Stella, PR Map & Demographics
Stella Map
Stella Overview
$15,522
PER CAPITA INCOME
$31,820
AVG FAMILY INCOME
$32,456
AVG HOUSEHOLD INCOME
9.4%
WAGE / INCOME GAP [ % ]
90.6¢/ $1
WAGE / INCOME GAP [ $ ]
0.35
INEQUALITY / GINI INDEX
1,130
TOTAL POPULATION
443
MALE POPULATION
687
FEMALE POPULATION
64.48
MALES / 100 FEMALES
155.08
FEMALES / 100 MALES
47.4
MEDIAN AGE
3.3
AVG FAMILY SIZE
2.9
AVG HOUSEHOLD SIZE
445
LABOR FORCE [ PEOPLE ]
45.2%
PERCENT IN LABOR FORCE
Income in Stella
Income Overview in Stella
Per Capita Income in Stella is $15,522, while median incomes of families and households are $31,820 and $32,456 respectively.
| Characteristic | Number | Measure |
| Per Capita Income | 1,130 | $15,522 |
| Median Family Income | 299 | $31,820 |
| Mean Family Income | 299 | $42,871 |
| Median Household Income | 390 | $32,456 |
| Mean Household Income | 390 | $41,215 |
| Income Deficit | 299 | $0 |
| Wage / Income Gap (%) | 1,130 | 9.43% |
| Wage / Income Gap ($) | 1,130 | 90.57¢ per $1 |
| Gini / Inequality Index | 1,130 | 0.35 |
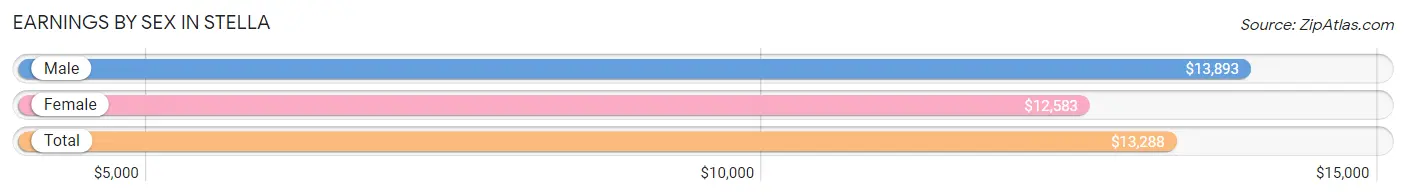
Earnings by Sex in Stella
Average Earnings in Stella are $13,288, $13,893 for men and $12,583 for women, a difference of 9.4%.
| Sex | Number | Average Earnings |
| Male | 161 (36.2%) | $13,893 |
| Female | 284 (63.8%) | $12,583 |
| Total | 445 (100.0%) | $13,288 |
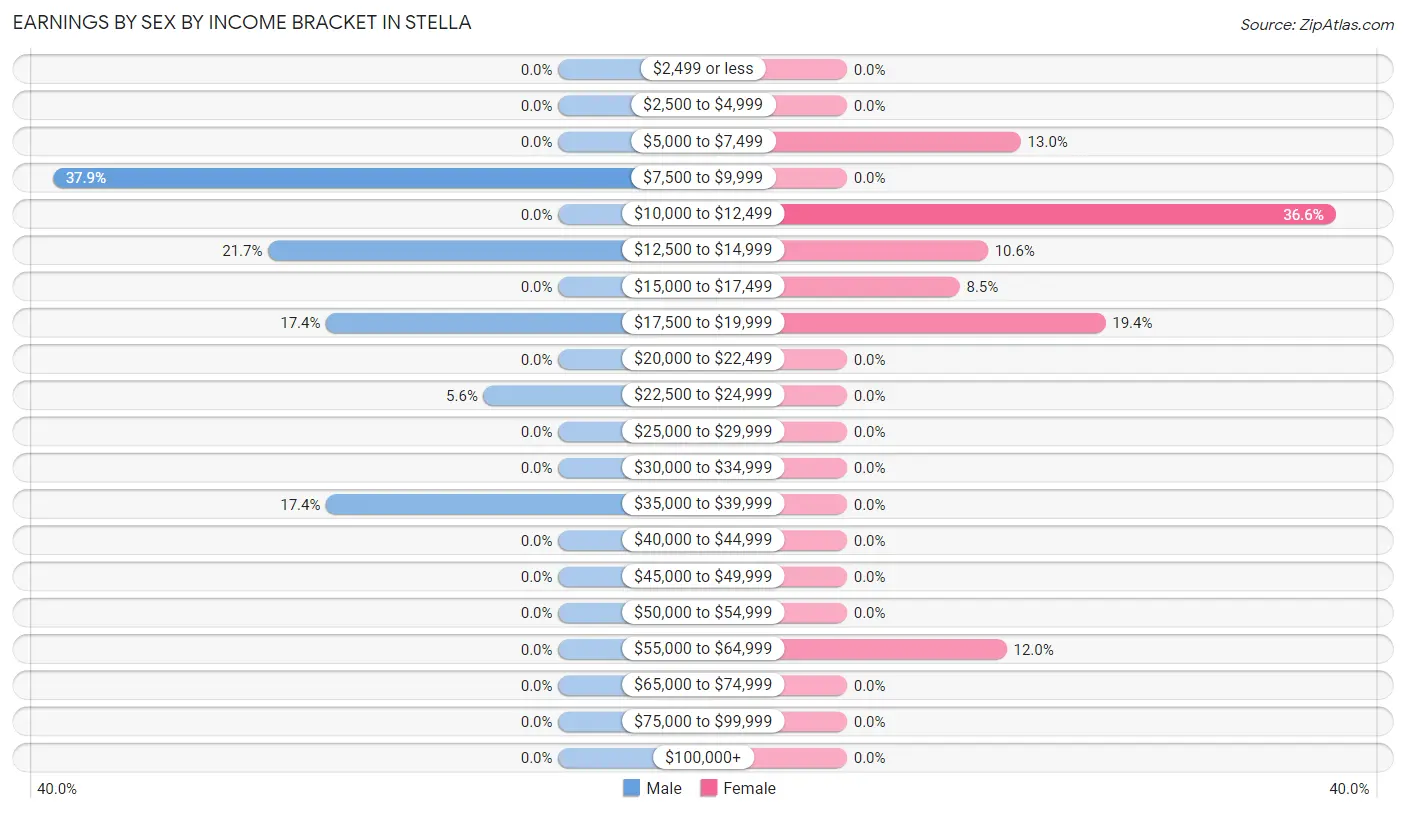
Earnings by Sex by Income Bracket in Stella
The most common earnings brackets in Stella are $7,500 to $9,999 for men (61 | 37.9%) and $10,000 to $12,499 for women (104 | 36.6%).
| Income | Male | Female |
| $2,499 or less | 0 (0.0%) | 0 (0.0%) |
| $2,500 to $4,999 | 0 (0.0%) | 0 (0.0%) |
| $5,000 to $7,499 | 0 (0.0%) | 37 (13.0%) |
| $7,500 to $9,999 | 61 (37.9%) | 0 (0.0%) |
| $10,000 to $12,499 | 0 (0.0%) | 104 (36.6%) |
| $12,500 to $14,999 | 35 (21.7%) | 30 (10.6%) |
| $15,000 to $17,499 | 0 (0.0%) | 24 (8.5%) |
| $17,500 to $19,999 | 28 (17.4%) | 55 (19.4%) |
| $20,000 to $22,499 | 0 (0.0%) | 0 (0.0%) |
| $22,500 to $24,999 | 9 (5.6%) | 0 (0.0%) |
| $25,000 to $29,999 | 0 (0.0%) | 0 (0.0%) |
| $30,000 to $34,999 | 0 (0.0%) | 0 (0.0%) |
| $35,000 to $39,999 | 28 (17.4%) | 0 (0.0%) |
| $40,000 to $44,999 | 0 (0.0%) | 0 (0.0%) |
| $45,000 to $49,999 | 0 (0.0%) | 0 (0.0%) |
| $50,000 to $54,999 | 0 (0.0%) | 0 (0.0%) |
| $55,000 to $64,999 | 0 (0.0%) | 34 (12.0%) |
| $65,000 to $74,999 | 0 (0.0%) | 0 (0.0%) |
| $75,000 to $99,999 | 0 (0.0%) | 0 (0.0%) |
| $100,000+ | 0 (0.0%) | 0 (0.0%) |
| Total | 161 (100.0%) | 284 (100.0%) |
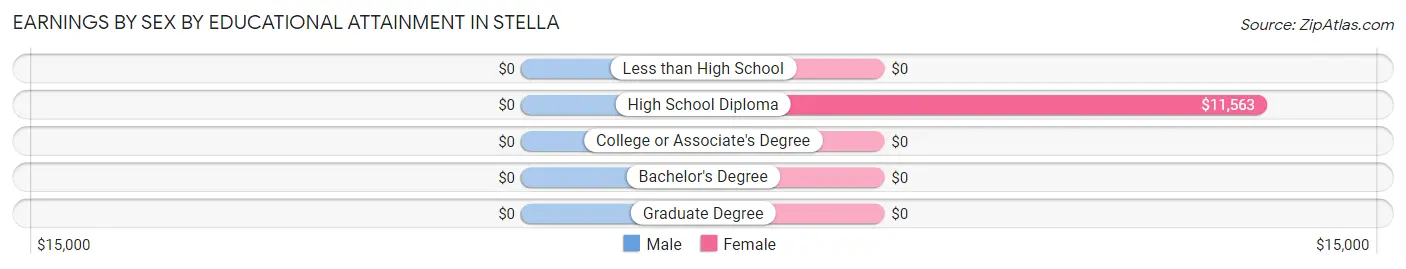
Earnings by Sex by Educational Attainment in Stella
| Educational Attainment | Male Income | Female Income |
| Less than High School | - | - |
| High School Diploma | - | - |
| College or Associate's Degree | - | - |
| Bachelor's Degree | - | - |
| Graduate Degree | - | - |
| Total | $12,893 | $14,125 |
Family Income in Stella
Family Income Brackets in Stella
According to the Stella family income data, there are 112 families falling into the $25,000 to $34,999 income range, which is the most common income bracket and makes up 37.5% of all families.
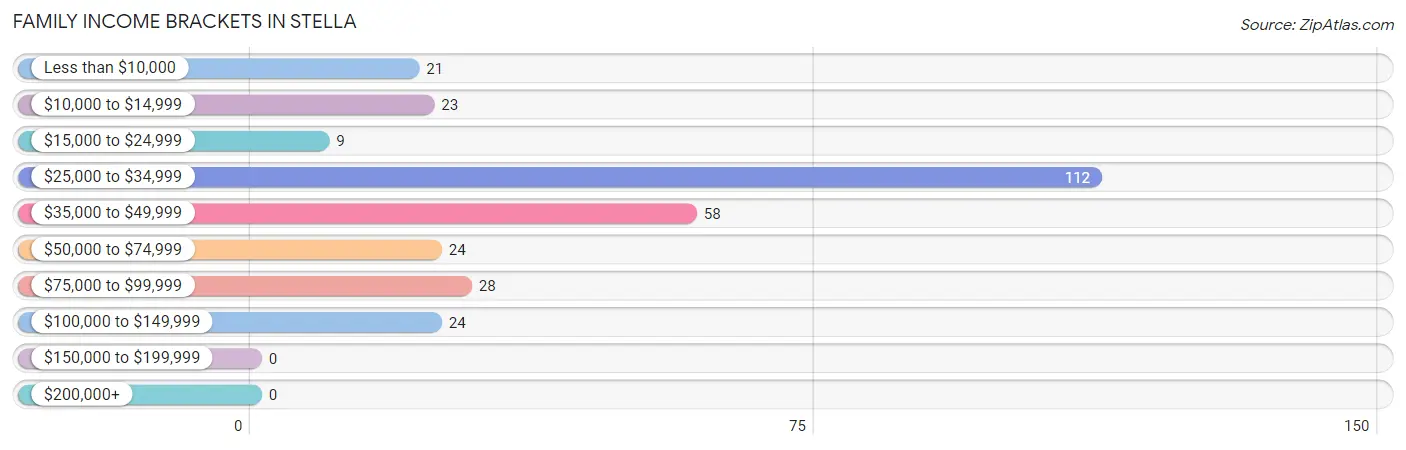
| Income Bracket | # Families | % Families |
| Less than $10,000 | 21 | 7.0% |
| $10,000 to $14,999 | 23 | 7.7% |
| $15,000 to $24,999 | 9 | 3.0% |
| $25,000 to $34,999 | 112 | 37.5% |
| $35,000 to $49,999 | 58 | 19.4% |
| $50,000 to $74,999 | 24 | 8.0% |
| $75,000 to $99,999 | 28 | 9.4% |
| $100,000 to $149,999 | 24 | 8.0% |
| $150,000 to $199,999 | 0 | 0.0% |
| $200,000+ | 0 | 0.0% |
Family Income by Famaliy Size in Stella
2-person families (128 | 42.8%) account for the highest median family income in Stella with $31,167 per family, while 2-person families (128 | 42.8%) have the highest median income of $15,584 per family member.
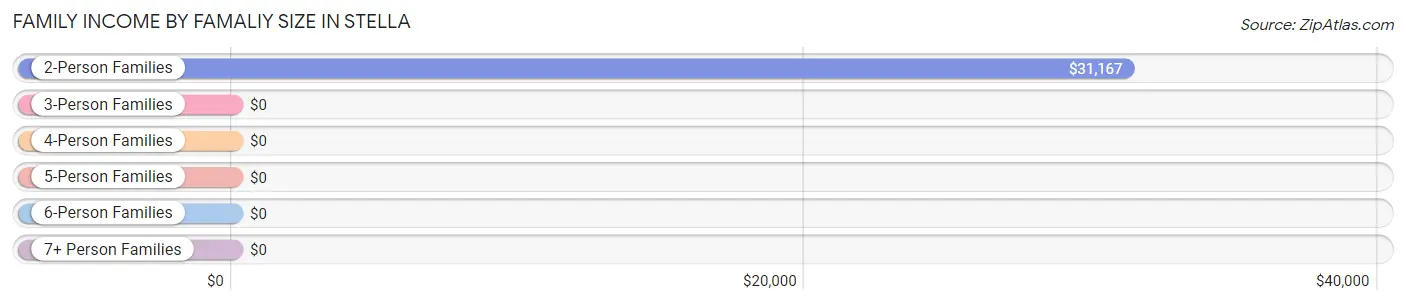
| Income Bracket | # Families | Median Income |
| 2-Person Families | 128 (42.8%) | $31,167 |
| 3-Person Families | 77 (25.8%) | $0 |
| 4-Person Families | 58 (19.4%) | $0 |
| 5-Person Families | 36 (12.0%) | $0 |
| 6-Person Families | 0 (0.0%) | $0 |
| 7+ Person Families | 0 (0.0%) | $0 |
| Total | 299 (100.0%) | $31,820 |
Family Income by Number of Earners in Stella
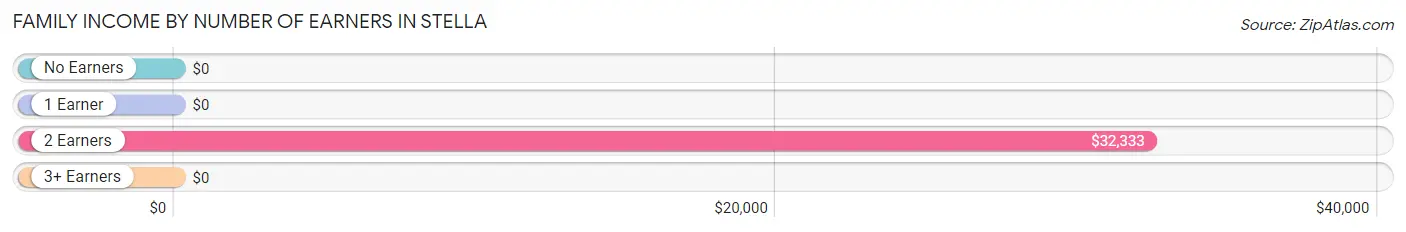
| Number of Earners | # Families | Median Income |
| No Earners | 96 (32.1%) | $0 |
| 1 Earner | 51 (17.1%) | $0 |
| 2 Earners | 128 (42.8%) | $32,333 |
| 3+ Earners | 24 (8.0%) | $0 |
| Total | 299 (100.0%) | $31,820 |
Household Income in Stella
Household Income Brackets in Stella
With 147 households falling in the category, the $25,000 to $34,999 income range is the most frequent in Stella, accounting for 37.7% of all households.
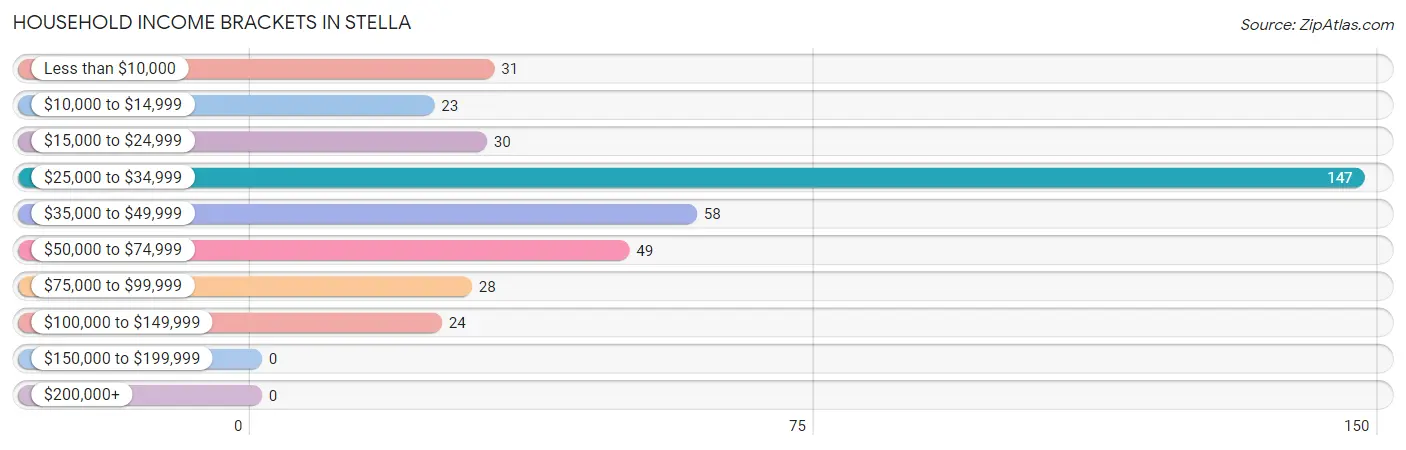
| Income Bracket | # Households | % Households |
| Less than $10,000 | 31 | 7.9% |
| $10,000 to $14,999 | 23 | 5.9% |
| $15,000 to $24,999 | 30 | 7.7% |
| $25,000 to $34,999 | 147 | 37.7% |
| $35,000 to $49,999 | 58 | 14.9% |
| $50,000 to $74,999 | 49 | 12.6% |
| $75,000 to $99,999 | 28 | 7.2% |
| $100,000 to $149,999 | 24 | 6.2% |
| $150,000 to $199,999 | 0 | 0.0% |
| $200,000+ | 0 | 0.0% |
Household Income by Householder Age in Stella
The median household income in Stella is $32,456, with the highest median household income of $38,966 found in the 45 to 64 years age bracket for the primary householder. A total of 154 households (39.5%) fall into this category.
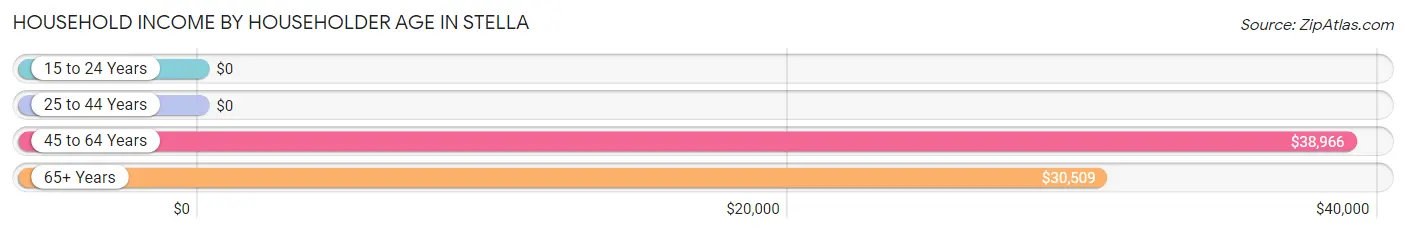
| Income Bracket | # Households | Median Income |
| 15 to 24 Years | 0 (0.0%) | $0 |
| 25 to 44 Years | 45 (11.5%) | $0 |
| 45 to 64 Years | 154 (39.5%) | $38,966 |
| 65+ Years | 191 (49.0%) | $30,509 |
| Total | 390 (100.0%) | $32,456 |
Poverty in Stella
Income Below Poverty by Sex and Age in Stella
With 37.7% poverty level for males and 34.9% for females among the residents of Stella, under 5 year old males and under 5 year old females are the most vulnerable to poverty, with 37 males (100.0%) and 37 females (100.0%) in their respective age groups living below the poverty level.
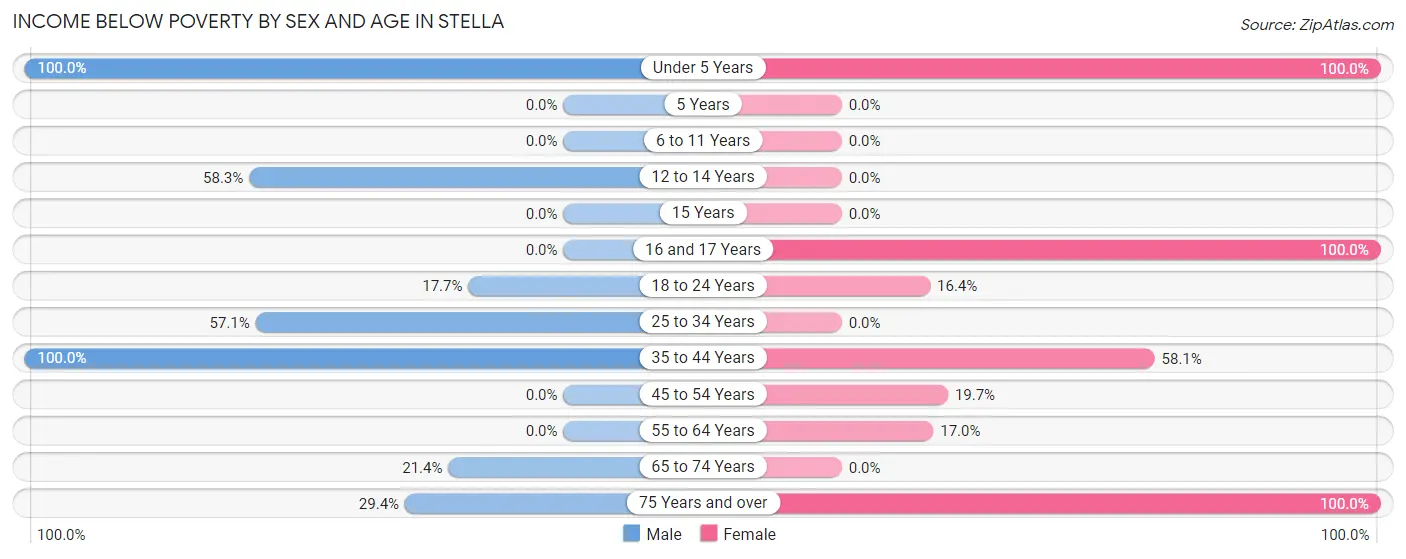
| Age Bracket | Male | Female |
| Under 5 Years | 37 (100.0%) | 37 (100.0%) |
| 5 Years | 0 (0.0%) | 0 (0.0%) |
| 6 to 11 Years | 0 (0.0%) | 0 (0.0%) |
| 12 to 14 Years | 42 (58.3%) | 0 (0.0%) |
| 15 Years | 0 (0.0%) | 0 (0.0%) |
| 16 and 17 Years | 0 (0.0%) | 39 (100.0%) |
| 18 to 24 Years | 12 (17.6%) | 20 (16.4%) |
| 25 to 34 Years | 12 (57.1%) | 0 (0.0%) |
| 35 to 44 Years | 35 (100.0%) | 36 (58.1%) |
| 45 to 54 Years | 0 (0.0%) | 13 (19.7%) |
| 55 to 64 Years | 0 (0.0%) | 27 (17.0%) |
| 65 to 74 Years | 19 (21.3%) | 0 (0.0%) |
| 75 Years and over | 10 (29.4%) | 68 (100.0%) |
| Total | 167 (37.7%) | 240 (34.9%) |
Income Above Poverty by Sex and Age in Stella
According to the poverty statistics in Stella, males aged 45 to 54 years and females aged 25 to 34 years are the age groups that are most secure financially, with 100.0% of males and 100.0% of females in these age groups living above the poverty line.
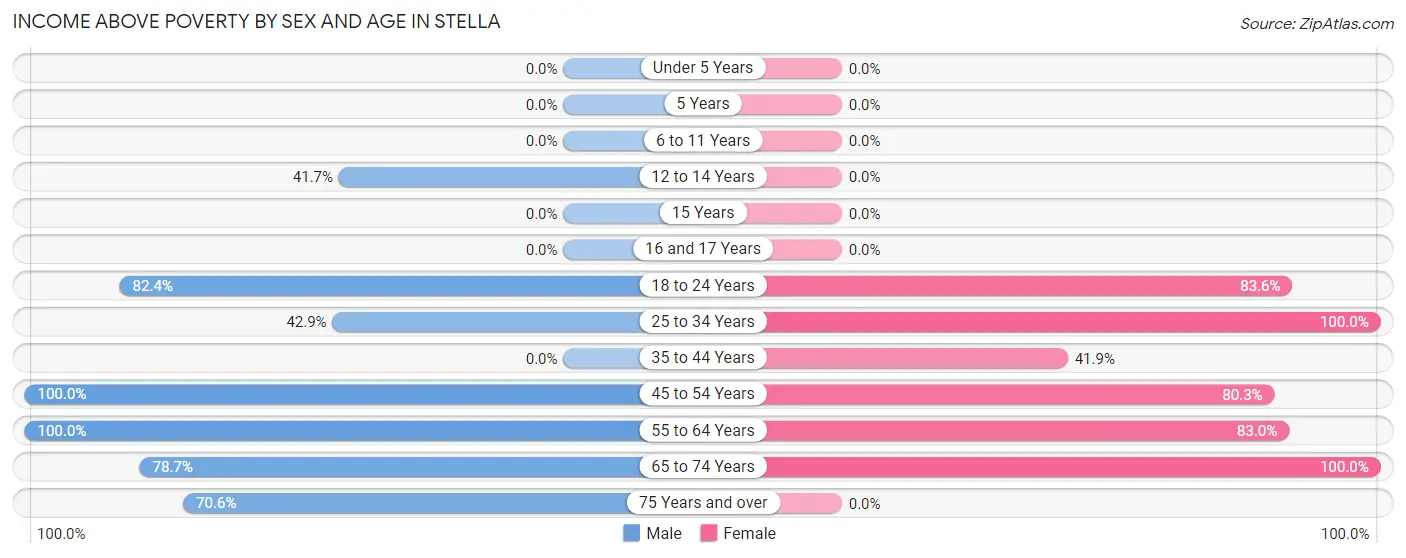
| Age Bracket | Male | Female |
| Under 5 Years | 0 (0.0%) | 0 (0.0%) |
| 5 Years | 0 (0.0%) | 0 (0.0%) |
| 6 to 11 Years | 0 (0.0%) | 0 (0.0%) |
| 12 to 14 Years | 30 (41.7%) | 0 (0.0%) |
| 15 Years | 0 (0.0%) | 0 (0.0%) |
| 16 and 17 Years | 0 (0.0%) | 0 (0.0%) |
| 18 to 24 Years | 56 (82.4%) | 102 (83.6%) |
| 25 to 34 Years | 9 (42.9%) | 46 (100.0%) |
| 35 to 44 Years | 0 (0.0%) | 26 (41.9%) |
| 45 to 54 Years | 62 (100.0%) | 53 (80.3%) |
| 55 to 64 Years | 25 (100.0%) | 132 (83.0%) |
| 65 to 74 Years | 70 (78.6%) | 88 (100.0%) |
| 75 Years and over | 24 (70.6%) | 0 (0.0%) |
| Total | 276 (62.3%) | 447 (65.1%) |
Income Below Poverty Among Married-Couple Families in Stella
The poverty statistics for married-couple families in Stella show that 29.9% or 55 of the total 184 families live below the poverty line. Families with 3 or 4 children have the highest poverty rate of 100.0%, comprising of 36 families. On the other hand, families with 1 or 2 children have the lowest poverty rate of 0.0%, which includes 0 families.
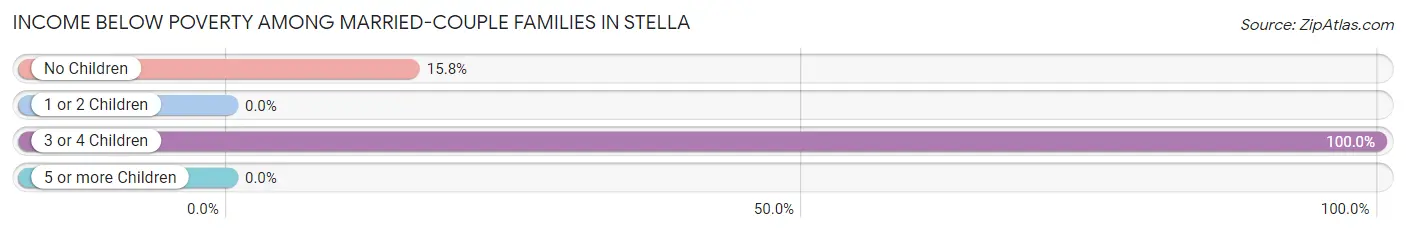
| Children | Above Poverty | Below Poverty |
| No Children | 101 (84.2%) | 19 (15.8%) |
| 1 or 2 Children | 28 (100.0%) | 0 (0.0%) |
| 3 or 4 Children | 0 (0.0%) | 36 (100.0%) |
| 5 or more Children | 0 (0.0%) | 0 (0.0%) |
| Total | 129 (70.1%) | 55 (29.9%) |
Income Below Poverty Among Single-Parent Households in Stella
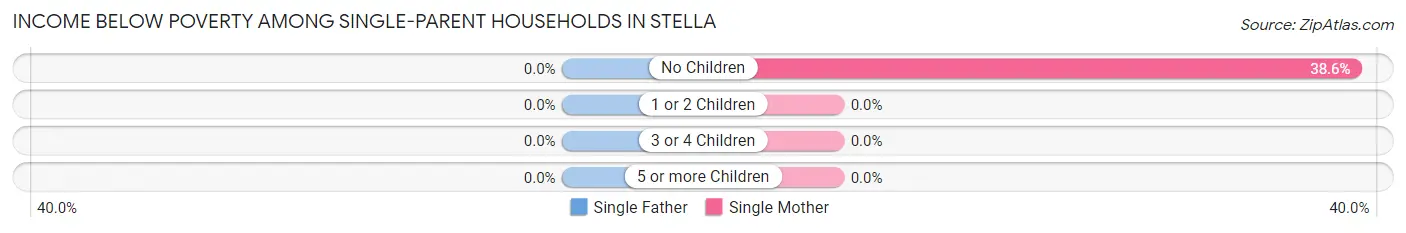
| Children | Single Father | Single Mother |
| No Children | 0 (0.0%) | 34 (38.6%) |
| 1 or 2 Children | 0 (0.0%) | 0 (0.0%) |
| 3 or 4 Children | 0 (0.0%) | 0 (0.0%) |
| 5 or more Children | 0 (0.0%) | 0 (0.0%) |
| Total | 0 (0.0%) | 34 (38.6%) |
Income Below Poverty Among Married-Couple vs Single-Parent Households in Stella
The poverty data for Stella shows that 55 of the married-couple family households (29.9%) and 34 of the single-parent households (29.6%) are living below the poverty level. Within the married-couple family households, those with 3 or 4 children have the highest poverty rate, with 36 households (100.0%) falling below the poverty line. Among the single-parent households, those with no children have the highest poverty rate, with 34 household (29.6%) living below poverty.
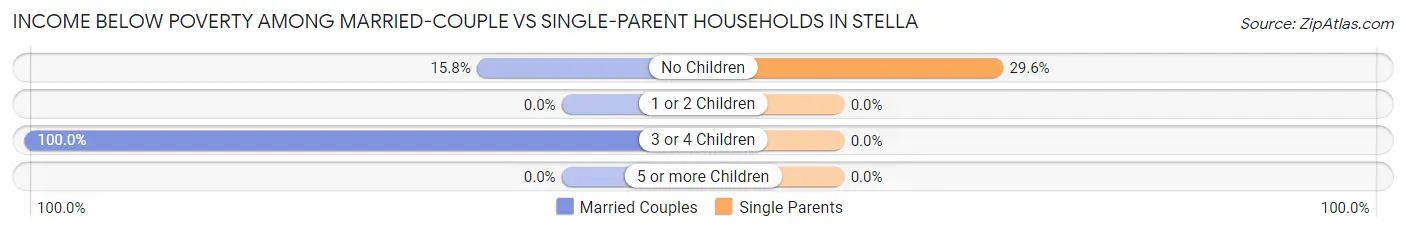
| Children | Married-Couple Families | Single-Parent Households |
| No Children | 19 (15.8%) | 34 (29.6%) |
| 1 or 2 Children | 0 (0.0%) | 0 (0.0%) |
| 3 or 4 Children | 36 (100.0%) | 0 (0.0%) |
| 5 or more Children | 0 (0.0%) | 0 (0.0%) |
| Total | 55 (29.9%) | 34 (29.6%) |
Race in Stella
The most populous races in Stella are Hispanic or Latino (1,047 | 92.6%), White / Caucasian (836 | 74.0%), and Two or more Races (260 | 23.0%).
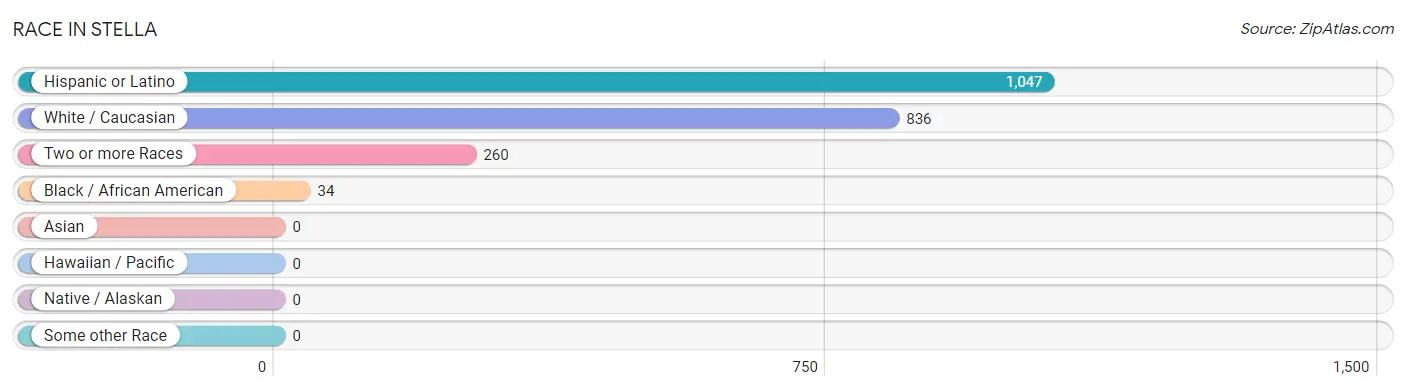
| Race | # Population | % Population |
| Asian | 0 | 0.0% |
| Black / African American | 34 | 3.0% |
| Hawaiian / Pacific | 0 | 0.0% |
| Hispanic or Latino | 1,047 | 92.6% |
| Native / Alaskan | 0 | 0.0% |
| White / Caucasian | 836 | 74.0% |
| Two or more Races | 260 | 23.0% |
| Some other Race | 0 | 0.0% |
| Total | 1,130 | 100.0% |
Ancestry in Stella
The most populous ancestries reported in Stella are Puerto Rican (968 | 85.7%), Central American Indian (260 | 23.0%), American (83 | 7.3%), Dominican (35 | 3.1%), and Central American (26 | 2.3%), together accounting for 121.4% of all Stella residents.
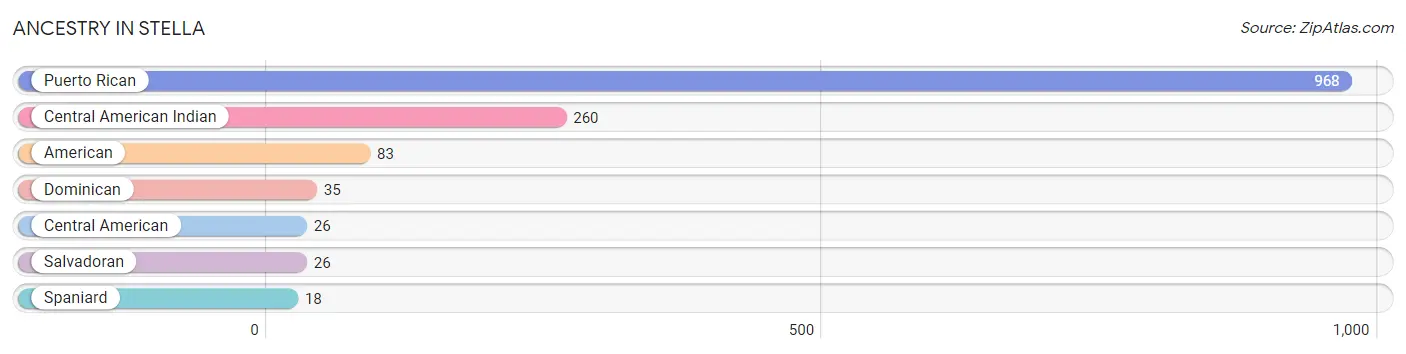
| Ancestry | # Population | % Population |
| American | 83 | 7.3% |
| Central American | 26 | 2.3% |
| Central American Indian | 260 | 23.0% |
| Dominican | 35 | 3.1% |
| Puerto Rican | 968 | 85.7% |
| Salvadoran | 26 | 2.3% |
| Spaniard | 18 | 1.6% | View All 7 Rows |
Immigrants in Stella

| Immigration Origin | # Population | % Population | View All 0 Rows |
Sex and Age in Stella
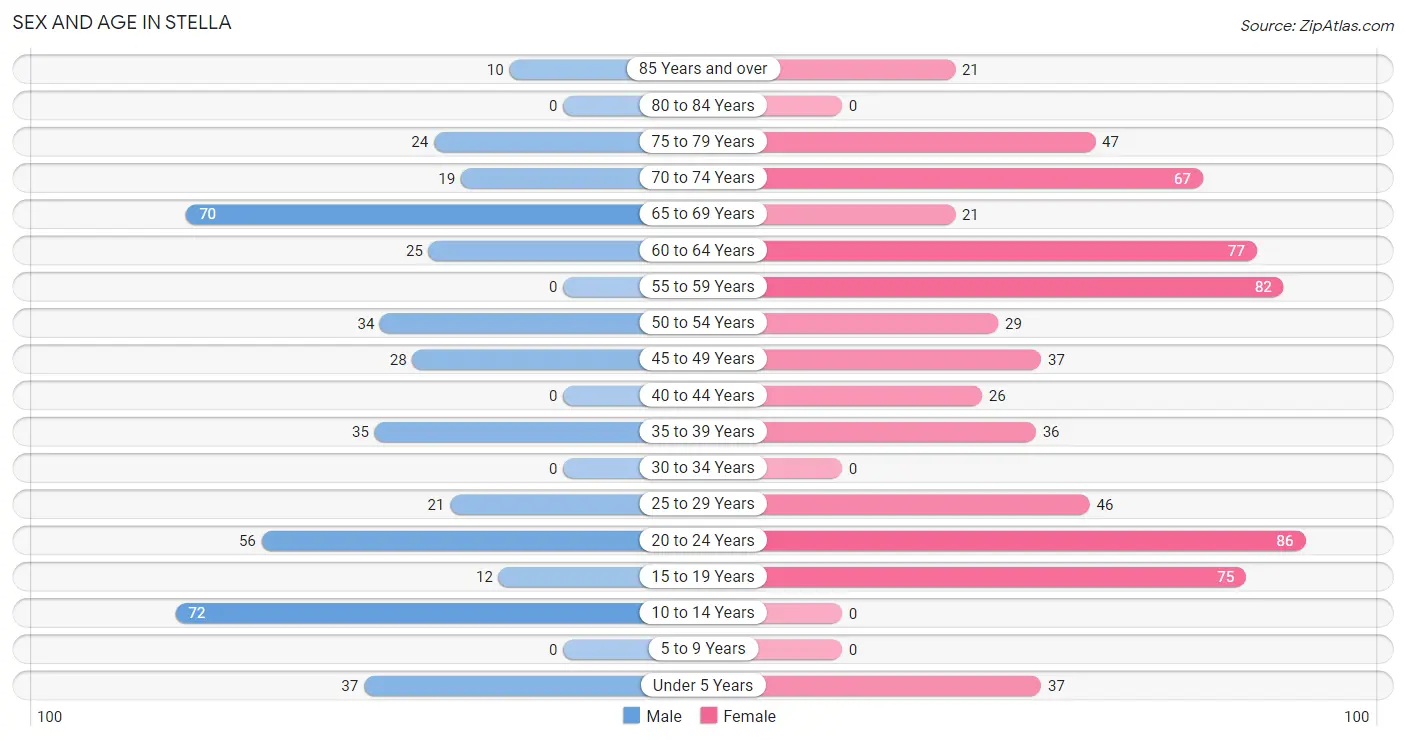
Sex and Age in Stella
The most populous age groups in Stella are 10 to 14 Years (72 | 16.3%) for men and 20 to 24 Years (86 | 12.5%) for women.
| Age Bracket | Male | Female |
| Under 5 Years | 37 (8.4%) | 37 (5.4%) |
| 5 to 9 Years | 0 (0.0%) | 0 (0.0%) |
| 10 to 14 Years | 72 (16.3%) | 0 (0.0%) |
| 15 to 19 Years | 12 (2.7%) | 75 (10.9%) |
| 20 to 24 Years | 56 (12.6%) | 86 (12.5%) |
| 25 to 29 Years | 21 (4.7%) | 46 (6.7%) |
| 30 to 34 Years | 0 (0.0%) | 0 (0.0%) |
| 35 to 39 Years | 35 (7.9%) | 36 (5.2%) |
| 40 to 44 Years | 0 (0.0%) | 26 (3.8%) |
| 45 to 49 Years | 28 (6.3%) | 37 (5.4%) |
| 50 to 54 Years | 34 (7.7%) | 29 (4.2%) |
| 55 to 59 Years | 0 (0.0%) | 82 (11.9%) |
| 60 to 64 Years | 25 (5.6%) | 77 (11.2%) |
| 65 to 69 Years | 70 (15.8%) | 21 (3.1%) |
| 70 to 74 Years | 19 (4.3%) | 67 (9.8%) |
| 75 to 79 Years | 24 (5.4%) | 47 (6.8%) |
| 80 to 84 Years | 0 (0.0%) | 0 (0.0%) |
| 85 Years and over | 10 (2.3%) | 21 (3.1%) |
| Total | 443 (100.0%) | 687 (100.0%) |
Families and Households in Stella
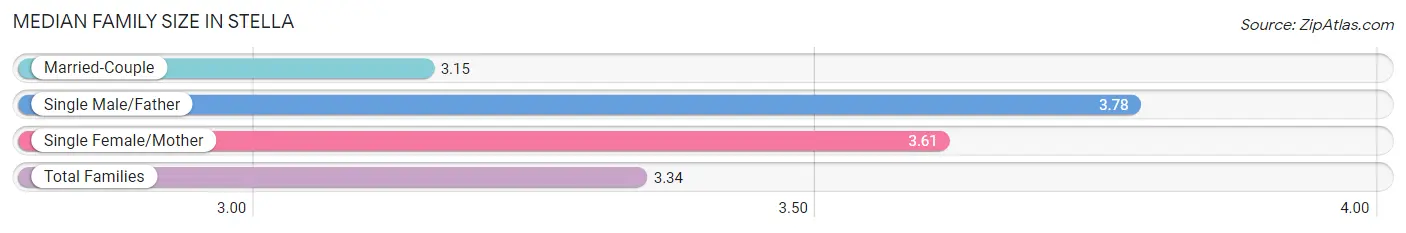
Median Family Size in Stella
The median family size in Stella is 3.34 persons per family, with single male/father families (27 | 9.0%) accounting for the largest median family size of 3.78 persons per family. On the other hand, married-couple families (184 | 61.5%) represent the smallest median family size with 3.15 persons per family.
| Family Type | # Families | Family Size |
| Married-Couple | 184 (61.5%) | 3.15 |
| Single Male/Father | 27 (9.0%) | 3.78 |
| Single Female/Mother | 88 (29.4%) | 3.61 |
| Total Families | 299 (100.0%) | 3.34 |
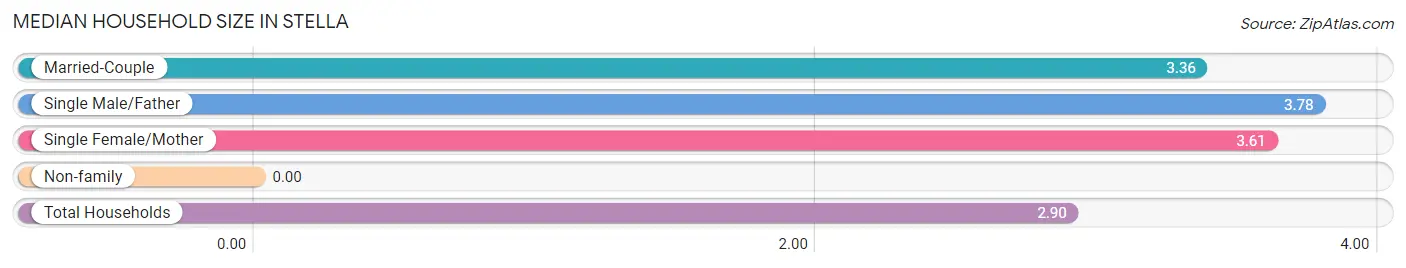
Median Household Size in Stella
| Household Type | # Households | Household Size |
| Married-Couple | 184 (47.2%) | 3.36 |
| Single Male/Father | 27 (6.9%) | 3.78 |
| Single Female/Mother | 88 (22.6%) | 3.61 |
| Non-family | 91 (23.3%) | - |
| Total Households | 390 (100.0%) | 2.90 |
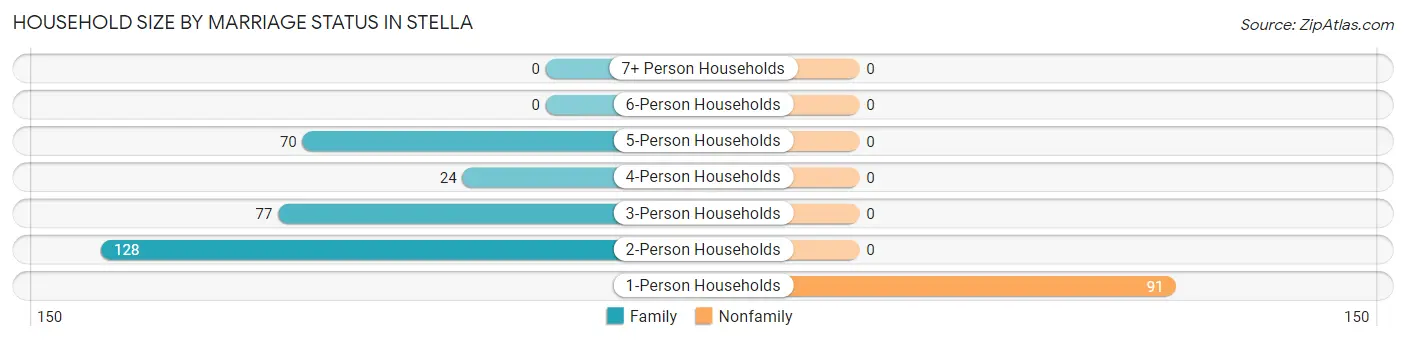
Household Size by Marriage Status in Stella
Out of a total of 390 households in Stella, 299 (76.7%) are family households, while 91 (23.3%) are nonfamily households. The most numerous type of family households are 2-person households, comprising 128, and the most common type of nonfamily households are 1-person households, comprising 91.
| Household Size | Family Households | Nonfamily Households |
| 1-Person Households | - | 91 (23.3%) |
| 2-Person Households | 128 (32.8%) | 0 (0.0%) |
| 3-Person Households | 77 (19.7%) | 0 (0.0%) |
| 4-Person Households | 24 (6.1%) | 0 (0.0%) |
| 5-Person Households | 70 (17.9%) | 0 (0.0%) |
| 6-Person Households | 0 (0.0%) | 0 (0.0%) |
| 7+ Person Households | 0 (0.0%) | 0 (0.0%) |
| Total | 299 (76.7%) | 91 (23.3%) |
Female Fertility in Stella
Fertility by Age in Stella
| Age Bracket | Women with Births | Births / 1,000 Women |
| 15 to 19 years | 0 (0.0%) | 0.0 |
| 20 to 34 years | 0 (0.0%) | 0.0 |
| 35 to 50 years | 0 (0.0%) | 0.0 |
| Total | 0 (0.0%) | 0.0 |
Fertility by Age by Marriage Status in Stella
| Age Bracket | Married | Unmarried |
| 15 to 19 years | 0 (0.0%) | 0 (0.0%) |
| 20 to 34 years | 0 (0.0%) | 0 (0.0%) |
| 35 to 50 years | 0 (0.0%) | 0 (0.0%) |
| Total | 0 (0.0%) | 0 (0.0%) |
Fertility by Education in Stella
| Educational Attainment | Women with Births | Births / 1,000 Women |
| Less than High School | 0 (0.0%) | 0.0 |
| High School Diploma | 0 (0.0%) | 0.0 |
| College or Associate's Degree | 0 (0.0%) | 0.0 |
| Bachelor's Degree | 0 (0.0%) | 0.0 |
| Graduate Degree | 0 (0.0%) | 0.0 |
| Total | 0 (0.0%) | 0.0 |
Fertility by Education by Marriage Status in Stella
| Educational Attainment | Married | Unmarried |
| Less than High School | 0 (0.0%) | 0 (0.0%) |
| High School Diploma | 0 (0.0%) | 0 (0.0%) |
| College or Associate's Degree | 0 (0.0%) | 0 (0.0%) |
| Bachelor's Degree | 0 (0.0%) | 0 (0.0%) |
| Graduate Degree | 0 (0.0%) | 0 (0.0%) |
| Total | 0 (0.0%) | 0 (0.0%) |
Employment Characteristics in Stella
Employment by Class of Employer in Stella
Among the 445 employed individuals in Stella, private company employees (231 | 51.9%), self-employed (not incorporated) (88 | 19.8%), and self-employed (incorporated) (61 | 13.7%) make up the most common classes of employment.
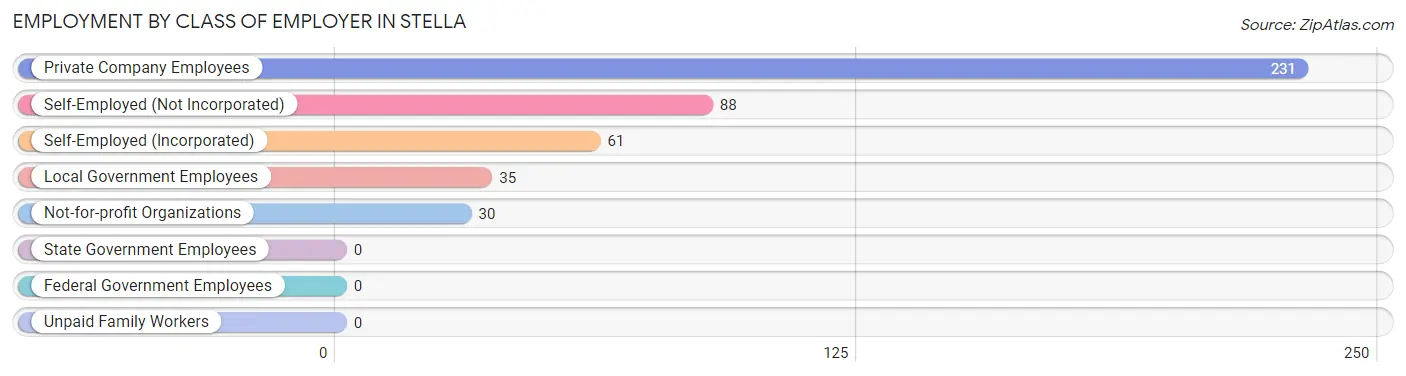
| Employer Class | # Employees | % Employees |
| Private Company Employees | 231 | 51.9% |
| Self-Employed (Incorporated) | 61 | 13.7% |
| Self-Employed (Not Incorporated) | 88 | 19.8% |
| Not-for-profit Organizations | 30 | 6.7% |
| Local Government Employees | 35 | 7.9% |
| State Government Employees | 0 | 0.0% |
| Federal Government Employees | 0 | 0.0% |
| Unpaid Family Workers | 0 | 0.0% |
| Total | 445 | 100.0% |
Employment Status by Age in Stella
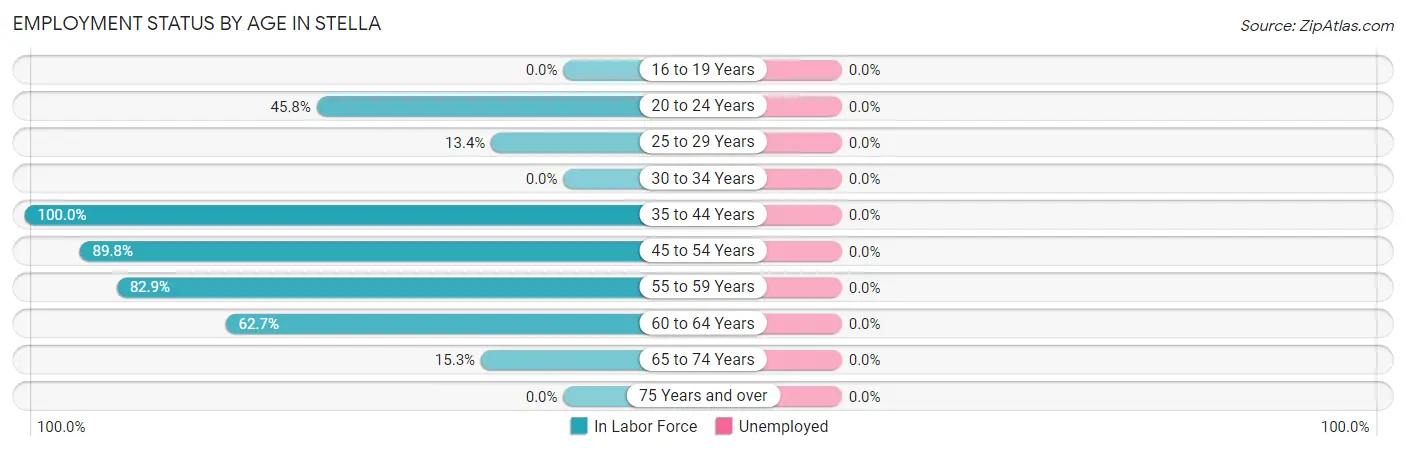
| Age Bracket | In Labor Force | Unemployed |
| 16 to 19 Years | 0 (0.0%) | 0 (0.0%) |
| 20 to 24 Years | 65 (45.8%) | 0 (0.0%) |
| 25 to 29 Years | 9 (13.4%) | 0 (0.0%) |
| 30 to 34 Years | 0 (0.0%) | 0 (0.0%) |
| 35 to 44 Years | 97 (100.0%) | 0 (0.0%) |
| 45 to 54 Years | 115 (89.8%) | 0 (0.0%) |
| 55 to 59 Years | 68 (82.9%) | 0 (0.0%) |
| 60 to 64 Years | 64 (62.7%) | 0 (0.0%) |
| 65 to 74 Years | 27 (15.3%) | 0 (0.0%) |
| 75 Years and over | 0 (0.0%) | 0 (0.0%) |
| Total | 445 (45.2%) | 0 (0.0%) |
Employment Status by Educational Attainment in Stella
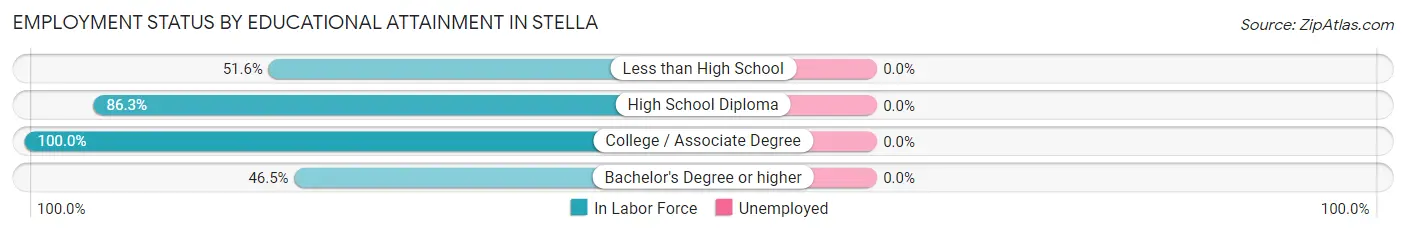
| Educational Attainment | In Labor Force | Unemployed |
| Less than High School | 63 (51.6%) | 0 (0.0%) |
| High School Diploma | 164 (86.3%) | 0 (0.0%) |
| College / Associate Degree | 93 (100.0%) | 0 (0.0%) |
| Bachelor's Degree or higher | 33 (46.5%) | 0 (0.0%) |
| Total | 353 (74.2%) | 0 (0.0%) |
Employment Occupations by Sex in Stella
Management, Business, Science and Arts Occupations
The most common Management, Business, Science and Arts occupations in Stella are Management (28 | 6.3%), Community & Social Service (27 | 6.1%), and Arts, Media & Entertainment (27 | 6.1%).
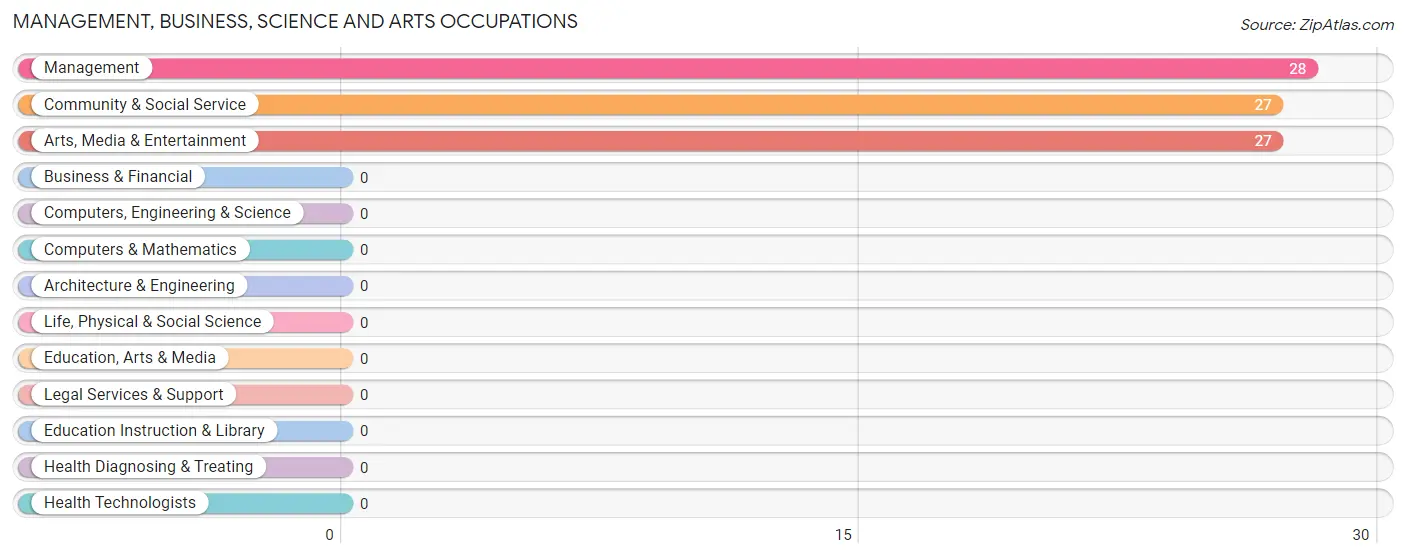
Management, Business, Science and Arts Occupations by Sex
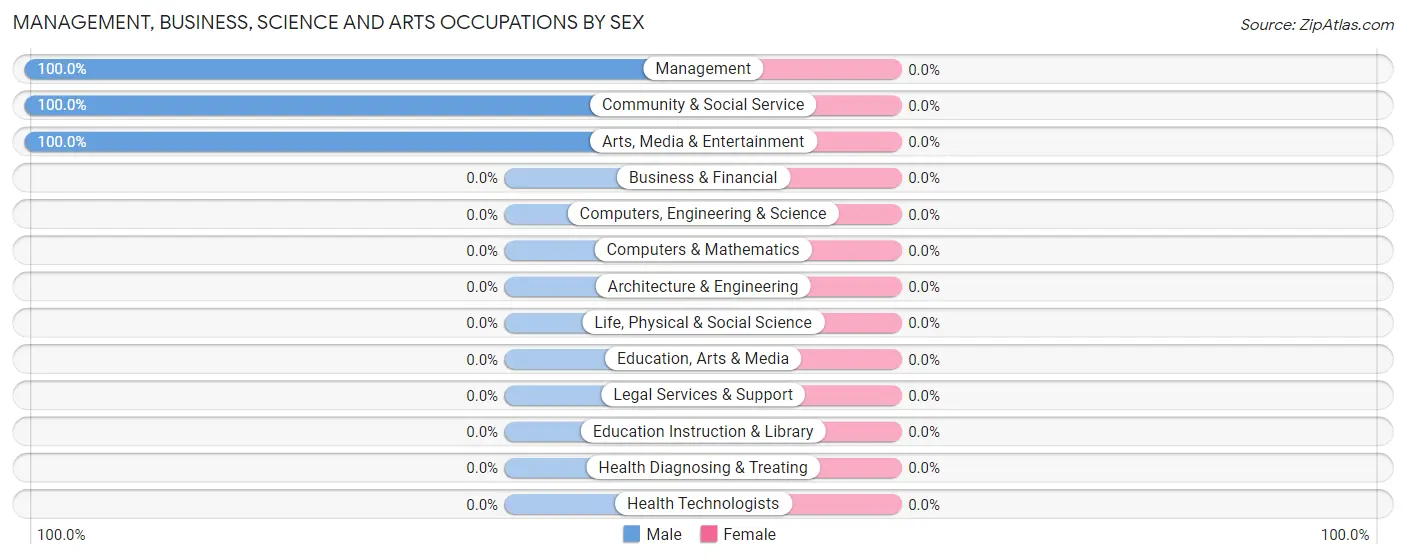
| Occupation | Male | Female |
| Management | 28 (100.0%) | 0 (0.0%) |
| Business & Financial | 0 (0.0%) | 0 (0.0%) |
| Computers, Engineering & Science | 0 (0.0%) | 0 (0.0%) |
| Computers & Mathematics | 0 (0.0%) | 0 (0.0%) |
| Architecture & Engineering | 0 (0.0%) | 0 (0.0%) |
| Life, Physical & Social Science | 0 (0.0%) | 0 (0.0%) |
| Community & Social Service | 27 (100.0%) | 0 (0.0%) |
| Education, Arts & Media | 0 (0.0%) | 0 (0.0%) |
| Legal Services & Support | 0 (0.0%) | 0 (0.0%) |
| Education Instruction & Library | 0 (0.0%) | 0 (0.0%) |
| Arts, Media & Entertainment | 27 (100.0%) | 0 (0.0%) |
| Health Diagnosing & Treating | 0 (0.0%) | 0 (0.0%) |
| Health Technologists | 0 (0.0%) | 0 (0.0%) |
| Total (Category) | 55 (100.0%) | 0 (0.0%) |
| Total (Overall) | 161 (36.2%) | 284 (63.8%) |
Services Occupations
The most common Services occupations in Stella are Cleaning & Maintenance (73 | 16.4%), and Food Preparation & Serving (26 | 5.8%).
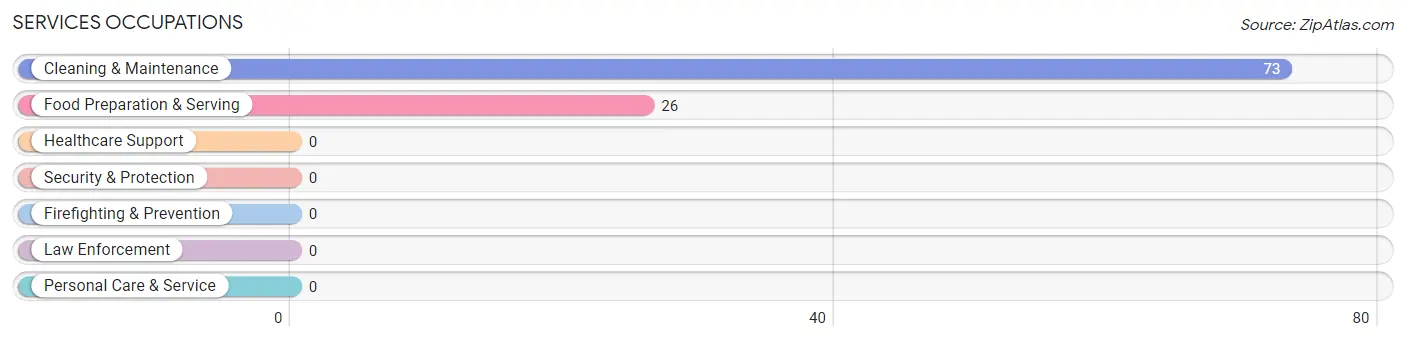
Services Occupations by Sex
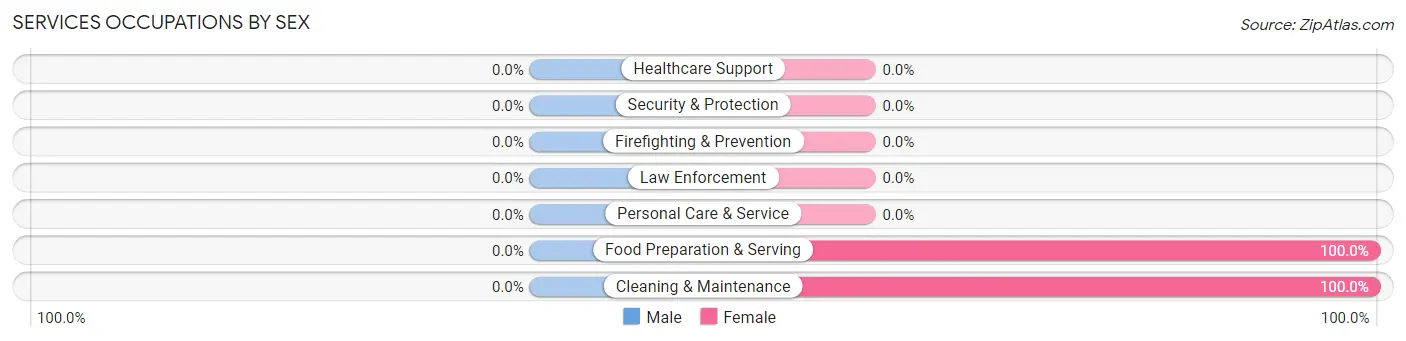
| Occupation | Male | Female |
| Healthcare Support | 0 (0.0%) | 0 (0.0%) |
| Security & Protection | 0 (0.0%) | 0 (0.0%) |
| Firefighting & Prevention | 0 (0.0%) | 0 (0.0%) |
| Law Enforcement | 0 (0.0%) | 0 (0.0%) |
| Food Preparation & Serving | 0 (0.0%) | 26 (100.0%) |
| Cleaning & Maintenance | 0 (0.0%) | 73 (100.0%) |
| Personal Care & Service | 0 (0.0%) | 0 (0.0%) |
| Total (Category) | 0 (0.0%) | 99 (100.0%) |
| Total (Overall) | 161 (36.2%) | 284 (63.8%) |
Sales and Office Occupations
The most common Sales and Office occupations in Stella are Office & Administration (120 | 27.0%), and Sales & Related (102 | 22.9%).

Sales and Office Occupations by Sex

| Occupation | Male | Female |
| Sales & Related | 0 (0.0%) | 102 (100.0%) |
| Office & Administration | 37 (30.8%) | 83 (69.2%) |
| Total (Category) | 37 (16.7%) | 185 (83.3%) |
| Total (Overall) | 161 (36.2%) | 284 (63.8%) |
Natural Resources, Construction and Maintenance Occupations
The most common Natural Resources, Construction and Maintenance occupations in Stella are , and Construction & Extraction (34 | 7.6%).
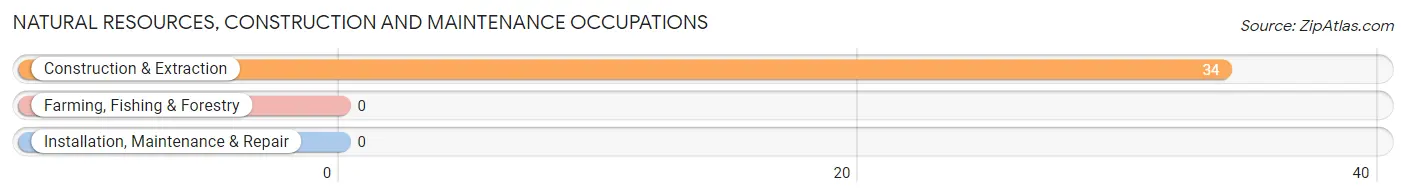
Natural Resources, Construction and Maintenance Occupations by Sex

| Occupation | Male | Female |
| Farming, Fishing & Forestry | 0 (0.0%) | 0 (0.0%) |
| Construction & Extraction | 34 (100.0%) | 0 (0.0%) |
| Installation, Maintenance & Repair | 0 (0.0%) | 0 (0.0%) |
| Total (Category) | 34 (100.0%) | 0 (0.0%) |
| Total (Overall) | 161 (36.2%) | 284 (63.8%) |
Production, Transportation and Moving Occupations
The most common Production, Transportation and Moving occupations in Stella are , and Material Moving (35 | 7.9%).
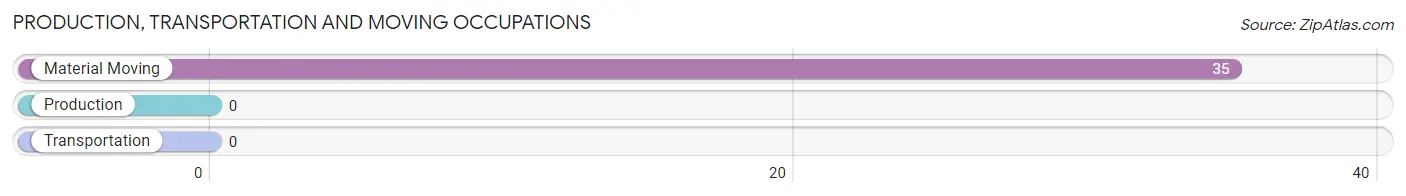
Production, Transportation and Moving Occupations by Sex
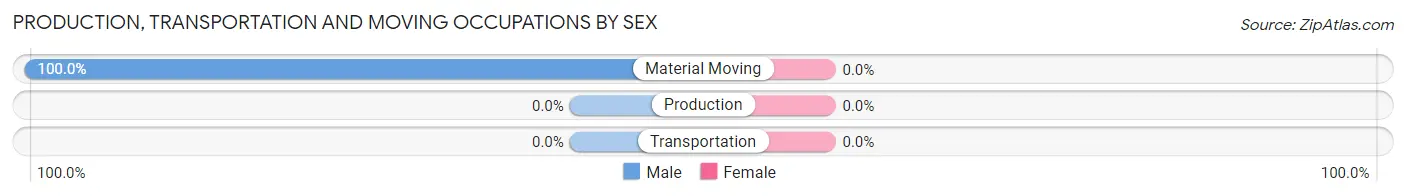
| Occupation | Male | Female |
| Production | 0 (0.0%) | 0 (0.0%) |
| Transportation | 0 (0.0%) | 0 (0.0%) |
| Material Moving | 35 (100.0%) | 0 (0.0%) |
| Total (Category) | 35 (100.0%) | 0 (0.0%) |
| Total (Overall) | 161 (36.2%) | 284 (63.8%) |
Employment Industries by Sex in Stella
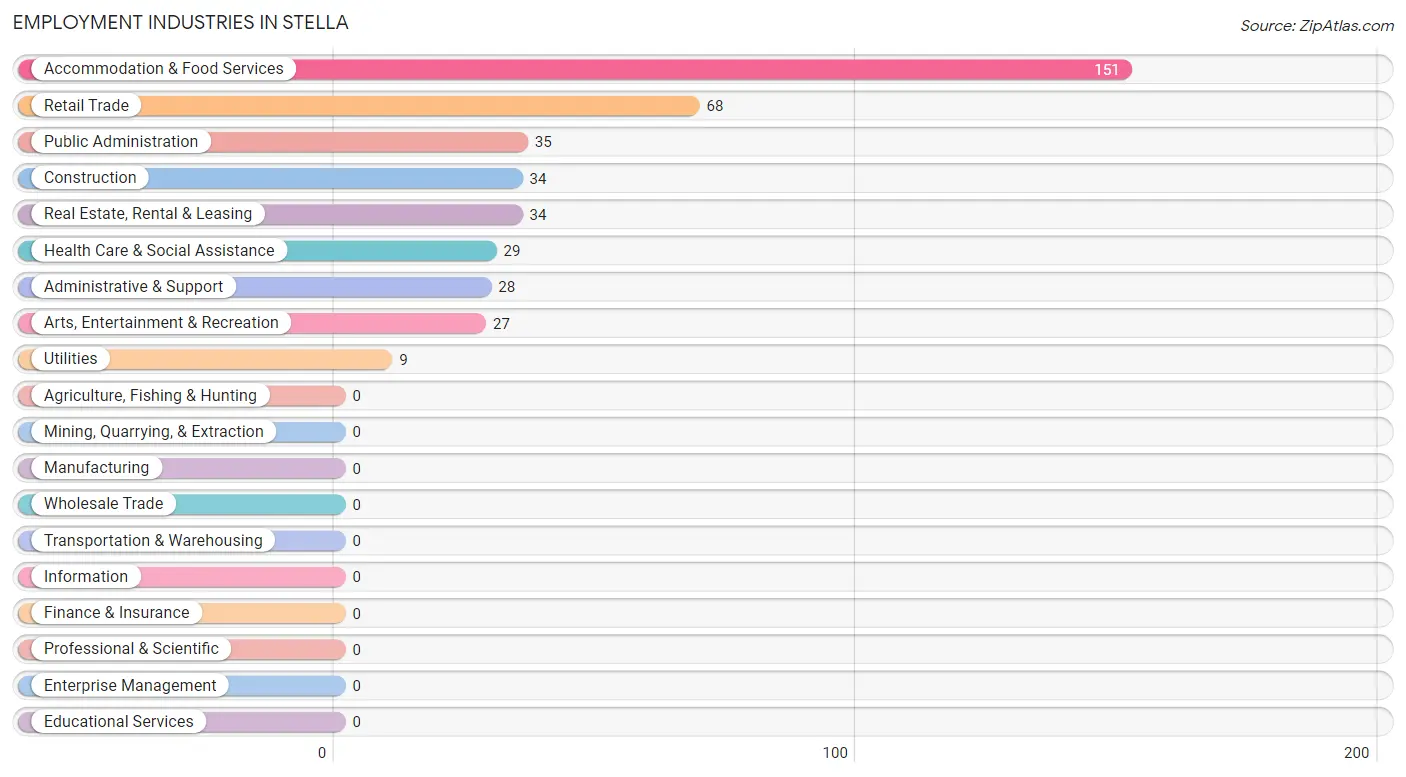
Employment Industries in Stella
The major employment industries in Stella include Accommodation & Food Services (151 | 33.9%), Retail Trade (68 | 15.3%), Public Administration (35 | 7.9%), Construction (34 | 7.6%), and Real Estate, Rental & Leasing (34 | 7.6%).
Employment Industries by Sex in Stella
The Stella industries that see more men than women are Construction (100.0%), Utilities (100.0%), and Administrative & Support (100.0%), whereas the industries that tend to have a higher number of women are Retail Trade (100.0%), Real Estate, Rental & Leasing (100.0%), and Health Care & Social Assistance (100.0%).
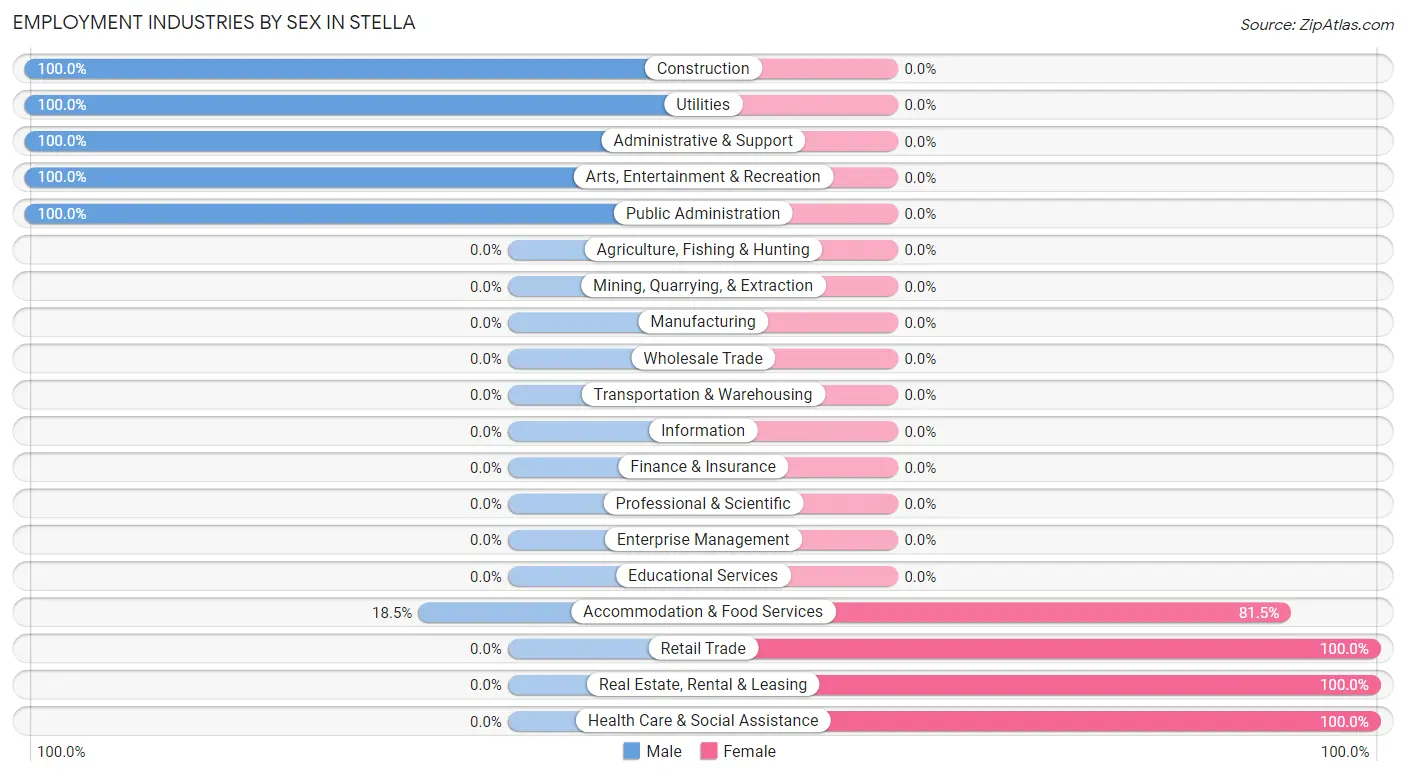
| Industry | Male | Female |
| Agriculture, Fishing & Hunting | 0 (0.0%) | 0 (0.0%) |
| Mining, Quarrying, & Extraction | 0 (0.0%) | 0 (0.0%) |
| Construction | 34 (100.0%) | 0 (0.0%) |
| Manufacturing | 0 (0.0%) | 0 (0.0%) |
| Wholesale Trade | 0 (0.0%) | 0 (0.0%) |
| Retail Trade | 0 (0.0%) | 68 (100.0%) |
| Transportation & Warehousing | 0 (0.0%) | 0 (0.0%) |
| Utilities | 9 (100.0%) | 0 (0.0%) |
| Information | 0 (0.0%) | 0 (0.0%) |
| Finance & Insurance | 0 (0.0%) | 0 (0.0%) |
| Real Estate, Rental & Leasing | 0 (0.0%) | 34 (100.0%) |
| Professional & Scientific | 0 (0.0%) | 0 (0.0%) |
| Enterprise Management | 0 (0.0%) | 0 (0.0%) |
| Administrative & Support | 28 (100.0%) | 0 (0.0%) |
| Educational Services | 0 (0.0%) | 0 (0.0%) |
| Health Care & Social Assistance | 0 (0.0%) | 29 (100.0%) |
| Arts, Entertainment & Recreation | 27 (100.0%) | 0 (0.0%) |
| Accommodation & Food Services | 28 (18.5%) | 123 (81.5%) |
| Public Administration | 35 (100.0%) | 0 (0.0%) |
| Total | 161 (36.2%) | 284 (63.8%) |
Education in Stella
School Enrollment in Stella
The most common levels of schooling among the 188 students in Stella are college / undergraduate (104 | 55.3%), middle school (72 | 38.3%), and high school (12 | 6.4%).
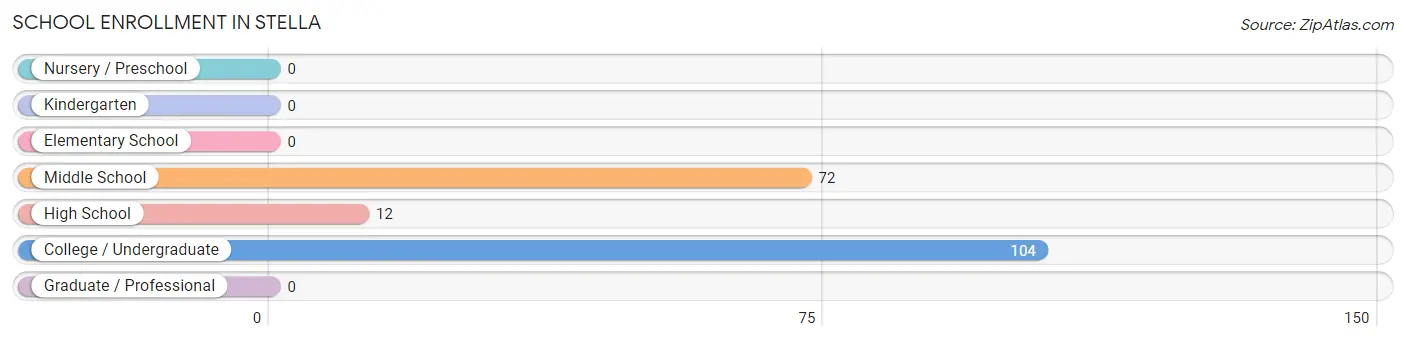
| School Level | # Students | % Students |
| Nursery / Preschool | 0 | 0.0% |
| Kindergarten | 0 | 0.0% |
| Elementary School | 0 | 0.0% |
| Middle School | 72 | 38.3% |
| High School | 12 | 6.4% |
| College / Undergraduate | 104 | 55.3% |
| Graduate / Professional | 0 | 0.0% |
| Total | 188 | 100.0% |
School Enrollment by Age by Funding Source in Stella
Out of a total of 188 students who are enrolled in schools in Stella, 146 (77.7%) attend a private institution, while the remaining 42 (22.3%) are enrolled in public schools. The age group of 20 to 24 year olds has the highest likelihood of being enrolled in private schools, with 86 (100.0% in the age bracket) enrolled. Conversely, the age group of 10 to 14 year olds has the lowest likelihood of being enrolled in a private school, with 30 (41.7% in the age bracket) attending a public institution.
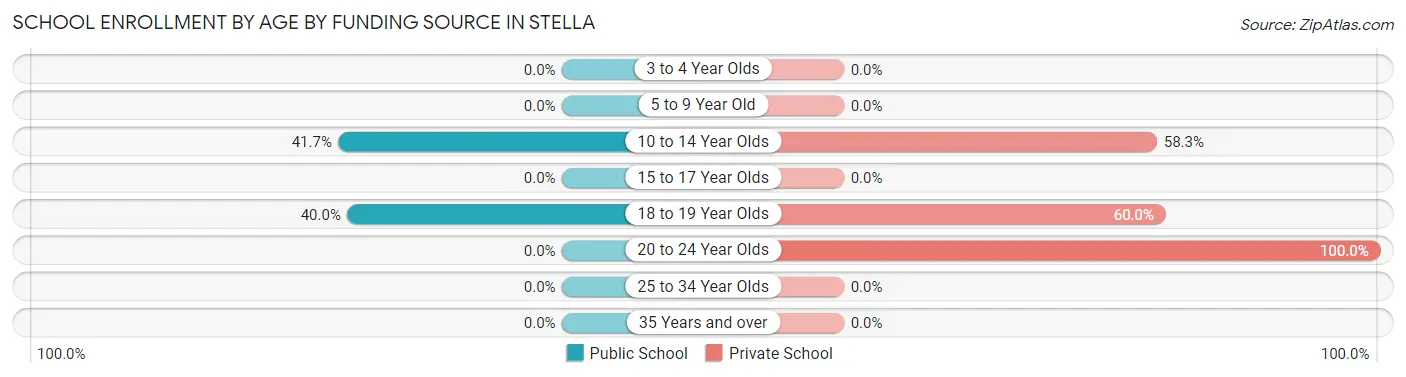
| Age Bracket | Public School | Private School |
| 3 to 4 Year Olds | 0 (0.0%) | 0 (0.0%) |
| 5 to 9 Year Old | 0 (0.0%) | 0 (0.0%) |
| 10 to 14 Year Olds | 30 (41.7%) | 42 (58.3%) |
| 15 to 17 Year Olds | 0 (0.0%) | 0 (0.0%) |
| 18 to 19 Year Olds | 12 (40.0%) | 18 (60.0%) |
| 20 to 24 Year Olds | 0 (0.0%) | 86 (100.0%) |
| 25 to 34 Year Olds | 0 (0.0%) | 0 (0.0%) |
| 35 Years and over | 0 (0.0%) | 0 (0.0%) |
| Total | 42 (22.3%) | 146 (77.7%) |
Educational Attainment by Field of Study in Stella
Business (58 | 32.6%), bio, nature & agricultural (34 | 19.1%), liberal arts & history (24 | 13.5%), education (23 | 12.9%), and science & technology (21 | 11.8%) are the most common fields of study among 178 individuals in Stella who have obtained a bachelor's degree or higher.
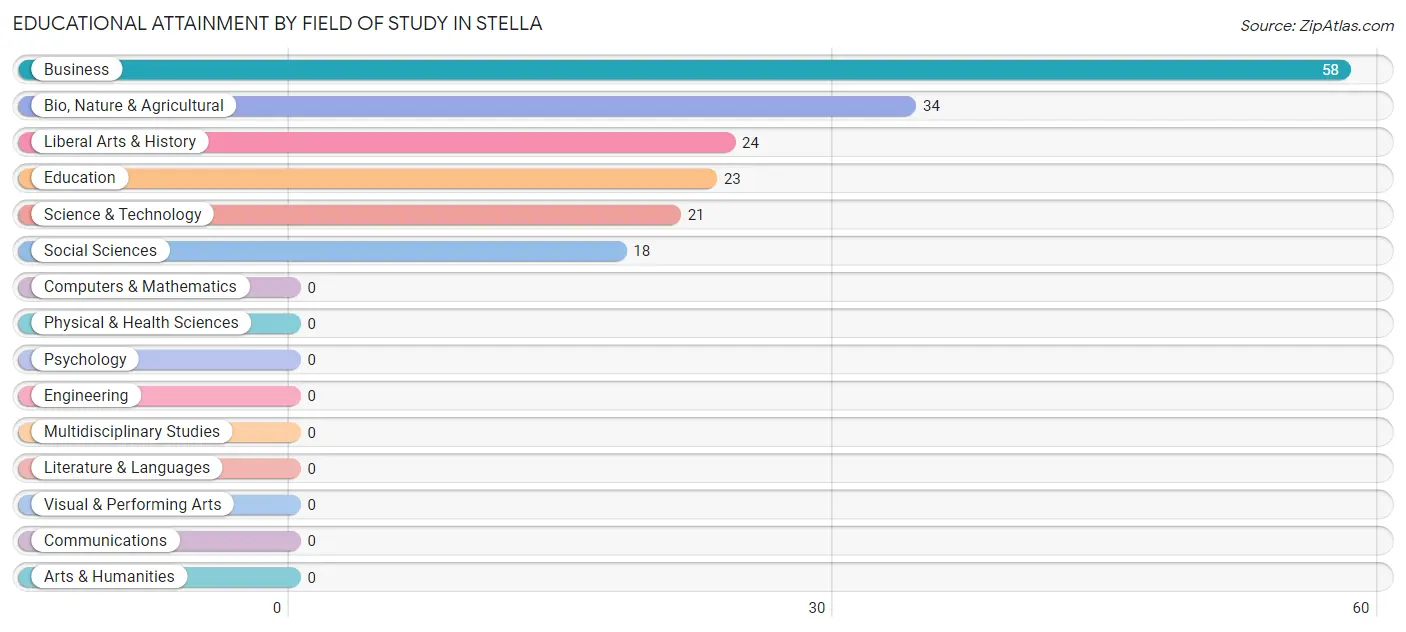
| Field of Study | # Graduates | % Graduates |
| Computers & Mathematics | 0 | 0.0% |
| Bio, Nature & Agricultural | 34 | 19.1% |
| Physical & Health Sciences | 0 | 0.0% |
| Psychology | 0 | 0.0% |
| Social Sciences | 18 | 10.1% |
| Engineering | 0 | 0.0% |
| Multidisciplinary Studies | 0 | 0.0% |
| Science & Technology | 21 | 11.8% |
| Business | 58 | 32.6% |
| Education | 23 | 12.9% |
| Literature & Languages | 0 | 0.0% |
| Liberal Arts & History | 24 | 13.5% |
| Visual & Performing Arts | 0 | 0.0% |
| Communications | 0 | 0.0% |
| Arts & Humanities | 0 | 0.0% |
| Total | 178 | 100.0% |
Transportation & Commute in Stella
Vehicle Availability by Sex in Stella
The most prevalent vehicle ownership categories in Stella are males with 2 vehicles (91, accounting for 56.5%) and females with 2 vehicles (221, making up 32.0%).
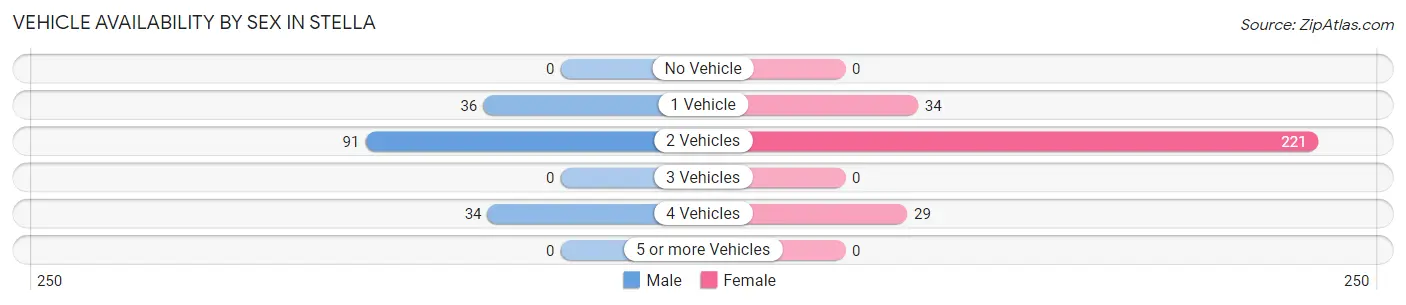
| Vehicles Available | Male | Female |
| No Vehicle | 0 (0.0%) | 0 (0.0%) |
| 1 Vehicle | 36 (22.4%) | 34 (12.0%) |
| 2 Vehicles | 91 (56.5%) | 221 (77.8%) |
| 3 Vehicles | 0 (0.0%) | 0 (0.0%) |
| 4 Vehicles | 34 (21.1%) | 29 (10.2%) |
| 5 or more Vehicles | 0 (0.0%) | 0 (0.0%) |
| Total | 161 (100.0%) | 284 (100.0%) |
Commute Time in Stella
The most frequently occuring commute durations in Stella are 5 to 9 minutes (230 commuters, 64.4%), 15 to 19 minutes (34 commuters, 9.5%), and 60 to 89 minutes (29 commuters, 8.1%).
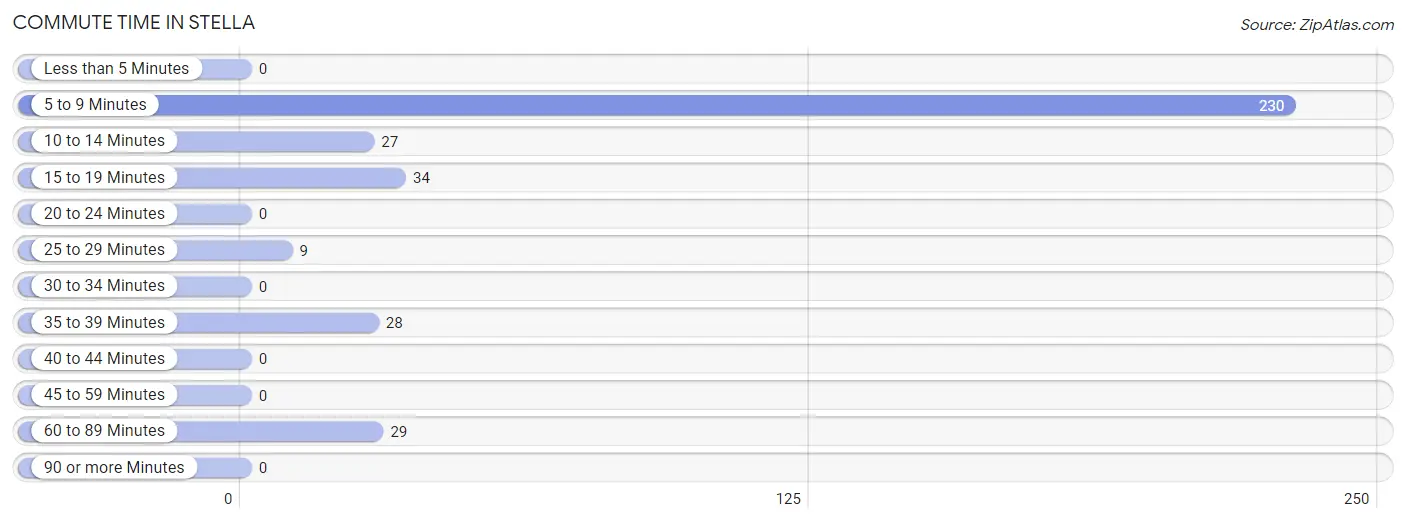
| Commute Time | # Commuters | % Commuters |
| Less than 5 Minutes | 0 | 0.0% |
| 5 to 9 Minutes | 230 | 64.4% |
| 10 to 14 Minutes | 27 | 7.6% |
| 15 to 19 Minutes | 34 | 9.5% |
| 20 to 24 Minutes | 0 | 0.0% |
| 25 to 29 Minutes | 9 | 2.5% |
| 30 to 34 Minutes | 0 | 0.0% |
| 35 to 39 Minutes | 28 | 7.8% |
| 40 to 44 Minutes | 0 | 0.0% |
| 45 to 59 Minutes | 0 | 0.0% |
| 60 to 89 Minutes | 29 | 8.1% |
| 90 or more Minutes | 0 | 0.0% |
Commute Time by Sex in Stella
The most common commute times in Stella are 5 to 9 minutes (35 commuters, 26.3%) for males and 5 to 9 minutes (195 commuters, 87.1%) for females.
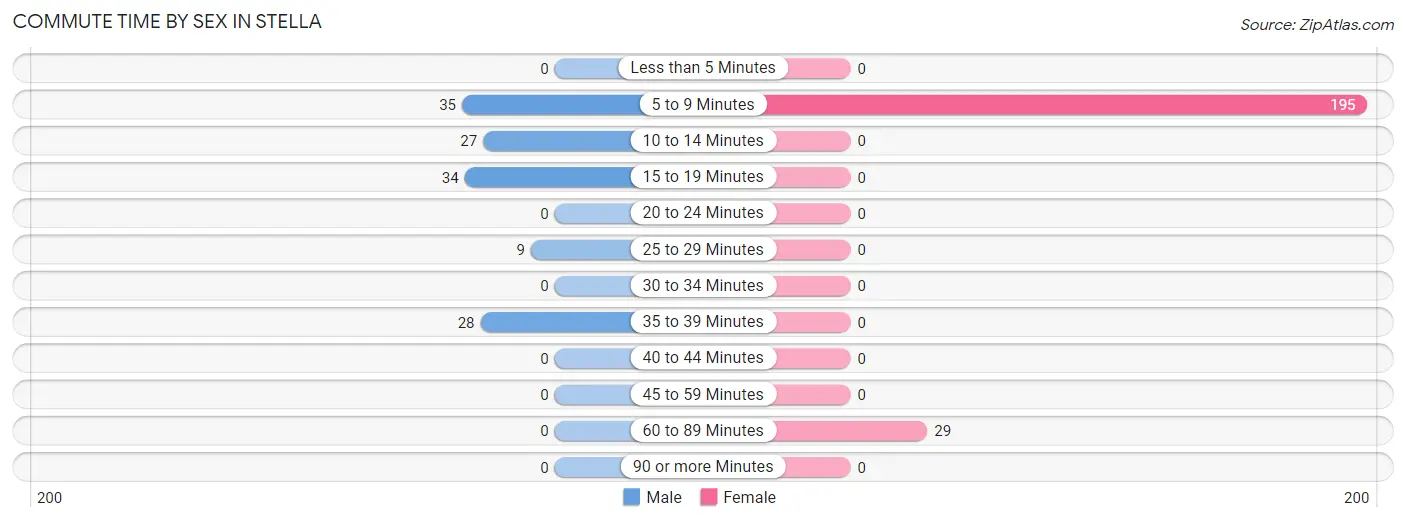
| Commute Time | Male | Female |
| Less than 5 Minutes | 0 (0.0%) | 0 (0.0%) |
| 5 to 9 Minutes | 35 (26.3%) | 195 (87.1%) |
| 10 to 14 Minutes | 27 (20.3%) | 0 (0.0%) |
| 15 to 19 Minutes | 34 (25.6%) | 0 (0.0%) |
| 20 to 24 Minutes | 0 (0.0%) | 0 (0.0%) |
| 25 to 29 Minutes | 9 (6.8%) | 0 (0.0%) |
| 30 to 34 Minutes | 0 (0.0%) | 0 (0.0%) |
| 35 to 39 Minutes | 28 (21.0%) | 0 (0.0%) |
| 40 to 44 Minutes | 0 (0.0%) | 0 (0.0%) |
| 45 to 59 Minutes | 0 (0.0%) | 0 (0.0%) |
| 60 to 89 Minutes | 0 (0.0%) | 29 (13.0%) |
| 90 or more Minutes | 0 (0.0%) | 0 (0.0%) |
Time of Departure to Work by Sex in Stella
The most frequent times of departure to work in Stella are 5:00 AM to 5:29 AM (35, 26.3%) for males and 8:00 AM to 8:29 AM (165, 73.7%) for females.
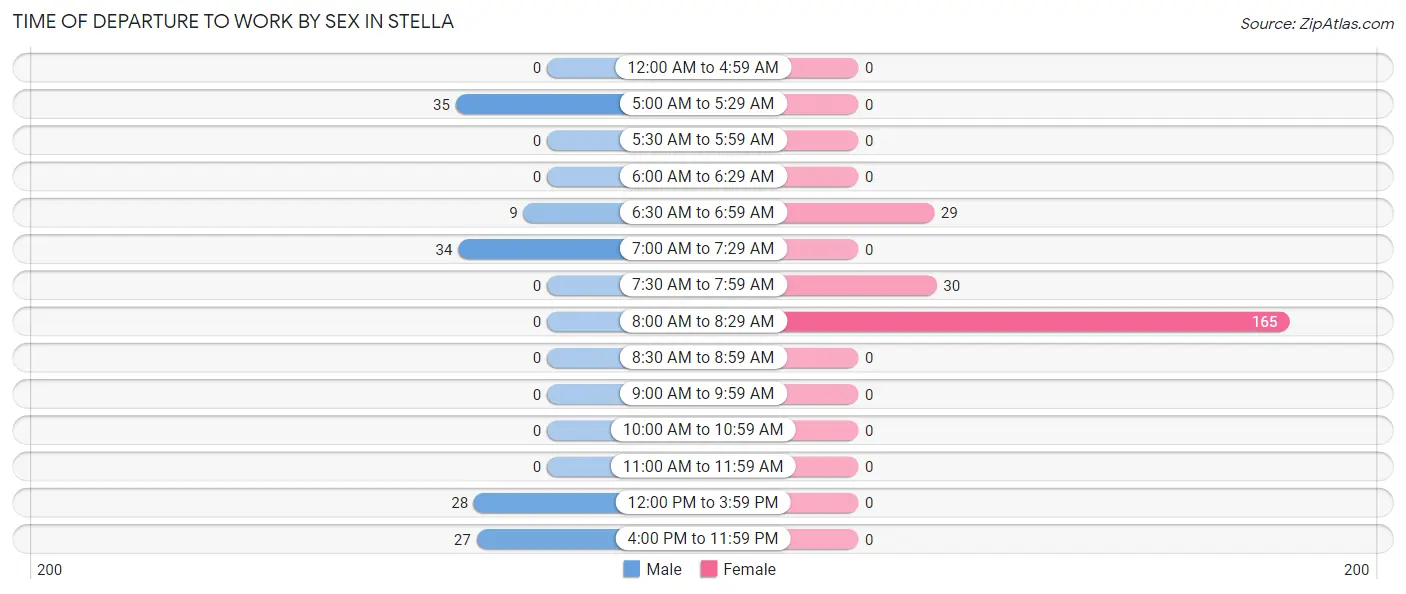
| Time of Departure | Male | Female |
| 12:00 AM to 4:59 AM | 0 (0.0%) | 0 (0.0%) |
| 5:00 AM to 5:29 AM | 35 (26.3%) | 0 (0.0%) |
| 5:30 AM to 5:59 AM | 0 (0.0%) | 0 (0.0%) |
| 6:00 AM to 6:29 AM | 0 (0.0%) | 0 (0.0%) |
| 6:30 AM to 6:59 AM | 9 (6.8%) | 29 (13.0%) |
| 7:00 AM to 7:29 AM | 34 (25.6%) | 0 (0.0%) |
| 7:30 AM to 7:59 AM | 0 (0.0%) | 30 (13.4%) |
| 8:00 AM to 8:29 AM | 0 (0.0%) | 165 (73.7%) |
| 8:30 AM to 8:59 AM | 0 (0.0%) | 0 (0.0%) |
| 9:00 AM to 9:59 AM | 0 (0.0%) | 0 (0.0%) |
| 10:00 AM to 10:59 AM | 0 (0.0%) | 0 (0.0%) |
| 11:00 AM to 11:59 AM | 0 (0.0%) | 0 (0.0%) |
| 12:00 PM to 3:59 PM | 28 (21.0%) | 0 (0.0%) |
| 4:00 PM to 11:59 PM | 27 (20.3%) | 0 (0.0%) |
| Total | 133 (100.0%) | 224 (100.0%) |
Housing Occupancy in Stella
Occupancy by Ownership in Stella
Of the total 390 dwellings in Stella, owner-occupied units account for 284 (72.8%), while renter-occupied units make up 106 (27.2%).
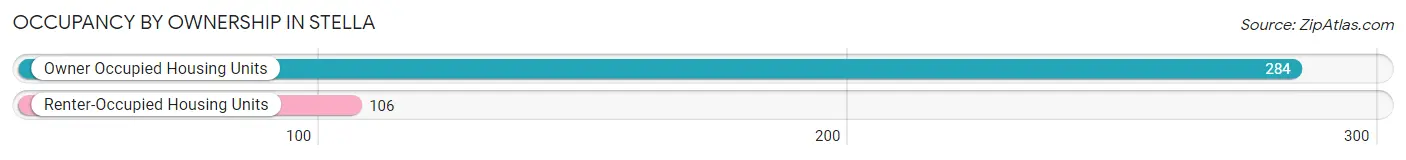
| Occupancy | # Housing Units | % Housing Units |
| Owner Occupied Housing Units | 284 | 72.8% |
| Renter-Occupied Housing Units | 106 | 27.2% |
| Total Occupied Housing Units | 390 | 100.0% |
Occupancy by Household Size in Stella
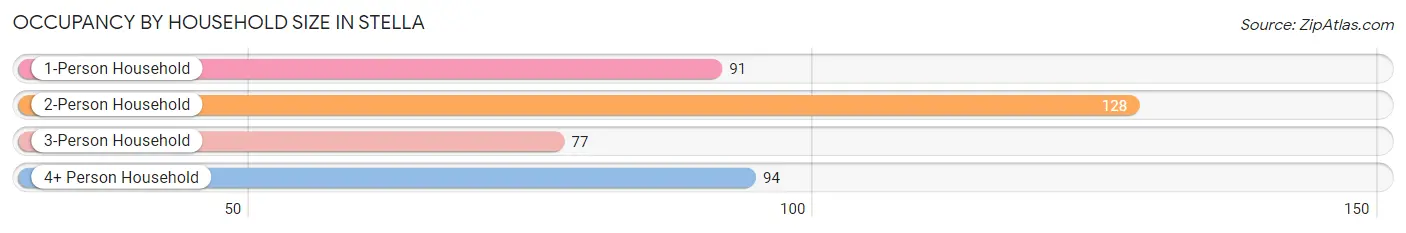
| Household Size | # Housing Units | % Housing Units |
| 1-Person Household | 91 | 23.3% |
| 2-Person Household | 128 | 32.8% |
| 3-Person Household | 77 | 19.7% |
| 4+ Person Household | 94 | 24.1% |
| Total Housing Units | 390 | 100.0% |
Occupancy by Ownership by Household Size in Stella
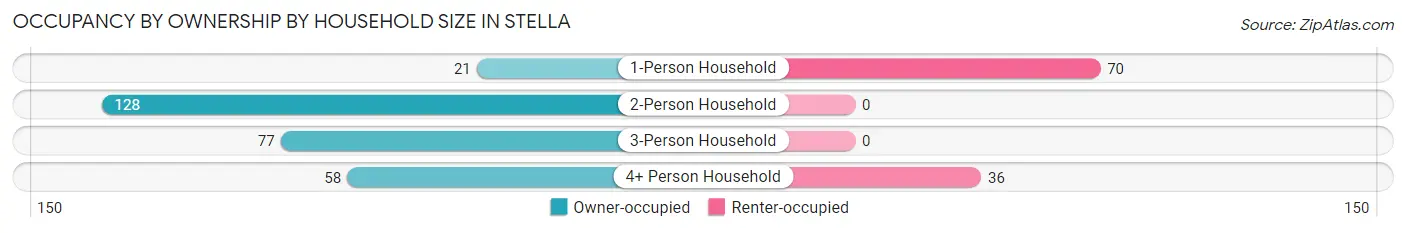
| Household Size | Owner-occupied | Renter-occupied |
| 1-Person Household | 21 (23.1%) | 70 (76.9%) |
| 2-Person Household | 128 (100.0%) | 0 (0.0%) |
| 3-Person Household | 77 (100.0%) | 0 (0.0%) |
| 4+ Person Household | 58 (61.7%) | 36 (38.3%) |
| Total Housing Units | 284 (72.8%) | 106 (27.2%) |
Occupancy by Educational Attainment in Stella
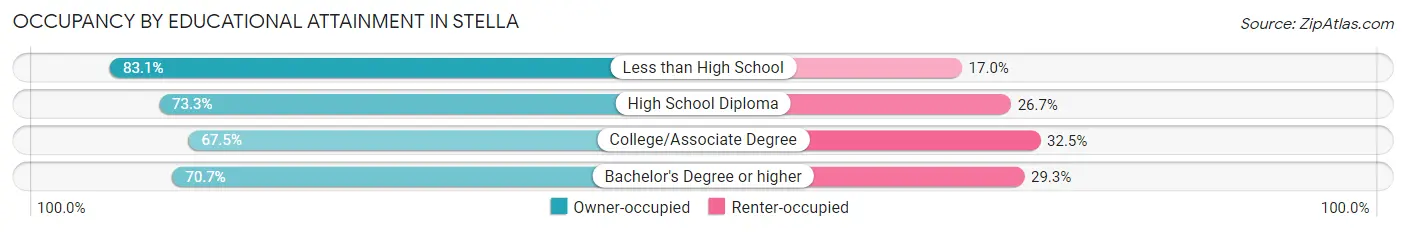
| Household Size | Owner-occupied | Renter-occupied |
| Less than High School | 49 (83.1%) | 10 (17.0%) |
| High School Diploma | 99 (73.3%) | 36 (26.7%) |
| College/Associate Degree | 54 (67.5%) | 26 (32.5%) |
| Bachelor's Degree or higher | 82 (70.7%) | 34 (29.3%) |
Occupancy by Age of Householder in Stella
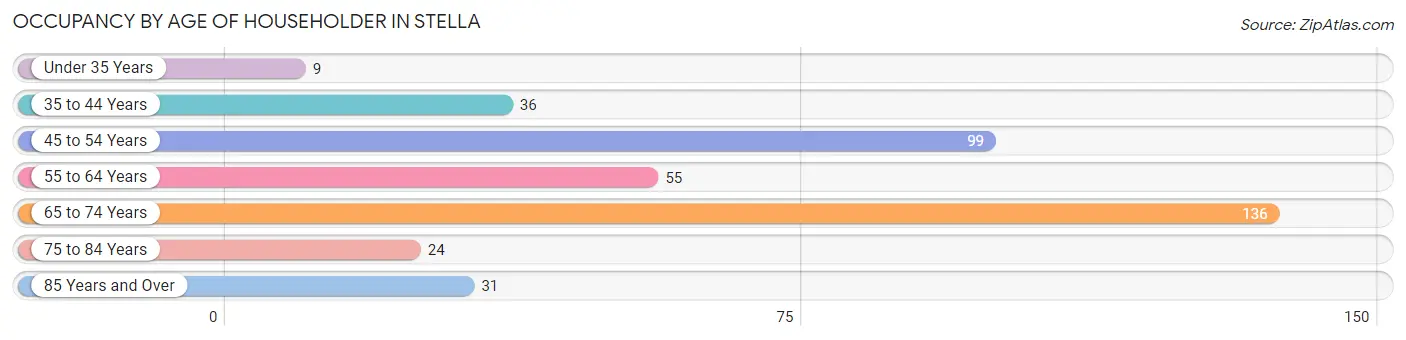
| Age Bracket | # Households | % Households |
| Under 35 Years | 9 | 2.3% |
| 35 to 44 Years | 36 | 9.2% |
| 45 to 54 Years | 99 | 25.4% |
| 55 to 64 Years | 55 | 14.1% |
| 65 to 74 Years | 136 | 34.9% |
| 75 to 84 Years | 24 | 6.1% |
| 85 Years and Over | 31 | 8.0% |
| Total | 390 | 100.0% |
Housing Finances in Stella
Median Income by Occupancy in Stella
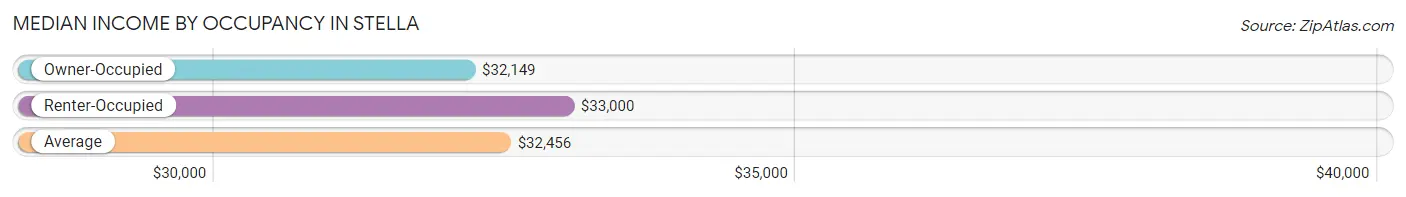
| Occupancy Type | # Households | Median Income |
| Owner-Occupied | 284 (72.8%) | $32,149 |
| Renter-Occupied | 106 (27.2%) | $33,000 |
| Average | 390 (100.0%) | $32,456 |
Occupancy by Householder Income Bracket in Stella
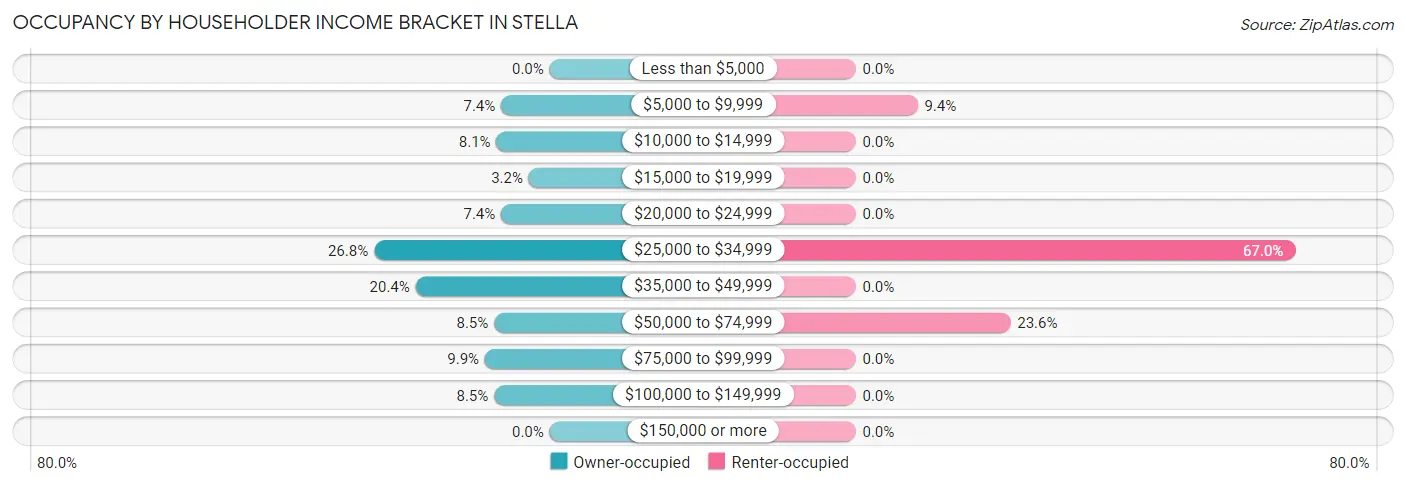
| Income Bracket | Owner-occupied | Renter-occupied |
| Less than $5,000 | 0 (0.0%) | 0 (0.0%) |
| $5,000 to $9,999 | 21 (7.4%) | 10 (9.4%) |
| $10,000 to $14,999 | 23 (8.1%) | 0 (0.0%) |
| $15,000 to $19,999 | 9 (3.2%) | 0 (0.0%) |
| $20,000 to $24,999 | 21 (7.4%) | 0 (0.0%) |
| $25,000 to $34,999 | 76 (26.8%) | 71 (67.0%) |
| $35,000 to $49,999 | 58 (20.4%) | 0 (0.0%) |
| $50,000 to $74,999 | 24 (8.5%) | 25 (23.6%) |
| $75,000 to $99,999 | 28 (9.9%) | 0 (0.0%) |
| $100,000 to $149,999 | 24 (8.5%) | 0 (0.0%) |
| $150,000 or more | 0 (0.0%) | 0 (0.0%) |
| Total | 284 (100.0%) | 106 (100.0%) |
Monthly Housing Cost Tiers in Stella
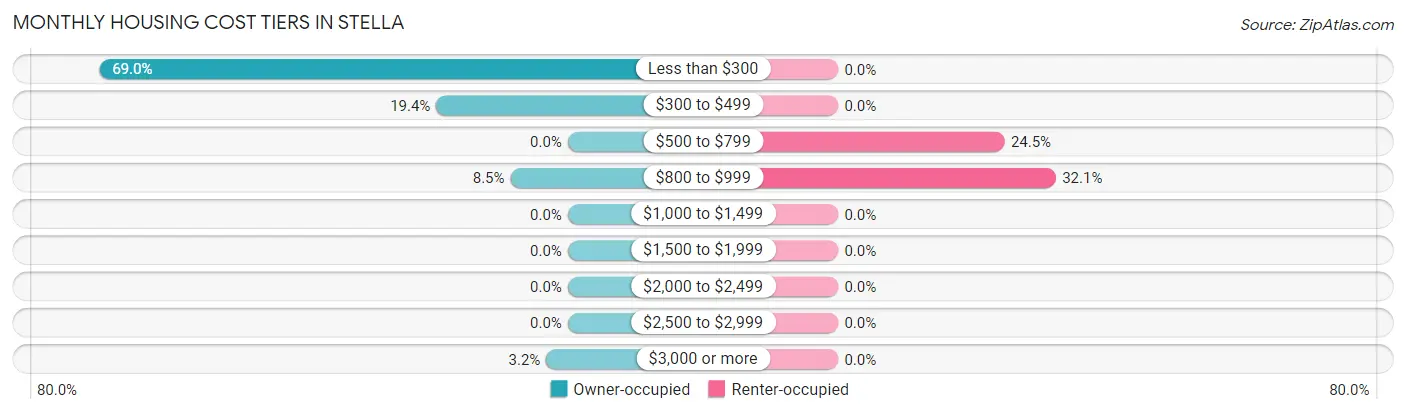
| Monthly Cost | Owner-occupied | Renter-occupied |
| Less than $300 | 196 (69.0%) | 0 (0.0%) |
| $300 to $499 | 55 (19.4%) | 0 (0.0%) |
| $500 to $799 | 0 (0.0%) | 26 (24.5%) |
| $800 to $999 | 24 (8.5%) | 34 (32.1%) |
| $1,000 to $1,499 | 0 (0.0%) | 0 (0.0%) |
| $1,500 to $1,999 | 0 (0.0%) | 0 (0.0%) |
| $2,000 to $2,499 | 0 (0.0%) | 0 (0.0%) |
| $2,500 to $2,999 | 0 (0.0%) | 0 (0.0%) |
| $3,000 or more | 9 (3.2%) | 0 (0.0%) |
| Total | 284 (100.0%) | 106 (100.0%) |
Physical Housing Characteristics in Stella
Housing Structures in Stella
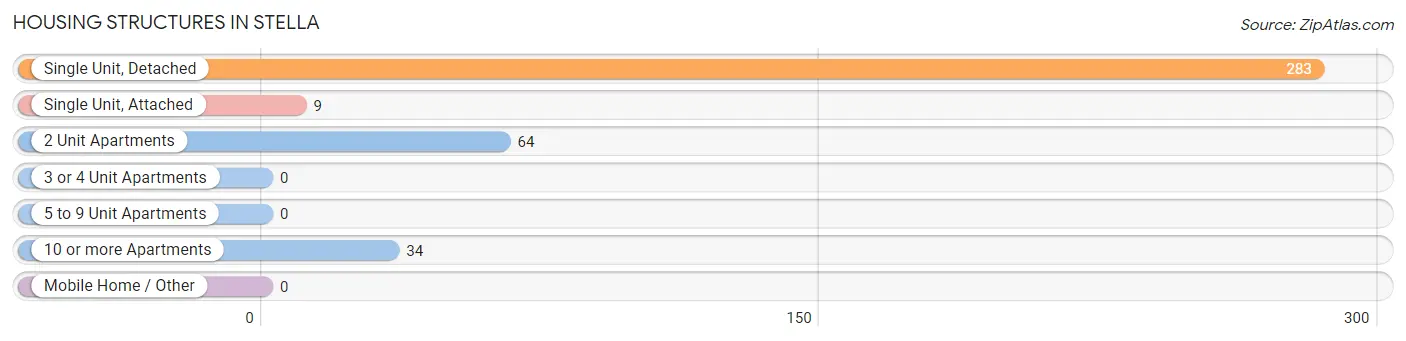
| Structure Type | # Housing Units | % Housing Units |
| Single Unit, Detached | 283 | 72.6% |
| Single Unit, Attached | 9 | 2.3% |
| 2 Unit Apartments | 64 | 16.4% |
| 3 or 4 Unit Apartments | 0 | 0.0% |
| 5 to 9 Unit Apartments | 0 | 0.0% |
| 10 or more Apartments | 34 | 8.7% |
| Mobile Home / Other | 0 | 0.0% |
| Total | 390 | 100.0% |
Housing Structures by Occupancy in Stella
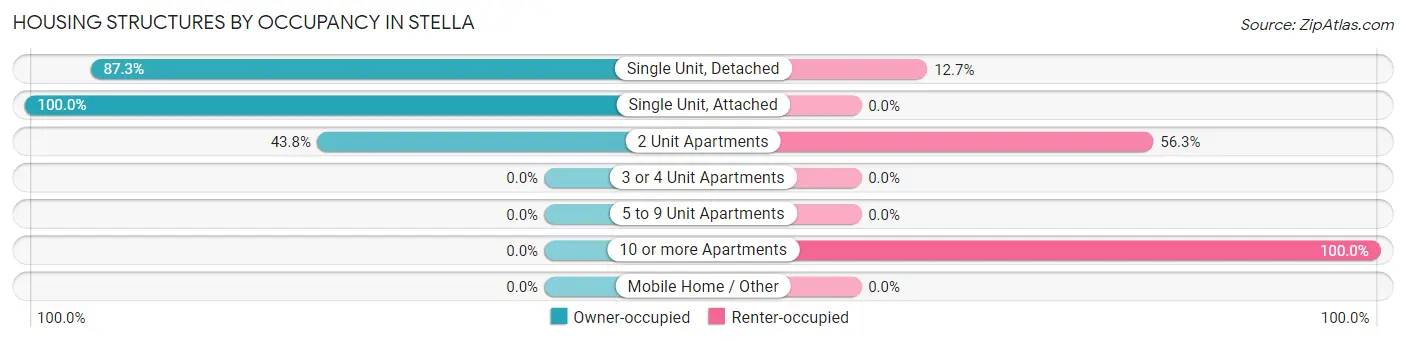
| Structure Type | Owner-occupied | Renter-occupied |
| Single Unit, Detached | 247 (87.3%) | 36 (12.7%) |
| Single Unit, Attached | 9 (100.0%) | 0 (0.0%) |
| 2 Unit Apartments | 28 (43.8%) | 36 (56.2%) |
| 3 or 4 Unit Apartments | 0 (0.0%) | 0 (0.0%) |
| 5 to 9 Unit Apartments | 0 (0.0%) | 0 (0.0%) |
| 10 or more Apartments | 0 (0.0%) | 34 (100.0%) |
| Mobile Home / Other | 0 (0.0%) | 0 (0.0%) |
| Total | 284 (72.8%) | 106 (27.2%) |
Housing Structures by Number of Rooms in Stella
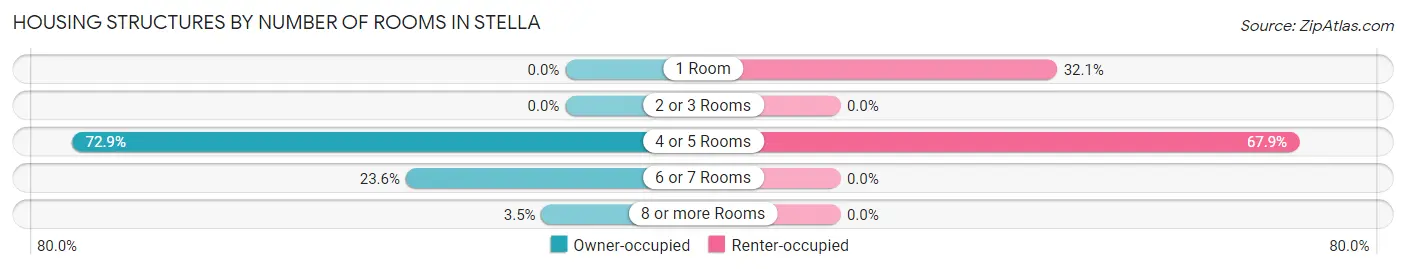
| Number of Rooms | Owner-occupied | Renter-occupied |
| 1 Room | 0 (0.0%) | 34 (32.1%) |
| 2 or 3 Rooms | 0 (0.0%) | 0 (0.0%) |
| 4 or 5 Rooms | 207 (72.9%) | 72 (67.9%) |
| 6 or 7 Rooms | 67 (23.6%) | 0 (0.0%) |
| 8 or more Rooms | 10 (3.5%) | 0 (0.0%) |
| Total | 284 (100.0%) | 106 (100.0%) |
Housing Structure by Heating Type in Stella
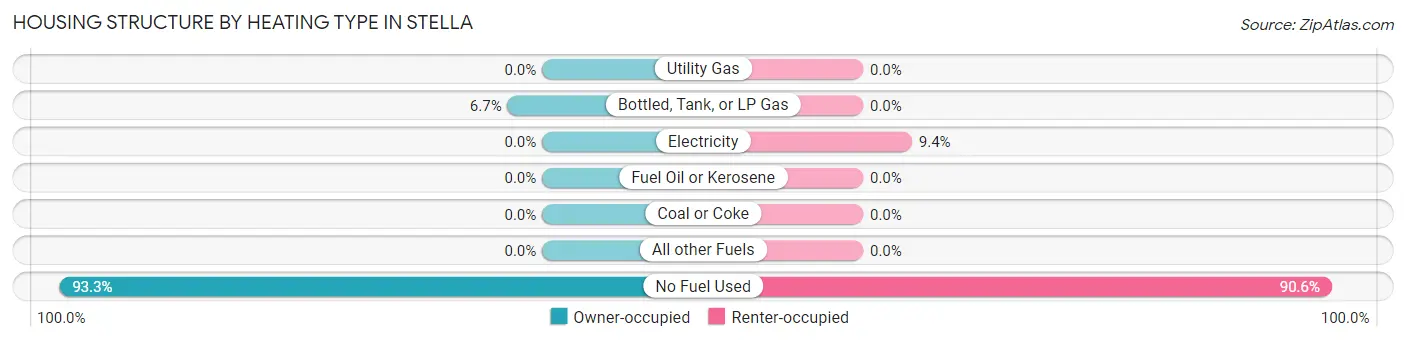
| Heating Type | Owner-occupied | Renter-occupied |
| Utility Gas | 0 (0.0%) | 0 (0.0%) |
| Bottled, Tank, or LP Gas | 19 (6.7%) | 0 (0.0%) |
| Electricity | 0 (0.0%) | 10 (9.4%) |
| Fuel Oil or Kerosene | 0 (0.0%) | 0 (0.0%) |
| Coal or Coke | 0 (0.0%) | 0 (0.0%) |
| All other Fuels | 0 (0.0%) | 0 (0.0%) |
| No Fuel Used | 265 (93.3%) | 96 (90.6%) |
| Total | 284 (100.0%) | 106 (100.0%) |
Household Vehicle Usage in Stella
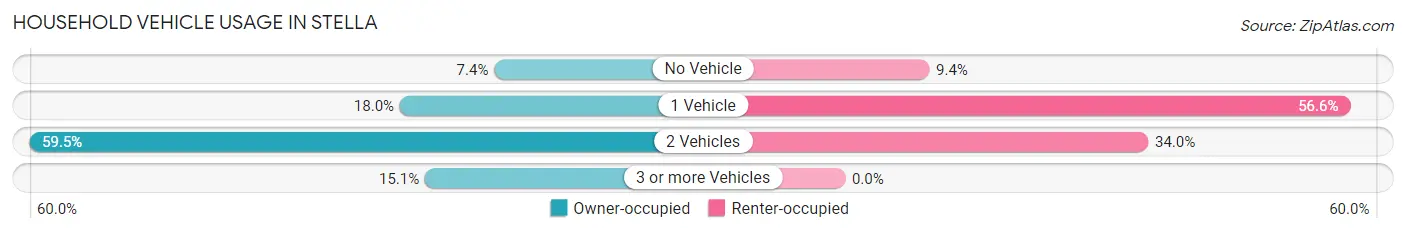
| Vehicles per Household | Owner-occupied | Renter-occupied |
| No Vehicle | 21 (7.4%) | 10 (9.4%) |
| 1 Vehicle | 51 (18.0%) | 60 (56.6%) |
| 2 Vehicles | 169 (59.5%) | 36 (34.0%) |
| 3 or more Vehicles | 43 (15.1%) | 0 (0.0%) |
| Total | 284 (100.0%) | 106 (100.0%) |
Real Estate & Mortgages in Stella
Real Estate and Mortgage Overview in Stella
| Characteristic | Without Mortgage | With Mortgage |
| Housing Units | 260 | 24 |
| Median Property Value | $169,600 | $0 |
| Median Household Income | $31,623 | $0 |
| Monthly Housing Costs | $196 | $0 |
| Real Estate Taxes | - | - |
Property Value by Mortgage Status in Stella
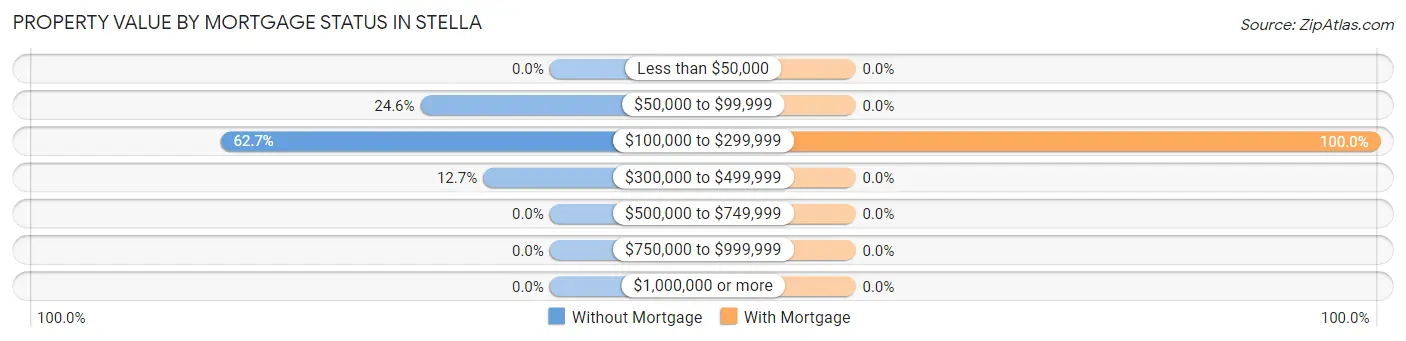
| Property Value | Without Mortgage | With Mortgage |
| Less than $50,000 | 0 (0.0%) | 0 (0.0%) |
| $50,000 to $99,999 | 64 (24.6%) | 0 (0.0%) |
| $100,000 to $299,999 | 163 (62.7%) | 24 (100.0%) |
| $300,000 to $499,999 | 33 (12.7%) | 0 (0.0%) |
| $500,000 to $749,999 | 0 (0.0%) | 0 (0.0%) |
| $750,000 to $999,999 | 0 (0.0%) | 0 (0.0%) |
| $1,000,000 or more | 0 (0.0%) | 0 (0.0%) |
| Total | 260 (100.0%) | 24 (100.0%) |
Household Income by Mortgage Status in Stella
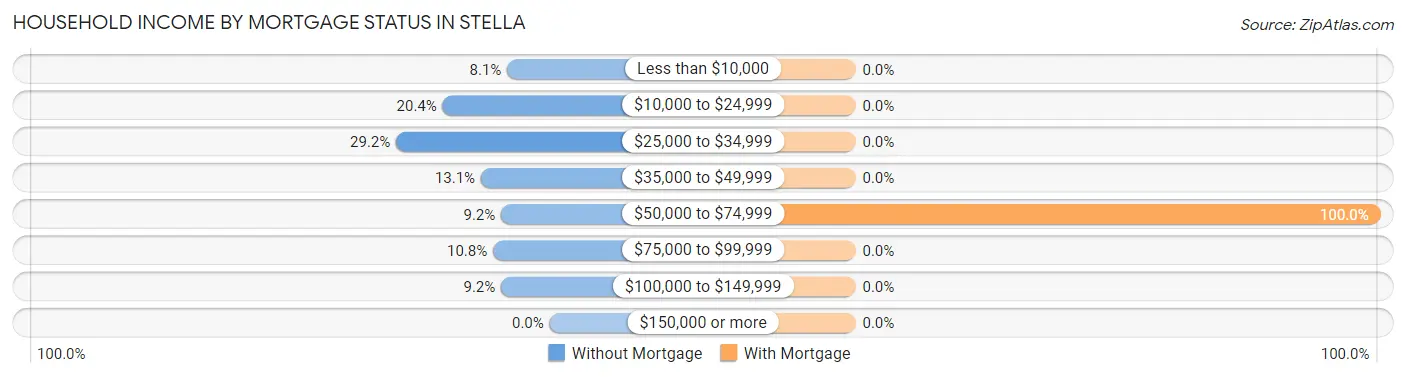
| Household Income | Without Mortgage | With Mortgage |
| Less than $10,000 | 21 (8.1%) | 0 (0.0%) |
| $10,000 to $24,999 | 53 (20.4%) | 0 (0.0%) |
| $25,000 to $34,999 | 76 (29.2%) | 0 (0.0%) |
| $35,000 to $49,999 | 34 (13.1%) | 0 (0.0%) |
| $50,000 to $74,999 | 24 (9.2%) | 24 (100.0%) |
| $75,000 to $99,999 | 28 (10.8%) | 0 (0.0%) |
| $100,000 to $149,999 | 24 (9.2%) | 0 (0.0%) |
| $150,000 or more | 0 (0.0%) | 0 (0.0%) |
| Total | 260 (100.0%) | 24 (100.0%) |
Property Value to Household Income Ratio in Stella
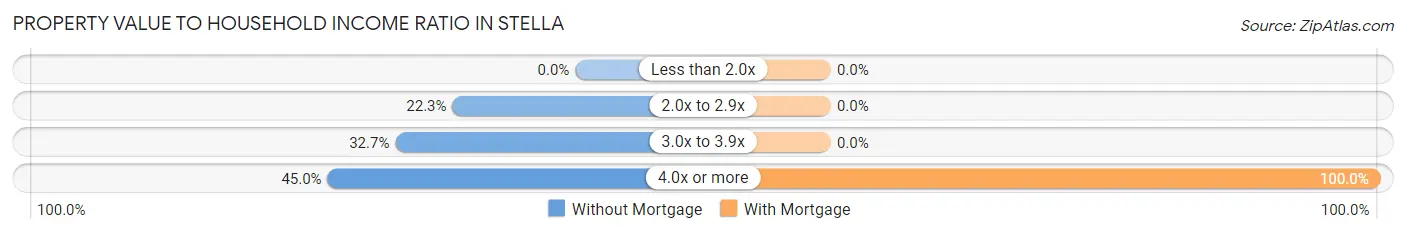
| Value-to-Income Ratio | Without Mortgage | With Mortgage |
| Less than 2.0x | 0 (0.0%) | 0 (0.0%) |
| 2.0x to 2.9x | 58 (22.3%) | 0 (0.0%) |
| 3.0x to 3.9x | 85 (32.7%) | 0 (0.0%) |
| 4.0x or more | 117 (45.0%) | 24 (100.0%) |
| Total | 260 (100.0%) | 24 (100.0%) |
Real Estate Taxes by Mortgage Status in Stella
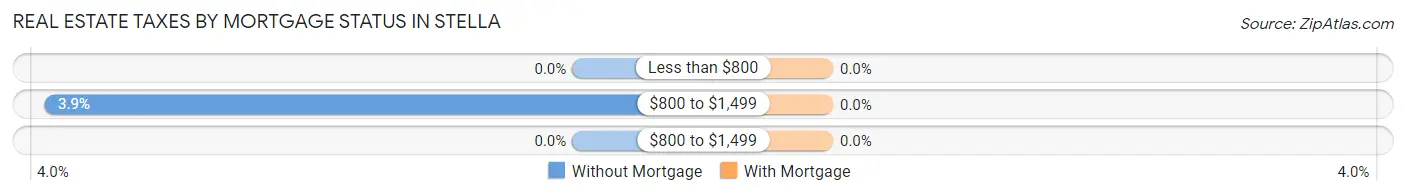
| Property Taxes | Without Mortgage | With Mortgage |
| Less than $800 | 0 (0.0%) | 0 (0.0%) |
| $800 to $1,499 | 10 (3.8%) | 0 (0.0%) |
| $800 to $1,499 | 0 (0.0%) | 0 (0.0%) |
| Total | 260 (100.0%) | 24 (100.0%) |
Health & Disability in Stella
Health Insurance Coverage by Age in Stella
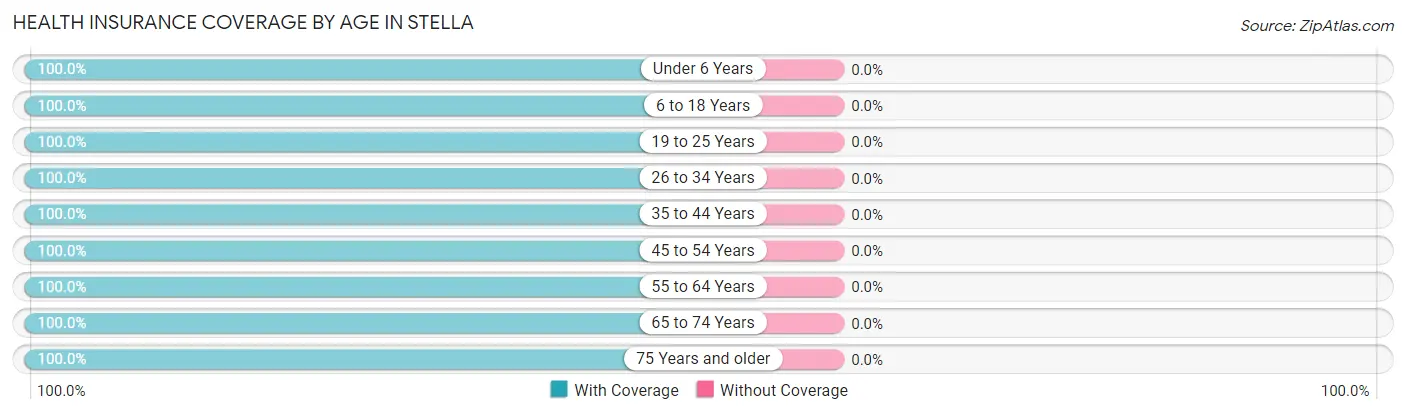
| Age Bracket | With Coverage | Without Coverage |
| Under 6 Years | 74 (100.0%) | 0 (0.0%) |
| 6 to 18 Years | 129 (100.0%) | 0 (0.0%) |
| 19 to 25 Years | 230 (100.0%) | 0 (0.0%) |
| 26 to 34 Years | 9 (100.0%) | 0 (0.0%) |
| 35 to 44 Years | 97 (100.0%) | 0 (0.0%) |
| 45 to 54 Years | 128 (100.0%) | 0 (0.0%) |
| 55 to 64 Years | 184 (100.0%) | 0 (0.0%) |
| 65 to 74 Years | 177 (100.0%) | 0 (0.0%) |
| 75 Years and older | 102 (100.0%) | 0 (0.0%) |
| Total | 1,130 (100.0%) | 0 (0.0%) |
Health Insurance Coverage by Citizenship Status in Stella
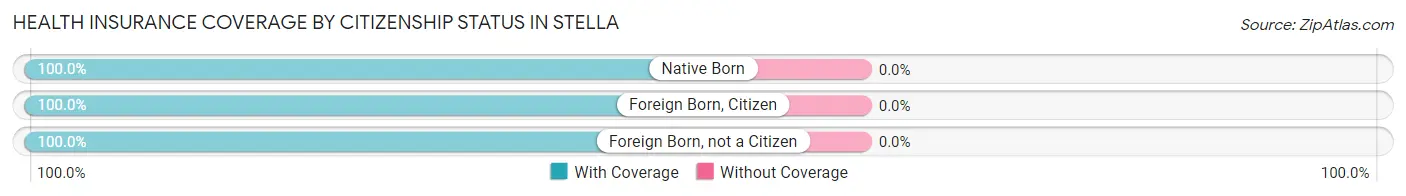
| Citizenship Status | With Coverage | Without Coverage |
| Native Born | 74 (100.0%) | 0 (0.0%) |
| Foreign Born, Citizen | 129 (100.0%) | 0 (0.0%) |
| Foreign Born, not a Citizen | 230 (100.0%) | 0 (0.0%) |
Health Insurance Coverage by Household Income in Stella
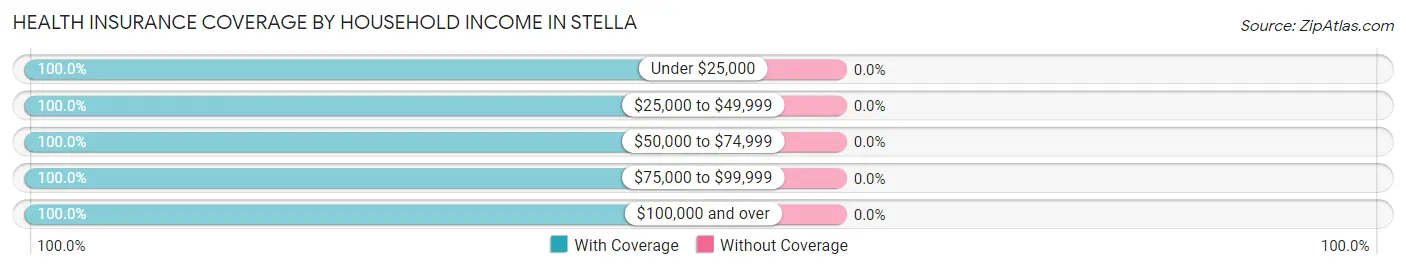
| Household Income | With Coverage | Without Coverage |
| Under $25,000 | 202 (100.0%) | 0 (0.0%) |
| $25,000 to $49,999 | 714 (100.0%) | 0 (0.0%) |
| $50,000 to $74,999 | 72 (100.0%) | 0 (0.0%) |
| $75,000 to $99,999 | 84 (100.0%) | 0 (0.0%) |
| $100,000 and over | 58 (100.0%) | 0 (0.0%) |
Public vs Private Health Insurance Coverage by Age in Stella
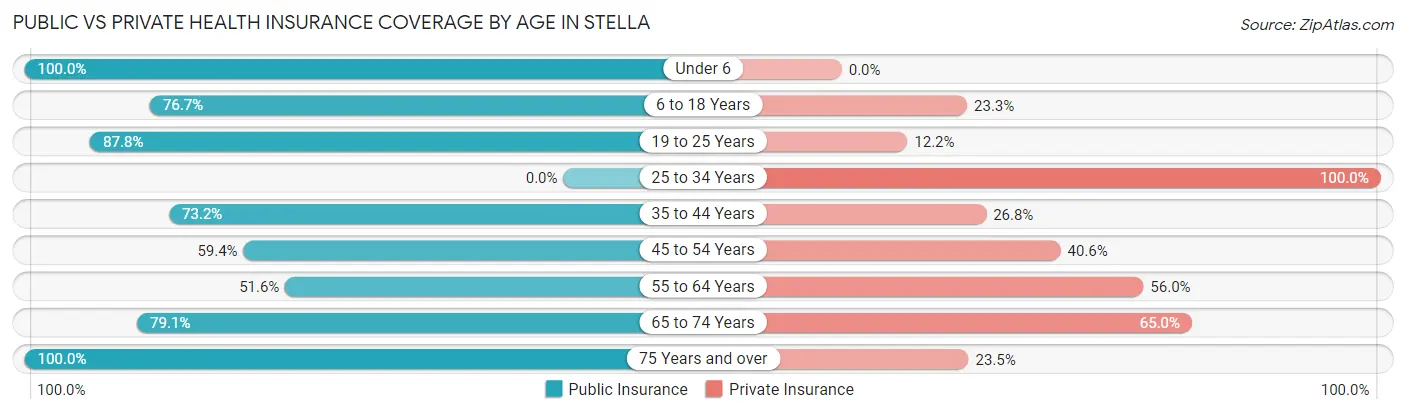
| Age Bracket | Public Insurance | Private Insurance |
| Under 6 | 74 (100.0%) | 0 (0.0%) |
| 6 to 18 Years | 99 (76.7%) | 30 (23.3%) |
| 19 to 25 Years | 202 (87.8%) | 28 (12.2%) |
| 25 to 34 Years | 0 (0.0%) | 9 (100.0%) |
| 35 to 44 Years | 71 (73.2%) | 26 (26.8%) |
| 45 to 54 Years | 76 (59.4%) | 52 (40.6%) |
| 55 to 64 Years | 95 (51.6%) | 103 (56.0%) |
| 65 to 74 Years | 140 (79.1%) | 115 (65.0%) |
| 75 Years and over | 102 (100.0%) | 24 (23.5%) |
| Total | 859 (76.0%) | 387 (34.3%) |
Disability Status by Sex by Age in Stella
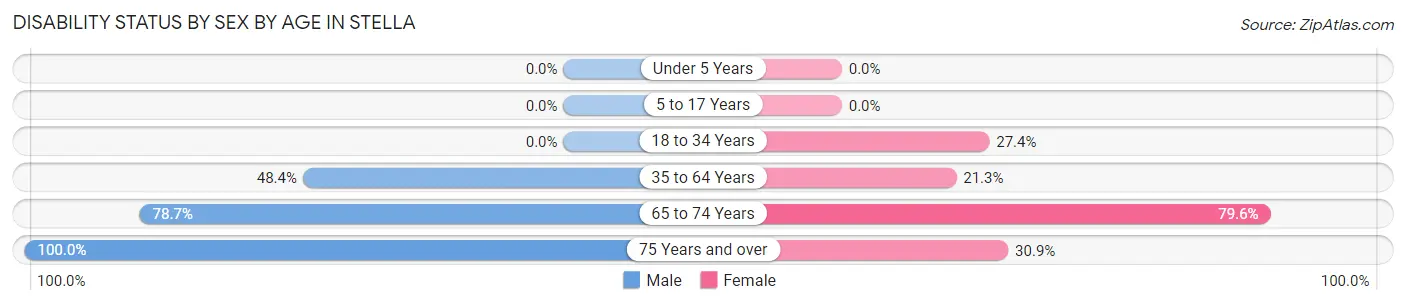
| Age Bracket | Male | Female |
| Under 5 Years | 0 (0.0%) | 0 (0.0%) |
| 5 to 17 Years | 0 (0.0%) | 0 (0.0%) |
| 18 to 34 Years | 0 (0.0%) | 46 (27.4%) |
| 35 to 64 Years | 59 (48.4%) | 61 (21.2%) |
| 65 to 74 Years | 70 (78.6%) | 70 (79.5%) |
| 75 Years and over | 34 (100.0%) | 21 (30.9%) |
Disability Class by Sex by Age in Stella
Disability Class: Hearing Difficulty
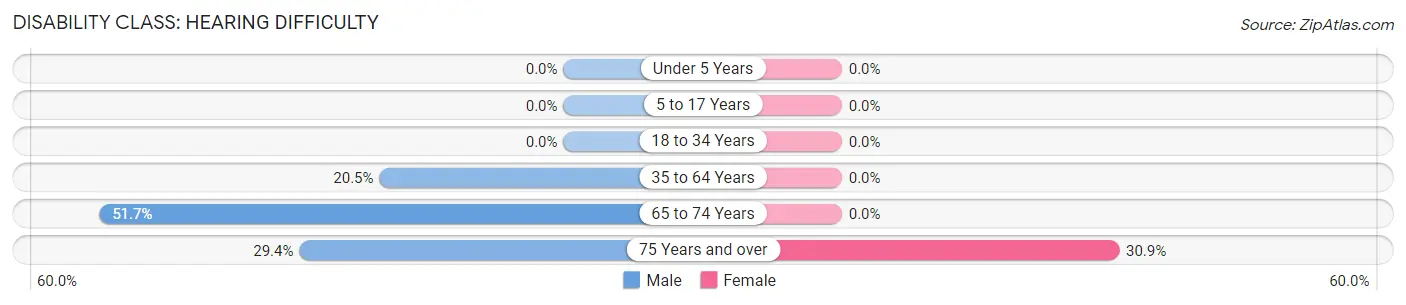
| Age Bracket | Male | Female |
| Under 5 Years | 0 (0.0%) | 0 (0.0%) |
| 5 to 17 Years | 0 (0.0%) | 0 (0.0%) |
| 18 to 34 Years | 0 (0.0%) | 0 (0.0%) |
| 35 to 64 Years | 25 (20.5%) | 0 (0.0%) |
| 65 to 74 Years | 46 (51.7%) | 0 (0.0%) |
| 75 Years and over | 10 (29.4%) | 21 (30.9%) |
Disability Class: Vision Difficulty
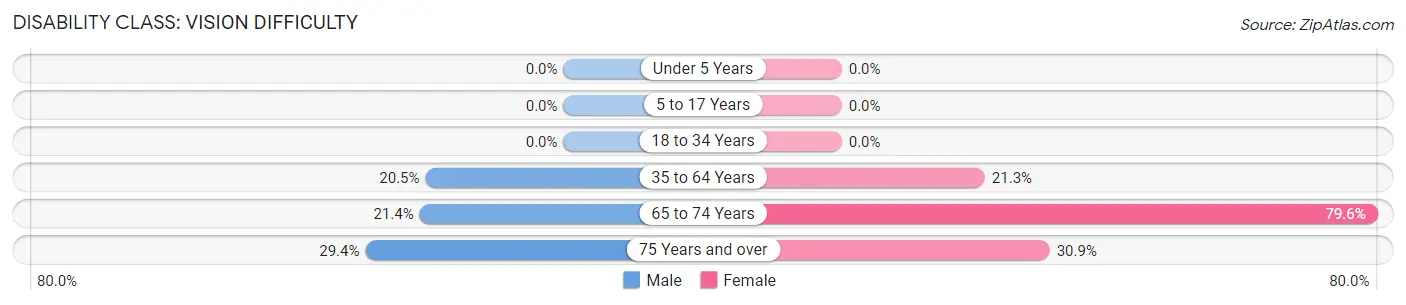
| Age Bracket | Male | Female |
| Under 5 Years | 0 (0.0%) | 0 (0.0%) |
| 5 to 17 Years | 0 (0.0%) | 0 (0.0%) |
| 18 to 34 Years | 0 (0.0%) | 0 (0.0%) |
| 35 to 64 Years | 25 (20.5%) | 61 (21.2%) |
| 65 to 74 Years | 19 (21.3%) | 70 (79.5%) |
| 75 Years and over | 10 (29.4%) | 21 (30.9%) |
Disability Class: Cognitive Difficulty
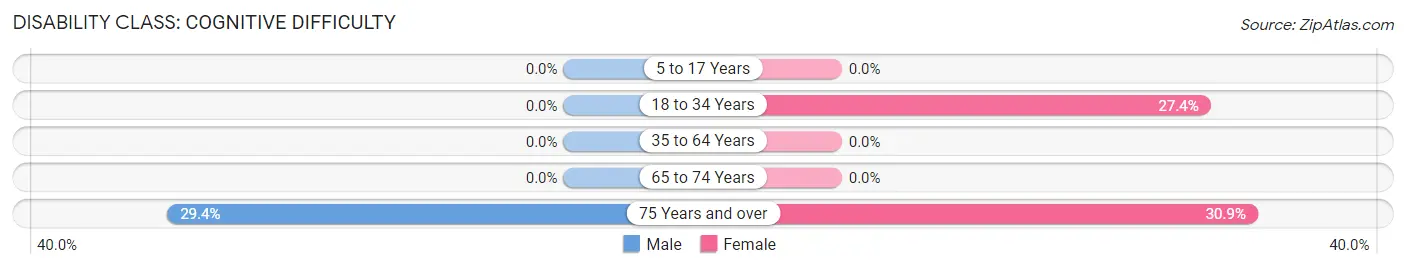
| Age Bracket | Male | Female |
| 5 to 17 Years | 0 (0.0%) | 0 (0.0%) |
| 18 to 34 Years | 0 (0.0%) | 46 (27.4%) |
| 35 to 64 Years | 0 (0.0%) | 0 (0.0%) |
| 65 to 74 Years | 0 (0.0%) | 0 (0.0%) |
| 75 Years and over | 10 (29.4%) | 21 (30.9%) |
Disability Class: Ambulatory Difficulty
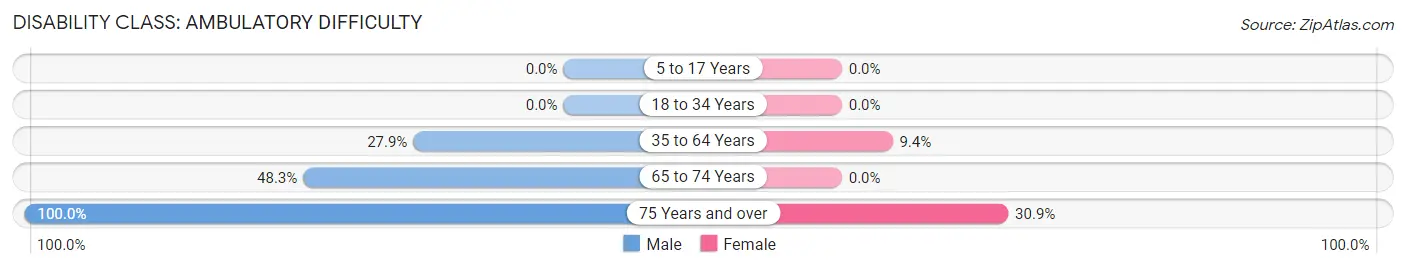
| Age Bracket | Male | Female |
| 5 to 17 Years | 0 (0.0%) | 0 (0.0%) |
| 18 to 34 Years | 0 (0.0%) | 0 (0.0%) |
| 35 to 64 Years | 34 (27.9%) | 27 (9.4%) |
| 65 to 74 Years | 43 (48.3%) | 0 (0.0%) |
| 75 Years and over | 34 (100.0%) | 21 (30.9%) |
Disability Class: Self-Care Difficulty
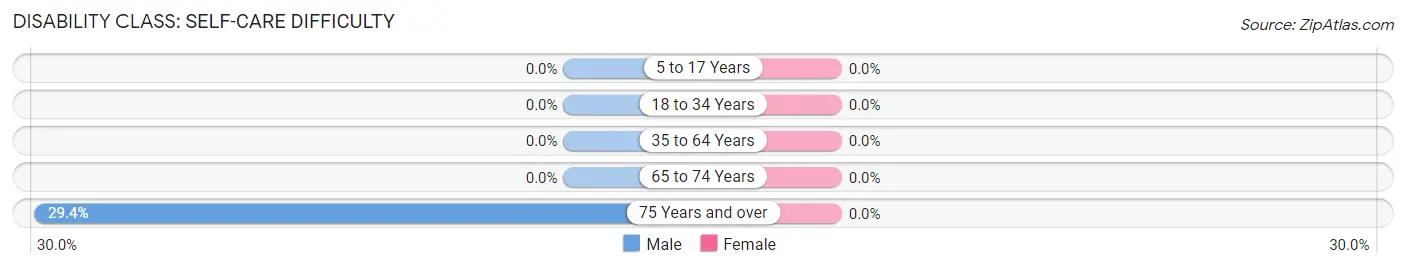
| Age Bracket | Male | Female |
| 5 to 17 Years | 0 (0.0%) | 0 (0.0%) |
| 18 to 34 Years | 0 (0.0%) | 0 (0.0%) |
| 35 to 64 Years | 0 (0.0%) | 0 (0.0%) |
| 65 to 74 Years | 0 (0.0%) | 0 (0.0%) |
| 75 Years and over | 10 (29.4%) | 0 (0.0%) |
Technology Access in Stella
Computing Device Access in Stella
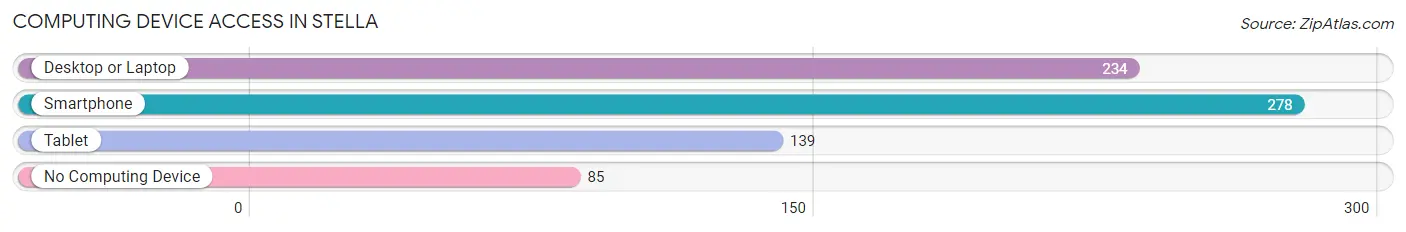
| Device Type | # Households | % Households |
| Desktop or Laptop | 234 | 60.0% |
| Smartphone | 278 | 71.3% |
| Tablet | 139 | 35.6% |
| No Computing Device | 85 | 21.8% |
| Total | 390 | 100.0% |
Internet Access in Stella
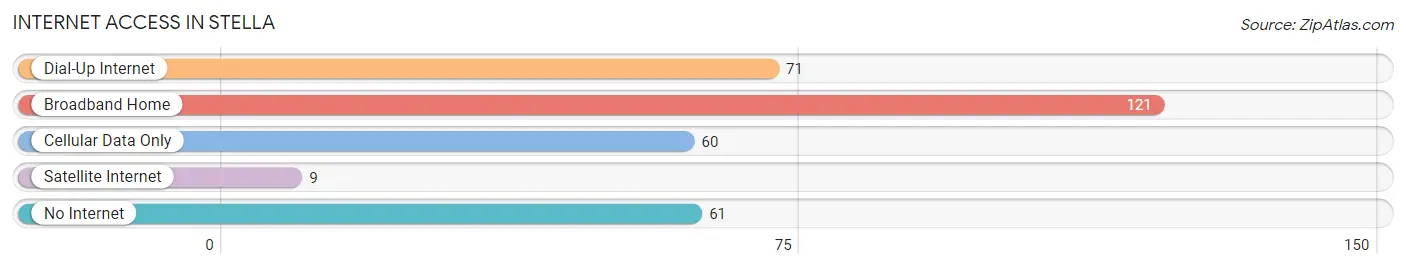
| Internet Type | # Households | % Households |
| Dial-Up Internet | 71 | 18.2% |
| Broadband Home | 121 | 31.0% |
| Cellular Data Only | 60 | 15.4% |
| Satellite Internet | 9 | 2.3% |
| No Internet | 61 | 15.6% |
| Total | 390 | 100.0% |
Stella Summary
Puerto Rico is an unincorporated territory of the United States located in the northeastern Caribbean Sea. It is an archipelago that includes the main island of Puerto Rico and several smaller islands, such as Vieques, Culebra, and Mona. The total land area of Puerto Rico is 3,515 square miles, making it the third-largest island in the Caribbean. Puerto Rico is home to a population of approximately 3.2 million people, making it the second-most populous island in the Caribbean after Cuba.
History
Puerto Rico has a long and rich history that dates back to the early 16th century. The island was first inhabited by the Taíno people, who were later displaced by Spanish settlers in the late 15th century. The Spanish established a colony on the island and named it Puerto Rico, which translates to “rich port.” The island was a Spanish colony for nearly four centuries, until it was ceded to the United States in 1898 following the Spanish-American War.
Since then, Puerto Rico has been an unincorporated territory of the United States. In 1917, the Jones-Shafroth Act granted U.S. citizenship to all Puerto Ricans. In 1952, Puerto Rico adopted its own constitution and became an autonomous commonwealth of the United States.
Geography
Puerto Rico is located in the northeastern Caribbean Sea, about 1,000 miles southeast of Miami, Florida. The main island of Puerto Rico is surrounded by several smaller islands, including Vieques, Culebra, and Mona. The total land area of Puerto Rico is 3,515 square miles, making it the third-largest island in the Caribbean.
The terrain of Puerto Rico is mostly mountainous, with the highest point being Cerro de Punta at 4,390 feet. The island is also home to several rivers, including the Rio Grande de Loíza, the Rio de la Plata, and the Rio Grande de Manatí.
Economy
Puerto Rico’s economy is largely based on tourism, manufacturing, and services. The island is home to several large companies, including pharmaceutical giant Pfizer and rum producer Bacardi. Tourism is also a major contributor to the economy, with millions of visitors coming to the island each year to enjoy its beaches, culture, and history.
The government of Puerto Rico is responsible for providing public services, such as education, healthcare, and infrastructure. The government also provides tax incentives to businesses that invest in the island.
Demographics
Puerto Rico is home to a population of approximately 3.2 million people, making it the second-most populous island in the Caribbean after Cuba. The majority of the population is of Hispanic or Latino descent, with the largest ethnic group being Puerto Ricans. Other ethnic groups include African, European, and Asian.
The official language of Puerto Rico is Spanish, although English is also widely spoken. The majority of the population is Roman Catholic, although there are also smaller populations of Protestants, Jews, and Muslims.
Common Questions
What is Per Capita Income in Stella?
Per Capita income in Stella is $15,522.
What is the Median Family Income in Stella?
Median Family Income in Stella is $31,820.
What is the Median Household income in Stella?
Median Household Income in Stella is $32,456.
What is Income or Wage Gap in Stella?
Income or Wage Gap in Stella is 9.4%.
Women in Stella earn 90.6 cents for every dollar earned by a man.
What is Inequality or Gini Index in Stella?
Inequality or Gini Index in Stella is 0.35.
What is the Total Population of Stella?
Total Population of Stella is 1,130.
What is the Total Male Population of Stella?
Total Male Population of Stella is 443.
What is the Total Female Population of Stella?
Total Female Population of Stella is 687.
What is the Ratio of Males per 100 Females in Stella?
There are 64.48 Males per 100 Females in Stella.
What is the Ratio of Females per 100 Males in Stella?
There are 155.08 Females per 100 Males in Stella.
What is the Median Population Age in Stella?
Median Population Age in Stella is 47.4 Years.
What is the Average Family Size in Stella
Average Family Size in Stella is 3.3 People.
What is the Average Household Size in Stella
Average Household Size in Stella is 2.9 People.
How Large is the Labor Force in Stella?
There are 445 People in the Labor Forcein in Stella.
What is the Percentage of People in the Labor Force in Stella?
45.2% of People are in the Labor Force in Stella.