Los Prados, PR Map & Demographics
Los Prados Map
Los Prados Overview
$44,984
PER CAPITA INCOME
$111,630
AVG FAMILY INCOME
$104,502
AVG HOUSEHOLD INCOME
26.9%
WAGE / INCOME GAP [ % ]
73.1¢/ $1
WAGE / INCOME GAP [ $ ]
0.39
INEQUALITY / GINI INDEX
3,185
TOTAL POPULATION
1,300
MALE POPULATION
1,885
FEMALE POPULATION
68.97
MALES / 100 FEMALES
145.00
FEMALES / 100 MALES
43.0
MEDIAN AGE
3.6
AVG FAMILY SIZE
3.0
AVG HOUSEHOLD SIZE
1,792
LABOR FORCE [ PEOPLE ]
68.2%
PERCENT IN LABOR FORCE
3.6%
UNEMPLOYMENT RATE
Income in Los Prados
Income Overview in Los Prados
Per Capita Income in Los Prados is $44,984, while median incomes of families and households are $111,630 and $104,502 respectively.
| Characteristic | Number | Measure |
| Per Capita Income | 3,185 | $44,984 |
| Median Family Income | 776 | $111,630 |
| Mean Family Income | 776 | $153,863 |
| Median Household Income | 1,047 | $104,502 |
| Mean Household Income | 1,047 | $130,759 |
| Income Deficit | 776 | $0 |
| Wage / Income Gap (%) | 3,185 | 26.86% |
| Wage / Income Gap ($) | 3,185 | 73.14¢ per $1 |
| Gini / Inequality Index | 3,185 | 0.39 |
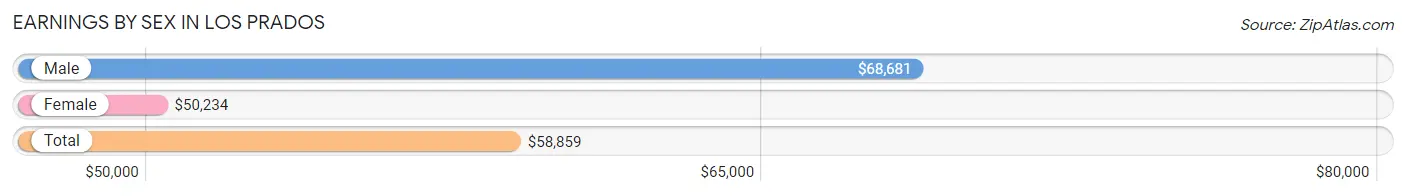
Earnings by Sex in Los Prados
Average Earnings in Los Prados are $58,859, $68,681 for men and $50,234 for women, a difference of 26.9%.
| Sex | Number | Average Earnings |
| Male | 944 (51.7%) | $68,681 |
| Female | 881 (48.3%) | $50,234 |
| Total | 1,825 (100.0%) | $58,859 |
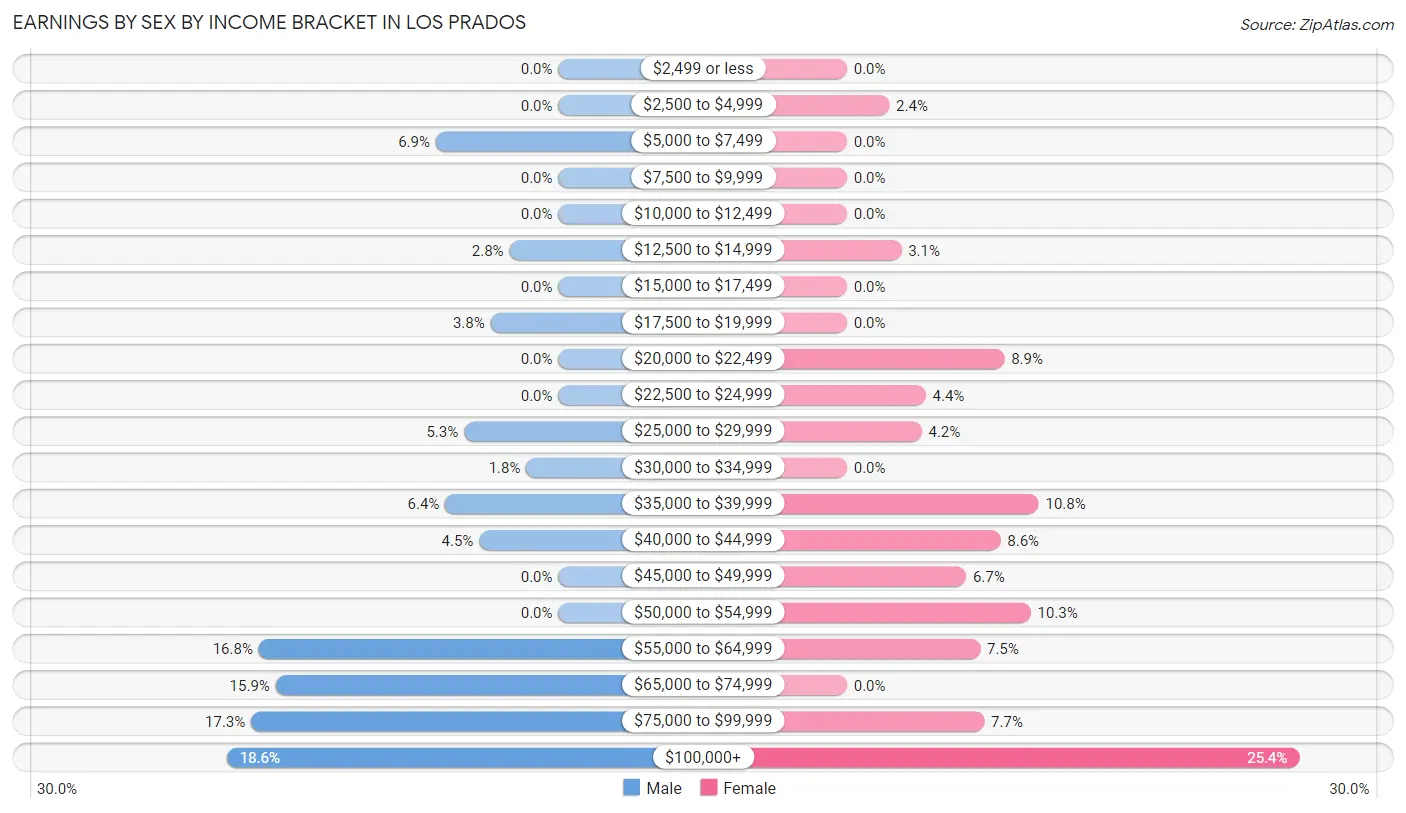
Earnings by Sex by Income Bracket in Los Prados
The most common earnings brackets in Los Prados are $100,000+ for men (176 | 18.6%) and $100,000+ for women (224 | 25.4%).
| Income | Male | Female |
| $2,499 or less | 0 (0.0%) | 0 (0.0%) |
| $2,500 to $4,999 | 0 (0.0%) | 21 (2.4%) |
| $5,000 to $7,499 | 65 (6.9%) | 0 (0.0%) |
| $7,500 to $9,999 | 0 (0.0%) | 0 (0.0%) |
| $10,000 to $12,499 | 0 (0.0%) | 0 (0.0%) |
| $12,500 to $14,999 | 26 (2.8%) | 27 (3.1%) |
| $15,000 to $17,499 | 0 (0.0%) | 0 (0.0%) |
| $17,500 to $19,999 | 36 (3.8%) | 0 (0.0%) |
| $20,000 to $22,499 | 0 (0.0%) | 78 (8.8%) |
| $22,500 to $24,999 | 0 (0.0%) | 39 (4.4%) |
| $25,000 to $29,999 | 50 (5.3%) | 37 (4.2%) |
| $30,000 to $34,999 | 17 (1.8%) | 0 (0.0%) |
| $35,000 to $39,999 | 60 (6.4%) | 95 (10.8%) |
| $40,000 to $44,999 | 42 (4.4%) | 76 (8.6%) |
| $45,000 to $49,999 | 0 (0.0%) | 59 (6.7%) |
| $50,000 to $54,999 | 0 (0.0%) | 91 (10.3%) |
| $55,000 to $64,999 | 159 (16.8%) | 66 (7.5%) |
| $65,000 to $74,999 | 150 (15.9%) | 0 (0.0%) |
| $75,000 to $99,999 | 163 (17.3%) | 68 (7.7%) |
| $100,000+ | 176 (18.6%) | 224 (25.4%) |
| Total | 944 (100.0%) | 881 (100.0%) |
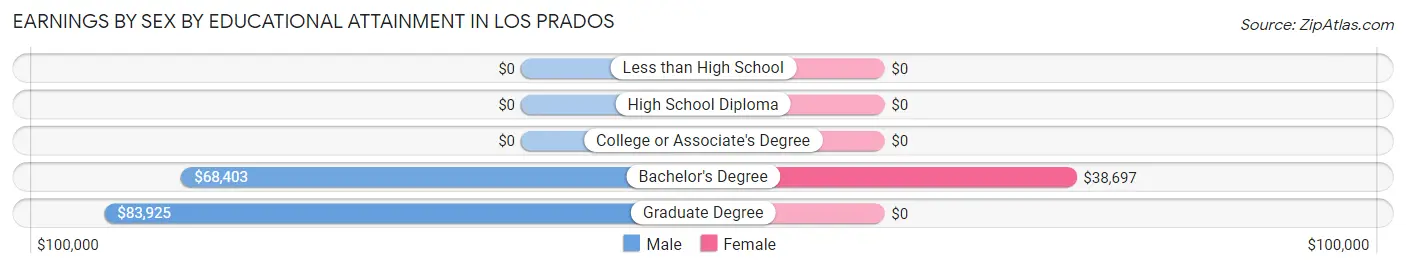
Earnings by Sex by Educational Attainment in Los Prados
Average earnings in Los Prados are $69,583 for men and $50,234 for women, a difference of 27.8%. Men with an educational attainment of graduate degree enjoy the highest average annual earnings of $83,925, while those with bachelor's degree education earn the least with $68,403. Women with an educational attainment of bachelor's degree earn the most with the average annual earnings of $38,697, while those with bachelor's degree education have the smallest earnings of $38,697.
| Educational Attainment | Male Income | Female Income |
| Less than High School | - | - |
| High School Diploma | - | - |
| College or Associate's Degree | - | - |
| Bachelor's Degree | $68,403 | $38,697 |
| Graduate Degree | $83,925 | $0 |
| Total | $69,583 | $50,234 |
Family Income in Los Prados
Family Income Brackets in Los Prados
According to the Los Prados family income data, there are 228 families falling into the $200,000+ income range, which is the most common income bracket and makes up 29.4% of all families.
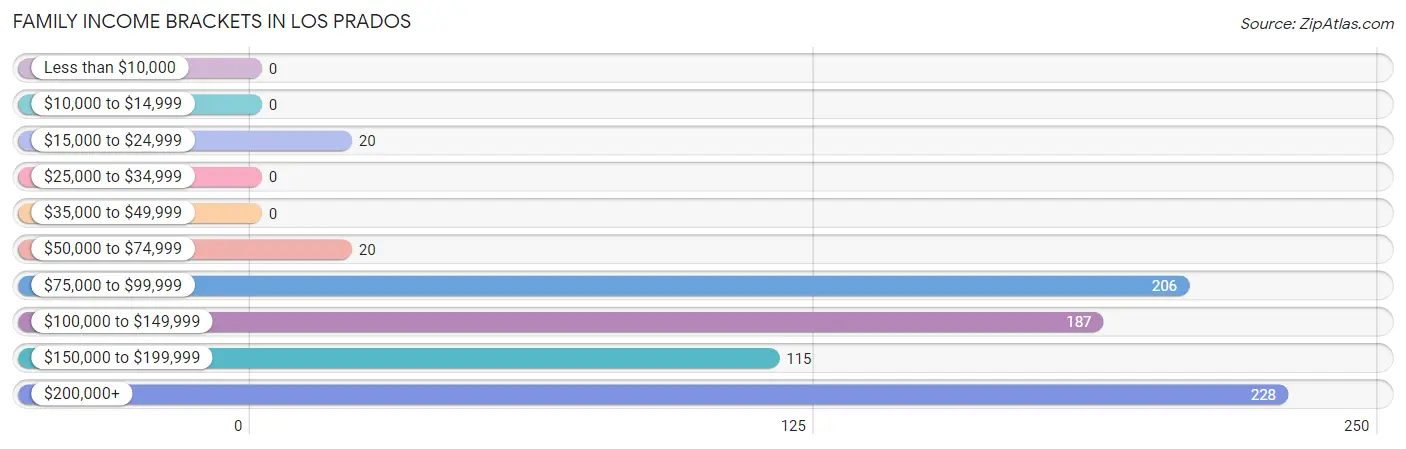
| Income Bracket | # Families | % Families |
| Less than $10,000 | 0 | 0.0% |
| $10,000 to $14,999 | 0 | 0.0% |
| $15,000 to $24,999 | 20 | 2.6% |
| $25,000 to $34,999 | 0 | 0.0% |
| $35,000 to $49,999 | 0 | 0.0% |
| $50,000 to $74,999 | 20 | 2.6% |
| $75,000 to $99,999 | 206 | 26.5% |
| $100,000 to $149,999 | 187 | 24.1% |
| $150,000 to $199,999 | 115 | 14.8% |
| $200,000+ | 228 | 29.4% |
Family Income by Famaliy Size in Los Prados
3-person families (247 | 31.8%) account for the highest median family income in Los Prados with $128,456 per family, while 3-person families (247 | 31.8%) have the highest median income of $42,819 per family member.
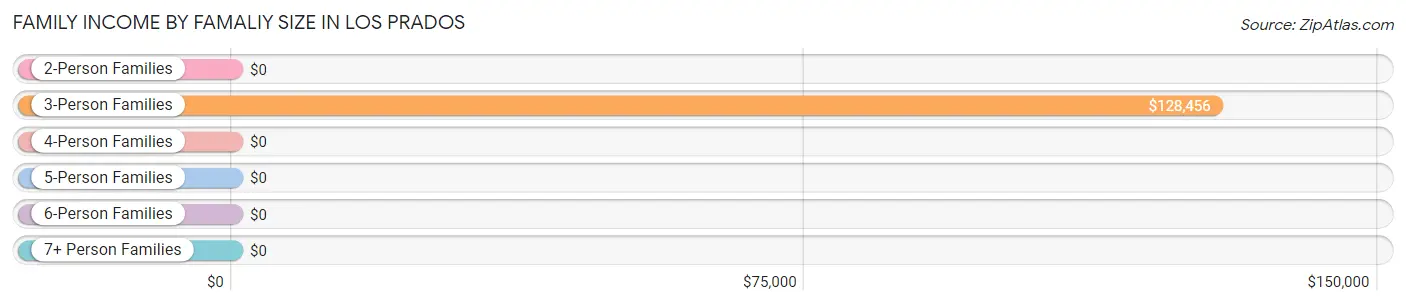
| Income Bracket | # Families | Median Income |
| 2-Person Families | 204 (26.3%) | $0 |
| 3-Person Families | 247 (31.8%) | $128,456 |
| 4-Person Families | 260 (33.5%) | $0 |
| 5-Person Families | 65 (8.4%) | $0 |
| 6-Person Families | 0 (0.0%) | $0 |
| 7+ Person Families | 0 (0.0%) | $0 |
| Total | 776 (100.0%) | $111,630 |
Family Income by Number of Earners in Los Prados
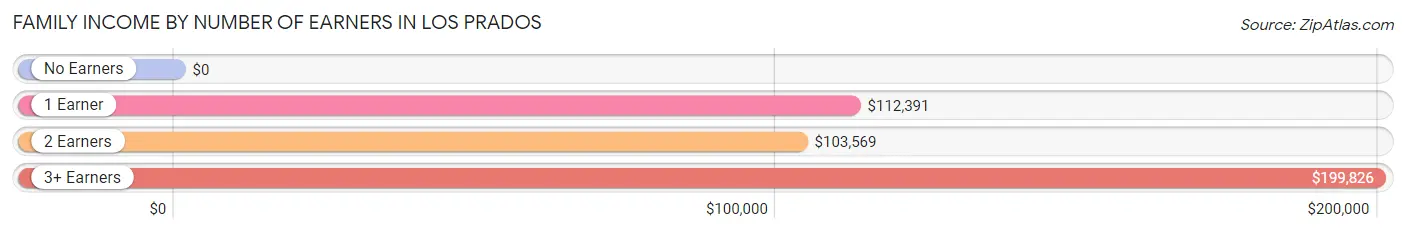
| Number of Earners | # Families | Median Income |
| No Earners | 20 (2.6%) | $0 |
| 1 Earner | 118 (15.2%) | $112,391 |
| 2 Earners | 497 (64.0%) | $103,569 |
| 3+ Earners | 141 (18.2%) | $199,826 |
| Total | 776 (100.0%) | $111,630 |
Household Income in Los Prados
Household Income Brackets in Los Prados
With 267 households falling in the category, the $100,000 to $149,999 income range is the most frequent in Los Prados, accounting for 25.5% of all households.
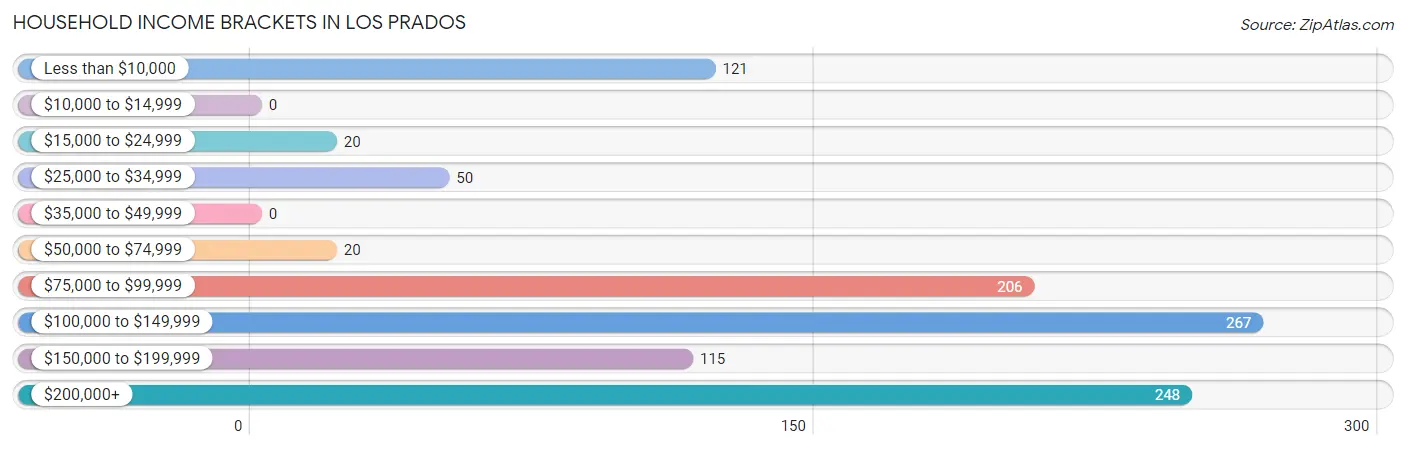
| Income Bracket | # Households | % Households |
| Less than $10,000 | 121 | 11.6% |
| $10,000 to $14,999 | 0 | 0.0% |
| $15,000 to $24,999 | 20 | 1.9% |
| $25,000 to $34,999 | 50 | 4.8% |
| $35,000 to $49,999 | 0 | 0.0% |
| $50,000 to $74,999 | 20 | 1.9% |
| $75,000 to $99,999 | 206 | 19.7% |
| $100,000 to $149,999 | 267 | 25.5% |
| $150,000 to $199,999 | 115 | 11.0% |
| $200,000+ | 248 | 23.7% |
Household Income by Householder Age in Los Prados
The median household income in Los Prados is $104,502, with the highest median household income of $133,750 found in the 45 to 64 years age bracket for the primary householder. A total of 651 households (62.2%) fall into this category.
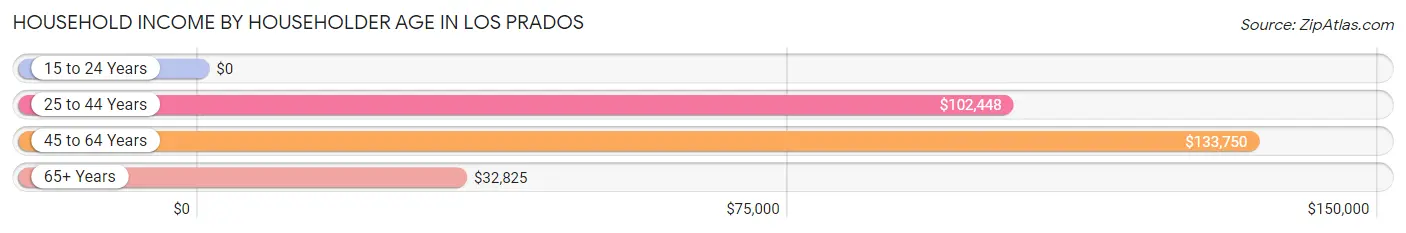
| Income Bracket | # Households | Median Income |
| 15 to 24 Years | 0 (0.0%) | $0 |
| 25 to 44 Years | 309 (29.5%) | $102,448 |
| 45 to 64 Years | 651 (62.2%) | $133,750 |
| 65+ Years | 87 (8.3%) | $32,825 |
| Total | 1,047 (100.0%) | $104,502 |
Poverty in Los Prados
Income Below Poverty by Sex and Age in Los Prados
With 3.9% poverty level for males and 9.6% for females among the residents of Los Prados, 65 to 74 year old males and 25 to 34 year old females are the most vulnerable to poverty, with 17 males (46.0%) and 123 females (38.4%) in their respective age groups living below the poverty level.
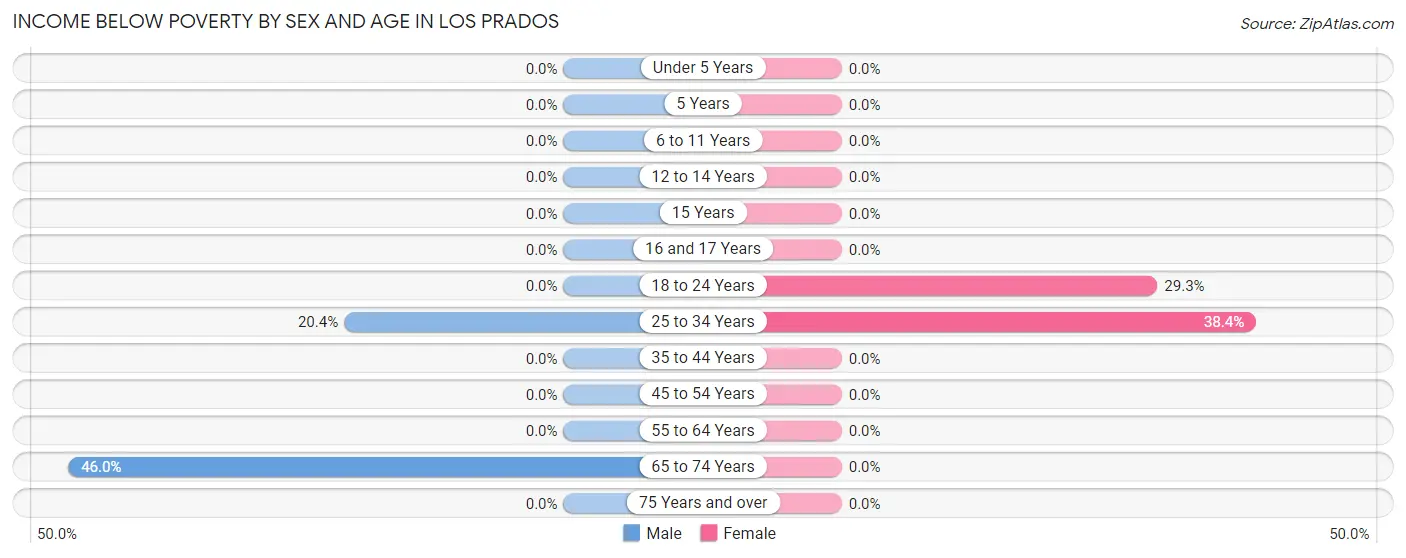
| Age Bracket | Male | Female |
| Under 5 Years | 0 (0.0%) | 0 (0.0%) |
| 5 Years | 0 (0.0%) | 0 (0.0%) |
| 6 to 11 Years | 0 (0.0%) | 0 (0.0%) |
| 12 to 14 Years | 0 (0.0%) | 0 (0.0%) |
| 15 Years | 0 (0.0%) | 0 (0.0%) |
| 16 and 17 Years | 0 (0.0%) | 0 (0.0%) |
| 18 to 24 Years | 0 (0.0%) | 58 (29.3%) |
| 25 to 34 Years | 34 (20.4%) | 123 (38.4%) |
| 35 to 44 Years | 0 (0.0%) | 0 (0.0%) |
| 45 to 54 Years | 0 (0.0%) | 0 (0.0%) |
| 55 to 64 Years | 0 (0.0%) | 0 (0.0%) |
| 65 to 74 Years | 17 (46.0%) | 0 (0.0%) |
| 75 Years and over | 0 (0.0%) | 0 (0.0%) |
| Total | 51 (3.9%) | 181 (9.6%) |
Income Above Poverty by Sex and Age in Los Prados
According to the poverty statistics in Los Prados, males aged 6 to 11 years and females aged under 5 years are the age groups that are most secure financially, with 100.0% of males and 100.0% of females in these age groups living above the poverty line.
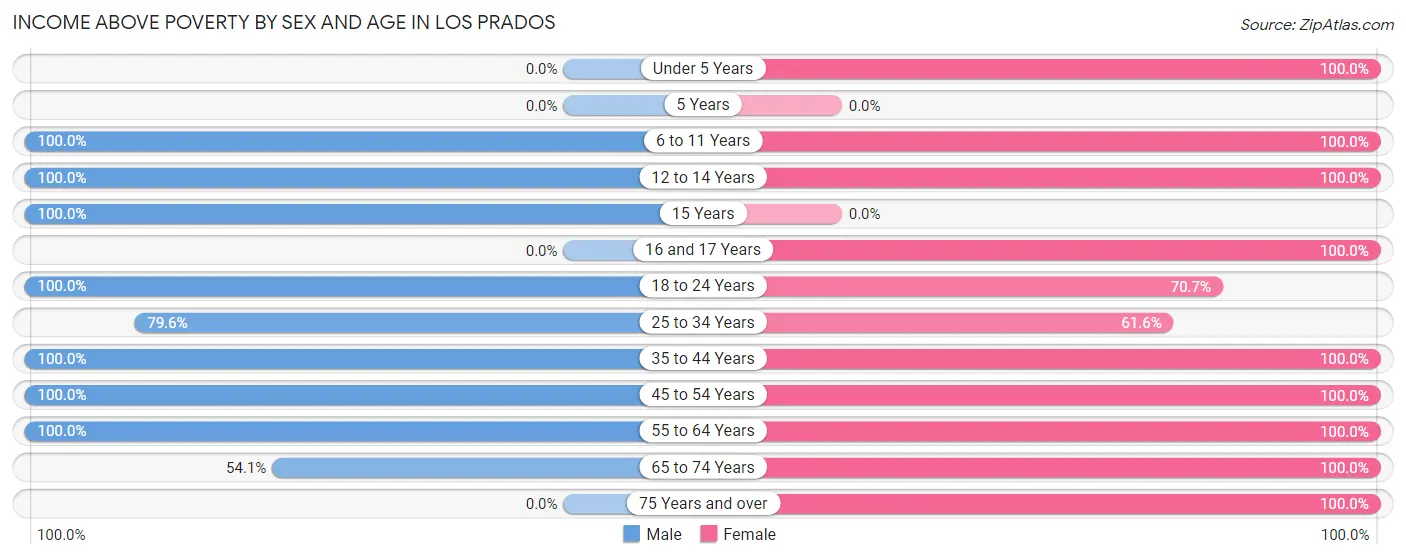
| Age Bracket | Male | Female |
| Under 5 Years | 0 (0.0%) | 25 (100.0%) |
| 5 Years | 0 (0.0%) | 0 (0.0%) |
| 6 to 11 Years | 131 (100.0%) | 240 (100.0%) |
| 12 to 14 Years | 24 (100.0%) | 108 (100.0%) |
| 15 Years | 29 (100.0%) | 0 (0.0%) |
| 16 and 17 Years | 0 (0.0%) | 80 (100.0%) |
| 18 to 24 Years | 51 (100.0%) | 140 (70.7%) |
| 25 to 34 Years | 133 (79.6%) | 197 (61.6%) |
| 35 to 44 Years | 257 (100.0%) | 307 (100.0%) |
| 45 to 54 Years | 347 (100.0%) | 291 (100.0%) |
| 55 to 64 Years | 257 (100.0%) | 220 (100.0%) |
| 65 to 74 Years | 20 (54.0%) | 21 (100.0%) |
| 75 Years and over | 0 (0.0%) | 75 (100.0%) |
| Total | 1,249 (96.1%) | 1,704 (90.4%) |
Income Below Poverty Among Married-Couple Families in Los Prados
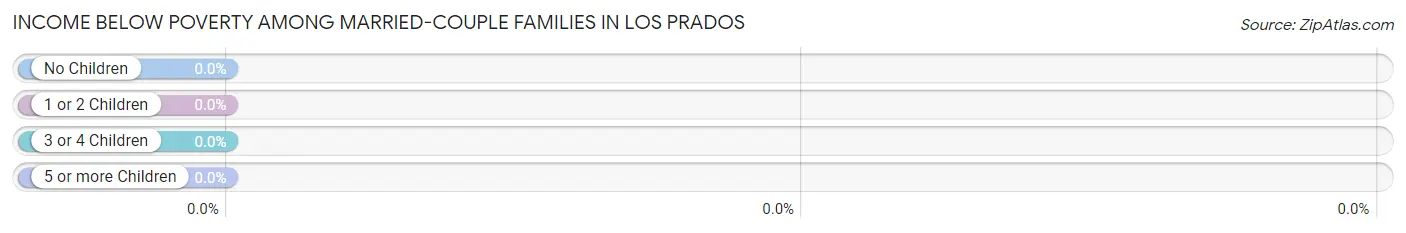
| Children | Above Poverty | Below Poverty |
| No Children | 360 (100.0%) | 0 (0.0%) |
| 1 or 2 Children | 354 (100.0%) | 0 (0.0%) |
| 3 or 4 Children | 45 (100.0%) | 0 (0.0%) |
| 5 or more Children | 0 (0.0%) | 0 (0.0%) |
| Total | 759 (100.0%) | 0 (0.0%) |
Income Below Poverty Among Single-Parent Households in Los Prados
| Children | Single Father | Single Mother |
| No Children | 0 (0.0%) | 0 (0.0%) |
| 1 or 2 Children | 0 (0.0%) | 0 (0.0%) |
| 3 or 4 Children | 0 (0.0%) | 0 (0.0%) |
| 5 or more Children | 0 (0.0%) | 0 (0.0%) |
| Total | 0 (0.0%) | 0 (0.0%) |
Income Below Poverty Among Married-Couple vs Single-Parent Households in Los Prados
| Children | Married-Couple Families | Single-Parent Households |
| No Children | 0 (0.0%) | 0 (0.0%) |
| 1 or 2 Children | 0 (0.0%) | 0 (0.0%) |
| 3 or 4 Children | 0 (0.0%) | 0 (0.0%) |
| 5 or more Children | 0 (0.0%) | 0 (0.0%) |
| Total | 0 (0.0%) | 0 (0.0%) |
Race in Los Prados
The most populous races in Los Prados are Hispanic or Latino (3,003 | 94.3%), White / Caucasian (1,435 | 45.1%), and Two or more Races (1,011 | 31.7%).
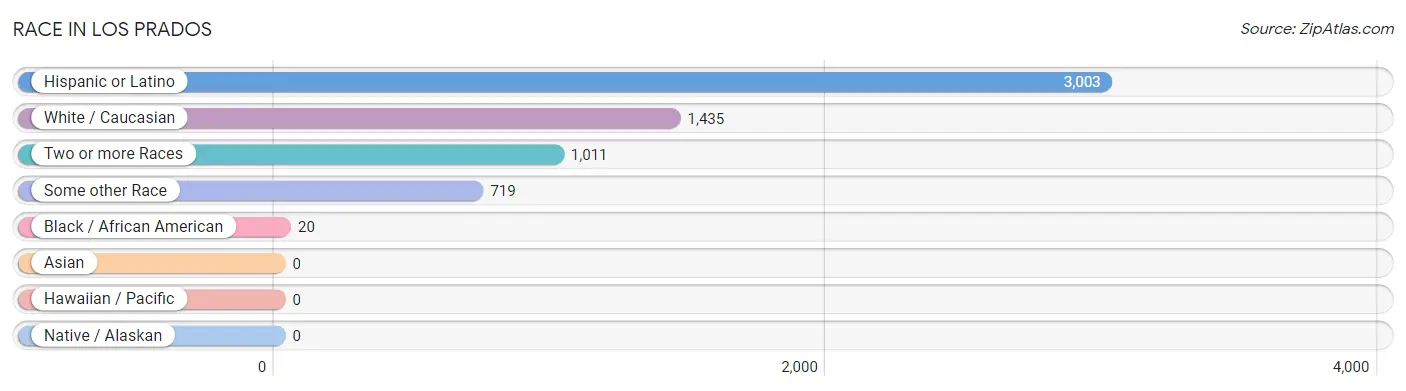
| Race | # Population | % Population |
| Asian | 0 | 0.0% |
| Black / African American | 20 | 0.6% |
| Hawaiian / Pacific | 0 | 0.0% |
| Hispanic or Latino | 3,003 | 94.3% |
| Native / Alaskan | 0 | 0.0% |
| White / Caucasian | 1,435 | 45.1% |
| Two or more Races | 1,011 | 31.7% |
| Some other Race | 719 | 22.6% |
| Total | 3,185 | 100.0% |
Ancestry in Los Prados
The most populous ancestries reported in Los Prados are Puerto Rican (2,484 | 78.0%), South American (385 | 12.1%), Venezuelan (185 | 5.8%), Colombian (146 | 4.6%), and Central American Indian (104 | 3.3%), together accounting for 103.7% of all Los Prados residents.
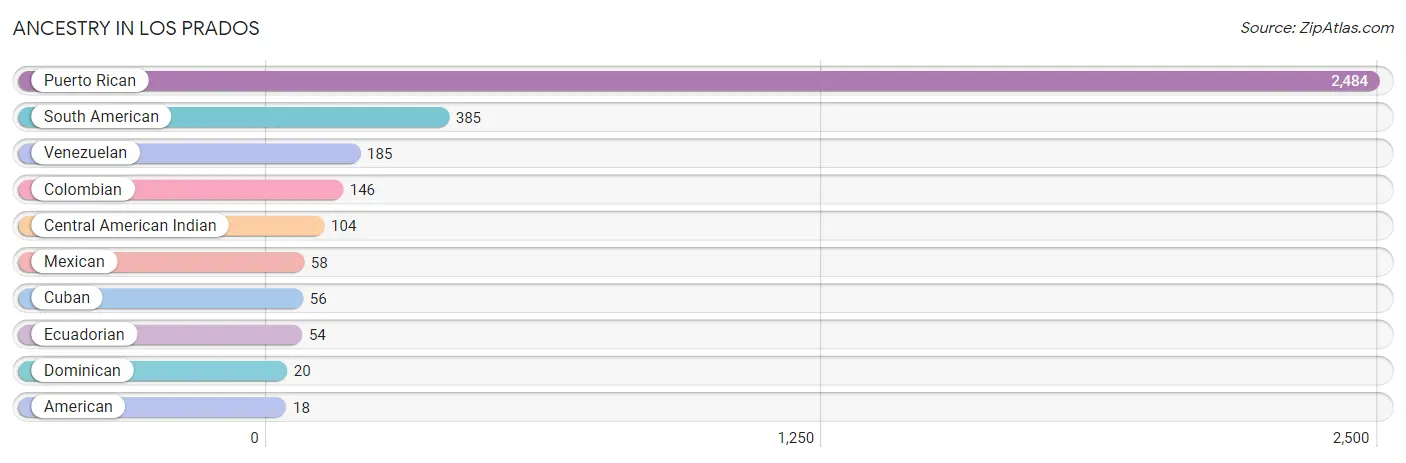
| Ancestry | # Population | % Population |
| American | 18 | 0.6% |
| Central American Indian | 104 | 3.3% |
| Colombian | 146 | 4.6% |
| Cuban | 56 | 1.8% |
| Dominican | 20 | 0.6% |
| Ecuadorian | 54 | 1.7% |
| Mexican | 58 | 1.8% |
| Puerto Rican | 2,484 | 78.0% |
| South American | 385 | 12.1% |
| Venezuelan | 185 | 5.8% | View All 10 Rows |
Immigrants in Los Prados

| Immigration Origin | # Population | % Population | View All 0 Rows |
Sex and Age in Los Prados
Sex and Age in Los Prados
The most populous age groups in Los Prados are 50 to 54 Years (251 | 19.3%) for men and 40 to 44 Years (259 | 13.7%) for women.
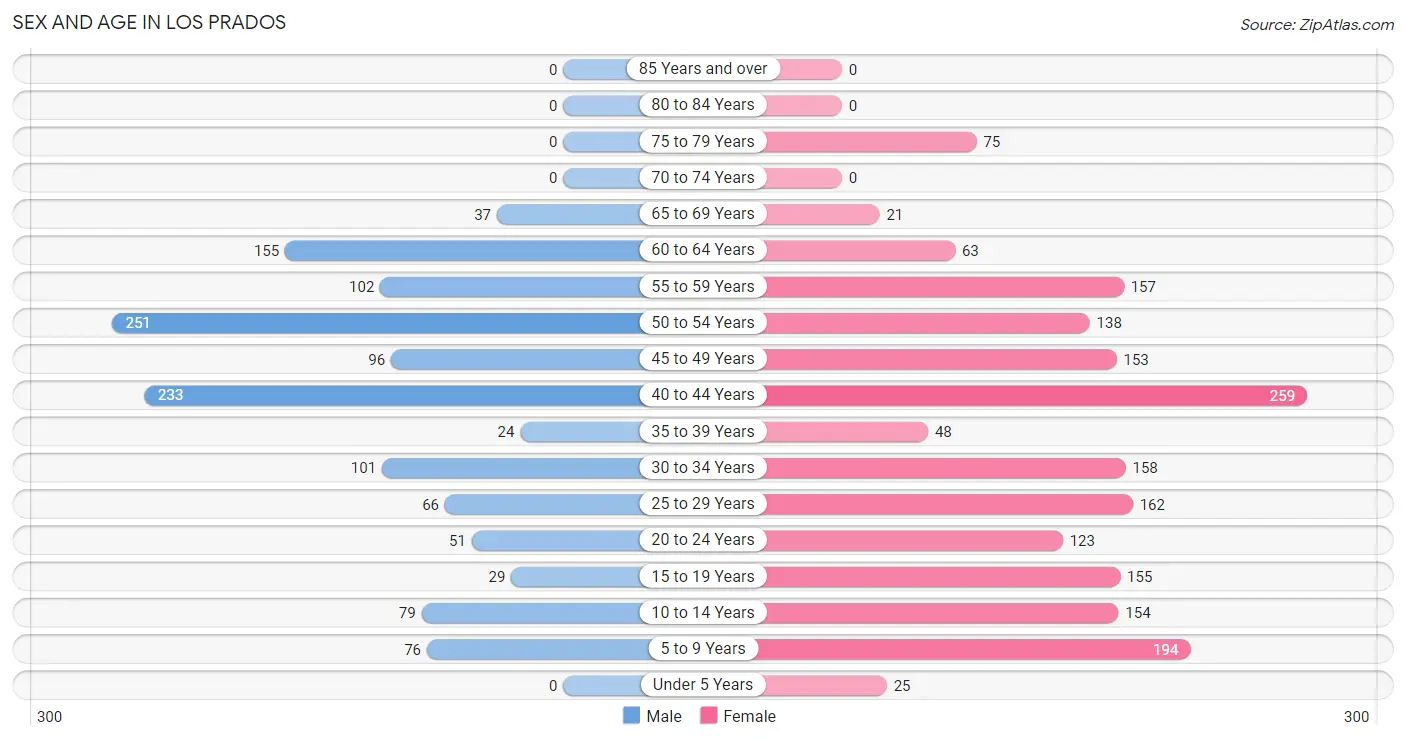
| Age Bracket | Male | Female |
| Under 5 Years | 0 (0.0%) | 25 (1.3%) |
| 5 to 9 Years | 76 (5.9%) | 194 (10.3%) |
| 10 to 14 Years | 79 (6.1%) | 154 (8.2%) |
| 15 to 19 Years | 29 (2.2%) | 155 (8.2%) |
| 20 to 24 Years | 51 (3.9%) | 123 (6.5%) |
| 25 to 29 Years | 66 (5.1%) | 162 (8.6%) |
| 30 to 34 Years | 101 (7.8%) | 158 (8.4%) |
| 35 to 39 Years | 24 (1.8%) | 48 (2.5%) |
| 40 to 44 Years | 233 (17.9%) | 259 (13.7%) |
| 45 to 49 Years | 96 (7.4%) | 153 (8.1%) |
| 50 to 54 Years | 251 (19.3%) | 138 (7.3%) |
| 55 to 59 Years | 102 (7.9%) | 157 (8.3%) |
| 60 to 64 Years | 155 (11.9%) | 63 (3.3%) |
| 65 to 69 Years | 37 (2.9%) | 21 (1.1%) |
| 70 to 74 Years | 0 (0.0%) | 0 (0.0%) |
| 75 to 79 Years | 0 (0.0%) | 75 (4.0%) |
| 80 to 84 Years | 0 (0.0%) | 0 (0.0%) |
| 85 Years and over | 0 (0.0%) | 0 (0.0%) |
| Total | 1,300 (100.0%) | 1,885 (100.0%) |
Families and Households in Los Prados
Median Family Size in Los Prados
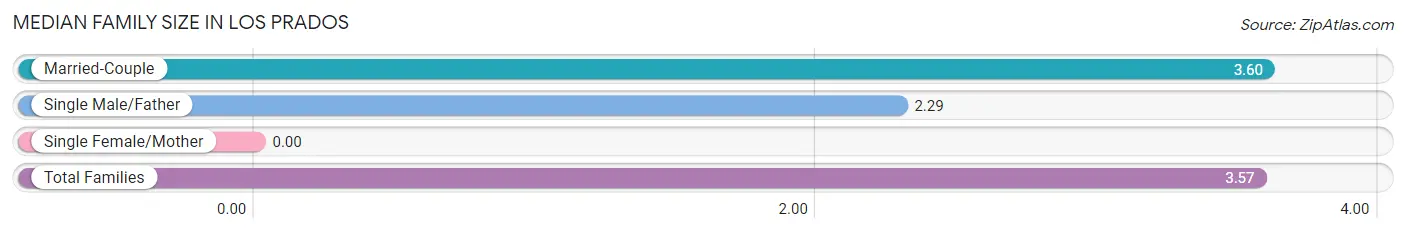
| Family Type | # Families | Family Size |
| Married-Couple | 759 (97.8%) | 3.60 |
| Single Male/Father | 17 (2.2%) | 2.29 |
| Single Female/Mother | 0 (0.0%) | - |
| Total Families | 776 (100.0%) | 3.57 |
Median Household Size in Los Prados
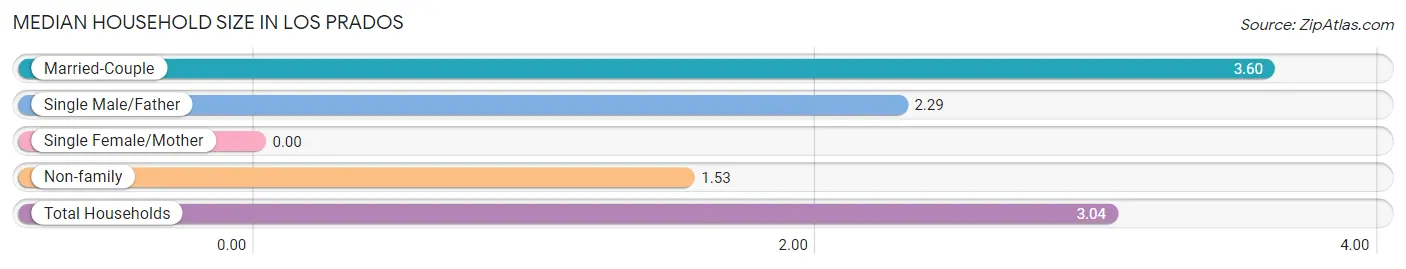
| Household Type | # Households | Household Size |
| Married-Couple | 759 (72.5%) | 3.60 |
| Single Male/Father | 17 (1.6%) | 2.29 |
| Single Female/Mother | 0 (0.0%) | - |
| Non-family | 271 (25.9%) | 1.53 |
| Total Households | 1,047 (100.0%) | 3.04 |
Household Size by Marriage Status in Los Prados
Out of a total of 1,047 households in Los Prados, 776 (74.1%) are family households, while 271 (25.9%) are nonfamily households. The most numerous type of family households are 4-person households, comprising 260, and the most common type of nonfamily households are 2-person households, comprising 137.
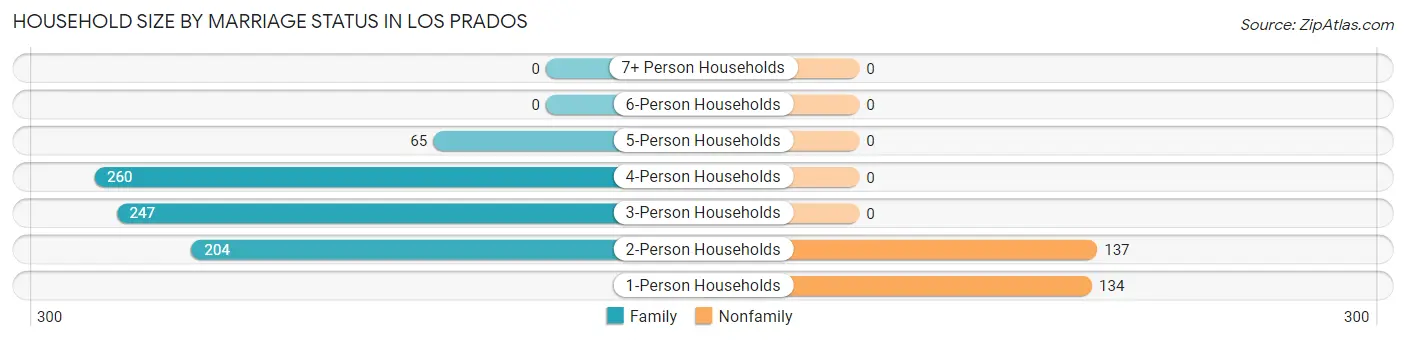
| Household Size | Family Households | Nonfamily Households |
| 1-Person Households | - | 134 (12.8%) |
| 2-Person Households | 204 (19.5%) | 137 (13.1%) |
| 3-Person Households | 247 (23.6%) | 0 (0.0%) |
| 4-Person Households | 260 (24.8%) | 0 (0.0%) |
| 5-Person Households | 65 (6.2%) | 0 (0.0%) |
| 6-Person Households | 0 (0.0%) | 0 (0.0%) |
| 7+ Person Households | 0 (0.0%) | 0 (0.0%) |
| Total | 776 (74.1%) | 271 (25.9%) |
Female Fertility in Los Prados
Fertility by Age in Los Prados
| Age Bracket | Women with Births | Births / 1,000 Women |
| 15 to 19 years | 0 (0.0%) | 0.0 |
| 20 to 34 years | 0 (0.0%) | 0.0 |
| 35 to 50 years | 0 (0.0%) | 0.0 |
| Total | 0 (0.0%) | 0.0 |
Fertility by Age by Marriage Status in Los Prados
| Age Bracket | Married | Unmarried |
| 15 to 19 years | 0 (0.0%) | 0 (0.0%) |
| 20 to 34 years | 0 (0.0%) | 0 (0.0%) |
| 35 to 50 years | 0 (0.0%) | 0 (0.0%) |
| Total | 0 (0.0%) | 0 (0.0%) |
Fertility by Education in Los Prados
| Educational Attainment | Women with Births | Births / 1,000 Women |
| Less than High School | 0 (0.0%) | 0.0 |
| High School Diploma | 0 (0.0%) | 0.0 |
| College or Associate's Degree | 0 (0.0%) | 0.0 |
| Bachelor's Degree | 0 (0.0%) | 0.0 |
| Graduate Degree | 0 (0.0%) | 0.0 |
| Total | 0 (0.0%) | 0.0 |
Fertility by Education by Marriage Status in Los Prados
| Educational Attainment | Married | Unmarried |
| Less than High School | 0 (0.0%) | 0 (0.0%) |
| High School Diploma | 0 (0.0%) | 0 (0.0%) |
| College or Associate's Degree | 0 (0.0%) | 0 (0.0%) |
| Bachelor's Degree | 0 (0.0%) | 0 (0.0%) |
| Graduate Degree | 0 (0.0%) | 0 (0.0%) |
| Total | 0 (0.0%) | 0 (0.0%) |
Employment Characteristics in Los Prados
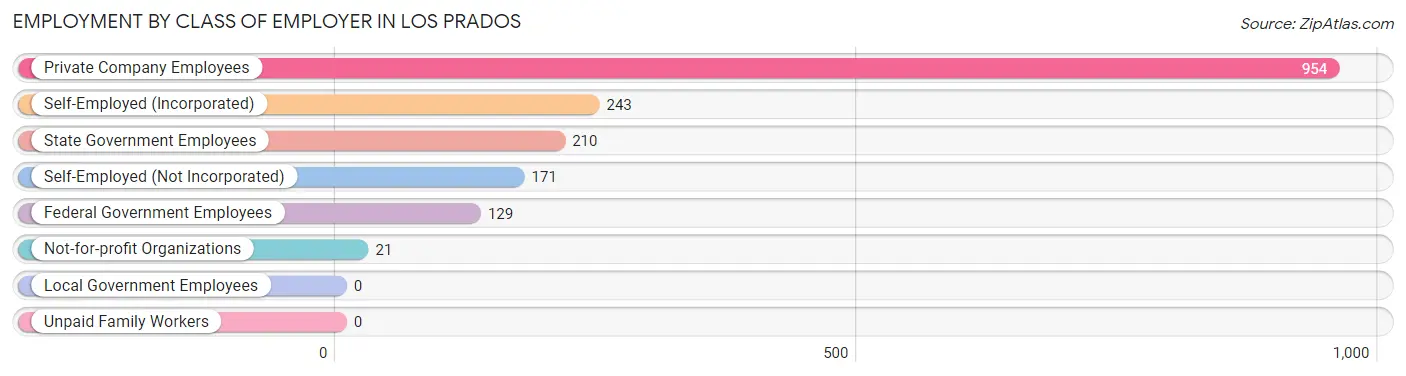
Employment by Class of Employer in Los Prados
Among the 1,728 employed individuals in Los Prados, private company employees (954 | 55.2%), self-employed (incorporated) (243 | 14.1%), and state government employees (210 | 12.1%) make up the most common classes of employment.
| Employer Class | # Employees | % Employees |
| Private Company Employees | 954 | 55.2% |
| Self-Employed (Incorporated) | 243 | 14.1% |
| Self-Employed (Not Incorporated) | 171 | 9.9% |
| Not-for-profit Organizations | 21 | 1.2% |
| Local Government Employees | 0 | 0.0% |
| State Government Employees | 210 | 12.1% |
| Federal Government Employees | 129 | 7.5% |
| Unpaid Family Workers | 0 | 0.0% |
| Total | 1,728 | 100.0% |
Employment Status by Age in Los Prados
According to the labor force statistics for Los Prados, out of the total population over 16 years of age (2,628), 68.2% or 1,792 individuals are in the labor force, with 3.6% or 65 of them unemployed. The age group with the highest labor force participation rate is 30 to 34 years, with 100.0% or 259 individuals in the labor force. Within the labor force, the 20 to 24 years age range has the highest percentage of unemployed individuals, with 71.4% or 65 of them being unemployed.
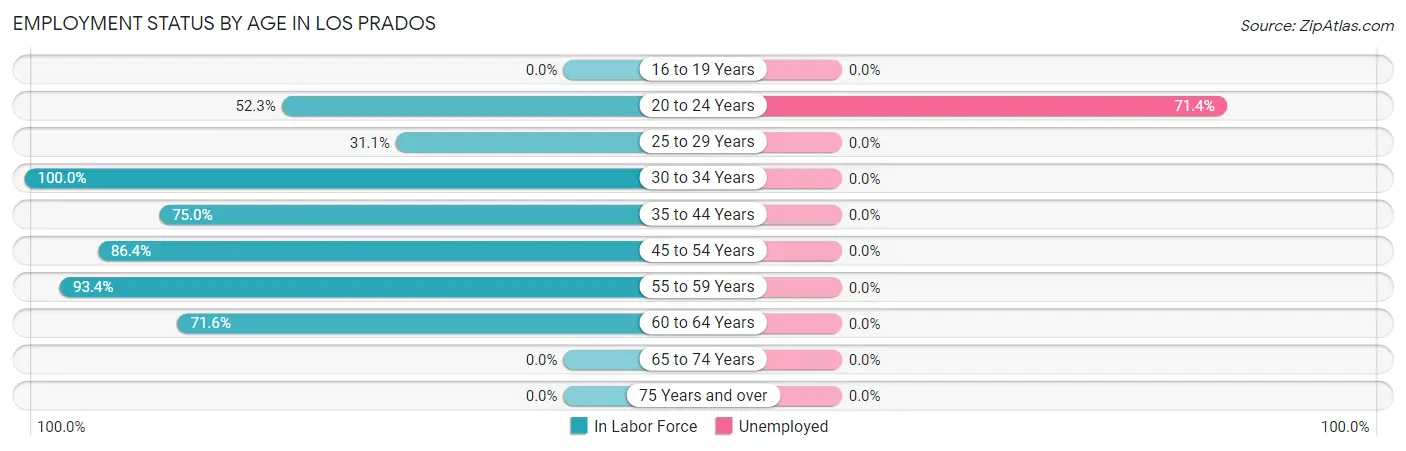
| Age Bracket | In Labor Force | Unemployed |
| 16 to 19 Years | 0 (0.0%) | 0 (0.0%) |
| 20 to 24 Years | 91 (52.3%) | 65 (71.4%) |
| 25 to 29 Years | 71 (31.1%) | 0 (0.0%) |
| 30 to 34 Years | 259 (100.0%) | 0 (0.0%) |
| 35 to 44 Years | 423 (75.0%) | 0 (0.0%) |
| 45 to 54 Years | 551 (86.4%) | 0 (0.0%) |
| 55 to 59 Years | 242 (93.4%) | 0 (0.0%) |
| 60 to 64 Years | 156 (71.6%) | 0 (0.0%) |
| 65 to 74 Years | 0 (0.0%) | 0 (0.0%) |
| 75 Years and over | 0 (0.0%) | 0 (0.0%) |
| Total | 1,792 (68.2%) | 65 (3.6%) |
Employment Status by Educational Attainment in Los Prados
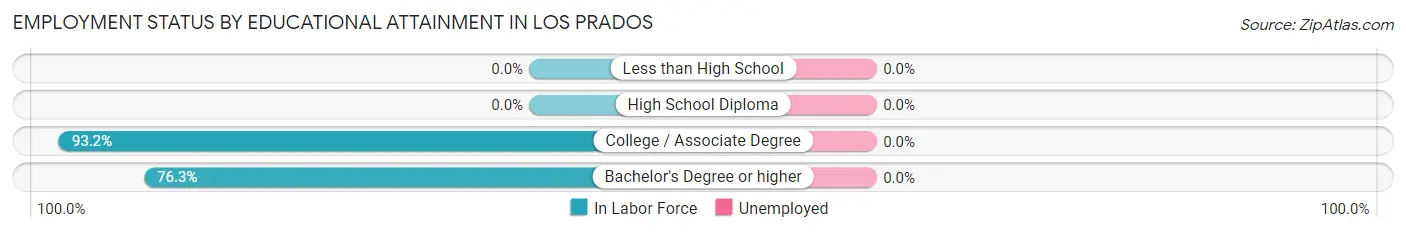
| Educational Attainment | In Labor Force | Unemployed |
| Less than High School | 0 (0.0%) | 0 (0.0%) |
| High School Diploma | 0 (0.0%) | 0 (0.0%) |
| College / Associate Degree | 272 (93.2%) | 0 (0.0%) |
| Bachelor's Degree or higher | 1,430 (76.3%) | 0 (0.0%) |
| Total | 1,702 (78.6%) | 0 (0.0%) |
Employment Occupations by Sex in Los Prados
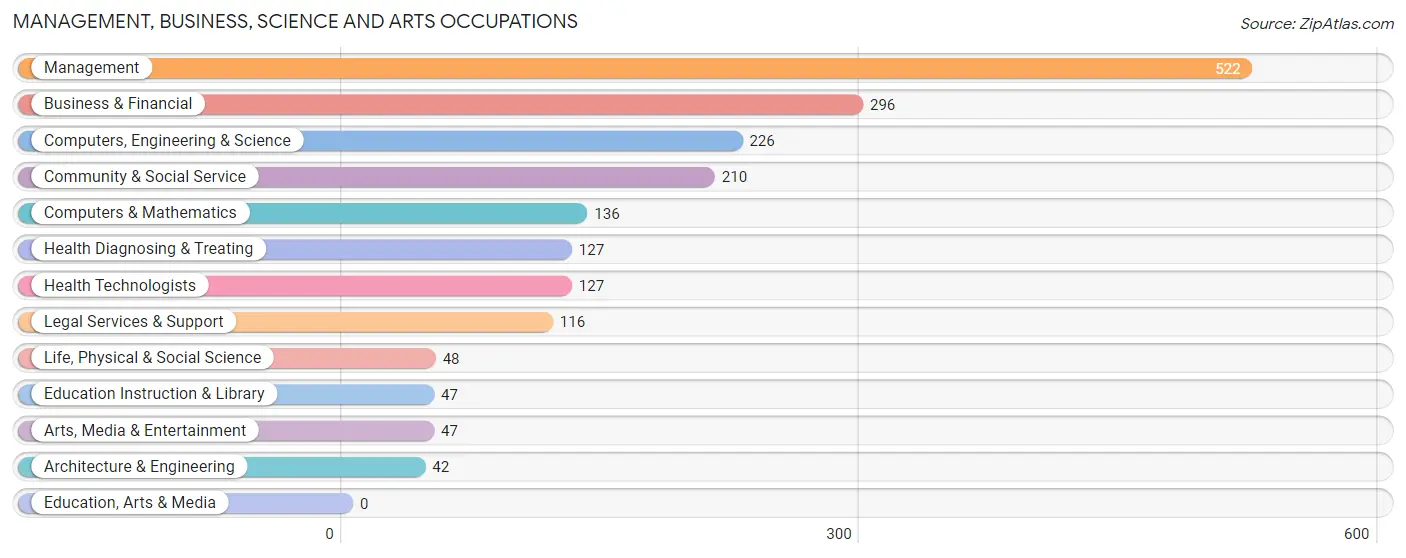
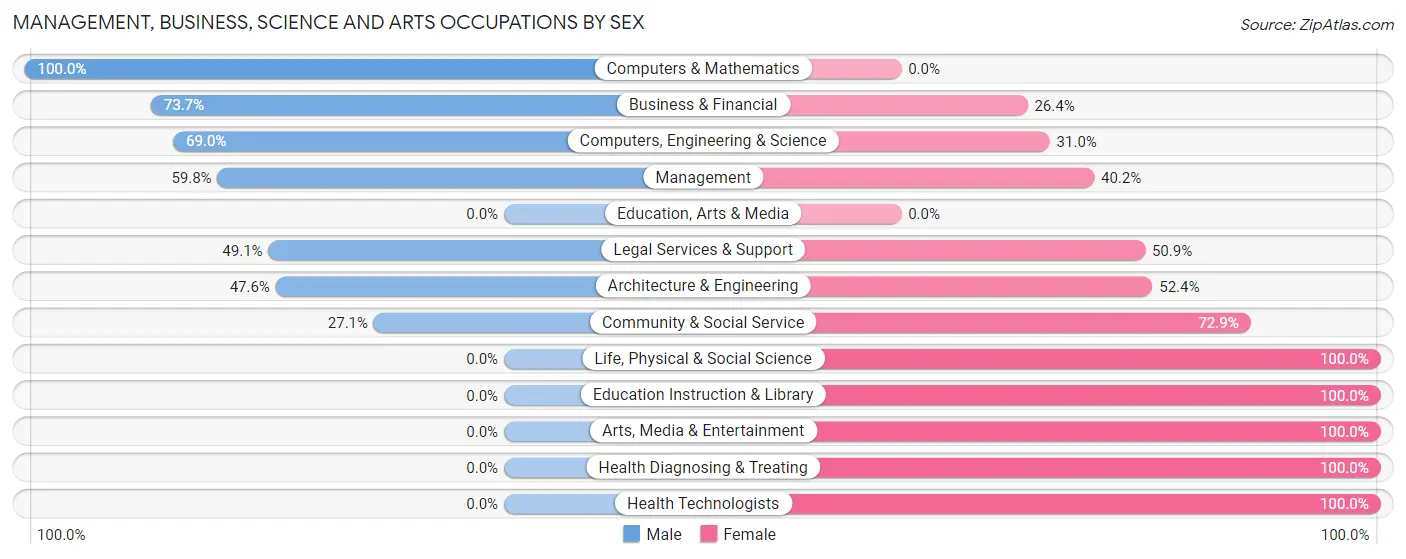
Management, Business, Science and Arts Occupations
The most common Management, Business, Science and Arts occupations in Los Prados are Management (522 | 30.2%), Business & Financial (296 | 17.1%), Computers, Engineering & Science (226 | 13.1%), Community & Social Service (210 | 12.1%), and Computers & Mathematics (136 | 7.9%).
Management, Business, Science and Arts Occupations by Sex
Within the Management, Business, Science and Arts occupations in Los Prados, the most male-oriented occupations are Computers & Mathematics (100.0%), Business & Financial (73.7%), and Computers, Engineering & Science (69.0%), while the most female-oriented occupations are Life, Physical & Social Science (100.0%), Education Instruction & Library (100.0%), and Arts, Media & Entertainment (100.0%).
| Occupation | Male | Female |
| Management | 312 (59.8%) | 210 (40.2%) |
| Business & Financial | 218 (73.7%) | 78 (26.4%) |
| Computers, Engineering & Science | 156 (69.0%) | 70 (31.0%) |
| Computers & Mathematics | 136 (100.0%) | 0 (0.0%) |
| Architecture & Engineering | 20 (47.6%) | 22 (52.4%) |
| Life, Physical & Social Science | 0 (0.0%) | 48 (100.0%) |
| Community & Social Service | 57 (27.1%) | 153 (72.9%) |
| Education, Arts & Media | 0 (0.0%) | 0 (0.0%) |
| Legal Services & Support | 57 (49.1%) | 59 (50.9%) |
| Education Instruction & Library | 0 (0.0%) | 47 (100.0%) |
| Arts, Media & Entertainment | 0 (0.0%) | 47 (100.0%) |
| Health Diagnosing & Treating | 0 (0.0%) | 127 (100.0%) |
| Health Technologists | 0 (0.0%) | 127 (100.0%) |
| Total (Category) | 743 (53.8%) | 638 (46.2%) |
| Total (Overall) | 944 (54.6%) | 784 (45.4%) |
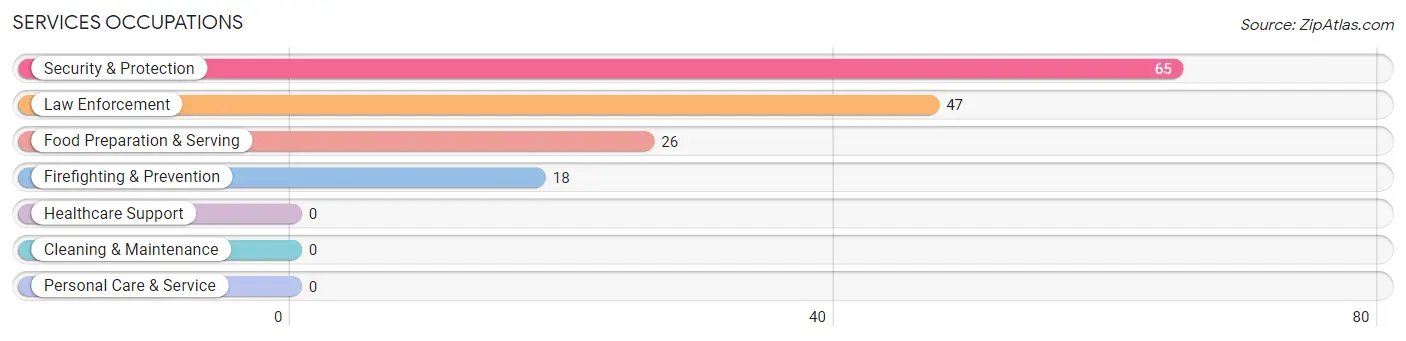
Services Occupations
The most common Services occupations in Los Prados are Security & Protection (65 | 3.8%), Law Enforcement (47 | 2.7%), Food Preparation & Serving (26 | 1.5%), and Firefighting & Prevention (18 | 1.0%).
Services Occupations by Sex
Within the Services occupations in Los Prados, the most male-oriented occupations are Firefighting & Prevention (100.0%), Food Preparation & Serving (100.0%), and Security & Protection (27.7%), while the most female-oriented occupations are Law Enforcement (100.0%), and Security & Protection (72.3%).
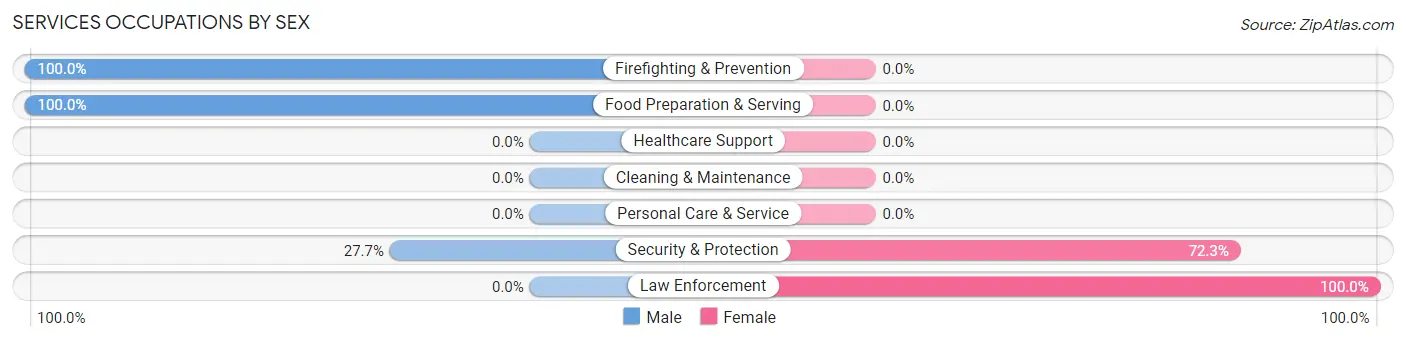
| Occupation | Male | Female |
| Healthcare Support | 0 (0.0%) | 0 (0.0%) |
| Security & Protection | 18 (27.7%) | 47 (72.3%) |
| Firefighting & Prevention | 18 (100.0%) | 0 (0.0%) |
| Law Enforcement | 0 (0.0%) | 47 (100.0%) |
| Food Preparation & Serving | 26 (100.0%) | 0 (0.0%) |
| Cleaning & Maintenance | 0 (0.0%) | 0 (0.0%) |
| Personal Care & Service | 0 (0.0%) | 0 (0.0%) |
| Total (Category) | 44 (48.3%) | 47 (51.6%) |
| Total (Overall) | 944 (54.6%) | 784 (45.4%) |
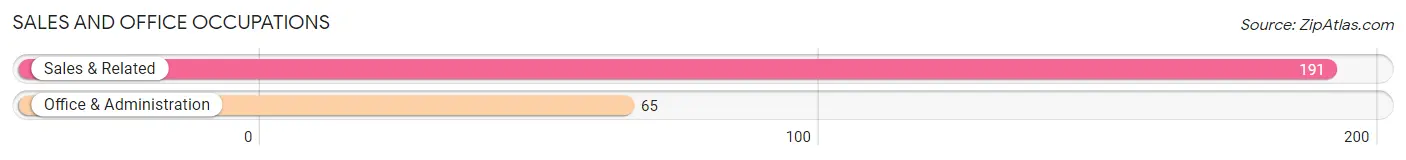
Sales and Office Occupations
The most common Sales and Office occupations in Los Prados are Sales & Related (191 | 11.1%), and Office & Administration (65 | 3.8%).
Sales and Office Occupations by Sex
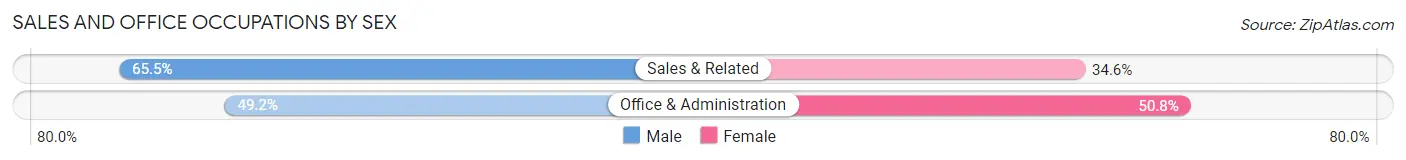
| Occupation | Male | Female |
| Sales & Related | 125 (65.4%) | 66 (34.5%) |
| Office & Administration | 32 (49.2%) | 33 (50.8%) |
| Total (Category) | 157 (61.3%) | 99 (38.7%) |
| Total (Overall) | 944 (54.6%) | 784 (45.4%) |
Natural Resources, Construction and Maintenance Occupations

Natural Resources, Construction and Maintenance Occupations by Sex

| Occupation | Male | Female |
| Farming, Fishing & Forestry | 0 (0.0%) | 0 (0.0%) |
| Construction & Extraction | 0 (0.0%) | 0 (0.0%) |
| Installation, Maintenance & Repair | 0 (0.0%) | 0 (0.0%) |
| Total (Category) | 0 (0.0%) | 0 (0.0%) |
| Total (Overall) | 944 (54.6%) | 784 (45.4%) |
Production, Transportation and Moving Occupations
Production, Transportation and Moving Occupations by Sex
| Occupation | Male | Female |
| Production | 0 (0.0%) | 0 (0.0%) |
| Transportation | 0 (0.0%) | 0 (0.0%) |
| Material Moving | 0 (0.0%) | 0 (0.0%) |
| Total (Category) | 0 (0.0%) | 0 (0.0%) |
| Total (Overall) | 944 (54.6%) | 784 (45.4%) |
Employment Industries by Sex in Los Prados
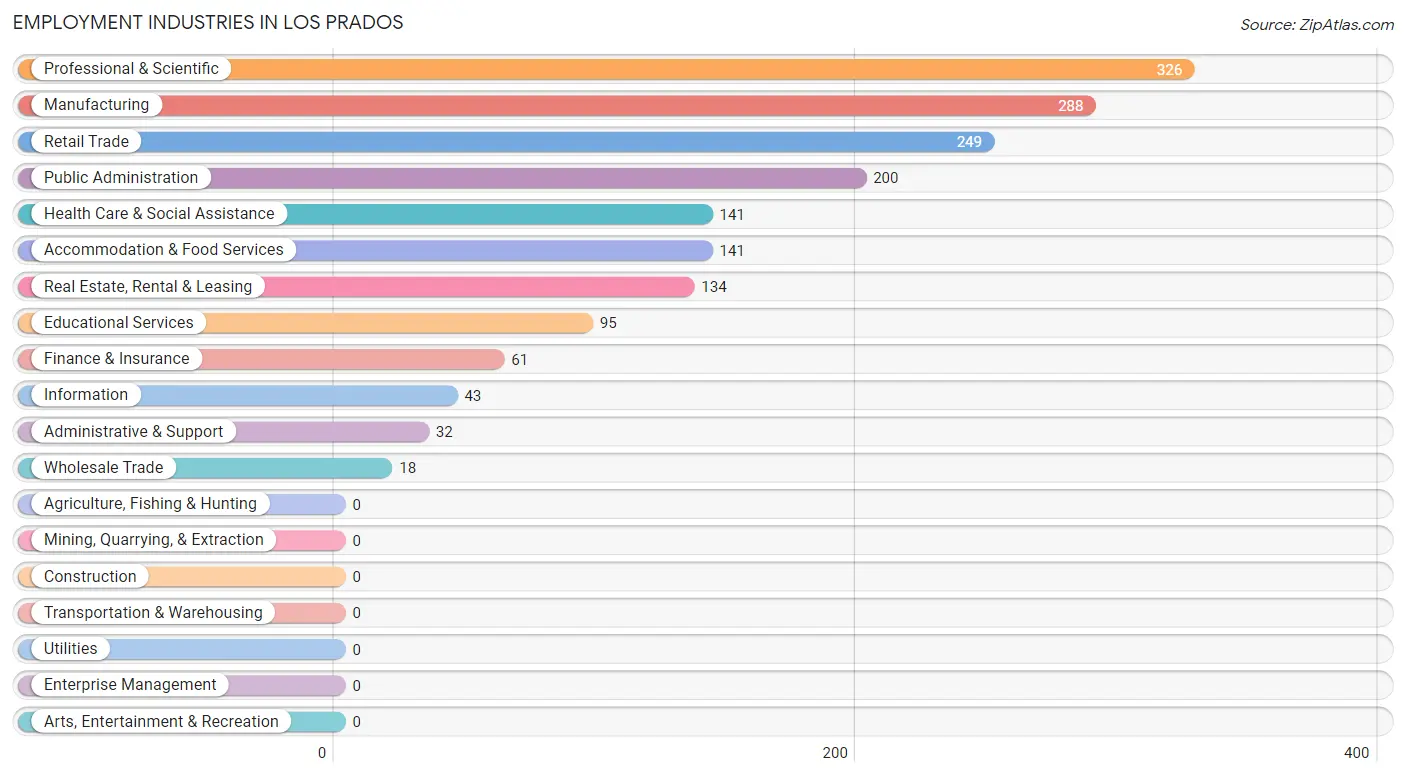
Employment Industries in Los Prados
The major employment industries in Los Prados include Professional & Scientific (326 | 18.9%), Manufacturing (288 | 16.7%), Retail Trade (249 | 14.4%), Public Administration (200 | 11.6%), and Health Care & Social Assistance (141 | 8.2%).
Employment Industries by Sex in Los Prados
The Los Prados industries that see more men than women are Real Estate, Rental & Leasing (100.0%), Administrative & Support (100.0%), and Accommodation & Food Services (68.1%), whereas the industries that tend to have a higher number of women are Wholesale Trade (100.0%), Educational Services (100.0%), and Health Care & Social Assistance (100.0%).
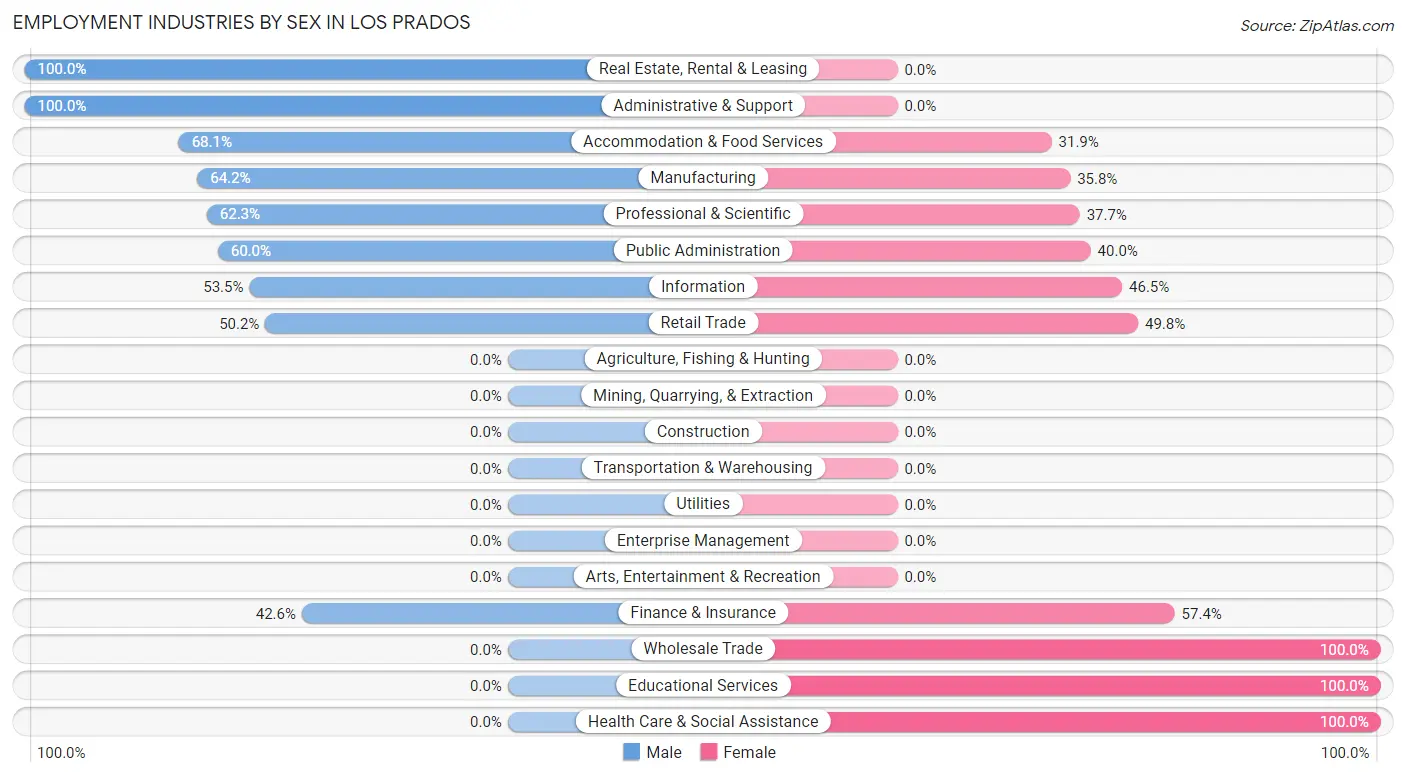
| Industry | Male | Female |
| Agriculture, Fishing & Hunting | 0 (0.0%) | 0 (0.0%) |
| Mining, Quarrying, & Extraction | 0 (0.0%) | 0 (0.0%) |
| Construction | 0 (0.0%) | 0 (0.0%) |
| Manufacturing | 185 (64.2%) | 103 (35.8%) |
| Wholesale Trade | 0 (0.0%) | 18 (100.0%) |
| Retail Trade | 125 (50.2%) | 124 (49.8%) |
| Transportation & Warehousing | 0 (0.0%) | 0 (0.0%) |
| Utilities | 0 (0.0%) | 0 (0.0%) |
| Information | 23 (53.5%) | 20 (46.5%) |
| Finance & Insurance | 26 (42.6%) | 35 (57.4%) |
| Real Estate, Rental & Leasing | 134 (100.0%) | 0 (0.0%) |
| Professional & Scientific | 203 (62.3%) | 123 (37.7%) |
| Enterprise Management | 0 (0.0%) | 0 (0.0%) |
| Administrative & Support | 32 (100.0%) | 0 (0.0%) |
| Educational Services | 0 (0.0%) | 95 (100.0%) |
| Health Care & Social Assistance | 0 (0.0%) | 141 (100.0%) |
| Arts, Entertainment & Recreation | 0 (0.0%) | 0 (0.0%) |
| Accommodation & Food Services | 96 (68.1%) | 45 (31.9%) |
| Public Administration | 120 (60.0%) | 80 (40.0%) |
| Total | 944 (54.6%) | 784 (45.4%) |
Education in Los Prados
School Enrollment in Los Prados
The most common levels of schooling among the 936 students in Los Prados are graduate / professional (255 | 27.2%), elementary school (220 | 23.5%), and high school (197 | 21.0%).
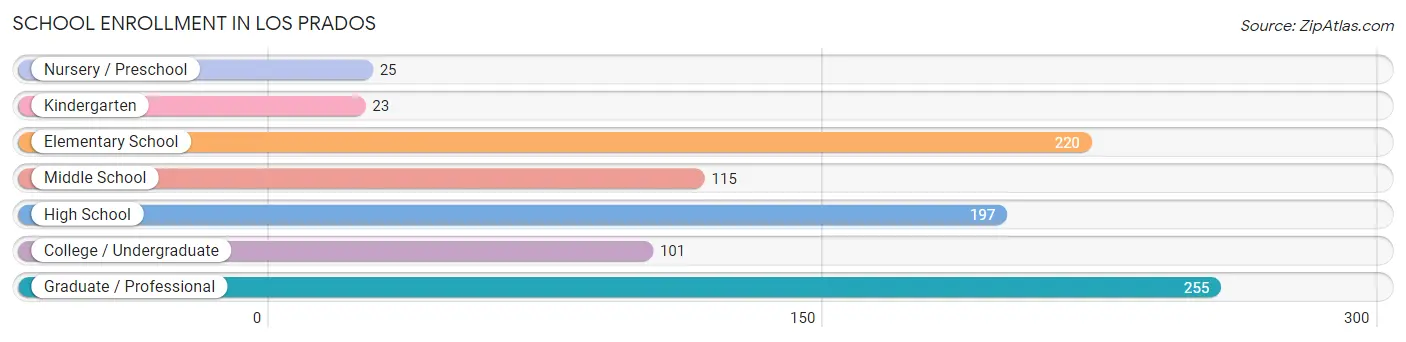
| School Level | # Students | % Students |
| Nursery / Preschool | 25 | 2.7% |
| Kindergarten | 23 | 2.5% |
| Elementary School | 220 | 23.5% |
| Middle School | 115 | 12.3% |
| High School | 197 | 21.0% |
| College / Undergraduate | 101 | 10.8% |
| Graduate / Professional | 255 | 27.2% |
| Total | 936 | 100.0% |
School Enrollment by Age by Funding Source in Los Prados
Out of a total of 936 students who are enrolled in schools in Los Prados, 858 (91.7%) attend a private institution, while the remaining 78 (8.3%) are enrolled in public schools. The age group of 5 to 9 year old has the highest likelihood of being enrolled in private schools, with 213 (100.0% in the age bracket) enrolled. Conversely, the age group of 3 to 4 year olds has the lowest likelihood of being enrolled in a private school, with 25 (100.0% in the age bracket) attending a public institution.
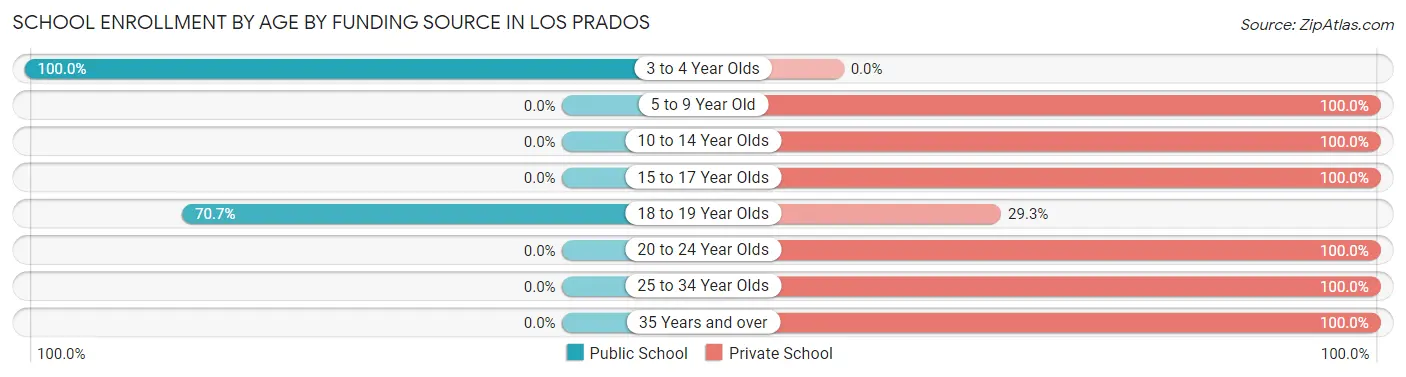
| Age Bracket | Public School | Private School |
| 3 to 4 Year Olds | 25 (100.0%) | 0 (0.0%) |
| 5 to 9 Year Old | 0 (0.0%) | 213 (100.0%) |
| 10 to 14 Year Olds | 0 (0.0%) | 233 (100.0%) |
| 15 to 17 Year Olds | 0 (0.0%) | 109 (100.0%) |
| 18 to 19 Year Olds | 53 (70.7%) | 22 (29.3%) |
| 20 to 24 Year Olds | 0 (0.0%) | 84 (100.0%) |
| 25 to 34 Year Olds | 0 (0.0%) | 157 (100.0%) |
| 35 Years and over | 0 (0.0%) | 40 (100.0%) |
| Total | 78 (8.3%) | 858 (91.7%) |
Educational Attainment by Field of Study in Los Prados
Business (668 | 34.4%), bio, nature & agricultural (238 | 12.3%), psychology (213 | 11.0%), engineering (204 | 10.5%), and physical & health sciences (202 | 10.4%) are the most common fields of study among 1,941 individuals in Los Prados who have obtained a bachelor's degree or higher.
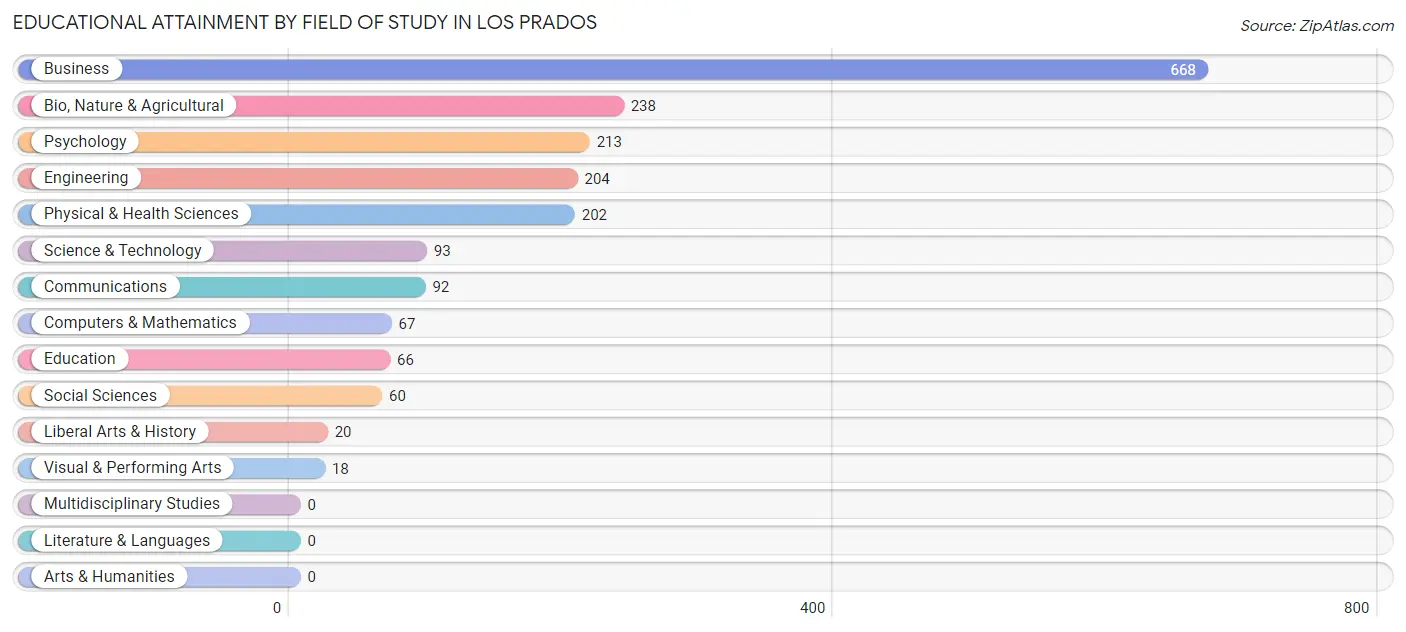
| Field of Study | # Graduates | % Graduates |
| Computers & Mathematics | 67 | 3.5% |
| Bio, Nature & Agricultural | 238 | 12.3% |
| Physical & Health Sciences | 202 | 10.4% |
| Psychology | 213 | 11.0% |
| Social Sciences | 60 | 3.1% |
| Engineering | 204 | 10.5% |
| Multidisciplinary Studies | 0 | 0.0% |
| Science & Technology | 93 | 4.8% |
| Business | 668 | 34.4% |
| Education | 66 | 3.4% |
| Literature & Languages | 0 | 0.0% |
| Liberal Arts & History | 20 | 1.0% |
| Visual & Performing Arts | 18 | 0.9% |
| Communications | 92 | 4.7% |
| Arts & Humanities | 0 | 0.0% |
| Total | 1,941 | 100.0% |
Transportation & Commute in Los Prados
Vehicle Availability by Sex in Los Prados
The most prevalent vehicle ownership categories in Los Prados are males with 2 vehicles (561, accounting for 59.4%) and females with 2 vehicles (245, making up 71.6%).
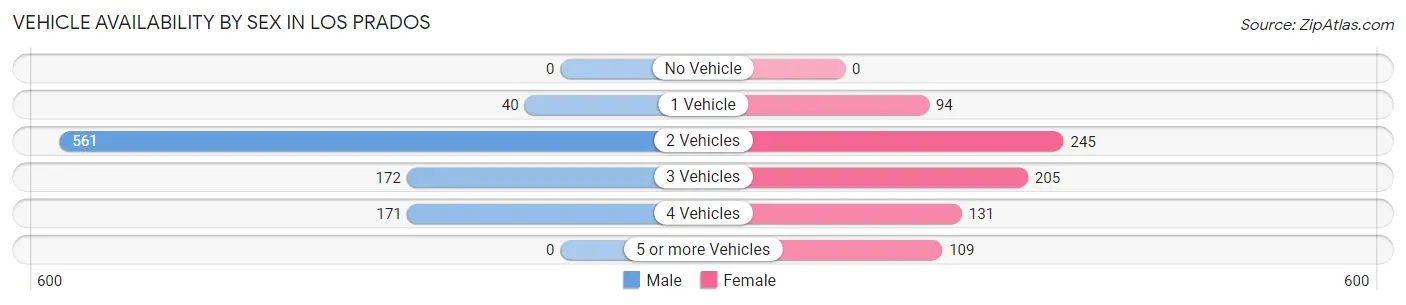
| Vehicles Available | Male | Female |
| No Vehicle | 0 (0.0%) | 0 (0.0%) |
| 1 Vehicle | 40 (4.2%) | 94 (12.0%) |
| 2 Vehicles | 561 (59.4%) | 245 (31.2%) |
| 3 Vehicles | 172 (18.2%) | 205 (26.2%) |
| 4 Vehicles | 171 (18.1%) | 131 (16.7%) |
| 5 or more Vehicles | 0 (0.0%) | 109 (13.9%) |
| Total | 944 (100.0%) | 784 (100.0%) |
Commute Time in Los Prados
The most frequently occuring commute durations in Los Prados are 60 to 89 minutes (317 commuters, 19.1%), 45 to 59 minutes (313 commuters, 18.8%), and 90 or more minutes (267 commuters, 16.1%).
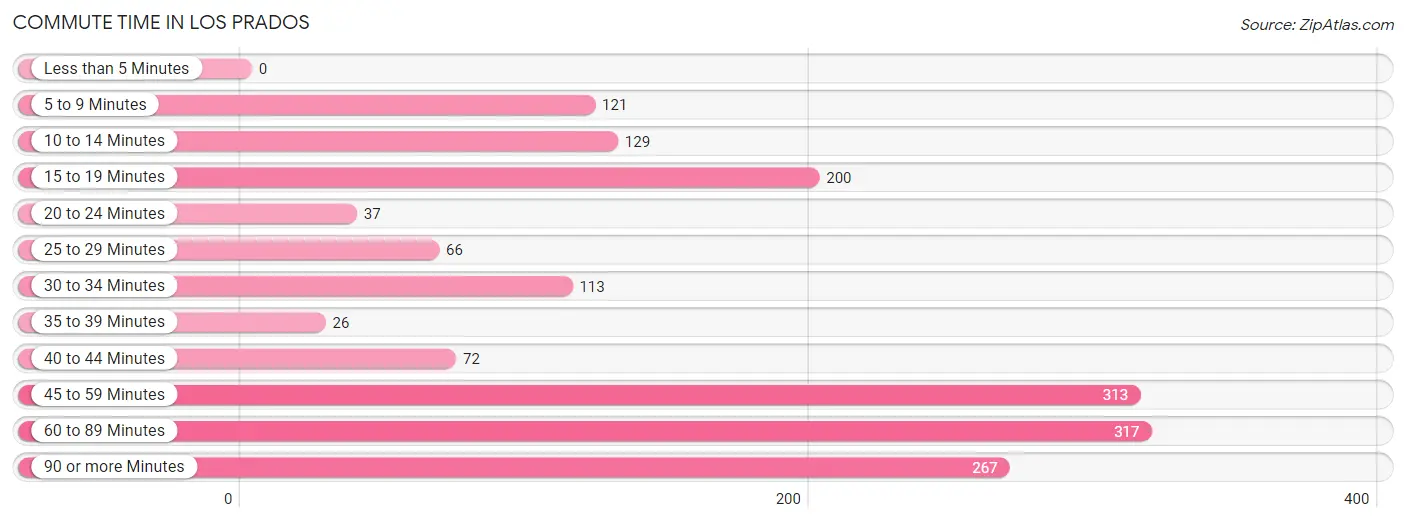
| Commute Time | # Commuters | % Commuters |
| Less than 5 Minutes | 0 | 0.0% |
| 5 to 9 Minutes | 121 | 7.3% |
| 10 to 14 Minutes | 129 | 7.8% |
| 15 to 19 Minutes | 200 | 12.0% |
| 20 to 24 Minutes | 37 | 2.2% |
| 25 to 29 Minutes | 66 | 4.0% |
| 30 to 34 Minutes | 113 | 6.8% |
| 35 to 39 Minutes | 26 | 1.6% |
| 40 to 44 Minutes | 72 | 4.3% |
| 45 to 59 Minutes | 313 | 18.8% |
| 60 to 89 Minutes | 317 | 19.1% |
| 90 or more Minutes | 267 | 16.1% |
Commute Time by Sex in Los Prados
The most common commute times in Los Prados are 60 to 89 minutes (246 commuters, 28.1%) for males and 90 or more minutes (154 commuters, 19.6%) for females.
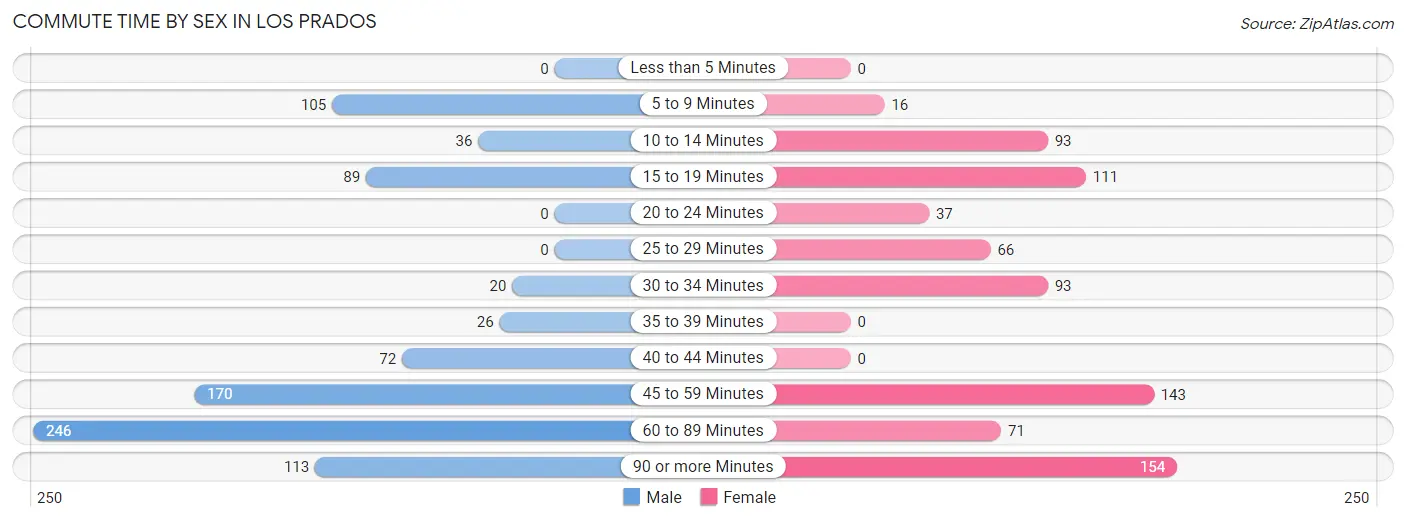
| Commute Time | Male | Female |
| Less than 5 Minutes | 0 (0.0%) | 0 (0.0%) |
| 5 to 9 Minutes | 105 (12.0%) | 16 (2.0%) |
| 10 to 14 Minutes | 36 (4.1%) | 93 (11.9%) |
| 15 to 19 Minutes | 89 (10.2%) | 111 (14.2%) |
| 20 to 24 Minutes | 0 (0.0%) | 37 (4.7%) |
| 25 to 29 Minutes | 0 (0.0%) | 66 (8.4%) |
| 30 to 34 Minutes | 20 (2.3%) | 93 (11.9%) |
| 35 to 39 Minutes | 26 (3.0%) | 0 (0.0%) |
| 40 to 44 Minutes | 72 (8.2%) | 0 (0.0%) |
| 45 to 59 Minutes | 170 (19.4%) | 143 (18.2%) |
| 60 to 89 Minutes | 246 (28.1%) | 71 (9.1%) |
| 90 or more Minutes | 113 (12.9%) | 154 (19.6%) |
Time of Departure to Work by Sex in Los Prados
The most frequent times of departure to work in Los Prados are 7:00 AM to 7:29 AM (233, 26.6%) for males and 7:00 AM to 7:29 AM (336, 42.9%) for females.
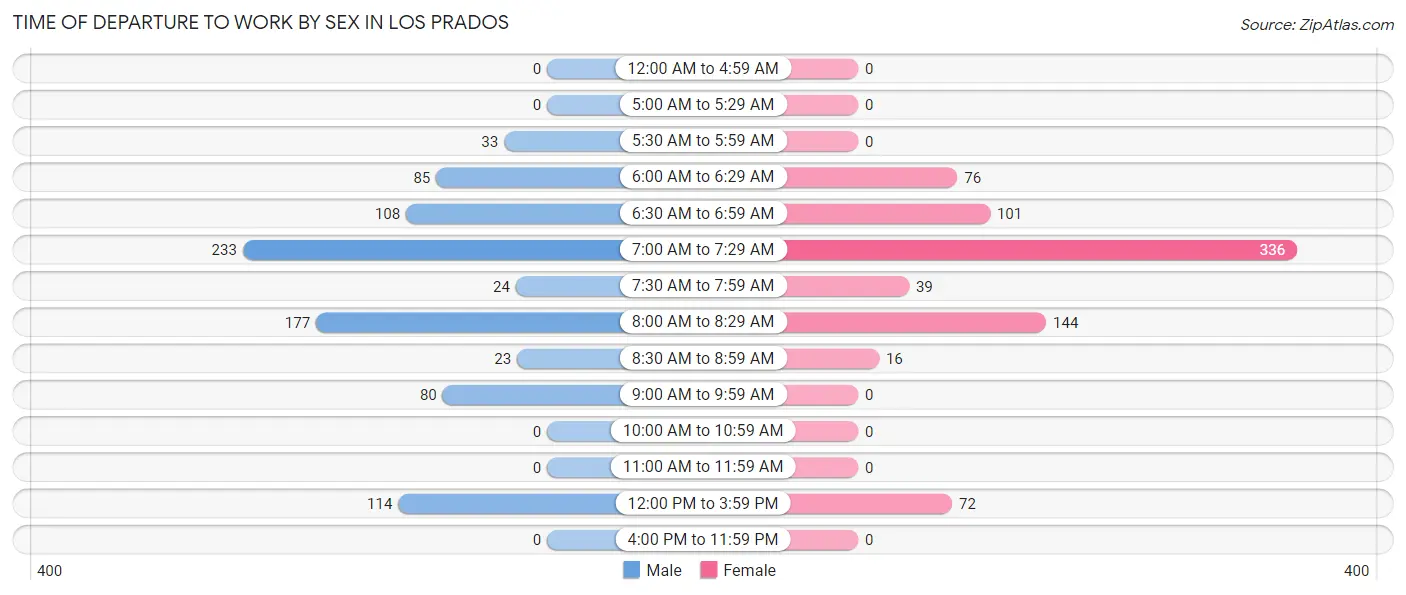
| Time of Departure | Male | Female |
| 12:00 AM to 4:59 AM | 0 (0.0%) | 0 (0.0%) |
| 5:00 AM to 5:29 AM | 0 (0.0%) | 0 (0.0%) |
| 5:30 AM to 5:59 AM | 33 (3.8%) | 0 (0.0%) |
| 6:00 AM to 6:29 AM | 85 (9.7%) | 76 (9.7%) |
| 6:30 AM to 6:59 AM | 108 (12.3%) | 101 (12.9%) |
| 7:00 AM to 7:29 AM | 233 (26.6%) | 336 (42.9%) |
| 7:30 AM to 7:59 AM | 24 (2.7%) | 39 (5.0%) |
| 8:00 AM to 8:29 AM | 177 (20.2%) | 144 (18.4%) |
| 8:30 AM to 8:59 AM | 23 (2.6%) | 16 (2.0%) |
| 9:00 AM to 9:59 AM | 80 (9.1%) | 0 (0.0%) |
| 10:00 AM to 10:59 AM | 0 (0.0%) | 0 (0.0%) |
| 11:00 AM to 11:59 AM | 0 (0.0%) | 0 (0.0%) |
| 12:00 PM to 3:59 PM | 114 (13.0%) | 72 (9.2%) |
| 4:00 PM to 11:59 PM | 0 (0.0%) | 0 (0.0%) |
| Total | 877 (100.0%) | 784 (100.0%) |
Housing Occupancy in Los Prados
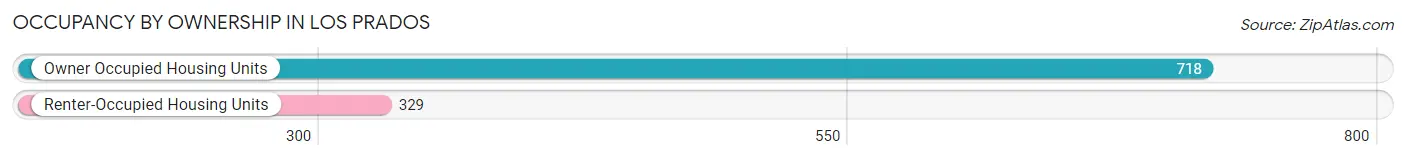
Occupancy by Ownership in Los Prados
Of the total 1,047 dwellings in Los Prados, owner-occupied units account for 718 (68.6%), while renter-occupied units make up 329 (31.4%).
| Occupancy | # Housing Units | % Housing Units |
| Owner Occupied Housing Units | 718 | 68.6% |
| Renter-Occupied Housing Units | 329 | 31.4% |
| Total Occupied Housing Units | 1,047 | 100.0% |
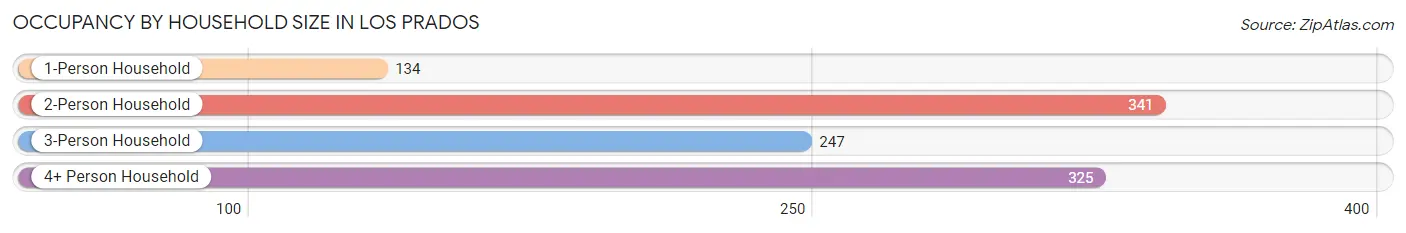
Occupancy by Household Size in Los Prados
| Household Size | # Housing Units | % Housing Units |
| 1-Person Household | 134 | 12.8% |
| 2-Person Household | 341 | 32.6% |
| 3-Person Household | 247 | 23.6% |
| 4+ Person Household | 325 | 31.0% |
| Total Housing Units | 1,047 | 100.0% |
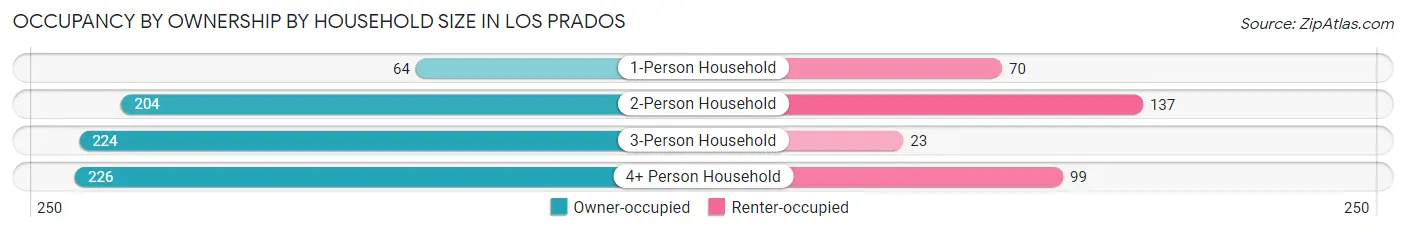
Occupancy by Ownership by Household Size in Los Prados
| Household Size | Owner-occupied | Renter-occupied |
| 1-Person Household | 64 (47.8%) | 70 (52.2%) |
| 2-Person Household | 204 (59.8%) | 137 (40.2%) |
| 3-Person Household | 224 (90.7%) | 23 (9.3%) |
| 4+ Person Household | 226 (69.5%) | 99 (30.5%) |
| Total Housing Units | 718 (68.6%) | 329 (31.4%) |
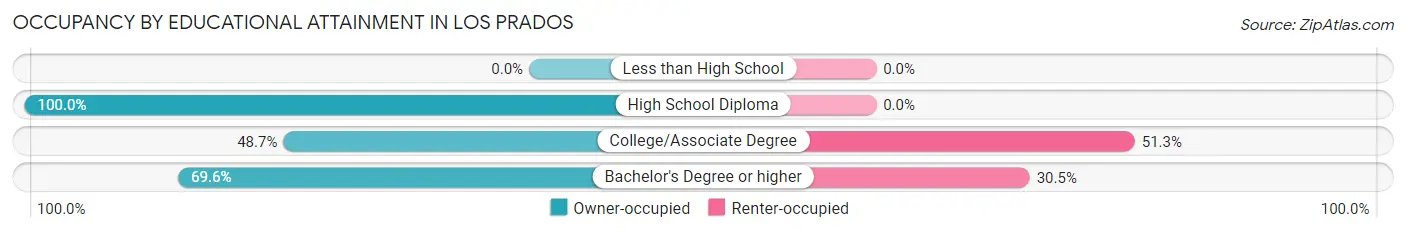
Occupancy by Educational Attainment in Los Prados
| Household Size | Owner-occupied | Renter-occupied |
| Less than High School | 0 (0.0%) | 0 (0.0%) |
| High School Diploma | 20 (100.0%) | 0 (0.0%) |
| College/Associate Degree | 38 (48.7%) | 40 (51.3%) |
| Bachelor's Degree or higher | 660 (69.6%) | 289 (30.4%) |
Occupancy by Age of Householder in Los Prados
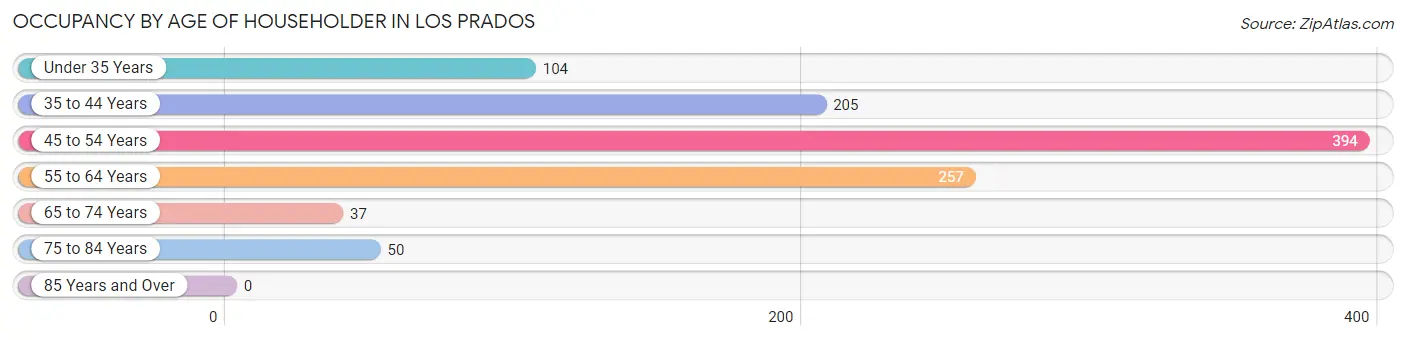
| Age Bracket | # Households | % Households |
| Under 35 Years | 104 | 9.9% |
| 35 to 44 Years | 205 | 19.6% |
| 45 to 54 Years | 394 | 37.6% |
| 55 to 64 Years | 257 | 24.5% |
| 65 to 74 Years | 37 | 3.5% |
| 75 to 84 Years | 50 | 4.8% |
| 85 Years and Over | 0 | 0.0% |
| Total | 1,047 | 100.0% |
Housing Finances in Los Prados
Median Income by Occupancy in Los Prados
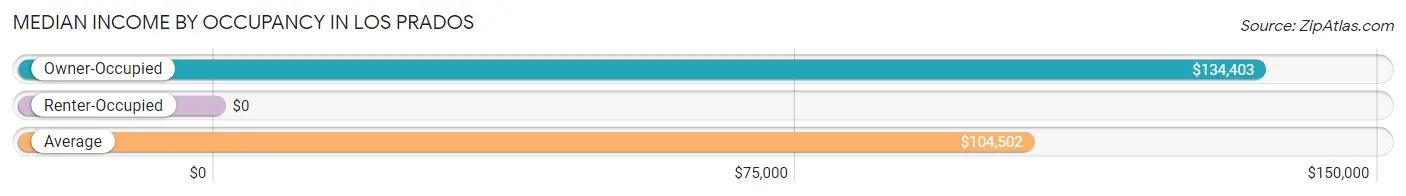
| Occupancy Type | # Households | Median Income |
| Owner-Occupied | 718 (68.6%) | $134,403 |
| Renter-Occupied | 329 (31.4%) | $0 |
| Average | 1,047 (100.0%) | $104,502 |
Occupancy by Householder Income Bracket in Los Prados
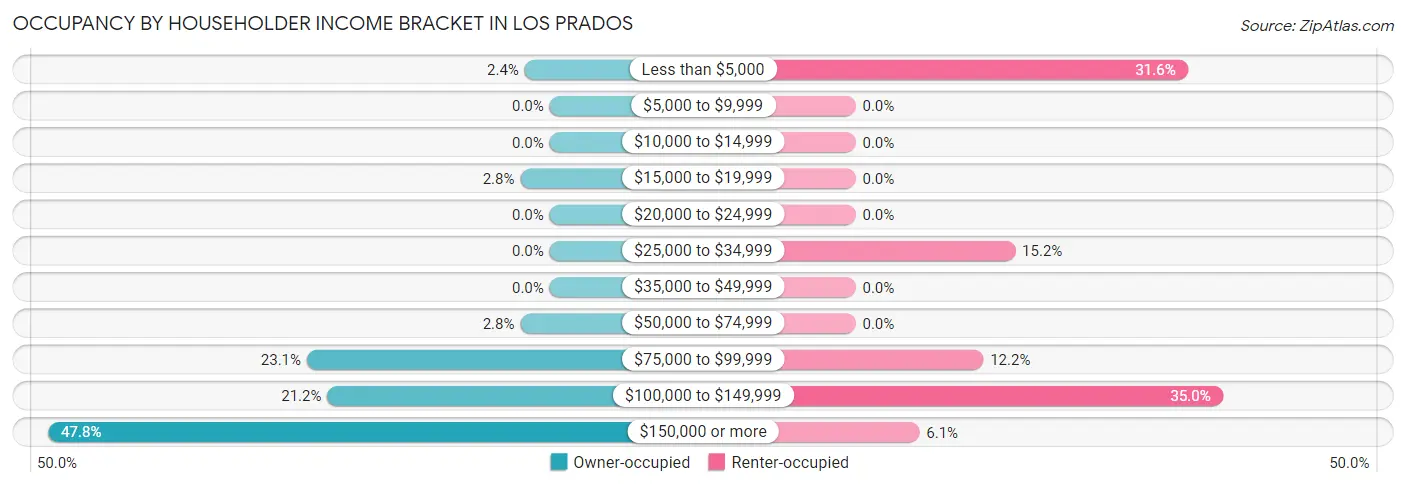
| Income Bracket | Owner-occupied | Renter-occupied |
| Less than $5,000 | 17 (2.4%) | 104 (31.6%) |
| $5,000 to $9,999 | 0 (0.0%) | 0 (0.0%) |
| $10,000 to $14,999 | 0 (0.0%) | 0 (0.0%) |
| $15,000 to $19,999 | 20 (2.8%) | 0 (0.0%) |
| $20,000 to $24,999 | 0 (0.0%) | 0 (0.0%) |
| $25,000 to $34,999 | 0 (0.0%) | 50 (15.2%) |
| $35,000 to $49,999 | 0 (0.0%) | 0 (0.0%) |
| $50,000 to $74,999 | 20 (2.8%) | 0 (0.0%) |
| $75,000 to $99,999 | 166 (23.1%) | 40 (12.2%) |
| $100,000 to $149,999 | 152 (21.2%) | 115 (34.9%) |
| $150,000 or more | 343 (47.8%) | 20 (6.1%) |
| Total | 718 (100.0%) | 329 (100.0%) |
Monthly Housing Cost Tiers in Los Prados
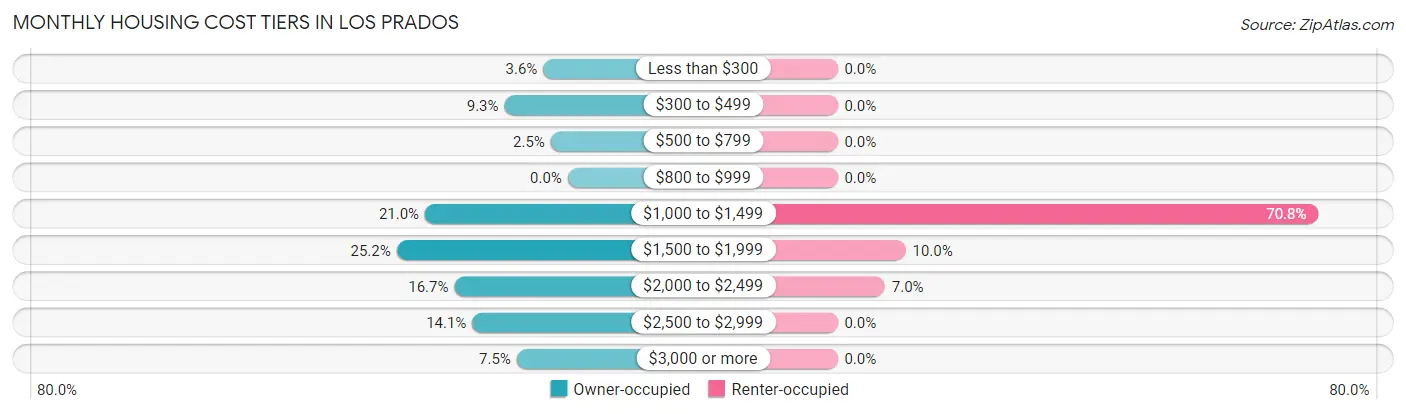
| Monthly Cost | Owner-occupied | Renter-occupied |
| Less than $300 | 26 (3.6%) | 0 (0.0%) |
| $300 to $499 | 67 (9.3%) | 0 (0.0%) |
| $500 to $799 | 18 (2.5%) | 0 (0.0%) |
| $800 to $999 | 0 (0.0%) | 0 (0.0%) |
| $1,000 to $1,499 | 151 (21.0%) | 233 (70.8%) |
| $1,500 to $1,999 | 181 (25.2%) | 33 (10.0%) |
| $2,000 to $2,499 | 120 (16.7%) | 23 (7.0%) |
| $2,500 to $2,999 | 101 (14.1%) | 0 (0.0%) |
| $3,000 or more | 54 (7.5%) | 0 (0.0%) |
| Total | 718 (100.0%) | 329 (100.0%) |
Physical Housing Characteristics in Los Prados
Housing Structures in Los Prados
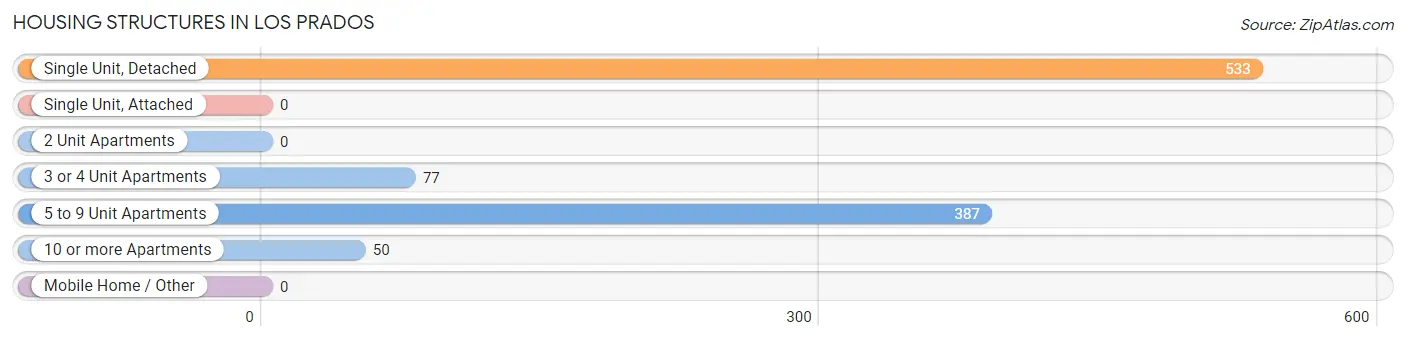
| Structure Type | # Housing Units | % Housing Units |
| Single Unit, Detached | 533 | 50.9% |
| Single Unit, Attached | 0 | 0.0% |
| 2 Unit Apartments | 0 | 0.0% |
| 3 or 4 Unit Apartments | 77 | 7.3% |
| 5 to 9 Unit Apartments | 387 | 37.0% |
| 10 or more Apartments | 50 | 4.8% |
| Mobile Home / Other | 0 | 0.0% |
| Total | 1,047 | 100.0% |
Housing Structures by Occupancy in Los Prados
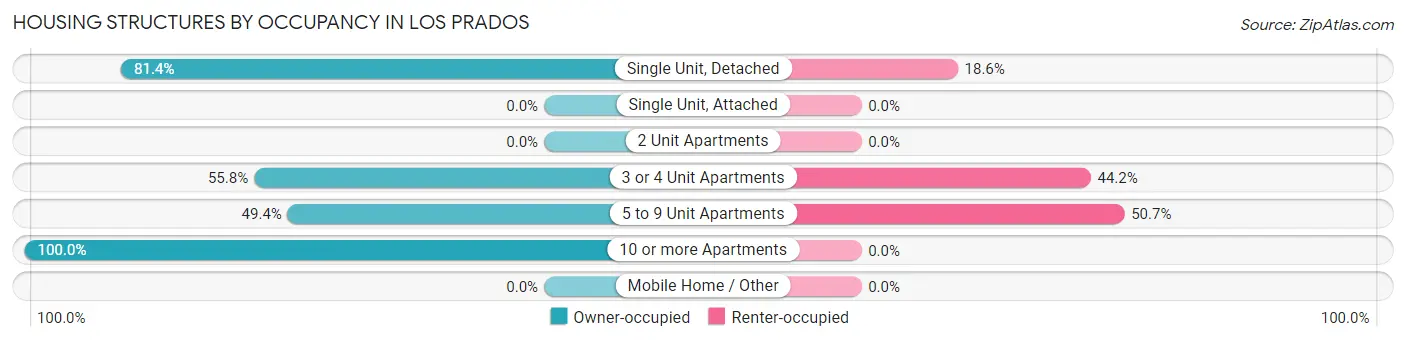
| Structure Type | Owner-occupied | Renter-occupied |
| Single Unit, Detached | 434 (81.4%) | 99 (18.6%) |
| Single Unit, Attached | 0 (0.0%) | 0 (0.0%) |
| 2 Unit Apartments | 0 (0.0%) | 0 (0.0%) |
| 3 or 4 Unit Apartments | 43 (55.8%) | 34 (44.2%) |
| 5 to 9 Unit Apartments | 191 (49.3%) | 196 (50.6%) |
| 10 or more Apartments | 50 (100.0%) | 0 (0.0%) |
| Mobile Home / Other | 0 (0.0%) | 0 (0.0%) |
| Total | 718 (68.6%) | 329 (31.4%) |
Housing Structures by Number of Rooms in Los Prados
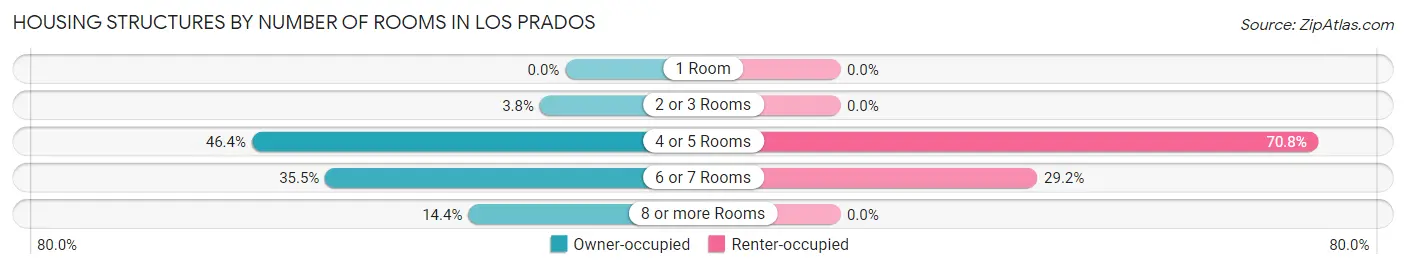
| Number of Rooms | Owner-occupied | Renter-occupied |
| 1 Room | 0 (0.0%) | 0 (0.0%) |
| 2 or 3 Rooms | 27 (3.8%) | 0 (0.0%) |
| 4 or 5 Rooms | 333 (46.4%) | 233 (70.8%) |
| 6 or 7 Rooms | 255 (35.5%) | 96 (29.2%) |
| 8 or more Rooms | 103 (14.3%) | 0 (0.0%) |
| Total | 718 (100.0%) | 329 (100.0%) |
Housing Structure by Heating Type in Los Prados
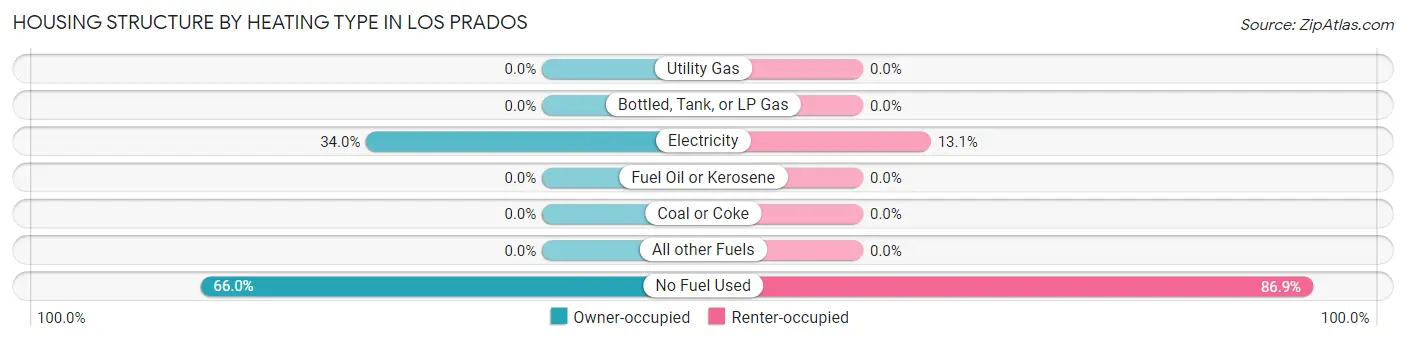
| Heating Type | Owner-occupied | Renter-occupied |
| Utility Gas | 0 (0.0%) | 0 (0.0%) |
| Bottled, Tank, or LP Gas | 0 (0.0%) | 0 (0.0%) |
| Electricity | 244 (34.0%) | 43 (13.1%) |
| Fuel Oil or Kerosene | 0 (0.0%) | 0 (0.0%) |
| Coal or Coke | 0 (0.0%) | 0 (0.0%) |
| All other Fuels | 0 (0.0%) | 0 (0.0%) |
| No Fuel Used | 474 (66.0%) | 286 (86.9%) |
| Total | 718 (100.0%) | 329 (100.0%) |
Household Vehicle Usage in Los Prados
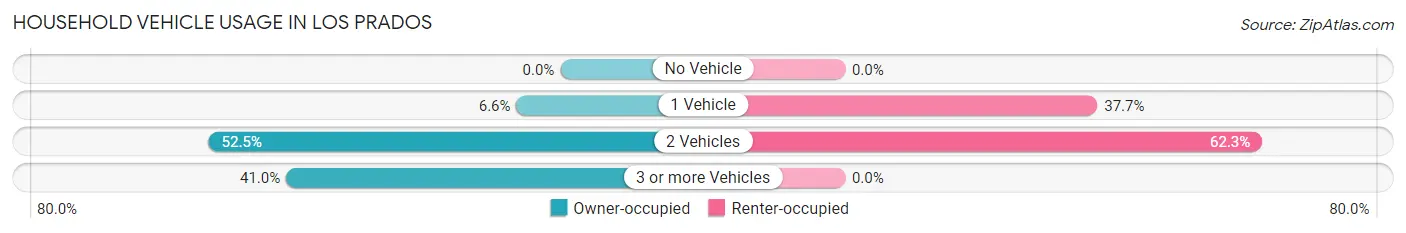
| Vehicles per Household | Owner-occupied | Renter-occupied |
| No Vehicle | 0 (0.0%) | 0 (0.0%) |
| 1 Vehicle | 47 (6.6%) | 124 (37.7%) |
| 2 Vehicles | 377 (52.5%) | 205 (62.3%) |
| 3 or more Vehicles | 294 (40.9%) | 0 (0.0%) |
| Total | 718 (100.0%) | 329 (100.0%) |
Real Estate & Mortgages in Los Prados
Real Estate and Mortgage Overview in Los Prados
| Characteristic | Without Mortgage | With Mortgage |
| Housing Units | 111 | 607 |
| Median Property Value | $318,400 | $256,900 |
| Median Household Income | - | - |
| Monthly Housing Costs | $334 | $54 |
| Real Estate Taxes | $1,340 | $182 |
Property Value by Mortgage Status in Los Prados
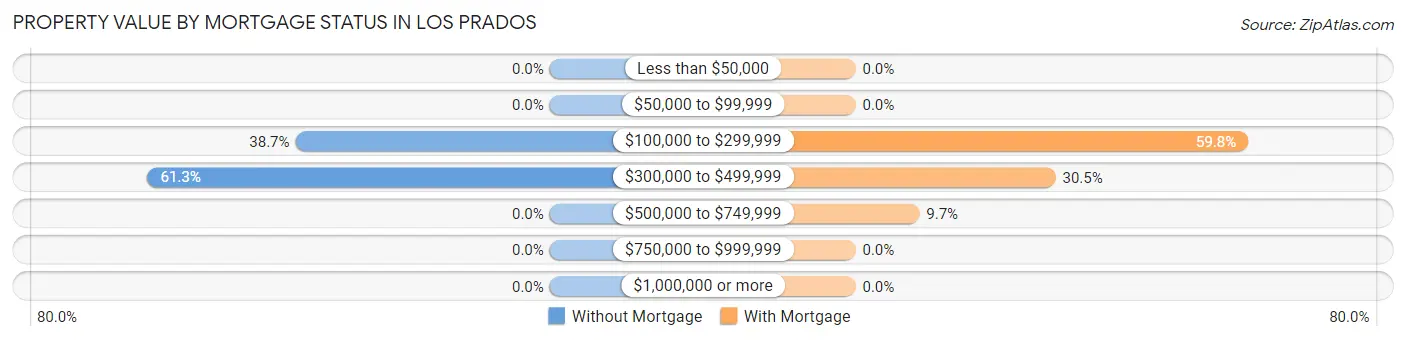
| Property Value | Without Mortgage | With Mortgage |
| Less than $50,000 | 0 (0.0%) | 0 (0.0%) |
| $50,000 to $99,999 | 0 (0.0%) | 0 (0.0%) |
| $100,000 to $299,999 | 43 (38.7%) | 363 (59.8%) |
| $300,000 to $499,999 | 68 (61.3%) | 185 (30.5%) |
| $500,000 to $749,999 | 0 (0.0%) | 59 (9.7%) |
| $750,000 to $999,999 | 0 (0.0%) | 0 (0.0%) |
| $1,000,000 or more | 0 (0.0%) | 0 (0.0%) |
| Total | 111 (100.0%) | 607 (100.0%) |
Household Income by Mortgage Status in Los Prados
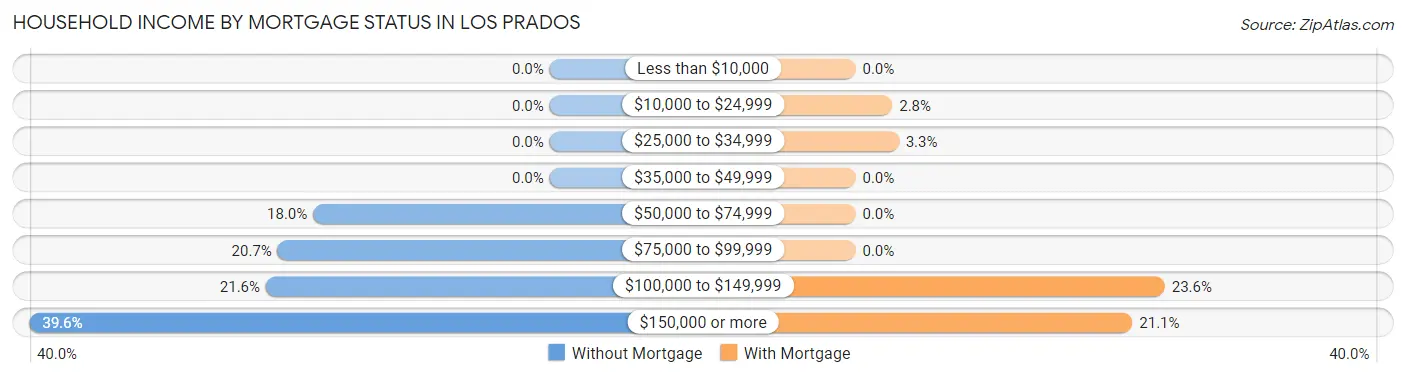
| Household Income | Without Mortgage | With Mortgage |
| Less than $10,000 | 0 (0.0%) | 0 (0.0%) |
| $10,000 to $24,999 | 0 (0.0%) | 17 (2.8%) |
| $25,000 to $34,999 | 0 (0.0%) | 20 (3.3%) |
| $35,000 to $49,999 | 0 (0.0%) | 0 (0.0%) |
| $50,000 to $74,999 | 20 (18.0%) | 0 (0.0%) |
| $75,000 to $99,999 | 23 (20.7%) | 0 (0.0%) |
| $100,000 to $149,999 | 24 (21.6%) | 143 (23.6%) |
| $150,000 or more | 44 (39.6%) | 128 (21.1%) |
| Total | 111 (100.0%) | 607 (100.0%) |
Property Value to Household Income Ratio in Los Prados
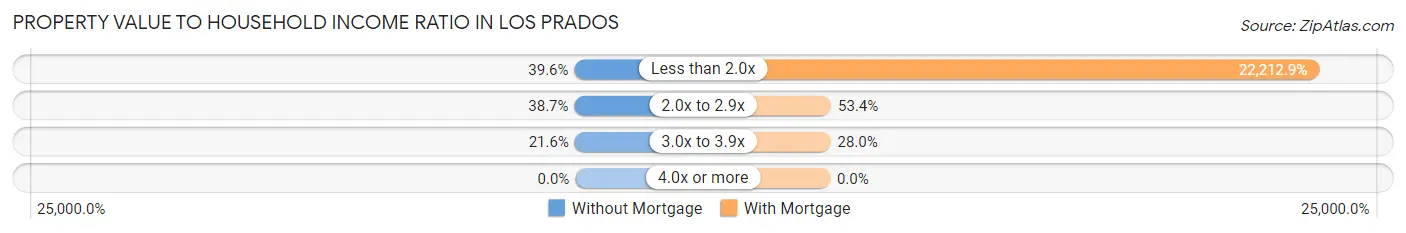
| Value-to-Income Ratio | Without Mortgage | With Mortgage |
| Less than 2.0x | 44 (39.6%) | 134,832 (22,212.9%) |
| 2.0x to 2.9x | 43 (38.7%) | 324 (53.4%) |
| 3.0x to 3.9x | 24 (21.6%) | 170 (28.0%) |
| 4.0x or more | 0 (0.0%) | 0 (0.0%) |
| Total | 111 (100.0%) | 607 (100.0%) |
Real Estate Taxes by Mortgage Status in Los Prados
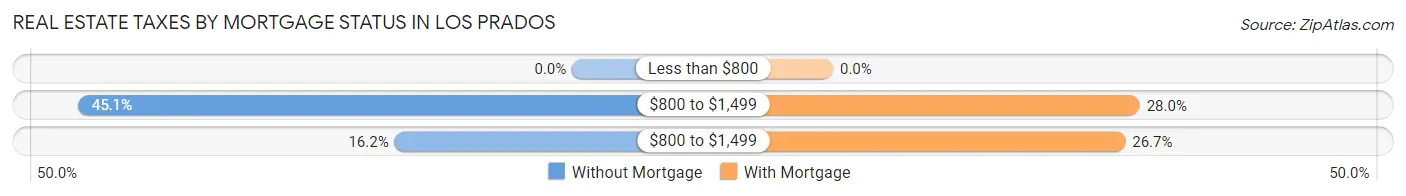
| Property Taxes | Without Mortgage | With Mortgage |
| Less than $800 | 0 (0.0%) | 0 (0.0%) |
| $800 to $1,499 | 50 (45.1%) | 170 (28.0%) |
| $800 to $1,499 | 18 (16.2%) | 162 (26.7%) |
| Total | 111 (100.0%) | 607 (100.0%) |
Health & Disability in Los Prados
Health Insurance Coverage by Age in Los Prados
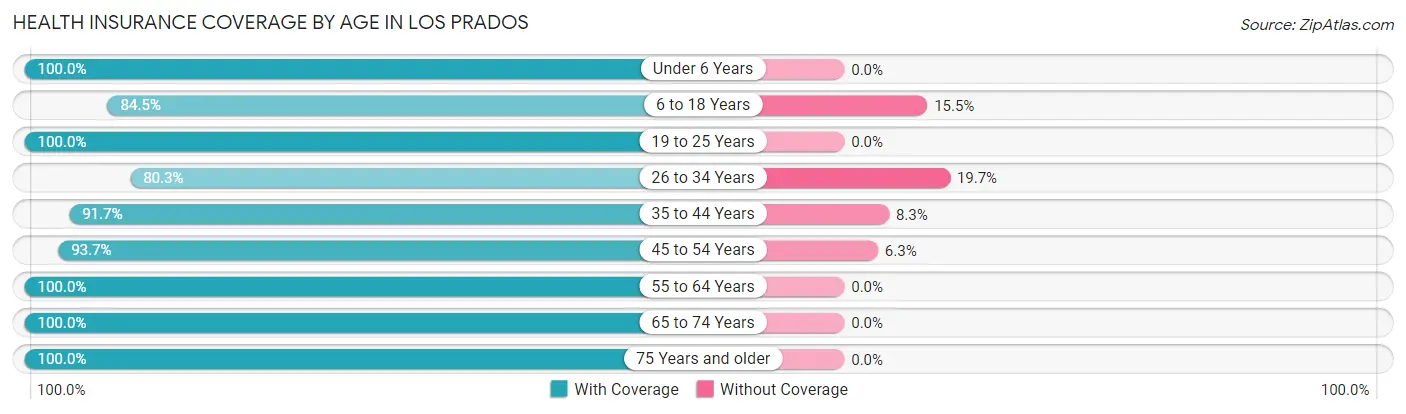
| Age Bracket | With Coverage | Without Coverage |
| Under 6 Years | 25 (100.0%) | 0 (0.0%) |
| 6 to 18 Years | 536 (84.5%) | 98 (15.5%) |
| 19 to 25 Years | 384 (100.0%) | 0 (0.0%) |
| 26 to 34 Years | 265 (80.3%) | 65 (19.7%) |
| 35 to 44 Years | 517 (91.7%) | 47 (8.3%) |
| 45 to 54 Years | 598 (93.7%) | 40 (6.3%) |
| 55 to 64 Years | 477 (100.0%) | 0 (0.0%) |
| 65 to 74 Years | 58 (100.0%) | 0 (0.0%) |
| 75 Years and older | 75 (100.0%) | 0 (0.0%) |
| Total | 2,935 (92.1%) | 250 (7.9%) |
Health Insurance Coverage by Citizenship Status in Los Prados
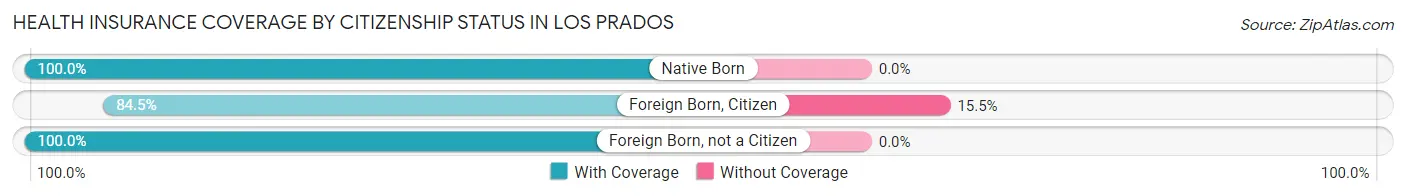
| Citizenship Status | With Coverage | Without Coverage |
| Native Born | 25 (100.0%) | 0 (0.0%) |
| Foreign Born, Citizen | 536 (84.5%) | 98 (15.5%) |
| Foreign Born, not a Citizen | 384 (100.0%) | 0 (0.0%) |
Health Insurance Coverage by Household Income in Los Prados
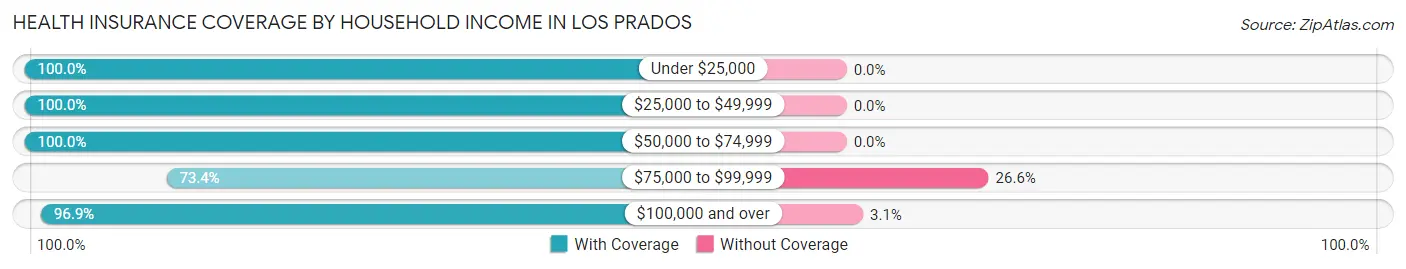
| Household Income | With Coverage | Without Coverage |
| Under $25,000 | 273 (100.0%) | 0 (0.0%) |
| $25,000 to $49,999 | 50 (100.0%) | 0 (0.0%) |
| $50,000 to $74,999 | 40 (100.0%) | 0 (0.0%) |
| $75,000 to $99,999 | 511 (73.4%) | 185 (26.6%) |
| $100,000 and over | 2,061 (96.9%) | 65 (3.1%) |
Public vs Private Health Insurance Coverage by Age in Los Prados
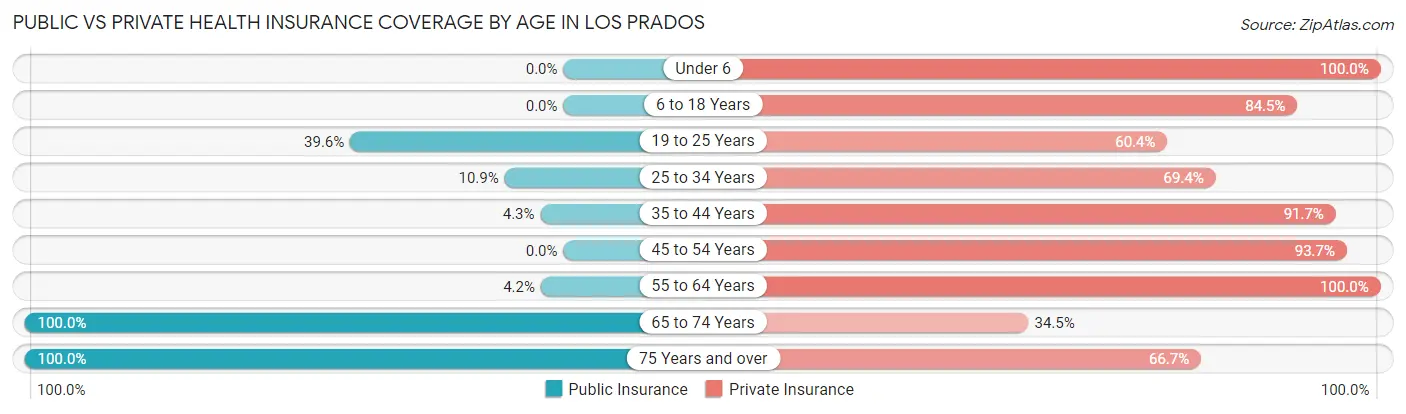
| Age Bracket | Public Insurance | Private Insurance |
| Under 6 | 0 (0.0%) | 25 (100.0%) |
| 6 to 18 Years | 0 (0.0%) | 536 (84.5%) |
| 19 to 25 Years | 152 (39.6%) | 232 (60.4%) |
| 25 to 34 Years | 36 (10.9%) | 229 (69.4%) |
| 35 to 44 Years | 24 (4.3%) | 517 (91.7%) |
| 45 to 54 Years | 0 (0.0%) | 598 (93.7%) |
| 55 to 64 Years | 20 (4.2%) | 477 (100.0%) |
| 65 to 74 Years | 58 (100.0%) | 20 (34.5%) |
| 75 Years and over | 75 (100.0%) | 50 (66.7%) |
| Total | 365 (11.5%) | 2,684 (84.3%) |
Disability Status by Sex by Age in Los Prados
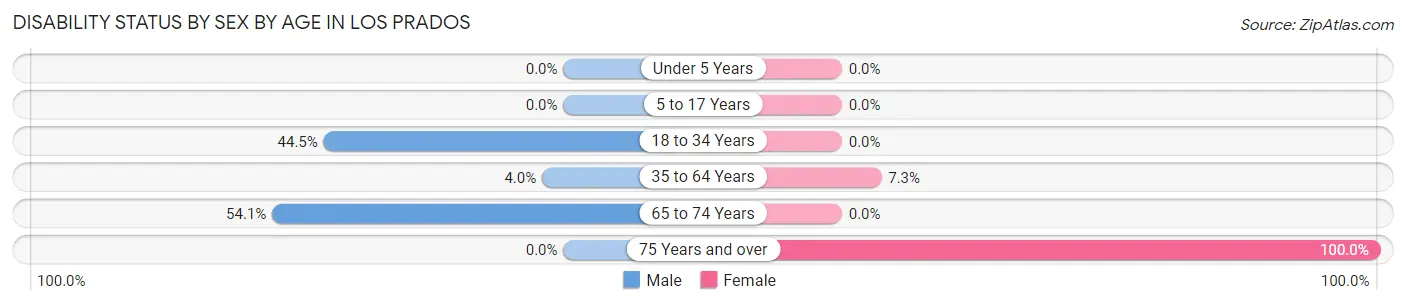
| Age Bracket | Male | Female |
| Under 5 Years | 0 (0.0%) | 0 (0.0%) |
| 5 to 17 Years | 0 (0.0%) | 0 (0.0%) |
| 18 to 34 Years | 97 (44.5%) | 0 (0.0%) |
| 35 to 64 Years | 34 (4.0%) | 60 (7.3%) |
| 65 to 74 Years | 20 (54.0%) | 0 (0.0%) |
| 75 Years and over | 0 (0.0%) | 75 (100.0%) |
Disability Class by Sex by Age in Los Prados
Disability Class: Hearing Difficulty
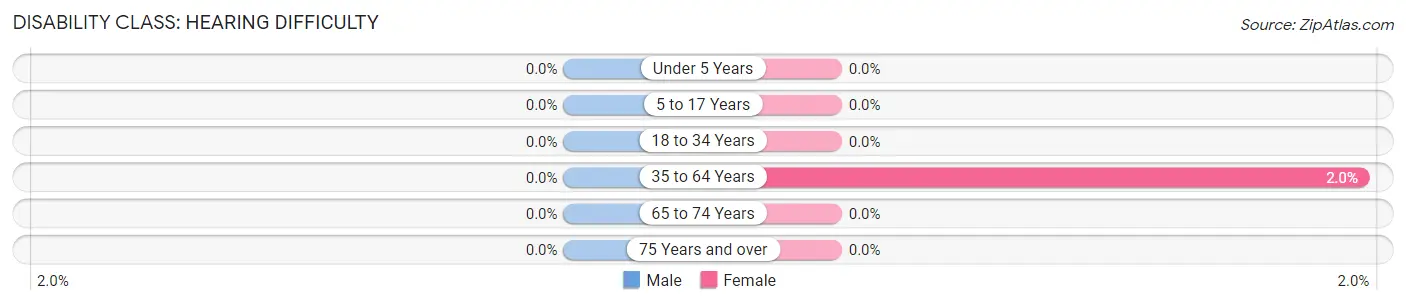
| Age Bracket | Male | Female |
| Under 5 Years | 0 (0.0%) | 0 (0.0%) |
| 5 to 17 Years | 0 (0.0%) | 0 (0.0%) |
| 18 to 34 Years | 0 (0.0%) | 0 (0.0%) |
| 35 to 64 Years | 0 (0.0%) | 16 (2.0%) |
| 65 to 74 Years | 0 (0.0%) | 0 (0.0%) |
| 75 Years and over | 0 (0.0%) | 0 (0.0%) |
Disability Class: Vision Difficulty
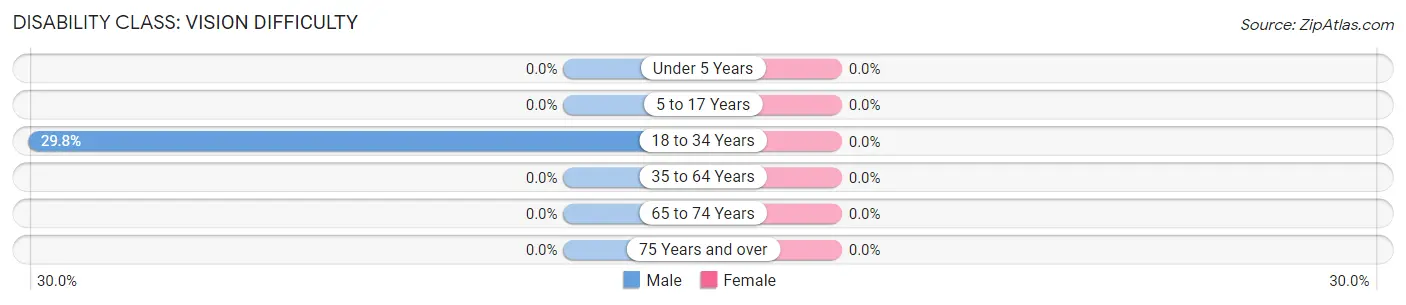
| Age Bracket | Male | Female |
| Under 5 Years | 0 (0.0%) | 0 (0.0%) |
| 5 to 17 Years | 0 (0.0%) | 0 (0.0%) |
| 18 to 34 Years | 65 (29.8%) | 0 (0.0%) |
| 35 to 64 Years | 0 (0.0%) | 0 (0.0%) |
| 65 to 74 Years | 0 (0.0%) | 0 (0.0%) |
| 75 Years and over | 0 (0.0%) | 0 (0.0%) |
Disability Class: Cognitive Difficulty
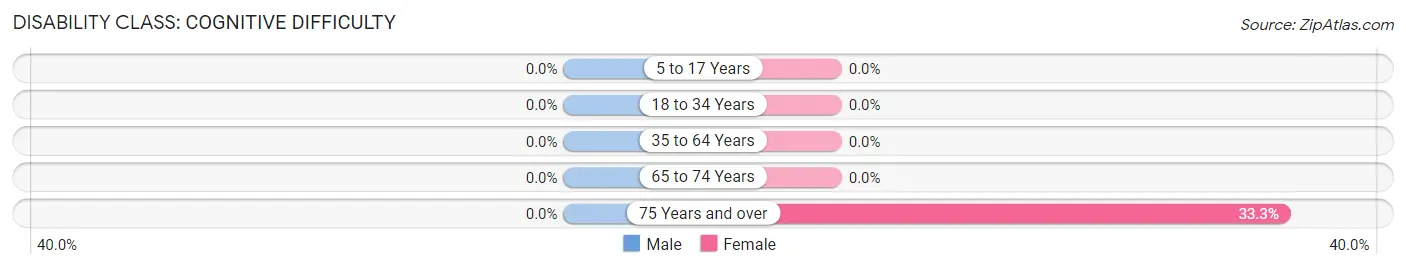
| Age Bracket | Male | Female |
| 5 to 17 Years | 0 (0.0%) | 0 (0.0%) |
| 18 to 34 Years | 0 (0.0%) | 0 (0.0%) |
| 35 to 64 Years | 0 (0.0%) | 0 (0.0%) |
| 65 to 74 Years | 0 (0.0%) | 0 (0.0%) |
| 75 Years and over | 0 (0.0%) | 25 (33.3%) |
Disability Class: Ambulatory Difficulty
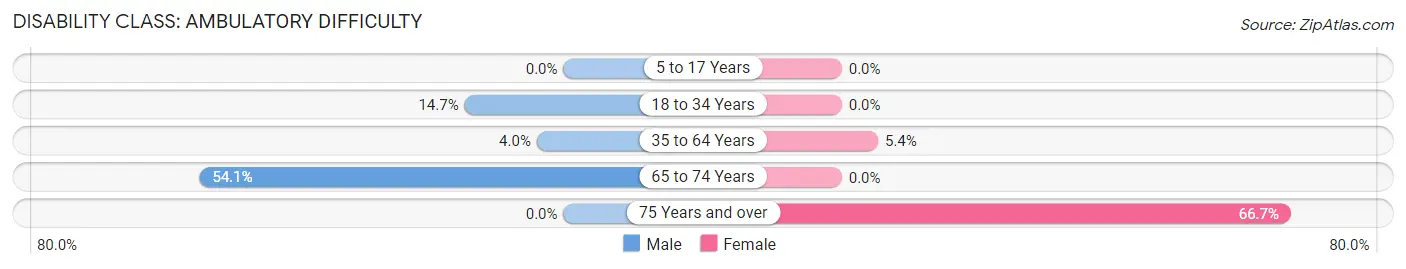
| Age Bracket | Male | Female |
| 5 to 17 Years | 0 (0.0%) | 0 (0.0%) |
| 18 to 34 Years | 32 (14.7%) | 0 (0.0%) |
| 35 to 64 Years | 34 (4.0%) | 44 (5.4%) |
| 65 to 74 Years | 20 (54.0%) | 0 (0.0%) |
| 75 Years and over | 0 (0.0%) | 50 (66.7%) |
Disability Class: Self-Care Difficulty
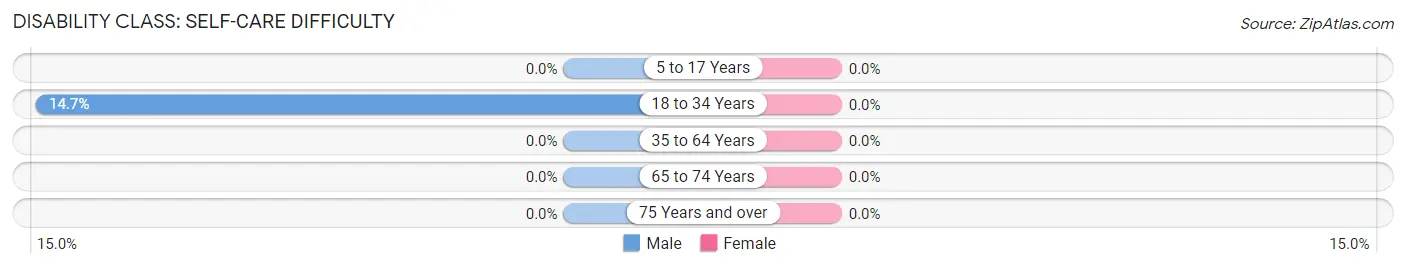
| Age Bracket | Male | Female |
| 5 to 17 Years | 0 (0.0%) | 0 (0.0%) |
| 18 to 34 Years | 32 (14.7%) | 0 (0.0%) |
| 35 to 64 Years | 0 (0.0%) | 0 (0.0%) |
| 65 to 74 Years | 0 (0.0%) | 0 (0.0%) |
| 75 Years and over | 0 (0.0%) | 0 (0.0%) |
Technology Access in Los Prados
Computing Device Access in Los Prados
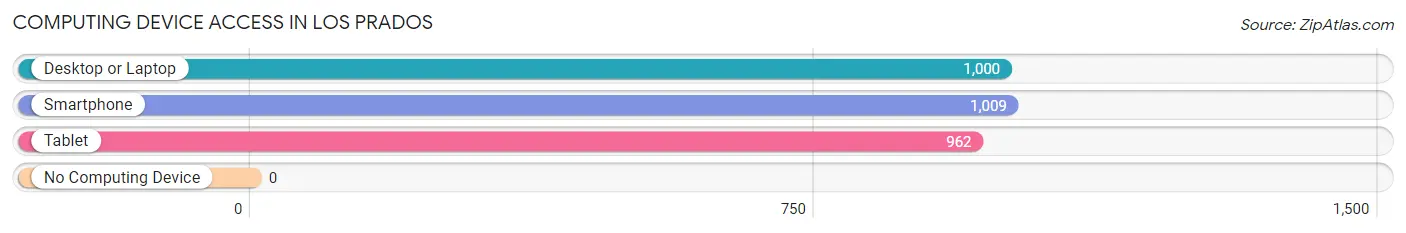
| Device Type | # Households | % Households |
| Desktop or Laptop | 1,000 | 95.5% |
| Smartphone | 1,009 | 96.4% |
| Tablet | 962 | 91.9% |
| No Computing Device | 0 | 0.0% |
| Total | 1,047 | 100.0% |
Internet Access in Los Prados
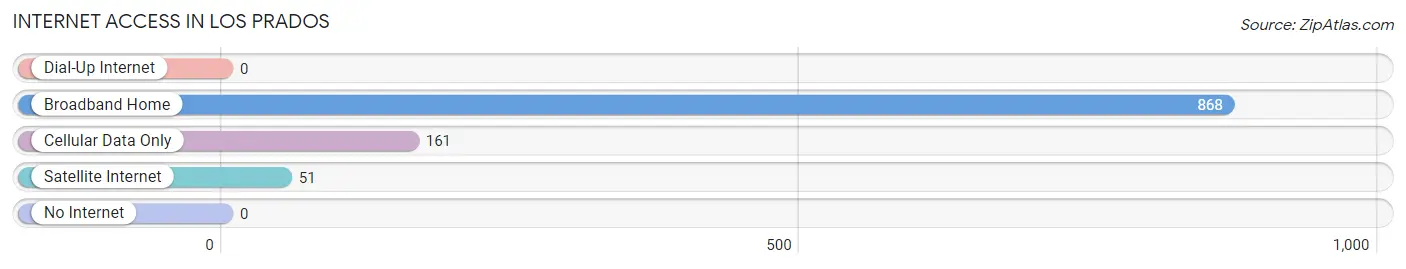
| Internet Type | # Households | % Households |
| Dial-Up Internet | 0 | 0.0% |
| Broadband Home | 868 | 82.9% |
| Cellular Data Only | 161 | 15.4% |
| Satellite Internet | 51 | 4.9% |
| No Internet | 0 | 0.0% |
| Total | 1,047 | 100.0% |
Los Prados Summary
History
Los Prados is a small town located in the municipality of San Lorenzo, Puerto Rico. It is located in the northern part of the island, in the foothills of the Cordillera Central mountain range. The town was founded in 1845 by a group of settlers from the nearby town of San Lorenzo. The settlers were looking for a place to settle and farm, and Los Prados was the perfect spot.
The town was named after the nearby Prado River, which runs through the area. The river was named after the Spanish word for “meadow”, which is what the area was known for. The settlers quickly began to cultivate the land and build homes. They also built a church, which still stands today.
The town grew slowly but steadily over the years, and by the early 20th century, it had become a thriving agricultural community. The main crops grown in the area were coffee, sugar cane, and tobacco. The town also had a small but vibrant commercial sector, with several stores and businesses.
In the 1950s, the town began to experience a period of rapid growth. This was due to the influx of people from other parts of the island who were looking for work and a better life. The population of Los Prados grew from around 500 in 1950 to over 3,000 by the year 2000.
Geography
Los Prados is located in the northern part of Puerto Rico, in the foothills of the Cordillera Central mountain range. The town is situated at an elevation of about 1,000 feet above sea level. The climate in the area is tropical, with temperatures ranging from the mid-70s to the mid-80s Fahrenheit.
The town is surrounded by lush green hills and mountains, and the Prado River runs through the area. The river is a popular spot for fishing and swimming. The town is also home to several small lakes, which are popular for swimming and boating.
Economy
The economy of Los Prados is largely based on agriculture. The main crops grown in the area are coffee, sugar cane, and tobacco. The town also has a small but vibrant commercial sector, with several stores and businesses.
Tourism is also an important part of the local economy. The town is home to several small hotels and guesthouses, as well as a few restaurants and bars. The town is also a popular destination for hikers and nature lovers, as it is surrounded by lush green hills and mountains.
Demographics
As of the 2010 census, the population of Los Prados was 3,845. The population is mostly of Puerto Rican descent, with a small percentage of people of other ethnic backgrounds. The median age in the town is 33.5 years, and the median household income is $20,000.
The town is served by several public schools, as well as a few private schools. The town also has a small hospital and several churches. The town is connected to the rest of the island by a network of roads and highways.
Common Questions
What is Per Capita Income in Los Prados?
Per Capita income in Los Prados is $44,984.
What is the Median Family Income in Los Prados?
Median Family Income in Los Prados is $111,630.
What is the Median Household income in Los Prados?
Median Household Income in Los Prados is $104,502.
What is Income or Wage Gap in Los Prados?
Income or Wage Gap in Los Prados is 26.9%.
Women in Los Prados earn 73.1 cents for every dollar earned by a man.
What is Inequality or Gini Index in Los Prados?
Inequality or Gini Index in Los Prados is 0.39.
What is the Total Population of Los Prados?
Total Population of Los Prados is 3,185.
What is the Total Male Population of Los Prados?
Total Male Population of Los Prados is 1,300.
What is the Total Female Population of Los Prados?
Total Female Population of Los Prados is 1,885.
What is the Ratio of Males per 100 Females in Los Prados?
There are 68.97 Males per 100 Females in Los Prados.
What is the Ratio of Females per 100 Males in Los Prados?
There are 145.00 Females per 100 Males in Los Prados.
What is the Median Population Age in Los Prados?
Median Population Age in Los Prados is 43.0 Years.
What is the Average Family Size in Los Prados
Average Family Size in Los Prados is 3.6 People.
What is the Average Household Size in Los Prados
Average Household Size in Los Prados is 3.0 People.
How Large is the Labor Force in Los Prados?
There are 1,792 People in the Labor Forcein in Los Prados.
What is the Percentage of People in the Labor Force in Los Prados?
68.2% of People are in the Labor Force in Los Prados.
What is the Unemployment Rate in Los Prados?
Unemployment Rate in Los Prados is 3.6%.