Juncal, PR Map & Demographics
Juncal Map
Juncal Overview
$9,206
PER CAPITA INCOME
$21,676
AVG FAMILY INCOME
$14,073
AVG HOUSEHOLD INCOME
50.0%
WAGE / INCOME GAP [ % ]
50.0¢/ $1
WAGE / INCOME GAP [ $ ]
0.45
INEQUALITY / GINI INDEX
1,181
TOTAL POPULATION
506
MALE POPULATION
675
FEMALE POPULATION
74.96
MALES / 100 FEMALES
133.40
FEMALES / 100 MALES
39.8
MEDIAN AGE
3.4
AVG FAMILY SIZE
2.7
AVG HOUSEHOLD SIZE
262
LABOR FORCE [ PEOPLE ]
28.3%
PERCENT IN LABOR FORCE
Income in Juncal
Income Overview in Juncal
Per Capita Income in Juncal is $9,206, while median incomes of families and households are $21,676 and $14,073 respectively.
| Characteristic | Number | Measure |
| Per Capita Income | 1,181 | $9,206 |
| Median Family Income | 271 | $21,676 |
| Mean Family Income | 271 | $26,245 |
| Median Household Income | 441 | $14,073 |
| Mean Household Income | 441 | $19,788 |
| Income Deficit | 271 | $0 |
| Wage / Income Gap (%) | 1,181 | 50.00% |
| Wage / Income Gap ($) | 1,181 | 50.00¢ per $1 |
| Gini / Inequality Index | 1,181 | 0.45 |
Earnings by Sex in Juncal
Average Earnings in Juncal are $15,000, $17,279 for men and $8,640 for women, a difference of 50.0%.
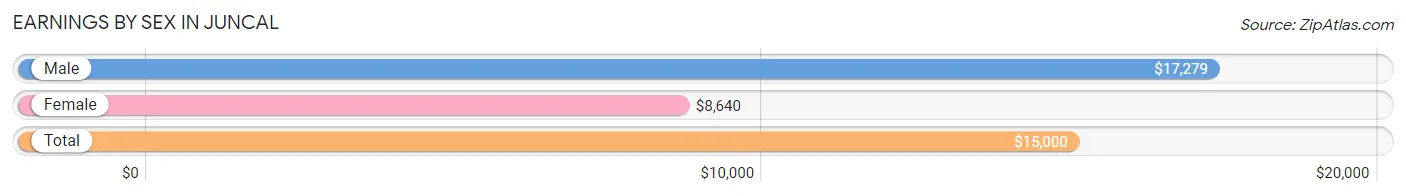
| Sex | Number | Average Earnings |
| Male | 214 (70.4%) | $17,279 |
| Female | 90 (29.6%) | $8,640 |
| Total | 304 (100.0%) | $15,000 |
Earnings by Sex by Income Bracket in Juncal
The most common earnings brackets in Juncal are $17,500 to $19,999 for men (38 | 17.8%) and $7,500 to $9,999 for women (57 | 63.3%).
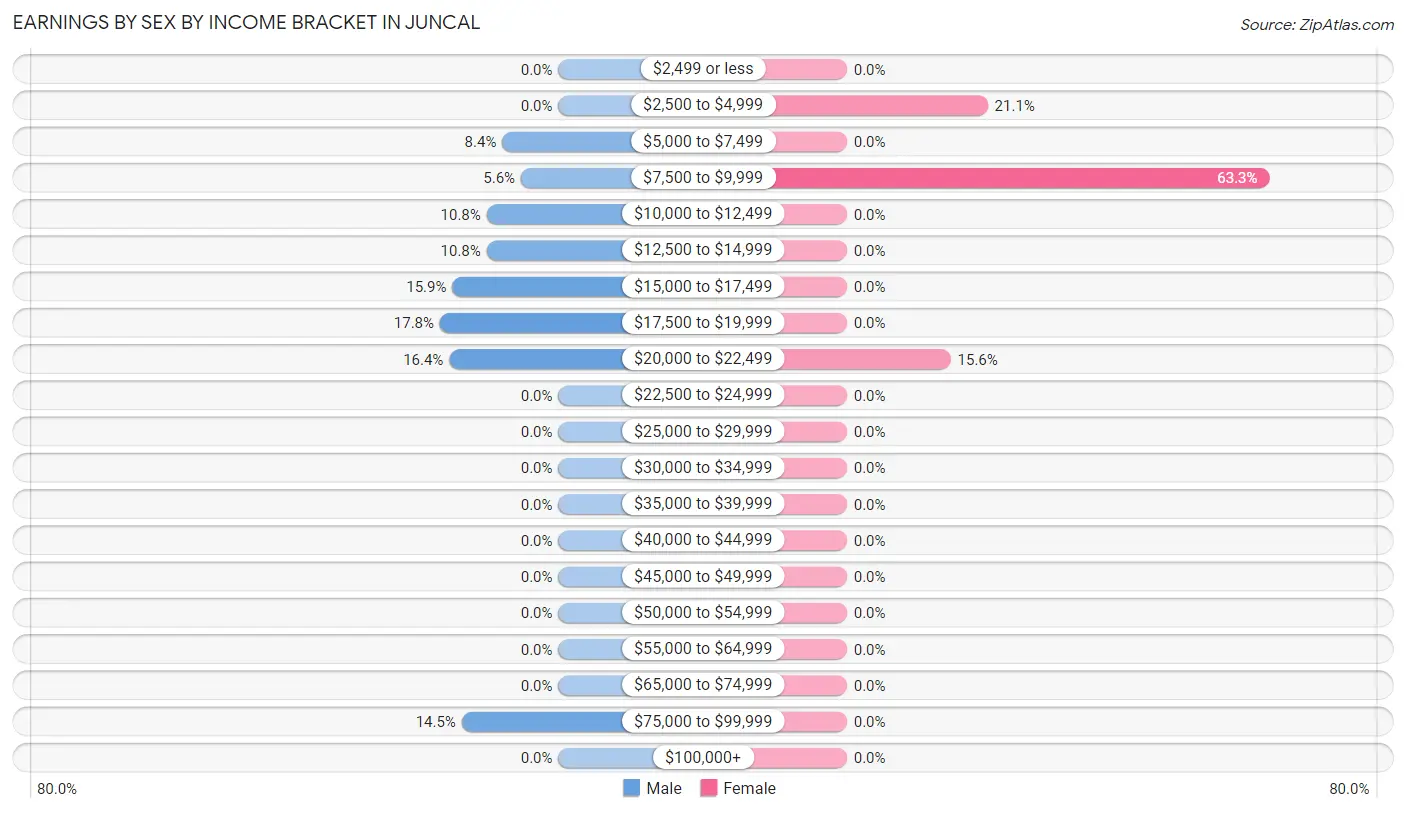
| Income | Male | Female |
| $2,499 or less | 0 (0.0%) | 0 (0.0%) |
| $2,500 to $4,999 | 0 (0.0%) | 19 (21.1%) |
| $5,000 to $7,499 | 18 (8.4%) | 0 (0.0%) |
| $7,500 to $9,999 | 12 (5.6%) | 57 (63.3%) |
| $10,000 to $12,499 | 23 (10.7%) | 0 (0.0%) |
| $12,500 to $14,999 | 23 (10.7%) | 0 (0.0%) |
| $15,000 to $17,499 | 34 (15.9%) | 0 (0.0%) |
| $17,500 to $19,999 | 38 (17.8%) | 0 (0.0%) |
| $20,000 to $22,499 | 35 (16.4%) | 14 (15.6%) |
| $22,500 to $24,999 | 0 (0.0%) | 0 (0.0%) |
| $25,000 to $29,999 | 0 (0.0%) | 0 (0.0%) |
| $30,000 to $34,999 | 0 (0.0%) | 0 (0.0%) |
| $35,000 to $39,999 | 0 (0.0%) | 0 (0.0%) |
| $40,000 to $44,999 | 0 (0.0%) | 0 (0.0%) |
| $45,000 to $49,999 | 0 (0.0%) | 0 (0.0%) |
| $50,000 to $54,999 | 0 (0.0%) | 0 (0.0%) |
| $55,000 to $64,999 | 0 (0.0%) | 0 (0.0%) |
| $65,000 to $74,999 | 0 (0.0%) | 0 (0.0%) |
| $75,000 to $99,999 | 31 (14.5%) | 0 (0.0%) |
| $100,000+ | 0 (0.0%) | 0 (0.0%) |
| Total | 214 (100.0%) | 90 (100.0%) |
Earnings by Sex by Educational Attainment in Juncal
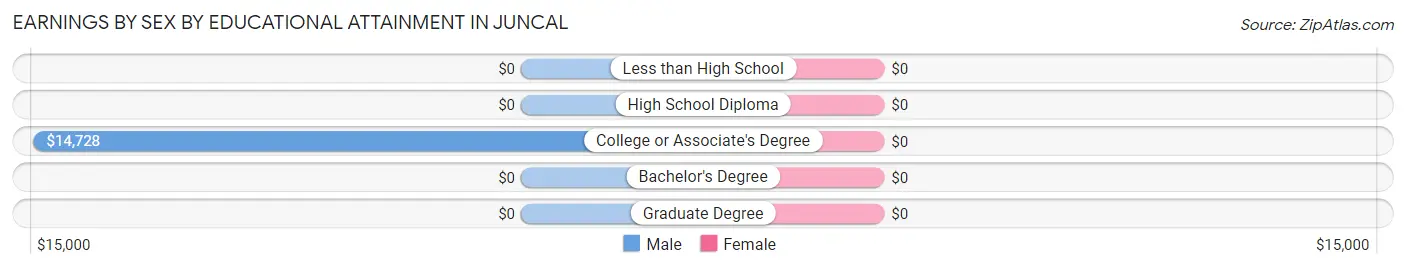
| Educational Attainment | Male Income | Female Income |
| Less than High School | - | - |
| High School Diploma | - | - |
| College or Associate's Degree | $14,728 | $0 |
| Bachelor's Degree | - | - |
| Graduate Degree | - | - |
| Total | $16,728 | $8,640 |
Family Income in Juncal
Family Income Brackets in Juncal
According to the Juncal family income data, there are 66 families falling into the $15,000 to $24,999 income range, which is the most common income bracket and makes up 24.3% of all families.
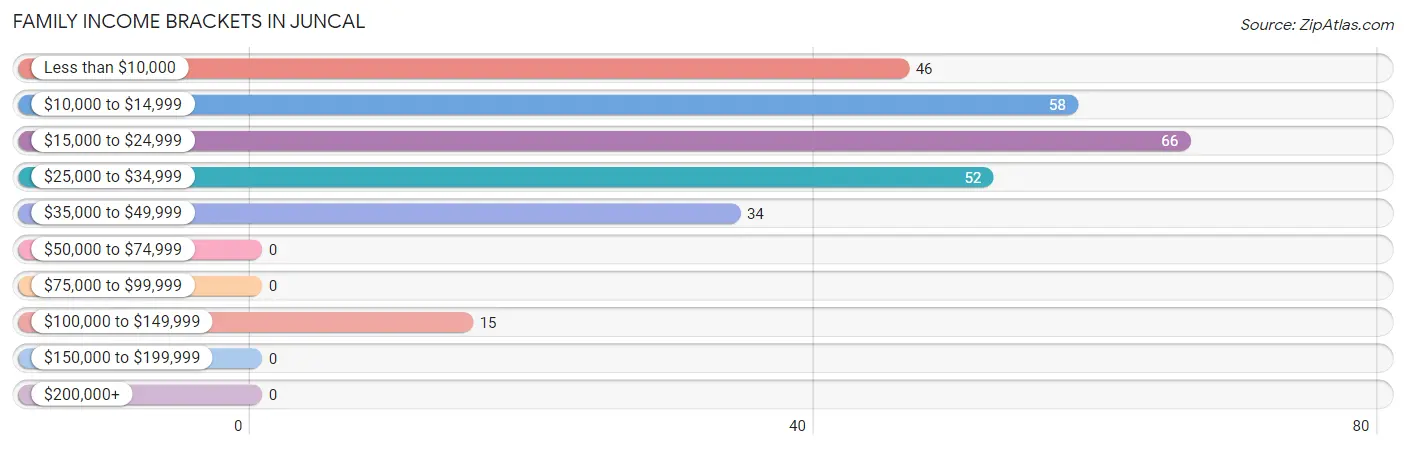
| Income Bracket | # Families | % Families |
| Less than $10,000 | 46 | 17.0% |
| $10,000 to $14,999 | 58 | 21.4% |
| $15,000 to $24,999 | 66 | 24.4% |
| $25,000 to $34,999 | 52 | 19.2% |
| $35,000 to $49,999 | 34 | 12.5% |
| $50,000 to $74,999 | 0 | 0.0% |
| $75,000 to $99,999 | 0 | 0.0% |
| $100,000 to $149,999 | 15 | 5.5% |
| $150,000 to $199,999 | 0 | 0.0% |
| $200,000+ | 0 | 0.0% |
Family Income by Famaliy Size in Juncal
2-person families (140 | 51.7%) account for the highest median family income in Juncal with $24,474 per family, while 2-person families (140 | 51.7%) have the highest median income of $12,237 per family member.
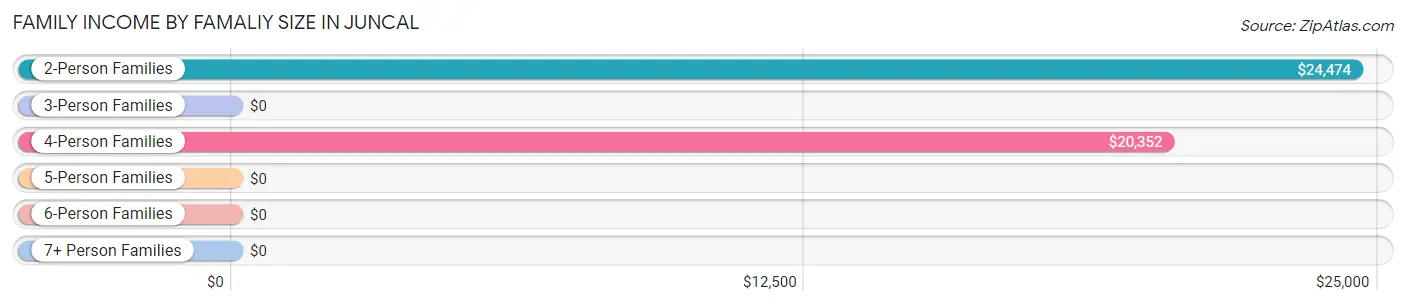
| Income Bracket | # Families | Median Income |
| 2-Person Families | 140 (51.7%) | $24,474 |
| 3-Person Families | 58 (21.4%) | $0 |
| 4-Person Families | 55 (20.3%) | $20,352 |
| 5-Person Families | 18 (6.6%) | $0 |
| 6-Person Families | 0 (0.0%) | $0 |
| 7+ Person Families | 0 (0.0%) | $0 |
| Total | 271 (100.0%) | $21,676 |
Family Income by Number of Earners in Juncal
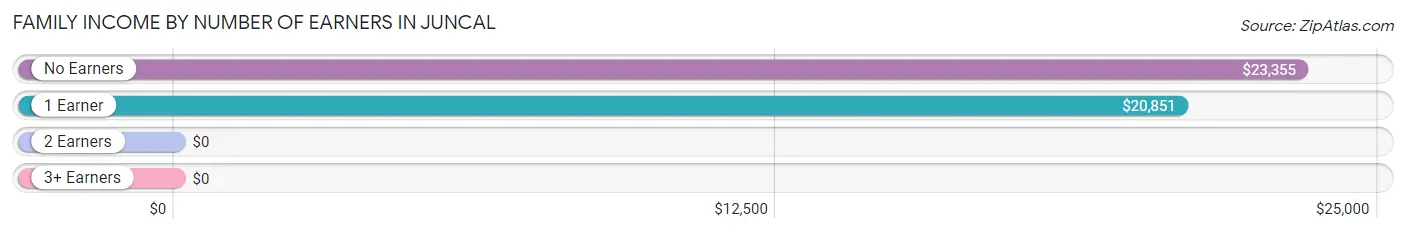
| Number of Earners | # Families | Median Income |
| No Earners | 93 (34.3%) | $23,355 |
| 1 Earner | 160 (59.0%) | $20,851 |
| 2 Earners | 18 (6.6%) | $0 |
| 3+ Earners | 0 (0.0%) | $0 |
| Total | 271 (100.0%) | $21,676 |
Household Income in Juncal
Household Income Brackets in Juncal
With 152 households falling in the category, the less than $10,000 income range is the most frequent in Juncal, accounting for 34.5% of all households.
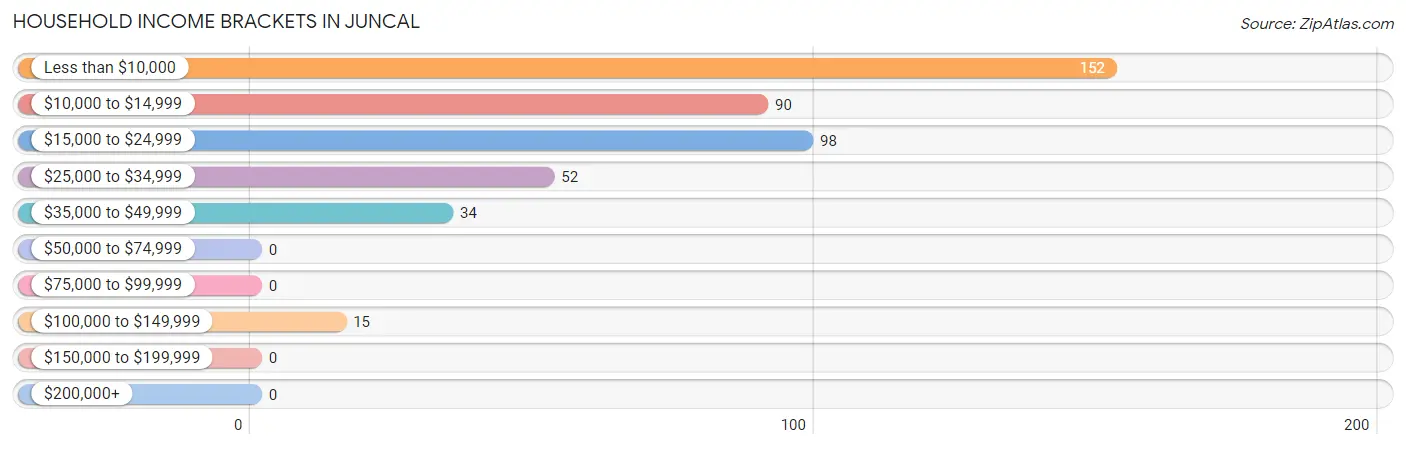
| Income Bracket | # Households | % Households |
| Less than $10,000 | 152 | 34.5% |
| $10,000 to $14,999 | 90 | 20.4% |
| $15,000 to $24,999 | 98 | 22.2% |
| $25,000 to $34,999 | 52 | 11.8% |
| $35,000 to $49,999 | 34 | 7.7% |
| $50,000 to $74,999 | 0 | 0.0% |
| $75,000 to $99,999 | 0 | 0.0% |
| $100,000 to $149,999 | 15 | 3.4% |
| $150,000 to $199,999 | 0 | 0.0% |
| $200,000+ | 0 | 0.0% |
Household Income by Householder Age in Juncal
The median household income in Juncal is $14,073, with the highest median household income of $21,587 found in the 45 to 64 years age bracket for the primary householder. A total of 83 households (18.8%) fall into this category.
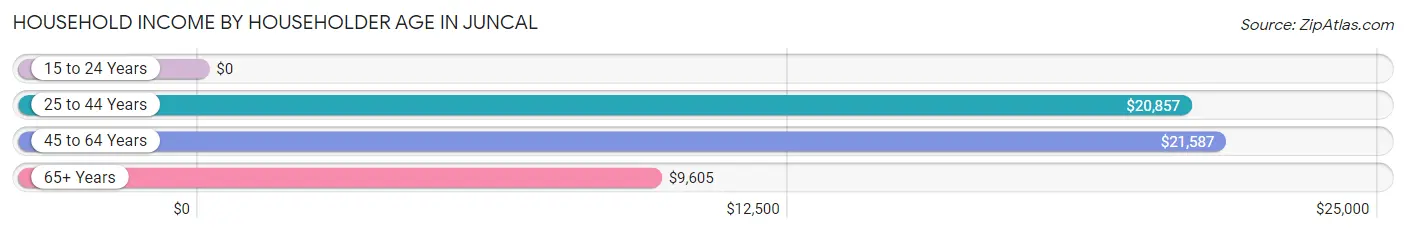
| Income Bracket | # Households | Median Income |
| 15 to 24 Years | 0 (0.0%) | $0 |
| 25 to 44 Years | 152 (34.5%) | $20,857 |
| 45 to 64 Years | 83 (18.8%) | $21,587 |
| 65+ Years | 206 (46.7%) | $9,605 |
| Total | 441 (100.0%) | $14,073 |
Poverty in Juncal
Income Below Poverty by Sex and Age in Juncal
With 65.2% poverty level for males and 76.2% for females among the residents of Juncal, under 5 year old males and under 5 year old females are the most vulnerable to poverty, with 47 males (100.0%) and 47 females (100.0%) in their respective age groups living below the poverty level.
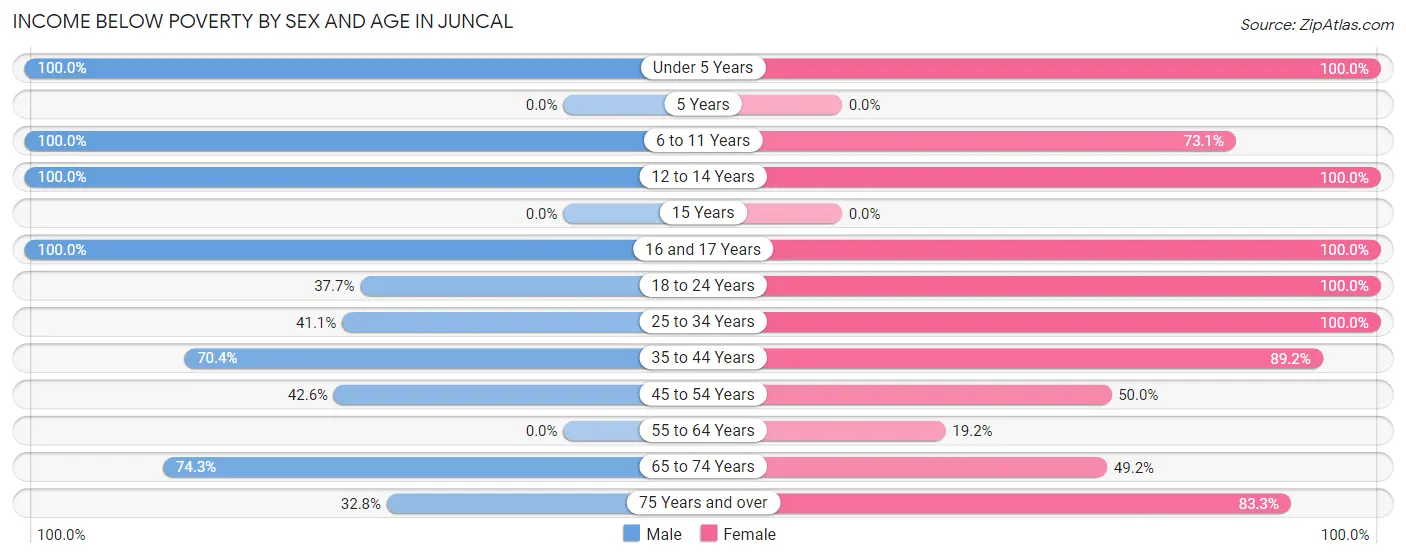
| Age Bracket | Male | Female |
| Under 5 Years | 47 (100.0%) | 47 (100.0%) |
| 5 Years | 0 (0.0%) | 0 (0.0%) |
| 6 to 11 Years | 24 (100.0%) | 49 (73.1%) |
| 12 to 14 Years | 29 (100.0%) | 42 (100.0%) |
| 15 Years | 0 (0.0%) | 0 (0.0%) |
| 16 and 17 Years | 49 (100.0%) | 28 (100.0%) |
| 18 to 24 Years | 23 (37.7%) | 20 (100.0%) |
| 25 to 34 Years | 23 (41.1%) | 48 (100.0%) |
| 35 to 44 Years | 38 (70.4%) | 141 (89.2%) |
| 45 to 54 Years | 23 (42.6%) | 14 (50.0%) |
| 55 to 64 Years | 0 (0.0%) | 15 (19.2%) |
| 65 to 74 Years | 55 (74.3%) | 31 (49.2%) |
| 75 Years and over | 19 (32.8%) | 75 (83.3%) |
| Total | 330 (65.2%) | 510 (76.2%) |
Income Above Poverty by Sex and Age in Juncal
According to the poverty statistics in Juncal, males aged 75 years and over and females aged 55 to 64 years are the age groups that are most secure financially, with 67.2% of males and 80.8% of females in these age groups living above the poverty line.
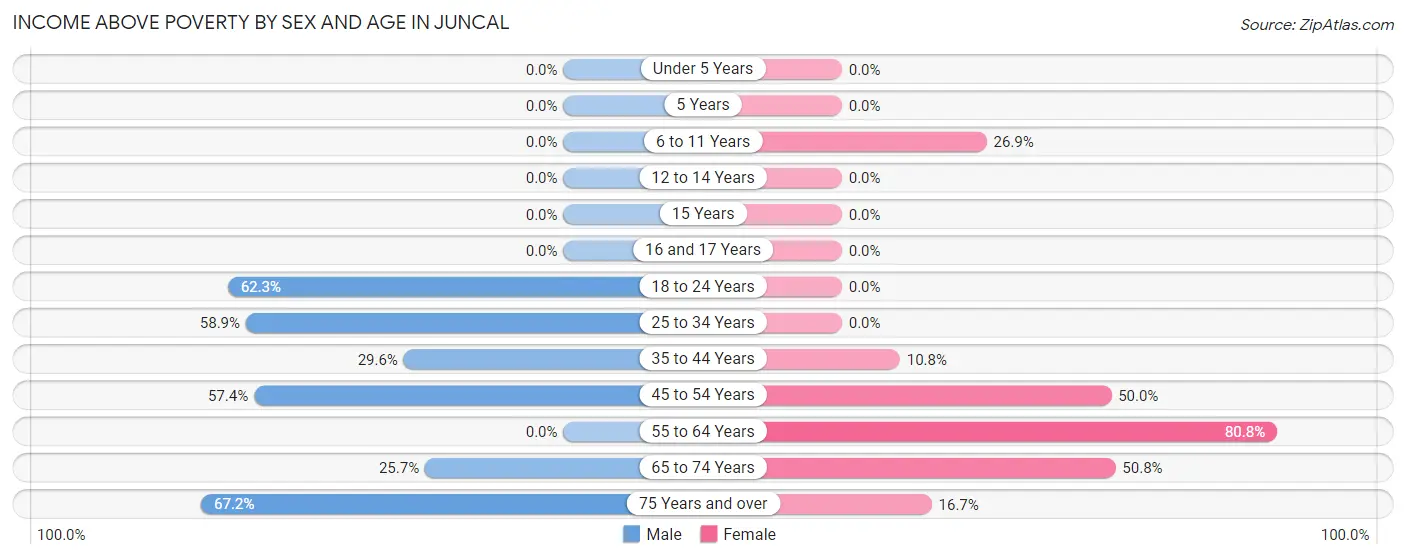
| Age Bracket | Male | Female |
| Under 5 Years | 0 (0.0%) | 0 (0.0%) |
| 5 Years | 0 (0.0%) | 0 (0.0%) |
| 6 to 11 Years | 0 (0.0%) | 18 (26.9%) |
| 12 to 14 Years | 0 (0.0%) | 0 (0.0%) |
| 15 Years | 0 (0.0%) | 0 (0.0%) |
| 16 and 17 Years | 0 (0.0%) | 0 (0.0%) |
| 18 to 24 Years | 38 (62.3%) | 0 (0.0%) |
| 25 to 34 Years | 33 (58.9%) | 0 (0.0%) |
| 35 to 44 Years | 16 (29.6%) | 17 (10.8%) |
| 45 to 54 Years | 31 (57.4%) | 14 (50.0%) |
| 55 to 64 Years | 0 (0.0%) | 63 (80.8%) |
| 65 to 74 Years | 19 (25.7%) | 32 (50.8%) |
| 75 Years and over | 39 (67.2%) | 15 (16.7%) |
| Total | 176 (34.8%) | 159 (23.8%) |
Income Below Poverty Among Married-Couple Families in Juncal
The poverty statistics for married-couple families in Juncal show that 46.2% or 60 of the total 130 families live below the poverty line. Families with 1 or 2 children have the highest poverty rate of 65.3%, comprising of 32 families. On the other hand, families with no children have the lowest poverty rate of 34.6%, which includes 28 families.
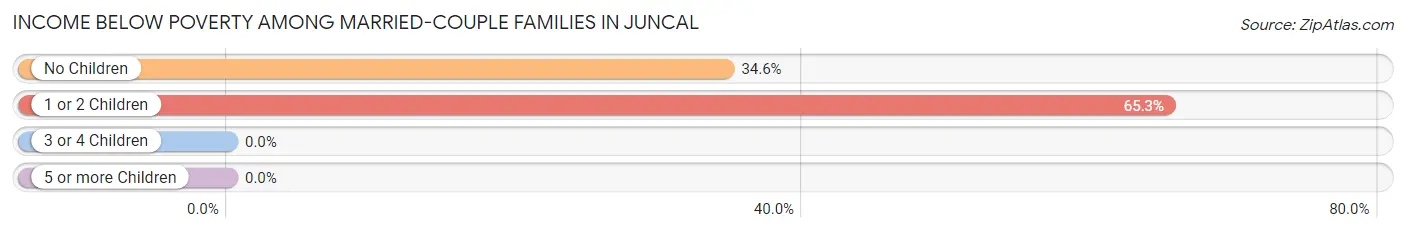
| Children | Above Poverty | Below Poverty |
| No Children | 53 (65.4%) | 28 (34.6%) |
| 1 or 2 Children | 17 (34.7%) | 32 (65.3%) |
| 3 or 4 Children | 0 (0.0%) | 0 (0.0%) |
| 5 or more Children | 0 (0.0%) | 0 (0.0%) |
| Total | 70 (53.8%) | 60 (46.2%) |
Income Below Poverty Among Single-Parent Households in Juncal
According to the poverty data in Juncal, 77.9% or 53 single-father households and 56.2% or 41 single-mother households are living below the poverty line. Among single-father households, those with 1 or 2 children have the highest poverty rate, with 41 households (100.0%) experiencing poverty. Likewise, among single-mother households, those with 1 or 2 children have the highest poverty rate, with 18 households (100.0%) falling below the poverty line.
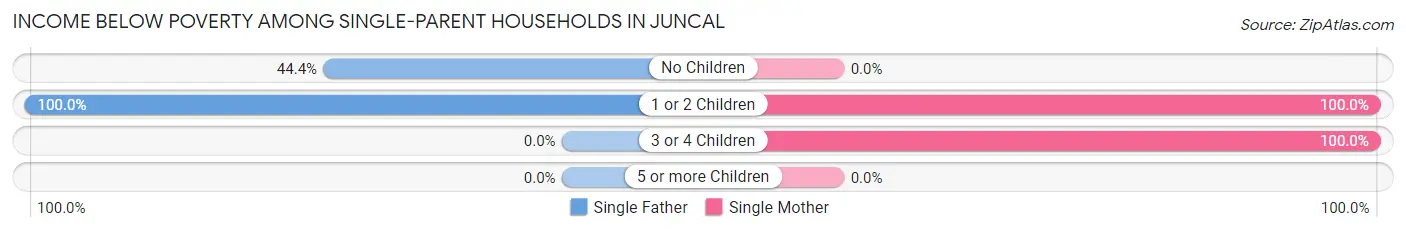
| Children | Single Father | Single Mother |
| No Children | 12 (44.4%) | 0 (0.0%) |
| 1 or 2 Children | 41 (100.0%) | 18 (100.0%) |
| 3 or 4 Children | 0 (0.0%) | 23 (100.0%) |
| 5 or more Children | 0 (0.0%) | 0 (0.0%) |
| Total | 53 (77.9%) | 41 (56.2%) |
Income Below Poverty Among Married-Couple vs Single-Parent Households in Juncal
The poverty data for Juncal shows that 60 of the married-couple family households (46.2%) and 94 of the single-parent households (66.7%) are living below the poverty level. Within the married-couple family households, those with 1 or 2 children have the highest poverty rate, with 32 households (65.3%) falling below the poverty line. Among the single-parent households, those with 1 or 2 children have the highest poverty rate, with 59 household (100.0%) living below poverty.
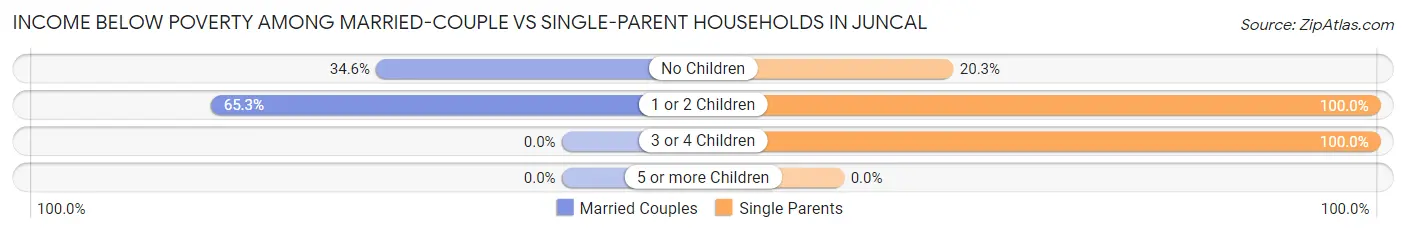
| Children | Married-Couple Families | Single-Parent Households |
| No Children | 28 (34.6%) | 12 (20.3%) |
| 1 or 2 Children | 32 (65.3%) | 59 (100.0%) |
| 3 or 4 Children | 0 (0.0%) | 23 (100.0%) |
| 5 or more Children | 0 (0.0%) | 0 (0.0%) |
| Total | 60 (46.2%) | 94 (66.7%) |
Race in Juncal
The most populous races in Juncal are Hispanic or Latino (1,127 | 95.4%), White / Caucasian (947 | 80.2%), and Two or more Races (109 | 9.2%).
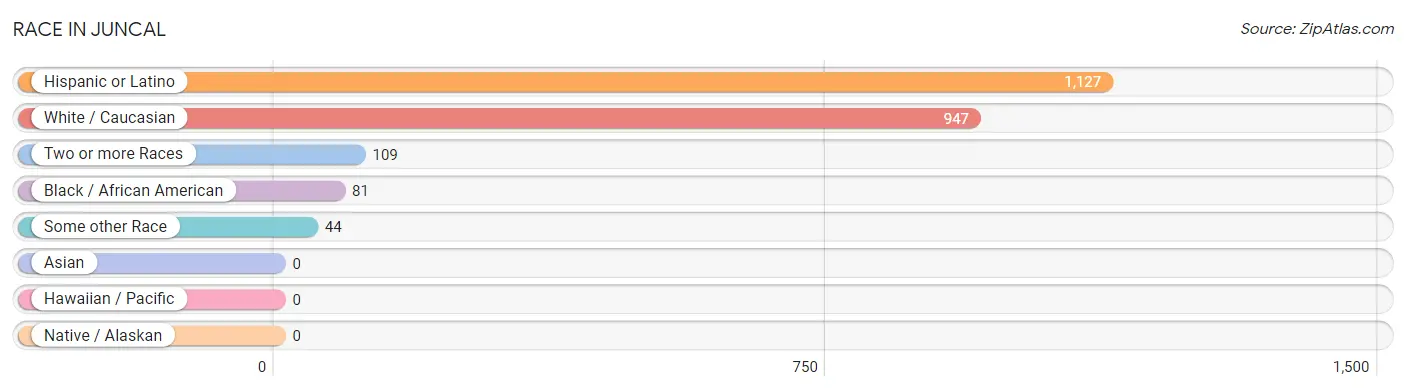
| Race | # Population | % Population |
| Asian | 0 | 0.0% |
| Black / African American | 81 | 6.9% |
| Hawaiian / Pacific | 0 | 0.0% |
| Hispanic or Latino | 1,127 | 95.4% |
| Native / Alaskan | 0 | 0.0% |
| White / Caucasian | 947 | 80.2% |
| Two or more Races | 109 | 9.2% |
| Some other Race | 44 | 3.7% |
| Total | 1,181 | 100.0% |
Ancestry in Juncal
The most populous ancestries reported in Juncal are Puerto Rican (1,127 | 95.4%), Central American Indian (109 | 9.2%), and American (42 | 3.6%), together accounting for 108.2% of all Juncal residents.
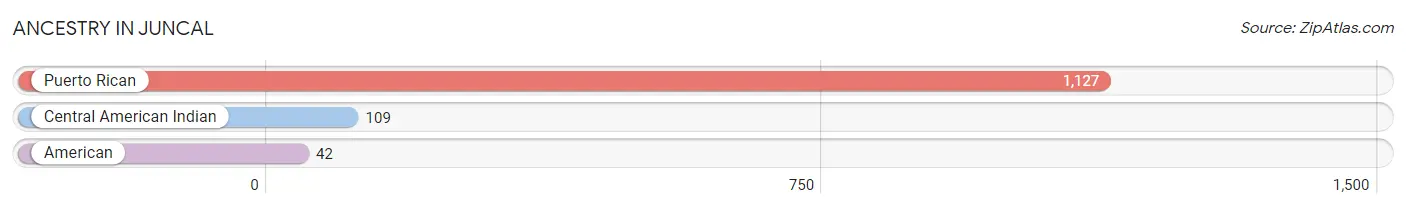
| Ancestry | # Population | % Population |
| American | 42 | 3.6% |
| Central American Indian | 109 | 9.2% |
| Puerto Rican | 1,127 | 95.4% | View All 3 Rows |
Immigrants in Juncal

| Immigration Origin | # Population | % Population | View All 0 Rows |
Sex and Age in Juncal
Sex and Age in Juncal
The most populous age groups in Juncal are 15 to 19 Years (72 | 14.2%) for men and 40 to 44 Years (99 | 14.7%) for women.
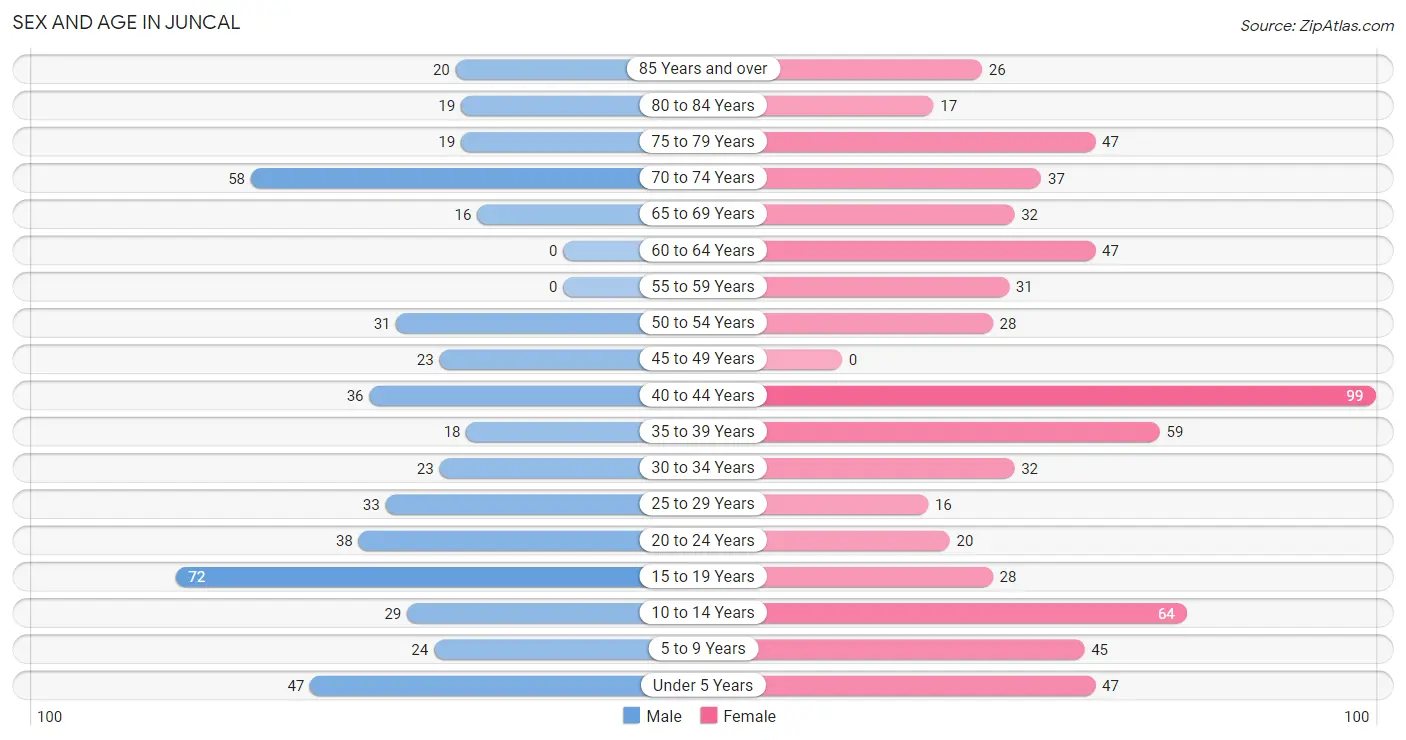
| Age Bracket | Male | Female |
| Under 5 Years | 47 (9.3%) | 47 (7.0%) |
| 5 to 9 Years | 24 (4.7%) | 45 (6.7%) |
| 10 to 14 Years | 29 (5.7%) | 64 (9.5%) |
| 15 to 19 Years | 72 (14.2%) | 28 (4.2%) |
| 20 to 24 Years | 38 (7.5%) | 20 (3.0%) |
| 25 to 29 Years | 33 (6.5%) | 16 (2.4%) |
| 30 to 34 Years | 23 (4.5%) | 32 (4.7%) |
| 35 to 39 Years | 18 (3.6%) | 59 (8.7%) |
| 40 to 44 Years | 36 (7.1%) | 99 (14.7%) |
| 45 to 49 Years | 23 (4.5%) | 0 (0.0%) |
| 50 to 54 Years | 31 (6.1%) | 28 (4.2%) |
| 55 to 59 Years | 0 (0.0%) | 31 (4.6%) |
| 60 to 64 Years | 0 (0.0%) | 47 (7.0%) |
| 65 to 69 Years | 16 (3.2%) | 32 (4.7%) |
| 70 to 74 Years | 58 (11.5%) | 37 (5.5%) |
| 75 to 79 Years | 19 (3.7%) | 47 (7.0%) |
| 80 to 84 Years | 19 (3.7%) | 17 (2.5%) |
| 85 Years and over | 20 (4.0%) | 26 (3.8%) |
| Total | 506 (100.0%) | 675 (100.0%) |
Families and Households in Juncal
Median Family Size in Juncal
The median family size in Juncal is 3.41 persons per family, with single female/mother families (73 | 26.9%) accounting for the largest median family size of 4.25 persons per family. On the other hand, married-couple families (130 | 48.0%) represent the smallest median family size with 2.87 persons per family.
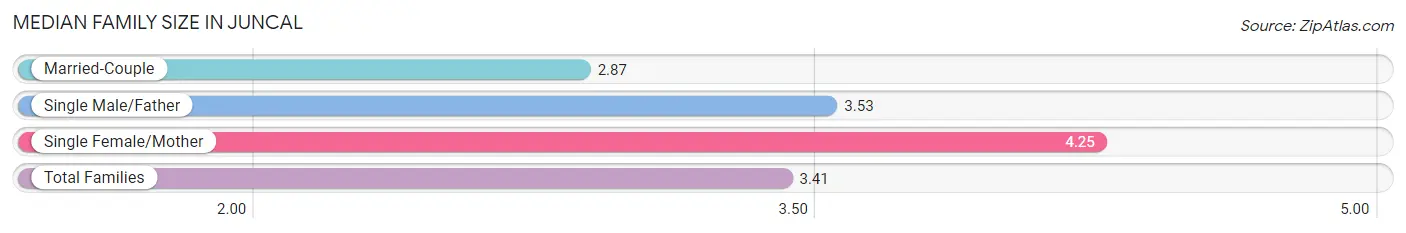
| Family Type | # Families | Family Size |
| Married-Couple | 130 (48.0%) | 2.87 |
| Single Male/Father | 68 (25.1%) | 3.53 |
| Single Female/Mother | 73 (26.9%) | 4.25 |
| Total Families | 271 (100.0%) | 3.41 |
Median Household Size in Juncal
The median household size in Juncal is 2.66 persons per household, with single male/father households (68 | 15.4%) accounting for the largest median household size of 4.28 persons per household. non-family households (170 | 38.6%) represent the smallest median household size with 1.18 persons per household.
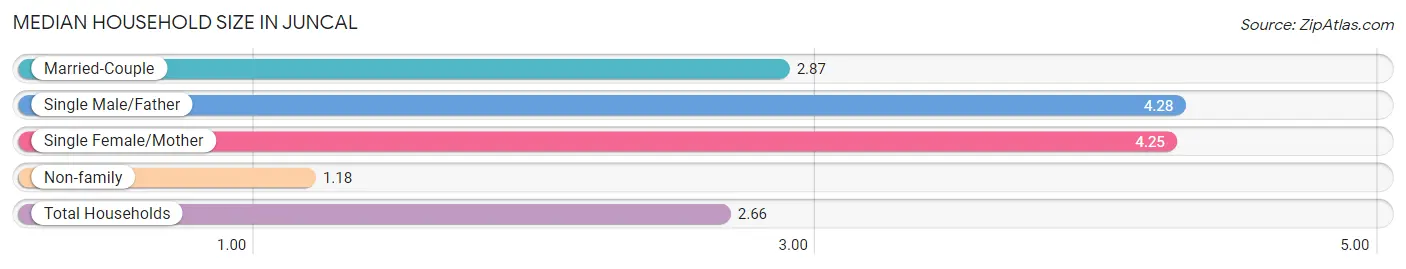
| Household Type | # Households | Household Size |
| Married-Couple | 130 (29.5%) | 2.87 |
| Single Male/Father | 68 (15.4%) | 4.28 |
| Single Female/Mother | 73 (16.6%) | 4.25 |
| Non-family | 170 (38.6%) | 1.18 |
| Total Households | 441 (100.0%) | 2.66 |
Household Size by Marriage Status in Juncal
Out of a total of 441 households in Juncal, 271 (61.5%) are family households, while 170 (38.6%) are nonfamily households. The most numerous type of family households are 2-person households, comprising 140, and the most common type of nonfamily households are 1-person households, comprising 135.
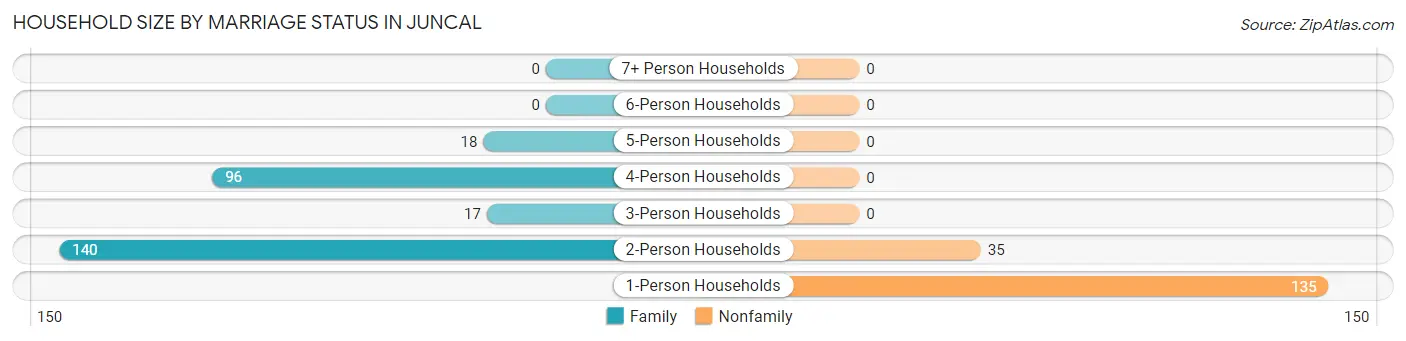
| Household Size | Family Households | Nonfamily Households |
| 1-Person Households | - | 135 (30.6%) |
| 2-Person Households | 140 (31.8%) | 35 (7.9%) |
| 3-Person Households | 17 (3.8%) | 0 (0.0%) |
| 4-Person Households | 96 (21.8%) | 0 (0.0%) |
| 5-Person Households | 18 (4.1%) | 0 (0.0%) |
| 6-Person Households | 0 (0.0%) | 0 (0.0%) |
| 7+ Person Households | 0 (0.0%) | 0 (0.0%) |
| Total | 271 (61.5%) | 170 (38.6%) |
Female Fertility in Juncal
Fertility by Age in Juncal
Average fertility rate in Juncal is 75.0 births per 1,000 women. Women in the age bracket of 35 to 50 years have the highest fertility rate with 120.0 births per 1,000 women. Women in the age bracket of 35 to 50 years acount for 100.0% of all women with births.
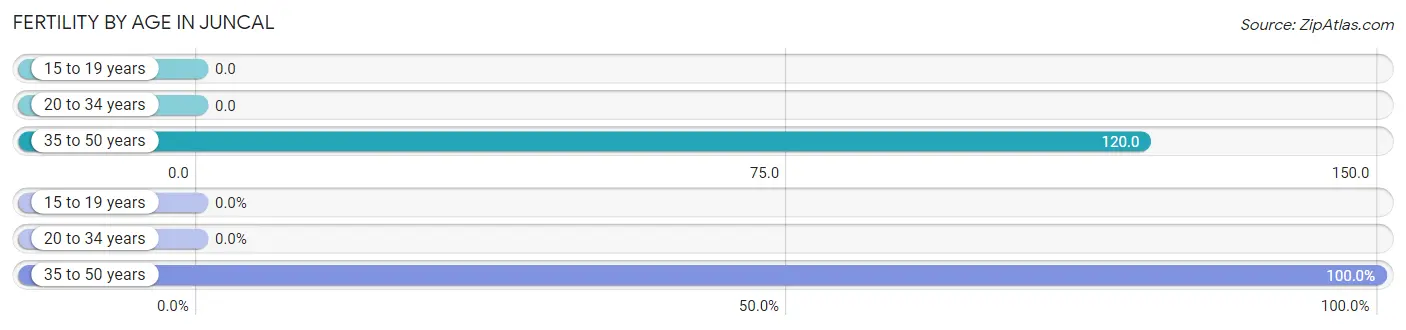
| Age Bracket | Women with Births | Births / 1,000 Women |
| 15 to 19 years | 0 (0.0%) | 0.0 |
| 20 to 34 years | 0 (0.0%) | 0.0 |
| 35 to 50 years | 19 (100.0%) | 120.0 |
| Total | 19 (100.0%) | 75.0 |
Fertility by Age by Marriage Status in Juncal
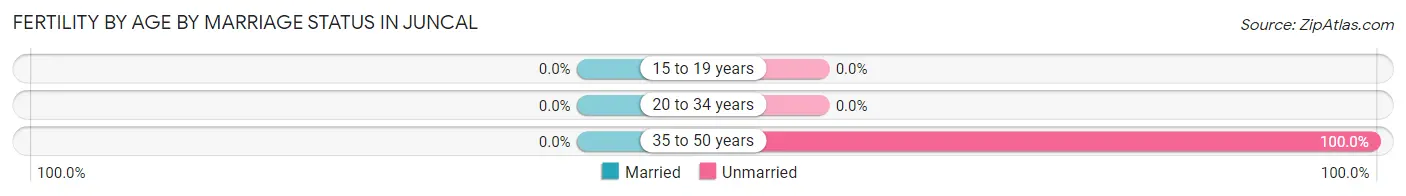
| Age Bracket | Married | Unmarried |
| 15 to 19 years | 0 (0.0%) | 0 (0.0%) |
| 20 to 34 years | 0 (0.0%) | 0 (0.0%) |
| 35 to 50 years | 0 (0.0%) | 19 (100.0%) |
| Total | 0 (0.0%) | 19 (100.0%) |
Fertility by Education in Juncal
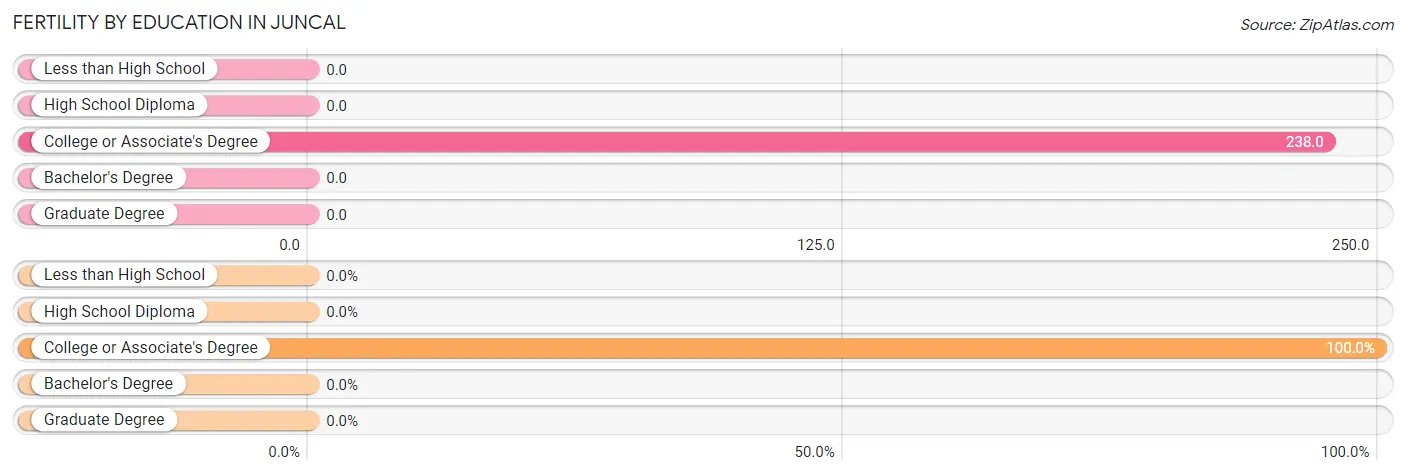
| Educational Attainment | Women with Births | Births / 1,000 Women |
| Less than High School | 0 (0.0%) | 0.0 |
| High School Diploma | 0 (0.0%) | 0.0 |
| College or Associate's Degree | 19 (100.0%) | 238.0 |
| Bachelor's Degree | 0 (0.0%) | 0.0 |
| Graduate Degree | 0 (0.0%) | 0.0 |
| Total | 19 (100.0%) | 75.0 |
Fertility by Education by Marriage Status in Juncal
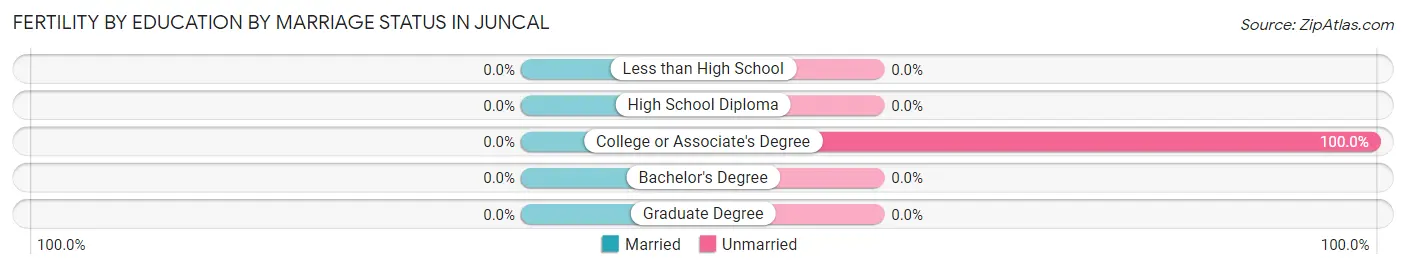
| Educational Attainment | Married | Unmarried |
| Less than High School | 0 (0.0%) | 0 (0.0%) |
| High School Diploma | 0 (0.0%) | 0 (0.0%) |
| College or Associate's Degree | 0 (0.0%) | 19 (100.0%) |
| Bachelor's Degree | 0 (0.0%) | 0 (0.0%) |
| Graduate Degree | 0 (0.0%) | 0 (0.0%) |
| Total | 0 (0.0%) | 19 (100.0%) |
Employment Characteristics in Juncal
Employment by Class of Employer in Juncal
Among the 231 employed individuals in Juncal, private company employees (107 | 46.3%), self-employed (not incorporated) (46 | 19.9%), and state government employees (46 | 19.9%) make up the most common classes of employment.
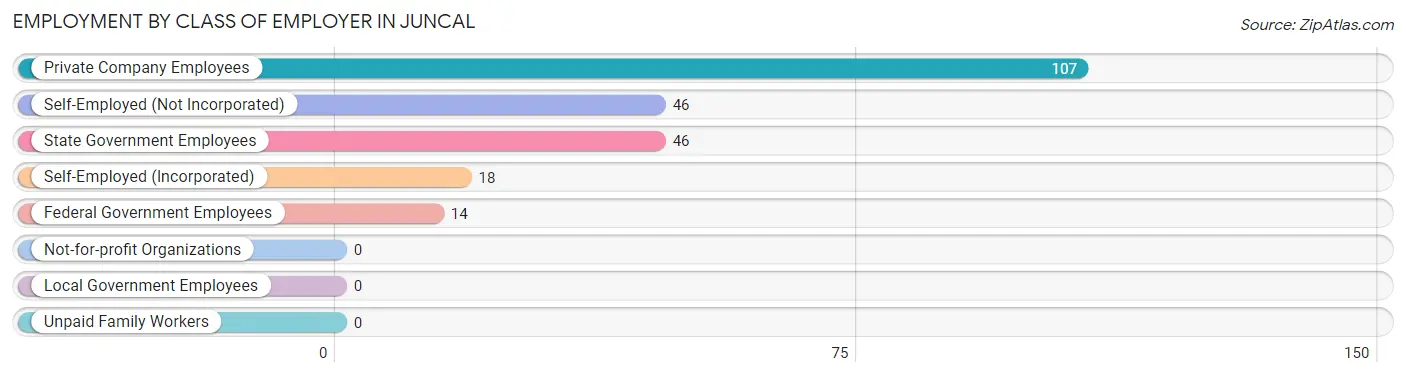
| Employer Class | # Employees | % Employees |
| Private Company Employees | 107 | 46.3% |
| Self-Employed (Incorporated) | 18 | 7.8% |
| Self-Employed (Not Incorporated) | 46 | 19.9% |
| Not-for-profit Organizations | 0 | 0.0% |
| Local Government Employees | 0 | 0.0% |
| State Government Employees | 46 | 19.9% |
| Federal Government Employees | 14 | 6.1% |
| Unpaid Family Workers | 0 | 0.0% |
| Total | 231 | 100.0% |
Employment Status by Age in Juncal
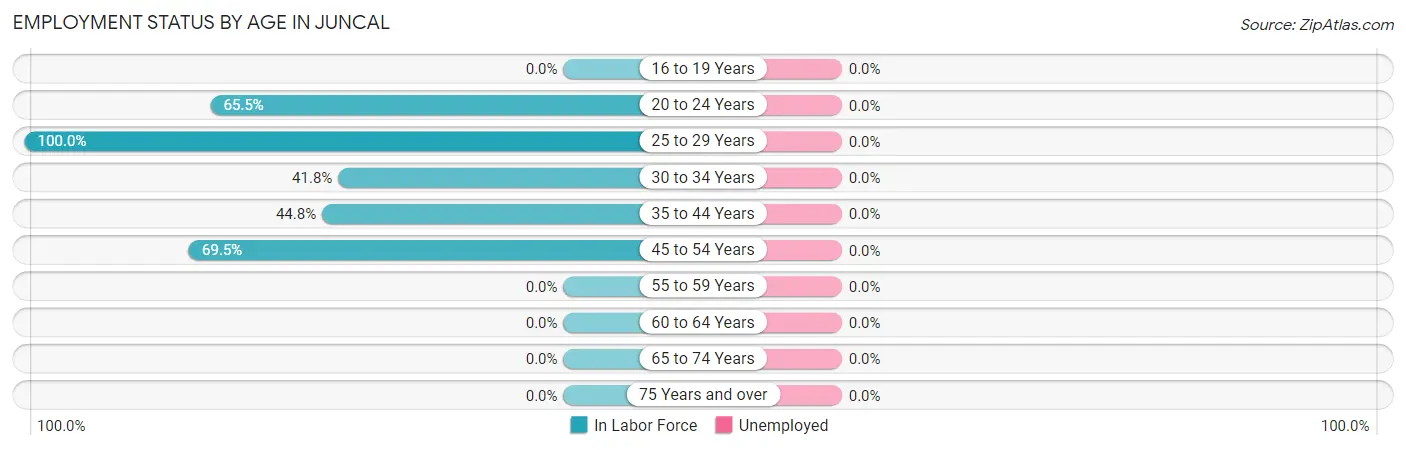
| Age Bracket | In Labor Force | Unemployed |
| 16 to 19 Years | 0 (0.0%) | 0 (0.0%) |
| 20 to 24 Years | 38 (65.5%) | 0 (0.0%) |
| 25 to 29 Years | 49 (100.0%) | 0 (0.0%) |
| 30 to 34 Years | 23 (41.8%) | 0 (0.0%) |
| 35 to 44 Years | 95 (44.8%) | 0 (0.0%) |
| 45 to 54 Years | 57 (69.5%) | 0 (0.0%) |
| 55 to 59 Years | 0 (0.0%) | 0 (0.0%) |
| 60 to 64 Years | 0 (0.0%) | 0 (0.0%) |
| 65 to 74 Years | 0 (0.0%) | 0 (0.0%) |
| 75 Years and over | 0 (0.0%) | 0 (0.0%) |
| Total | 262 (28.3%) | 0 (0.0%) |
Employment Status by Educational Attainment in Juncal
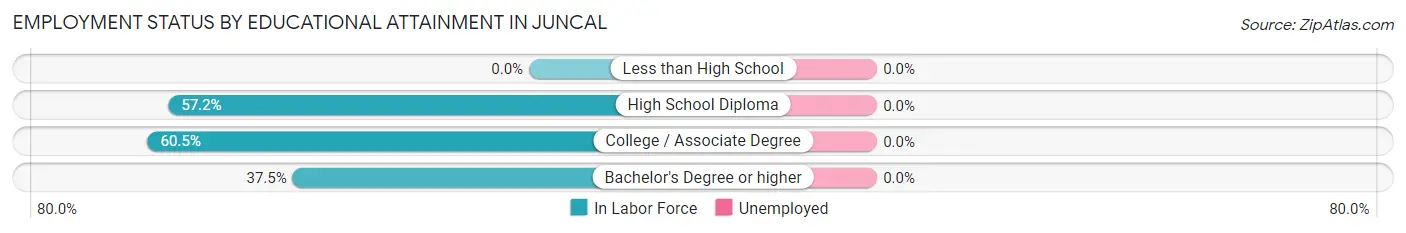
| Educational Attainment | In Labor Force | Unemployed |
| Less than High School | 0 (0.0%) | 0 (0.0%) |
| High School Diploma | 99 (57.2%) | 0 (0.0%) |
| College / Associate Degree | 95 (60.5%) | 0 (0.0%) |
| Bachelor's Degree or higher | 30 (37.5%) | 0 (0.0%) |
| Total | 224 (47.1%) | 0 (0.0%) |
Employment Occupations by Sex in Juncal
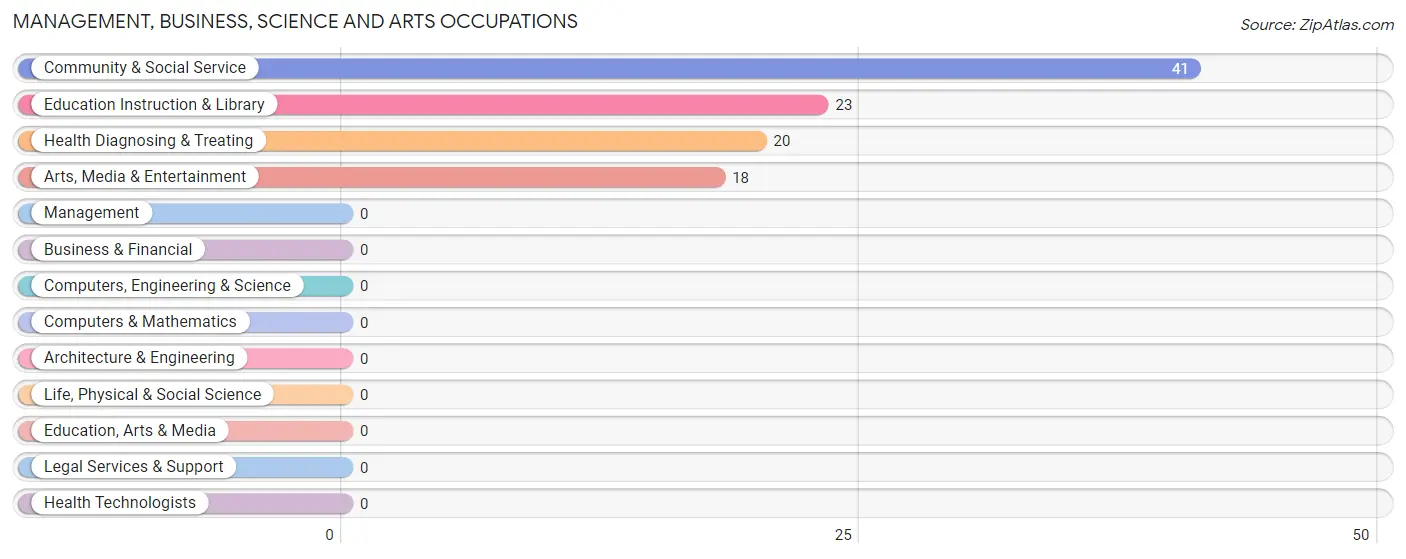
Management, Business, Science and Arts Occupations
The most common Management, Business, Science and Arts occupations in Juncal are Community & Social Service (41 | 15.7%), Education Instruction & Library (23 | 8.8%), Health Diagnosing & Treating (20 | 7.6%), and Arts, Media & Entertainment (18 | 6.9%).
Management, Business, Science and Arts Occupations by Sex
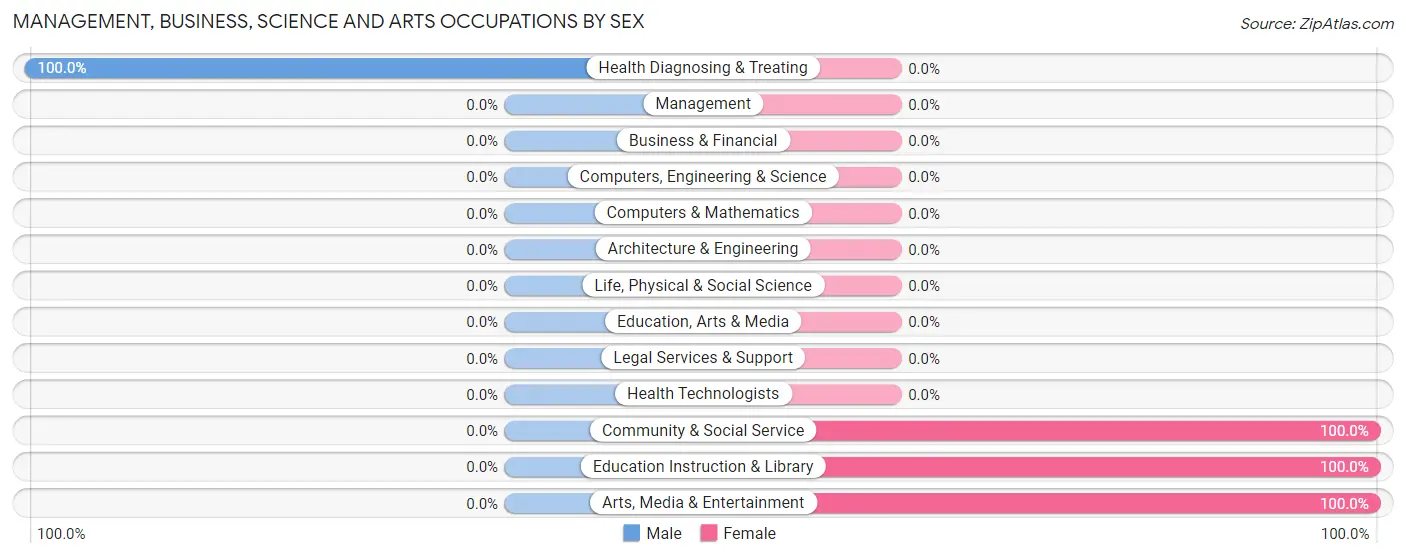
| Occupation | Male | Female |
| Management | 0 (0.0%) | 0 (0.0%) |
| Business & Financial | 0 (0.0%) | 0 (0.0%) |
| Computers, Engineering & Science | 0 (0.0%) | 0 (0.0%) |
| Computers & Mathematics | 0 (0.0%) | 0 (0.0%) |
| Architecture & Engineering | 0 (0.0%) | 0 (0.0%) |
| Life, Physical & Social Science | 0 (0.0%) | 0 (0.0%) |
| Community & Social Service | 0 (0.0%) | 41 (100.0%) |
| Education, Arts & Media | 0 (0.0%) | 0 (0.0%) |
| Legal Services & Support | 0 (0.0%) | 0 (0.0%) |
| Education Instruction & Library | 0 (0.0%) | 23 (100.0%) |
| Arts, Media & Entertainment | 0 (0.0%) | 18 (100.0%) |
| Health Diagnosing & Treating | 20 (100.0%) | 0 (0.0%) |
| Health Technologists | 0 (0.0%) | 0 (0.0%) |
| Total (Category) | 20 (32.8%) | 41 (67.2%) |
| Total (Overall) | 191 (72.9%) | 71 (27.1%) |
Services Occupations
The most common Services occupations in Juncal are Security & Protection (23 | 8.8%), and Law Enforcement (23 | 8.8%).
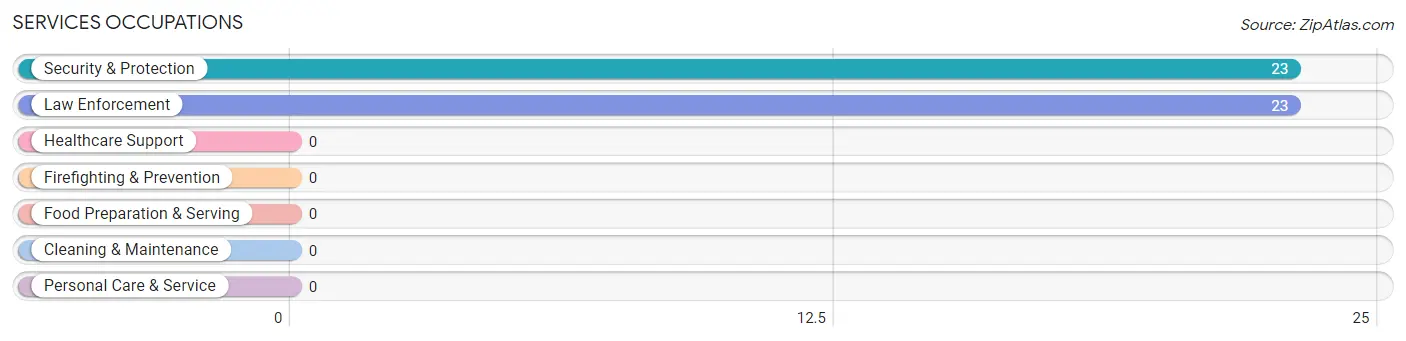
Services Occupations by Sex
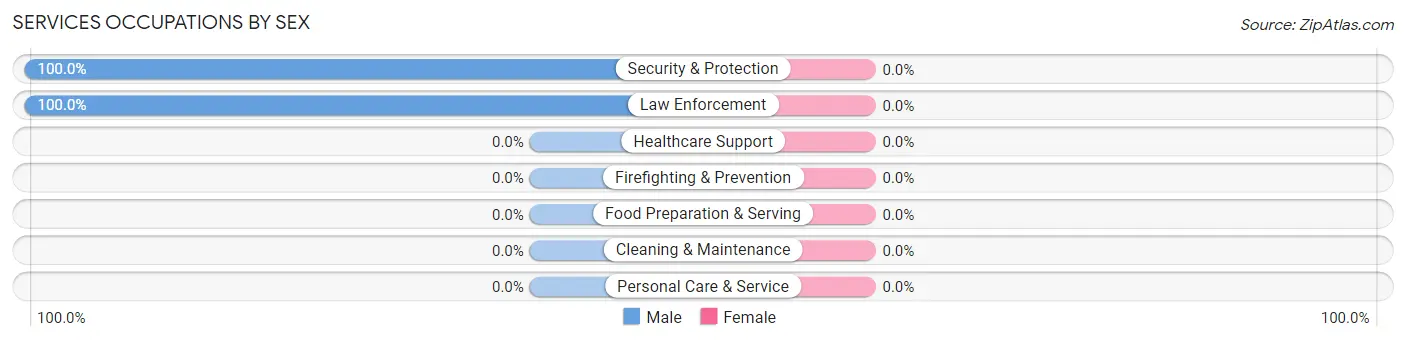
| Occupation | Male | Female |
| Healthcare Support | 0 (0.0%) | 0 (0.0%) |
| Security & Protection | 23 (100.0%) | 0 (0.0%) |
| Firefighting & Prevention | 0 (0.0%) | 0 (0.0%) |
| Law Enforcement | 23 (100.0%) | 0 (0.0%) |
| Food Preparation & Serving | 0 (0.0%) | 0 (0.0%) |
| Cleaning & Maintenance | 0 (0.0%) | 0 (0.0%) |
| Personal Care & Service | 0 (0.0%) | 0 (0.0%) |
| Total (Category) | 23 (100.0%) | 0 (0.0%) |
| Total (Overall) | 191 (72.9%) | 71 (27.1%) |
Sales and Office Occupations
The most common Sales and Office occupations in Juncal are Sales & Related (69 | 26.3%), and Office & Administration (30 | 11.5%).
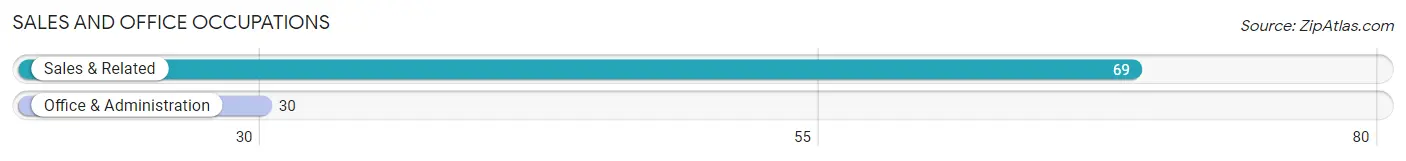
Sales and Office Occupations by Sex

| Occupation | Male | Female |
| Sales & Related | 69 (100.0%) | 0 (0.0%) |
| Office & Administration | 0 (0.0%) | 30 (100.0%) |
| Total (Category) | 69 (69.7%) | 30 (30.3%) |
| Total (Overall) | 191 (72.9%) | 71 (27.1%) |
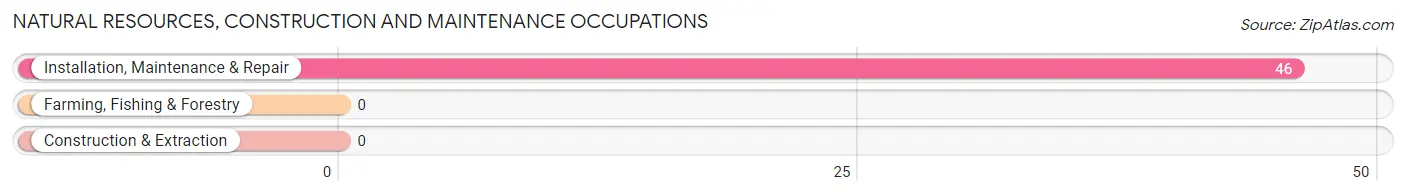
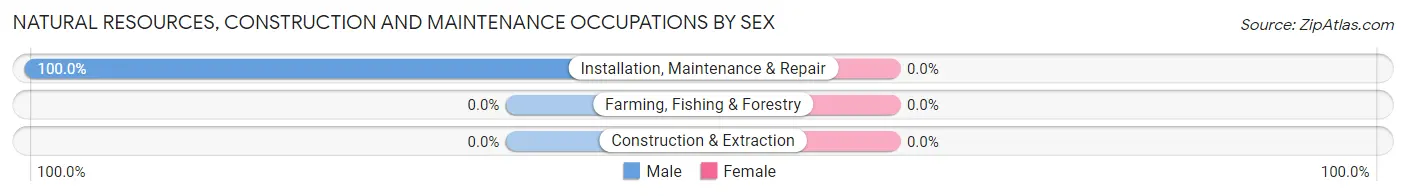
Natural Resources, Construction and Maintenance Occupations
The most common Natural Resources, Construction and Maintenance occupations in Juncal are , and Installation, Maintenance & Repair (46 | 17.6%).
Natural Resources, Construction and Maintenance Occupations by Sex
| Occupation | Male | Female |
| Farming, Fishing & Forestry | 0 (0.0%) | 0 (0.0%) |
| Construction & Extraction | 0 (0.0%) | 0 (0.0%) |
| Installation, Maintenance & Repair | 46 (100.0%) | 0 (0.0%) |
| Total (Category) | 46 (100.0%) | 0 (0.0%) |
| Total (Overall) | 191 (72.9%) | 71 (27.1%) |
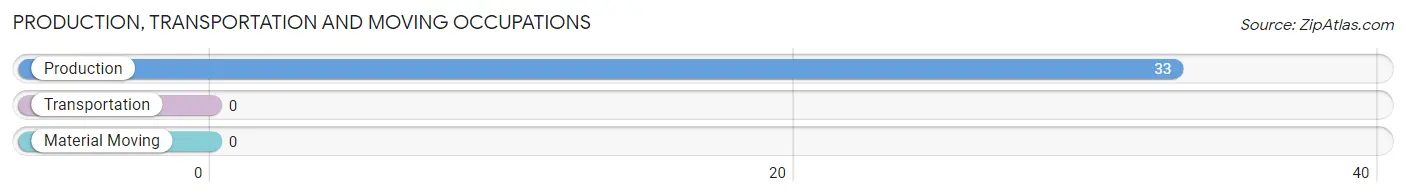
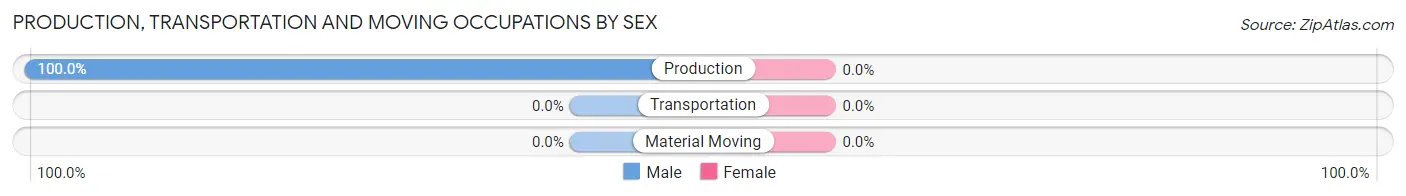
Production, Transportation and Moving Occupations
The most common Production, Transportation and Moving occupations in Juncal are , and Production (33 | 12.6%).
Production, Transportation and Moving Occupations by Sex
| Occupation | Male | Female |
| Production | 33 (100.0%) | 0 (0.0%) |
| Transportation | 0 (0.0%) | 0 (0.0%) |
| Material Moving | 0 (0.0%) | 0 (0.0%) |
| Total (Category) | 33 (100.0%) | 0 (0.0%) |
| Total (Overall) | 191 (72.9%) | 71 (27.1%) |
Employment Industries by Sex in Juncal
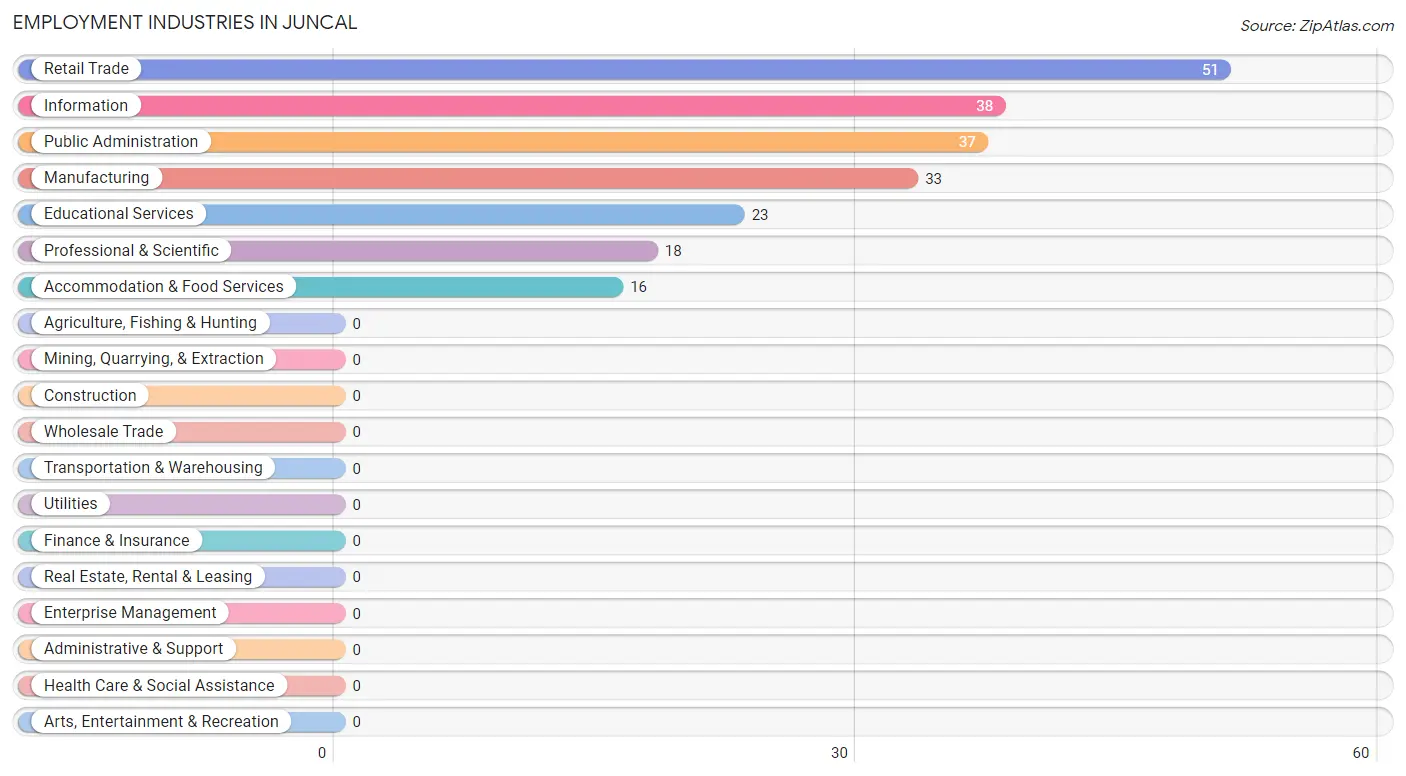
Employment Industries in Juncal
The major employment industries in Juncal include Retail Trade (51 | 19.5%), Information (38 | 14.5%), Public Administration (37 | 14.1%), Manufacturing (33 | 12.6%), and Educational Services (23 | 8.8%).
Employment Industries by Sex in Juncal
The Juncal industries that see more men than women are Manufacturing (100.0%), Retail Trade (100.0%), and Information (100.0%), whereas the industries that tend to have a higher number of women are Professional & Scientific (100.0%), Educational Services (100.0%), and Accommodation & Food Services (100.0%).
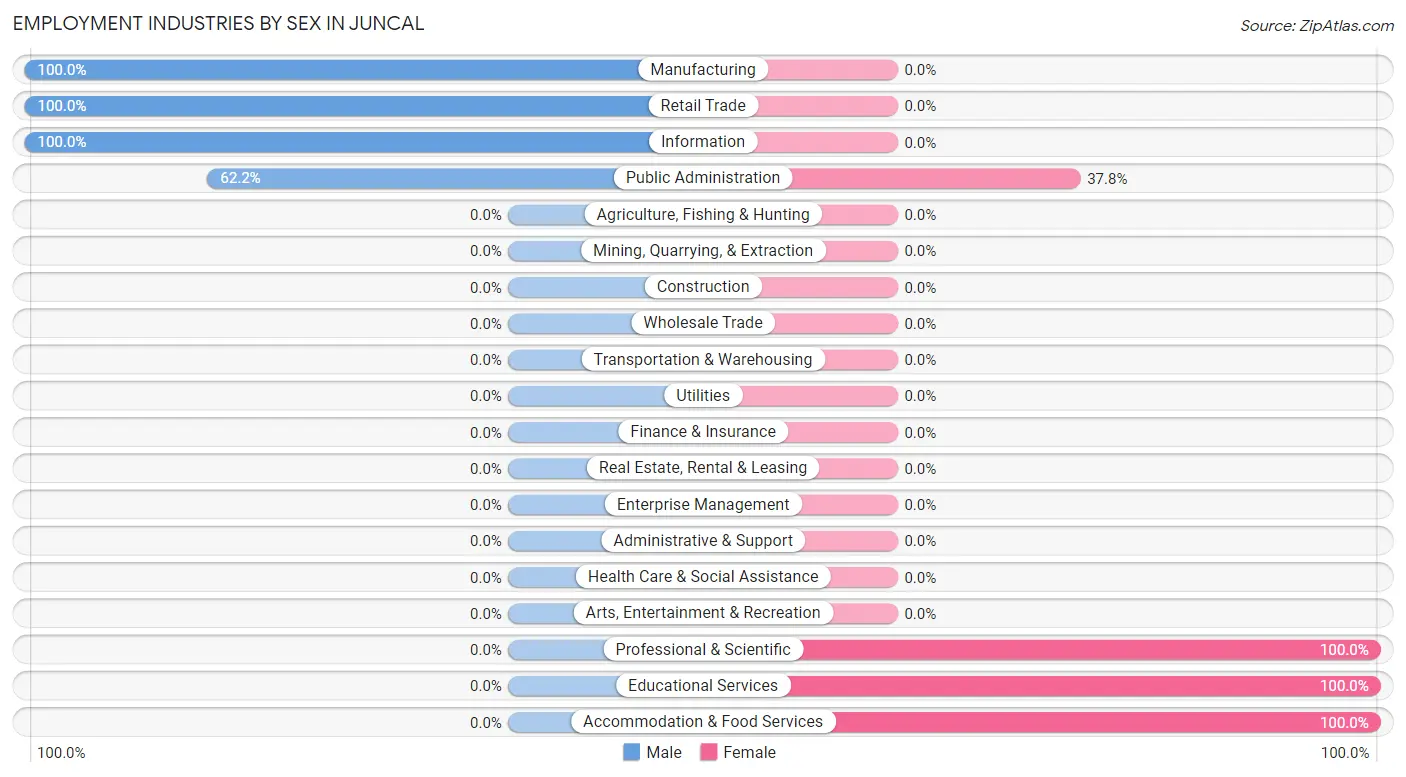
| Industry | Male | Female |
| Agriculture, Fishing & Hunting | 0 (0.0%) | 0 (0.0%) |
| Mining, Quarrying, & Extraction | 0 (0.0%) | 0 (0.0%) |
| Construction | 0 (0.0%) | 0 (0.0%) |
| Manufacturing | 33 (100.0%) | 0 (0.0%) |
| Wholesale Trade | 0 (0.0%) | 0 (0.0%) |
| Retail Trade | 51 (100.0%) | 0 (0.0%) |
| Transportation & Warehousing | 0 (0.0%) | 0 (0.0%) |
| Utilities | 0 (0.0%) | 0 (0.0%) |
| Information | 38 (100.0%) | 0 (0.0%) |
| Finance & Insurance | 0 (0.0%) | 0 (0.0%) |
| Real Estate, Rental & Leasing | 0 (0.0%) | 0 (0.0%) |
| Professional & Scientific | 0 (0.0%) | 18 (100.0%) |
| Enterprise Management | 0 (0.0%) | 0 (0.0%) |
| Administrative & Support | 0 (0.0%) | 0 (0.0%) |
| Educational Services | 0 (0.0%) | 23 (100.0%) |
| Health Care & Social Assistance | 0 (0.0%) | 0 (0.0%) |
| Arts, Entertainment & Recreation | 0 (0.0%) | 0 (0.0%) |
| Accommodation & Food Services | 0 (0.0%) | 16 (100.0%) |
| Public Administration | 23 (62.2%) | 14 (37.8%) |
| Total | 191 (72.9%) | 71 (27.1%) |
Education in Juncal
School Enrollment in Juncal
The most common levels of schooling among the 259 students in Juncal are middle school (93 | 35.9%), elementary school (69 | 26.6%), and high school (54 | 20.8%).
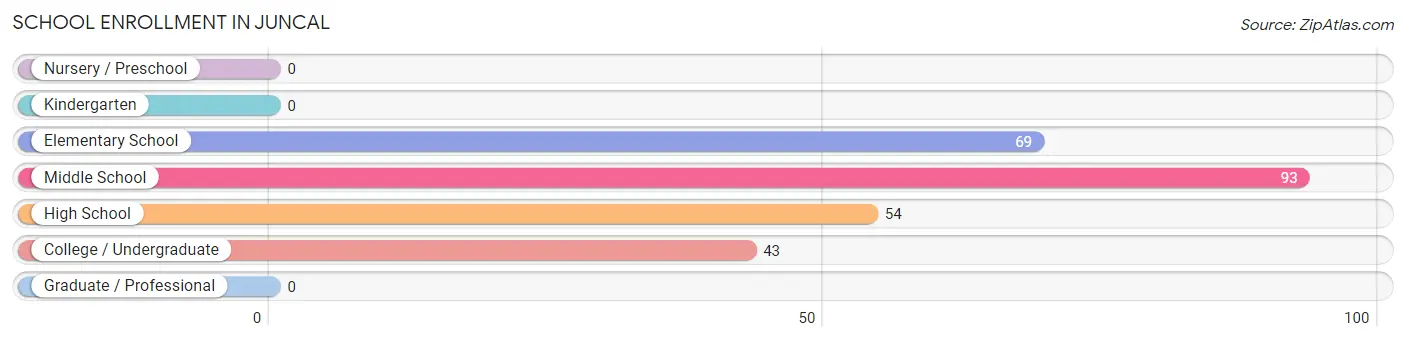
| School Level | # Students | % Students |
| Nursery / Preschool | 0 | 0.0% |
| Kindergarten | 0 | 0.0% |
| Elementary School | 69 | 26.6% |
| Middle School | 93 | 35.9% |
| High School | 54 | 20.8% |
| College / Undergraduate | 43 | 16.6% |
| Graduate / Professional | 0 | 0.0% |
| Total | 259 | 100.0% |
School Enrollment by Age by Funding Source in Juncal
Out of a total of 259 students who are enrolled in schools in Juncal, 67 (25.9%) attend a private institution, while the remaining 192 (74.1%) are enrolled in public schools. The age group of 35 years and over has the highest likelihood of being enrolled in private schools, with 20 (100.0% in the age bracket) enrolled. Conversely, the age group of 10 to 14 year olds has the lowest likelihood of being enrolled in a private school, with 93 (100.0% in the age bracket) attending a public institution.

| Age Bracket | Public School | Private School |
| 3 to 4 Year Olds | 0 (0.0%) | 0 (0.0%) |
| 5 to 9 Year Old | 45 (65.2%) | 24 (34.8%) |
| 10 to 14 Year Olds | 93 (100.0%) | 0 (0.0%) |
| 15 to 17 Year Olds | 54 (70.1%) | 23 (29.9%) |
| 18 to 19 Year Olds | 0 (0.0%) | 0 (0.0%) |
| 20 to 24 Year Olds | 0 (0.0%) | 0 (0.0%) |
| 25 to 34 Year Olds | 0 (0.0%) | 0 (0.0%) |
| 35 Years and over | 0 (0.0%) | 20 (100.0%) |
| Total | 192 (74.1%) | 67 (25.9%) |
Educational Attainment by Field of Study in Juncal
Business (49 | 46.7%), education (25 | 23.8%), science & technology (16 | 15.2%), and social sciences (15 | 14.3%) are the most common fields of study among 105 individuals in Juncal who have obtained a bachelor's degree or higher.
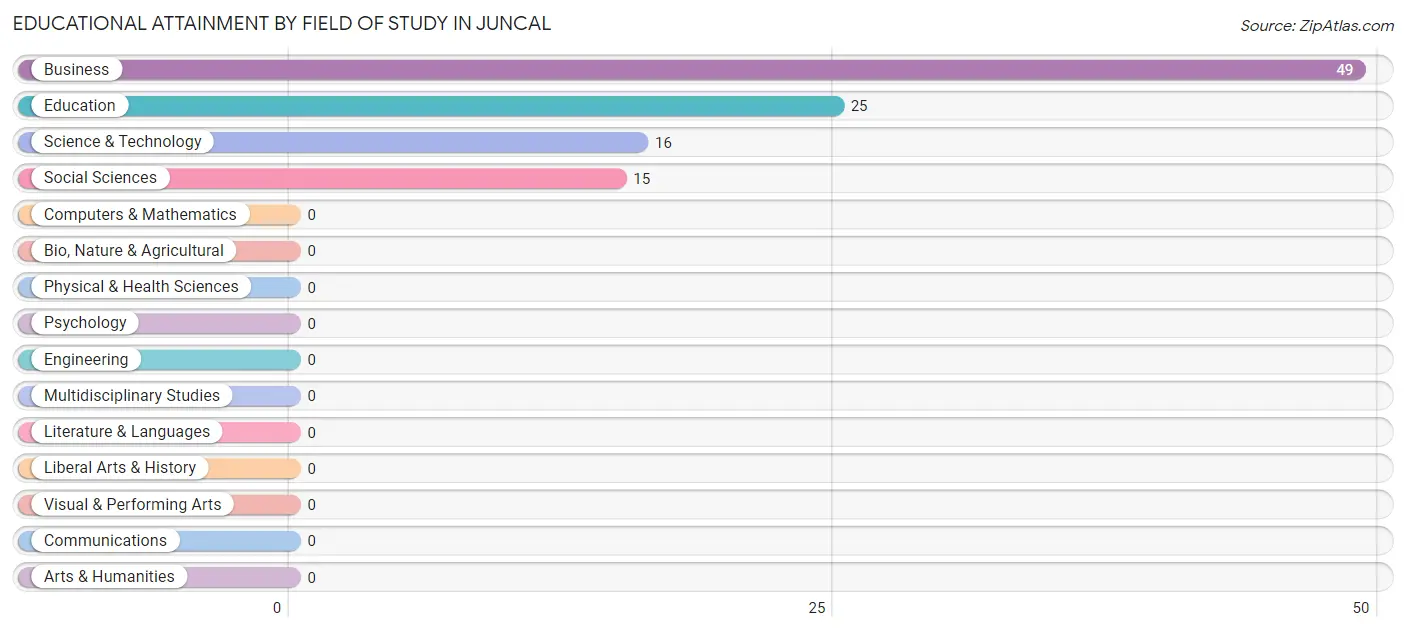
| Field of Study | # Graduates | % Graduates |
| Computers & Mathematics | 0 | 0.0% |
| Bio, Nature & Agricultural | 0 | 0.0% |
| Physical & Health Sciences | 0 | 0.0% |
| Psychology | 0 | 0.0% |
| Social Sciences | 15 | 14.3% |
| Engineering | 0 | 0.0% |
| Multidisciplinary Studies | 0 | 0.0% |
| Science & Technology | 16 | 15.2% |
| Business | 49 | 46.7% |
| Education | 25 | 23.8% |
| Literature & Languages | 0 | 0.0% |
| Liberal Arts & History | 0 | 0.0% |
| Visual & Performing Arts | 0 | 0.0% |
| Communications | 0 | 0.0% |
| Arts & Humanities | 0 | 0.0% |
| Total | 105 | 100.0% |
Transportation & Commute in Juncal
Vehicle Availability by Sex in Juncal
The most prevalent vehicle ownership categories in Juncal are males with 1 vehicle (63, accounting for 39.4%) and females with 1 vehicle (23, making up 88.7%).
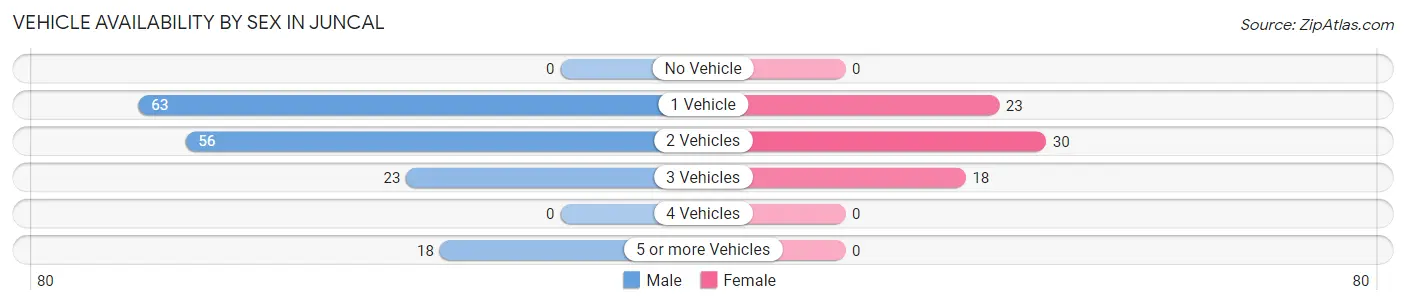
| Vehicles Available | Male | Female |
| No Vehicle | 0 (0.0%) | 0 (0.0%) |
| 1 Vehicle | 63 (39.4%) | 23 (32.4%) |
| 2 Vehicles | 56 (35.0%) | 30 (42.2%) |
| 3 Vehicles | 23 (14.4%) | 18 (25.4%) |
| 4 Vehicles | 0 (0.0%) | 0 (0.0%) |
| 5 or more Vehicles | 18 (11.3%) | 0 (0.0%) |
| Total | 160 (100.0%) | 71 (100.0%) |
Commute Time in Juncal
The most frequently occuring commute durations in Juncal are 10 to 14 minutes (38 commuters, 17.3%), 45 to 59 minutes (38 commuters, 17.3%), and 5 to 9 minutes (32 commuters, 14.6%).
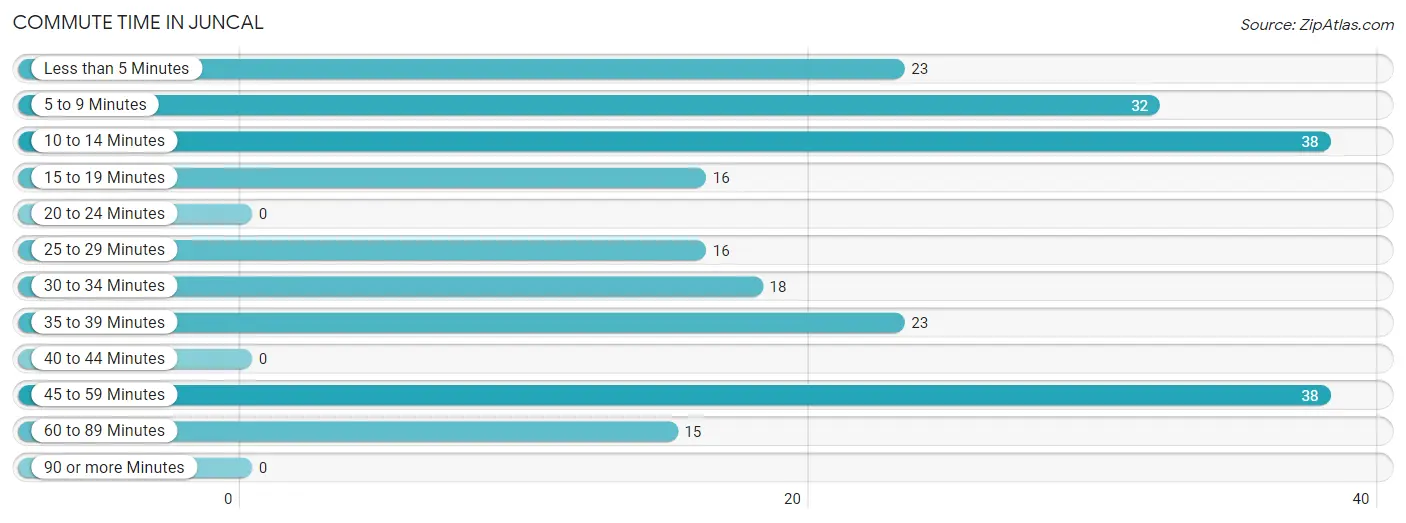
| Commute Time | # Commuters | % Commuters |
| Less than 5 Minutes | 23 | 10.5% |
| 5 to 9 Minutes | 32 | 14.6% |
| 10 to 14 Minutes | 38 | 17.3% |
| 15 to 19 Minutes | 16 | 7.3% |
| 20 to 24 Minutes | 0 | 0.0% |
| 25 to 29 Minutes | 16 | 7.3% |
| 30 to 34 Minutes | 18 | 8.2% |
| 35 to 39 Minutes | 23 | 10.5% |
| 40 to 44 Minutes | 0 | 0.0% |
| 45 to 59 Minutes | 38 | 17.3% |
| 60 to 89 Minutes | 15 | 6.9% |
| 90 or more Minutes | 0 | 0.0% |
Commute Time by Sex in Juncal
The most common commute times in Juncal are 10 to 14 minutes (38 commuters, 25.7%) for males and less than 5 minutes (23 commuters, 32.4%) for females.
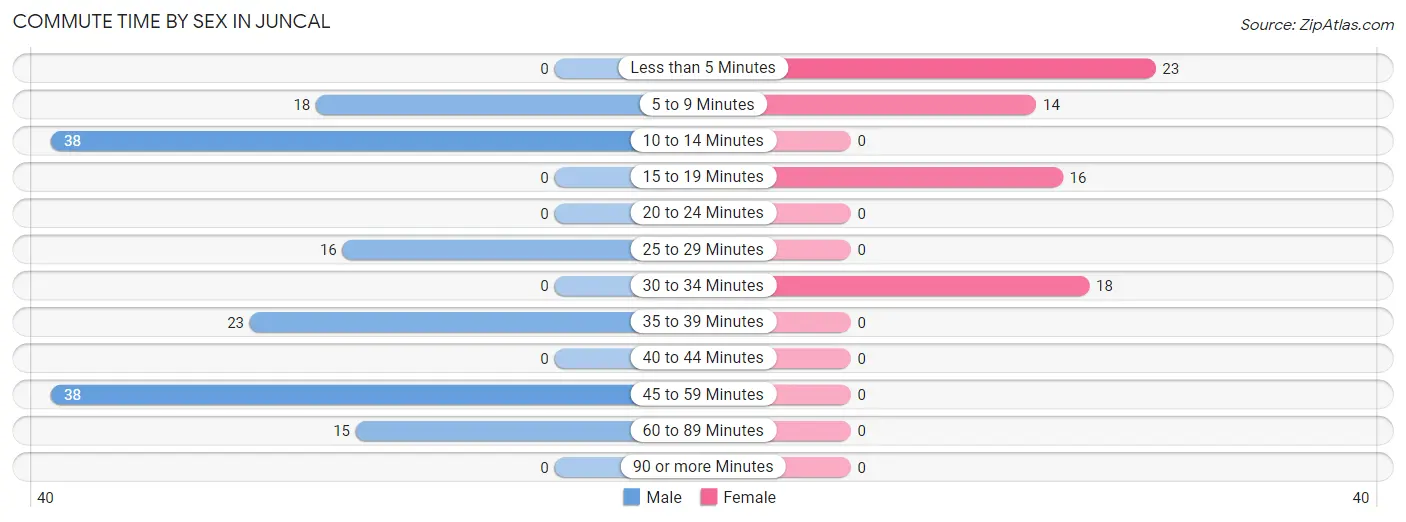
| Commute Time | Male | Female |
| Less than 5 Minutes | 0 (0.0%) | 23 (32.4%) |
| 5 to 9 Minutes | 18 (12.2%) | 14 (19.7%) |
| 10 to 14 Minutes | 38 (25.7%) | 0 (0.0%) |
| 15 to 19 Minutes | 0 (0.0%) | 16 (22.5%) |
| 20 to 24 Minutes | 0 (0.0%) | 0 (0.0%) |
| 25 to 29 Minutes | 16 (10.8%) | 0 (0.0%) |
| 30 to 34 Minutes | 0 (0.0%) | 18 (25.4%) |
| 35 to 39 Minutes | 23 (15.5%) | 0 (0.0%) |
| 40 to 44 Minutes | 0 (0.0%) | 0 (0.0%) |
| 45 to 59 Minutes | 38 (25.7%) | 0 (0.0%) |
| 60 to 89 Minutes | 15 (10.1%) | 0 (0.0%) |
| 90 or more Minutes | 0 (0.0%) | 0 (0.0%) |
Time of Departure to Work by Sex in Juncal
The most frequent times of departure to work in Juncal are 7:00 AM to 7:29 AM (56, 37.8%) for males and 12:00 AM to 4:59 AM (34, 47.9%) for females.
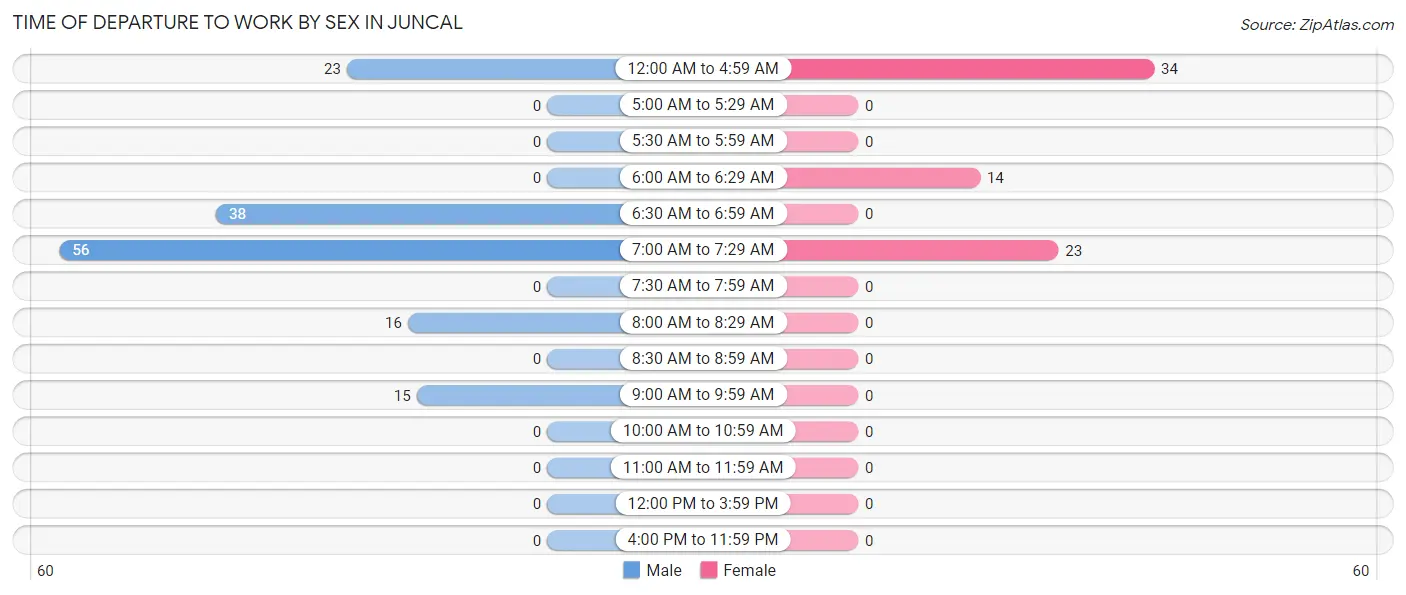
| Time of Departure | Male | Female |
| 12:00 AM to 4:59 AM | 23 (15.5%) | 34 (47.9%) |
| 5:00 AM to 5:29 AM | 0 (0.0%) | 0 (0.0%) |
| 5:30 AM to 5:59 AM | 0 (0.0%) | 0 (0.0%) |
| 6:00 AM to 6:29 AM | 0 (0.0%) | 14 (19.7%) |
| 6:30 AM to 6:59 AM | 38 (25.7%) | 0 (0.0%) |
| 7:00 AM to 7:29 AM | 56 (37.8%) | 23 (32.4%) |
| 7:30 AM to 7:59 AM | 0 (0.0%) | 0 (0.0%) |
| 8:00 AM to 8:29 AM | 16 (10.8%) | 0 (0.0%) |
| 8:30 AM to 8:59 AM | 0 (0.0%) | 0 (0.0%) |
| 9:00 AM to 9:59 AM | 15 (10.1%) | 0 (0.0%) |
| 10:00 AM to 10:59 AM | 0 (0.0%) | 0 (0.0%) |
| 11:00 AM to 11:59 AM | 0 (0.0%) | 0 (0.0%) |
| 12:00 PM to 3:59 PM | 0 (0.0%) | 0 (0.0%) |
| 4:00 PM to 11:59 PM | 0 (0.0%) | 0 (0.0%) |
| Total | 148 (100.0%) | 71 (100.0%) |
Housing Occupancy in Juncal
Occupancy by Ownership in Juncal
Of the total 441 dwellings in Juncal, owner-occupied units account for 347 (78.7%), while renter-occupied units make up 94 (21.3%).
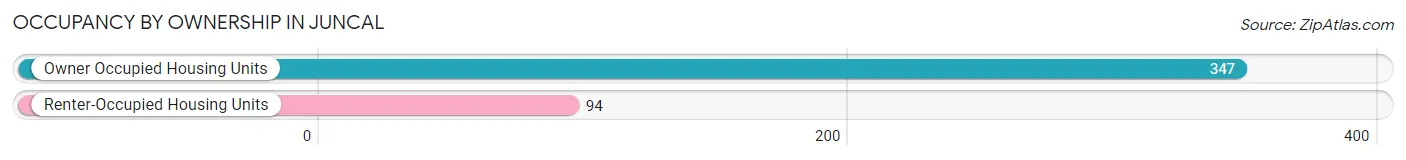
| Occupancy | # Housing Units | % Housing Units |
| Owner Occupied Housing Units | 347 | 78.7% |
| Renter-Occupied Housing Units | 94 | 21.3% |
| Total Occupied Housing Units | 441 | 100.0% |
Occupancy by Household Size in Juncal
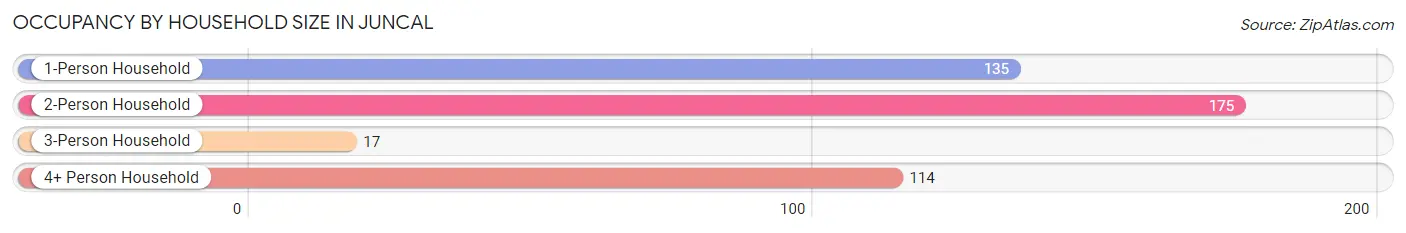
| Household Size | # Housing Units | % Housing Units |
| 1-Person Household | 135 | 30.6% |
| 2-Person Household | 175 | 39.7% |
| 3-Person Household | 17 | 3.8% |
| 4+ Person Household | 114 | 25.9% |
| Total Housing Units | 441 | 100.0% |
Occupancy by Ownership by Household Size in Juncal
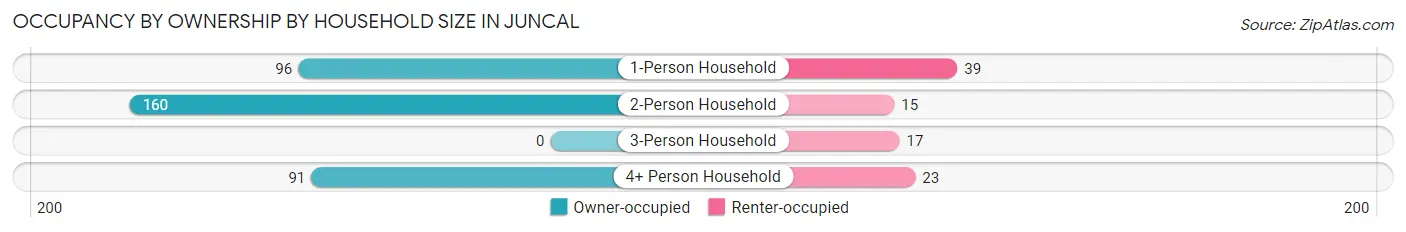
| Household Size | Owner-occupied | Renter-occupied |
| 1-Person Household | 96 (71.1%) | 39 (28.9%) |
| 2-Person Household | 160 (91.4%) | 15 (8.6%) |
| 3-Person Household | 0 (0.0%) | 17 (100.0%) |
| 4+ Person Household | 91 (79.8%) | 23 (20.2%) |
| Total Housing Units | 347 (78.7%) | 94 (21.3%) |
Occupancy by Educational Attainment in Juncal
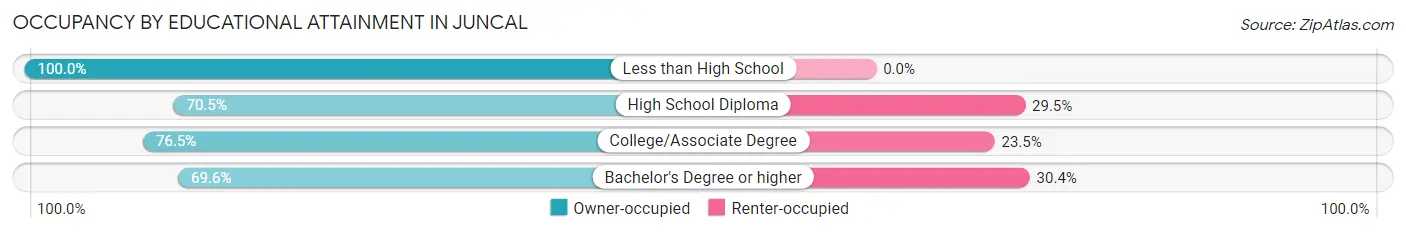
| Household Size | Owner-occupied | Renter-occupied |
| Less than High School | 104 (100.0%) | 0 (0.0%) |
| High School Diploma | 136 (70.5%) | 57 (29.5%) |
| College/Associate Degree | 75 (76.5%) | 23 (23.5%) |
| Bachelor's Degree or higher | 32 (69.6%) | 14 (30.4%) |
Occupancy by Age of Householder in Juncal
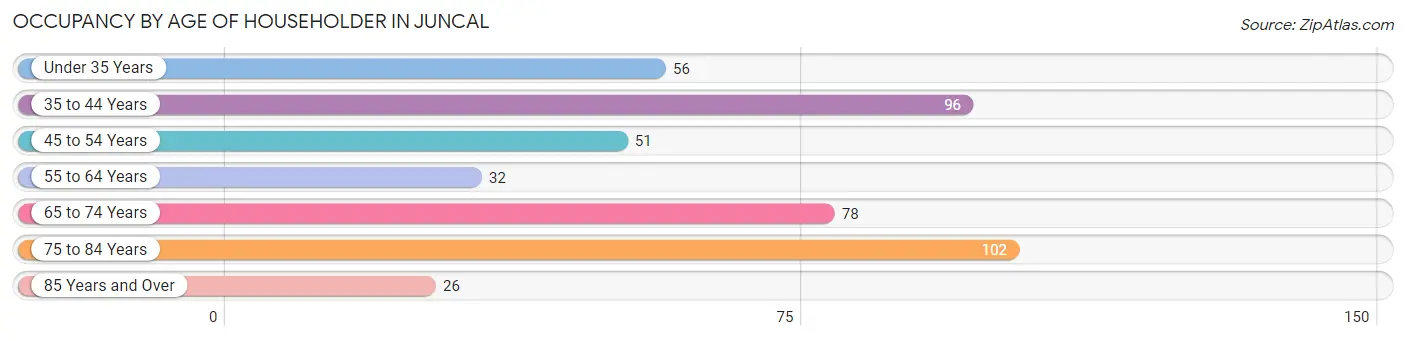
| Age Bracket | # Households | % Households |
| Under 35 Years | 56 | 12.7% |
| 35 to 44 Years | 96 | 21.8% |
| 45 to 54 Years | 51 | 11.6% |
| 55 to 64 Years | 32 | 7.3% |
| 65 to 74 Years | 78 | 17.7% |
| 75 to 84 Years | 102 | 23.1% |
| 85 Years and Over | 26 | 5.9% |
| Total | 441 | 100.0% |
Housing Finances in Juncal
Median Income by Occupancy in Juncal
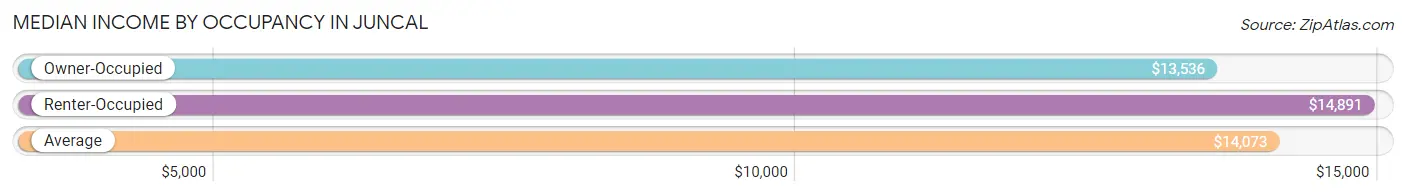
| Occupancy Type | # Households | Median Income |
| Owner-Occupied | 347 (78.7%) | $13,536 |
| Renter-Occupied | 94 (21.3%) | $14,891 |
| Average | 441 (100.0%) | $14,073 |
Occupancy by Householder Income Bracket in Juncal
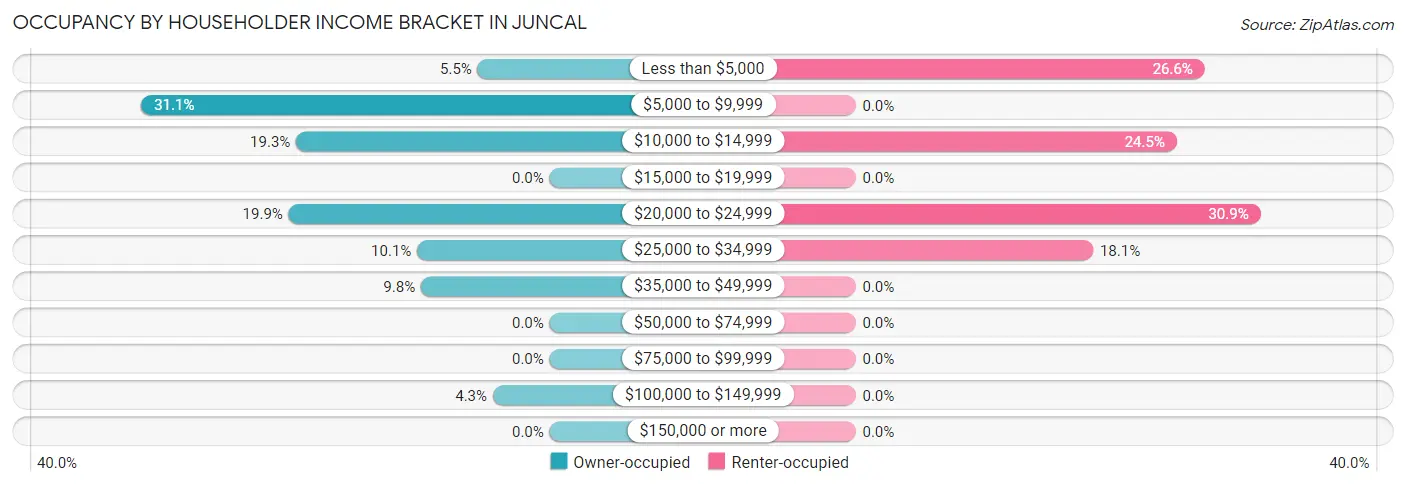
| Income Bracket | Owner-occupied | Renter-occupied |
| Less than $5,000 | 19 (5.5%) | 25 (26.6%) |
| $5,000 to $9,999 | 108 (31.1%) | 0 (0.0%) |
| $10,000 to $14,999 | 67 (19.3%) | 23 (24.5%) |
| $15,000 to $19,999 | 0 (0.0%) | 0 (0.0%) |
| $20,000 to $24,999 | 69 (19.9%) | 29 (30.8%) |
| $25,000 to $34,999 | 35 (10.1%) | 17 (18.1%) |
| $35,000 to $49,999 | 34 (9.8%) | 0 (0.0%) |
| $50,000 to $74,999 | 0 (0.0%) | 0 (0.0%) |
| $75,000 to $99,999 | 0 (0.0%) | 0 (0.0%) |
| $100,000 to $149,999 | 15 (4.3%) | 0 (0.0%) |
| $150,000 or more | 0 (0.0%) | 0 (0.0%) |
| Total | 347 (100.0%) | 94 (100.0%) |
Monthly Housing Cost Tiers in Juncal
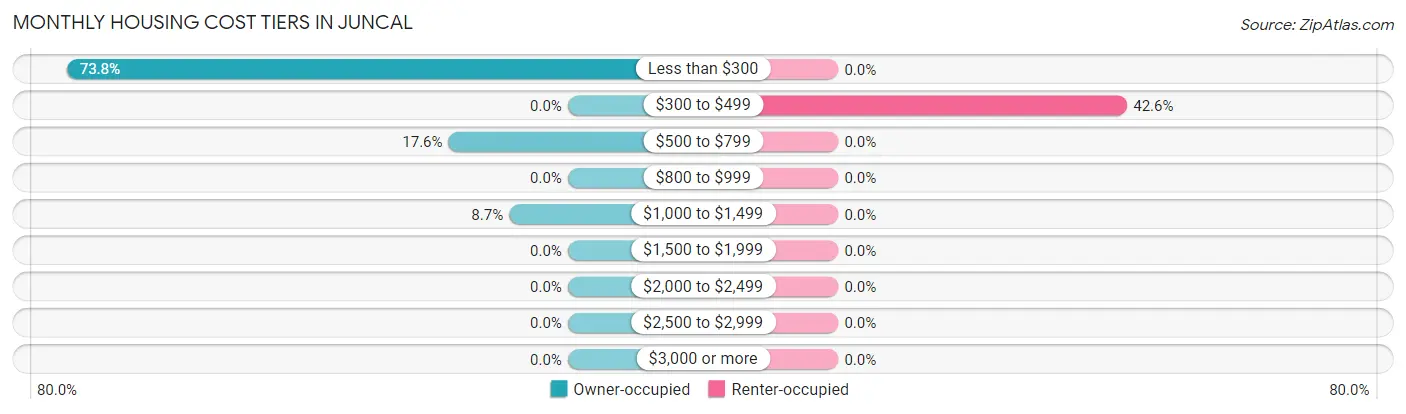
| Monthly Cost | Owner-occupied | Renter-occupied |
| Less than $300 | 256 (73.8%) | 0 (0.0%) |
| $300 to $499 | 0 (0.0%) | 40 (42.5%) |
| $500 to $799 | 61 (17.6%) | 0 (0.0%) |
| $800 to $999 | 0 (0.0%) | 0 (0.0%) |
| $1,000 to $1,499 | 30 (8.6%) | 0 (0.0%) |
| $1,500 to $1,999 | 0 (0.0%) | 0 (0.0%) |
| $2,000 to $2,499 | 0 (0.0%) | 0 (0.0%) |
| $2,500 to $2,999 | 0 (0.0%) | 0 (0.0%) |
| $3,000 or more | 0 (0.0%) | 0 (0.0%) |
| Total | 347 (100.0%) | 94 (100.0%) |
Physical Housing Characteristics in Juncal
Housing Structures in Juncal

| Structure Type | # Housing Units | % Housing Units |
| Single Unit, Detached | 387 | 87.8% |
| Single Unit, Attached | 31 | 7.0% |
| 2 Unit Apartments | 23 | 5.2% |
| 3 or 4 Unit Apartments | 0 | 0.0% |
| 5 to 9 Unit Apartments | 0 | 0.0% |
| 10 or more Apartments | 0 | 0.0% |
| Mobile Home / Other | 0 | 0.0% |
| Total | 441 | 100.0% |
Housing Structures by Occupancy in Juncal
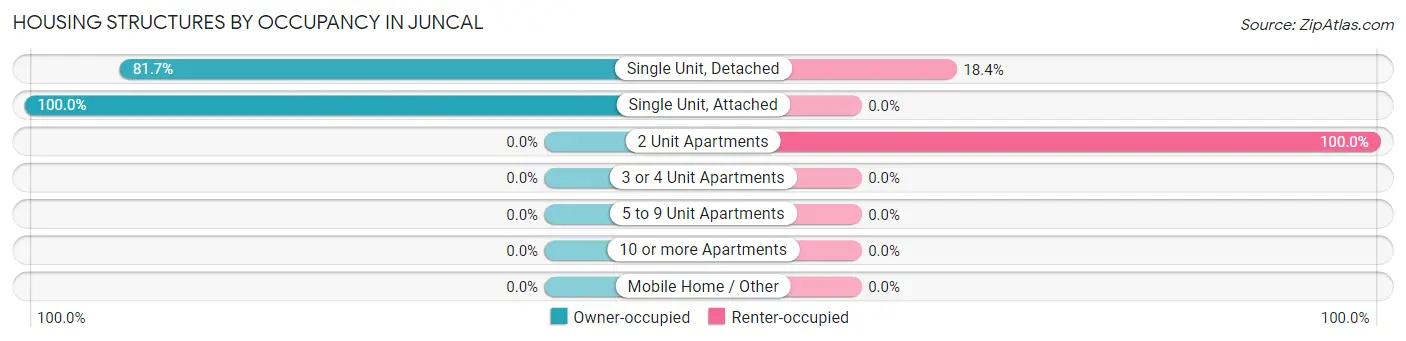
| Structure Type | Owner-occupied | Renter-occupied |
| Single Unit, Detached | 316 (81.7%) | 71 (18.3%) |
| Single Unit, Attached | 31 (100.0%) | 0 (0.0%) |
| 2 Unit Apartments | 0 (0.0%) | 23 (100.0%) |
| 3 or 4 Unit Apartments | 0 (0.0%) | 0 (0.0%) |
| 5 to 9 Unit Apartments | 0 (0.0%) | 0 (0.0%) |
| 10 or more Apartments | 0 (0.0%) | 0 (0.0%) |
| Mobile Home / Other | 0 (0.0%) | 0 (0.0%) |
| Total | 347 (78.7%) | 94 (21.3%) |
Housing Structures by Number of Rooms in Juncal
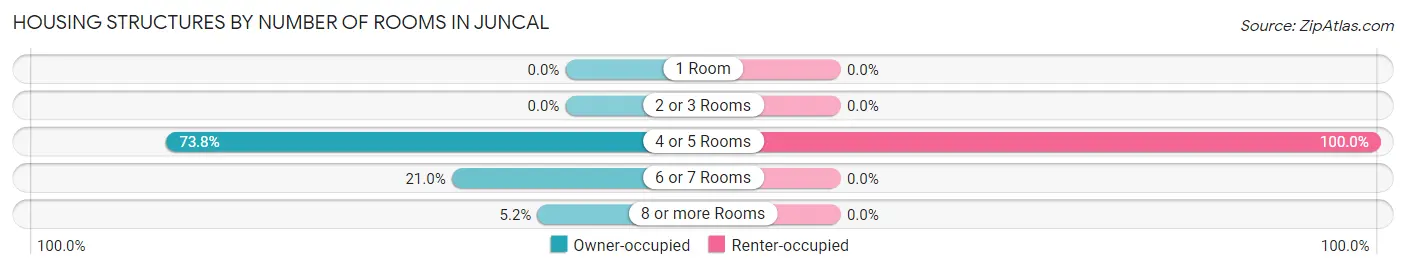
| Number of Rooms | Owner-occupied | Renter-occupied |
| 1 Room | 0 (0.0%) | 0 (0.0%) |
| 2 or 3 Rooms | 0 (0.0%) | 0 (0.0%) |
| 4 or 5 Rooms | 256 (73.8%) | 94 (100.0%) |
| 6 or 7 Rooms | 73 (21.0%) | 0 (0.0%) |
| 8 or more Rooms | 18 (5.2%) | 0 (0.0%) |
| Total | 347 (100.0%) | 94 (100.0%) |
Housing Structure by Heating Type in Juncal
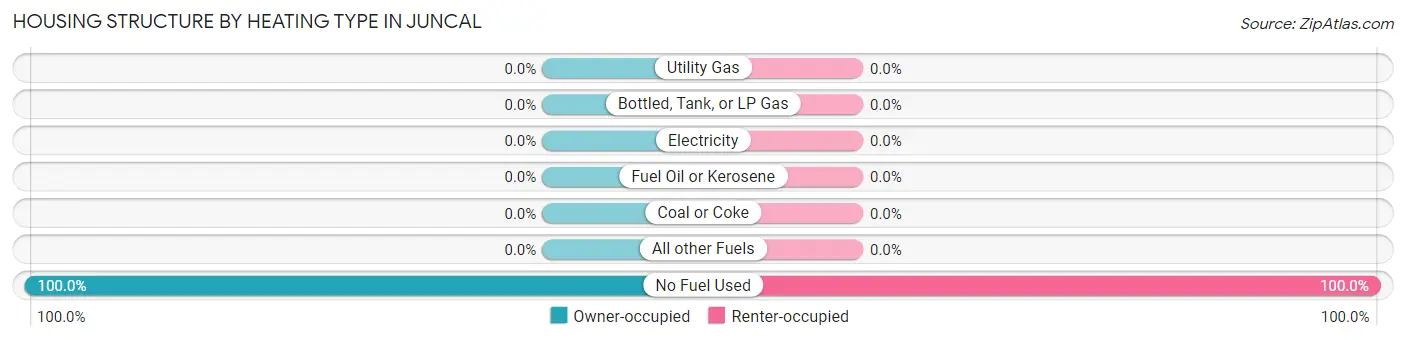
| Heating Type | Owner-occupied | Renter-occupied |
| Utility Gas | 0 (0.0%) | 0 (0.0%) |
| Bottled, Tank, or LP Gas | 0 (0.0%) | 0 (0.0%) |
| Electricity | 0 (0.0%) | 0 (0.0%) |
| Fuel Oil or Kerosene | 0 (0.0%) | 0 (0.0%) |
| Coal or Coke | 0 (0.0%) | 0 (0.0%) |
| All other Fuels | 0 (0.0%) | 0 (0.0%) |
| No Fuel Used | 347 (100.0%) | 94 (100.0%) |
| Total | 347 (100.0%) | 94 (100.0%) |
Household Vehicle Usage in Juncal
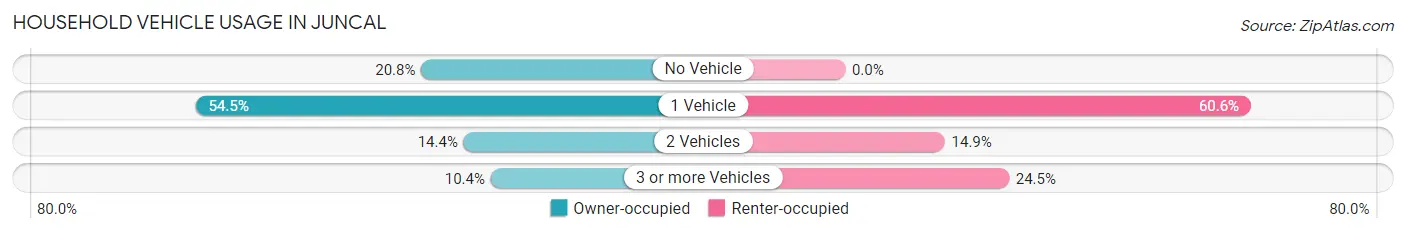
| Vehicles per Household | Owner-occupied | Renter-occupied |
| No Vehicle | 72 (20.7%) | 0 (0.0%) |
| 1 Vehicle | 189 (54.5%) | 57 (60.6%) |
| 2 Vehicles | 50 (14.4%) | 14 (14.9%) |
| 3 or more Vehicles | 36 (10.4%) | 23 (24.5%) |
| Total | 347 (100.0%) | 94 (100.0%) |
Real Estate & Mortgages in Juncal
Real Estate and Mortgage Overview in Juncal
| Characteristic | Without Mortgage | With Mortgage |
| Housing Units | 256 | 91 |
| Median Property Value | $84,200 | $118,200 |
| Median Household Income | $11,484 | $0 |
| Monthly Housing Costs | $102 | $0 |
| Real Estate Taxes | - | - |
Property Value by Mortgage Status in Juncal
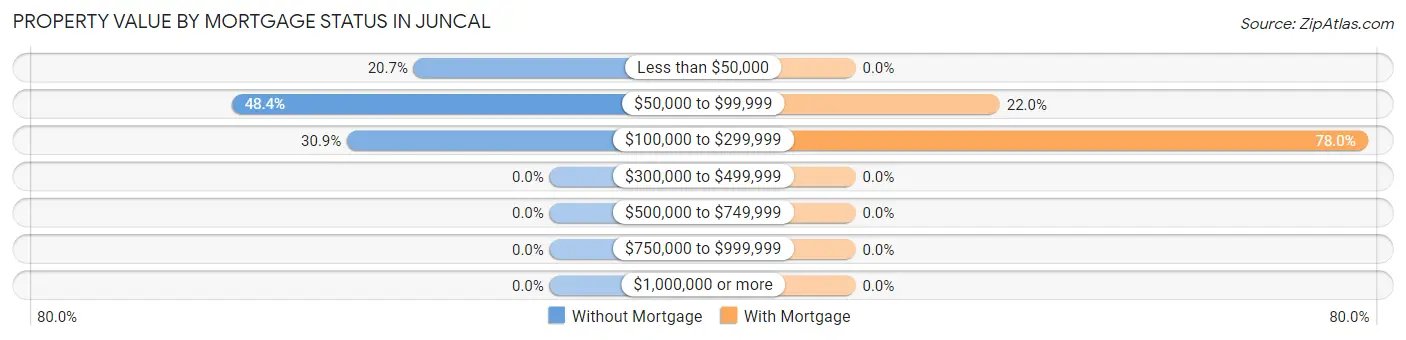
| Property Value | Without Mortgage | With Mortgage |
| Less than $50,000 | 53 (20.7%) | 0 (0.0%) |
| $50,000 to $99,999 | 124 (48.4%) | 20 (22.0%) |
| $100,000 to $299,999 | 79 (30.9%) | 71 (78.0%) |
| $300,000 to $499,999 | 0 (0.0%) | 0 (0.0%) |
| $500,000 to $749,999 | 0 (0.0%) | 0 (0.0%) |
| $750,000 to $999,999 | 0 (0.0%) | 0 (0.0%) |
| $1,000,000 or more | 0 (0.0%) | 0 (0.0%) |
| Total | 256 (100.0%) | 91 (100.0%) |
Household Income by Mortgage Status in Juncal
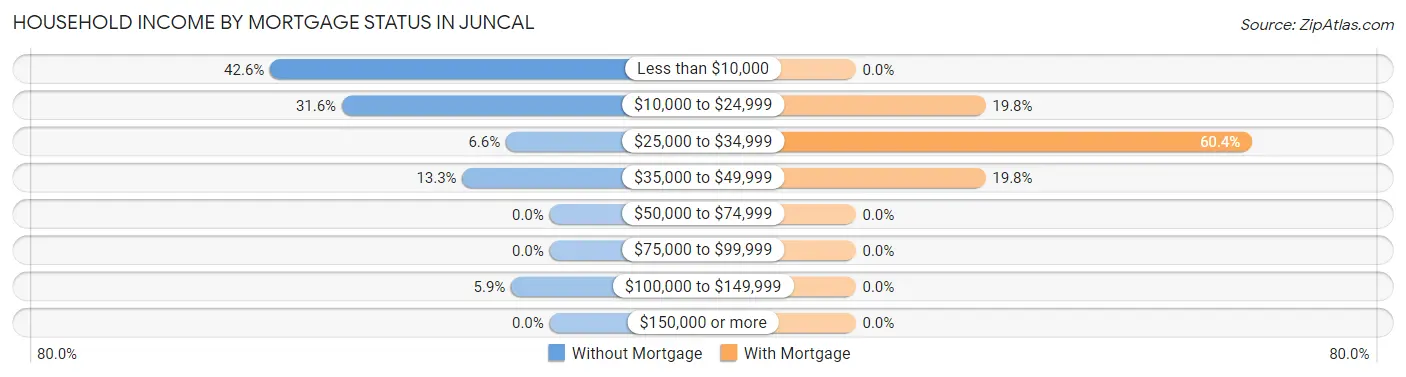
| Household Income | Without Mortgage | With Mortgage |
| Less than $10,000 | 109 (42.6%) | 0 (0.0%) |
| $10,000 to $24,999 | 81 (31.6%) | 18 (19.8%) |
| $25,000 to $34,999 | 17 (6.6%) | 55 (60.4%) |
| $35,000 to $49,999 | 34 (13.3%) | 18 (19.8%) |
| $50,000 to $74,999 | 0 (0.0%) | 0 (0.0%) |
| $75,000 to $99,999 | 0 (0.0%) | 0 (0.0%) |
| $100,000 to $149,999 | 15 (5.9%) | 0 (0.0%) |
| $150,000 or more | 0 (0.0%) | 0 (0.0%) |
| Total | 256 (100.0%) | 91 (100.0%) |
Property Value to Household Income Ratio in Juncal
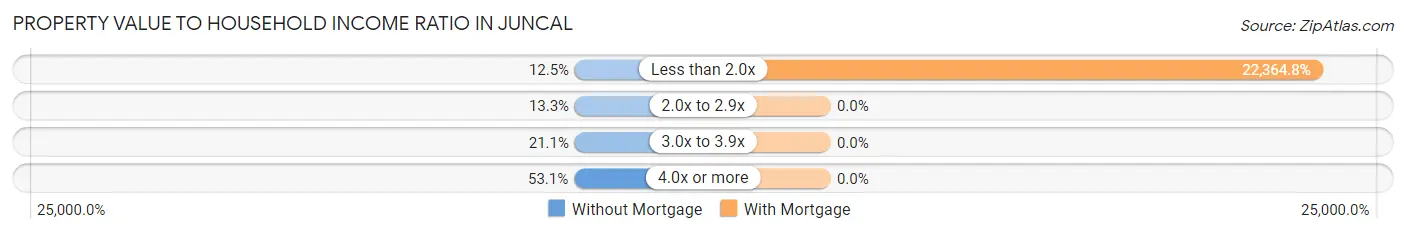
| Value-to-Income Ratio | Without Mortgage | With Mortgage |
| Less than 2.0x | 32 (12.5%) | 20,352 (22,364.8%) |
| 2.0x to 2.9x | 34 (13.3%) | 0 (0.0%) |
| 3.0x to 3.9x | 54 (21.1%) | 0 (0.0%) |
| 4.0x or more | 136 (53.1%) | 0 (0.0%) |
| Total | 256 (100.0%) | 91 (100.0%) |
Real Estate Taxes by Mortgage Status in Juncal
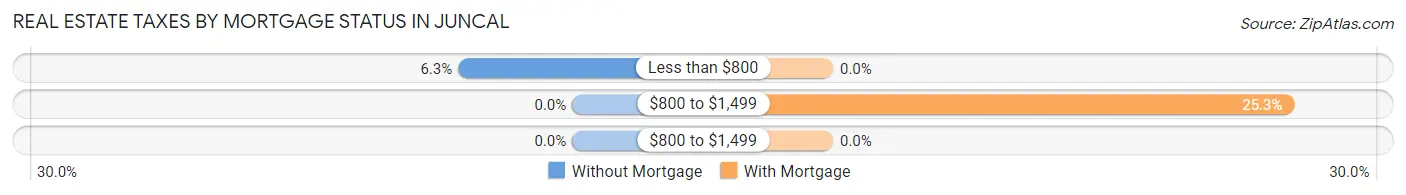
| Property Taxes | Without Mortgage | With Mortgage |
| Less than $800 | 16 (6.2%) | 0 (0.0%) |
| $800 to $1,499 | 0 (0.0%) | 23 (25.3%) |
| $800 to $1,499 | 0 (0.0%) | 0 (0.0%) |
| Total | 256 (100.0%) | 91 (100.0%) |
Health & Disability in Juncal
Health Insurance Coverage by Age in Juncal
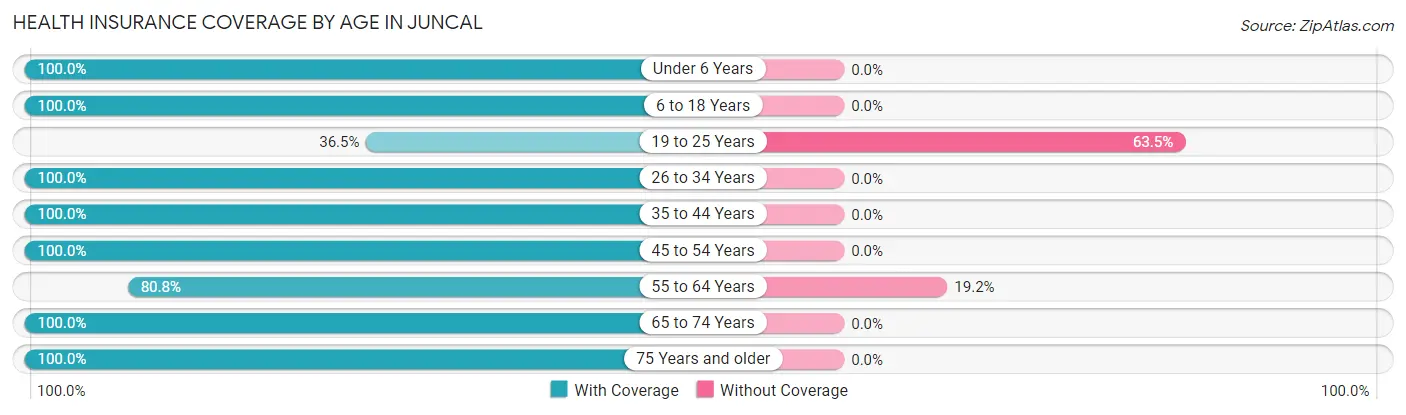
| Age Bracket | With Coverage | Without Coverage |
| Under 6 Years | 94 (100.0%) | 0 (0.0%) |
| 6 to 18 Years | 239 (100.0%) | 0 (0.0%) |
| 19 to 25 Years | 35 (36.5%) | 61 (63.5%) |
| 26 to 34 Years | 89 (100.0%) | 0 (0.0%) |
| 35 to 44 Years | 212 (100.0%) | 0 (0.0%) |
| 45 to 54 Years | 82 (100.0%) | 0 (0.0%) |
| 55 to 64 Years | 63 (80.8%) | 15 (19.2%) |
| 65 to 74 Years | 137 (100.0%) | 0 (0.0%) |
| 75 Years and older | 148 (100.0%) | 0 (0.0%) |
| Total | 1,099 (93.5%) | 76 (6.5%) |
Health Insurance Coverage by Citizenship Status in Juncal
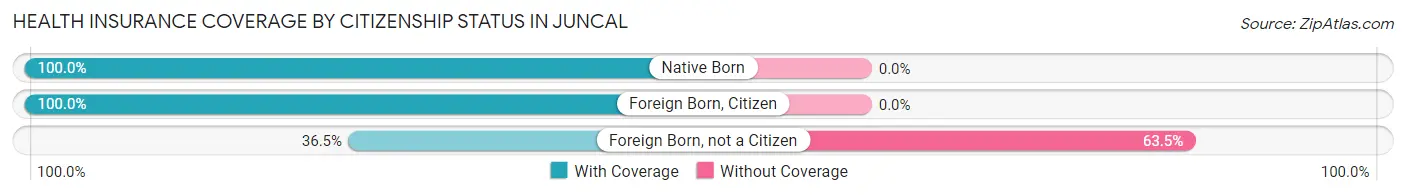
| Citizenship Status | With Coverage | Without Coverage |
| Native Born | 94 (100.0%) | 0 (0.0%) |
| Foreign Born, Citizen | 239 (100.0%) | 0 (0.0%) |
| Foreign Born, not a Citizen | 35 (36.5%) | 61 (63.5%) |
Health Insurance Coverage by Household Income in Juncal
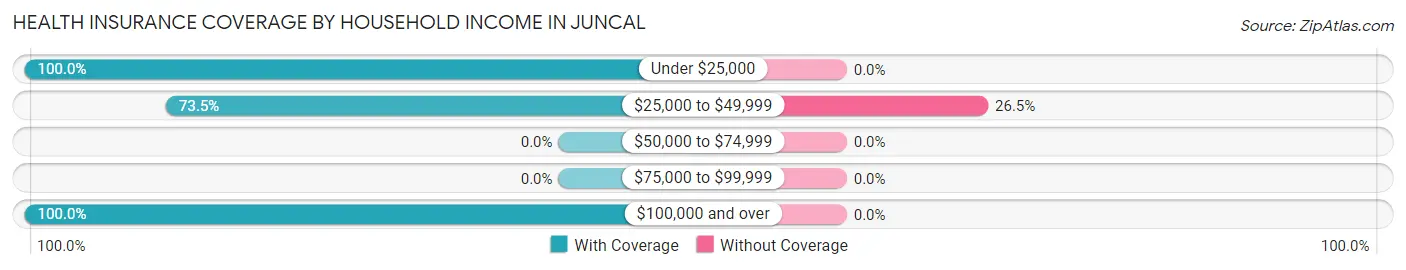
| Household Income | With Coverage | Without Coverage |
| Under $25,000 | 842 (100.0%) | 0 (0.0%) |
| $25,000 to $49,999 | 211 (73.5%) | 76 (26.5%) |
| $50,000 to $74,999 | 0 (0.0%) | 0 (0.0%) |
| $75,000 to $99,999 | 0 (0.0%) | 0 (0.0%) |
| $100,000 and over | 46 (100.0%) | 0 (0.0%) |
Public vs Private Health Insurance Coverage by Age in Juncal
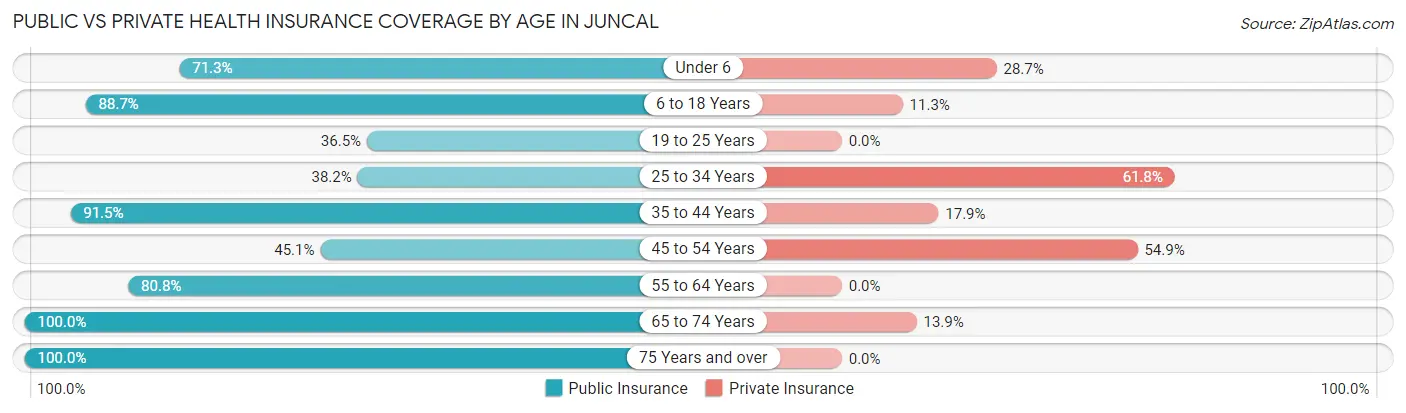
| Age Bracket | Public Insurance | Private Insurance |
| Under 6 | 67 (71.3%) | 27 (28.7%) |
| 6 to 18 Years | 212 (88.7%) | 27 (11.3%) |
| 19 to 25 Years | 35 (36.5%) | 0 (0.0%) |
| 25 to 34 Years | 34 (38.2%) | 55 (61.8%) |
| 35 to 44 Years | 194 (91.5%) | 38 (17.9%) |
| 45 to 54 Years | 37 (45.1%) | 45 (54.9%) |
| 55 to 64 Years | 63 (80.8%) | 0 (0.0%) |
| 65 to 74 Years | 137 (100.0%) | 19 (13.9%) |
| 75 Years and over | 148 (100.0%) | 0 (0.0%) |
| Total | 927 (78.9%) | 211 (18.0%) |
Disability Status by Sex by Age in Juncal
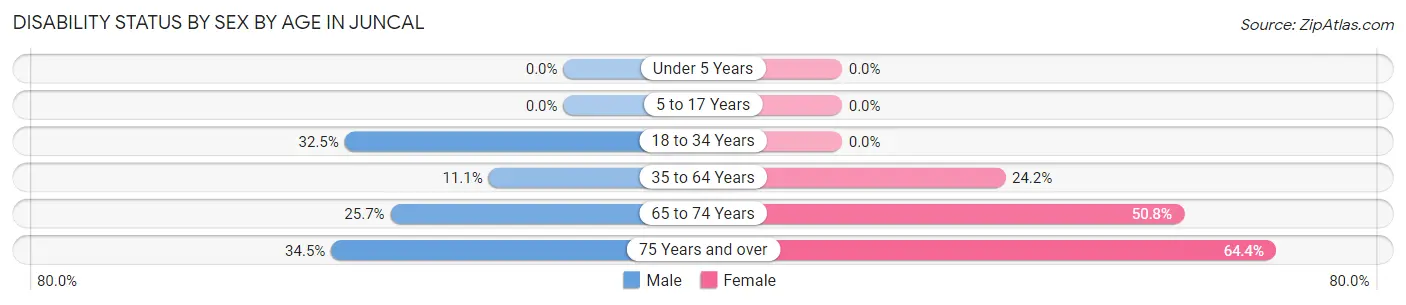
| Age Bracket | Male | Female |
| Under 5 Years | 0 (0.0%) | 0 (0.0%) |
| 5 to 17 Years | 0 (0.0%) | 0 (0.0%) |
| 18 to 34 Years | 38 (32.5%) | 0 (0.0%) |
| 35 to 64 Years | 12 (11.1%) | 64 (24.2%) |
| 65 to 74 Years | 19 (25.7%) | 32 (50.8%) |
| 75 Years and over | 20 (34.5%) | 58 (64.4%) |
Disability Class by Sex by Age in Juncal
Disability Class: Hearing Difficulty
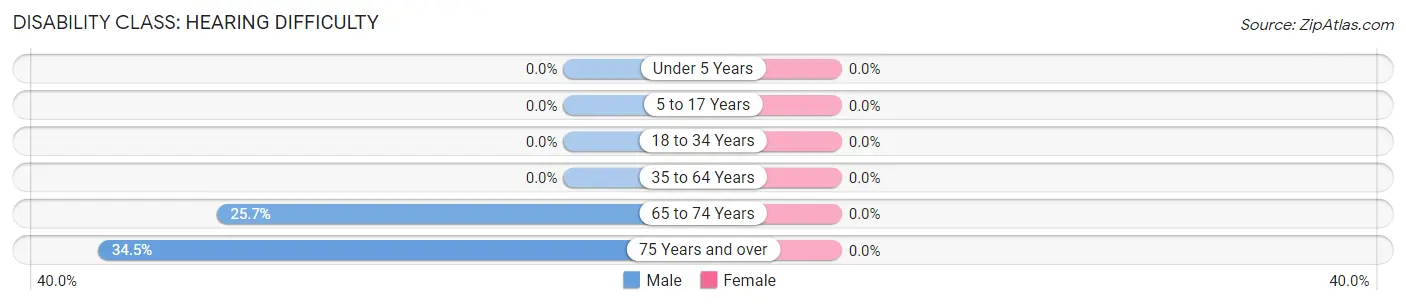
| Age Bracket | Male | Female |
| Under 5 Years | 0 (0.0%) | 0 (0.0%) |
| 5 to 17 Years | 0 (0.0%) | 0 (0.0%) |
| 18 to 34 Years | 0 (0.0%) | 0 (0.0%) |
| 35 to 64 Years | 0 (0.0%) | 0 (0.0%) |
| 65 to 74 Years | 19 (25.7%) | 0 (0.0%) |
| 75 Years and over | 20 (34.5%) | 0 (0.0%) |
Disability Class: Vision Difficulty
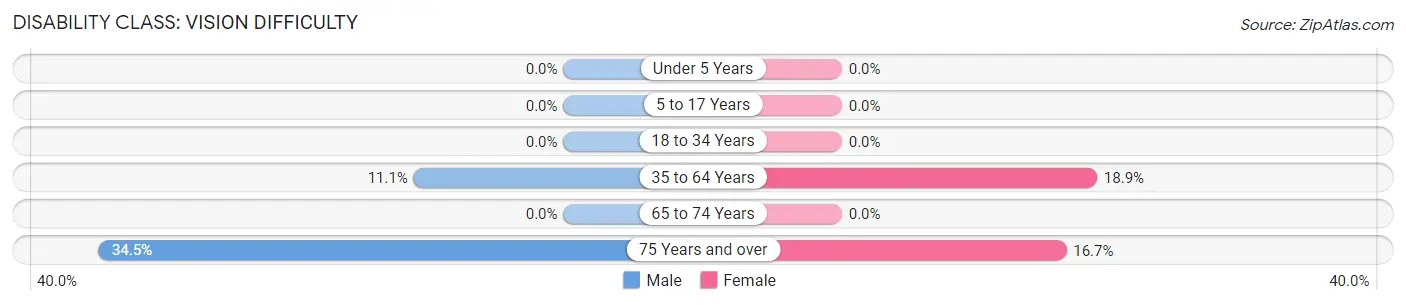
| Age Bracket | Male | Female |
| Under 5 Years | 0 (0.0%) | 0 (0.0%) |
| 5 to 17 Years | 0 (0.0%) | 0 (0.0%) |
| 18 to 34 Years | 0 (0.0%) | 0 (0.0%) |
| 35 to 64 Years | 12 (11.1%) | 50 (18.9%) |
| 65 to 74 Years | 0 (0.0%) | 0 (0.0%) |
| 75 Years and over | 20 (34.5%) | 15 (16.7%) |
Disability Class: Cognitive Difficulty
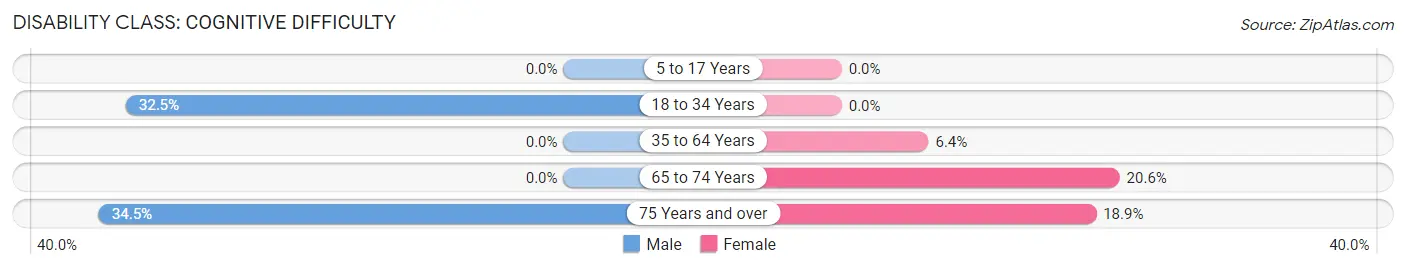
| Age Bracket | Male | Female |
| 5 to 17 Years | 0 (0.0%) | 0 (0.0%) |
| 18 to 34 Years | 38 (32.5%) | 0 (0.0%) |
| 35 to 64 Years | 0 (0.0%) | 17 (6.4%) |
| 65 to 74 Years | 0 (0.0%) | 13 (20.6%) |
| 75 Years and over | 20 (34.5%) | 17 (18.9%) |
Disability Class: Ambulatory Difficulty
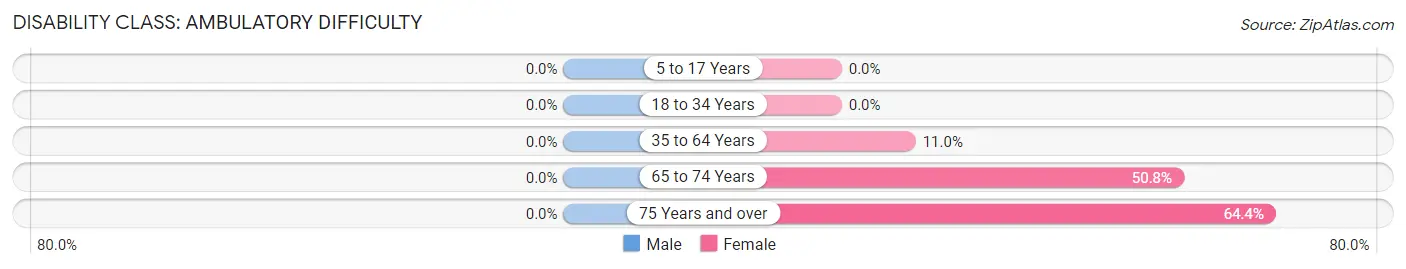
| Age Bracket | Male | Female |
| 5 to 17 Years | 0 (0.0%) | 0 (0.0%) |
| 18 to 34 Years | 0 (0.0%) | 0 (0.0%) |
| 35 to 64 Years | 0 (0.0%) | 29 (11.0%) |
| 65 to 74 Years | 0 (0.0%) | 32 (50.8%) |
| 75 Years and over | 0 (0.0%) | 58 (64.4%) |
Disability Class: Self-Care Difficulty
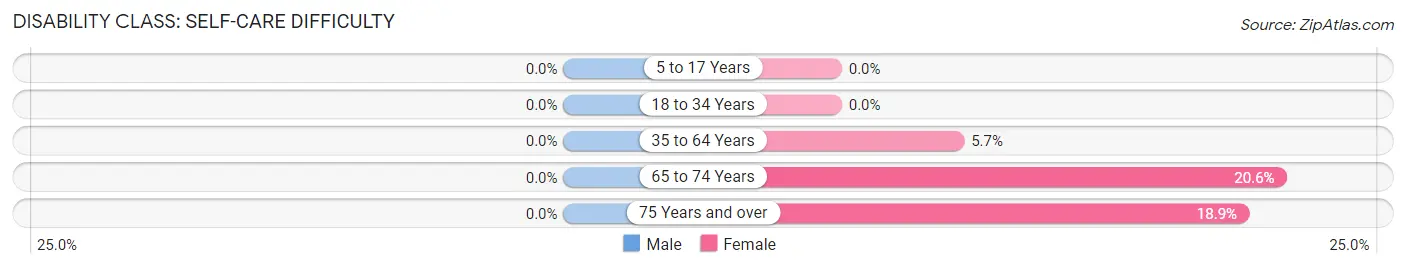
| Age Bracket | Male | Female |
| 5 to 17 Years | 0 (0.0%) | 0 (0.0%) |
| 18 to 34 Years | 0 (0.0%) | 0 (0.0%) |
| 35 to 64 Years | 0 (0.0%) | 15 (5.7%) |
| 65 to 74 Years | 0 (0.0%) | 13 (20.6%) |
| 75 Years and over | 0 (0.0%) | 17 (18.9%) |
Technology Access in Juncal
Computing Device Access in Juncal
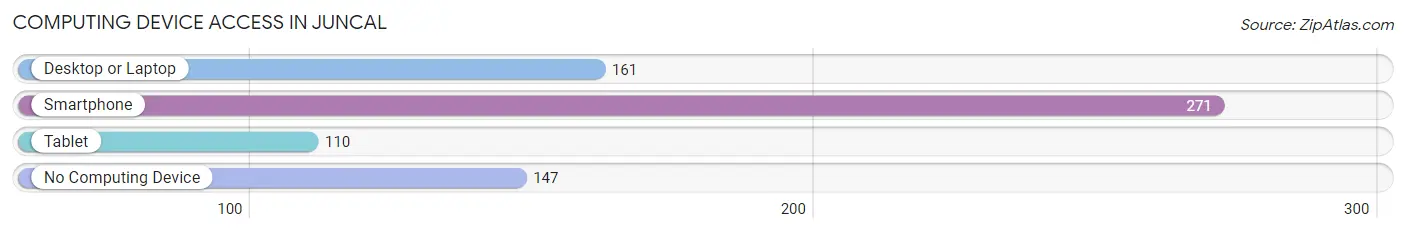
| Device Type | # Households | % Households |
| Desktop or Laptop | 161 | 36.5% |
| Smartphone | 271 | 61.5% |
| Tablet | 110 | 24.9% |
| No Computing Device | 147 | 33.3% |
| Total | 441 | 100.0% |
Internet Access in Juncal
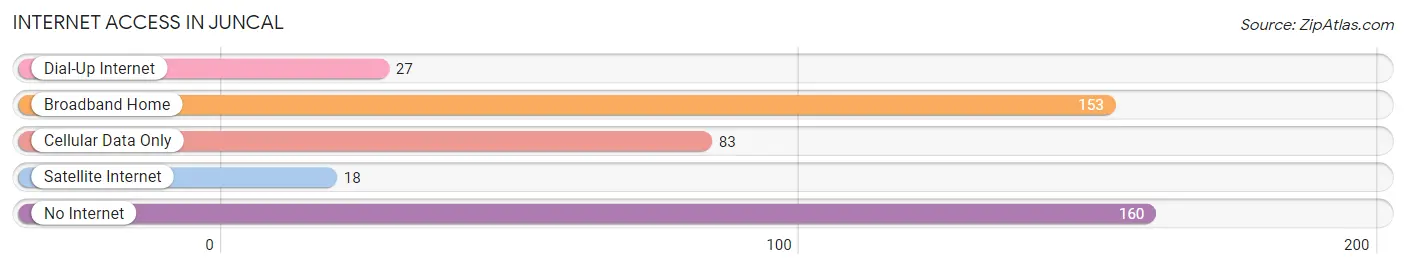
| Internet Type | # Households | % Households |
| Dial-Up Internet | 27 | 6.1% |
| Broadband Home | 153 | 34.7% |
| Cellular Data Only | 83 | 18.8% |
| Satellite Internet | 18 | 4.1% |
| No Internet | 160 | 36.3% |
| Total | 441 | 100.0% |
Juncal Summary
Juncal is a small town located in the province of Buenos Aires, Argentina. It is situated in the south of the province, about 40 kilometers from the capital city of Buenos Aires. The town has a population of around 4,000 people and is known for its rural charm and traditional way of life.
History
The town of Juncal was founded in 1883 by a group of settlers from the nearby town of San Isidro. The settlers were looking for a place to settle and start a new life, and they chose the area around Juncal because of its fertile soil and abundant water supply. The town was officially established in 1884 and was named after the Juncal River, which runs through the area.
The town quickly grew and prospered, and by the early 20th century it had become a thriving agricultural center. The town was also known for its production of leather goods, which were exported to other parts of Argentina and beyond.
In the mid-20th century, Juncal began to experience a decline in its economy due to the increasing mechanization of agriculture and the decline of the leather industry. This led to a decrease in population and a decrease in the town’s economic activity.
Geography
Juncal is located in the south of the province of Buenos Aires, about 40 kilometers from the capital city of Buenos Aires. The town is situated on the banks of the Juncal River, which runs through the area. The town is surrounded by rolling hills and farmland, and is known for its rural charm and traditional way of life.
The climate in Juncal is temperate, with hot summers and mild winters. The average temperature in the summer is around 25°C (77°F), and in the winter it is around 10°C (50°F).
Economy
The economy of Juncal is largely based on agriculture. The town is known for its production of wheat, corn, and other grains, as well as for its production of leather goods. The town also has a small manufacturing sector, which produces a variety of goods such as furniture and clothing.
The town also has a small tourism industry, with visitors coming to enjoy the rural charm and traditional way of life.
Demographics
As of 2020, the population of Juncal is estimated to be around 4,000 people. The majority of the population is of European descent, with a small percentage of people of African and indigenous descent. The town is predominantly Roman Catholic, with a small percentage of people belonging to other religions.
The town has a high rate of unemployment, with many people relying on government assistance to make ends meet. The town also has a high rate of poverty, with many people living in substandard housing and lacking access to basic services such as healthcare and education.
Conclusion
Juncal is a small town located in the province of Buenos Aires, Argentina. It is known for its rural charm and traditional way of life, and its economy is largely based on agriculture. The town has a population of around 4,000 people, and the majority of the population is of European descent. The town has a high rate of unemployment and poverty, and many people rely on government assistance to make ends meet.
Common Questions
What is Per Capita Income in Juncal?
Per Capita income in Juncal is $9,206.
What is the Median Family Income in Juncal?
Median Family Income in Juncal is $21,676.
What is the Median Household income in Juncal?
Median Household Income in Juncal is $14,073.
What is Income or Wage Gap in Juncal?
Income or Wage Gap in Juncal is 50.0%.
Women in Juncal earn 50.0 cents for every dollar earned by a man.
What is Inequality or Gini Index in Juncal?
Inequality or Gini Index in Juncal is 0.45.
What is the Total Population of Juncal?
Total Population of Juncal is 1,181.
What is the Total Male Population of Juncal?
Total Male Population of Juncal is 506.
What is the Total Female Population of Juncal?
Total Female Population of Juncal is 675.
What is the Ratio of Males per 100 Females in Juncal?
There are 74.96 Males per 100 Females in Juncal.
What is the Ratio of Females per 100 Males in Juncal?
There are 133.40 Females per 100 Males in Juncal.
What is the Median Population Age in Juncal?
Median Population Age in Juncal is 39.8 Years.
What is the Average Family Size in Juncal
Average Family Size in Juncal is 3.4 People.
What is the Average Household Size in Juncal
Average Household Size in Juncal is 2.7 People.
How Large is the Labor Force in Juncal?
There are 262 People in the Labor Forcein in Juncal.
What is the Percentage of People in the Labor Force in Juncal?
28.3% of People are in the Labor Force in Juncal.