Earth, TX Map & Demographics
Earth Map
Earth Overview
$27,991
PER CAPITA INCOME
$56,827
AVG FAMILY INCOME
$52,386
AVG HOUSEHOLD INCOME
52.1%
WAGE / INCOME GAP [ % ]
47.9¢/ $1
WAGE / INCOME GAP [ $ ]
0.42
INEQUALITY / GINI INDEX
999
TOTAL POPULATION
563
MALE POPULATION
436
FEMALE POPULATION
129.13
MALES / 100 FEMALES
77.44
FEMALES / 100 MALES
40.2
MEDIAN AGE
3.9
AVG FAMILY SIZE
2.8
AVG HOUSEHOLD SIZE
428
LABOR FORCE [ PEOPLE ]
55.3%
PERCENT IN LABOR FORCE
0.2%
UNEMPLOYMENT RATE
Earth Zip Codes
Earth Area Codes
Income in Earth
Income Overview in Earth
Per Capita Income in Earth is $27,991, while median incomes of families and households are $56,827 and $52,386 respectively.
| Characteristic | Number | Measure |
| Per Capita Income | 999 | $27,991 |
| Median Family Income | 205 | $56,827 |
| Mean Family Income | 205 | $77,741 |
| Median Household Income | 357 | $52,386 |
| Mean Household Income | 357 | $70,507 |
| Income Deficit | 205 | $0 |
| Wage / Income Gap (%) | 999 | 52.15% |
| Wage / Income Gap ($) | 999 | 47.85¢ per $1 |
| Gini / Inequality Index | 999 | 0.42 |
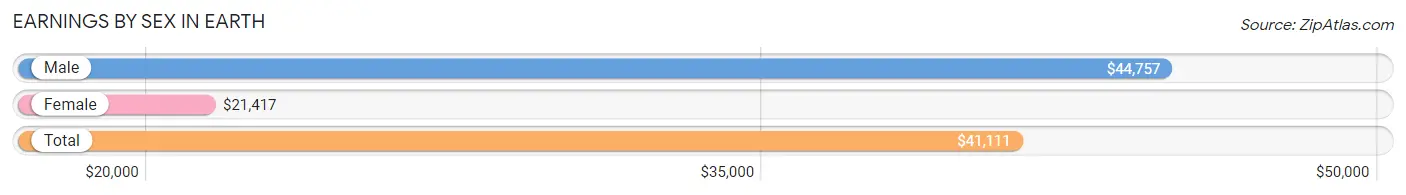
Earnings by Sex in Earth
Average Earnings in Earth are $41,111, $44,757 for men and $21,417 for women, a difference of 52.1%.
| Sex | Number | Average Earnings |
| Male | 289 (64.2%) | $44,757 |
| Female | 161 (35.8%) | $21,417 |
| Total | 450 (100.0%) | $41,111 |
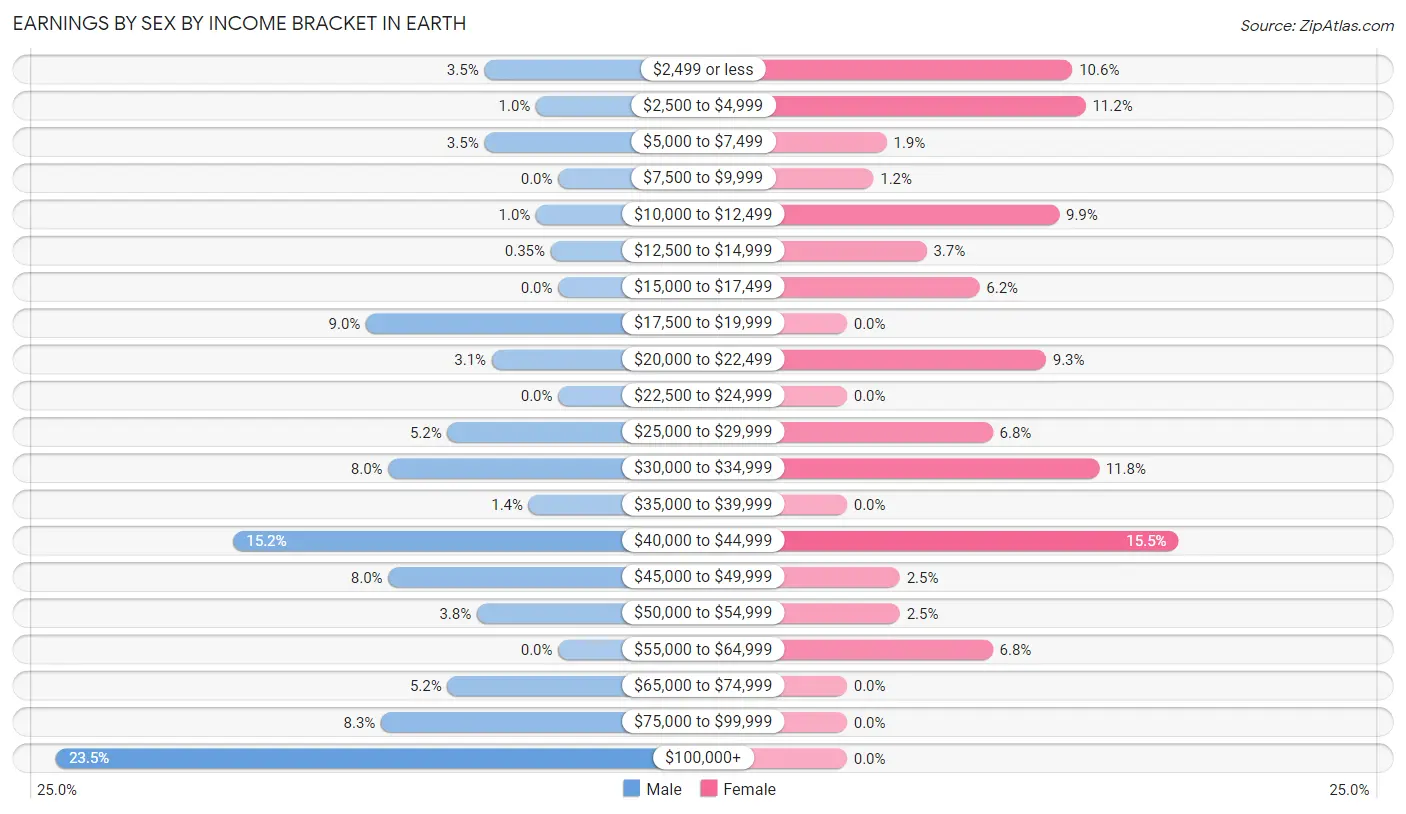
Earnings by Sex by Income Bracket in Earth
The most common earnings brackets in Earth are $100,000+ for men (68 | 23.5%) and $40,000 to $44,999 for women (25 | 15.5%).
| Income | Male | Female |
| $2,499 or less | 10 (3.5%) | 17 (10.6%) |
| $2,500 to $4,999 | 3 (1.0%) | 18 (11.2%) |
| $5,000 to $7,499 | 10 (3.5%) | 3 (1.9%) |
| $7,500 to $9,999 | 0 (0.0%) | 2 (1.2%) |
| $10,000 to $12,499 | 3 (1.0%) | 16 (9.9%) |
| $12,500 to $14,999 | 1 (0.4%) | 6 (3.7%) |
| $15,000 to $17,499 | 0 (0.0%) | 10 (6.2%) |
| $17,500 to $19,999 | 26 (9.0%) | 0 (0.0%) |
| $20,000 to $22,499 | 9 (3.1%) | 15 (9.3%) |
| $22,500 to $24,999 | 0 (0.0%) | 0 (0.0%) |
| $25,000 to $29,999 | 15 (5.2%) | 11 (6.8%) |
| $30,000 to $34,999 | 23 (8.0%) | 19 (11.8%) |
| $35,000 to $39,999 | 4 (1.4%) | 0 (0.0%) |
| $40,000 to $44,999 | 44 (15.2%) | 25 (15.5%) |
| $45,000 to $49,999 | 23 (8.0%) | 4 (2.5%) |
| $50,000 to $54,999 | 11 (3.8%) | 4 (2.5%) |
| $55,000 to $64,999 | 0 (0.0%) | 11 (6.8%) |
| $65,000 to $74,999 | 15 (5.2%) | 0 (0.0%) |
| $75,000 to $99,999 | 24 (8.3%) | 0 (0.0%) |
| $100,000+ | 68 (23.5%) | 0 (0.0%) |
| Total | 289 (100.0%) | 161 (100.0%) |
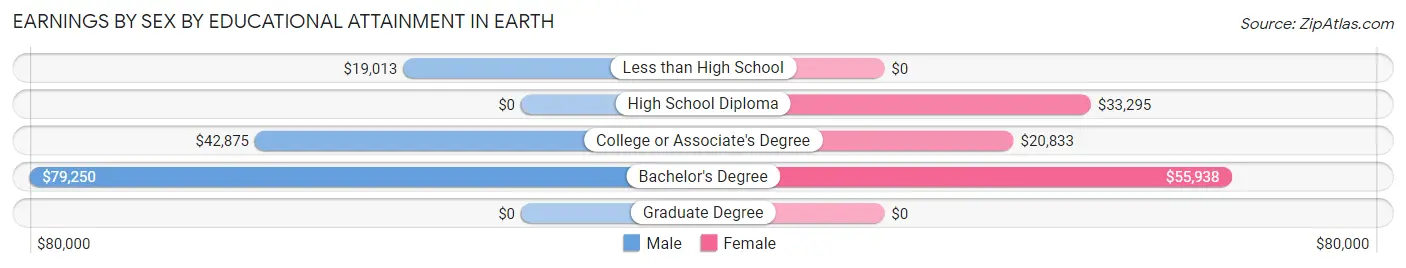
Earnings by Sex by Educational Attainment in Earth
Average earnings in Earth are $46,250 for men and $29,286 for women, a difference of 36.7%. Men with an educational attainment of bachelor's degree enjoy the highest average annual earnings of $79,250, while those with less than high school education earn the least with $19,013. Women with an educational attainment of bachelor's degree earn the most with the average annual earnings of $55,938, while those with college or associate's degree education have the smallest earnings of $20,833.
| Educational Attainment | Male Income | Female Income |
| Less than High School | $19,013 | $0 |
| High School Diploma | - | - |
| College or Associate's Degree | $42,875 | $20,833 |
| Bachelor's Degree | $79,250 | $55,938 |
| Graduate Degree | - | - |
| Total | $46,250 | $29,286 |
Family Income in Earth
Family Income Brackets in Earth
According to the Earth family income data, there are 43 families falling into the $75,000 to $99,999 income range, which is the most common income bracket and makes up 21.0% of all families.
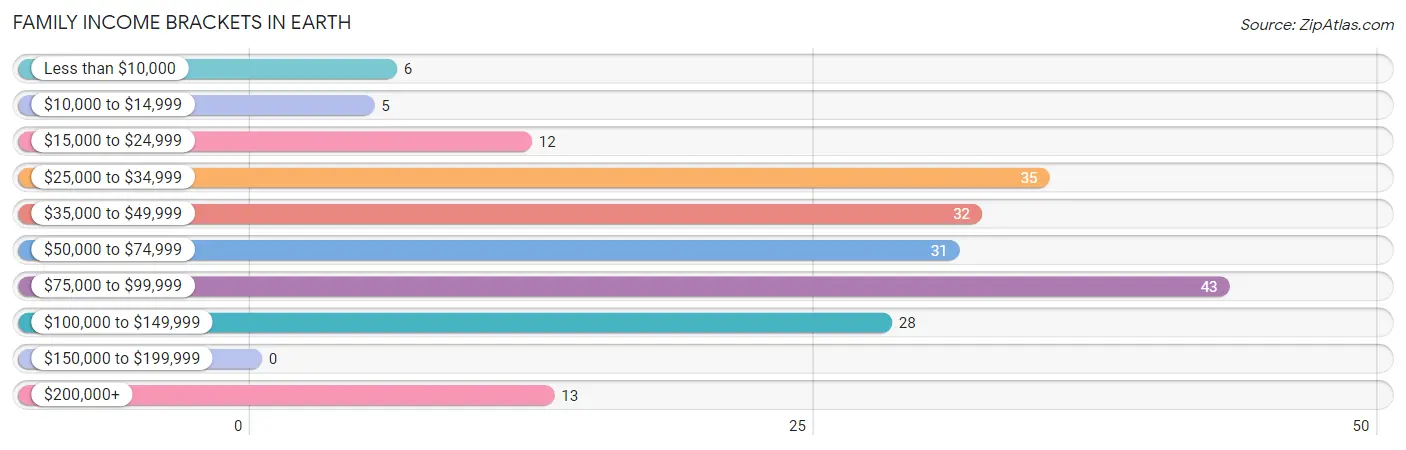
| Income Bracket | # Families | % Families |
| Less than $10,000 | 6 | 2.9% |
| $10,000 to $14,999 | 5 | 2.4% |
| $15,000 to $24,999 | 12 | 5.9% |
| $25,000 to $34,999 | 35 | 17.1% |
| $35,000 to $49,999 | 32 | 15.6% |
| $50,000 to $74,999 | 31 | 15.1% |
| $75,000 to $99,999 | 43 | 21.0% |
| $100,000 to $149,999 | 28 | 13.7% |
| $150,000 to $199,999 | 0 | 0.0% |
| $200,000+ | 13 | 6.3% |
Family Income by Famaliy Size in Earth
3-person families (49 | 23.9%) account for the highest median family income in Earth with $78,173 per family, while 3-person families (49 | 23.9%) have the highest median income of $26,058 per family member.
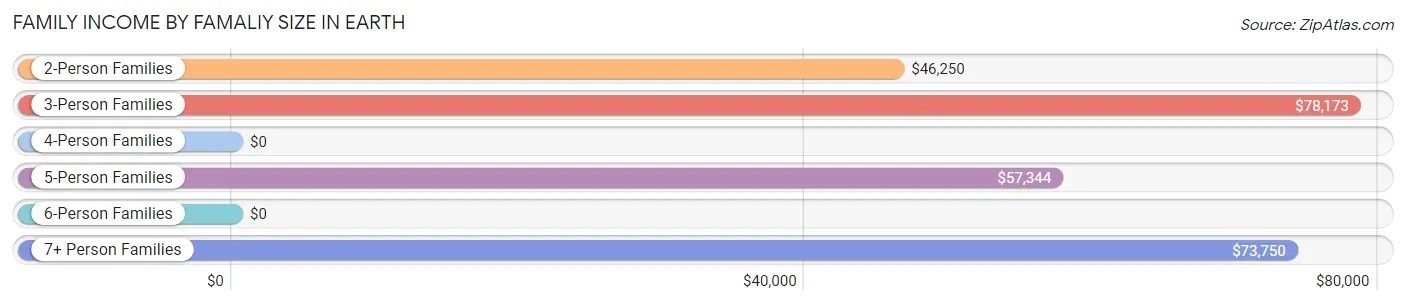
| Income Bracket | # Families | Median Income |
| 2-Person Families | 64 (31.2%) | $46,250 |
| 3-Person Families | 49 (23.9%) | $78,173 |
| 4-Person Families | 51 (24.9%) | $0 |
| 5-Person Families | 15 (7.3%) | $57,344 |
| 6-Person Families | 12 (5.9%) | $0 |
| 7+ Person Families | 14 (6.8%) | $73,750 |
| Total | 205 (100.0%) | $56,827 |
Family Income by Number of Earners in Earth
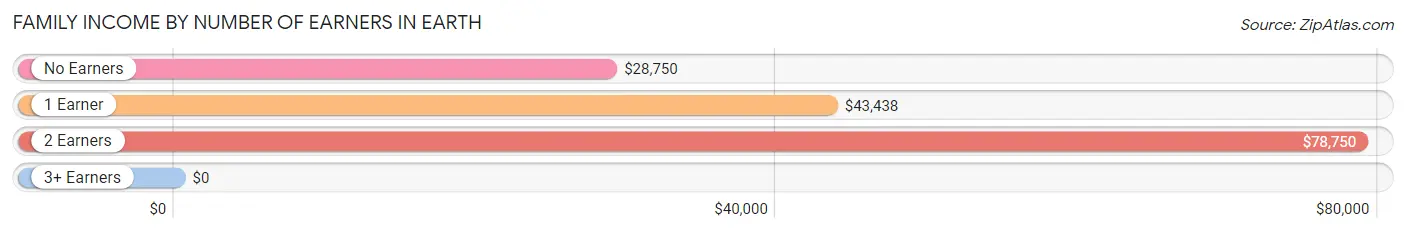
| Number of Earners | # Families | Median Income |
| No Earners | 32 (15.6%) | $28,750 |
| 1 Earner | 58 (28.3%) | $43,438 |
| 2 Earners | 108 (52.7%) | $78,750 |
| 3+ Earners | 7 (3.4%) | $0 |
| Total | 205 (100.0%) | $56,827 |
Household Income in Earth
Household Income Brackets in Earth
With 85 households falling in the category, the $100,000 to $149,999 income range is the most frequent in Earth, accounting for 23.8% of all households. In contrast, only 3 households (0.8%) fall into the $150,000 to $199,999 income bracket, making it the least populous group.
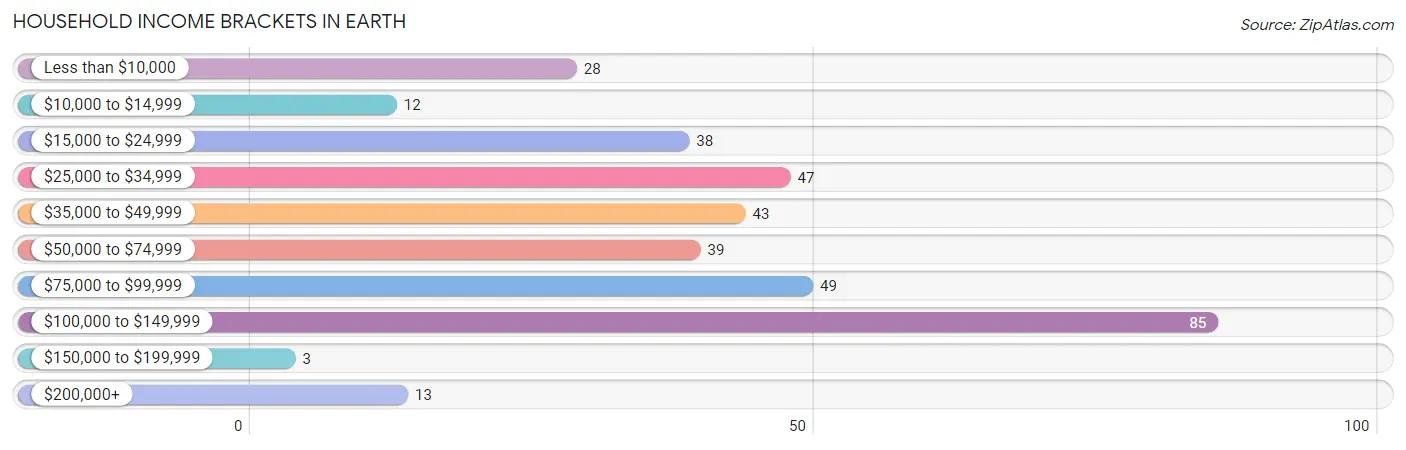
| Income Bracket | # Households | % Households |
| Less than $10,000 | 28 | 7.8% |
| $10,000 to $14,999 | 12 | 3.4% |
| $15,000 to $24,999 | 38 | 10.6% |
| $25,000 to $34,999 | 47 | 13.2% |
| $35,000 to $49,999 | 43 | 12.0% |
| $50,000 to $74,999 | 39 | 10.9% |
| $75,000 to $99,999 | 49 | 13.7% |
| $100,000 to $149,999 | 85 | 23.8% |
| $150,000 to $199,999 | 3 | 0.8% |
| $200,000+ | 13 | 3.6% |
Household Income by Householder Age in Earth
The median household income in Earth is $52,386, with the highest median household income of $91,000 found in the 45 to 64 years age bracket for the primary householder. A total of 160 households (44.8%) fall into this category. Meanwhile, the 15 to 24 years age bracket for the primary householder has the lowest median household income of $0, with 10 households (2.8%) in this group.
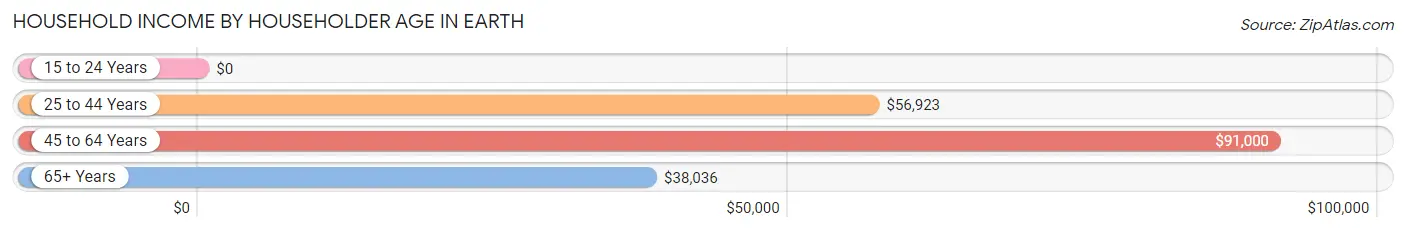
| Income Bracket | # Households | Median Income |
| 15 to 24 Years | 10 (2.8%) | $0 |
| 25 to 44 Years | 74 (20.7%) | $56,923 |
| 45 to 64 Years | 160 (44.8%) | $91,000 |
| 65+ Years | 113 (31.7%) | $38,036 |
| Total | 357 (100.0%) | $52,386 |
Poverty in Earth
Income Below Poverty by Sex and Age in Earth
With 13.0% poverty level for males and 11.5% for females among the residents of Earth, 5 year old males and 25 to 34 year old females are the most vulnerable to poverty, with 3 males (100.0%) and 12 females (31.6%) in their respective age groups living below the poverty level.
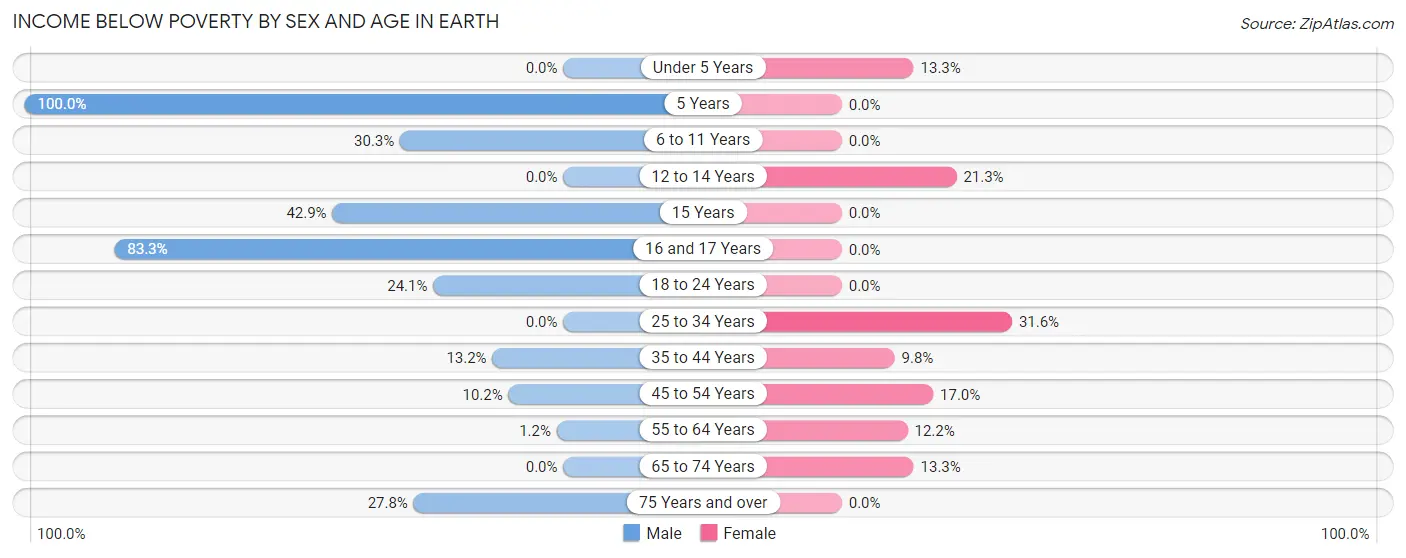
| Age Bracket | Male | Female |
| Under 5 Years | 0 (0.0%) | 2 (13.3%) |
| 5 Years | 3 (100.0%) | 0 (0.0%) |
| 6 to 11 Years | 10 (30.3%) | 0 (0.0%) |
| 12 to 14 Years | 0 (0.0%) | 10 (21.3%) |
| 15 Years | 9 (42.9%) | 0 (0.0%) |
| 16 and 17 Years | 10 (83.3%) | 0 (0.0%) |
| 18 to 24 Years | 14 (24.1%) | 0 (0.0%) |
| 25 to 34 Years | 0 (0.0%) | 12 (31.6%) |
| 35 to 44 Years | 10 (13.2%) | 5 (9.8%) |
| 45 to 54 Years | 6 (10.2%) | 10 (17.0%) |
| 55 to 64 Years | 1 (1.2%) | 5 (12.2%) |
| 65 to 74 Years | 0 (0.0%) | 6 (13.3%) |
| 75 Years and over | 10 (27.8%) | 0 (0.0%) |
| Total | 73 (13.0%) | 50 (11.5%) |
Income Above Poverty by Sex and Age in Earth
According to the poverty statistics in Earth, males aged under 5 years and females aged 5 years are the age groups that are most secure financially, with 100.0% of males and 100.0% of females in these age groups living above the poverty line.
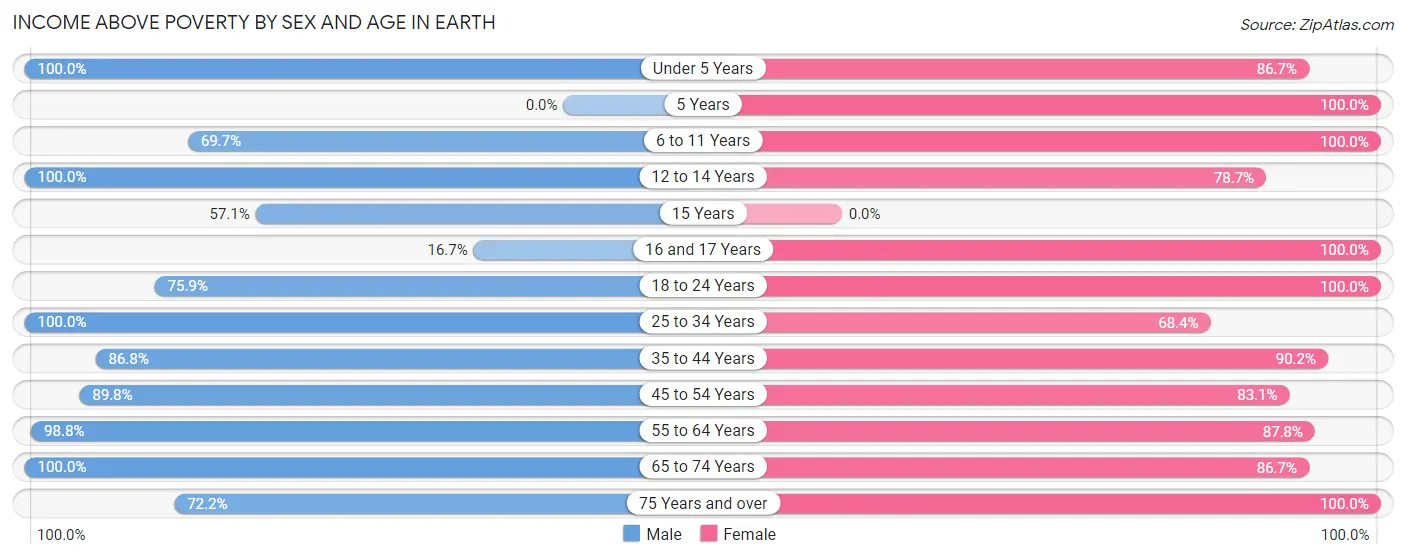
| Age Bracket | Male | Female |
| Under 5 Years | 44 (100.0%) | 13 (86.7%) |
| 5 Years | 0 (0.0%) | 7 (100.0%) |
| 6 to 11 Years | 23 (69.7%) | 34 (100.0%) |
| 12 to 14 Years | 21 (100.0%) | 37 (78.7%) |
| 15 Years | 12 (57.1%) | 0 (0.0%) |
| 16 and 17 Years | 2 (16.7%) | 39 (100.0%) |
| 18 to 24 Years | 44 (75.9%) | 29 (100.0%) |
| 25 to 34 Years | 50 (100.0%) | 26 (68.4%) |
| 35 to 44 Years | 66 (86.8%) | 46 (90.2%) |
| 45 to 54 Years | 53 (89.8%) | 49 (83.1%) |
| 55 to 64 Years | 81 (98.8%) | 36 (87.8%) |
| 65 to 74 Years | 68 (100.0%) | 39 (86.7%) |
| 75 Years and over | 26 (72.2%) | 31 (100.0%) |
| Total | 490 (87.0%) | 386 (88.5%) |
Income Below Poverty Among Married-Couple Families in Earth
The poverty statistics for married-couple families in Earth show that 5.8% or 8 of the total 139 families live below the poverty line. Families with 1 or 2 children have the highest poverty rate of 13.8%, comprising of 8 families. On the other hand, families with no children have the lowest poverty rate of 0.0%, which includes 0 families.
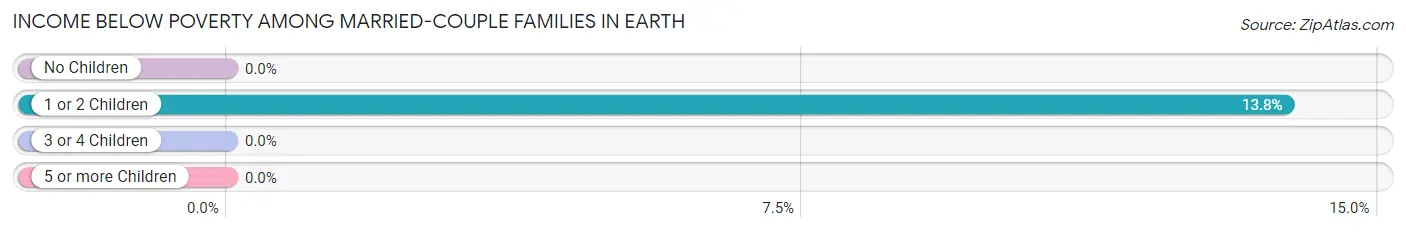
| Children | Above Poverty | Below Poverty |
| No Children | 52 (100.0%) | 0 (0.0%) |
| 1 or 2 Children | 50 (86.2%) | 8 (13.8%) |
| 3 or 4 Children | 18 (100.0%) | 0 (0.0%) |
| 5 or more Children | 11 (100.0%) | 0 (0.0%) |
| Total | 131 (94.2%) | 8 (5.8%) |
Income Below Poverty Among Single-Parent Households in Earth

| Children | Single Father | Single Mother |
| No Children | 0 (0.0%) | 0 (0.0%) |
| 1 or 2 Children | 0 (0.0%) | 5 (15.1%) |
| 3 or 4 Children | 0 (0.0%) | 4 (100.0%) |
| 5 or more Children | 0 (0.0%) | 0 (0.0%) |
| Total | 0 (0.0%) | 9 (13.6%) |
Income Below Poverty Among Married-Couple vs Single-Parent Households in Earth
The poverty data for Earth shows that 8 of the married-couple family households (5.8%) and 9 of the single-parent households (13.6%) are living below the poverty level. Within the married-couple family households, those with 1 or 2 children have the highest poverty rate, with 8 households (13.8%) falling below the poverty line. Among the single-parent households, those with 3 or 4 children have the highest poverty rate, with 4 household (100.0%) living below poverty.
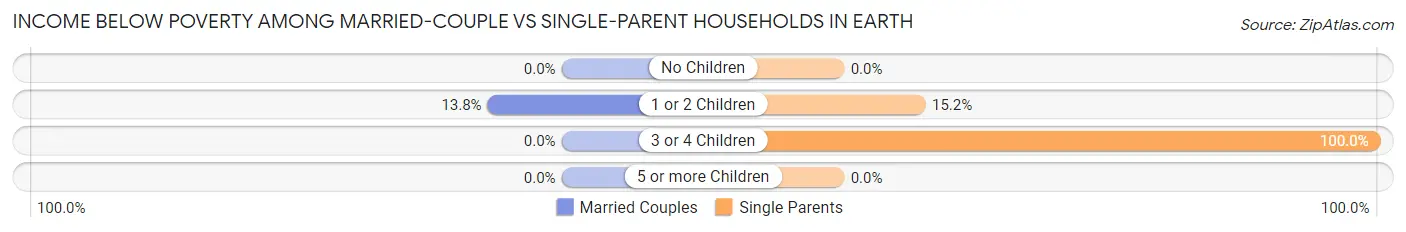
| Children | Married-Couple Families | Single-Parent Households |
| No Children | 0 (0.0%) | 0 (0.0%) |
| 1 or 2 Children | 8 (13.8%) | 5 (15.1%) |
| 3 or 4 Children | 0 (0.0%) | 4 (100.0%) |
| 5 or more Children | 0 (0.0%) | 0 (0.0%) |
| Total | 8 (5.8%) | 9 (13.6%) |
Race in Earth
The most populous races in Earth are White / Caucasian (669 | 67.0%), Hispanic or Latino (617 | 61.8%), and Two or more Races (202 | 20.2%).
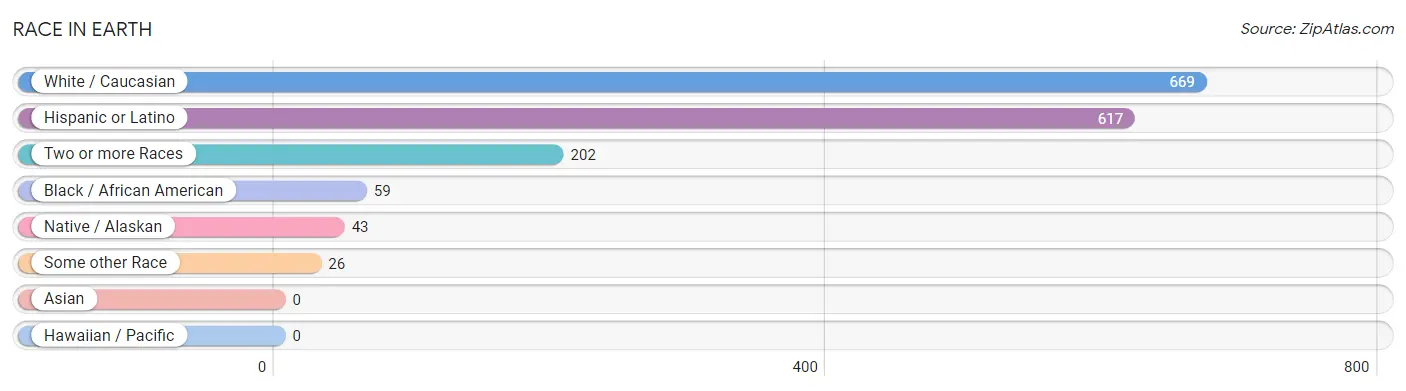
| Race | # Population | % Population |
| Asian | 0 | 0.0% |
| Black / African American | 59 | 5.9% |
| Hawaiian / Pacific | 0 | 0.0% |
| Hispanic or Latino | 617 | 61.8% |
| Native / Alaskan | 43 | 4.3% |
| White / Caucasian | 669 | 67.0% |
| Two or more Races | 202 | 20.2% |
| Some other Race | 26 | 2.6% |
| Total | 999 | 100.0% |
Ancestry in Earth
The most populous ancestries reported in Earth are Mexican (577 | 57.8%), German (75 | 7.5%), American (61 | 6.1%), Central American Indian (43 | 4.3%), and Irish (37 | 3.7%), together accounting for 79.4% of all Earth residents.
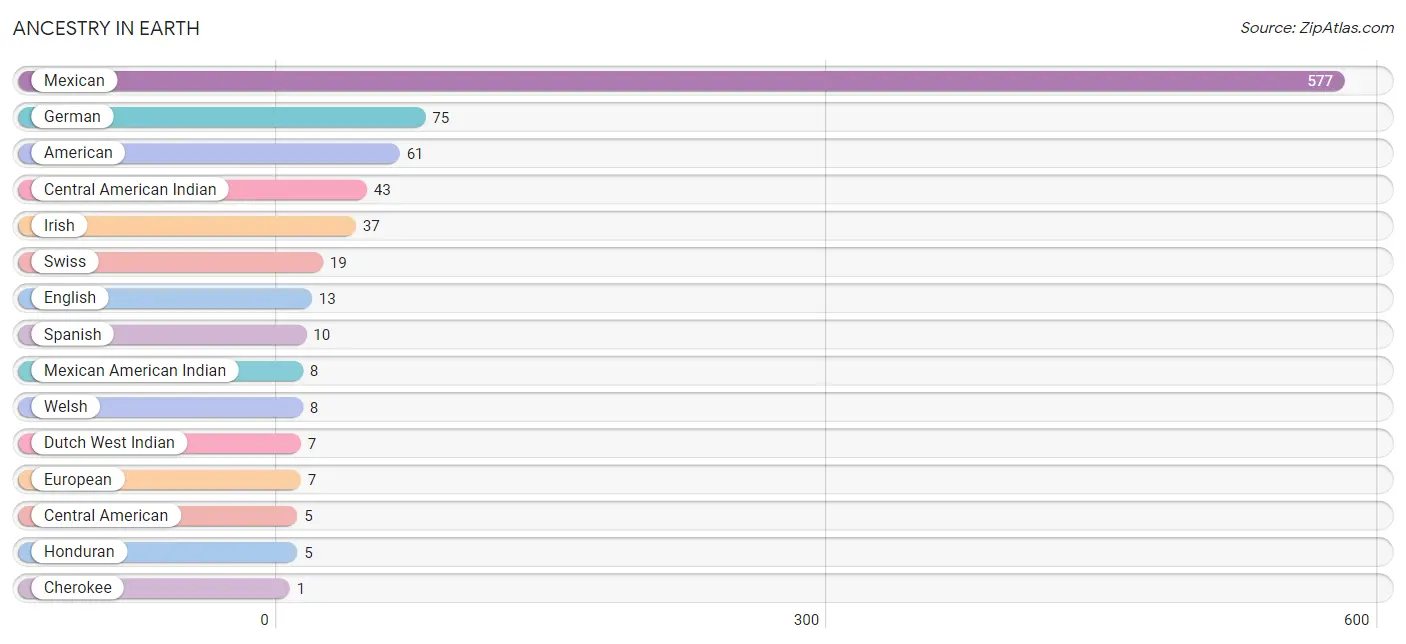
| Ancestry | # Population | % Population |
| American | 61 | 6.1% |
| Central American | 5 | 0.5% |
| Central American Indian | 43 | 4.3% |
| Cherokee | 1 | 0.1% |
| Dutch West Indian | 7 | 0.7% |
| English | 13 | 1.3% |
| European | 7 | 0.7% |
| German | 75 | 7.5% |
| Honduran | 5 | 0.5% |
| Irish | 37 | 3.7% |
| Mexican | 577 | 57.8% |
| Mexican American Indian | 8 | 0.8% |
| Spanish | 10 | 1.0% |
| Swiss | 19 | 1.9% |
| Welsh | 8 | 0.8% | View All 15 Rows |
Immigrants in Earth
The most numerous immigrant groups reported in Earth came from Central America (59 | 5.9%), Latin America (59 | 5.9%), and Mexico (59 | 5.9%), together accounting for 17.7% of all Earth residents.
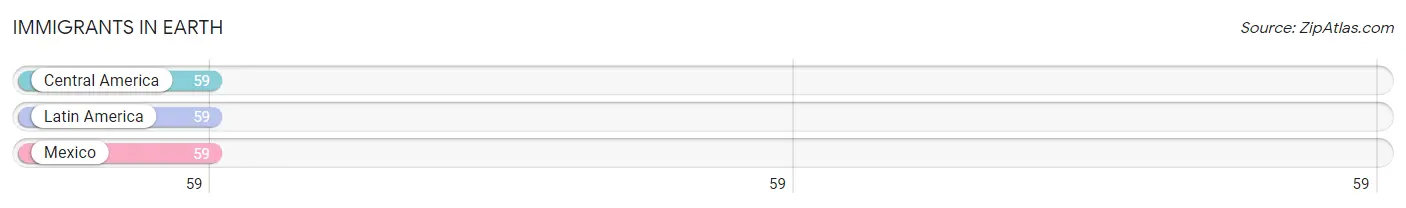
| Immigration Origin | # Population | % Population |
| Central America | 59 | 5.9% |
| Latin America | 59 | 5.9% |
| Mexico | 59 | 5.9% | View All 3 Rows |
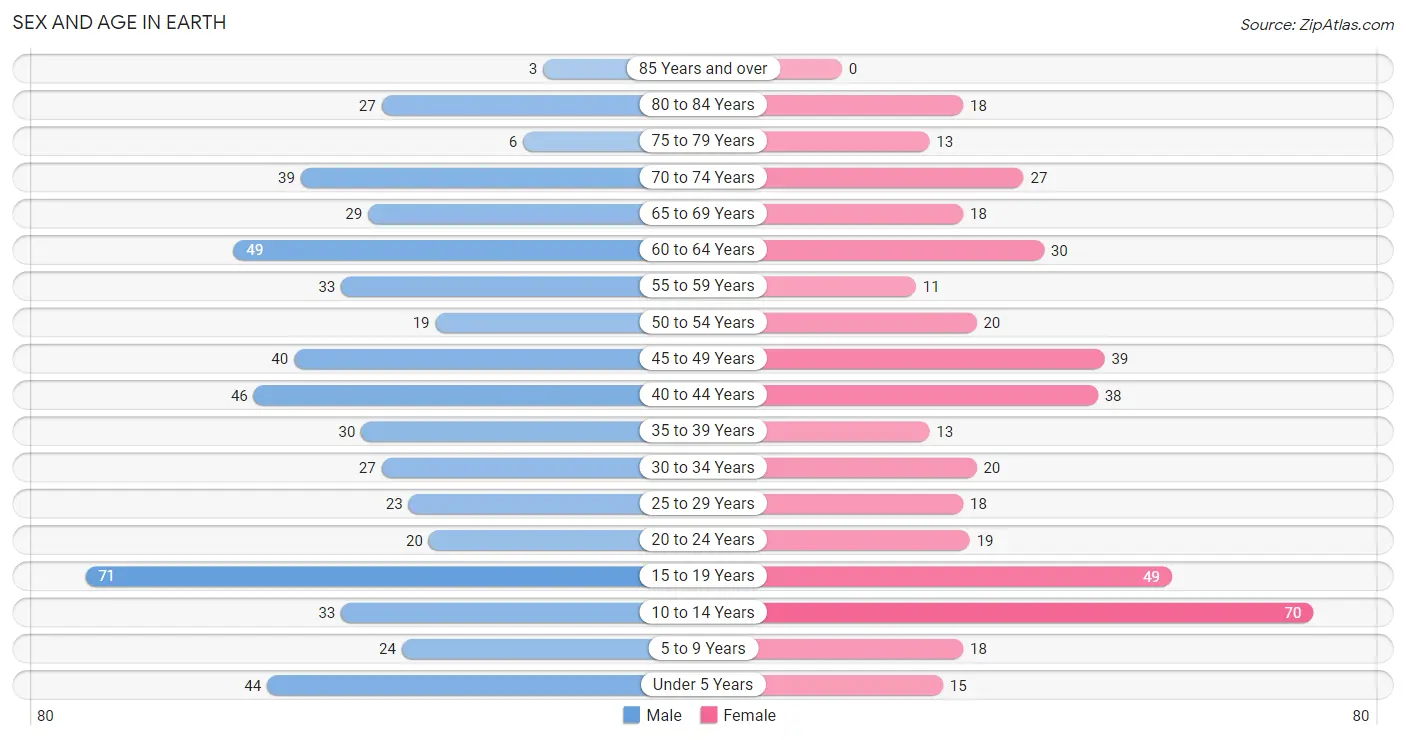
Sex and Age in Earth
Sex and Age in Earth
The most populous age groups in Earth are 15 to 19 Years (71 | 12.6%) for men and 10 to 14 Years (70 | 16.1%) for women.
| Age Bracket | Male | Female |
| Under 5 Years | 44 (7.8%) | 15 (3.4%) |
| 5 to 9 Years | 24 (4.3%) | 18 (4.1%) |
| 10 to 14 Years | 33 (5.9%) | 70 (16.1%) |
| 15 to 19 Years | 71 (12.6%) | 49 (11.2%) |
| 20 to 24 Years | 20 (3.5%) | 19 (4.4%) |
| 25 to 29 Years | 23 (4.1%) | 18 (4.1%) |
| 30 to 34 Years | 27 (4.8%) | 20 (4.6%) |
| 35 to 39 Years | 30 (5.3%) | 13 (3.0%) |
| 40 to 44 Years | 46 (8.2%) | 38 (8.7%) |
| 45 to 49 Years | 40 (7.1%) | 39 (8.9%) |
| 50 to 54 Years | 19 (3.4%) | 20 (4.6%) |
| 55 to 59 Years | 33 (5.9%) | 11 (2.5%) |
| 60 to 64 Years | 49 (8.7%) | 30 (6.9%) |
| 65 to 69 Years | 29 (5.1%) | 18 (4.1%) |
| 70 to 74 Years | 39 (6.9%) | 27 (6.2%) |
| 75 to 79 Years | 6 (1.1%) | 13 (3.0%) |
| 80 to 84 Years | 27 (4.8%) | 18 (4.1%) |
| 85 Years and over | 3 (0.5%) | 0 (0.0%) |
| Total | 563 (100.0%) | 436 (100.0%) |
Families and Households in Earth
Median Family Size in Earth
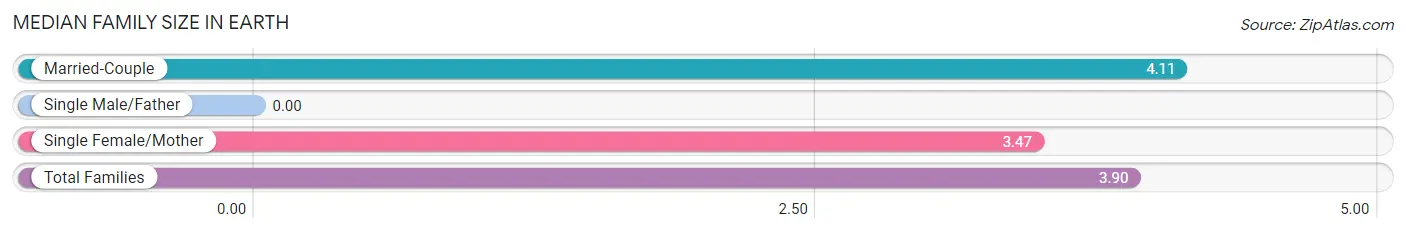
| Family Type | # Families | Family Size |
| Married-Couple | 139 (67.8%) | 4.11 |
| Single Male/Father | 0 (0.0%) | - |
| Single Female/Mother | 66 (32.2%) | 3.47 |
| Total Families | 205 (100.0%) | 3.90 |
Median Household Size in Earth
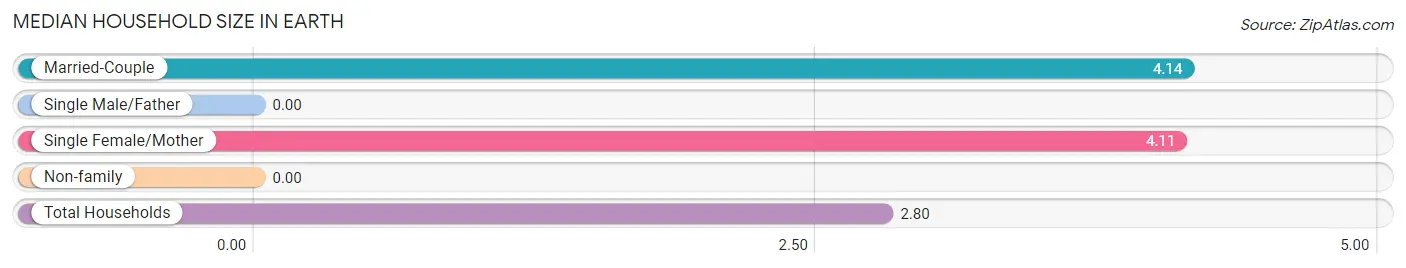
| Household Type | # Households | Household Size |
| Married-Couple | 139 (38.9%) | 4.14 |
| Single Male/Father | 0 (0.0%) | - |
| Single Female/Mother | 66 (18.5%) | 4.11 |
| Non-family | 152 (42.6%) | - |
| Total Households | 357 (100.0%) | 2.80 |
Household Size by Marriage Status in Earth
Out of a total of 357 households in Earth, 205 (57.4%) are family households, while 152 (42.6%) are nonfamily households. The most numerous type of family households are 4-person households, comprising 63, and the most common type of nonfamily households are 1-person households, comprising 152.
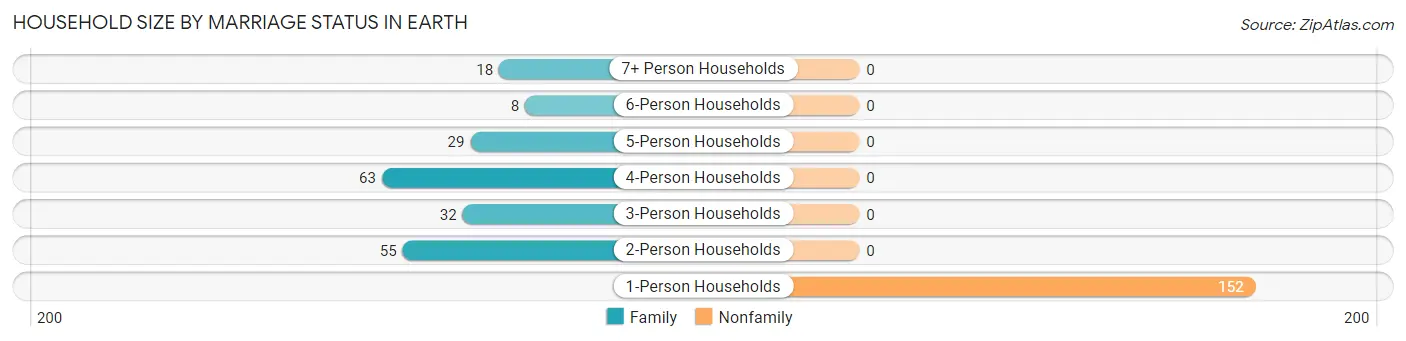
| Household Size | Family Households | Nonfamily Households |
| 1-Person Households | - | 152 (42.6%) |
| 2-Person Households | 55 (15.4%) | 0 (0.0%) |
| 3-Person Households | 32 (9.0%) | 0 (0.0%) |
| 4-Person Households | 63 (17.6%) | 0 (0.0%) |
| 5-Person Households | 29 (8.1%) | 0 (0.0%) |
| 6-Person Households | 8 (2.2%) | 0 (0.0%) |
| 7+ Person Households | 18 (5.0%) | 0 (0.0%) |
| Total | 205 (57.4%) | 152 (42.6%) |
Female Fertility in Earth
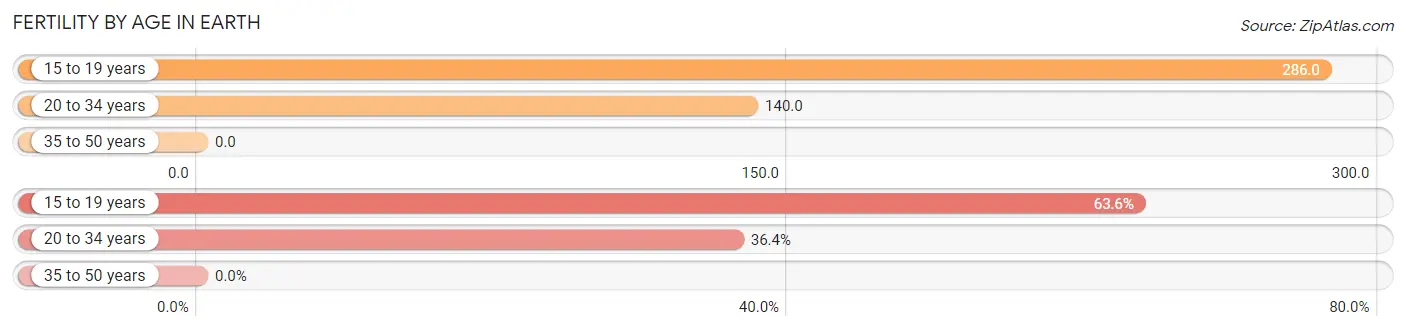
Fertility by Age in Earth
Average fertility rate in Earth is 107.0 births per 1,000 women. Women in the age bracket of 15 to 19 years have the highest fertility rate with 286.0 births per 1,000 women. Women in the age bracket of 15 to 19 years acount for 63.6% of all women with births.
| Age Bracket | Women with Births | Births / 1,000 Women |
| 15 to 19 years | 14 (63.6%) | 286.0 |
| 20 to 34 years | 8 (36.4%) | 140.0 |
| 35 to 50 years | 0 (0.0%) | 0.0 |
| Total | 22 (100.0%) | 107.0 |
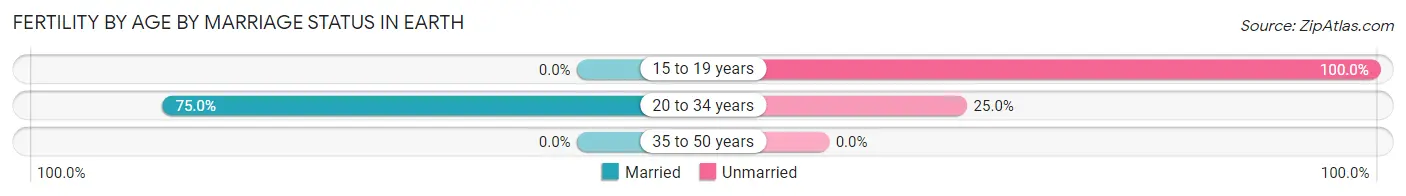
Fertility by Age by Marriage Status in Earth
27.3% of women with births (22) in Earth are married. The highest percentage of unmarried women with births falls into 15 to 19 years age bracket with 100.0% of them unmarried at the time of birth, while the lowest percentage of unmarried women with births belong to 20 to 34 years age bracket with 25.0% of them unmarried.
| Age Bracket | Married | Unmarried |
| 15 to 19 years | 0 (0.0%) | 14 (100.0%) |
| 20 to 34 years | 6 (75.0%) | 2 (25.0%) |
| 35 to 50 years | 0 (0.0%) | 0 (0.0%) |
| Total | 6 (27.3%) | 16 (72.7%) |
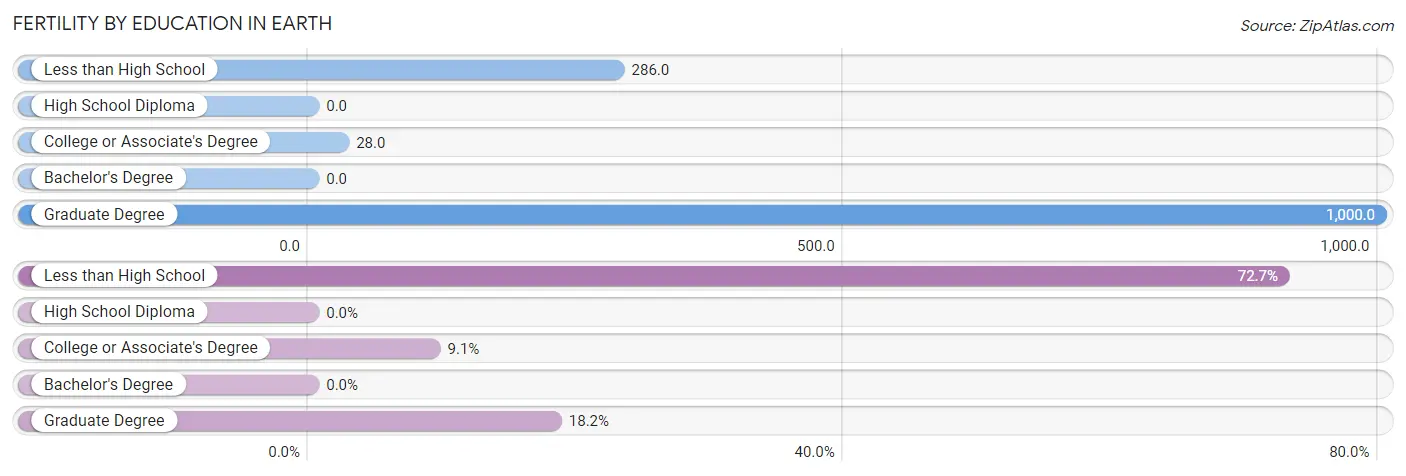
Fertility by Education in Earth
| Educational Attainment | Women with Births | Births / 1,000 Women |
| Less than High School | 16 (72.7%) | 286.0 |
| High School Diploma | 0 (0.0%) | 0.0 |
| College or Associate's Degree | 2 (9.1%) | 28.0 |
| Bachelor's Degree | 0 (0.0%) | 0.0 |
| Graduate Degree | 4 (18.2%) | 1,000.0 |
| Total | 22 (100.0%) | 107.0 |
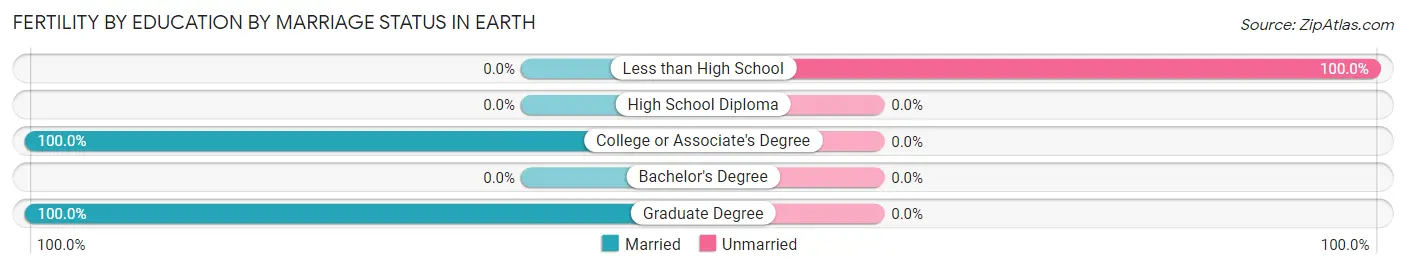
Fertility by Education by Marriage Status in Earth
72.7% of women with births in Earth are unmarried. Women with the educational attainment of college or associate's degree are most likely to be married with 100.0% of them married at childbirth, while women with the educational attainment of less than high school are least likely to be married with 100.0% of them unmarried at childbirth.
| Educational Attainment | Married | Unmarried |
| Less than High School | 0 (0.0%) | 16 (100.0%) |
| High School Diploma | 0 (0.0%) | 0 (0.0%) |
| College or Associate's Degree | 2 (100.0%) | 0 (0.0%) |
| Bachelor's Degree | 0 (0.0%) | 0 (0.0%) |
| Graduate Degree | 4 (100.0%) | 0 (0.0%) |
| Total | 6 (27.3%) | 16 (72.7%) |
Employment Characteristics in Earth
Employment by Class of Employer in Earth
Among the 421 employed individuals in Earth, private company employees (285 | 67.7%), local government employees (64 | 15.2%), and not-for-profit organizations (25 | 5.9%) make up the most common classes of employment.
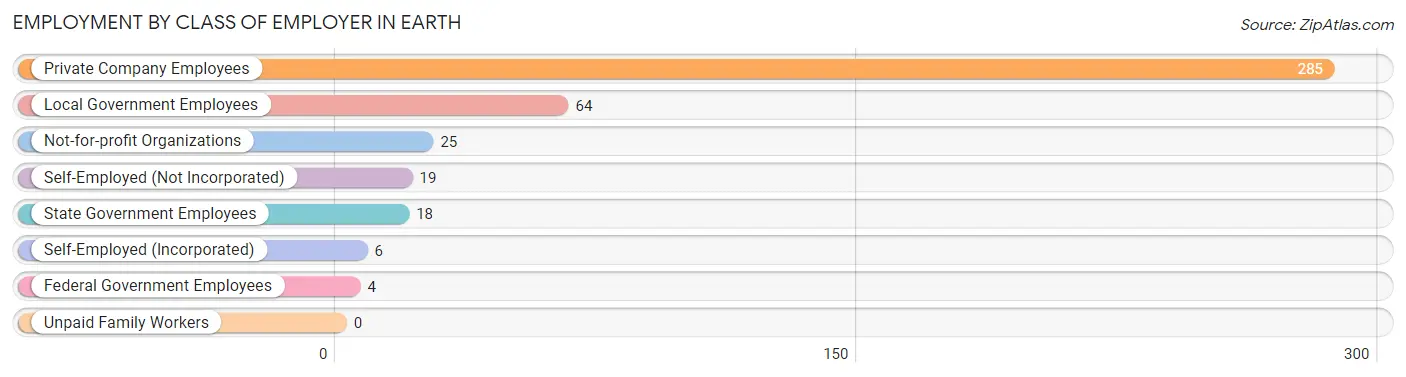
| Employer Class | # Employees | % Employees |
| Private Company Employees | 285 | 67.7% |
| Self-Employed (Incorporated) | 6 | 1.4% |
| Self-Employed (Not Incorporated) | 19 | 4.5% |
| Not-for-profit Organizations | 25 | 5.9% |
| Local Government Employees | 64 | 15.2% |
| State Government Employees | 18 | 4.3% |
| Federal Government Employees | 4 | 0.9% |
| Unpaid Family Workers | 0 | 0.0% |
| Total | 421 | 100.0% |
Employment Status by Age in Earth
According to the labor force statistics for Earth, out of the total population over 16 years of age (774), 55.3% or 428 individuals are in the labor force, with 0.2% or 1 of them unemployed. The age group with the highest labor force participation rate is 45 to 54 years, with 89.8% or 106 individuals in the labor force. Within the labor force, the 65 to 74 years age range has the highest percentage of unemployed individuals, with 2.8% or 1 of them being unemployed.
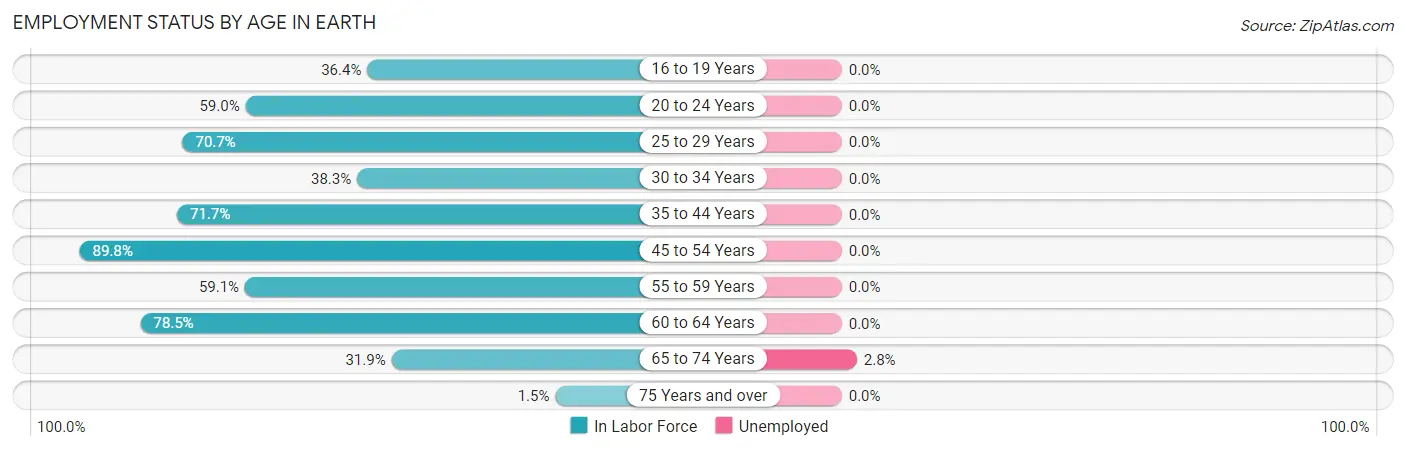
| Age Bracket | In Labor Force | Unemployed |
| 16 to 19 Years | 36 (36.4%) | 0 (0.0%) |
| 20 to 24 Years | 23 (59.0%) | 0 (0.0%) |
| 25 to 29 Years | 29 (70.7%) | 0 (0.0%) |
| 30 to 34 Years | 18 (38.3%) | 0 (0.0%) |
| 35 to 44 Years | 91 (71.7%) | 0 (0.0%) |
| 45 to 54 Years | 106 (89.8%) | 0 (0.0%) |
| 55 to 59 Years | 26 (59.1%) | 0 (0.0%) |
| 60 to 64 Years | 62 (78.5%) | 0 (0.0%) |
| 65 to 74 Years | 36 (31.9%) | 1 (2.8%) |
| 75 Years and over | 1 (1.5%) | 0 (0.0%) |
| Total | 428 (55.3%) | 1 (0.2%) |
Employment Status by Educational Attainment in Earth

| Educational Attainment | In Labor Force | Unemployed |
| Less than High School | 41 (43.2%) | 0 (0.0%) |
| High School Diploma | 151 (78.6%) | 0 (0.0%) |
| College / Associate Degree | 99 (77.3%) | 0 (0.0%) |
| Bachelor's Degree or higher | 41 (100.0%) | 0 (0.0%) |
| Total | 332 (72.8%) | 0 (0.0%) |
Employment Occupations by Sex in Earth
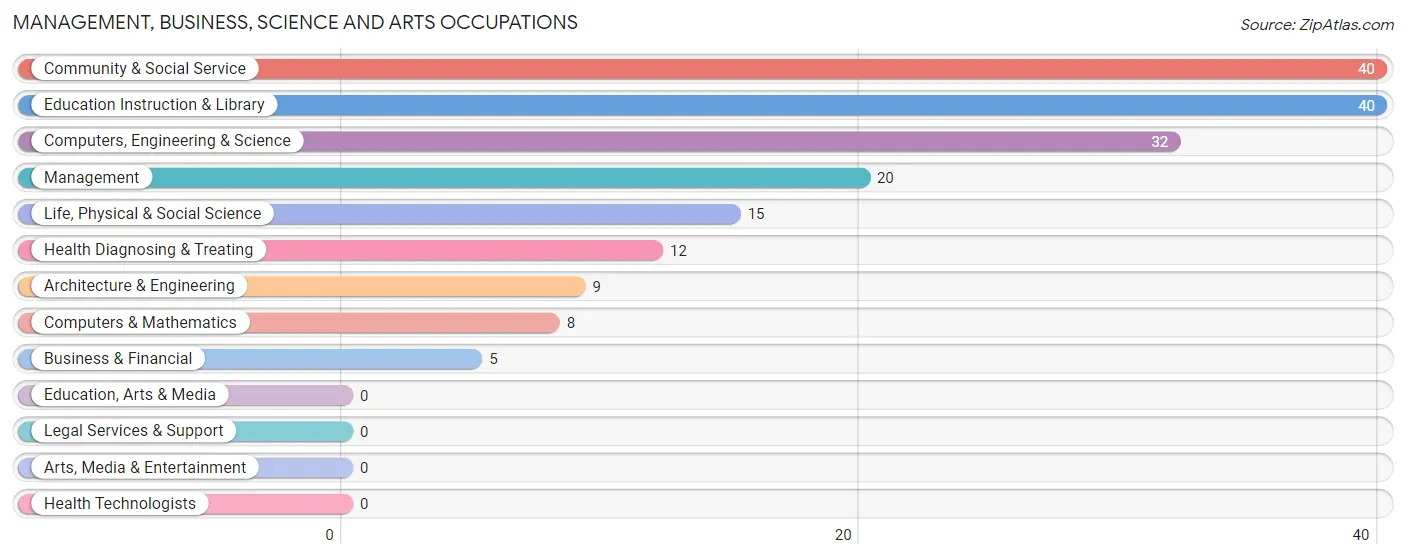
Management, Business, Science and Arts Occupations
The most common Management, Business, Science and Arts occupations in Earth are Community & Social Service (40 | 9.4%), Education Instruction & Library (40 | 9.4%), Computers, Engineering & Science (32 | 7.5%), Management (20 | 4.7%), and Life, Physical & Social Science (15 | 3.5%).
Management, Business, Science and Arts Occupations by Sex
Within the Management, Business, Science and Arts occupations in Earth, the most male-oriented occupations are Management (100.0%), Business & Financial (100.0%), and Computers & Mathematics (100.0%), while the most female-oriented occupations are Life, Physical & Social Science (100.0%), Community & Social Service (95.0%), and Education Instruction & Library (95.0%).
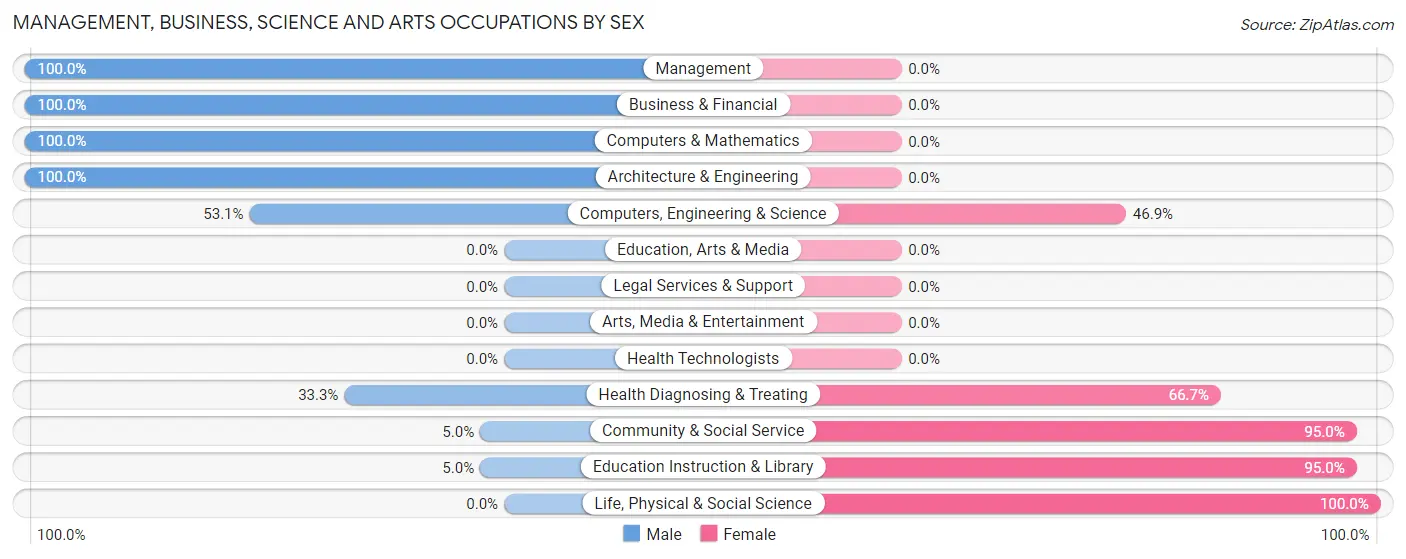
| Occupation | Male | Female |
| Management | 20 (100.0%) | 0 (0.0%) |
| Business & Financial | 5 (100.0%) | 0 (0.0%) |
| Computers, Engineering & Science | 17 (53.1%) | 15 (46.9%) |
| Computers & Mathematics | 8 (100.0%) | 0 (0.0%) |
| Architecture & Engineering | 9 (100.0%) | 0 (0.0%) |
| Life, Physical & Social Science | 0 (0.0%) | 15 (100.0%) |
| Community & Social Service | 2 (5.0%) | 38 (95.0%) |
| Education, Arts & Media | 0 (0.0%) | 0 (0.0%) |
| Legal Services & Support | 0 (0.0%) | 0 (0.0%) |
| Education Instruction & Library | 2 (5.0%) | 38 (95.0%) |
| Arts, Media & Entertainment | 0 (0.0%) | 0 (0.0%) |
| Health Diagnosing & Treating | 4 (33.3%) | 8 (66.7%) |
| Health Technologists | 0 (0.0%) | 0 (0.0%) |
| Total (Category) | 48 (44.0%) | 61 (56.0%) |
| Total (Overall) | 275 (64.4%) | 152 (35.6%) |
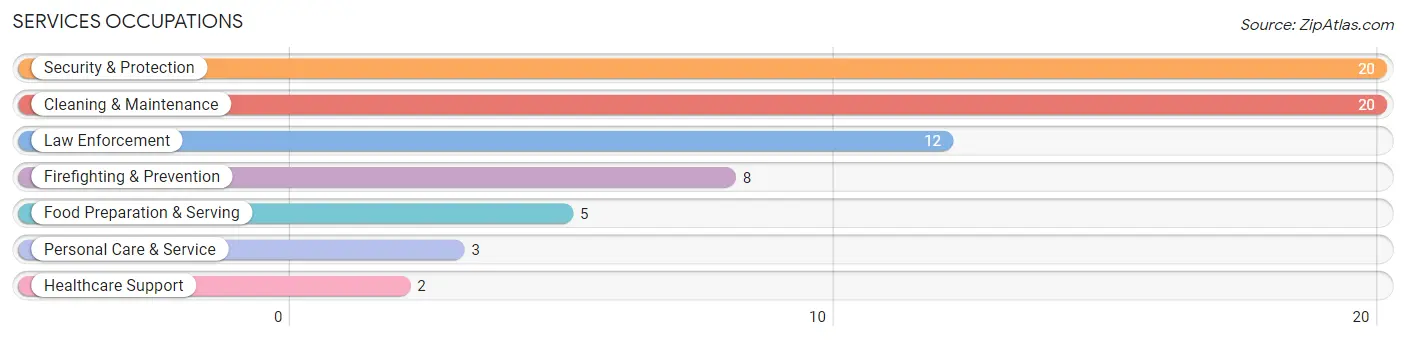
Services Occupations
The most common Services occupations in Earth are Security & Protection (20 | 4.7%), Cleaning & Maintenance (20 | 4.7%), Law Enforcement (12 | 2.8%), Firefighting & Prevention (8 | 1.9%), and Food Preparation & Serving (5 | 1.2%).
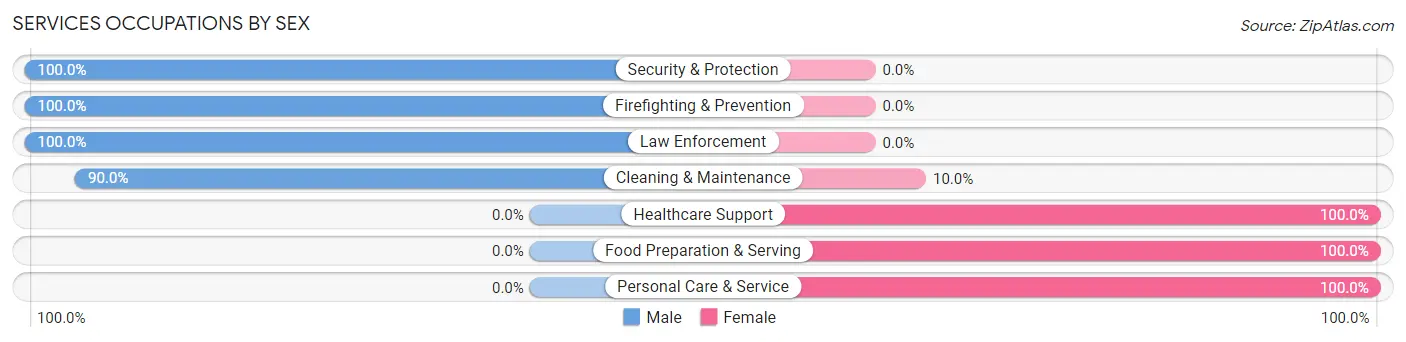
Services Occupations by Sex
Within the Services occupations in Earth, the most male-oriented occupations are Security & Protection (100.0%), Firefighting & Prevention (100.0%), and Law Enforcement (100.0%), while the most female-oriented occupations are Healthcare Support (100.0%), Food Preparation & Serving (100.0%), and Personal Care & Service (100.0%).
| Occupation | Male | Female |
| Healthcare Support | 0 (0.0%) | 2 (100.0%) |
| Security & Protection | 20 (100.0%) | 0 (0.0%) |
| Firefighting & Prevention | 8 (100.0%) | 0 (0.0%) |
| Law Enforcement | 12 (100.0%) | 0 (0.0%) |
| Food Preparation & Serving | 0 (0.0%) | 5 (100.0%) |
| Cleaning & Maintenance | 18 (90.0%) | 2 (10.0%) |
| Personal Care & Service | 0 (0.0%) | 3 (100.0%) |
| Total (Category) | 38 (76.0%) | 12 (24.0%) |
| Total (Overall) | 275 (64.4%) | 152 (35.6%) |
Sales and Office Occupations
The most common Sales and Office occupations in Earth are Office & Administration (46 | 10.8%), and Sales & Related (37 | 8.7%).

Sales and Office Occupations by Sex

| Occupation | Male | Female |
| Sales & Related | 19 (51.3%) | 18 (48.6%) |
| Office & Administration | 0 (0.0%) | 46 (100.0%) |
| Total (Category) | 19 (22.9%) | 64 (77.1%) |
| Total (Overall) | 275 (64.4%) | 152 (35.6%) |
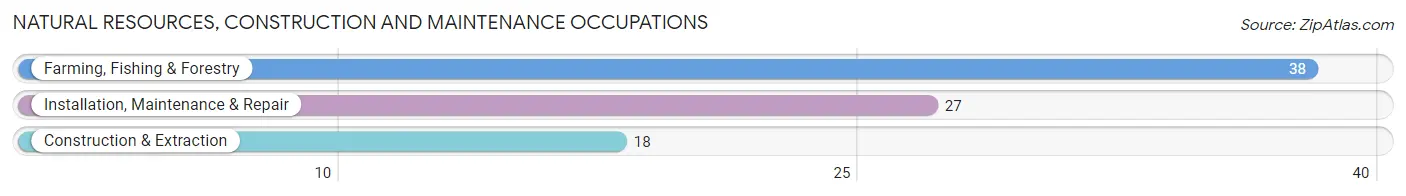
Natural Resources, Construction and Maintenance Occupations
The most common Natural Resources, Construction and Maintenance occupations in Earth are Farming, Fishing & Forestry (38 | 8.9%), Installation, Maintenance & Repair (27 | 6.3%), and Construction & Extraction (18 | 4.2%).
Natural Resources, Construction and Maintenance Occupations by Sex

| Occupation | Male | Female |
| Farming, Fishing & Forestry | 38 (100.0%) | 0 (0.0%) |
| Construction & Extraction | 16 (88.9%) | 2 (11.1%) |
| Installation, Maintenance & Repair | 27 (100.0%) | 0 (0.0%) |
| Total (Category) | 81 (97.6%) | 2 (2.4%) |
| Total (Overall) | 275 (64.4%) | 152 (35.6%) |
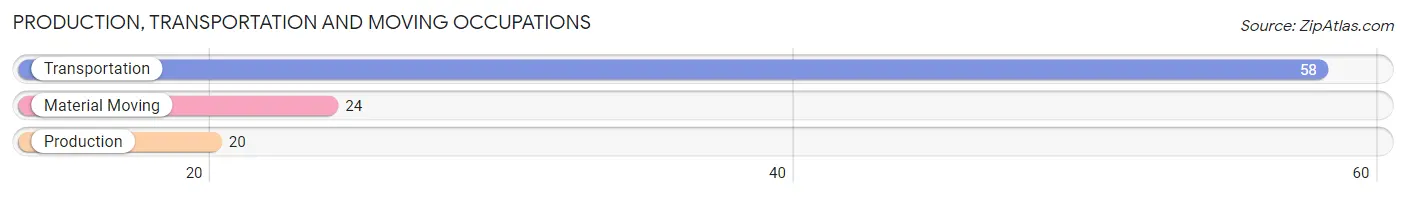
Production, Transportation and Moving Occupations
The most common Production, Transportation and Moving occupations in Earth are Transportation (58 | 13.6%), Material Moving (24 | 5.6%), and Production (20 | 4.7%).
Production, Transportation and Moving Occupations by Sex
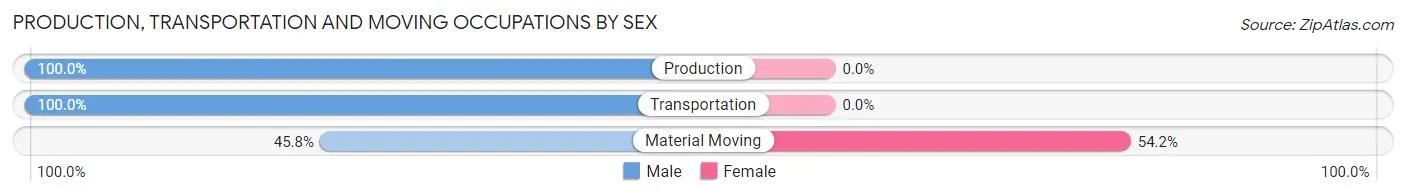
| Occupation | Male | Female |
| Production | 20 (100.0%) | 0 (0.0%) |
| Transportation | 58 (100.0%) | 0 (0.0%) |
| Material Moving | 11 (45.8%) | 13 (54.2%) |
| Total (Category) | 89 (87.3%) | 13 (12.8%) |
| Total (Overall) | 275 (64.4%) | 152 (35.6%) |
Employment Industries by Sex in Earth
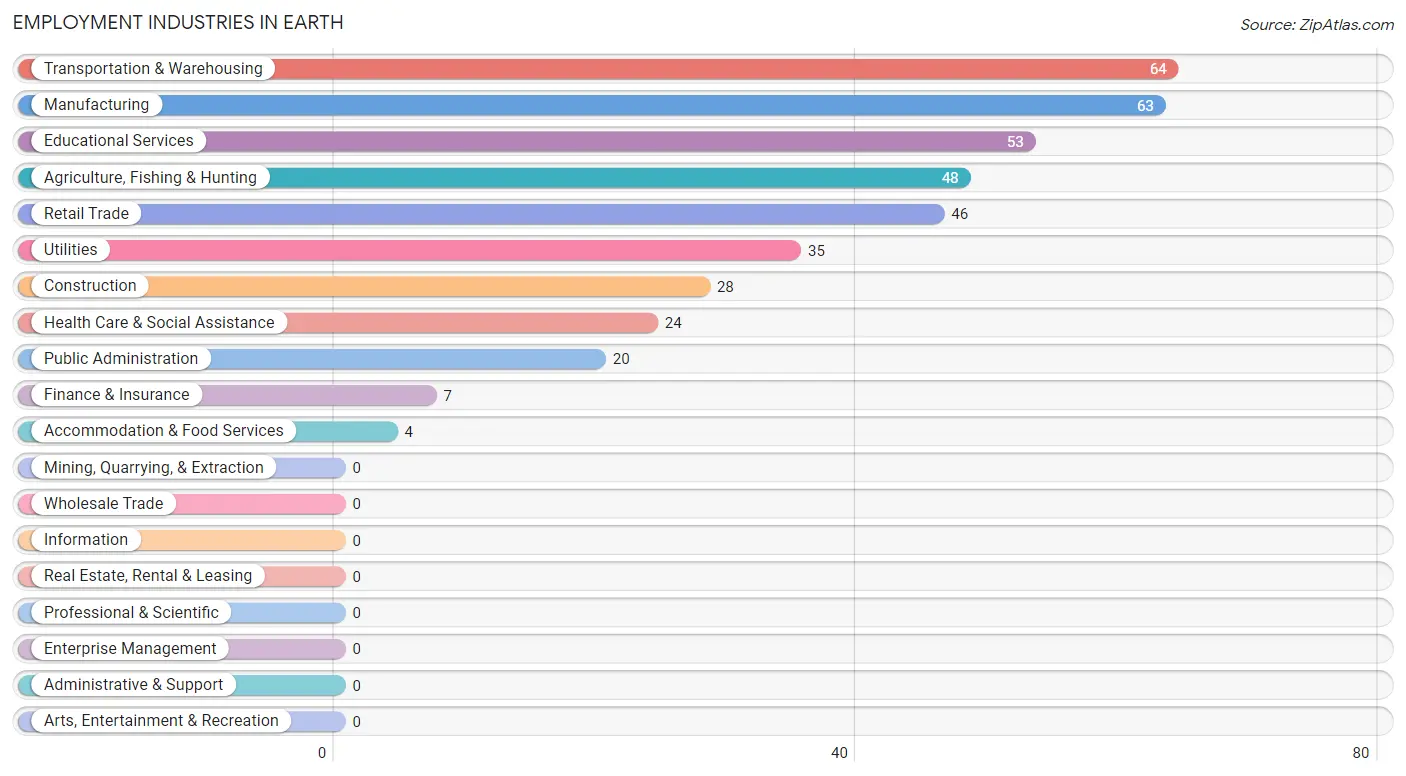
Employment Industries in Earth
The major employment industries in Earth include Transportation & Warehousing (64 | 15.0%), Manufacturing (63 | 14.7%), Educational Services (53 | 12.4%), Agriculture, Fishing & Hunting (48 | 11.2%), and Retail Trade (46 | 10.8%).
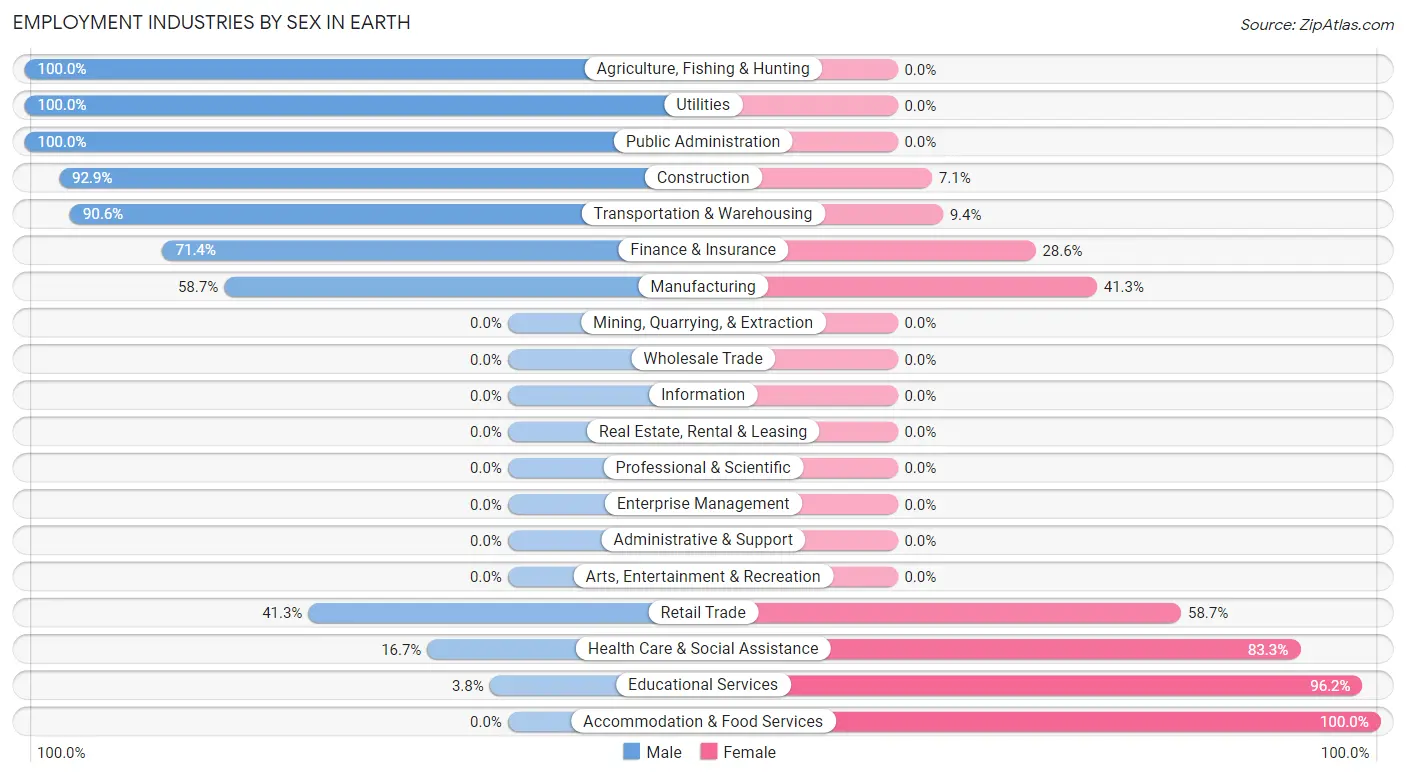
Employment Industries by Sex in Earth
The Earth industries that see more men than women are Agriculture, Fishing & Hunting (100.0%), Utilities (100.0%), and Public Administration (100.0%), whereas the industries that tend to have a higher number of women are Accommodation & Food Services (100.0%), Educational Services (96.2%), and Health Care & Social Assistance (83.3%).
| Industry | Male | Female |
| Agriculture, Fishing & Hunting | 48 (100.0%) | 0 (0.0%) |
| Mining, Quarrying, & Extraction | 0 (0.0%) | 0 (0.0%) |
| Construction | 26 (92.9%) | 2 (7.1%) |
| Manufacturing | 37 (58.7%) | 26 (41.3%) |
| Wholesale Trade | 0 (0.0%) | 0 (0.0%) |
| Retail Trade | 19 (41.3%) | 27 (58.7%) |
| Transportation & Warehousing | 58 (90.6%) | 6 (9.4%) |
| Utilities | 35 (100.0%) | 0 (0.0%) |
| Information | 0 (0.0%) | 0 (0.0%) |
| Finance & Insurance | 5 (71.4%) | 2 (28.6%) |
| Real Estate, Rental & Leasing | 0 (0.0%) | 0 (0.0%) |
| Professional & Scientific | 0 (0.0%) | 0 (0.0%) |
| Enterprise Management | 0 (0.0%) | 0 (0.0%) |
| Administrative & Support | 0 (0.0%) | 0 (0.0%) |
| Educational Services | 2 (3.8%) | 51 (96.2%) |
| Health Care & Social Assistance | 4 (16.7%) | 20 (83.3%) |
| Arts, Entertainment & Recreation | 0 (0.0%) | 0 (0.0%) |
| Accommodation & Food Services | 0 (0.0%) | 4 (100.0%) |
| Public Administration | 20 (100.0%) | 0 (0.0%) |
| Total | 275 (64.4%) | 152 (35.6%) |
Education in Earth
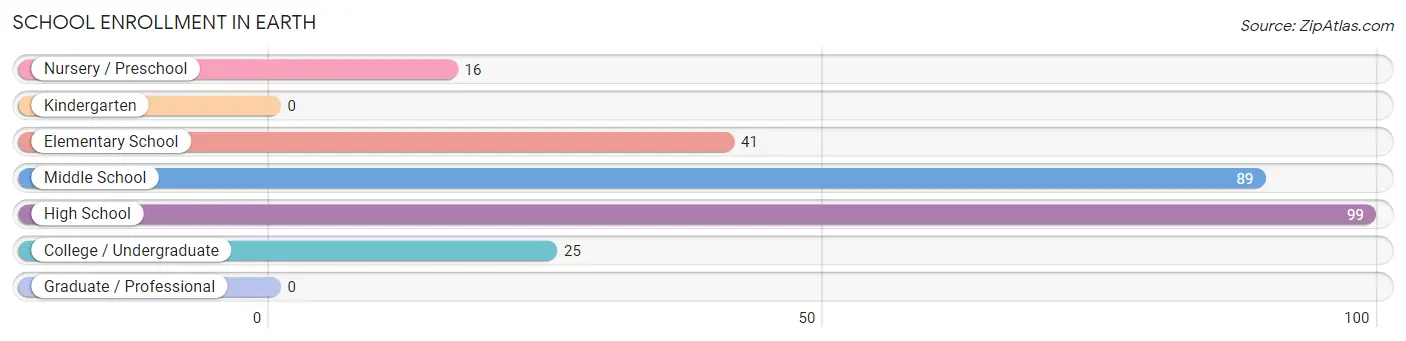
School Enrollment in Earth
The most common levels of schooling among the 270 students in Earth are high school (99 | 36.7%), middle school (89 | 33.0%), and elementary school (41 | 15.2%).
| School Level | # Students | % Students |
| Nursery / Preschool | 16 | 5.9% |
| Kindergarten | 0 | 0.0% |
| Elementary School | 41 | 15.2% |
| Middle School | 89 | 33.0% |
| High School | 99 | 36.7% |
| College / Undergraduate | 25 | 9.3% |
| Graduate / Professional | 0 | 0.0% |
| Total | 270 | 100.0% |
School Enrollment by Age by Funding Source in Earth
Out of a total of 270 students who are enrolled in schools in Earth, 9 (3.3%) attend a private institution, while the remaining 261 (96.7%) are enrolled in public schools. The age group of 10 to 14 year olds has the highest likelihood of being enrolled in private schools, with 9 (9.2% in the age bracket) enrolled. Conversely, the age group of 3 to 4 year olds has the lowest likelihood of being enrolled in a private school, with 6 (100.0% in the age bracket) attending a public institution.
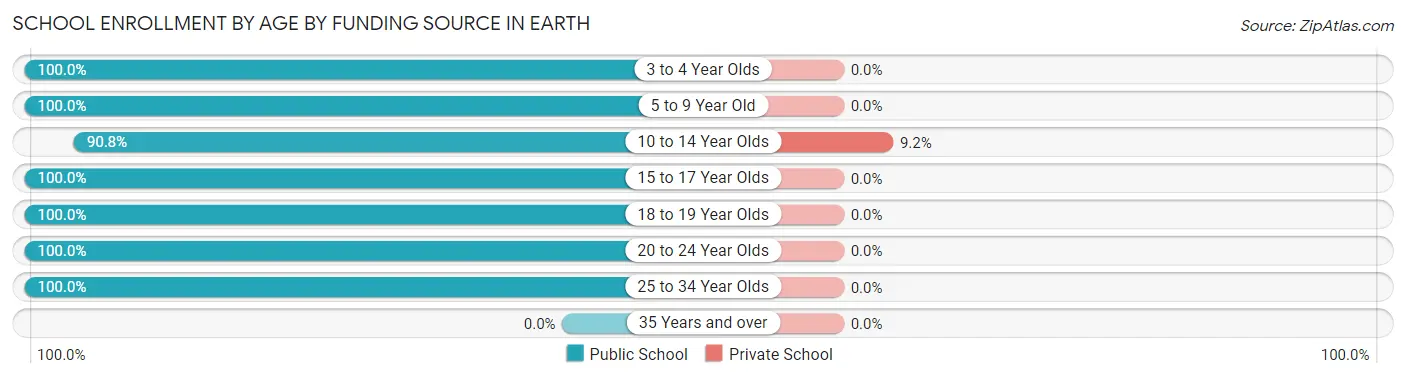
| Age Bracket | Public School | Private School |
| 3 to 4 Year Olds | 6 (100.0%) | 0 (0.0%) |
| 5 to 9 Year Old | 42 (100.0%) | 0 (0.0%) |
| 10 to 14 Year Olds | 89 (90.8%) | 9 (9.2%) |
| 15 to 17 Year Olds | 72 (100.0%) | 0 (0.0%) |
| 18 to 19 Year Olds | 31 (100.0%) | 0 (0.0%) |
| 20 to 24 Year Olds | 19 (100.0%) | 0 (0.0%) |
| 25 to 34 Year Olds | 2 (100.0%) | 0 (0.0%) |
| 35 Years and over | 0 (0.0%) | 0 (0.0%) |
| Total | 261 (96.7%) | 9 (3.3%) |
Educational Attainment by Field of Study in Earth
Engineering (17 | 30.4%), education (12 | 21.4%), bio, nature & agricultural (6 | 10.7%), science & technology (5 | 8.9%), and business (5 | 8.9%) are the most common fields of study among 56 individuals in Earth who have obtained a bachelor's degree or higher.
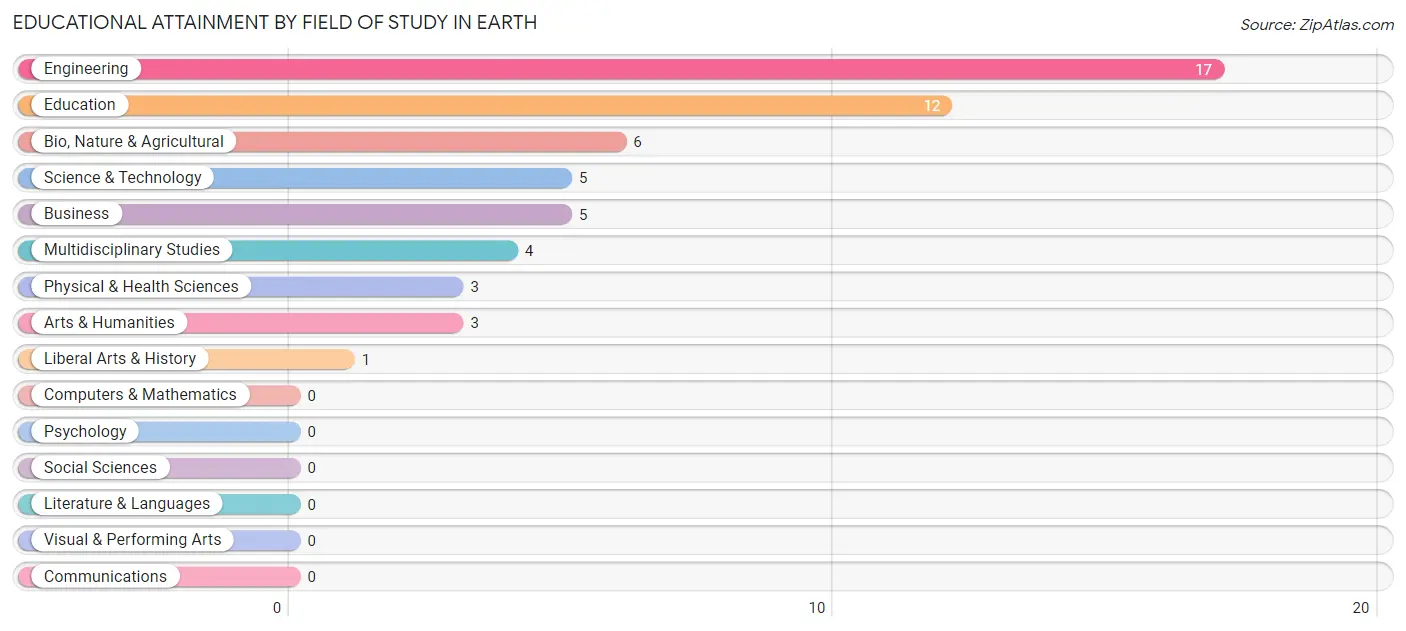
| Field of Study | # Graduates | % Graduates |
| Computers & Mathematics | 0 | 0.0% |
| Bio, Nature & Agricultural | 6 | 10.7% |
| Physical & Health Sciences | 3 | 5.4% |
| Psychology | 0 | 0.0% |
| Social Sciences | 0 | 0.0% |
| Engineering | 17 | 30.4% |
| Multidisciplinary Studies | 4 | 7.1% |
| Science & Technology | 5 | 8.9% |
| Business | 5 | 8.9% |
| Education | 12 | 21.4% |
| Literature & Languages | 0 | 0.0% |
| Liberal Arts & History | 1 | 1.8% |
| Visual & Performing Arts | 0 | 0.0% |
| Communications | 0 | 0.0% |
| Arts & Humanities | 3 | 5.4% |
| Total | 56 | 100.0% |
Transportation & Commute in Earth
Vehicle Availability by Sex in Earth
The most prevalent vehicle ownership categories in Earth are males with 3 vehicles (92, accounting for 33.8%) and females with 3 vehicles (48, making up 61.7%).
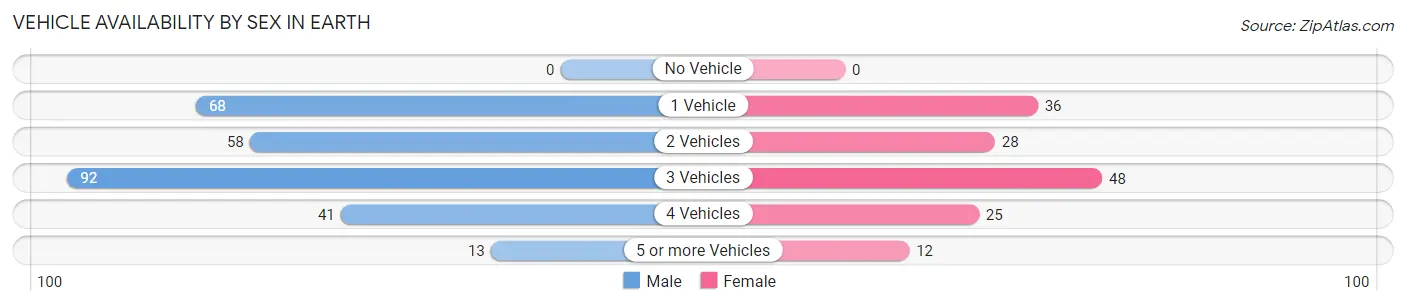
| Vehicles Available | Male | Female |
| No Vehicle | 0 (0.0%) | 0 (0.0%) |
| 1 Vehicle | 68 (25.0%) | 36 (24.2%) |
| 2 Vehicles | 58 (21.3%) | 28 (18.8%) |
| 3 Vehicles | 92 (33.8%) | 48 (32.2%) |
| 4 Vehicles | 41 (15.1%) | 25 (16.8%) |
| 5 or more Vehicles | 13 (4.8%) | 12 (8.1%) |
| Total | 272 (100.0%) | 149 (100.0%) |
Commute Time in Earth
The most frequently occuring commute durations in Earth are 5 to 9 minutes (128 commuters, 31.1%), 10 to 14 minutes (78 commuters, 19.0%), and 15 to 19 minutes (75 commuters, 18.2%).
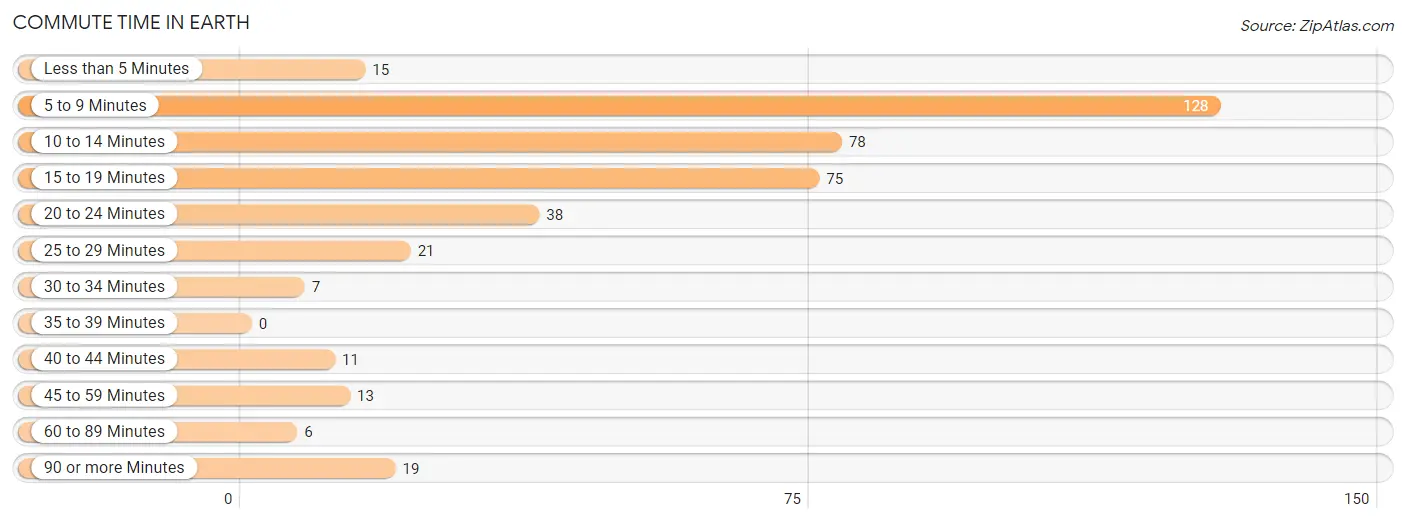
| Commute Time | # Commuters | % Commuters |
| Less than 5 Minutes | 15 | 3.6% |
| 5 to 9 Minutes | 128 | 31.1% |
| 10 to 14 Minutes | 78 | 19.0% |
| 15 to 19 Minutes | 75 | 18.2% |
| 20 to 24 Minutes | 38 | 9.2% |
| 25 to 29 Minutes | 21 | 5.1% |
| 30 to 34 Minutes | 7 | 1.7% |
| 35 to 39 Minutes | 0 | 0.0% |
| 40 to 44 Minutes | 11 | 2.7% |
| 45 to 59 Minutes | 13 | 3.2% |
| 60 to 89 Minutes | 6 | 1.5% |
| 90 or more Minutes | 19 | 4.6% |
Commute Time by Sex in Earth
The most common commute times in Earth are 5 to 9 minutes (89 commuters, 34.0%) for males and 15 to 19 minutes (59 commuters, 39.6%) for females.
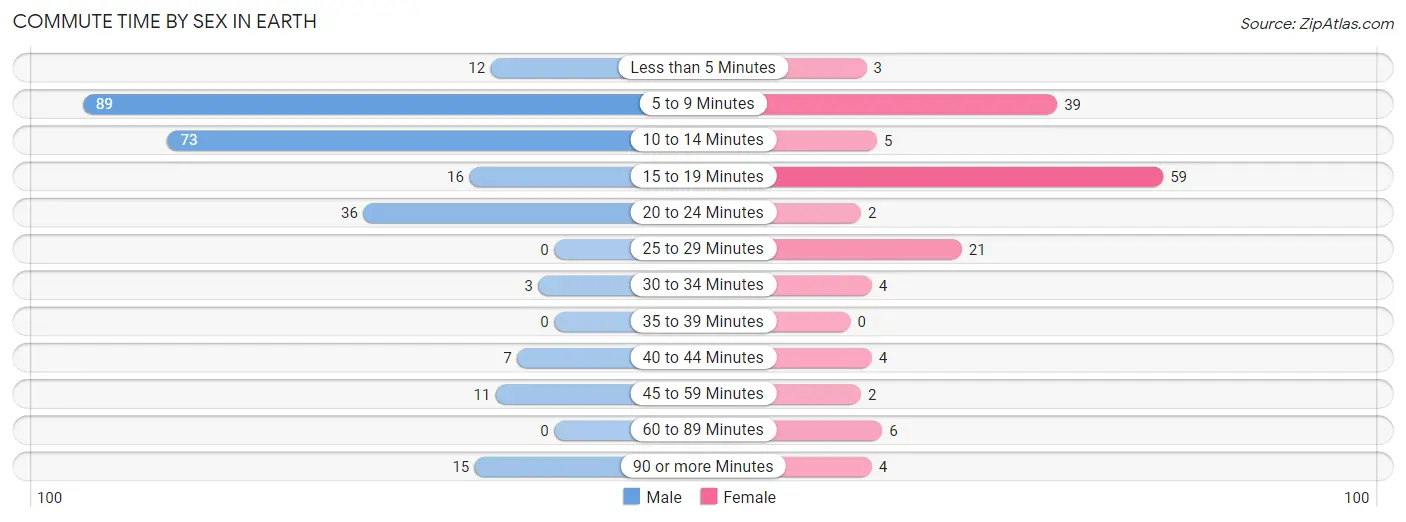
| Commute Time | Male | Female |
| Less than 5 Minutes | 12 (4.6%) | 3 (2.0%) |
| 5 to 9 Minutes | 89 (34.0%) | 39 (26.2%) |
| 10 to 14 Minutes | 73 (27.9%) | 5 (3.4%) |
| 15 to 19 Minutes | 16 (6.1%) | 59 (39.6%) |
| 20 to 24 Minutes | 36 (13.7%) | 2 (1.3%) |
| 25 to 29 Minutes | 0 (0.0%) | 21 (14.1%) |
| 30 to 34 Minutes | 3 (1.1%) | 4 (2.7%) |
| 35 to 39 Minutes | 0 (0.0%) | 0 (0.0%) |
| 40 to 44 Minutes | 7 (2.7%) | 4 (2.7%) |
| 45 to 59 Minutes | 11 (4.2%) | 2 (1.3%) |
| 60 to 89 Minutes | 0 (0.0%) | 6 (4.0%) |
| 90 or more Minutes | 15 (5.7%) | 4 (2.7%) |
Time of Departure to Work by Sex in Earth
The most frequent times of departure to work in Earth are 6:30 AM to 6:59 AM (111, 42.4%) for males and 7:00 AM to 7:29 AM (54, 36.2%) for females.
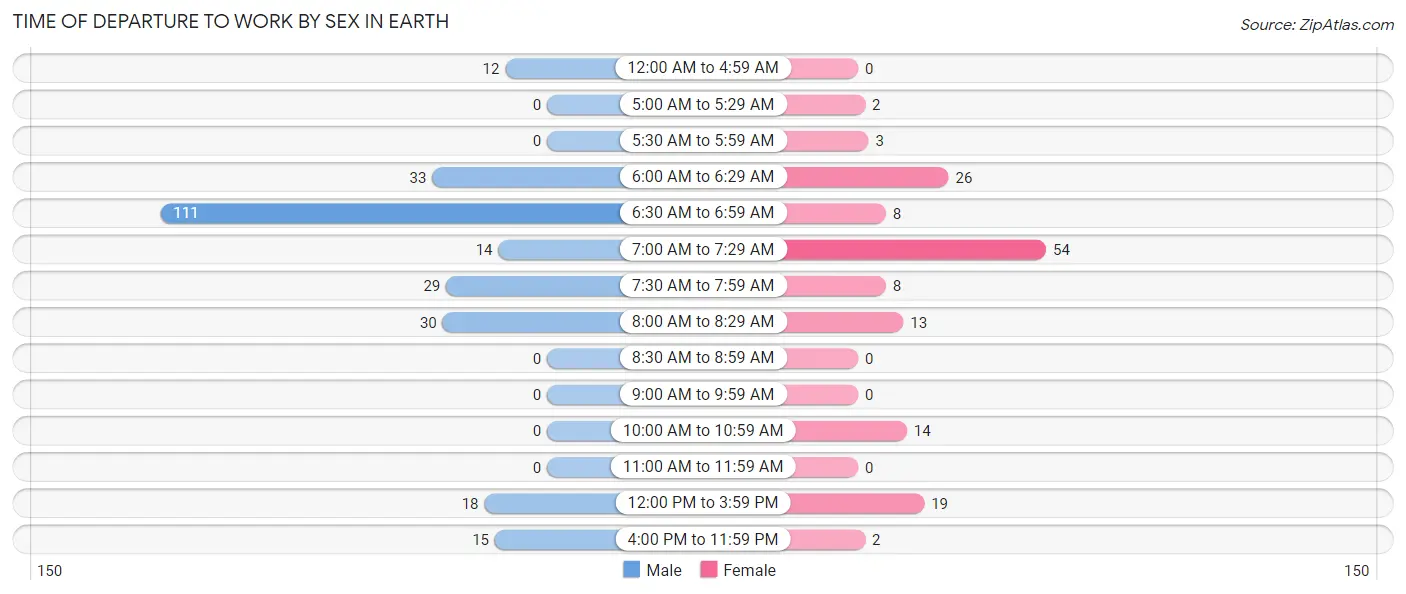
| Time of Departure | Male | Female |
| 12:00 AM to 4:59 AM | 12 (4.6%) | 0 (0.0%) |
| 5:00 AM to 5:29 AM | 0 (0.0%) | 2 (1.3%) |
| 5:30 AM to 5:59 AM | 0 (0.0%) | 3 (2.0%) |
| 6:00 AM to 6:29 AM | 33 (12.6%) | 26 (17.4%) |
| 6:30 AM to 6:59 AM | 111 (42.4%) | 8 (5.4%) |
| 7:00 AM to 7:29 AM | 14 (5.3%) | 54 (36.2%) |
| 7:30 AM to 7:59 AM | 29 (11.1%) | 8 (5.4%) |
| 8:00 AM to 8:29 AM | 30 (11.5%) | 13 (8.7%) |
| 8:30 AM to 8:59 AM | 0 (0.0%) | 0 (0.0%) |
| 9:00 AM to 9:59 AM | 0 (0.0%) | 0 (0.0%) |
| 10:00 AM to 10:59 AM | 0 (0.0%) | 14 (9.4%) |
| 11:00 AM to 11:59 AM | 0 (0.0%) | 0 (0.0%) |
| 12:00 PM to 3:59 PM | 18 (6.9%) | 19 (12.8%) |
| 4:00 PM to 11:59 PM | 15 (5.7%) | 2 (1.3%) |
| Total | 262 (100.0%) | 149 (100.0%) |
Housing Occupancy in Earth
Occupancy by Ownership in Earth
Of the total 357 dwellings in Earth, owner-occupied units account for 272 (76.2%), while renter-occupied units make up 85 (23.8%).
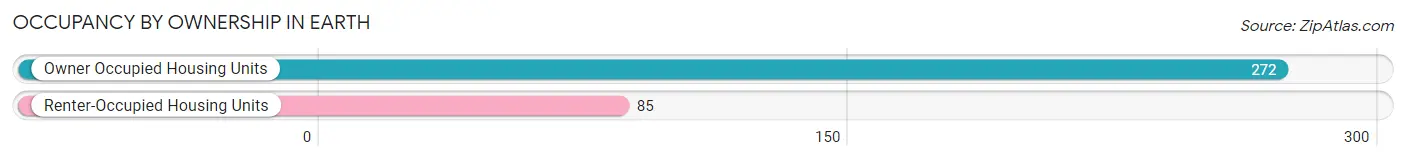
| Occupancy | # Housing Units | % Housing Units |
| Owner Occupied Housing Units | 272 | 76.2% |
| Renter-Occupied Housing Units | 85 | 23.8% |
| Total Occupied Housing Units | 357 | 100.0% |
Occupancy by Household Size in Earth
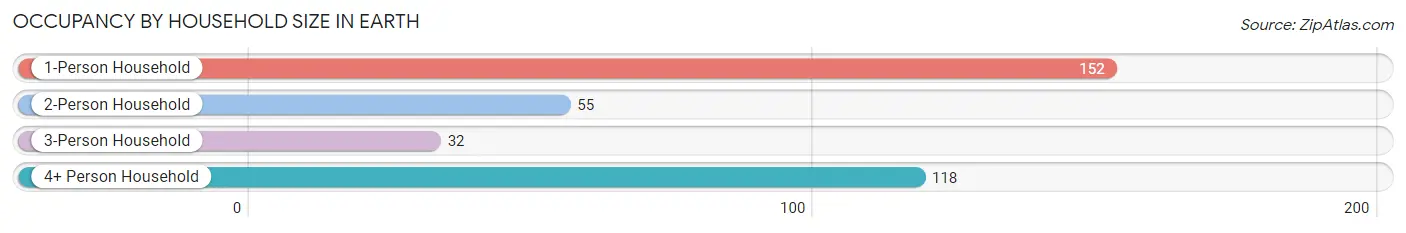
| Household Size | # Housing Units | % Housing Units |
| 1-Person Household | 152 | 42.6% |
| 2-Person Household | 55 | 15.4% |
| 3-Person Household | 32 | 9.0% |
| 4+ Person Household | 118 | 33.1% |
| Total Housing Units | 357 | 100.0% |
Occupancy by Ownership by Household Size in Earth
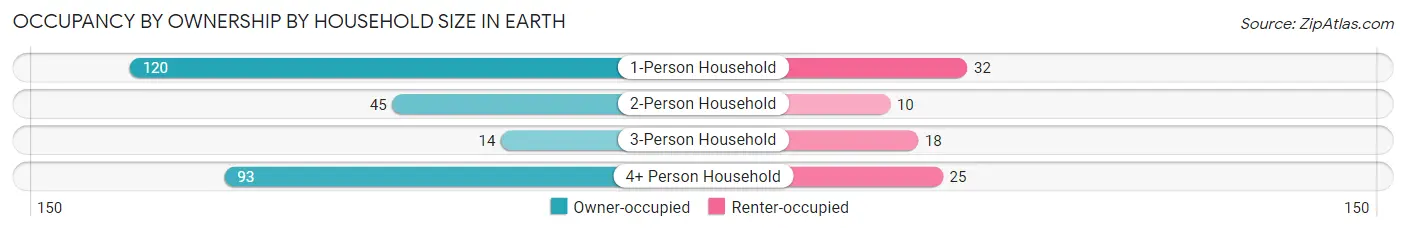
| Household Size | Owner-occupied | Renter-occupied |
| 1-Person Household | 120 (78.9%) | 32 (21.0%) |
| 2-Person Household | 45 (81.8%) | 10 (18.2%) |
| 3-Person Household | 14 (43.8%) | 18 (56.2%) |
| 4+ Person Household | 93 (78.8%) | 25 (21.2%) |
| Total Housing Units | 272 (76.2%) | 85 (23.8%) |
Occupancy by Educational Attainment in Earth
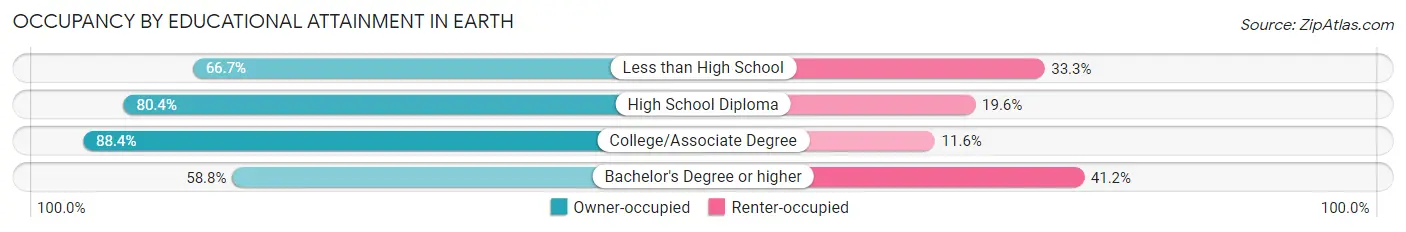
| Household Size | Owner-occupied | Renter-occupied |
| Less than High School | 64 (66.7%) | 32 (33.3%) |
| High School Diploma | 127 (80.4%) | 31 (19.6%) |
| College/Associate Degree | 61 (88.4%) | 8 (11.6%) |
| Bachelor's Degree or higher | 20 (58.8%) | 14 (41.2%) |
Occupancy by Age of Householder in Earth
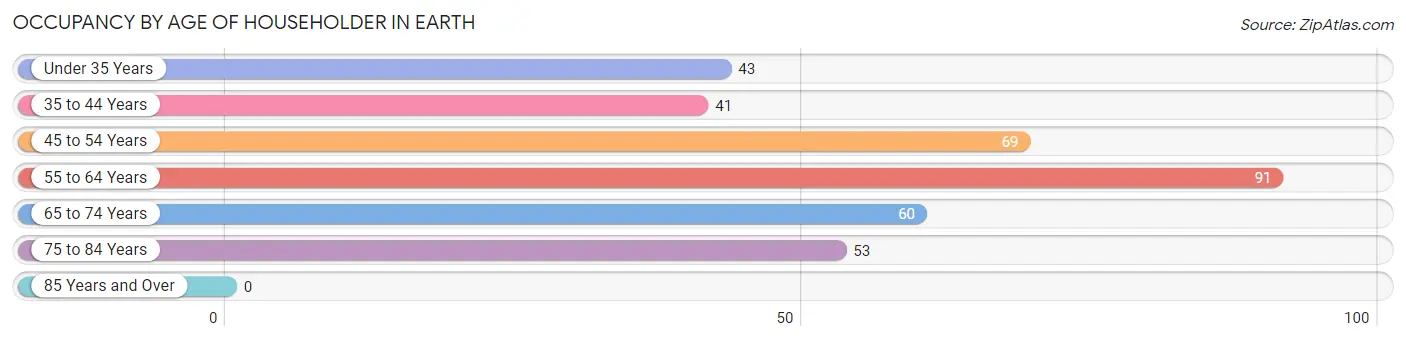
| Age Bracket | # Households | % Households |
| Under 35 Years | 43 | 12.0% |
| 35 to 44 Years | 41 | 11.5% |
| 45 to 54 Years | 69 | 19.3% |
| 55 to 64 Years | 91 | 25.5% |
| 65 to 74 Years | 60 | 16.8% |
| 75 to 84 Years | 53 | 14.8% |
| 85 Years and Over | 0 | 0.0% |
| Total | 357 | 100.0% |
Housing Finances in Earth
Median Income by Occupancy in Earth
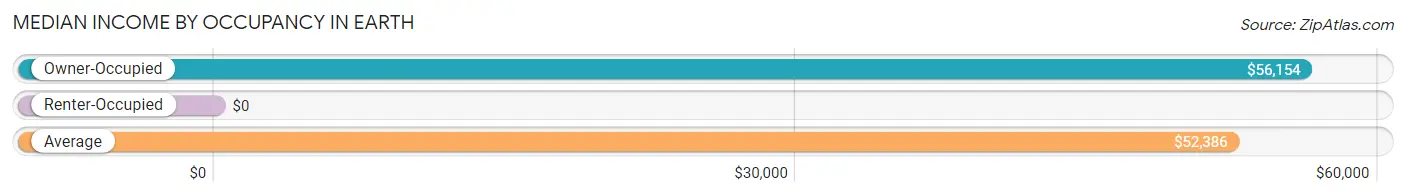
| Occupancy Type | # Households | Median Income |
| Owner-Occupied | 272 (76.2%) | $56,154 |
| Renter-Occupied | 85 (23.8%) | $0 |
| Average | 357 (100.0%) | $52,386 |
Occupancy by Householder Income Bracket in Earth
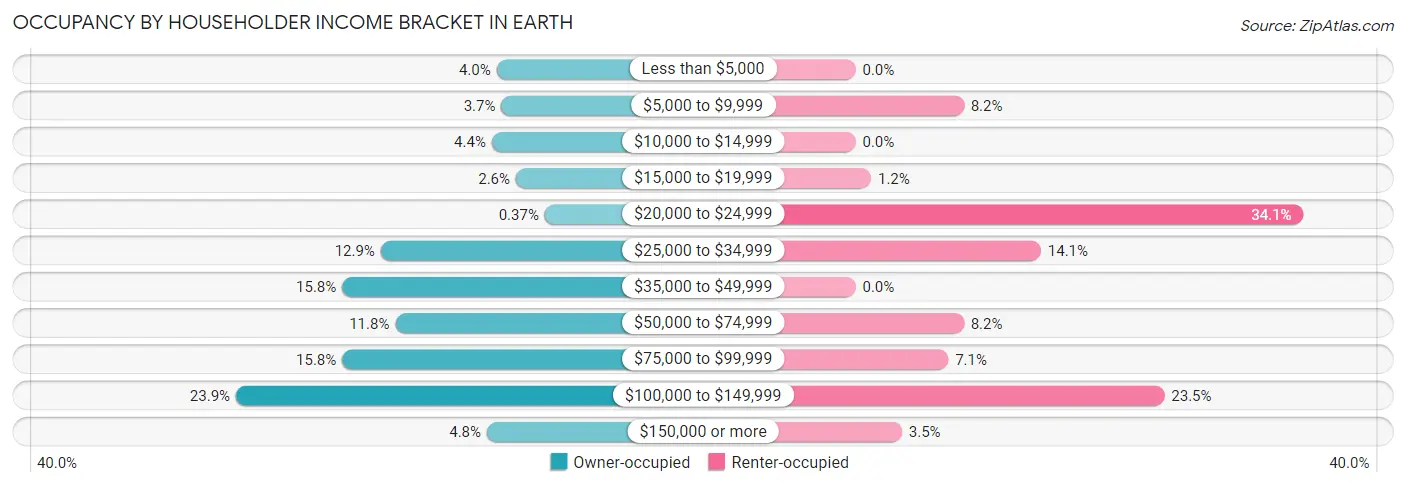
| Income Bracket | Owner-occupied | Renter-occupied |
| Less than $5,000 | 11 (4.0%) | 0 (0.0%) |
| $5,000 to $9,999 | 10 (3.7%) | 7 (8.2%) |
| $10,000 to $14,999 | 12 (4.4%) | 0 (0.0%) |
| $15,000 to $19,999 | 7 (2.6%) | 1 (1.2%) |
| $20,000 to $24,999 | 1 (0.4%) | 29 (34.1%) |
| $25,000 to $34,999 | 35 (12.9%) | 12 (14.1%) |
| $35,000 to $49,999 | 43 (15.8%) | 0 (0.0%) |
| $50,000 to $74,999 | 32 (11.8%) | 7 (8.2%) |
| $75,000 to $99,999 | 43 (15.8%) | 6 (7.1%) |
| $100,000 to $149,999 | 65 (23.9%) | 20 (23.5%) |
| $150,000 or more | 13 (4.8%) | 3 (3.5%) |
| Total | 272 (100.0%) | 85 (100.0%) |
Monthly Housing Cost Tiers in Earth
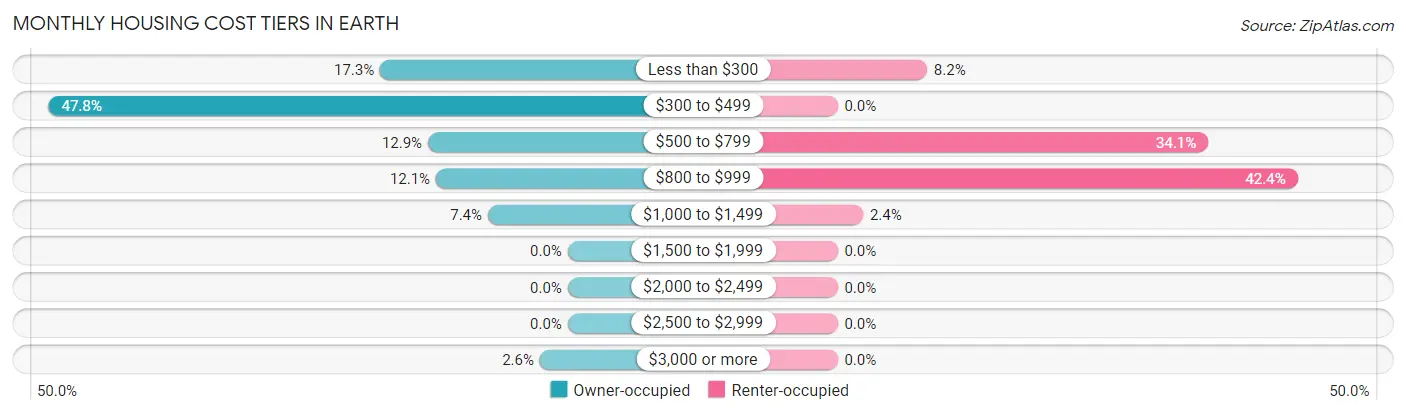
| Monthly Cost | Owner-occupied | Renter-occupied |
| Less than $300 | 47 (17.3%) | 7 (8.2%) |
| $300 to $499 | 130 (47.8%) | 0 (0.0%) |
| $500 to $799 | 35 (12.9%) | 29 (34.1%) |
| $800 to $999 | 33 (12.1%) | 36 (42.3%) |
| $1,000 to $1,499 | 20 (7.3%) | 2 (2.4%) |
| $1,500 to $1,999 | 0 (0.0%) | 0 (0.0%) |
| $2,000 to $2,499 | 0 (0.0%) | 0 (0.0%) |
| $2,500 to $2,999 | 0 (0.0%) | 0 (0.0%) |
| $3,000 or more | 7 (2.6%) | 0 (0.0%) |
| Total | 272 (100.0%) | 85 (100.0%) |
Physical Housing Characteristics in Earth
Housing Structures in Earth
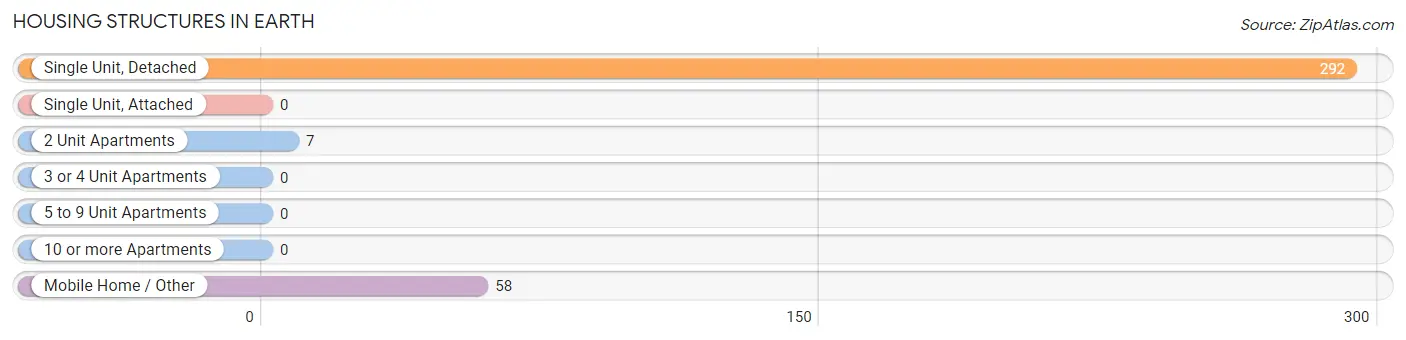
| Structure Type | # Housing Units | % Housing Units |
| Single Unit, Detached | 292 | 81.8% |
| Single Unit, Attached | 0 | 0.0% |
| 2 Unit Apartments | 7 | 2.0% |
| 3 or 4 Unit Apartments | 0 | 0.0% |
| 5 to 9 Unit Apartments | 0 | 0.0% |
| 10 or more Apartments | 0 | 0.0% |
| Mobile Home / Other | 58 | 16.3% |
| Total | 357 | 100.0% |
Housing Structures by Occupancy in Earth
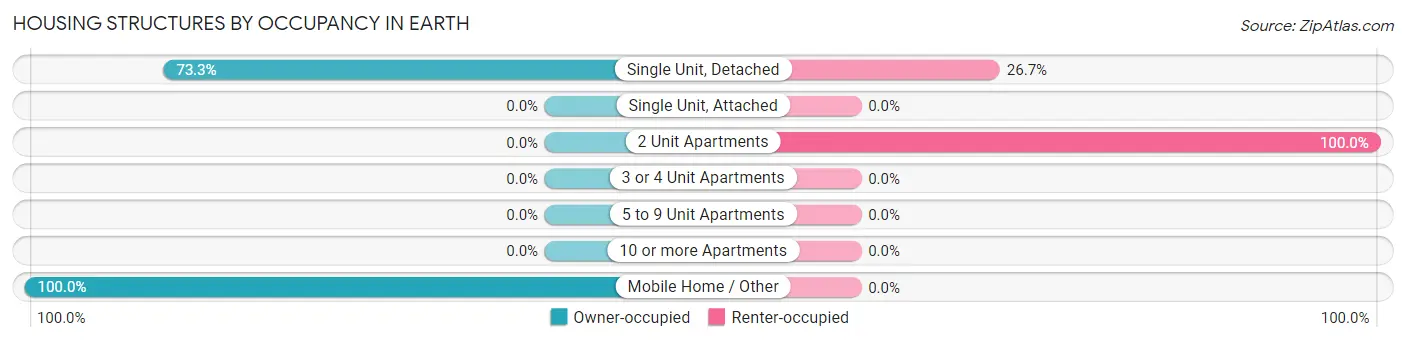
| Structure Type | Owner-occupied | Renter-occupied |
| Single Unit, Detached | 214 (73.3%) | 78 (26.7%) |
| Single Unit, Attached | 0 (0.0%) | 0 (0.0%) |
| 2 Unit Apartments | 0 (0.0%) | 7 (100.0%) |
| 3 or 4 Unit Apartments | 0 (0.0%) | 0 (0.0%) |
| 5 to 9 Unit Apartments | 0 (0.0%) | 0 (0.0%) |
| 10 or more Apartments | 0 (0.0%) | 0 (0.0%) |
| Mobile Home / Other | 58 (100.0%) | 0 (0.0%) |
| Total | 272 (76.2%) | 85 (23.8%) |
Housing Structures by Number of Rooms in Earth
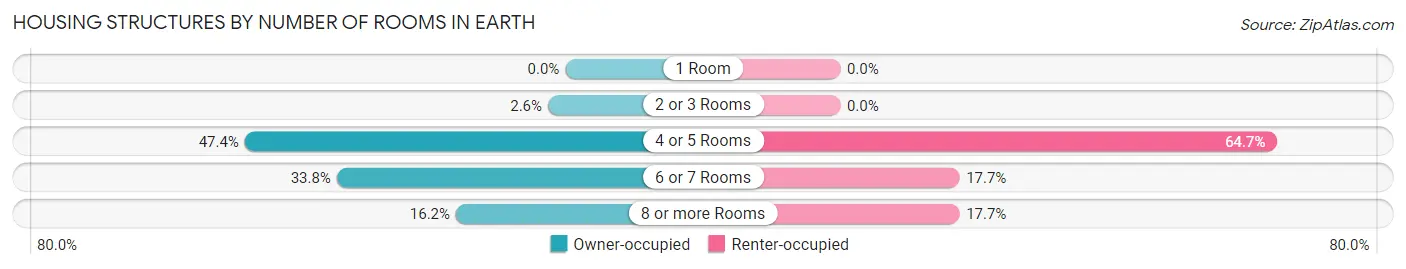
| Number of Rooms | Owner-occupied | Renter-occupied |
| 1 Room | 0 (0.0%) | 0 (0.0%) |
| 2 or 3 Rooms | 7 (2.6%) | 0 (0.0%) |
| 4 or 5 Rooms | 129 (47.4%) | 55 (64.7%) |
| 6 or 7 Rooms | 92 (33.8%) | 15 (17.6%) |
| 8 or more Rooms | 44 (16.2%) | 15 (17.6%) |
| Total | 272 (100.0%) | 85 (100.0%) |
Housing Structure by Heating Type in Earth
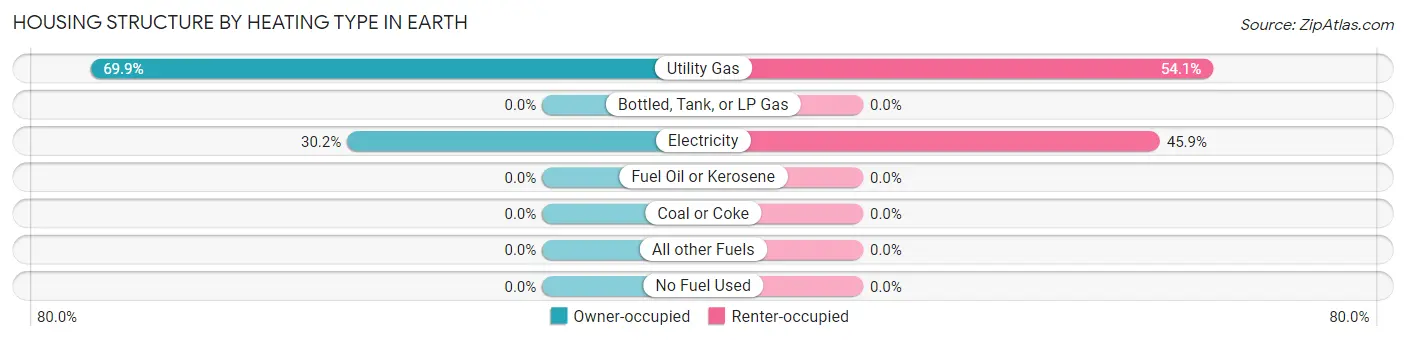
| Heating Type | Owner-occupied | Renter-occupied |
| Utility Gas | 190 (69.9%) | 46 (54.1%) |
| Bottled, Tank, or LP Gas | 0 (0.0%) | 0 (0.0%) |
| Electricity | 82 (30.1%) | 39 (45.9%) |
| Fuel Oil or Kerosene | 0 (0.0%) | 0 (0.0%) |
| Coal or Coke | 0 (0.0%) | 0 (0.0%) |
| All other Fuels | 0 (0.0%) | 0 (0.0%) |
| No Fuel Used | 0 (0.0%) | 0 (0.0%) |
| Total | 272 (100.0%) | 85 (100.0%) |
Household Vehicle Usage in Earth
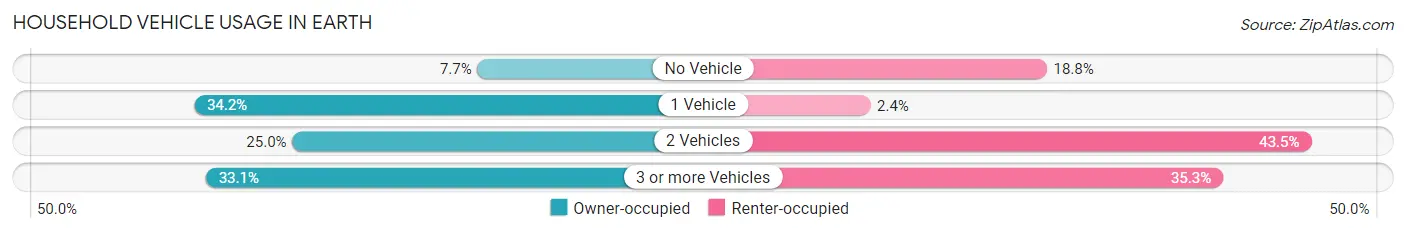
| Vehicles per Household | Owner-occupied | Renter-occupied |
| No Vehicle | 21 (7.7%) | 16 (18.8%) |
| 1 Vehicle | 93 (34.2%) | 2 (2.4%) |
| 2 Vehicles | 68 (25.0%) | 37 (43.5%) |
| 3 or more Vehicles | 90 (33.1%) | 30 (35.3%) |
| Total | 272 (100.0%) | 85 (100.0%) |
Real Estate & Mortgages in Earth
Real Estate and Mortgage Overview in Earth
| Characteristic | Without Mortgage | With Mortgage |
| Housing Units | 227 | 45 |
| Median Property Value | $80,400 | $69,700 |
| Median Household Income | $50,341 | $8 |
| Monthly Housing Costs | $377 | $0 |
| Real Estate Taxes | $1,054 | $19 |
Property Value by Mortgage Status in Earth
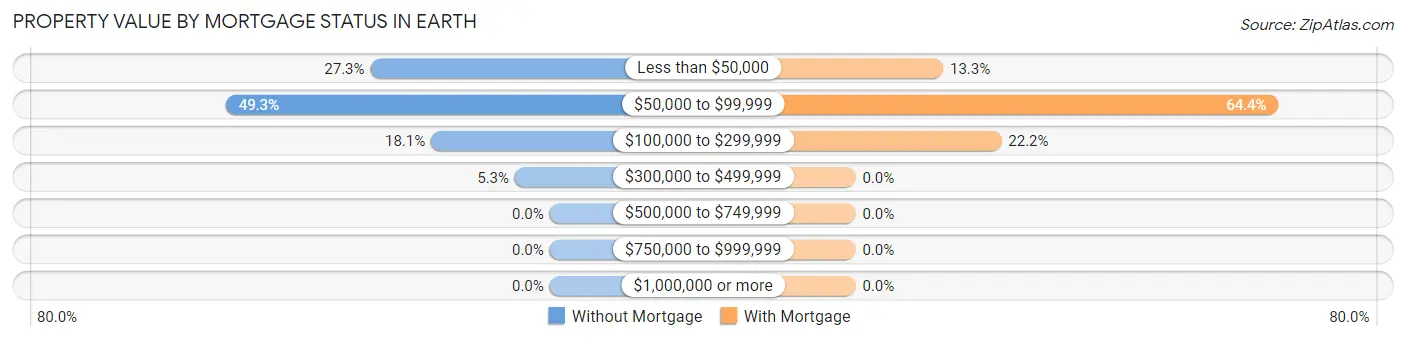
| Property Value | Without Mortgage | With Mortgage |
| Less than $50,000 | 62 (27.3%) | 6 (13.3%) |
| $50,000 to $99,999 | 112 (49.3%) | 29 (64.4%) |
| $100,000 to $299,999 | 41 (18.1%) | 10 (22.2%) |
| $300,000 to $499,999 | 12 (5.3%) | 0 (0.0%) |
| $500,000 to $749,999 | 0 (0.0%) | 0 (0.0%) |
| $750,000 to $999,999 | 0 (0.0%) | 0 (0.0%) |
| $1,000,000 or more | 0 (0.0%) | 0 (0.0%) |
| Total | 227 (100.0%) | 45 (100.0%) |
Household Income by Mortgage Status in Earth
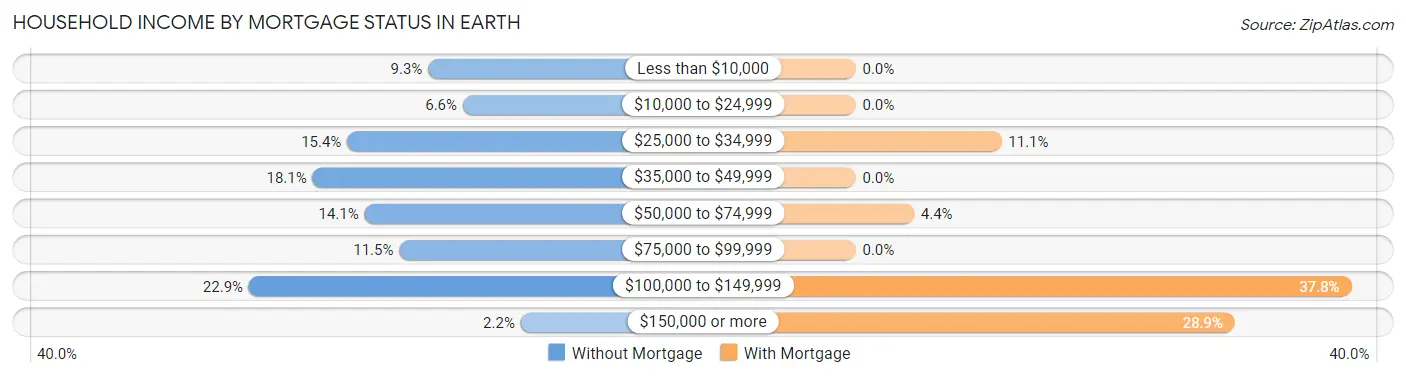
| Household Income | Without Mortgage | With Mortgage |
| Less than $10,000 | 21 (9.2%) | 0 (0.0%) |
| $10,000 to $24,999 | 15 (6.6%) | 0 (0.0%) |
| $25,000 to $34,999 | 35 (15.4%) | 5 (11.1%) |
| $35,000 to $49,999 | 41 (18.1%) | 0 (0.0%) |
| $50,000 to $74,999 | 32 (14.1%) | 2 (4.4%) |
| $75,000 to $99,999 | 26 (11.5%) | 0 (0.0%) |
| $100,000 to $149,999 | 52 (22.9%) | 17 (37.8%) |
| $150,000 or more | 5 (2.2%) | 13 (28.9%) |
| Total | 227 (100.0%) | 45 (100.0%) |
Property Value to Household Income Ratio in Earth
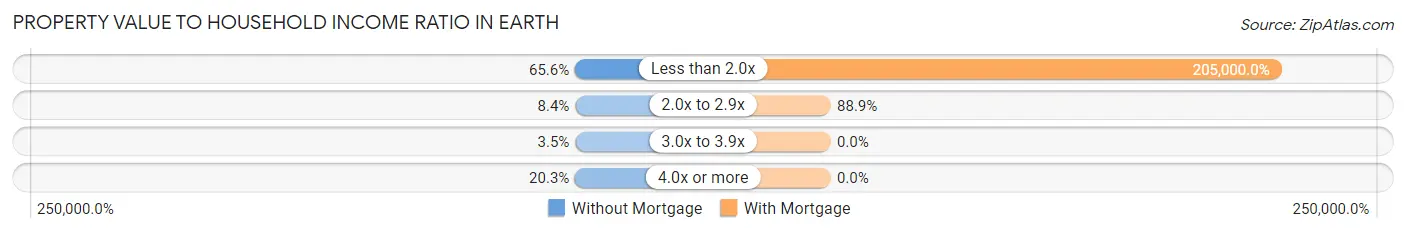
| Value-to-Income Ratio | Without Mortgage | With Mortgage |
| Less than 2.0x | 149 (65.6%) | 92,250 (205,000.0%) |
| 2.0x to 2.9x | 19 (8.4%) | 40 (88.9%) |
| 3.0x to 3.9x | 8 (3.5%) | 0 (0.0%) |
| 4.0x or more | 46 (20.3%) | 0 (0.0%) |
| Total | 227 (100.0%) | 45 (100.0%) |
Real Estate Taxes by Mortgage Status in Earth

| Property Taxes | Without Mortgage | With Mortgage |
| Less than $800 | 95 (41.8%) | 0 (0.0%) |
| $800 to $1,499 | 88 (38.8%) | 11 (24.4%) |
| $800 to $1,499 | 44 (19.4%) | 5 (11.1%) |
| Total | 227 (100.0%) | 45 (100.0%) |
Health & Disability in Earth
Health Insurance Coverage by Age in Earth
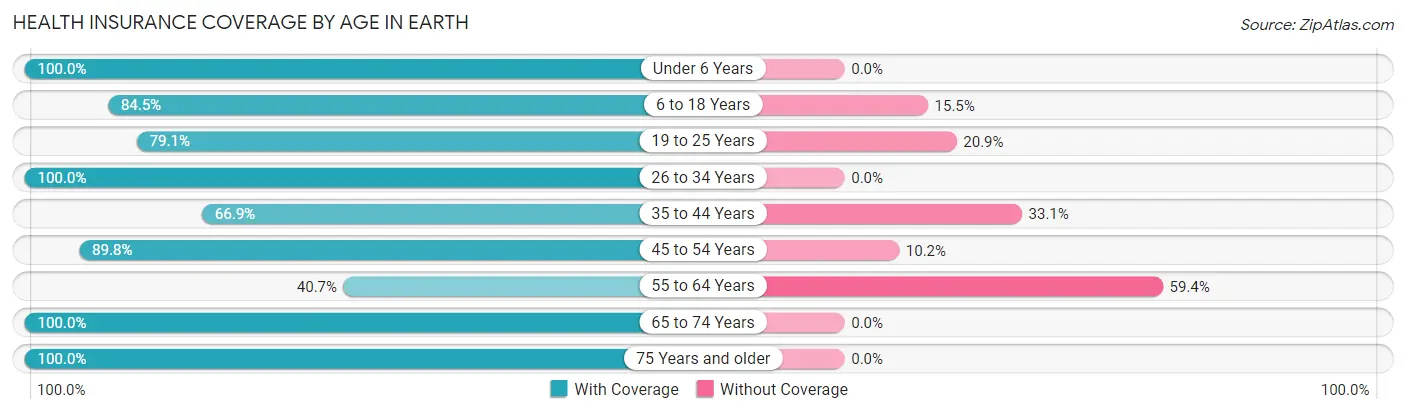
| Age Bracket | With Coverage | Without Coverage |
| Under 6 Years | 69 (100.0%) | 0 (0.0%) |
| 6 to 18 Years | 212 (84.5%) | 39 (15.5%) |
| 19 to 25 Years | 53 (79.1%) | 14 (20.9%) |
| 26 to 34 Years | 64 (100.0%) | 0 (0.0%) |
| 35 to 44 Years | 85 (66.9%) | 42 (33.1%) |
| 45 to 54 Years | 106 (89.8%) | 12 (10.2%) |
| 55 to 64 Years | 50 (40.6%) | 73 (59.4%) |
| 65 to 74 Years | 113 (100.0%) | 0 (0.0%) |
| 75 Years and older | 67 (100.0%) | 0 (0.0%) |
| Total | 819 (82.0%) | 180 (18.0%) |
Health Insurance Coverage by Citizenship Status in Earth

| Citizenship Status | With Coverage | Without Coverage |
| Native Born | 69 (100.0%) | 0 (0.0%) |
| Foreign Born, Citizen | 212 (84.5%) | 39 (15.5%) |
| Foreign Born, not a Citizen | 53 (79.1%) | 14 (20.9%) |
Health Insurance Coverage by Household Income in Earth

| Household Income | With Coverage | Without Coverage |
| Under $25,000 | 127 (86.4%) | 20 (13.6%) |
| $25,000 to $49,999 | 182 (86.3%) | 29 (13.7%) |
| $50,000 to $74,999 | 135 (87.7%) | 19 (12.3%) |
| $75,000 to $99,999 | 207 (90.4%) | 22 (9.6%) |
| $100,000 and over | 168 (65.1%) | 90 (34.9%) |
Public vs Private Health Insurance Coverage by Age in Earth
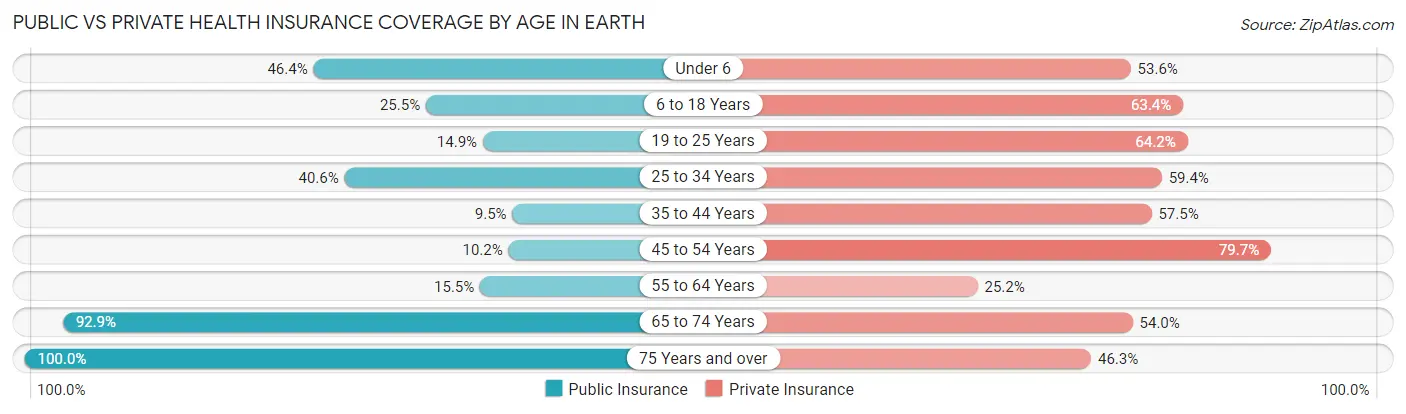
| Age Bracket | Public Insurance | Private Insurance |
| Under 6 | 32 (46.4%) | 37 (53.6%) |
| 6 to 18 Years | 64 (25.5%) | 159 (63.3%) |
| 19 to 25 Years | 10 (14.9%) | 43 (64.2%) |
| 25 to 34 Years | 26 (40.6%) | 38 (59.4%) |
| 35 to 44 Years | 12 (9.5%) | 73 (57.5%) |
| 45 to 54 Years | 12 (10.2%) | 94 (79.7%) |
| 55 to 64 Years | 19 (15.4%) | 31 (25.2%) |
| 65 to 74 Years | 105 (92.9%) | 61 (54.0%) |
| 75 Years and over | 67 (100.0%) | 31 (46.3%) |
| Total | 347 (34.7%) | 567 (56.8%) |
Disability Status by Sex by Age in Earth
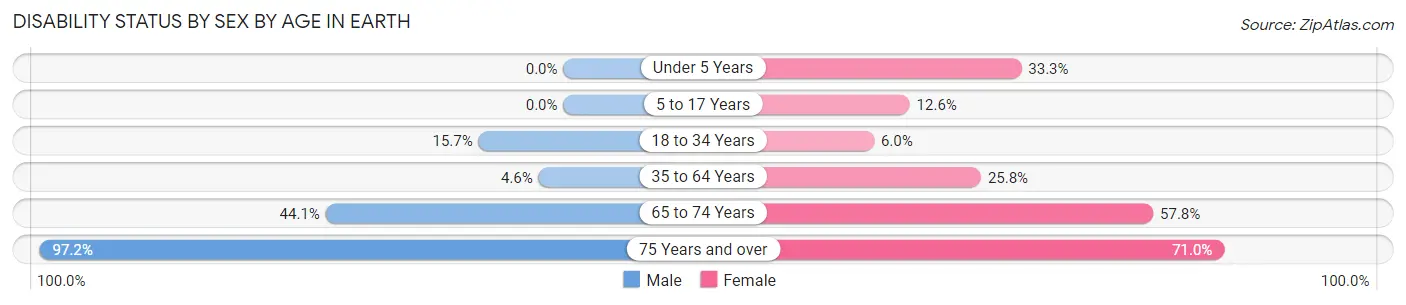
| Age Bracket | Male | Female |
| Under 5 Years | 0 (0.0%) | 5 (33.3%) |
| 5 to 17 Years | 0 (0.0%) | 16 (12.6%) |
| 18 to 34 Years | 17 (15.7%) | 4 (6.0%) |
| 35 to 64 Years | 10 (4.6%) | 39 (25.8%) |
| 65 to 74 Years | 30 (44.1%) | 26 (57.8%) |
| 75 Years and over | 35 (97.2%) | 22 (71.0%) |
Disability Class by Sex by Age in Earth
Disability Class: Hearing Difficulty
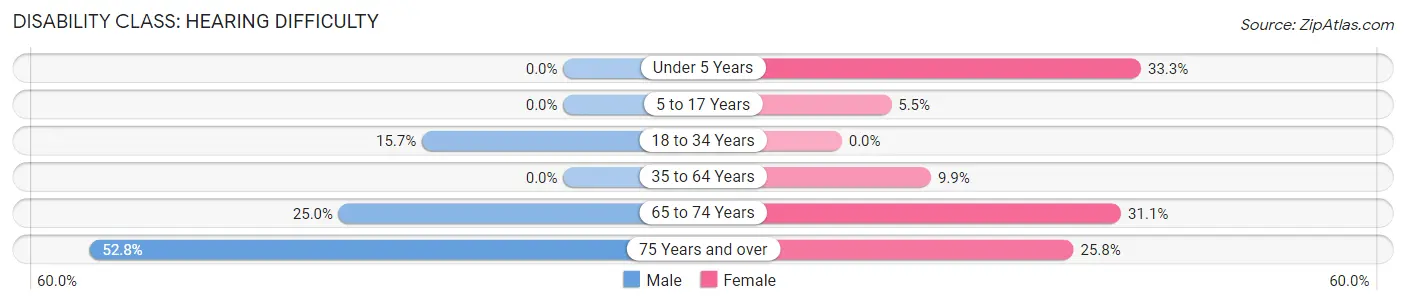
| Age Bracket | Male | Female |
| Under 5 Years | 0 (0.0%) | 5 (33.3%) |
| 5 to 17 Years | 0 (0.0%) | 7 (5.5%) |
| 18 to 34 Years | 17 (15.7%) | 0 (0.0%) |
| 35 to 64 Years | 0 (0.0%) | 15 (9.9%) |
| 65 to 74 Years | 17 (25.0%) | 14 (31.1%) |
| 75 Years and over | 19 (52.8%) | 8 (25.8%) |
Disability Class: Vision Difficulty
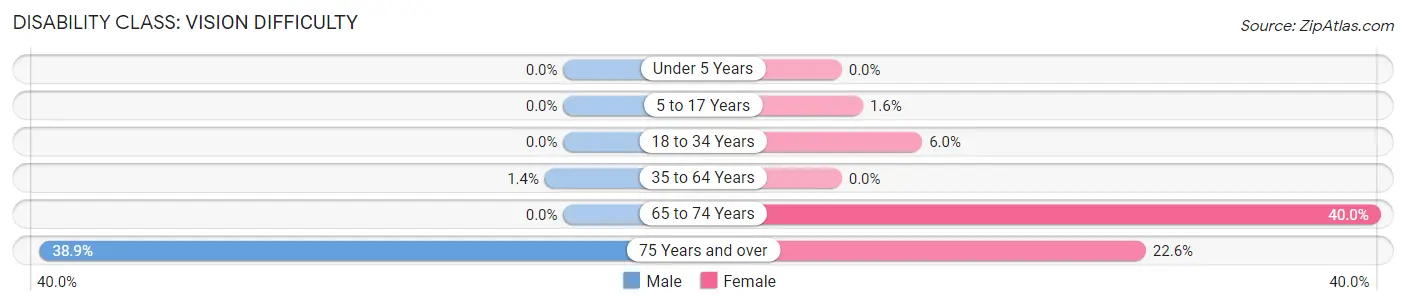
| Age Bracket | Male | Female |
| Under 5 Years | 0 (0.0%) | 0 (0.0%) |
| 5 to 17 Years | 0 (0.0%) | 2 (1.6%) |
| 18 to 34 Years | 0 (0.0%) | 4 (6.0%) |
| 35 to 64 Years | 3 (1.4%) | 0 (0.0%) |
| 65 to 74 Years | 0 (0.0%) | 18 (40.0%) |
| 75 Years and over | 14 (38.9%) | 7 (22.6%) |
Disability Class: Cognitive Difficulty
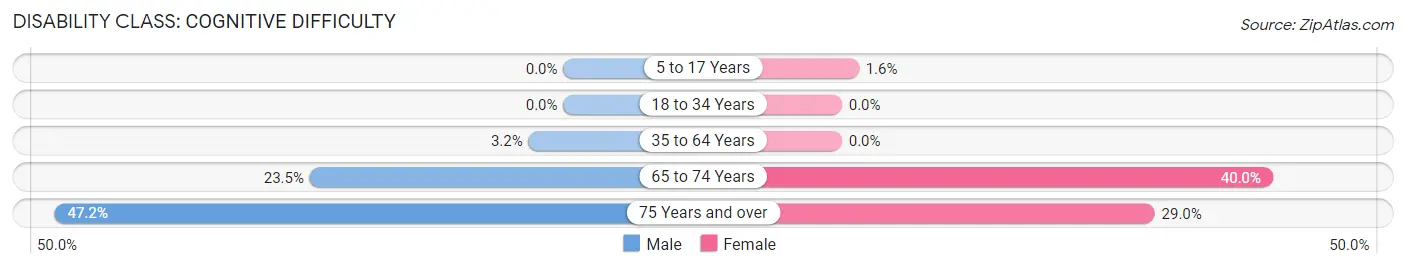
| Age Bracket | Male | Female |
| 5 to 17 Years | 0 (0.0%) | 2 (1.6%) |
| 18 to 34 Years | 0 (0.0%) | 0 (0.0%) |
| 35 to 64 Years | 7 (3.2%) | 0 (0.0%) |
| 65 to 74 Years | 16 (23.5%) | 18 (40.0%) |
| 75 Years and over | 17 (47.2%) | 9 (29.0%) |
Disability Class: Ambulatory Difficulty

| Age Bracket | Male | Female |
| 5 to 17 Years | 0 (0.0%) | 7 (5.5%) |
| 18 to 34 Years | 0 (0.0%) | 0 (0.0%) |
| 35 to 64 Years | 7 (3.2%) | 26 (17.2%) |
| 65 to 74 Years | 27 (39.7%) | 18 (40.0%) |
| 75 Years and over | 35 (97.2%) | 21 (67.7%) |
Disability Class: Self-Care Difficulty
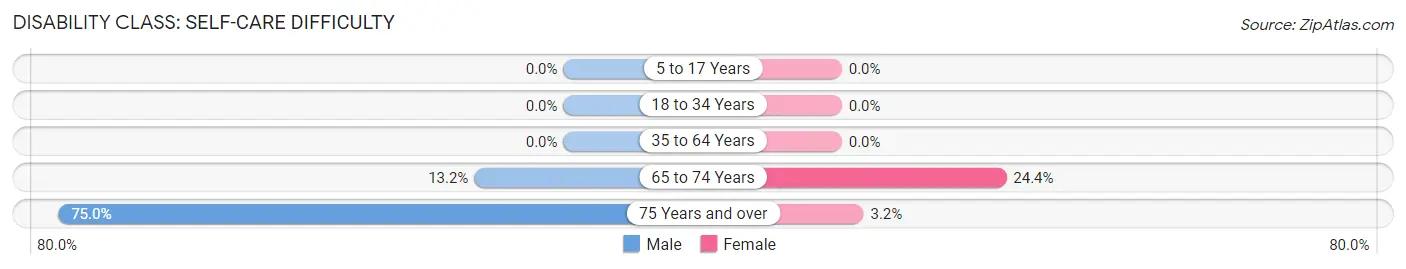
| Age Bracket | Male | Female |
| 5 to 17 Years | 0 (0.0%) | 0 (0.0%) |
| 18 to 34 Years | 0 (0.0%) | 0 (0.0%) |
| 35 to 64 Years | 0 (0.0%) | 0 (0.0%) |
| 65 to 74 Years | 9 (13.2%) | 11 (24.4%) |
| 75 Years and over | 27 (75.0%) | 1 (3.2%) |
Technology Access in Earth
Computing Device Access in Earth
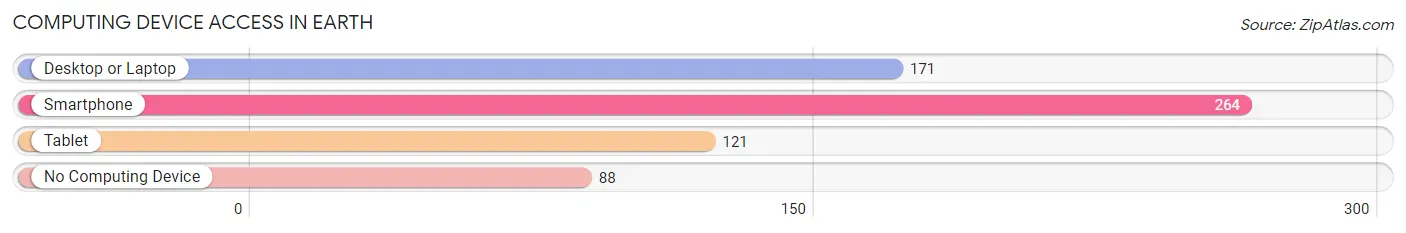
| Device Type | # Households | % Households |
| Desktop or Laptop | 171 | 47.9% |
| Smartphone | 264 | 74.0% |
| Tablet | 121 | 33.9% |
| No Computing Device | 88 | 24.6% |
| Total | 357 | 100.0% |
Internet Access in Earth
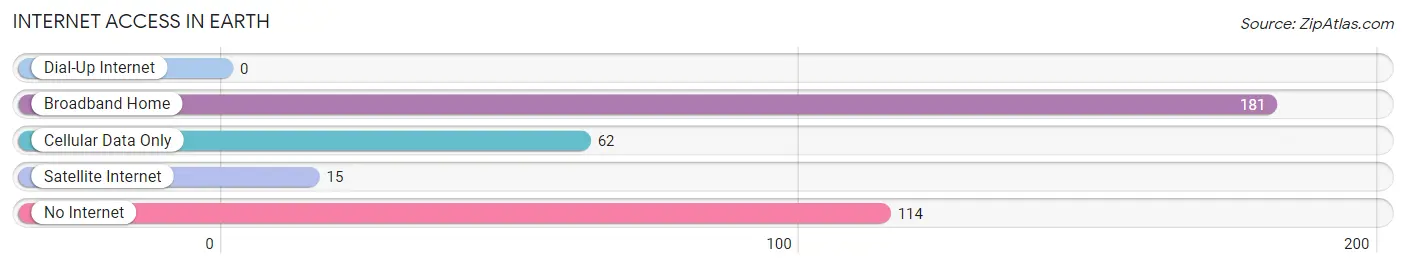
| Internet Type | # Households | % Households |
| Dial-Up Internet | 0 | 0.0% |
| Broadband Home | 181 | 50.7% |
| Cellular Data Only | 62 | 17.4% |
| Satellite Internet | 15 | 4.2% |
| No Internet | 114 | 31.9% |
| Total | 357 | 100.0% |
Earth Summary
Earth, Texas is a small town located in the western part of the state, in the county of Lamb. It is situated on the edge of the Llano Estacado, a large plateau that stretches across the Texas Panhandle. The town has a population of 1,741 people, according to the 2010 census.
Earth is located in the High Plains region of Texas, and is part of the South Plains region. The town is situated on the edge of the Llano Estacado, a large plateau that stretches across the Texas Panhandle. The town is located at an elevation of 2,845 feet above sea level. The climate in Earth is semi-arid, with hot summers and mild winters.
The economy of Earth is largely based on agriculture. The town is home to several large farms, which produce cotton, wheat, sorghum, and other crops. The town also has a small manufacturing sector, which produces a variety of products, including furniture, clothing, and food products.
The demographics of Earth are largely white, with a small Hispanic population. The median household income in Earth is $37,945, and the median age is 37. The town has a low unemployment rate, and the poverty rate is below the national average.
Earth is served by the Earth Independent School District, which includes two elementary schools, one middle school, and one high school. The town is also home to a branch of South Plains College, which offers a variety of degree and certificate programs.
Earth is home to several churches, including the First United Methodist Church, the Church of Christ, and the Church of Jesus Christ of Latter-day Saints. The town also has a public library, a post office, and a number of restaurants and shops.
Earth is a small town with a rich history and a vibrant economy. The town is home to a diverse population, and offers a variety of activities and attractions for visitors and residents alike. The town is a great place to live, work, and play, and is a great place to call home.
Common Questions
What is Per Capita Income in Earth?
Per Capita income in Earth is $27,991.
What is the Median Family Income in Earth?
Median Family Income in Earth is $56,827.
What is the Median Household income in Earth?
Median Household Income in Earth is $52,386.
What is Income or Wage Gap in Earth?
Income or Wage Gap in Earth is 52.1%.
Women in Earth earn 47.9 cents for every dollar earned by a man.
What is Inequality or Gini Index in Earth?
Inequality or Gini Index in Earth is 0.42.
What is the Total Population of Earth?
Total Population of Earth is 999.
What is the Total Male Population of Earth?
Total Male Population of Earth is 563.
What is the Total Female Population of Earth?
Total Female Population of Earth is 436.
What is the Ratio of Males per 100 Females in Earth?
There are 129.13 Males per 100 Females in Earth.
What is the Ratio of Females per 100 Males in Earth?
There are 77.44 Females per 100 Males in Earth.
What is the Median Population Age in Earth?
Median Population Age in Earth is 40.2 Years.
What is the Average Family Size in Earth
Average Family Size in Earth is 3.9 People.
What is the Average Household Size in Earth
Average Household Size in Earth is 2.8 People.
How Large is the Labor Force in Earth?
There are 428 People in the Labor Forcein in Earth.
What is the Percentage of People in the Labor Force in Earth?
55.3% of People are in the Labor Force in Earth.
What is the Unemployment Rate in Earth?
Unemployment Rate in Earth is 0.2%.