La Liga, PR Map & Demographics
La Liga Map
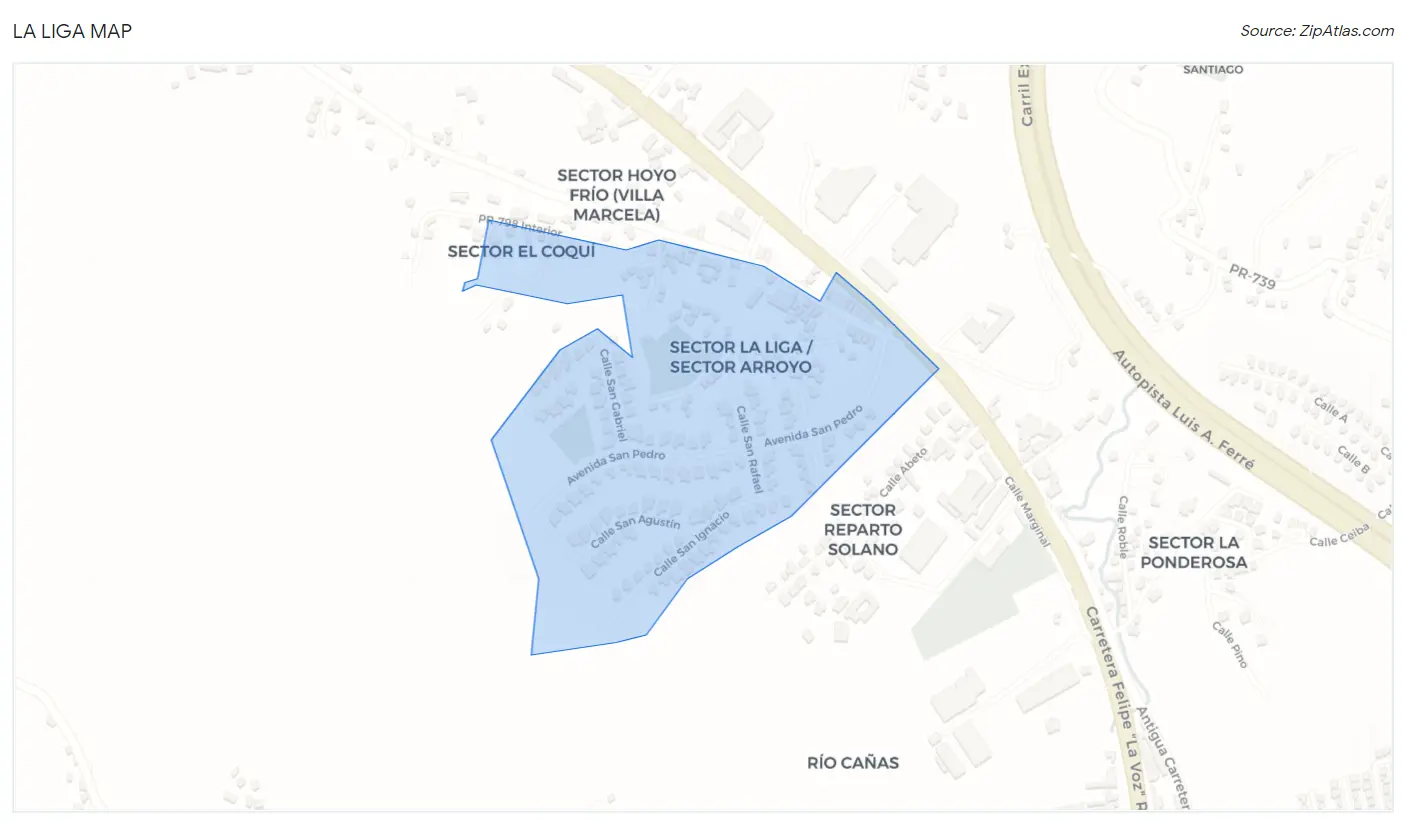
La Liga Overview
$20,039
PER CAPITA INCOME
$79,886
AVG FAMILY INCOME
$82,500
AVG HOUSEHOLD INCOME
8.3%
WAGE / INCOME GAP [ % ]
91.7¢/ $1
WAGE / INCOME GAP [ $ ]
0.34
INEQUALITY / GINI INDEX
590
TOTAL POPULATION
174
MALE POPULATION
416
FEMALE POPULATION
41.83
MALES / 100 FEMALES
239.08
FEMALES / 100 MALES
38.1
MEDIAN AGE
3.6
AVG FAMILY SIZE
3.4
AVG HOUSEHOLD SIZE
210
LABOR FORCE [ PEOPLE ]
45.3%
PERCENT IN LABOR FORCE
10.5%
UNEMPLOYMENT RATE
Income in La Liga
Income Overview in La Liga
Per Capita Income in La Liga is $20,039, while median incomes of families and households are $79,886 and $82,500 respectively.
| Characteristic | Number | Measure |
| Per Capita Income | 590 | $20,039 |
| Median Family Income | 150 | $79,886 |
| Mean Family Income | 150 | $63,303 |
| Median Household Income | 172 | $82,500 |
| Mean Household Income | 172 | $65,195 |
| Income Deficit | 150 | $0 |
| Wage / Income Gap (%) | 590 | 8.27% |
| Wage / Income Gap ($) | 590 | 91.73¢ per $1 |
| Gini / Inequality Index | 590 | 0.34 |
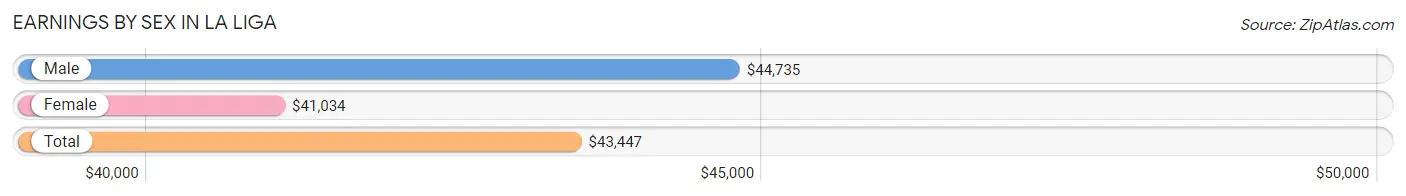
Earnings by Sex in La Liga
Average Earnings in La Liga are $43,447, $44,735 for men and $41,034 for women, a difference of 8.3%.
| Sex | Number | Average Earnings |
| Male | 118 (56.2%) | $44,735 |
| Female | 92 (43.8%) | $41,034 |
| Total | 210 (100.0%) | $43,447 |
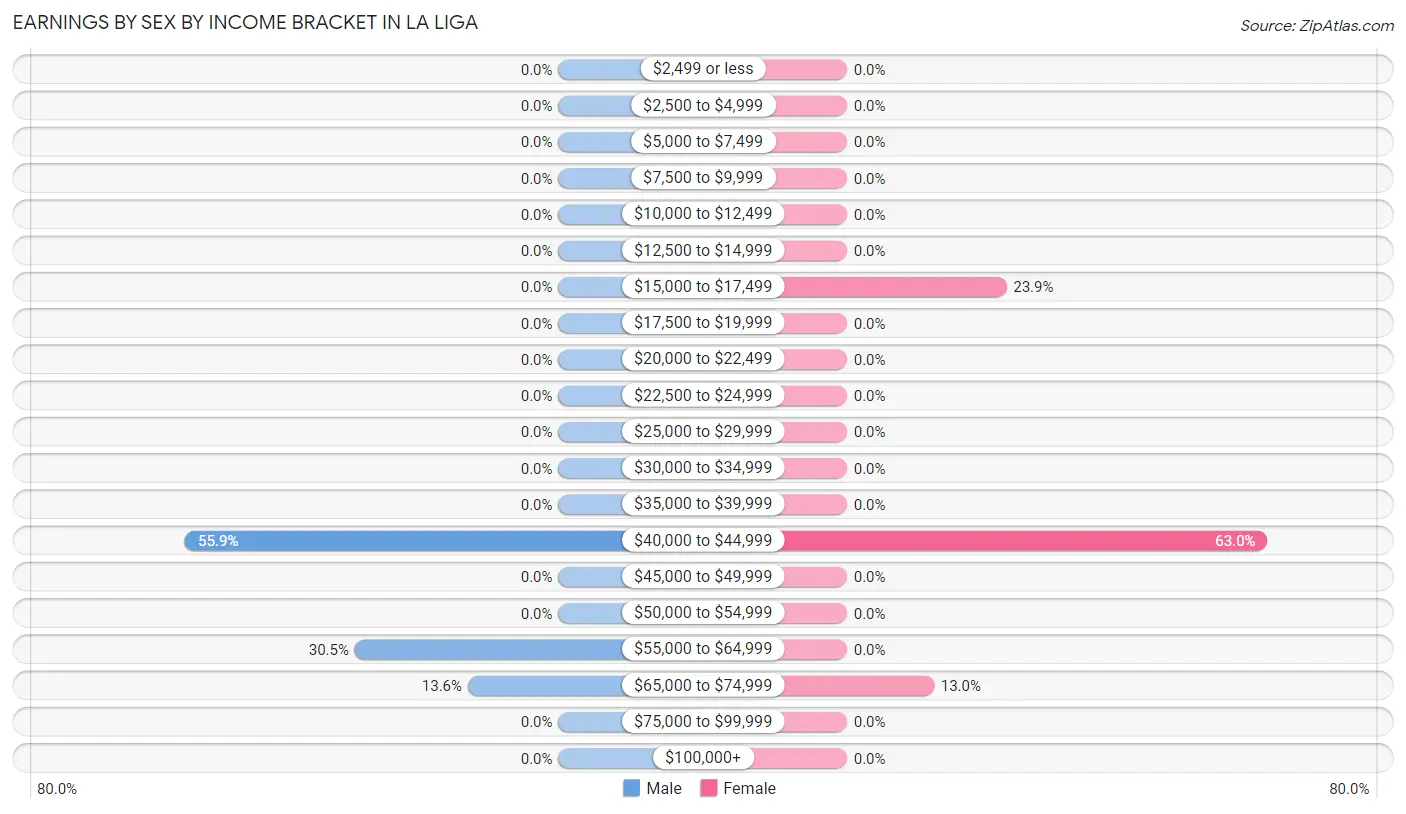
Earnings by Sex by Income Bracket in La Liga
The most common earnings brackets in La Liga are $40,000 to $44,999 for men (66 | 55.9%) and $40,000 to $44,999 for women (58 | 63.0%).
| Income | Male | Female |
| $2,499 or less | 0 (0.0%) | 0 (0.0%) |
| $2,500 to $4,999 | 0 (0.0%) | 0 (0.0%) |
| $5,000 to $7,499 | 0 (0.0%) | 0 (0.0%) |
| $7,500 to $9,999 | 0 (0.0%) | 0 (0.0%) |
| $10,000 to $12,499 | 0 (0.0%) | 0 (0.0%) |
| $12,500 to $14,999 | 0 (0.0%) | 0 (0.0%) |
| $15,000 to $17,499 | 0 (0.0%) | 22 (23.9%) |
| $17,500 to $19,999 | 0 (0.0%) | 0 (0.0%) |
| $20,000 to $22,499 | 0 (0.0%) | 0 (0.0%) |
| $22,500 to $24,999 | 0 (0.0%) | 0 (0.0%) |
| $25,000 to $29,999 | 0 (0.0%) | 0 (0.0%) |
| $30,000 to $34,999 | 0 (0.0%) | 0 (0.0%) |
| $35,000 to $39,999 | 0 (0.0%) | 0 (0.0%) |
| $40,000 to $44,999 | 66 (55.9%) | 58 (63.0%) |
| $45,000 to $49,999 | 0 (0.0%) | 0 (0.0%) |
| $50,000 to $54,999 | 0 (0.0%) | 0 (0.0%) |
| $55,000 to $64,999 | 36 (30.5%) | 0 (0.0%) |
| $65,000 to $74,999 | 16 (13.6%) | 12 (13.0%) |
| $75,000 to $99,999 | 0 (0.0%) | 0 (0.0%) |
| $100,000+ | 0 (0.0%) | 0 (0.0%) |
| Total | 118 (100.0%) | 92 (100.0%) |
Earnings by Sex by Educational Attainment in La Liga
| Educational Attainment | Male Income | Female Income |
| Less than High School | - | - |
| High School Diploma | - | - |
| College or Associate's Degree | - | - |
| Bachelor's Degree | - | - |
| Graduate Degree | - | - |
| Total | $44,735 | $41,034 |
Family Income in La Liga
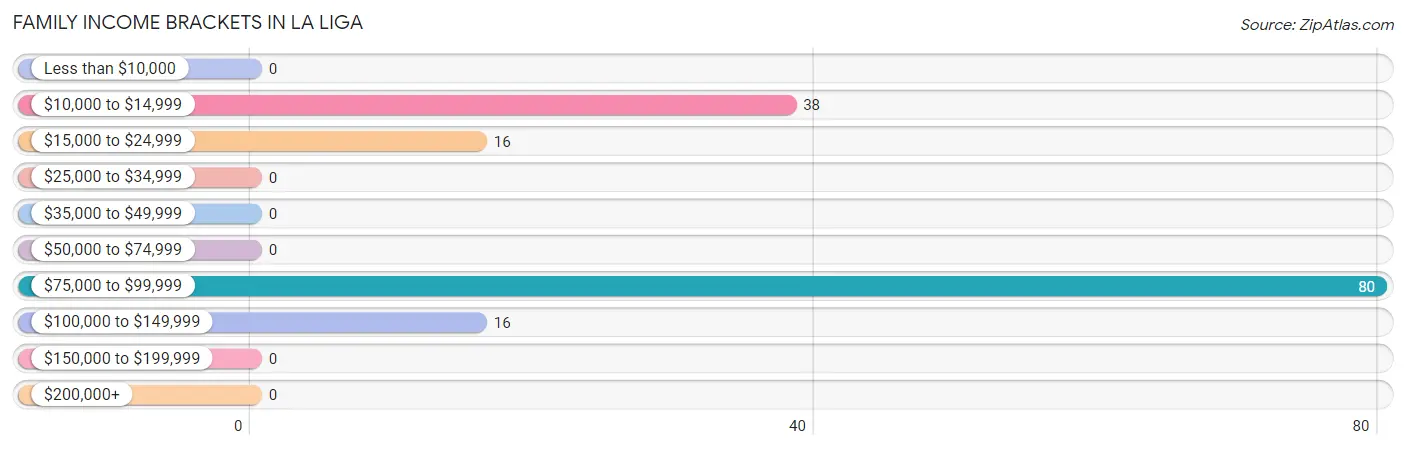
Family Income Brackets in La Liga
According to the La Liga family income data, there are 80 families falling into the $75,000 to $99,999 income range, which is the most common income bracket and makes up 53.3% of all families.
| Income Bracket | # Families | % Families |
| Less than $10,000 | 0 | 0.0% |
| $10,000 to $14,999 | 38 | 25.3% |
| $15,000 to $24,999 | 16 | 10.7% |
| $25,000 to $34,999 | 0 | 0.0% |
| $35,000 to $49,999 | 0 | 0.0% |
| $50,000 to $74,999 | 0 | 0.0% |
| $75,000 to $99,999 | 80 | 53.3% |
| $100,000 to $149,999 | 16 | 10.7% |
| $150,000 to $199,999 | 0 | 0.0% |
| $200,000+ | 0 | 0.0% |
Family Income by Famaliy Size in La Liga
| Income Bracket | # Families | Median Income |
| 2-Person Families | 76 (50.7%) | $0 |
| 3-Person Families | 16 (10.7%) | $0 |
| 4-Person Families | 0 (0.0%) | $0 |
| 5-Person Families | 58 (38.7%) | $0 |
| 6-Person Families | 0 (0.0%) | $0 |
| 7+ Person Families | 0 (0.0%) | $0 |
| Total | 150 (100.0%) | $79,886 |
Family Income by Number of Earners in La Liga
| Number of Earners | # Families | Median Income |
| No Earners | 54 (36.0%) | $0 |
| 1 Earner | 16 (10.7%) | $0 |
| 2 Earners | 80 (53.3%) | $0 |
| 3+ Earners | 0 (0.0%) | $0 |
| Total | 150 (100.0%) | $79,886 |
Household Income in La Liga
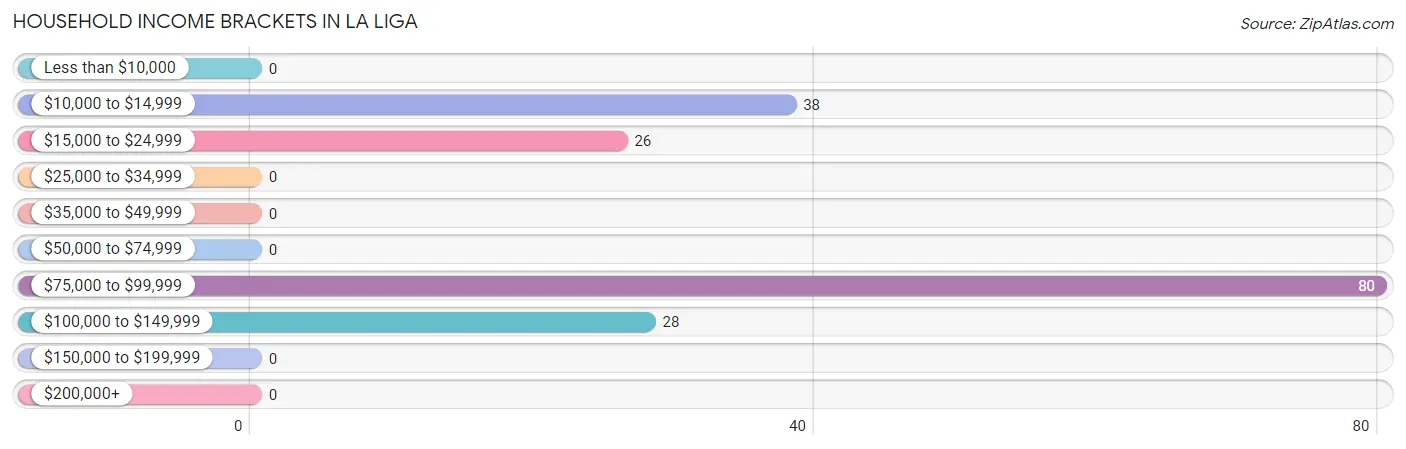
Household Income Brackets in La Liga
With 80 households falling in the category, the $75,000 to $99,999 income range is the most frequent in La Liga, accounting for 46.5% of all households.
| Income Bracket | # Households | % Households |
| Less than $10,000 | 0 | 0.0% |
| $10,000 to $14,999 | 38 | 22.1% |
| $15,000 to $24,999 | 26 | 15.1% |
| $25,000 to $34,999 | 0 | 0.0% |
| $35,000 to $49,999 | 0 | 0.0% |
| $50,000 to $74,999 | 0 | 0.0% |
| $75,000 to $99,999 | 80 | 46.5% |
| $100,000 to $149,999 | 28 | 16.3% |
| $150,000 to $199,999 | 0 | 0.0% |
| $200,000+ | 0 | 0.0% |
Household Income by Householder Age in La Liga
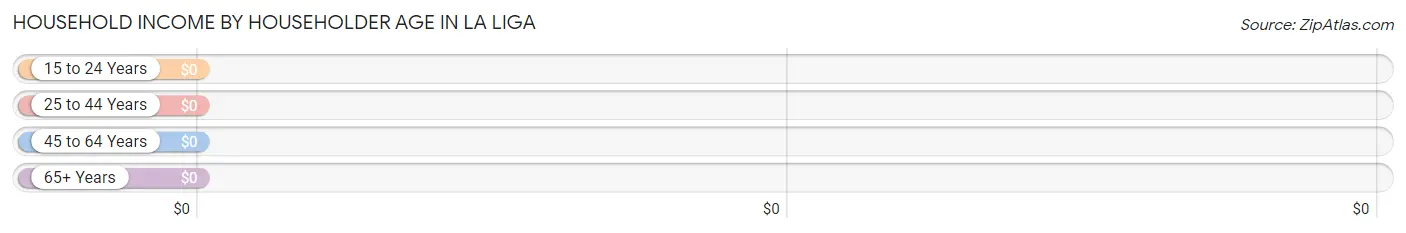
| Income Bracket | # Households | Median Income |
| 15 to 24 Years | 0 (0.0%) | $0 |
| 25 to 44 Years | 70 (40.7%) | $0 |
| 45 to 64 Years | 38 (22.1%) | $0 |
| 65+ Years | 64 (37.2%) | $0 |
| Total | 172 (100.0%) | $82,500 |
Poverty in La Liga
Income Below Poverty by Sex and Age in La Liga
With 32.2% poverty level for males and 28.1% for females among the residents of La Liga, 25 to 34 year old males and 75 year old and over females are the most vulnerable to poverty, with 30 males (100.0%) and 11 females (100.0%) in their respective age groups living below the poverty level.
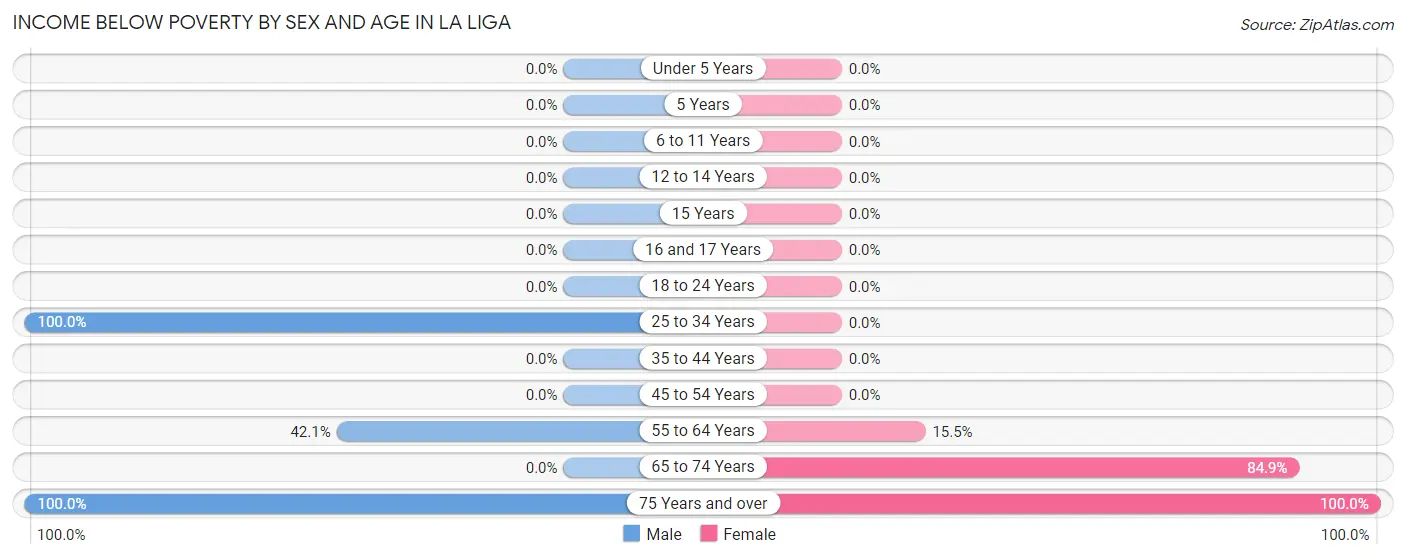
| Age Bracket | Male | Female |
| Under 5 Years | 0 (0.0%) | 0 (0.0%) |
| 5 Years | 0 (0.0%) | 0 (0.0%) |
| 6 to 11 Years | 0 (0.0%) | 0 (0.0%) |
| 12 to 14 Years | 0 (0.0%) | 0 (0.0%) |
| 15 Years | 0 (0.0%) | 0 (0.0%) |
| 16 and 17 Years | 0 (0.0%) | 0 (0.0%) |
| 18 to 24 Years | 0 (0.0%) | 0 (0.0%) |
| 25 to 34 Years | 30 (100.0%) | 0 (0.0%) |
| 35 to 44 Years | 0 (0.0%) | 0 (0.0%) |
| 45 to 54 Years | 0 (0.0%) | 0 (0.0%) |
| 55 to 64 Years | 16 (42.1%) | 16 (15.5%) |
| 65 to 74 Years | 0 (0.0%) | 90 (84.9%) |
| 75 Years and over | 10 (100.0%) | 11 (100.0%) |
| Total | 56 (32.2%) | 117 (28.1%) |
Income Above Poverty by Sex and Age in La Liga
According to the poverty statistics in La Liga, males aged 35 to 44 years and females aged under 5 years are the age groups that are most secure financially, with 100.0% of males and 100.0% of females in these age groups living above the poverty line.
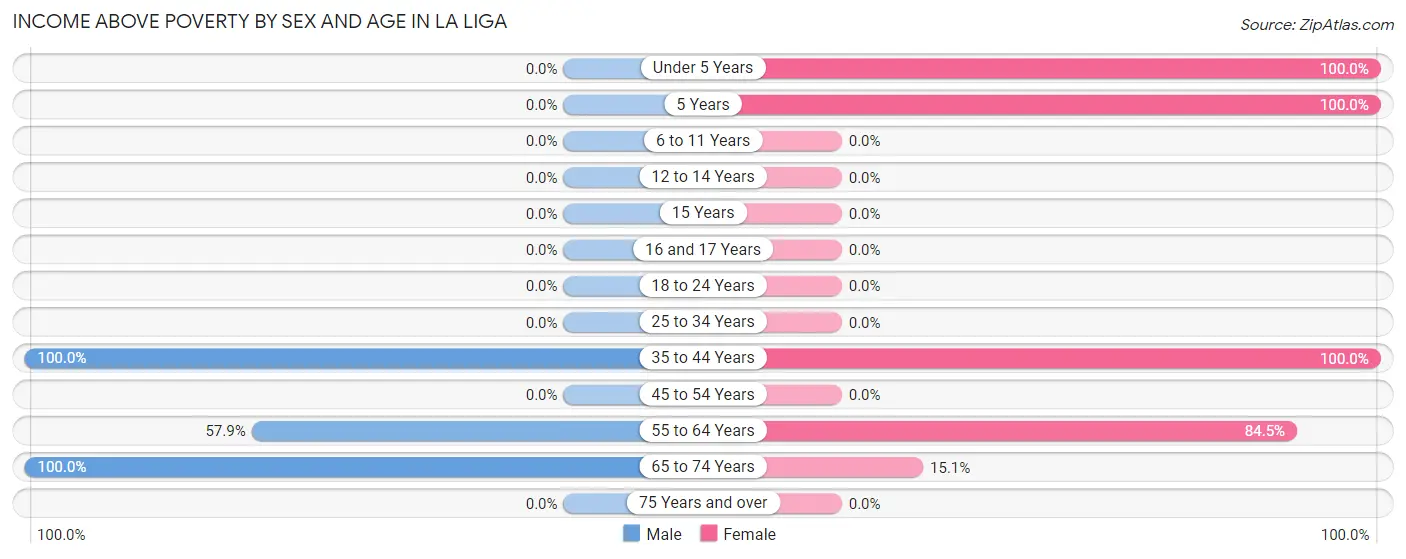
| Age Bracket | Male | Female |
| Under 5 Years | 0 (0.0%) | 69 (100.0%) |
| 5 Years | 0 (0.0%) | 57 (100.0%) |
| 6 to 11 Years | 0 (0.0%) | 0 (0.0%) |
| 12 to 14 Years | 0 (0.0%) | 0 (0.0%) |
| 15 Years | 0 (0.0%) | 0 (0.0%) |
| 16 and 17 Years | 0 (0.0%) | 0 (0.0%) |
| 18 to 24 Years | 0 (0.0%) | 0 (0.0%) |
| 25 to 34 Years | 0 (0.0%) | 0 (0.0%) |
| 35 to 44 Years | 80 (100.0%) | 70 (100.0%) |
| 45 to 54 Years | 0 (0.0%) | 0 (0.0%) |
| 55 to 64 Years | 22 (57.9%) | 87 (84.5%) |
| 65 to 74 Years | 16 (100.0%) | 16 (15.1%) |
| 75 Years and over | 0 (0.0%) | 0 (0.0%) |
| Total | 118 (67.8%) | 299 (71.9%) |
Income Below Poverty Among Married-Couple Families in La Liga
The poverty statistics for married-couple families in La Liga show that 14.3% or 16 of the total 112 families live below the poverty line. Families with no children have the highest poverty rate of 29.6%, comprising of 16 families. On the other hand, families with 1 or 2 children have the lowest poverty rate of 0.0%, which includes 0 families.
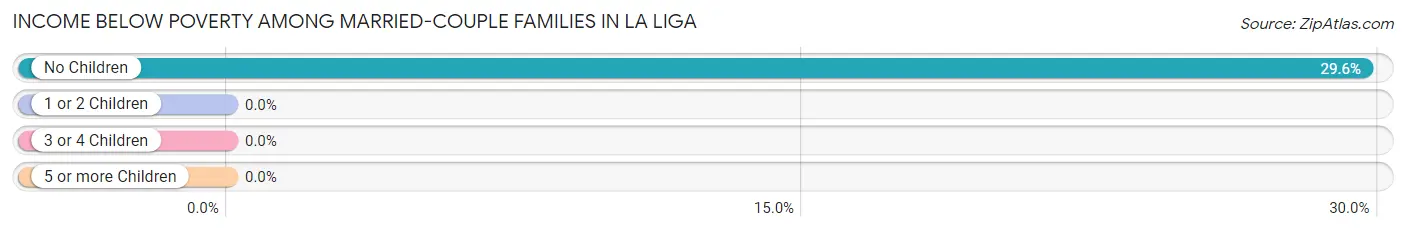
| Children | Above Poverty | Below Poverty |
| No Children | 38 (70.4%) | 16 (29.6%) |
| 1 or 2 Children | 58 (100.0%) | 0 (0.0%) |
| 3 or 4 Children | 0 (0.0%) | 0 (0.0%) |
| 5 or more Children | 0 (0.0%) | 0 (0.0%) |
| Total | 96 (85.7%) | 16 (14.3%) |
Income Below Poverty Among Single-Parent Households in La Liga
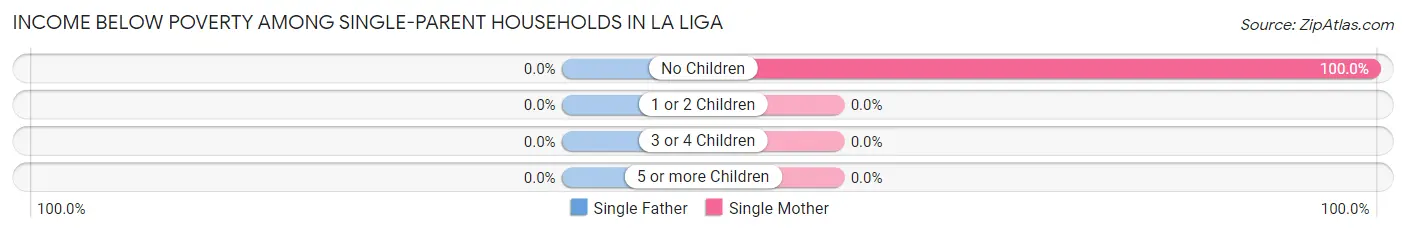
| Children | Single Father | Single Mother |
| No Children | 0 (0.0%) | 38 (100.0%) |
| 1 or 2 Children | 0 (0.0%) | 0 (0.0%) |
| 3 or 4 Children | 0 (0.0%) | 0 (0.0%) |
| 5 or more Children | 0 (0.0%) | 0 (0.0%) |
| Total | 0 (0.0%) | 38 (100.0%) |
Income Below Poverty Among Married-Couple vs Single-Parent Households in La Liga
The poverty data for La Liga shows that 16 of the married-couple family households (14.3%) and 38 of the single-parent households (100.0%) are living below the poverty level. Within the married-couple family households, those with no children have the highest poverty rate, with 16 households (29.6%) falling below the poverty line. Among the single-parent households, those with no children have the highest poverty rate, with 38 household (100.0%) living below poverty.
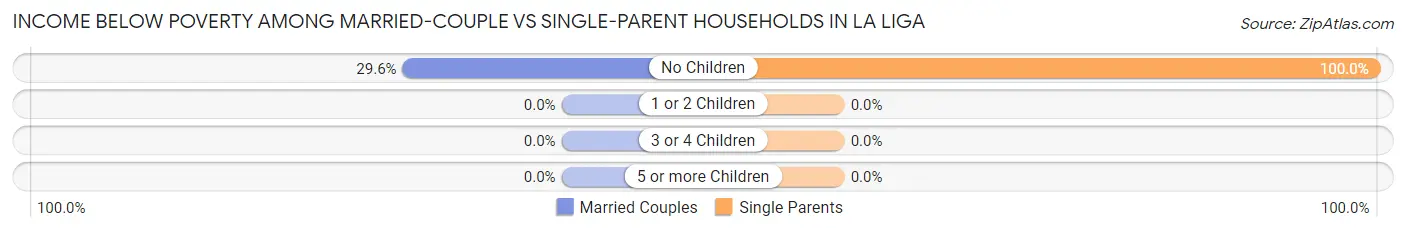
| Children | Married-Couple Families | Single-Parent Households |
| No Children | 16 (29.6%) | 38 (100.0%) |
| 1 or 2 Children | 0 (0.0%) | 0 (0.0%) |
| 3 or 4 Children | 0 (0.0%) | 0 (0.0%) |
| 5 or more Children | 0 (0.0%) | 0 (0.0%) |
| Total | 16 (14.3%) | 38 (100.0%) |
Race in La Liga
The most populous races in La Liga are Hispanic or Latino (590 | 100.0%), Some other Race (359 | 60.9%), and White / Caucasian (136 | 23.1%).
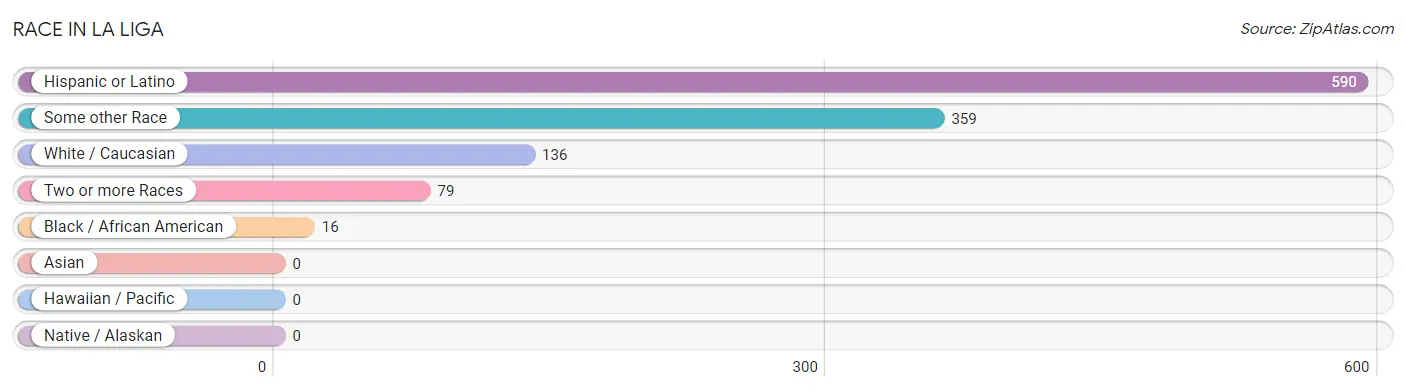
| Race | # Population | % Population |
| Asian | 0 | 0.0% |
| Black / African American | 16 | 2.7% |
| Hawaiian / Pacific | 0 | 0.0% |
| Hispanic or Latino | 590 | 100.0% |
| Native / Alaskan | 0 | 0.0% |
| White / Caucasian | 136 | 23.1% |
| Two or more Races | 79 | 13.4% |
| Some other Race | 359 | 60.9% |
| Total | 590 | 100.0% |
Ancestry in La Liga
The most populous ancestries reported in La Liga are Puerto Rican (487 | 82.5%), American (189 | 32.0%), Cuban (38 | 6.4%), and Central American Indian (26 | 4.4%), together accounting for 125.4% of all La Liga residents.
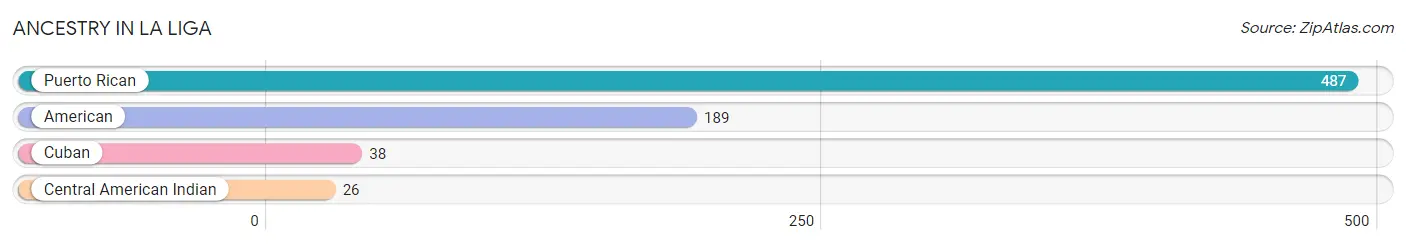
| Ancestry | # Population | % Population |
| American | 189 | 32.0% |
| Central American Indian | 26 | 4.4% |
| Cuban | 38 | 6.4% |
| Puerto Rican | 487 | 82.5% | View All 4 Rows |
Immigrants in La Liga

| Immigration Origin | # Population | % Population | View All 0 Rows |
Sex and Age in La Liga
Sex and Age in La Liga
The most populous age groups in La Liga are 35 to 39 Years (80 | 46.0%) for men and 70 to 74 Years (106 | 25.5%) for women.
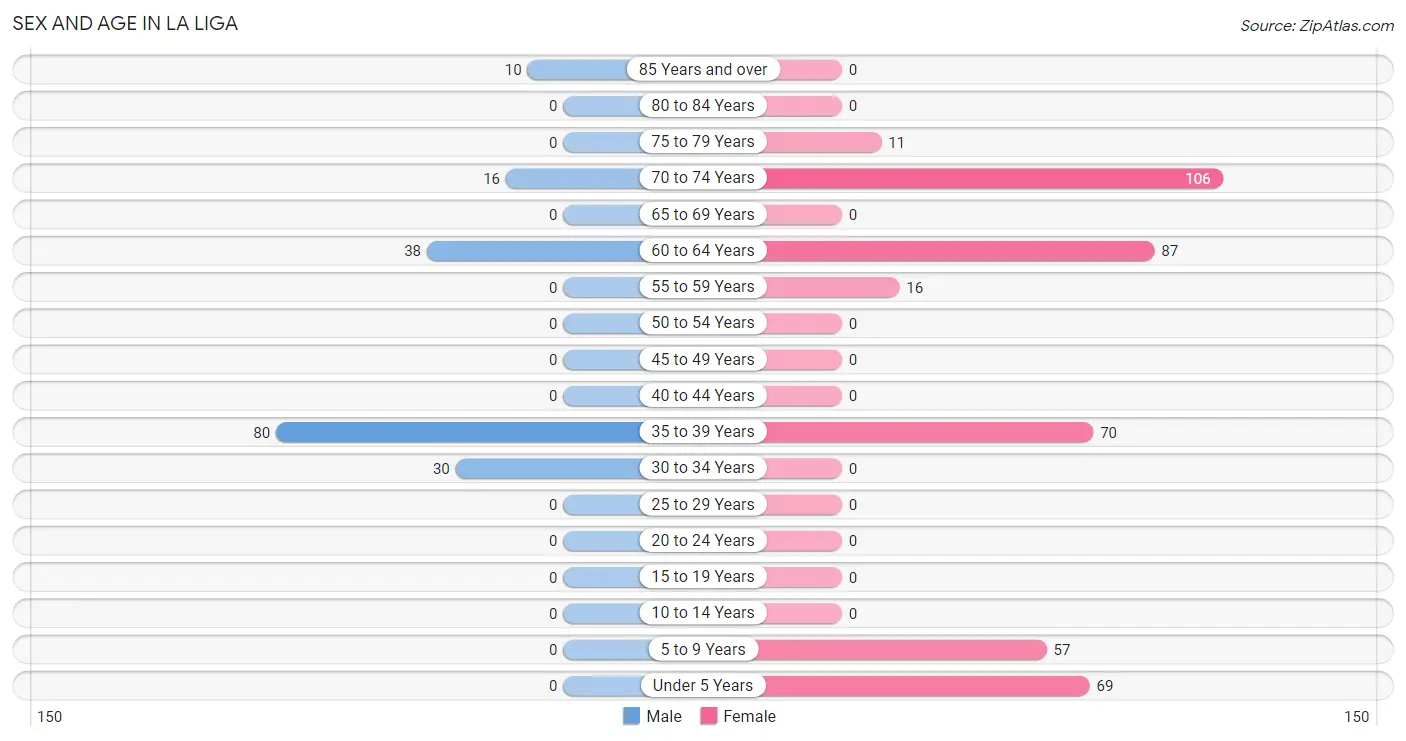
| Age Bracket | Male | Female |
| Under 5 Years | 0 (0.0%) | 69 (16.6%) |
| 5 to 9 Years | 0 (0.0%) | 57 (13.7%) |
| 10 to 14 Years | 0 (0.0%) | 0 (0.0%) |
| 15 to 19 Years | 0 (0.0%) | 0 (0.0%) |
| 20 to 24 Years | 0 (0.0%) | 0 (0.0%) |
| 25 to 29 Years | 0 (0.0%) | 0 (0.0%) |
| 30 to 34 Years | 30 (17.2%) | 0 (0.0%) |
| 35 to 39 Years | 80 (46.0%) | 70 (16.8%) |
| 40 to 44 Years | 0 (0.0%) | 0 (0.0%) |
| 45 to 49 Years | 0 (0.0%) | 0 (0.0%) |
| 50 to 54 Years | 0 (0.0%) | 0 (0.0%) |
| 55 to 59 Years | 0 (0.0%) | 16 (3.8%) |
| 60 to 64 Years | 38 (21.8%) | 87 (20.9%) |
| 65 to 69 Years | 0 (0.0%) | 0 (0.0%) |
| 70 to 74 Years | 16 (9.2%) | 106 (25.5%) |
| 75 to 79 Years | 0 (0.0%) | 11 (2.6%) |
| 80 to 84 Years | 0 (0.0%) | 0 (0.0%) |
| 85 Years and over | 10 (5.8%) | 0 (0.0%) |
| Total | 174 (100.0%) | 416 (100.0%) |
Families and Households in La Liga
Median Family Size in La Liga
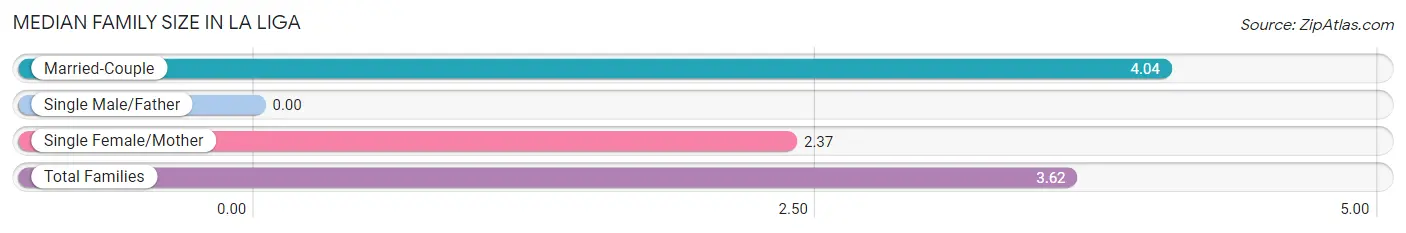
| Family Type | # Families | Family Size |
| Married-Couple | 112 (74.7%) | 4.04 |
| Single Male/Father | 0 (0.0%) | - |
| Single Female/Mother | 38 (25.3%) | 2.37 |
| Total Families | 150 (100.0%) | 3.62 |
Median Household Size in La Liga
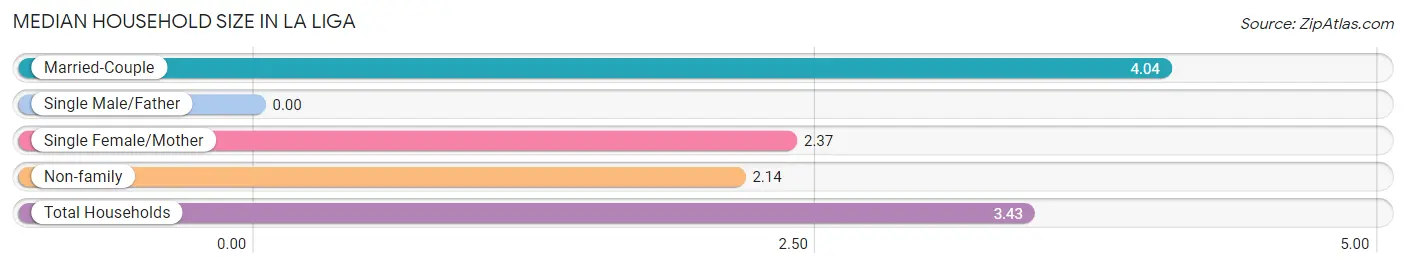
| Household Type | # Households | Household Size |
| Married-Couple | 112 (65.1%) | 4.04 |
| Single Male/Father | 0 (0.0%) | - |
| Single Female/Mother | 38 (22.1%) | 2.37 |
| Non-family | 22 (12.8%) | 2.14 |
| Total Households | 172 (100.0%) | 3.43 |
Household Size by Marriage Status in La Liga
Out of a total of 172 households in La Liga, 150 (87.2%) are family households, while 22 (12.8%) are nonfamily households. The most numerous type of family households are 2-person households, comprising 76, and the most common type of nonfamily households are 2-person households, comprising 22.
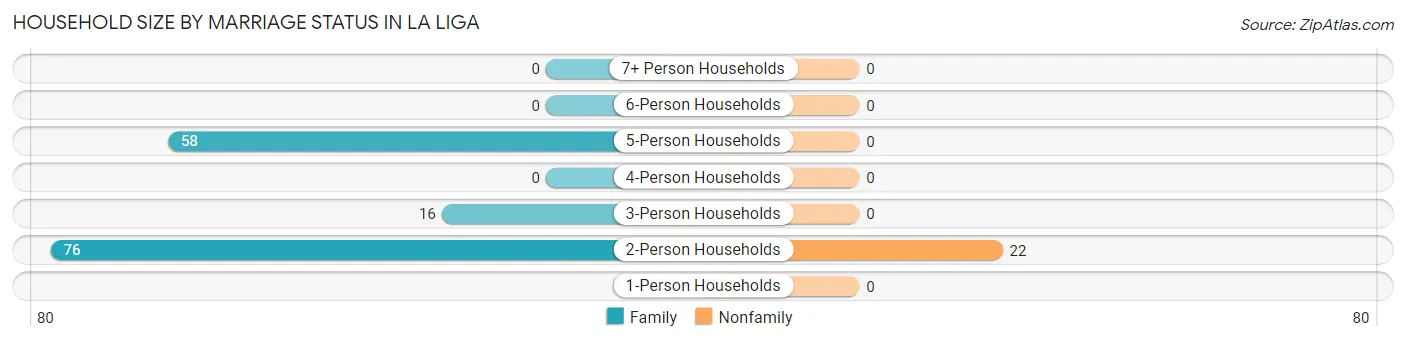
| Household Size | Family Households | Nonfamily Households |
| 1-Person Households | - | 0 (0.0%) |
| 2-Person Households | 76 (44.2%) | 22 (12.8%) |
| 3-Person Households | 16 (9.3%) | 0 (0.0%) |
| 4-Person Households | 0 (0.0%) | 0 (0.0%) |
| 5-Person Households | 58 (33.7%) | 0 (0.0%) |
| 6-Person Households | 0 (0.0%) | 0 (0.0%) |
| 7+ Person Households | 0 (0.0%) | 0 (0.0%) |
| Total | 150 (87.2%) | 22 (12.8%) |
Female Fertility in La Liga
Fertility by Age in La Liga
| Age Bracket | Women with Births | Births / 1,000 Women |
| 15 to 19 years | 0 (0.0%) | 0.0 |
| 20 to 34 years | 0 (0.0%) | 0.0 |
| 35 to 50 years | 0 (0.0%) | 0.0 |
| Total | 0 (0.0%) | 0.0 |
Fertility by Age by Marriage Status in La Liga
| Age Bracket | Married | Unmarried |
| 15 to 19 years | 0 (0.0%) | 0 (0.0%) |
| 20 to 34 years | 0 (0.0%) | 0 (0.0%) |
| 35 to 50 years | 0 (0.0%) | 0 (0.0%) |
| Total | 0 (0.0%) | 0 (0.0%) |
Fertility by Education in La Liga
| Educational Attainment | Women with Births | Births / 1,000 Women |
| Less than High School | 0 (0.0%) | 0.0 |
| High School Diploma | 0 (0.0%) | 0.0 |
| College or Associate's Degree | 0 (0.0%) | 0.0 |
| Bachelor's Degree | 0 (0.0%) | 0.0 |
| Graduate Degree | 0 (0.0%) | 0.0 |
| Total | 0 (0.0%) | 0.0 |
Fertility by Education by Marriage Status in La Liga
| Educational Attainment | Married | Unmarried |
| Less than High School | 0 (0.0%) | 0 (0.0%) |
| High School Diploma | 0 (0.0%) | 0 (0.0%) |
| College or Associate's Degree | 0 (0.0%) | 0 (0.0%) |
| Bachelor's Degree | 0 (0.0%) | 0 (0.0%) |
| Graduate Degree | 0 (0.0%) | 0 (0.0%) |
| Total | 0 (0.0%) | 0 (0.0%) |
Employment Characteristics in La Liga
Employment by Class of Employer in La Liga
Among the 188 employed individuals in La Liga, private company employees (82 | 43.6%), state government employees (72 | 38.3%), and self-employed (not incorporated) (22 | 11.7%) make up the most common classes of employment.
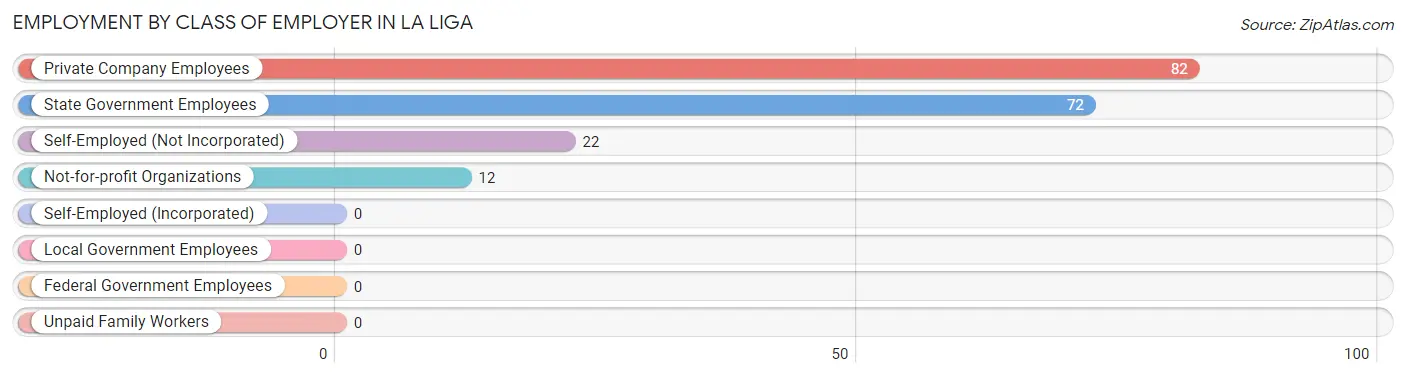
| Employer Class | # Employees | % Employees |
| Private Company Employees | 82 | 43.6% |
| Self-Employed (Incorporated) | 0 | 0.0% |
| Self-Employed (Not Incorporated) | 22 | 11.7% |
| Not-for-profit Organizations | 12 | 6.4% |
| Local Government Employees | 0 | 0.0% |
| State Government Employees | 72 | 38.3% |
| Federal Government Employees | 0 | 0.0% |
| Unpaid Family Workers | 0 | 0.0% |
| Total | 188 | 100.0% |
Employment Status by Age in La Liga
According to the labor force statistics for La Liga, out of the total population over 16 years of age (464), 45.3% or 210 individuals are in the labor force, with 10.5% or 22 of them unemployed. The age group with the highest labor force participation rate is 35 to 44 years, with 100.0% or 150 individuals in the labor force. Within the labor force, the 60 to 64 years age range has the highest percentage of unemployed individuals, with 50.0% or 22 of them being unemployed.
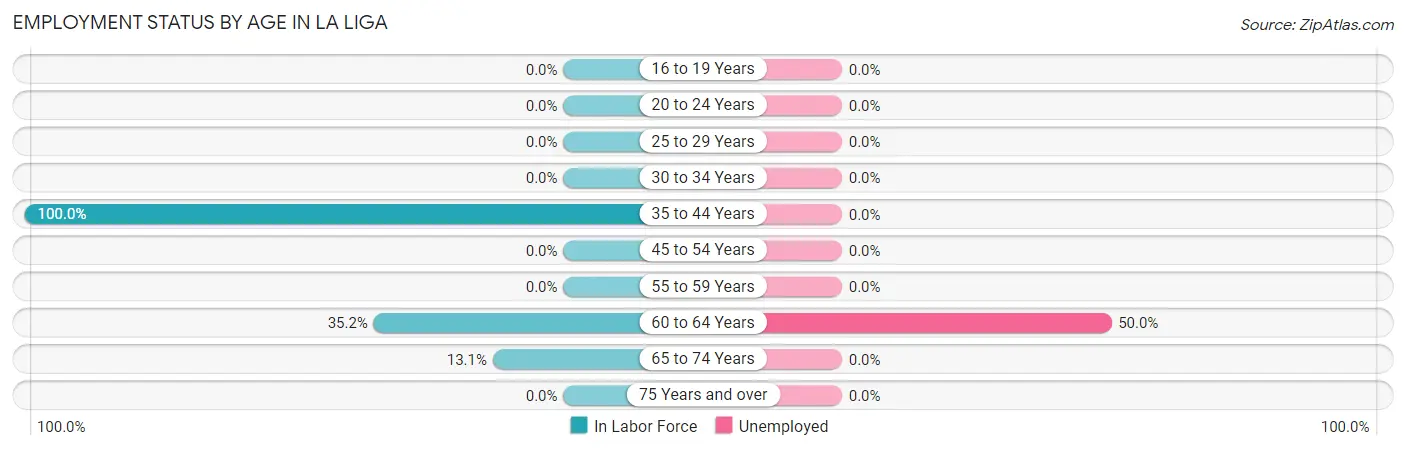
| Age Bracket | In Labor Force | Unemployed |
| 16 to 19 Years | 0 (0.0%) | 0 (0.0%) |
| 20 to 24 Years | 0 (0.0%) | 0 (0.0%) |
| 25 to 29 Years | 0 (0.0%) | 0 (0.0%) |
| 30 to 34 Years | 0 (0.0%) | 0 (0.0%) |
| 35 to 44 Years | 150 (100.0%) | 0 (0.0%) |
| 45 to 54 Years | 0 (0.0%) | 0 (0.0%) |
| 55 to 59 Years | 0 (0.0%) | 0 (0.0%) |
| 60 to 64 Years | 44 (35.2%) | 22 (50.0%) |
| 65 to 74 Years | 16 (13.1%) | 0 (0.0%) |
| 75 Years and over | 0 (0.0%) | 0 (0.0%) |
| Total | 210 (45.3%) | 22 (10.5%) |
Employment Status by Educational Attainment in La Liga
According to labor force statistics for La Liga, 60.4% of individuals (194) out of the total population between 25 and 64 years of age (321) are in the labor force, with 11.3% or 22 of them being unemployed. The group with the highest labor force participation rate are those with the educational attainment of bachelor's degree or higher, with 74.9% or 194 individuals in the labor force. Within the labor force, individuals with bachelor's degree or higher education have the highest percentage of unemployment, with 11.3% or 22 of them being unemployed.
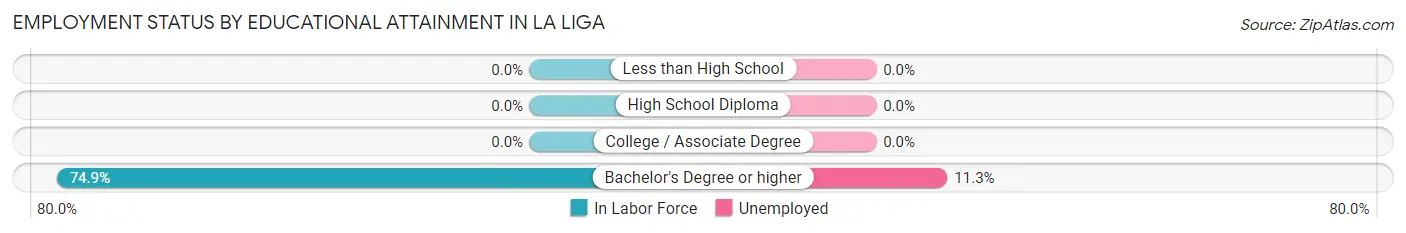
| Educational Attainment | In Labor Force | Unemployed |
| Less than High School | 0 (0.0%) | 0 (0.0%) |
| High School Diploma | 0 (0.0%) | 0 (0.0%) |
| College / Associate Degree | 0 (0.0%) | 0 (0.0%) |
| Bachelor's Degree or higher | 194 (74.9%) | 29 (11.3%) |
| Total | 194 (60.4%) | 36 (11.3%) |
Employment Occupations by Sex in La Liga
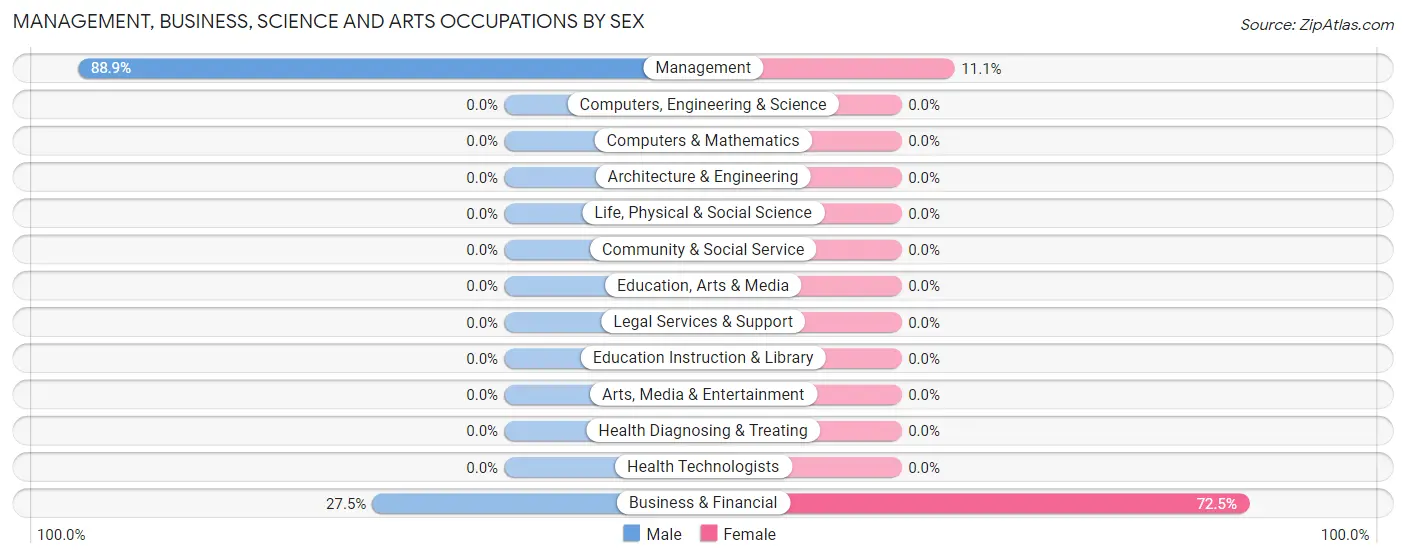
Management, Business, Science and Arts Occupations
The most common Management, Business, Science and Arts occupations in La Liga are Management (108 | 57.5%), and Business & Financial (80 | 42.5%).
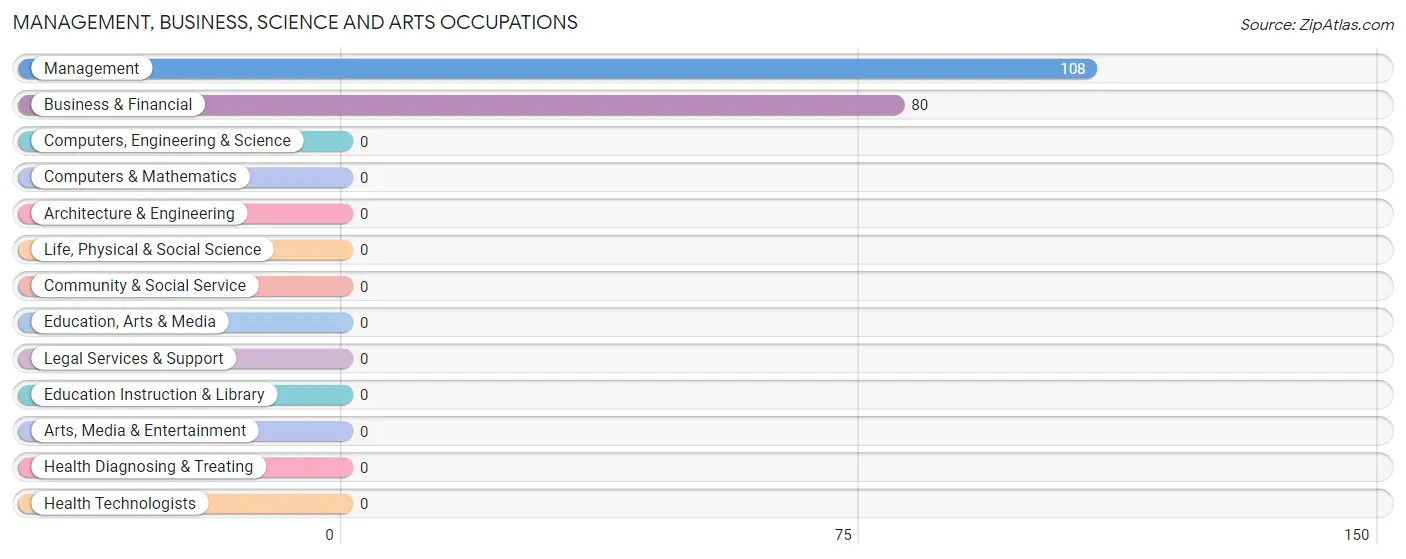
Management, Business, Science and Arts Occupations by Sex
Within the Management, Business, Science and Arts occupations in La Liga, the most male-oriented occupations are Management (88.9%), and Business & Financial (27.5%), while the most female-oriented occupations are Business & Financial (72.5%), and Management (11.1%).
| Occupation | Male | Female |
| Management | 96 (88.9%) | 12 (11.1%) |
| Business & Financial | 22 (27.5%) | 58 (72.5%) |
| Computers, Engineering & Science | 0 (0.0%) | 0 (0.0%) |
| Computers & Mathematics | 0 (0.0%) | 0 (0.0%) |
| Architecture & Engineering | 0 (0.0%) | 0 (0.0%) |
| Life, Physical & Social Science | 0 (0.0%) | 0 (0.0%) |
| Community & Social Service | 0 (0.0%) | 0 (0.0%) |
| Education, Arts & Media | 0 (0.0%) | 0 (0.0%) |
| Legal Services & Support | 0 (0.0%) | 0 (0.0%) |
| Education Instruction & Library | 0 (0.0%) | 0 (0.0%) |
| Arts, Media & Entertainment | 0 (0.0%) | 0 (0.0%) |
| Health Diagnosing & Treating | 0 (0.0%) | 0 (0.0%) |
| Health Technologists | 0 (0.0%) | 0 (0.0%) |
| Total (Category) | 118 (62.8%) | 70 (37.2%) |
| Total (Overall) | 118 (62.8%) | 70 (37.2%) |
Services Occupations
Services Occupations by Sex
| Occupation | Male | Female |
| Healthcare Support | 0 (0.0%) | 0 (0.0%) |
| Security & Protection | 0 (0.0%) | 0 (0.0%) |
| Firefighting & Prevention | 0 (0.0%) | 0 (0.0%) |
| Law Enforcement | 0 (0.0%) | 0 (0.0%) |
| Food Preparation & Serving | 0 (0.0%) | 0 (0.0%) |
| Cleaning & Maintenance | 0 (0.0%) | 0 (0.0%) |
| Personal Care & Service | 0 (0.0%) | 0 (0.0%) |
| Total (Category) | 0 (0.0%) | 0 (0.0%) |
| Total (Overall) | 118 (62.8%) | 70 (37.2%) |
Sales and Office Occupations

Sales and Office Occupations by Sex
| Occupation | Male | Female |
| Sales & Related | 0 (0.0%) | 0 (0.0%) |
| Office & Administration | 0 (0.0%) | 0 (0.0%) |
| Total (Category) | 0 (0.0%) | 0 (0.0%) |
| Total (Overall) | 118 (62.8%) | 70 (37.2%) |
Natural Resources, Construction and Maintenance Occupations

Natural Resources, Construction and Maintenance Occupations by Sex
| Occupation | Male | Female |
| Farming, Fishing & Forestry | 0 (0.0%) | 0 (0.0%) |
| Construction & Extraction | 0 (0.0%) | 0 (0.0%) |
| Installation, Maintenance & Repair | 0 (0.0%) | 0 (0.0%) |
| Total (Category) | 0 (0.0%) | 0 (0.0%) |
| Total (Overall) | 118 (62.8%) | 70 (37.2%) |
Production, Transportation and Moving Occupations
Production, Transportation and Moving Occupations by Sex
| Occupation | Male | Female |
| Production | 0 (0.0%) | 0 (0.0%) |
| Transportation | 0 (0.0%) | 0 (0.0%) |
| Material Moving | 0 (0.0%) | 0 (0.0%) |
| Total (Category) | 0 (0.0%) | 0 (0.0%) |
| Total (Overall) | 118 (62.8%) | 70 (37.2%) |
Employment Industries by Sex in La Liga
Employment Industries in La Liga
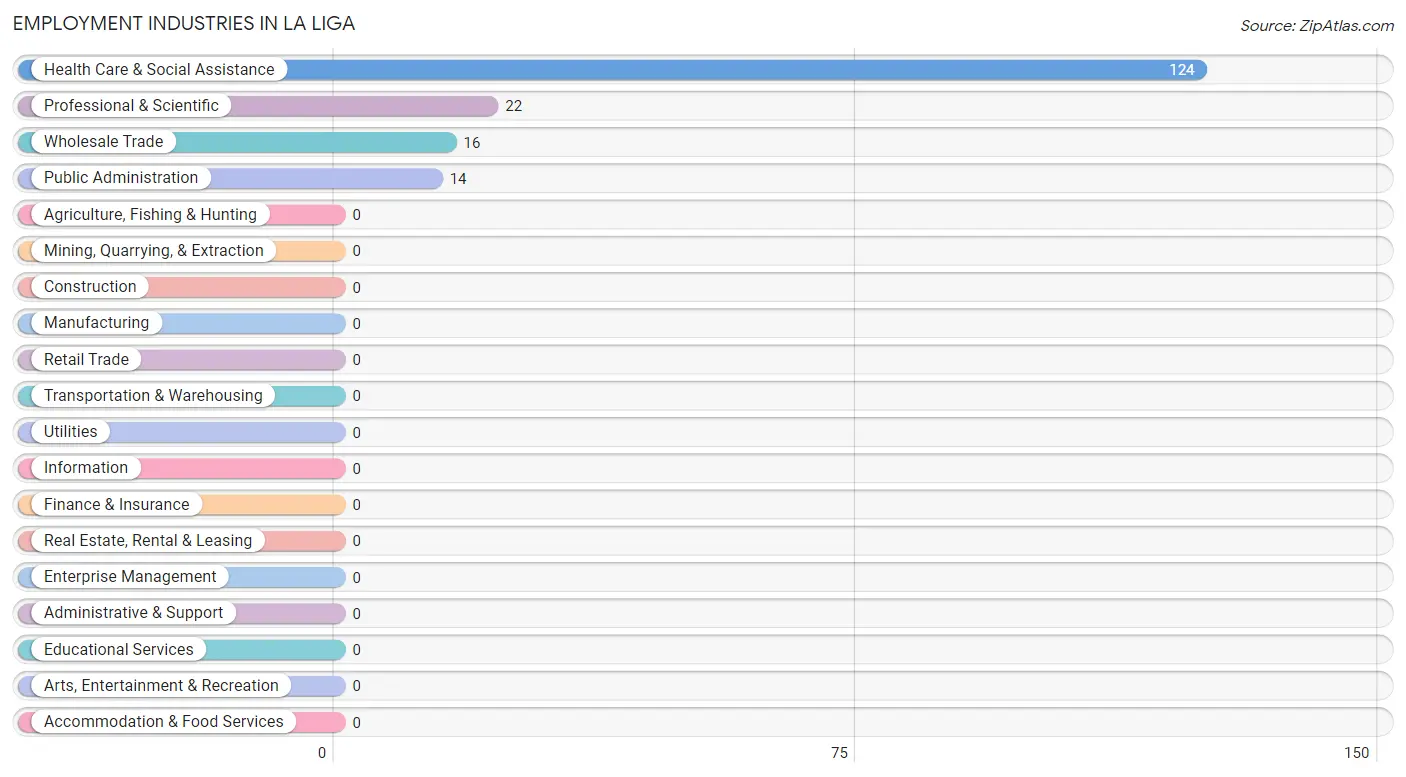
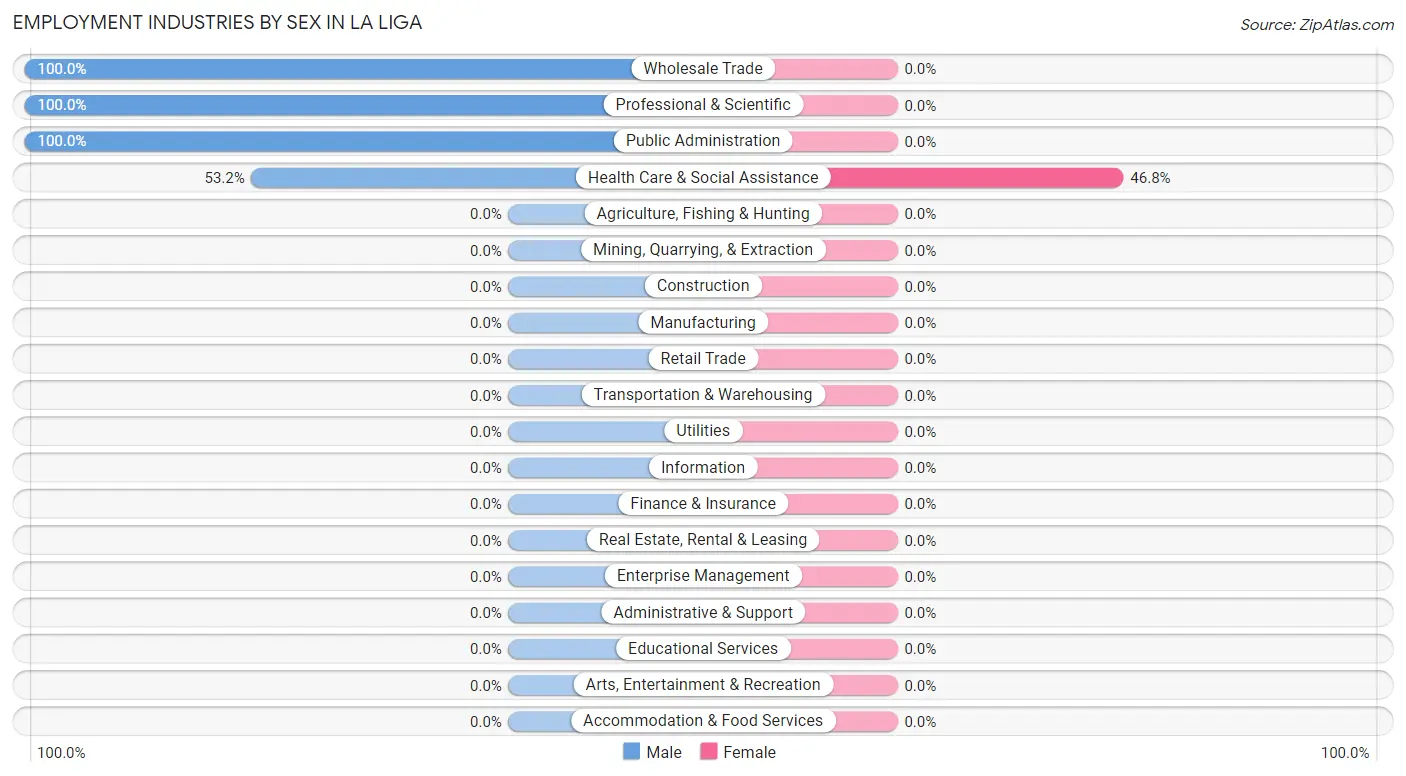
The major employment industries in La Liga include Health Care & Social Assistance (124 | 66.0%), Professional & Scientific (22 | 11.7%), Wholesale Trade (16 | 8.5%), and Public Administration (14 | 7.4%).
Employment Industries by Sex in La Liga
| Industry | Male | Female |
| Agriculture, Fishing & Hunting | 0 (0.0%) | 0 (0.0%) |
| Mining, Quarrying, & Extraction | 0 (0.0%) | 0 (0.0%) |
| Construction | 0 (0.0%) | 0 (0.0%) |
| Manufacturing | 0 (0.0%) | 0 (0.0%) |
| Wholesale Trade | 16 (100.0%) | 0 (0.0%) |
| Retail Trade | 0 (0.0%) | 0 (0.0%) |
| Transportation & Warehousing | 0 (0.0%) | 0 (0.0%) |
| Utilities | 0 (0.0%) | 0 (0.0%) |
| Information | 0 (0.0%) | 0 (0.0%) |
| Finance & Insurance | 0 (0.0%) | 0 (0.0%) |
| Real Estate, Rental & Leasing | 0 (0.0%) | 0 (0.0%) |
| Professional & Scientific | 22 (100.0%) | 0 (0.0%) |
| Enterprise Management | 0 (0.0%) | 0 (0.0%) |
| Administrative & Support | 0 (0.0%) | 0 (0.0%) |
| Educational Services | 0 (0.0%) | 0 (0.0%) |
| Health Care & Social Assistance | 66 (53.2%) | 58 (46.8%) |
| Arts, Entertainment & Recreation | 0 (0.0%) | 0 (0.0%) |
| Accommodation & Food Services | 0 (0.0%) | 0 (0.0%) |
| Public Administration | 14 (100.0%) | 0 (0.0%) |
| Total | 118 (62.8%) | 70 (37.2%) |
Education in La Liga
School Enrollment in La Liga
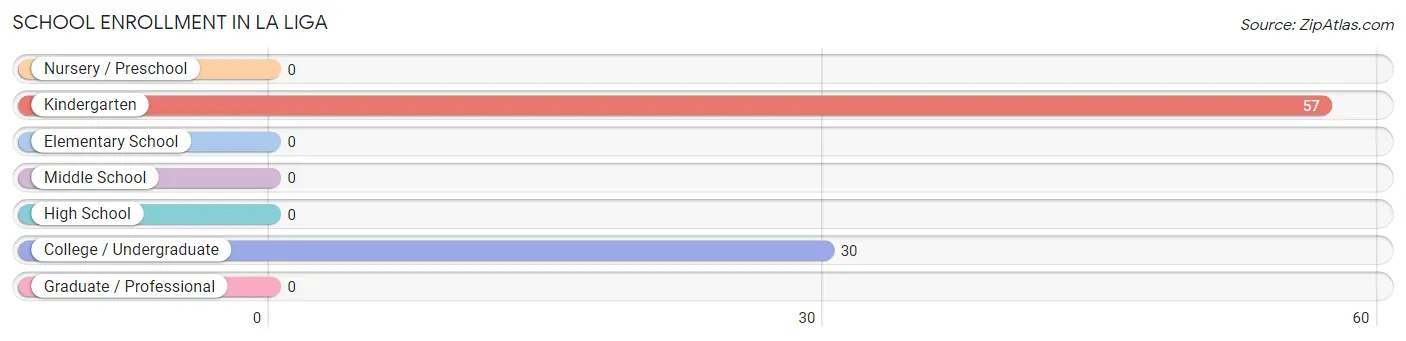
The most common levels of schooling among the 87 students in La Liga are kindergarten (57 | 65.5%), and college / undergraduate (30 | 34.5%).
| School Level | # Students | % Students |
| Nursery / Preschool | 0 | 0.0% |
| Kindergarten | 57 | 65.5% |
| Elementary School | 0 | 0.0% |
| Middle School | 0 | 0.0% |
| High School | 0 | 0.0% |
| College / Undergraduate | 30 | 34.5% |
| Graduate / Professional | 0 | 0.0% |
| Total | 87 | 100.0% |
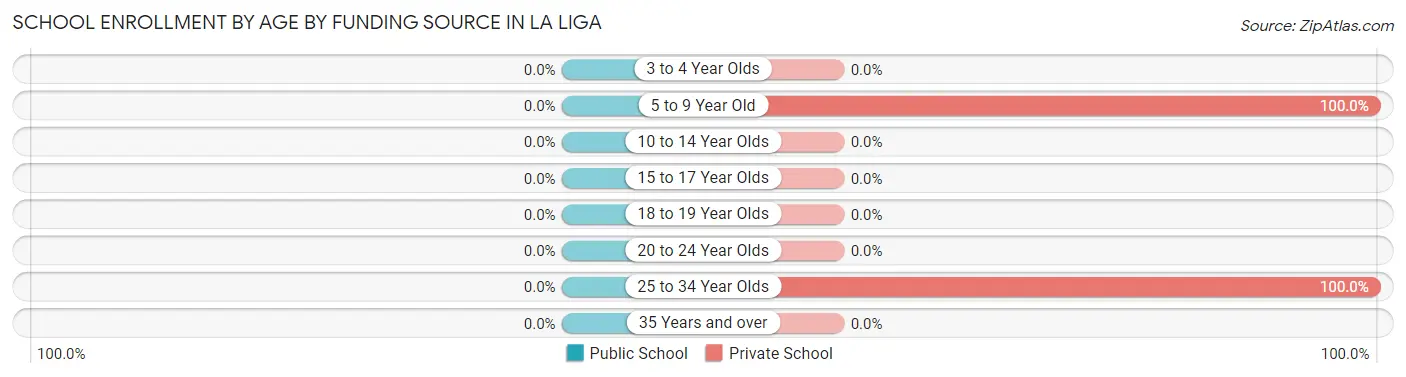
School Enrollment by Age by Funding Source in La Liga
| Age Bracket | Public School | Private School |
| 3 to 4 Year Olds | 0 (0.0%) | 0 (0.0%) |
| 5 to 9 Year Old | 0 (0.0%) | 57 (100.0%) |
| 10 to 14 Year Olds | 0 (0.0%) | 0 (0.0%) |
| 15 to 17 Year Olds | 0 (0.0%) | 0 (0.0%) |
| 18 to 19 Year Olds | 0 (0.0%) | 0 (0.0%) |
| 20 to 24 Year Olds | 0 (0.0%) | 0 (0.0%) |
| 25 to 34 Year Olds | 0 (0.0%) | 30 (100.0%) |
| 35 Years and over | 0 (0.0%) | 0 (0.0%) |
| Total | 0 (0.0%) | 87 (100.0%) |
Educational Attainment by Field of Study in La Liga
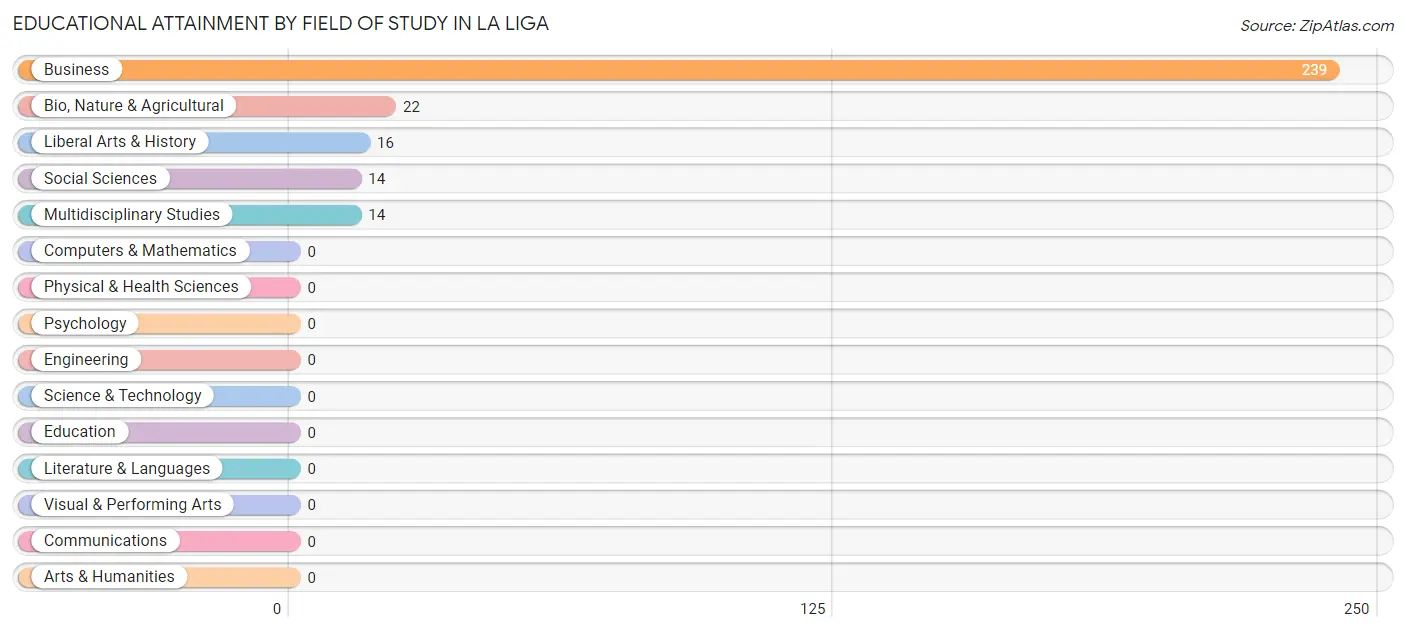
Business (239 | 78.4%), bio, nature & agricultural (22 | 7.2%), liberal arts & history (16 | 5.2%), social sciences (14 | 4.6%), and multidisciplinary studies (14 | 4.6%) are the most common fields of study among 305 individuals in La Liga who have obtained a bachelor's degree or higher.
| Field of Study | # Graduates | % Graduates |
| Computers & Mathematics | 0 | 0.0% |
| Bio, Nature & Agricultural | 22 | 7.2% |
| Physical & Health Sciences | 0 | 0.0% |
| Psychology | 0 | 0.0% |
| Social Sciences | 14 | 4.6% |
| Engineering | 0 | 0.0% |
| Multidisciplinary Studies | 14 | 4.6% |
| Science & Technology | 0 | 0.0% |
| Business | 239 | 78.4% |
| Education | 0 | 0.0% |
| Literature & Languages | 0 | 0.0% |
| Liberal Arts & History | 16 | 5.2% |
| Visual & Performing Arts | 0 | 0.0% |
| Communications | 0 | 0.0% |
| Arts & Humanities | 0 | 0.0% |
| Total | 305 | 100.0% |
Transportation & Commute in La Liga
Vehicle Availability by Sex in La Liga
The most prevalent vehicle ownership categories in La Liga are males with 3 vehicles (66, accounting for 55.9%) and females with 3 vehicles (58, making up 94.3%).
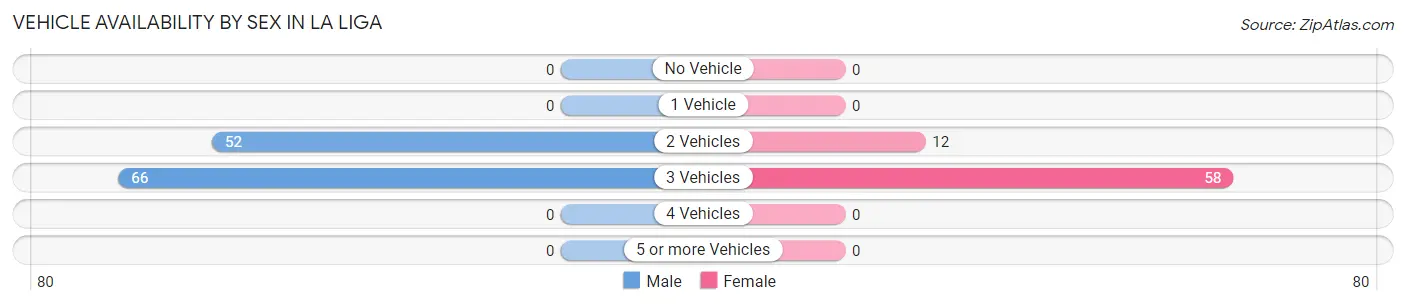
| Vehicles Available | Male | Female |
| No Vehicle | 0 (0.0%) | 0 (0.0%) |
| 1 Vehicle | 0 (0.0%) | 0 (0.0%) |
| 2 Vehicles | 52 (44.1%) | 12 (17.1%) |
| 3 Vehicles | 66 (55.9%) | 58 (82.9%) |
| 4 Vehicles | 0 (0.0%) | 0 (0.0%) |
| 5 or more Vehicles | 0 (0.0%) | 0 (0.0%) |
| Total | 118 (100.0%) | 70 (100.0%) |
Commute Time in La Liga
The most frequently occuring commute durations in La Liga are 30 to 34 minutes (146 commuters, 77.7%), 15 to 19 minutes (16 commuters, 8.5%), and 10 to 14 minutes (14 commuters, 7.4%).
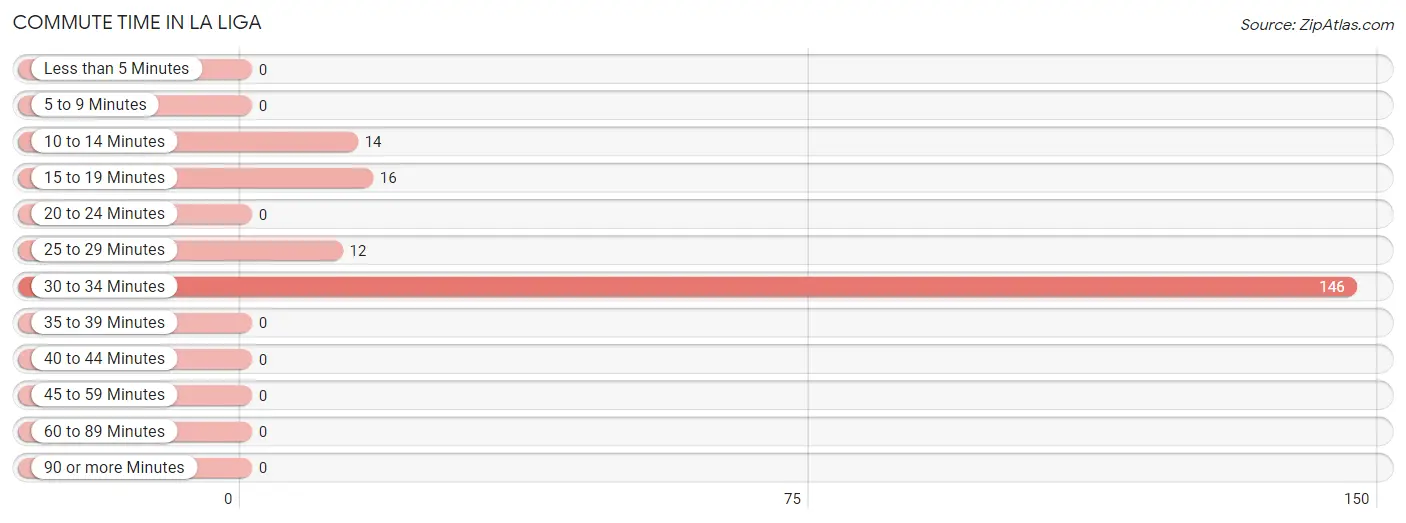
| Commute Time | # Commuters | % Commuters |
| Less than 5 Minutes | 0 | 0.0% |
| 5 to 9 Minutes | 0 | 0.0% |
| 10 to 14 Minutes | 14 | 7.4% |
| 15 to 19 Minutes | 16 | 8.5% |
| 20 to 24 Minutes | 0 | 0.0% |
| 25 to 29 Minutes | 12 | 6.4% |
| 30 to 34 Minutes | 146 | 77.7% |
| 35 to 39 Minutes | 0 | 0.0% |
| 40 to 44 Minutes | 0 | 0.0% |
| 45 to 59 Minutes | 0 | 0.0% |
| 60 to 89 Minutes | 0 | 0.0% |
| 90 or more Minutes | 0 | 0.0% |
Commute Time by Sex in La Liga
The most common commute times in La Liga are 30 to 34 minutes (88 commuters, 74.6%) for males and 30 to 34 minutes (58 commuters, 82.9%) for females.
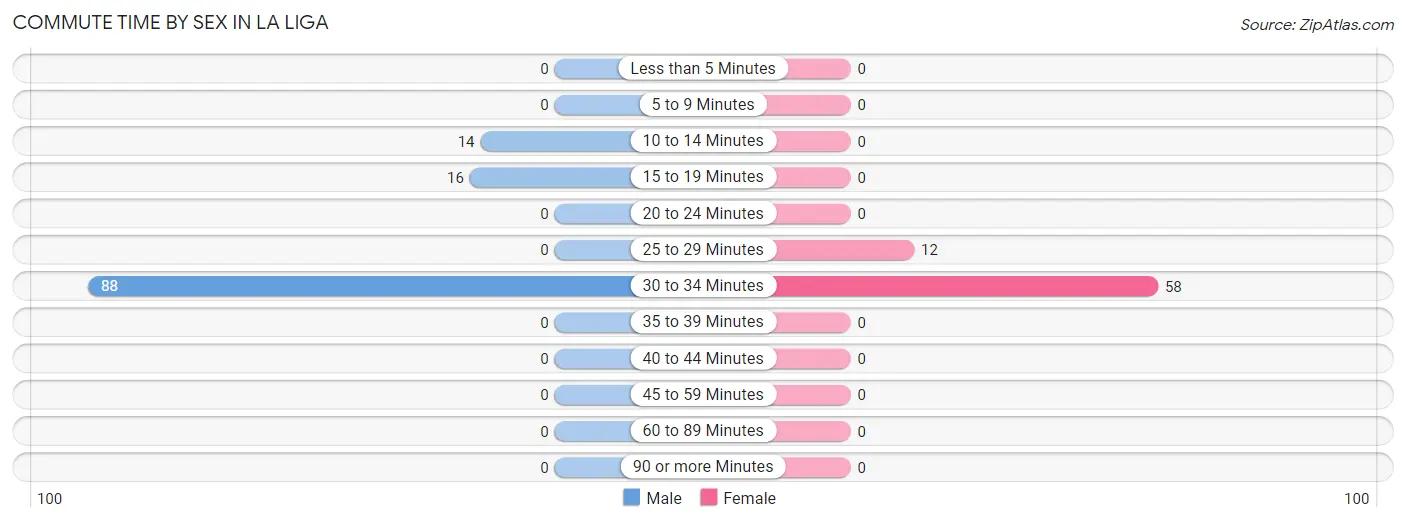
| Commute Time | Male | Female |
| Less than 5 Minutes | 0 (0.0%) | 0 (0.0%) |
| 5 to 9 Minutes | 0 (0.0%) | 0 (0.0%) |
| 10 to 14 Minutes | 14 (11.9%) | 0 (0.0%) |
| 15 to 19 Minutes | 16 (13.6%) | 0 (0.0%) |
| 20 to 24 Minutes | 0 (0.0%) | 0 (0.0%) |
| 25 to 29 Minutes | 0 (0.0%) | 12 (17.1%) |
| 30 to 34 Minutes | 88 (74.6%) | 58 (82.9%) |
| 35 to 39 Minutes | 0 (0.0%) | 0 (0.0%) |
| 40 to 44 Minutes | 0 (0.0%) | 0 (0.0%) |
| 45 to 59 Minutes | 0 (0.0%) | 0 (0.0%) |
| 60 to 89 Minutes | 0 (0.0%) | 0 (0.0%) |
| 90 or more Minutes | 0 (0.0%) | 0 (0.0%) |
Time of Departure to Work by Sex in La Liga
The most frequent times of departure to work in La Liga are 7:00 AM to 7:29 AM (80, 67.8%) for males and 7:00 AM to 7:29 AM (58, 82.9%) for females.
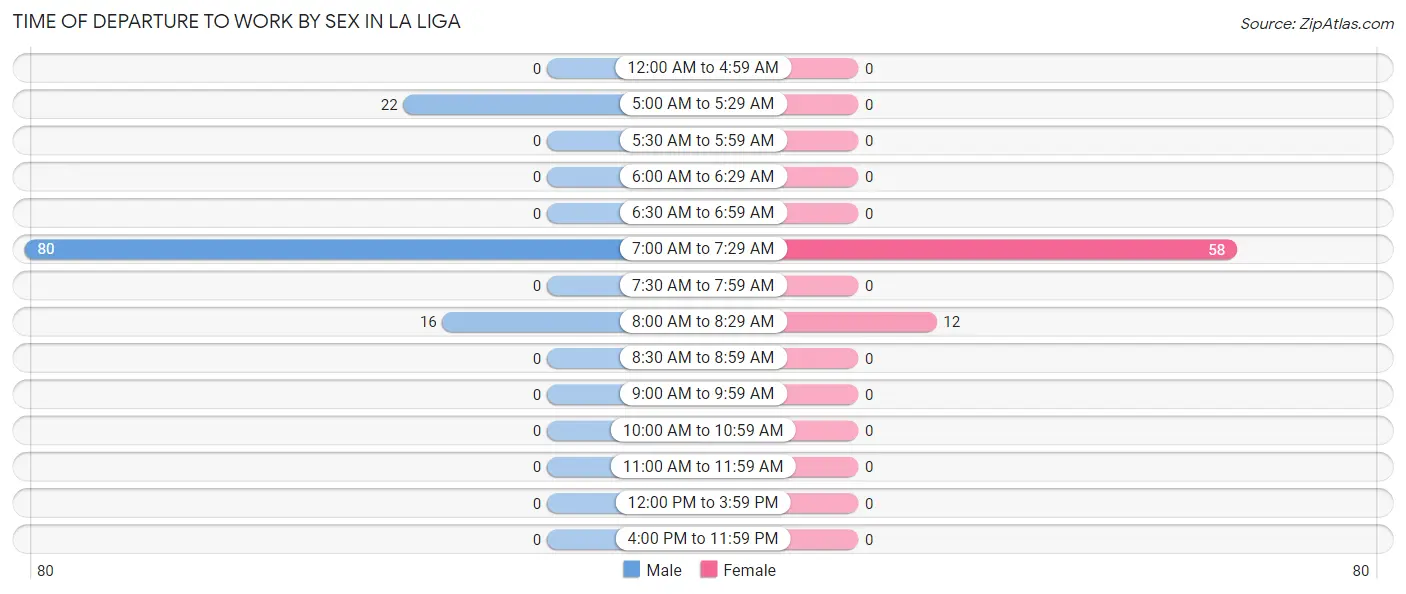
| Time of Departure | Male | Female |
| 12:00 AM to 4:59 AM | 0 (0.0%) | 0 (0.0%) |
| 5:00 AM to 5:29 AM | 22 (18.6%) | 0 (0.0%) |
| 5:30 AM to 5:59 AM | 0 (0.0%) | 0 (0.0%) |
| 6:00 AM to 6:29 AM | 0 (0.0%) | 0 (0.0%) |
| 6:30 AM to 6:59 AM | 0 (0.0%) | 0 (0.0%) |
| 7:00 AM to 7:29 AM | 80 (67.8%) | 58 (82.9%) |
| 7:30 AM to 7:59 AM | 0 (0.0%) | 0 (0.0%) |
| 8:00 AM to 8:29 AM | 16 (13.6%) | 12 (17.1%) |
| 8:30 AM to 8:59 AM | 0 (0.0%) | 0 (0.0%) |
| 9:00 AM to 9:59 AM | 0 (0.0%) | 0 (0.0%) |
| 10:00 AM to 10:59 AM | 0 (0.0%) | 0 (0.0%) |
| 11:00 AM to 11:59 AM | 0 (0.0%) | 0 (0.0%) |
| 12:00 PM to 3:59 PM | 0 (0.0%) | 0 (0.0%) |
| 4:00 PM to 11:59 PM | 0 (0.0%) | 0 (0.0%) |
| Total | 118 (100.0%) | 70 (100.0%) |
Housing Occupancy in La Liga
Occupancy by Ownership in La Liga
Of the total 172 dwellings in La Liga, owner-occupied units account for 172 (100.0%), while renter-occupied units make up 0 (0.0%).
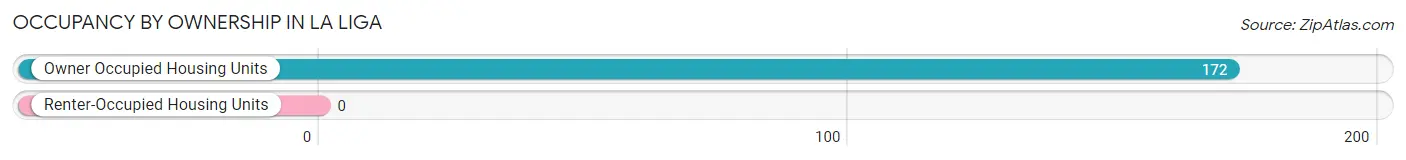
| Occupancy | # Housing Units | % Housing Units |
| Owner Occupied Housing Units | 172 | 100.0% |
| Renter-Occupied Housing Units | 0 | 0.0% |
| Total Occupied Housing Units | 172 | 100.0% |
Occupancy by Household Size in La Liga
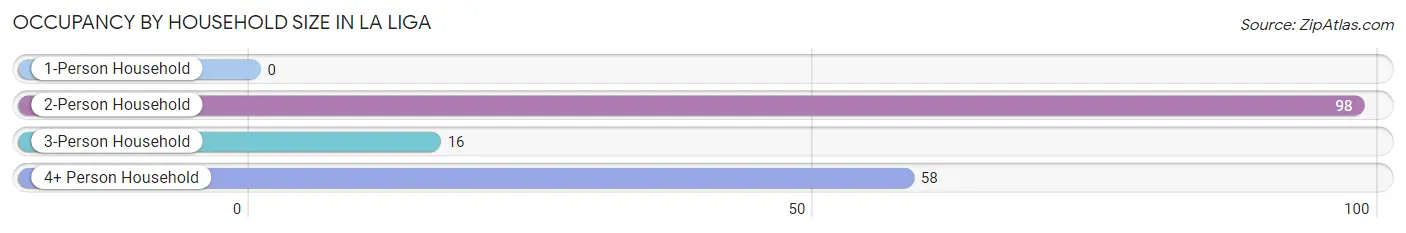
| Household Size | # Housing Units | % Housing Units |
| 1-Person Household | 0 | 0.0% |
| 2-Person Household | 98 | 57.0% |
| 3-Person Household | 16 | 9.3% |
| 4+ Person Household | 58 | 33.7% |
| Total Housing Units | 172 | 100.0% |
Occupancy by Ownership by Household Size in La Liga
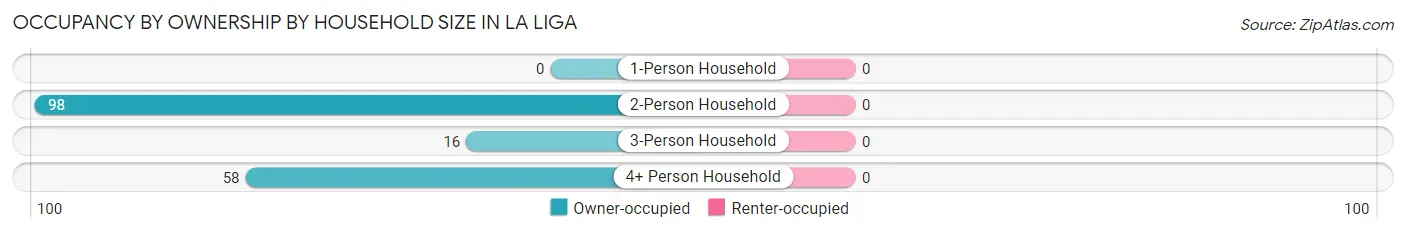
| Household Size | Owner-occupied | Renter-occupied |
| 1-Person Household | 0 (0.0%) | 0 (0.0%) |
| 2-Person Household | 98 (100.0%) | 0 (0.0%) |
| 3-Person Household | 16 (100.0%) | 0 (0.0%) |
| 4+ Person Household | 58 (100.0%) | 0 (0.0%) |
| Total Housing Units | 172 (100.0%) | 0 (0.0%) |
Occupancy by Educational Attainment in La Liga
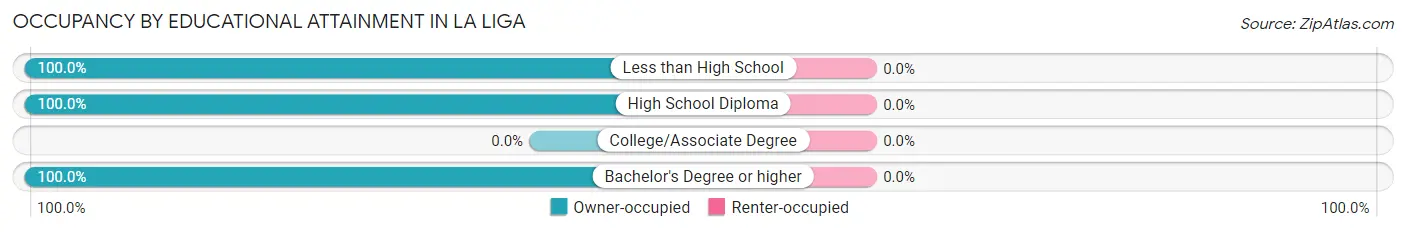
| Household Size | Owner-occupied | Renter-occupied |
| Less than High School | 48 (100.0%) | 0 (0.0%) |
| High School Diploma | 16 (100.0%) | 0 (0.0%) |
| College/Associate Degree | 0 (0.0%) | 0 (0.0%) |
| Bachelor's Degree or higher | 108 (100.0%) | 0 (0.0%) |
Occupancy by Age of Householder in La Liga
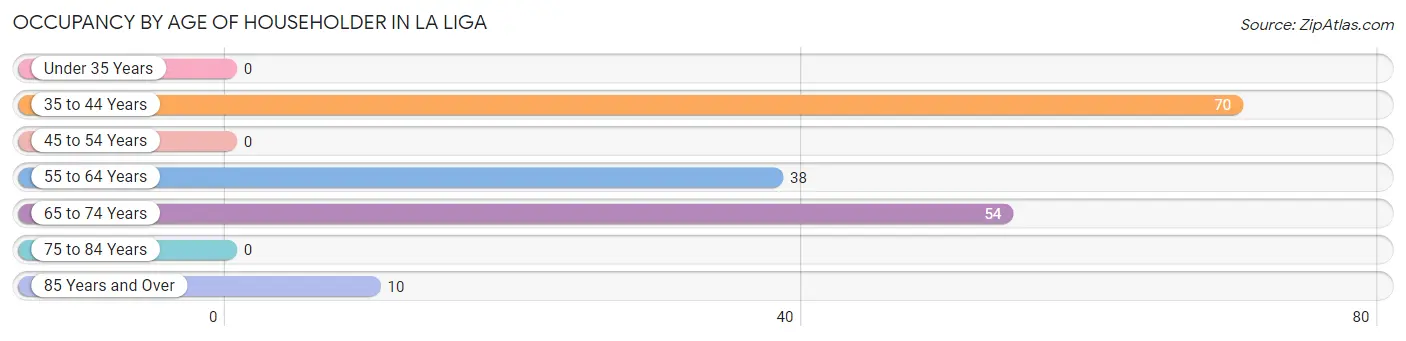
| Age Bracket | # Households | % Households |
| Under 35 Years | 0 | 0.0% |
| 35 to 44 Years | 70 | 40.7% |
| 45 to 54 Years | 0 | 0.0% |
| 55 to 64 Years | 38 | 22.1% |
| 65 to 74 Years | 54 | 31.4% |
| 75 to 84 Years | 0 | 0.0% |
| 85 Years and Over | 10 | 5.8% |
| Total | 172 | 100.0% |
Housing Finances in La Liga
Median Income by Occupancy in La Liga
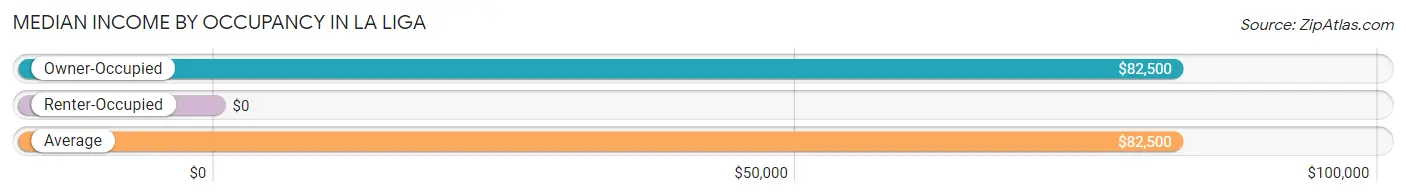
| Occupancy Type | # Households | Median Income |
| Owner-Occupied | 172 (100.0%) | $82,500 |
| Renter-Occupied | 0 (0.0%) | $0 |
| Average | 172 (100.0%) | $82,500 |
Occupancy by Householder Income Bracket in La Liga
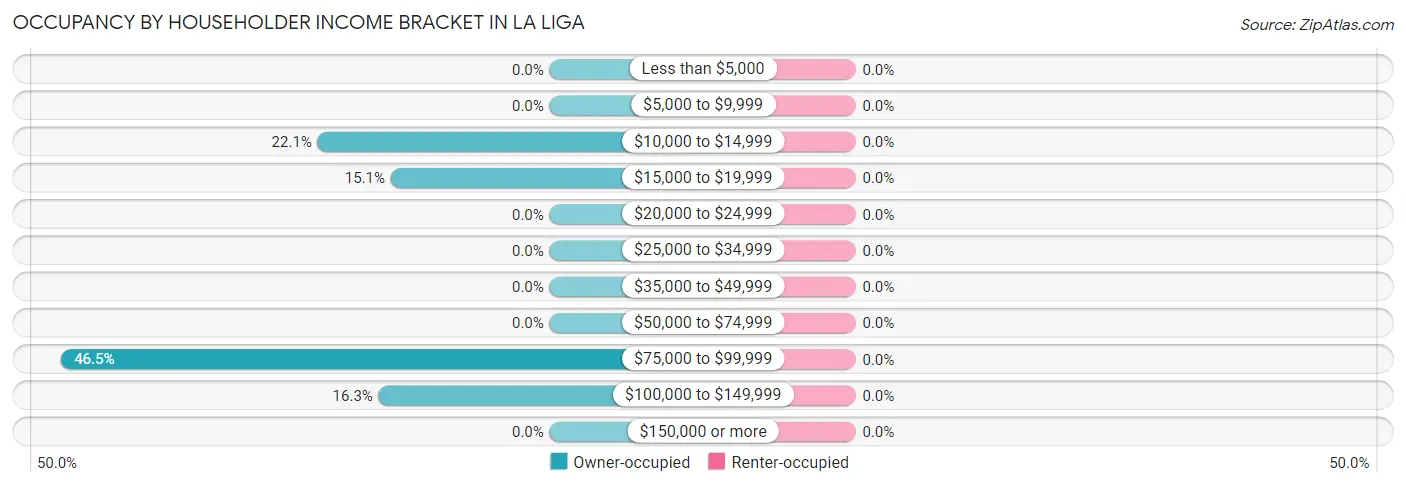
| Income Bracket | Owner-occupied | Renter-occupied |
| Less than $5,000 | 0 (0.0%) | 0 (0.0%) |
| $5,000 to $9,999 | 0 (0.0%) | 0 (0.0%) |
| $10,000 to $14,999 | 38 (22.1%) | 0 (0.0%) |
| $15,000 to $19,999 | 26 (15.1%) | 0 (0.0%) |
| $20,000 to $24,999 | 0 (0.0%) | 0 (0.0%) |
| $25,000 to $34,999 | 0 (0.0%) | 0 (0.0%) |
| $35,000 to $49,999 | 0 (0.0%) | 0 (0.0%) |
| $50,000 to $74,999 | 0 (0.0%) | 0 (0.0%) |
| $75,000 to $99,999 | 80 (46.5%) | 0 (0.0%) |
| $100,000 to $149,999 | 28 (16.3%) | 0 (0.0%) |
| $150,000 or more | 0 (0.0%) | 0 (0.0%) |
| Total | 172 (100.0%) | 0 (0.0%) |
Monthly Housing Cost Tiers in La Liga
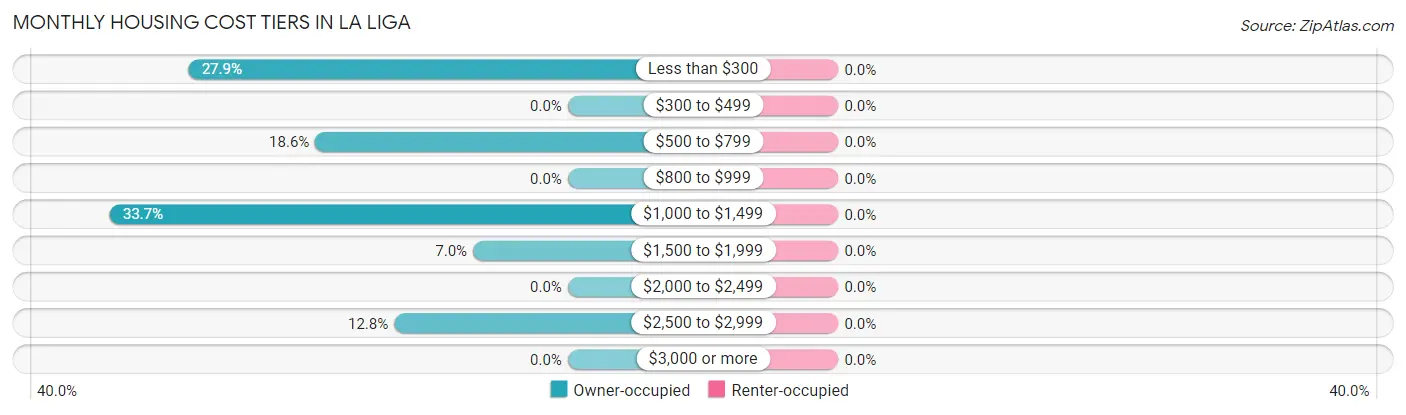
| Monthly Cost | Owner-occupied | Renter-occupied |
| Less than $300 | 48 (27.9%) | 0 (0.0%) |
| $300 to $499 | 0 (0.0%) | 0 (0.0%) |
| $500 to $799 | 32 (18.6%) | 0 (0.0%) |
| $800 to $999 | 0 (0.0%) | 0 (0.0%) |
| $1,000 to $1,499 | 58 (33.7%) | 0 (0.0%) |
| $1,500 to $1,999 | 12 (7.0%) | 0 (0.0%) |
| $2,000 to $2,499 | 0 (0.0%) | 0 (0.0%) |
| $2,500 to $2,999 | 22 (12.8%) | 0 (0.0%) |
| $3,000 or more | 0 (0.0%) | 0 (0.0%) |
| Total | 172 (100.0%) | 0 (0.0%) |
Physical Housing Characteristics in La Liga
Housing Structures in La Liga
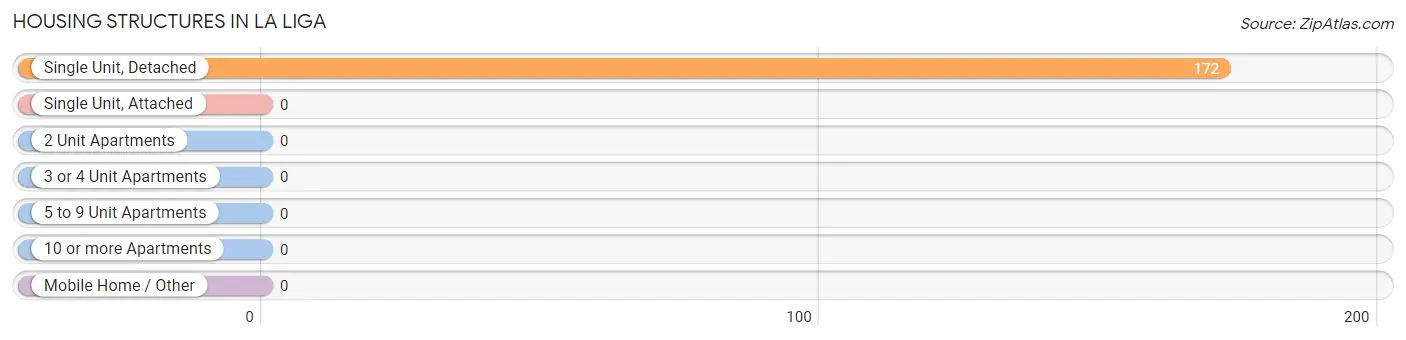
| Structure Type | # Housing Units | % Housing Units |
| Single Unit, Detached | 172 | 100.0% |
| Single Unit, Attached | 0 | 0.0% |
| 2 Unit Apartments | 0 | 0.0% |
| 3 or 4 Unit Apartments | 0 | 0.0% |
| 5 to 9 Unit Apartments | 0 | 0.0% |
| 10 or more Apartments | 0 | 0.0% |
| Mobile Home / Other | 0 | 0.0% |
| Total | 172 | 100.0% |
Housing Structures by Occupancy in La Liga
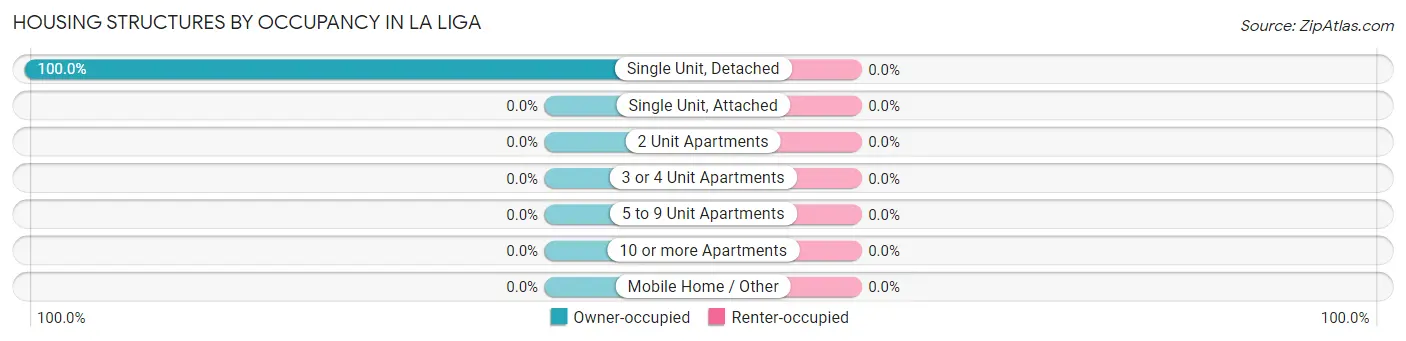
| Structure Type | Owner-occupied | Renter-occupied |
| Single Unit, Detached | 172 (100.0%) | 0 (0.0%) |
| Single Unit, Attached | 0 (0.0%) | 0 (0.0%) |
| 2 Unit Apartments | 0 (0.0%) | 0 (0.0%) |
| 3 or 4 Unit Apartments | 0 (0.0%) | 0 (0.0%) |
| 5 to 9 Unit Apartments | 0 (0.0%) | 0 (0.0%) |
| 10 or more Apartments | 0 (0.0%) | 0 (0.0%) |
| Mobile Home / Other | 0 (0.0%) | 0 (0.0%) |
| Total | 172 (100.0%) | 0 (0.0%) |
Housing Structures by Number of Rooms in La Liga
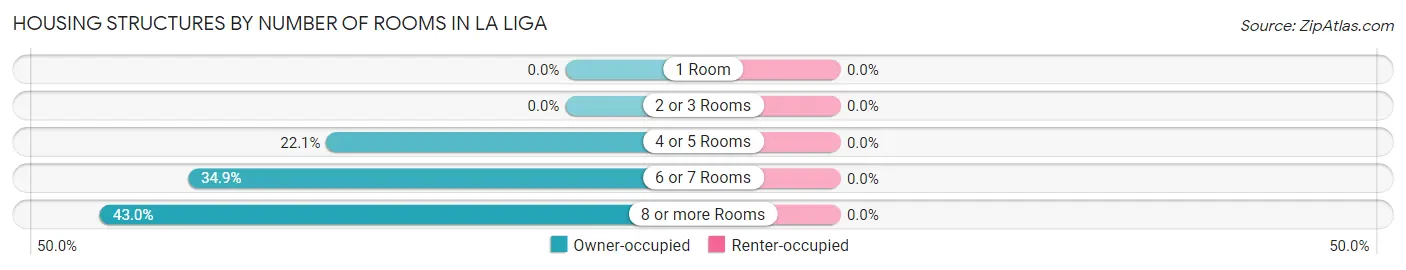
| Number of Rooms | Owner-occupied | Renter-occupied |
| 1 Room | 0 (0.0%) | 0 (0.0%) |
| 2 or 3 Rooms | 0 (0.0%) | 0 (0.0%) |
| 4 or 5 Rooms | 38 (22.1%) | 0 (0.0%) |
| 6 or 7 Rooms | 60 (34.9%) | 0 (0.0%) |
| 8 or more Rooms | 74 (43.0%) | 0 (0.0%) |
| Total | 172 (100.0%) | 0 (0.0%) |
Housing Structure by Heating Type in La Liga
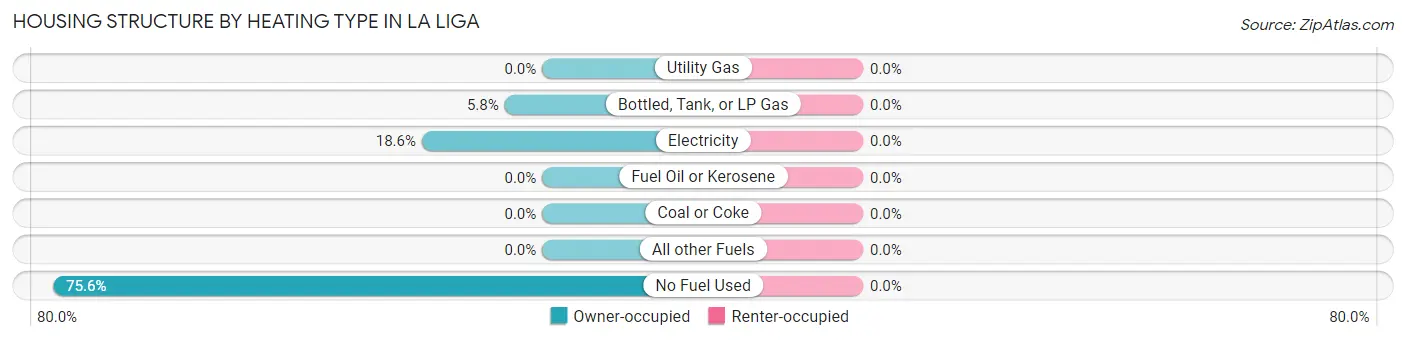
| Heating Type | Owner-occupied | Renter-occupied |
| Utility Gas | 0 (0.0%) | 0 (0.0%) |
| Bottled, Tank, or LP Gas | 10 (5.8%) | 0 (0.0%) |
| Electricity | 32 (18.6%) | 0 (0.0%) |
| Fuel Oil or Kerosene | 0 (0.0%) | 0 (0.0%) |
| Coal or Coke | 0 (0.0%) | 0 (0.0%) |
| All other Fuels | 0 (0.0%) | 0 (0.0%) |
| No Fuel Used | 130 (75.6%) | 0 (0.0%) |
| Total | 172 (100.0%) | 0 (0.0%) |
Household Vehicle Usage in La Liga
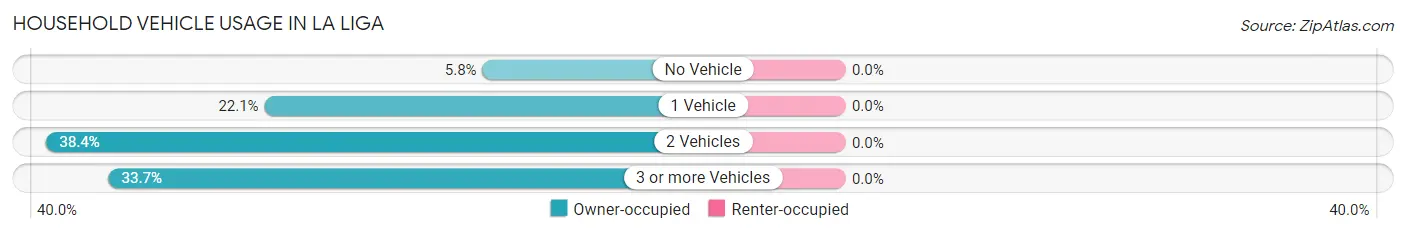
| Vehicles per Household | Owner-occupied | Renter-occupied |
| No Vehicle | 10 (5.8%) | 0 (0.0%) |
| 1 Vehicle | 38 (22.1%) | 0 (0.0%) |
| 2 Vehicles | 66 (38.4%) | 0 (0.0%) |
| 3 or more Vehicles | 58 (33.7%) | 0 (0.0%) |
| Total | 172 (100.0%) | 0 (0.0%) |
Real Estate & Mortgages in La Liga
Real Estate and Mortgage Overview in La Liga
| Characteristic | Without Mortgage | With Mortgage |
| Housing Units | 80 | 92 |
| Median Property Value | $53,700 | $239,700 |
| Median Household Income | $15,313 | $0 |
| Monthly Housing Costs | - | - |
| Real Estate Taxes | - | - |
Property Value by Mortgage Status in La Liga
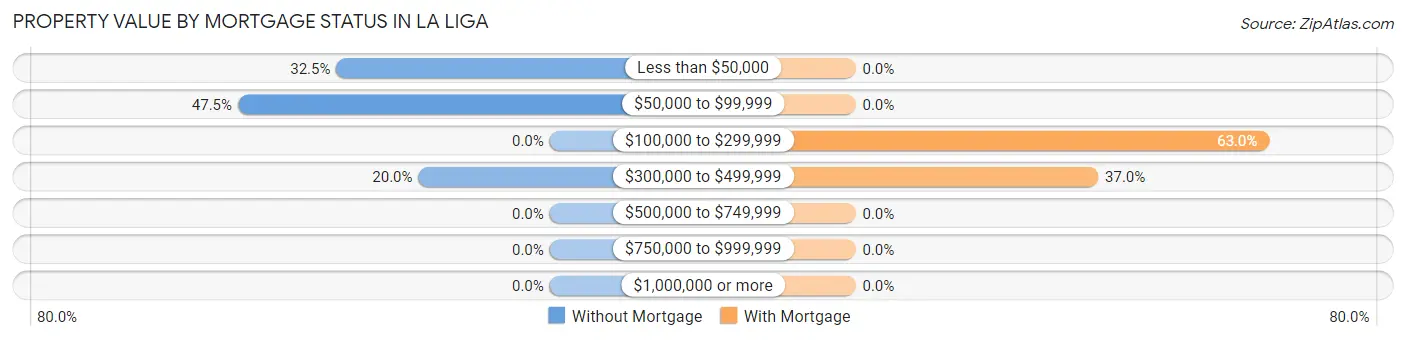
| Property Value | Without Mortgage | With Mortgage |
| Less than $50,000 | 26 (32.5%) | 0 (0.0%) |
| $50,000 to $99,999 | 38 (47.5%) | 0 (0.0%) |
| $100,000 to $299,999 | 0 (0.0%) | 58 (63.0%) |
| $300,000 to $499,999 | 16 (20.0%) | 34 (37.0%) |
| $500,000 to $749,999 | 0 (0.0%) | 0 (0.0%) |
| $750,000 to $999,999 | 0 (0.0%) | 0 (0.0%) |
| $1,000,000 or more | 0 (0.0%) | 0 (0.0%) |
| Total | 80 (100.0%) | 92 (100.0%) |
Household Income by Mortgage Status in La Liga
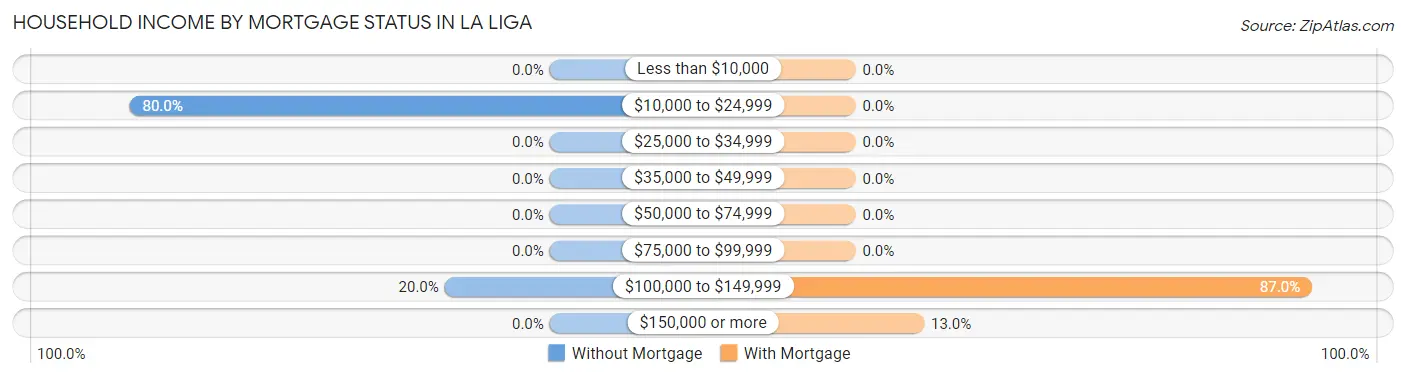
| Household Income | Without Mortgage | With Mortgage |
| Less than $10,000 | 0 (0.0%) | 0 (0.0%) |
| $10,000 to $24,999 | 64 (80.0%) | 0 (0.0%) |
| $25,000 to $34,999 | 0 (0.0%) | 0 (0.0%) |
| $35,000 to $49,999 | 0 (0.0%) | 0 (0.0%) |
| $50,000 to $74,999 | 0 (0.0%) | 0 (0.0%) |
| $75,000 to $99,999 | 0 (0.0%) | 0 (0.0%) |
| $100,000 to $149,999 | 16 (20.0%) | 80 (87.0%) |
| $150,000 or more | 0 (0.0%) | 12 (13.0%) |
| Total | 80 (100.0%) | 92 (100.0%) |
Property Value to Household Income Ratio in La Liga
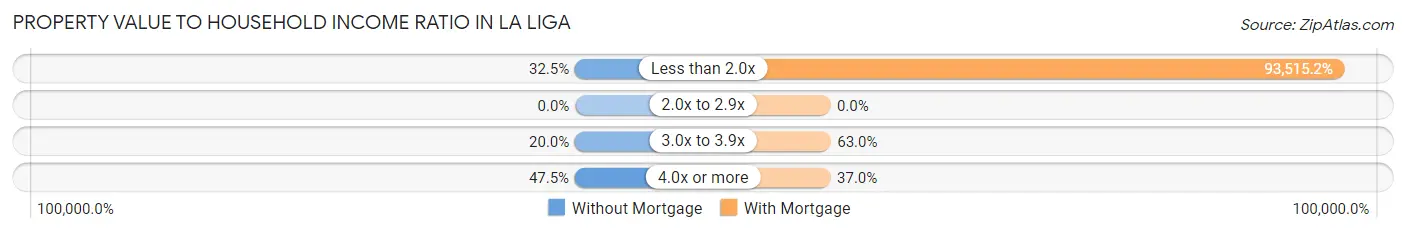
| Value-to-Income Ratio | Without Mortgage | With Mortgage |
| Less than 2.0x | 26 (32.5%) | 86,034 (93,515.2%) |
| 2.0x to 2.9x | 0 (0.0%) | 0 (0.0%) |
| 3.0x to 3.9x | 16 (20.0%) | 58 (63.0%) |
| 4.0x or more | 38 (47.5%) | 34 (37.0%) |
| Total | 80 (100.0%) | 92 (100.0%) |
Real Estate Taxes by Mortgage Status in La Liga
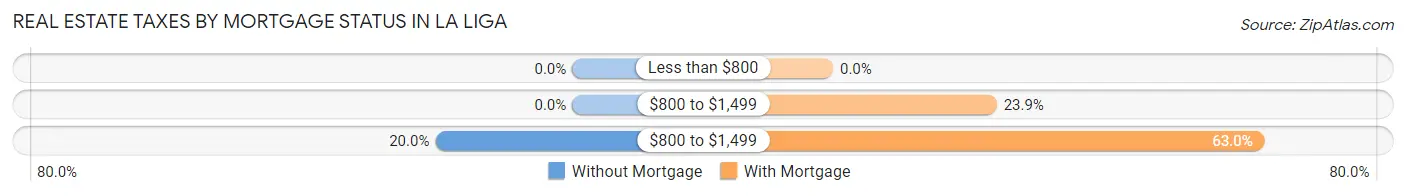
| Property Taxes | Without Mortgage | With Mortgage |
| Less than $800 | 0 (0.0%) | 0 (0.0%) |
| $800 to $1,499 | 0 (0.0%) | 22 (23.9%) |
| $800 to $1,499 | 16 (20.0%) | 58 (63.0%) |
| Total | 80 (100.0%) | 92 (100.0%) |
Health & Disability in La Liga
Health Insurance Coverage by Age in La Liga
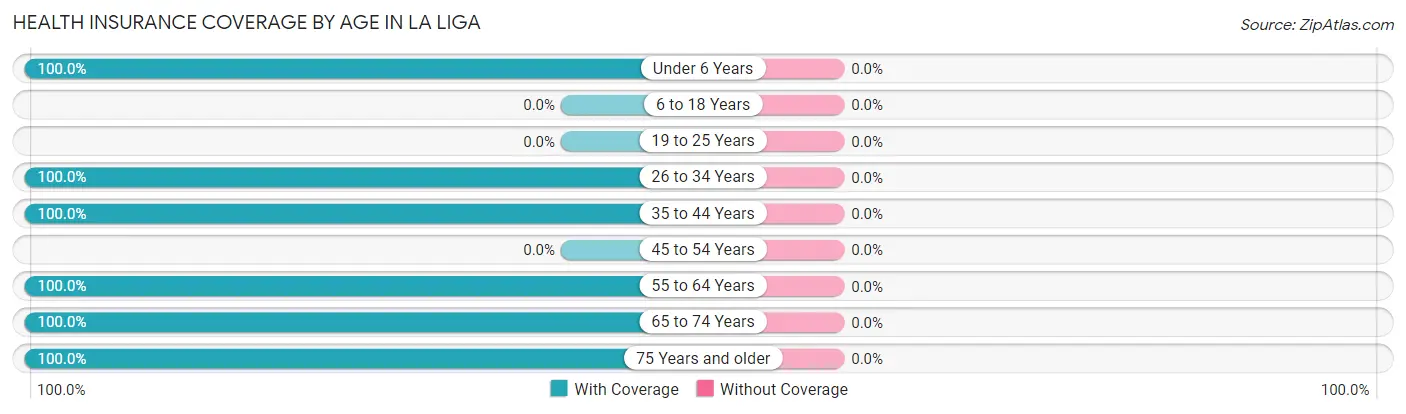
| Age Bracket | With Coverage | Without Coverage |
| Under 6 Years | 126 (100.0%) | 0 (0.0%) |
| 6 to 18 Years | 0 (0.0%) | 0 (0.0%) |
| 19 to 25 Years | 0 (0.0%) | 0 (0.0%) |
| 26 to 34 Years | 30 (100.0%) | 0 (0.0%) |
| 35 to 44 Years | 150 (100.0%) | 0 (0.0%) |
| 45 to 54 Years | 0 (0.0%) | 0 (0.0%) |
| 55 to 64 Years | 141 (100.0%) | 0 (0.0%) |
| 65 to 74 Years | 122 (100.0%) | 0 (0.0%) |
| 75 Years and older | 21 (100.0%) | 0 (0.0%) |
| Total | 590 (100.0%) | 0 (0.0%) |
Health Insurance Coverage by Citizenship Status in La Liga
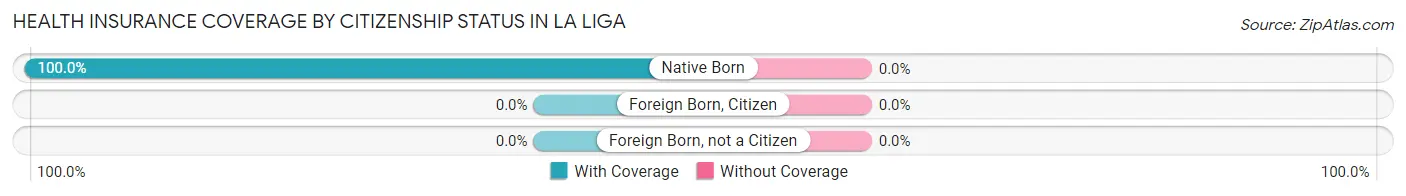
| Citizenship Status | With Coverage | Without Coverage |
| Native Born | 126 (100.0%) | 0 (0.0%) |
| Foreign Born, Citizen | 0 (0.0%) | 0 (0.0%) |
| Foreign Born, not a Citizen | 0 (0.0%) | 0 (0.0%) |
Health Insurance Coverage by Household Income in La Liga
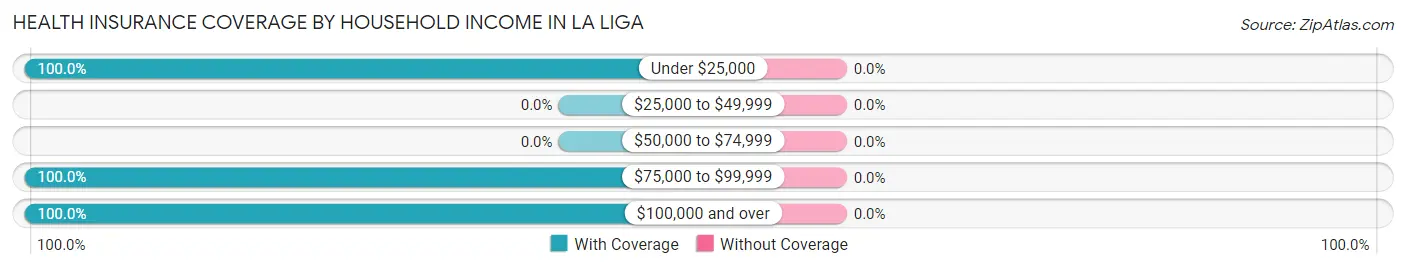
| Household Income | With Coverage | Without Coverage |
| Under $25,000 | 173 (100.0%) | 0 (0.0%) |
| $25,000 to $49,999 | 0 (0.0%) | 0 (0.0%) |
| $50,000 to $74,999 | 0 (0.0%) | 0 (0.0%) |
| $75,000 to $99,999 | 359 (100.0%) | 0 (0.0%) |
| $100,000 and over | 58 (100.0%) | 0 (0.0%) |
Public vs Private Health Insurance Coverage by Age in La Liga
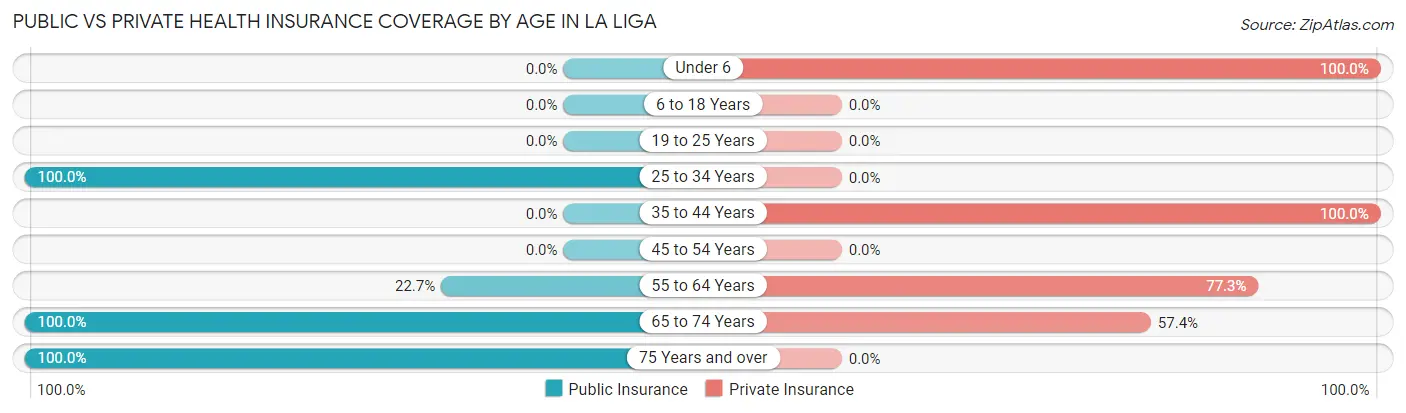
| Age Bracket | Public Insurance | Private Insurance |
| Under 6 | 0 (0.0%) | 126 (100.0%) |
| 6 to 18 Years | 0 (0.0%) | 0 (0.0%) |
| 19 to 25 Years | 0 (0.0%) | 0 (0.0%) |
| 25 to 34 Years | 30 (100.0%) | 0 (0.0%) |
| 35 to 44 Years | 0 (0.0%) | 150 (100.0%) |
| 45 to 54 Years | 0 (0.0%) | 0 (0.0%) |
| 55 to 64 Years | 32 (22.7%) | 109 (77.3%) |
| 65 to 74 Years | 122 (100.0%) | 70 (57.4%) |
| 75 Years and over | 21 (100.0%) | 0 (0.0%) |
| Total | 205 (34.7%) | 455 (77.1%) |
Disability Status by Sex by Age in La Liga
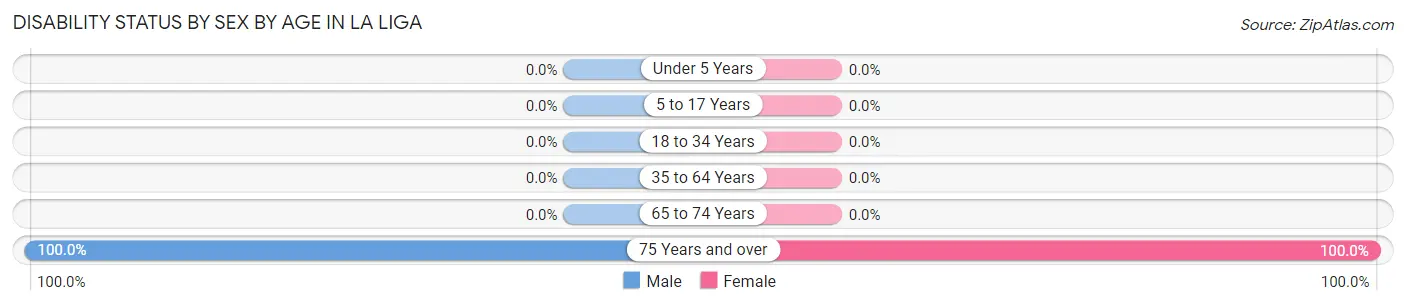
| Age Bracket | Male | Female |
| Under 5 Years | 0 (0.0%) | 0 (0.0%) |
| 5 to 17 Years | 0 (0.0%) | 0 (0.0%) |
| 18 to 34 Years | 0 (0.0%) | 0 (0.0%) |
| 35 to 64 Years | 0 (0.0%) | 0 (0.0%) |
| 65 to 74 Years | 0 (0.0%) | 0 (0.0%) |
| 75 Years and over | 10 (100.0%) | 11 (100.0%) |
Disability Class by Sex by Age in La Liga
Disability Class: Hearing Difficulty
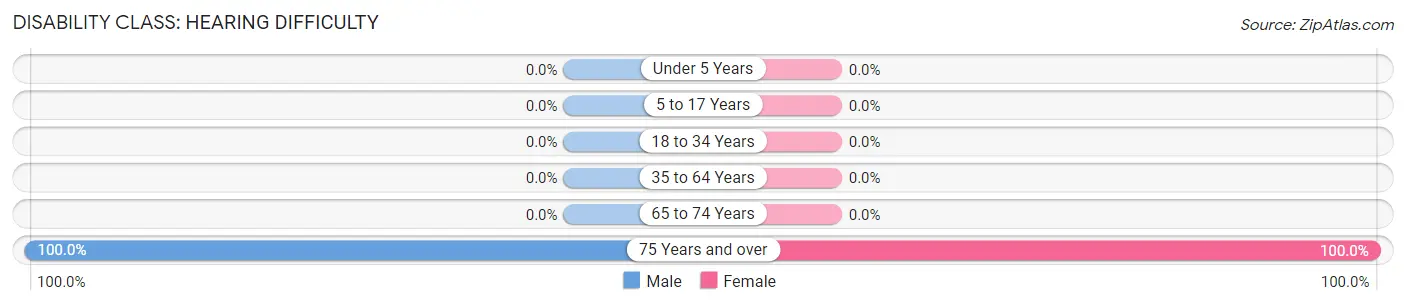
| Age Bracket | Male | Female |
| Under 5 Years | 0 (0.0%) | 0 (0.0%) |
| 5 to 17 Years | 0 (0.0%) | 0 (0.0%) |
| 18 to 34 Years | 0 (0.0%) | 0 (0.0%) |
| 35 to 64 Years | 0 (0.0%) | 0 (0.0%) |
| 65 to 74 Years | 0 (0.0%) | 0 (0.0%) |
| 75 Years and over | 10 (100.0%) | 11 (100.0%) |
Disability Class: Vision Difficulty
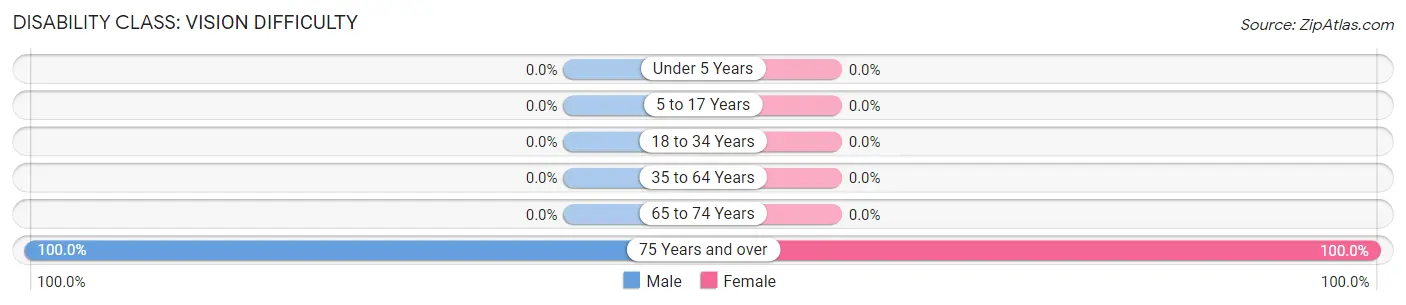
| Age Bracket | Male | Female |
| Under 5 Years | 0 (0.0%) | 0 (0.0%) |
| 5 to 17 Years | 0 (0.0%) | 0 (0.0%) |
| 18 to 34 Years | 0 (0.0%) | 0 (0.0%) |
| 35 to 64 Years | 0 (0.0%) | 0 (0.0%) |
| 65 to 74 Years | 0 (0.0%) | 0 (0.0%) |
| 75 Years and over | 10 (100.0%) | 11 (100.0%) |
Disability Class: Cognitive Difficulty
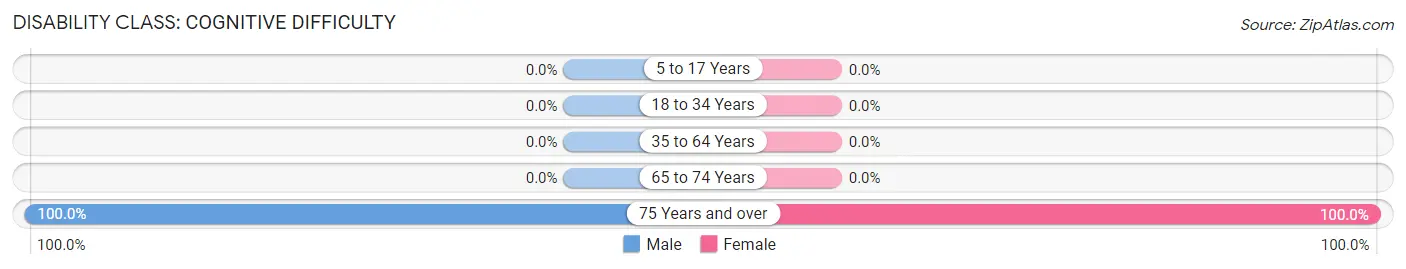
| Age Bracket | Male | Female |
| 5 to 17 Years | 0 (0.0%) | 0 (0.0%) |
| 18 to 34 Years | 0 (0.0%) | 0 (0.0%) |
| 35 to 64 Years | 0 (0.0%) | 0 (0.0%) |
| 65 to 74 Years | 0 (0.0%) | 0 (0.0%) |
| 75 Years and over | 10 (100.0%) | 11 (100.0%) |
Disability Class: Ambulatory Difficulty
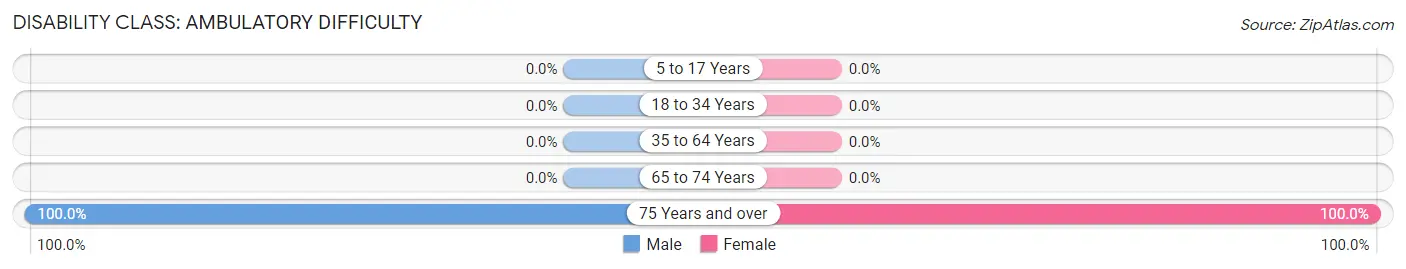
| Age Bracket | Male | Female |
| 5 to 17 Years | 0 (0.0%) | 0 (0.0%) |
| 18 to 34 Years | 0 (0.0%) | 0 (0.0%) |
| 35 to 64 Years | 0 (0.0%) | 0 (0.0%) |
| 65 to 74 Years | 0 (0.0%) | 0 (0.0%) |
| 75 Years and over | 10 (100.0%) | 11 (100.0%) |
Disability Class: Self-Care Difficulty

| Age Bracket | Male | Female |
| 5 to 17 Years | 0 (0.0%) | 0 (0.0%) |
| 18 to 34 Years | 0 (0.0%) | 0 (0.0%) |
| 35 to 64 Years | 0 (0.0%) | 0 (0.0%) |
| 65 to 74 Years | 0 (0.0%) | 0 (0.0%) |
| 75 Years and over | 10 (100.0%) | 0 (0.0%) |
Technology Access in La Liga
Computing Device Access in La Liga
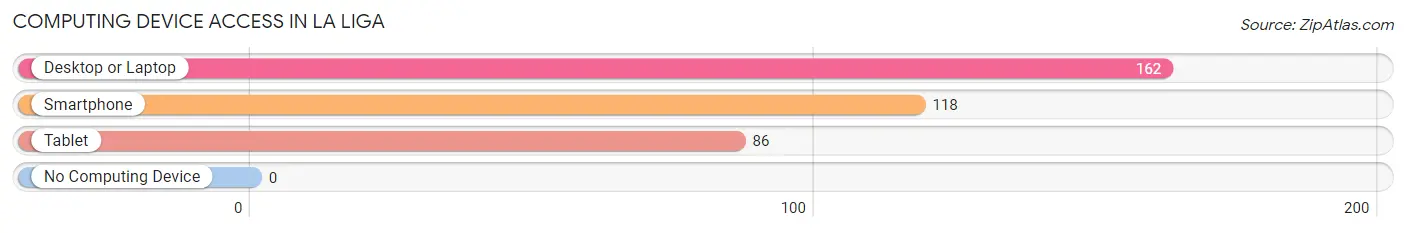
| Device Type | # Households | % Households |
| Desktop or Laptop | 162 | 94.2% |
| Smartphone | 118 | 68.6% |
| Tablet | 86 | 50.0% |
| No Computing Device | 0 | 0.0% |
| Total | 172 | 100.0% |
Internet Access in La Liga
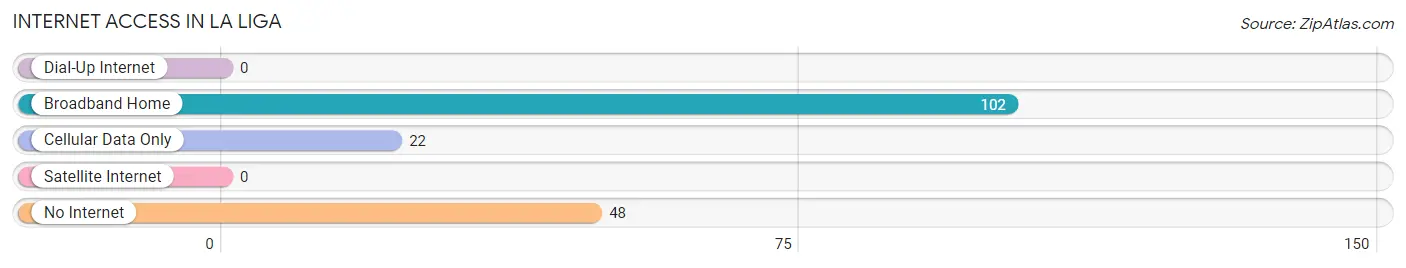
| Internet Type | # Households | % Households |
| Dial-Up Internet | 0 | 0.0% |
| Broadband Home | 102 | 59.3% |
| Cellular Data Only | 22 | 12.8% |
| Satellite Internet | 0 | 0.0% |
| No Internet | 48 | 27.9% |
| Total | 172 | 100.0% |
La Liga Summary
La Liga is the top professional football league in Spain and one of the most popular leagues in the world. It is composed of 20 teams, with the two lowest-ranked teams relegated to the Segunda Division at the end of each season. The league was founded in 1929 and is currently the longest-running professional football league in the world.
The history of La Liga is closely intertwined with the history of Spanish football. The first official football match in Spain was played in 1902, and the first professional league was established in 1928. The first season of La Liga was played in 1929, with 10 teams competing for the title. The league has grown in popularity over the years, and today it is one of the most watched leagues in the world.
The geography of La Liga is largely determined by the location of the teams. Most of the teams are based in the major cities of Spain, such as Madrid, Barcelona, Valencia, and Seville. However, there are also teams located in smaller cities, such as Almeria, Granada, and Malaga. The stadiums of the teams are spread throughout the country, with some of the larger stadiums located in Madrid and Barcelona.
The economy of La Liga is largely dependent on the success of the teams. The teams generate revenue from ticket sales, television rights, and sponsorship deals. The league also receives money from the Spanish government, which is used to fund the development of youth academies and other initiatives.
The demographics of La Liga are largely determined by the location of the teams. Most of the teams are based in the major cities of Spain, which tend to be more affluent and have higher levels of education. However, there are also teams located in smaller cities, which tend to have lower levels of education and income.
Overall, La Liga is one of the most popular and successful football leagues in the world. It has a long and rich history, and its teams are located throughout Spain. The league generates significant revenue from ticket sales, television rights, and sponsorship deals. The demographics of the league are largely determined by the location of the teams, with most of the teams located in the major cities of Spain.
Common Questions
What is Per Capita Income in La Liga?
Per Capita income in La Liga is $20,039.
What is the Median Family Income in La Liga?
Median Family Income in La Liga is $79,886.
What is the Median Household income in La Liga?
Median Household Income in La Liga is $82,500.
What is Income or Wage Gap in La Liga?
Income or Wage Gap in La Liga is 8.3%.
Women in La Liga earn 91.7 cents for every dollar earned by a man.
What is Inequality or Gini Index in La Liga?
Inequality or Gini Index in La Liga is 0.34.
What is the Total Population of La Liga?
Total Population of La Liga is 590.
What is the Total Male Population of La Liga?
Total Male Population of La Liga is 174.
What is the Total Female Population of La Liga?
Total Female Population of La Liga is 416.
What is the Ratio of Males per 100 Females in La Liga?
There are 41.83 Males per 100 Females in La Liga.
What is the Ratio of Females per 100 Males in La Liga?
There are 239.08 Females per 100 Males in La Liga.
What is the Median Population Age in La Liga?
Median Population Age in La Liga is 38.1 Years.
What is the Average Family Size in La Liga
Average Family Size in La Liga is 3.6 People.
What is the Average Household Size in La Liga
Average Household Size in La Liga is 3.4 People.
How Large is the Labor Force in La Liga?
There are 210 People in the Labor Forcein in La Liga.
What is the Percentage of People in the Labor Force in La Liga?
45.3% of People are in the Labor Force in La Liga.
What is the Unemployment Rate in La Liga?
Unemployment Rate in La Liga is 10.5%.