Charlotte, TX Map & Demographics
Charlotte Map
Charlotte Overview
$16,415
PER CAPITA INCOME
$26,939
AVG FAMILY INCOME
$26,352
AVG HOUSEHOLD INCOME
35.7%
WAGE / INCOME GAP [ % ]
64.3¢/ $1
WAGE / INCOME GAP [ $ ]
0.44
INEQUALITY / GINI INDEX
1,324
TOTAL POPULATION
674
MALE POPULATION
650
FEMALE POPULATION
103.69
MALES / 100 FEMALES
96.44
FEMALES / 100 MALES
33.2
MEDIAN AGE
3.3
AVG FAMILY SIZE
2.7
AVG HOUSEHOLD SIZE
559
LABOR FORCE [ PEOPLE ]
53.7%
PERCENT IN LABOR FORCE
6.1%
UNEMPLOYMENT RATE
Charlotte Zip Codes
Charlotte Area Codes
Income in Charlotte
Income Overview in Charlotte
Per Capita Income in Charlotte is $16,415, while median incomes of families and households are $26,939 and $26,352 respectively.
| Characteristic | Number | Measure |
| Per Capita Income | 1,324 | $16,415 |
| Median Family Income | 352 | $26,939 |
| Mean Family Income | 352 | $47,306 |
| Median Household Income | 498 | $26,352 |
| Mean Household Income | 498 | $42,875 |
| Income Deficit | 352 | $0 |
| Wage / Income Gap (%) | 1,324 | 35.70% |
| Wage / Income Gap ($) | 1,324 | 64.30¢ per $1 |
| Gini / Inequality Index | 1,324 | 0.44 |
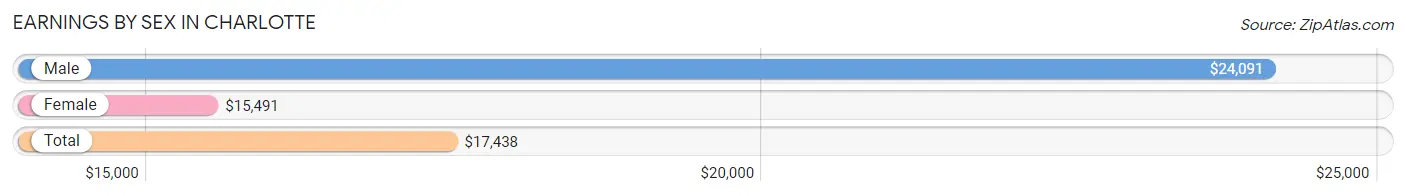
Earnings by Sex in Charlotte
Average Earnings in Charlotte are $17,438, $24,091 for men and $15,491 for women, a difference of 35.7%.
| Sex | Number | Average Earnings |
| Male | 320 (46.9%) | $24,091 |
| Female | 362 (53.1%) | $15,491 |
| Total | 682 (100.0%) | $17,438 |
Earnings by Sex by Income Bracket in Charlotte
The most common earnings brackets in Charlotte are $2,499 or less for men (55 | 17.2%) and $2,499 or less for women (102 | 28.2%).
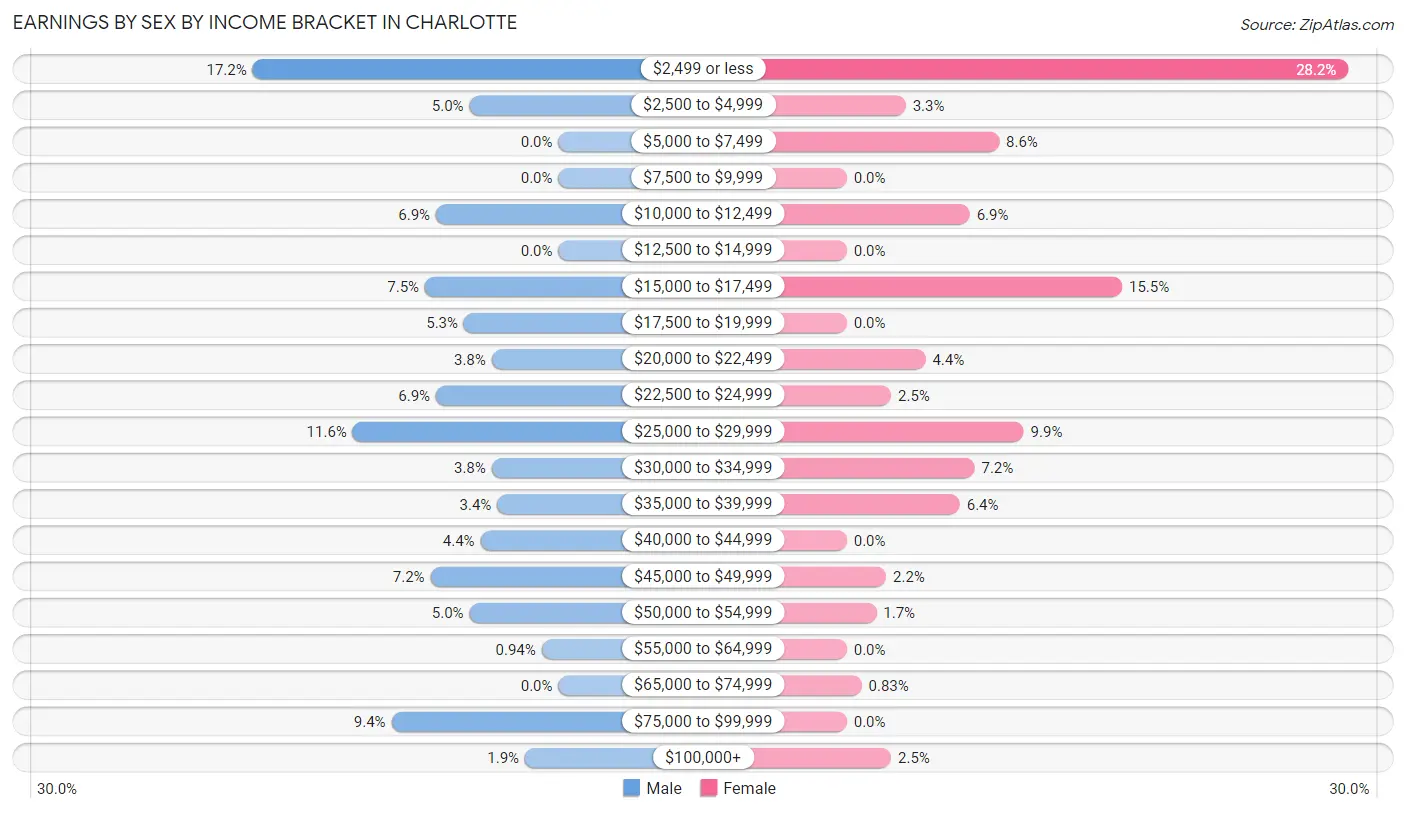
| Income | Male | Female |
| $2,499 or less | 55 (17.2%) | 102 (28.2%) |
| $2,500 to $4,999 | 16 (5.0%) | 12 (3.3%) |
| $5,000 to $7,499 | 0 (0.0%) | 31 (8.6%) |
| $7,500 to $9,999 | 0 (0.0%) | 0 (0.0%) |
| $10,000 to $12,499 | 22 (6.9%) | 25 (6.9%) |
| $12,500 to $14,999 | 0 (0.0%) | 0 (0.0%) |
| $15,000 to $17,499 | 24 (7.5%) | 56 (15.5%) |
| $17,500 to $19,999 | 17 (5.3%) | 0 (0.0%) |
| $20,000 to $22,499 | 12 (3.7%) | 16 (4.4%) |
| $22,500 to $24,999 | 22 (6.9%) | 9 (2.5%) |
| $25,000 to $29,999 | 37 (11.6%) | 36 (9.9%) |
| $30,000 to $34,999 | 12 (3.7%) | 26 (7.2%) |
| $35,000 to $39,999 | 11 (3.4%) | 23 (6.4%) |
| $40,000 to $44,999 | 14 (4.4%) | 0 (0.0%) |
| $45,000 to $49,999 | 23 (7.2%) | 8 (2.2%) |
| $50,000 to $54,999 | 16 (5.0%) | 6 (1.7%) |
| $55,000 to $64,999 | 3 (0.9%) | 0 (0.0%) |
| $65,000 to $74,999 | 0 (0.0%) | 3 (0.8%) |
| $75,000 to $99,999 | 30 (9.4%) | 0 (0.0%) |
| $100,000+ | 6 (1.9%) | 9 (2.5%) |
| Total | 320 (100.0%) | 362 (100.0%) |
Earnings by Sex by Educational Attainment in Charlotte
Average earnings in Charlotte are $37,614 for men and $15,174 for women, a difference of 59.7%. Men with an educational attainment of high school diploma enjoy the highest average annual earnings of $42,321, while those with less than high school education earn the least with $25,395. Women with an educational attainment of high school diploma earn the most with the average annual earnings of $21,667, while those with college or associate's degree education have the smallest earnings of $2,499.
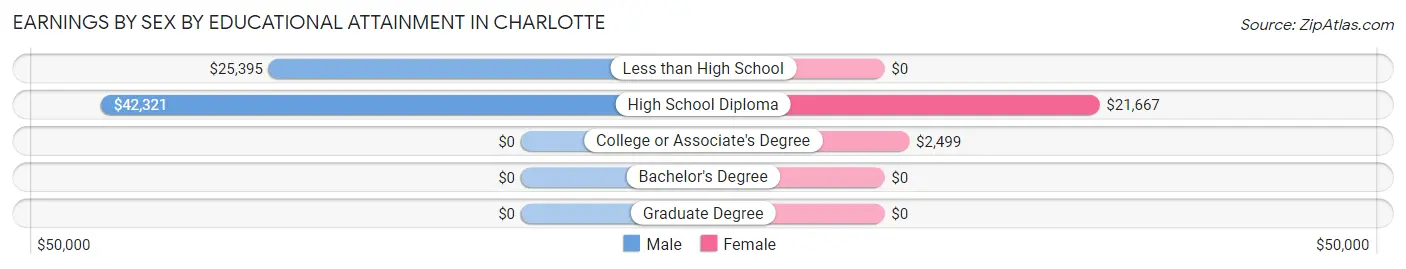
| Educational Attainment | Male Income | Female Income |
| Less than High School | $25,395 | $0 |
| High School Diploma | $42,321 | $21,667 |
| College or Associate's Degree | - | - |
| Bachelor's Degree | - | - |
| Graduate Degree | - | - |
| Total | $37,614 | $15,174 |
Family Income in Charlotte
Family Income Brackets in Charlotte
According to the Charlotte family income data, there are 105 families falling into the $15,000 to $24,999 income range, which is the most common income bracket and makes up 29.8% of all families. Conversely, the $150,000 to $199,999 income bracket is the least frequent group with only 6 families (1.7%) belonging to this category.
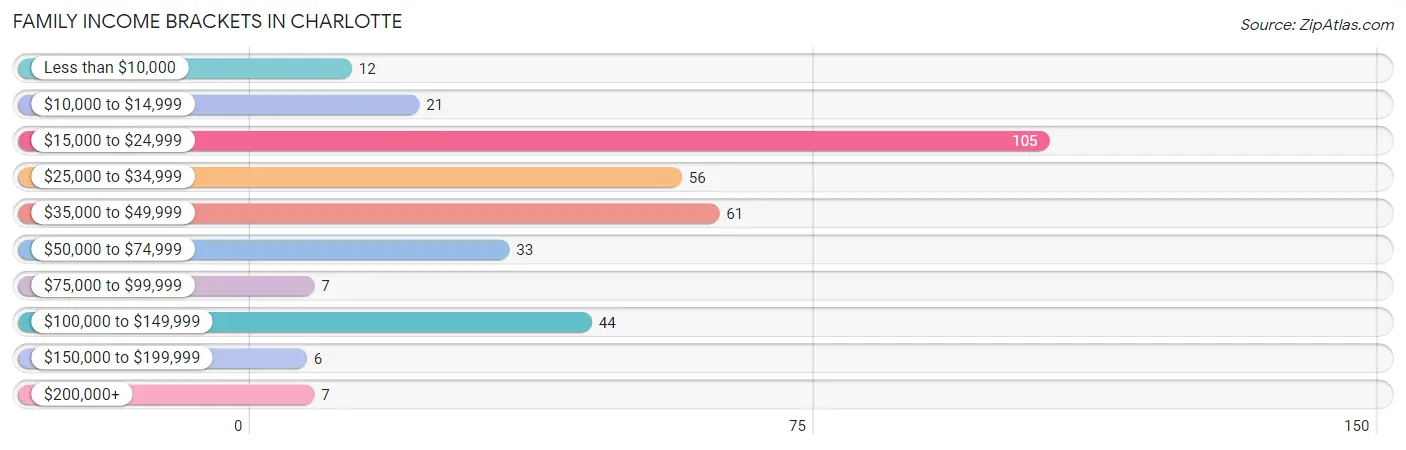
| Income Bracket | # Families | % Families |
| Less than $10,000 | 12 | 3.4% |
| $10,000 to $14,999 | 21 | 6.0% |
| $15,000 to $24,999 | 105 | 29.8% |
| $25,000 to $34,999 | 56 | 15.9% |
| $35,000 to $49,999 | 61 | 17.3% |
| $50,000 to $74,999 | 33 | 9.4% |
| $75,000 to $99,999 | 7 | 2.0% |
| $100,000 to $149,999 | 44 | 12.5% |
| $150,000 to $199,999 | 6 | 1.7% |
| $200,000+ | 7 | 2.0% |
Family Income by Famaliy Size in Charlotte
5-person families (28 | 8.0%) account for the highest median family income in Charlotte with $52,500 per family, while 2-person families (111 | 31.5%) have the highest median income of $18,946 per family member.
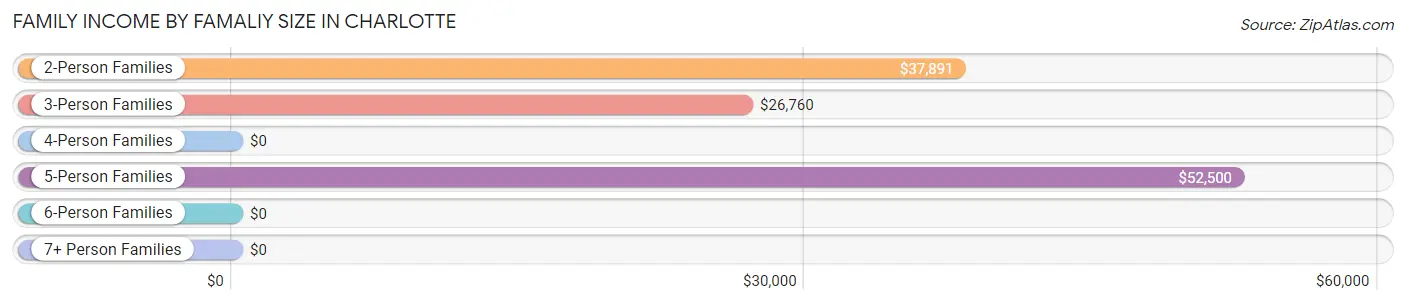
| Income Bracket | # Families | Median Income |
| 2-Person Families | 111 (31.5%) | $37,891 |
| 3-Person Families | 103 (29.3%) | $26,760 |
| 4-Person Families | 57 (16.2%) | $0 |
| 5-Person Families | 28 (8.0%) | $52,500 |
| 6-Person Families | 53 (15.1%) | $0 |
| 7+ Person Families | 0 (0.0%) | $0 |
| Total | 352 (100.0%) | $26,939 |
Family Income by Number of Earners in Charlotte
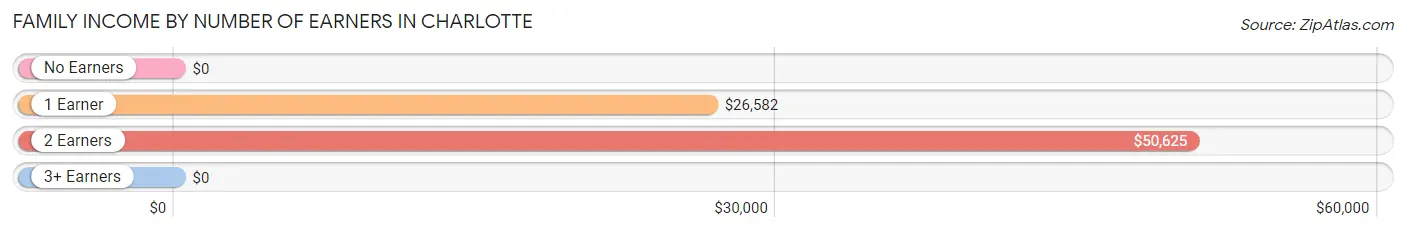
| Number of Earners | # Families | Median Income |
| No Earners | 26 (7.4%) | $0 |
| 1 Earner | 146 (41.5%) | $26,582 |
| 2 Earners | 109 (31.0%) | $50,625 |
| 3+ Earners | 71 (20.2%) | $0 |
| Total | 352 (100.0%) | $26,939 |
Household Income in Charlotte
Household Income Brackets in Charlotte
With 166 households falling in the category, the $15,000 to $24,999 income range is the most frequent in Charlotte, accounting for 33.3% of all households. In contrast, only 6 households (1.2%) fall into the $150,000 to $199,999 income bracket, making it the least populous group.
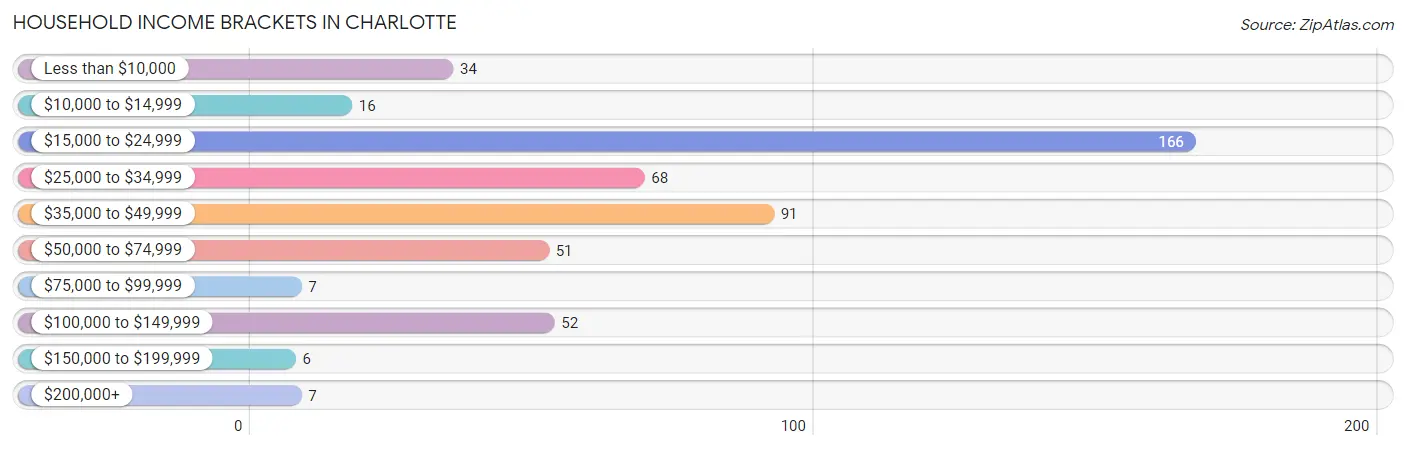
| Income Bracket | # Households | % Households |
| Less than $10,000 | 34 | 6.8% |
| $10,000 to $14,999 | 16 | 3.2% |
| $15,000 to $24,999 | 166 | 33.3% |
| $25,000 to $34,999 | 68 | 13.7% |
| $35,000 to $49,999 | 91 | 18.3% |
| $50,000 to $74,999 | 51 | 10.2% |
| $75,000 to $99,999 | 7 | 1.4% |
| $100,000 to $149,999 | 52 | 10.4% |
| $150,000 to $199,999 | 6 | 1.2% |
| $200,000+ | 7 | 1.4% |
Household Income by Householder Age in Charlotte
The median household income in Charlotte is $26,352, with the highest median household income of $40,365 found in the 45 to 64 years age bracket for the primary householder. A total of 183 households (36.7%) fall into this category.
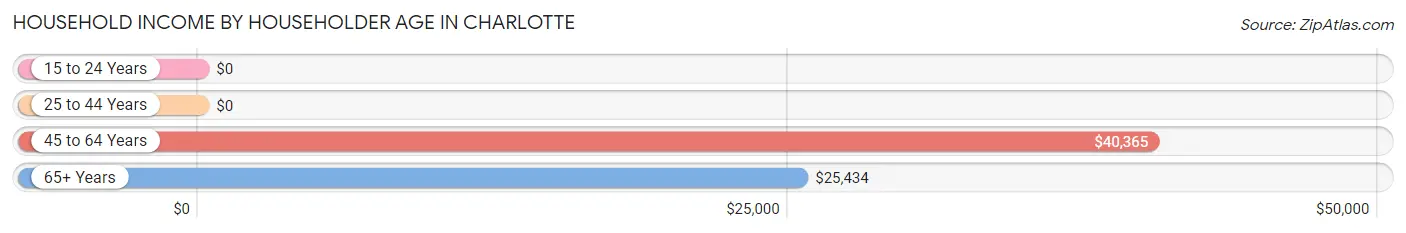
| Income Bracket | # Households | Median Income |
| 15 to 24 Years | 0 (0.0%) | $0 |
| 25 to 44 Years | 150 (30.1%) | $0 |
| 45 to 64 Years | 183 (36.7%) | $40,365 |
| 65+ Years | 165 (33.1%) | $25,434 |
| Total | 498 (100.0%) | $26,352 |
Poverty in Charlotte
Income Below Poverty by Sex and Age in Charlotte
With 36.5% poverty level for males and 41.2% for females among the residents of Charlotte, 16 and 17 year old males and 12 to 14 year old females are the most vulnerable to poverty, with 52 males (83.9%) and 19 females (100.0%) in their respective age groups living below the poverty level.
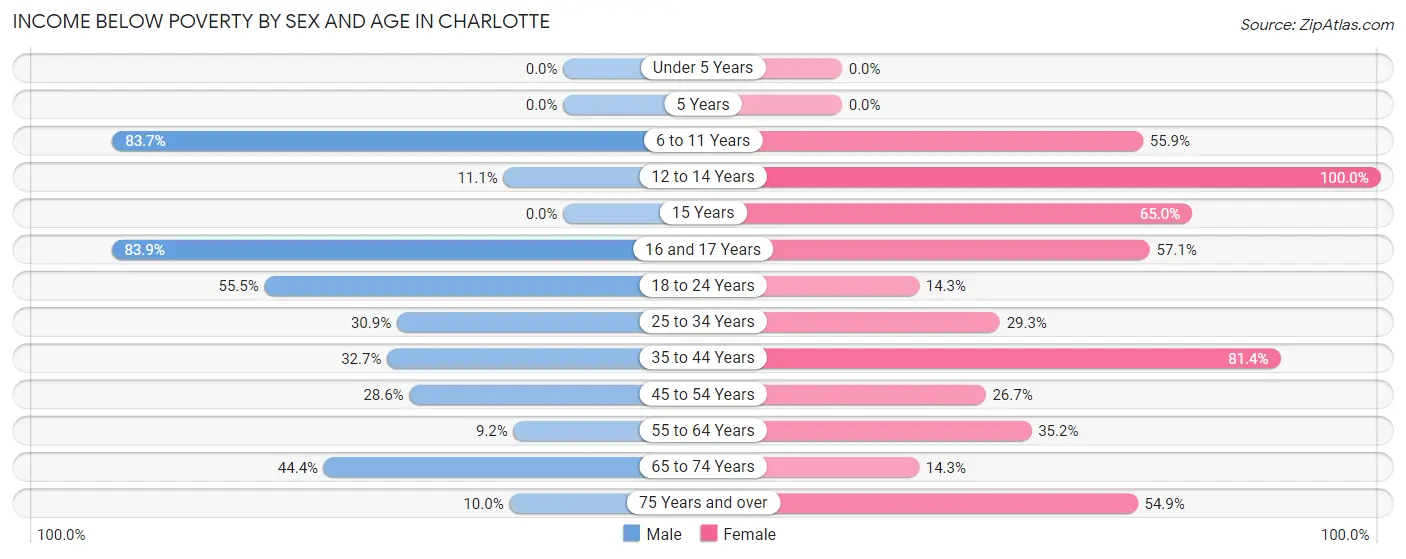
| Age Bracket | Male | Female |
| Under 5 Years | 0 (0.0%) | 0 (0.0%) |
| 5 Years | 0 (0.0%) | 0 (0.0%) |
| 6 to 11 Years | 36 (83.7%) | 19 (55.9%) |
| 12 to 14 Years | 8 (11.1%) | 19 (100.0%) |
| 15 Years | 0 (0.0%) | 26 (65.0%) |
| 16 and 17 Years | 52 (83.9%) | 16 (57.1%) |
| 18 to 24 Years | 71 (55.5%) | 9 (14.3%) |
| 25 to 34 Years | 21 (30.9%) | 17 (29.3%) |
| 35 to 44 Years | 17 (32.7%) | 70 (81.4%) |
| 45 to 54 Years | 10 (28.6%) | 20 (26.7%) |
| 55 to 64 Years | 6 (9.2%) | 32 (35.2%) |
| 65 to 74 Years | 20 (44.4%) | 12 (14.3%) |
| 75 Years and over | 5 (10.0%) | 28 (54.9%) |
| Total | 246 (36.5%) | 268 (41.2%) |
Income Above Poverty by Sex and Age in Charlotte
According to the poverty statistics in Charlotte, males aged under 5 years and females aged under 5 years are the age groups that are most secure financially, with 100.0% of males and 100.0% of females in these age groups living above the poverty line.
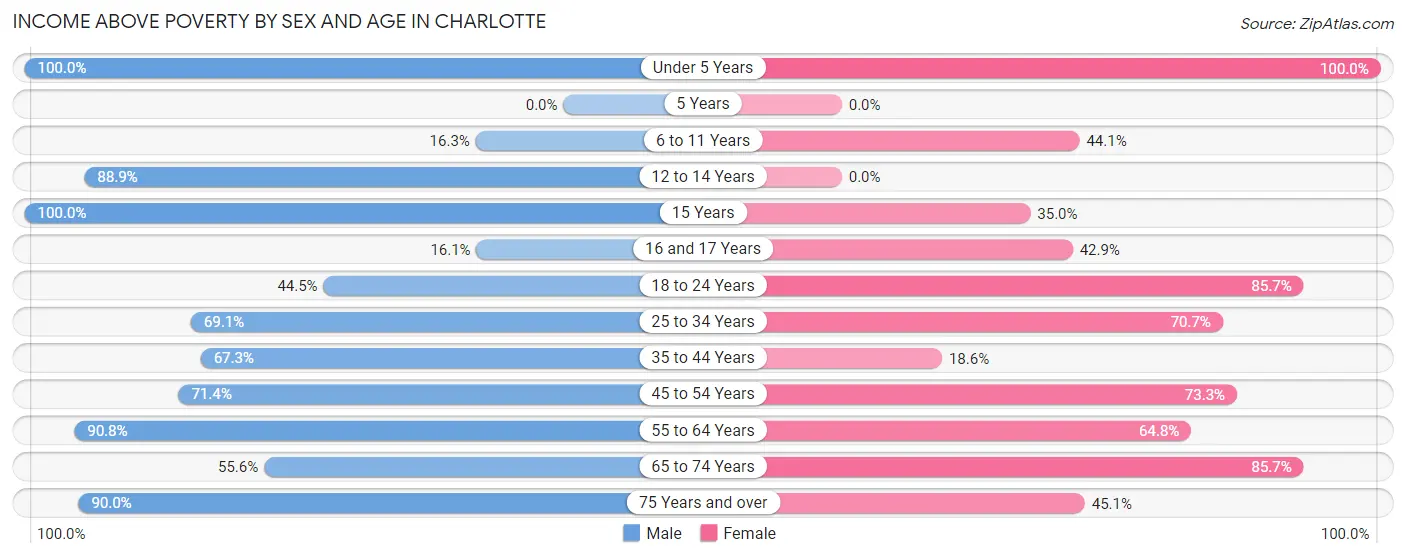
| Age Bracket | Male | Female |
| Under 5 Years | 10 (100.0%) | 21 (100.0%) |
| 5 Years | 0 (0.0%) | 0 (0.0%) |
| 6 to 11 Years | 7 (16.3%) | 15 (44.1%) |
| 12 to 14 Years | 64 (88.9%) | 0 (0.0%) |
| 15 Years | 44 (100.0%) | 14 (35.0%) |
| 16 and 17 Years | 10 (16.1%) | 12 (42.9%) |
| 18 to 24 Years | 57 (44.5%) | 54 (85.7%) |
| 25 to 34 Years | 47 (69.1%) | 41 (70.7%) |
| 35 to 44 Years | 35 (67.3%) | 16 (18.6%) |
| 45 to 54 Years | 25 (71.4%) | 55 (73.3%) |
| 55 to 64 Years | 59 (90.8%) | 59 (64.8%) |
| 65 to 74 Years | 25 (55.6%) | 72 (85.7%) |
| 75 Years and over | 45 (90.0%) | 23 (45.1%) |
| Total | 428 (63.5%) | 382 (58.8%) |
Income Below Poverty Among Married-Couple Families in Charlotte
The poverty statistics for married-couple families in Charlotte show that 39.3% or 95 of the total 242 families live below the poverty line. Families with 3 or 4 children have the highest poverty rate of 74.7%, comprising of 53 families. On the other hand, families with 1 or 2 children have the lowest poverty rate of 19.5%, which includes 15 families.
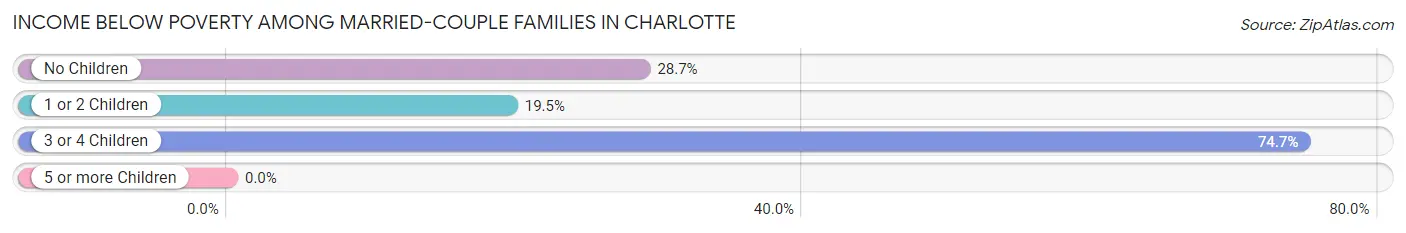
| Children | Above Poverty | Below Poverty |
| No Children | 67 (71.3%) | 27 (28.7%) |
| 1 or 2 Children | 62 (80.5%) | 15 (19.5%) |
| 3 or 4 Children | 18 (25.4%) | 53 (74.7%) |
| 5 or more Children | 0 (0.0%) | 0 (0.0%) |
| Total | 147 (60.7%) | 95 (39.3%) |
Income Below Poverty Among Single-Parent Households in Charlotte
According to the poverty data in Charlotte, 56.8% or 21 single-father households and 39.7% or 29 single-mother households are living below the poverty line. Among single-father households, those with 3 or 4 children have the highest poverty rate, with 21 households (100.0%) experiencing poverty. Likewise, among single-mother households, those with 1 or 2 children have the highest poverty rate, with 29 households (74.4%) falling below the poverty line.
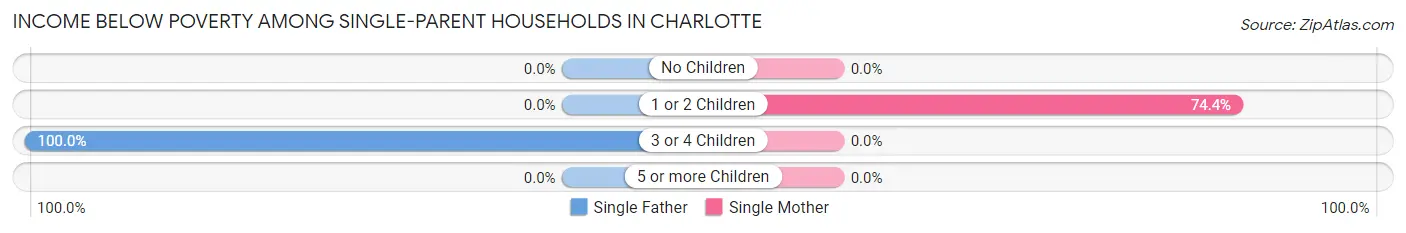
| Children | Single Father | Single Mother |
| No Children | 0 (0.0%) | 0 (0.0%) |
| 1 or 2 Children | 0 (0.0%) | 29 (74.4%) |
| 3 or 4 Children | 21 (100.0%) | 0 (0.0%) |
| 5 or more Children | 0 (0.0%) | 0 (0.0%) |
| Total | 21 (56.8%) | 29 (39.7%) |
Income Below Poverty Among Married-Couple vs Single-Parent Households in Charlotte
The poverty data for Charlotte shows that 95 of the married-couple family households (39.3%) and 50 of the single-parent households (45.5%) are living below the poverty level. Within the married-couple family households, those with 3 or 4 children have the highest poverty rate, with 53 households (74.7%) falling below the poverty line. Among the single-parent households, those with 3 or 4 children have the highest poverty rate, with 21 household (100.0%) living below poverty.
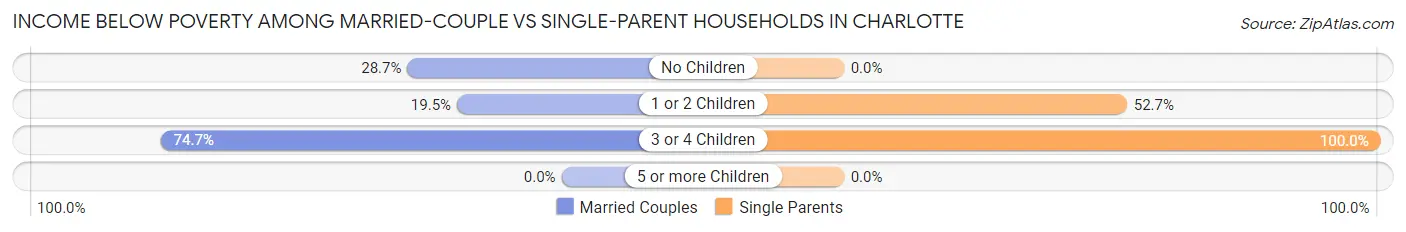
| Children | Married-Couple Families | Single-Parent Households |
| No Children | 27 (28.7%) | 0 (0.0%) |
| 1 or 2 Children | 15 (19.5%) | 29 (52.7%) |
| 3 or 4 Children | 53 (74.7%) | 21 (100.0%) |
| 5 or more Children | 0 (0.0%) | 0 (0.0%) |
| Total | 95 (39.3%) | 50 (45.5%) |
Race in Charlotte
The most populous races in Charlotte are Hispanic or Latino (1,203 | 90.9%), White / Caucasian (769 | 58.1%), and Two or more Races (498 | 37.6%).
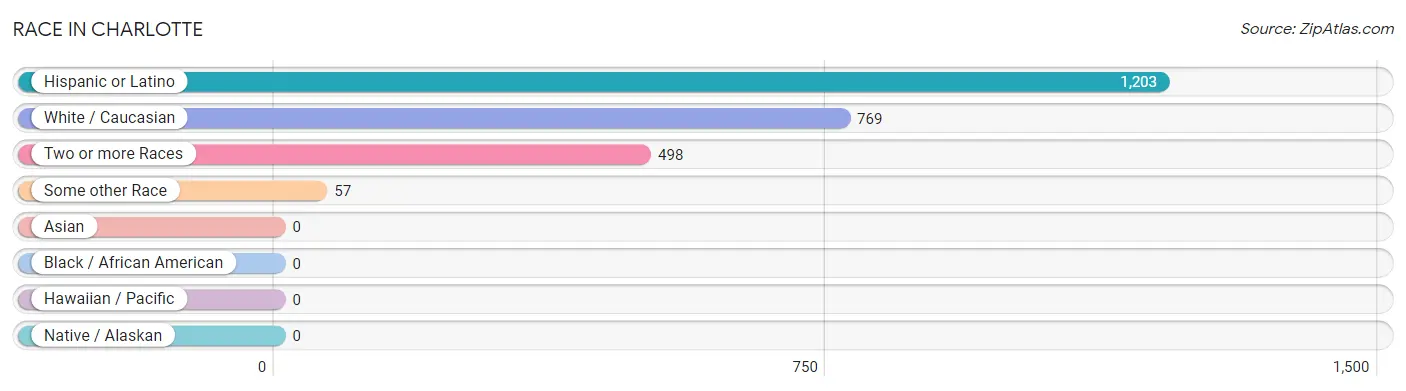
| Race | # Population | % Population |
| Asian | 0 | 0.0% |
| Black / African American | 0 | 0.0% |
| Hawaiian / Pacific | 0 | 0.0% |
| Hispanic or Latino | 1,203 | 90.9% |
| Native / Alaskan | 0 | 0.0% |
| White / Caucasian | 769 | 58.1% |
| Two or more Races | 498 | 37.6% |
| Some other Race | 57 | 4.3% |
| Total | 1,324 | 100.0% |
Ancestry in Charlotte
The most populous ancestries reported in Charlotte are Mexican (1,086 | 82.0%), German (171 | 12.9%), Central American Indian (131 | 9.9%), Irish (95 | 7.2%), and Portuguese (15 | 1.1%), together accounting for 113.1% of all Charlotte residents.
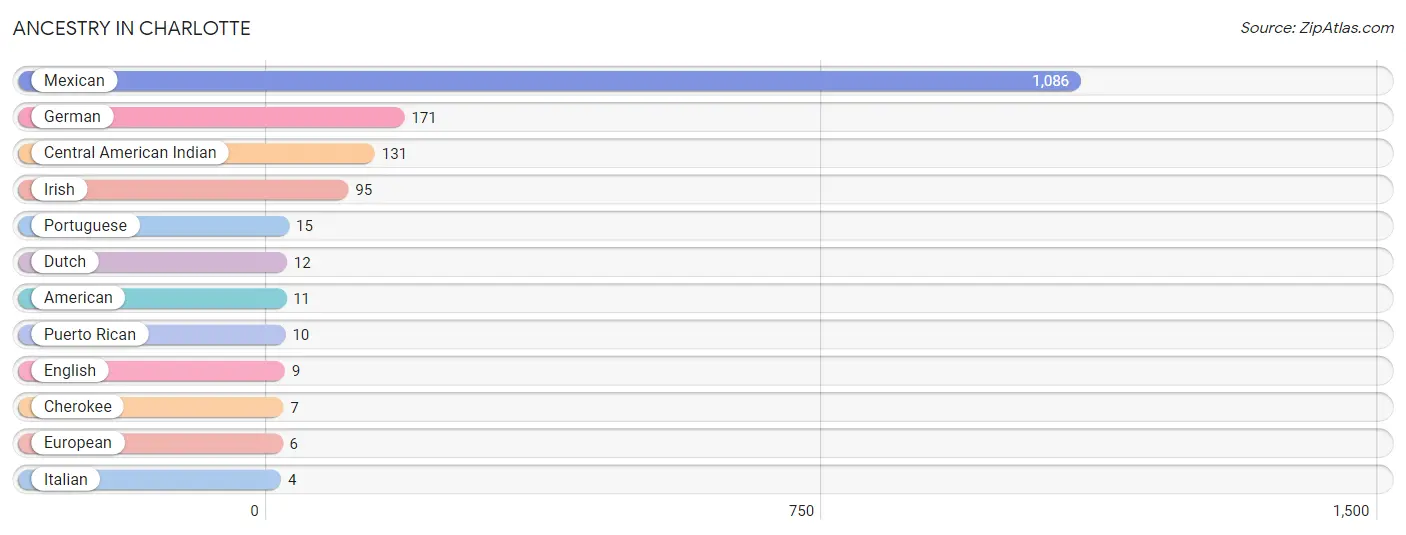
| Ancestry | # Population | % Population |
| American | 11 | 0.8% |
| Central American Indian | 131 | 9.9% |
| Cherokee | 7 | 0.5% |
| Dutch | 12 | 0.9% |
| English | 9 | 0.7% |
| European | 6 | 0.4% |
| German | 171 | 12.9% |
| Irish | 95 | 7.2% |
| Italian | 4 | 0.3% |
| Mexican | 1,086 | 82.0% |
| Portuguese | 15 | 1.1% |
| Puerto Rican | 10 | 0.8% | View All 12 Rows |
Immigrants in Charlotte
The most numerous immigrant groups reported in Charlotte came from Central America (160 | 12.1%), Latin America (160 | 12.1%), Mexico (103 | 7.8%), and El Salvador (57 | 4.3%), together accounting for 36.3% of all Charlotte residents.
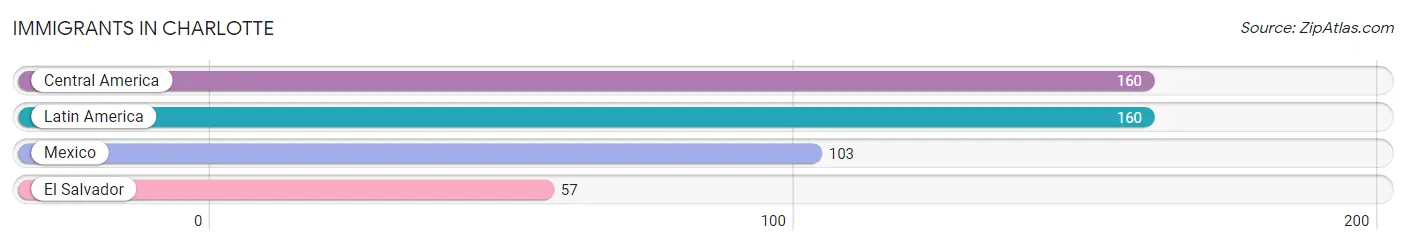
| Immigration Origin | # Population | % Population |
| Central America | 160 | 12.1% |
| El Salvador | 57 | 4.3% |
| Latin America | 160 | 12.1% |
| Mexico | 103 | 7.8% | View All 4 Rows |
Sex and Age in Charlotte
Sex and Age in Charlotte
The most populous age groups in Charlotte are 15 to 19 Years (204 | 30.3%) for men and 15 to 19 Years (91 | 14.0%) for women.
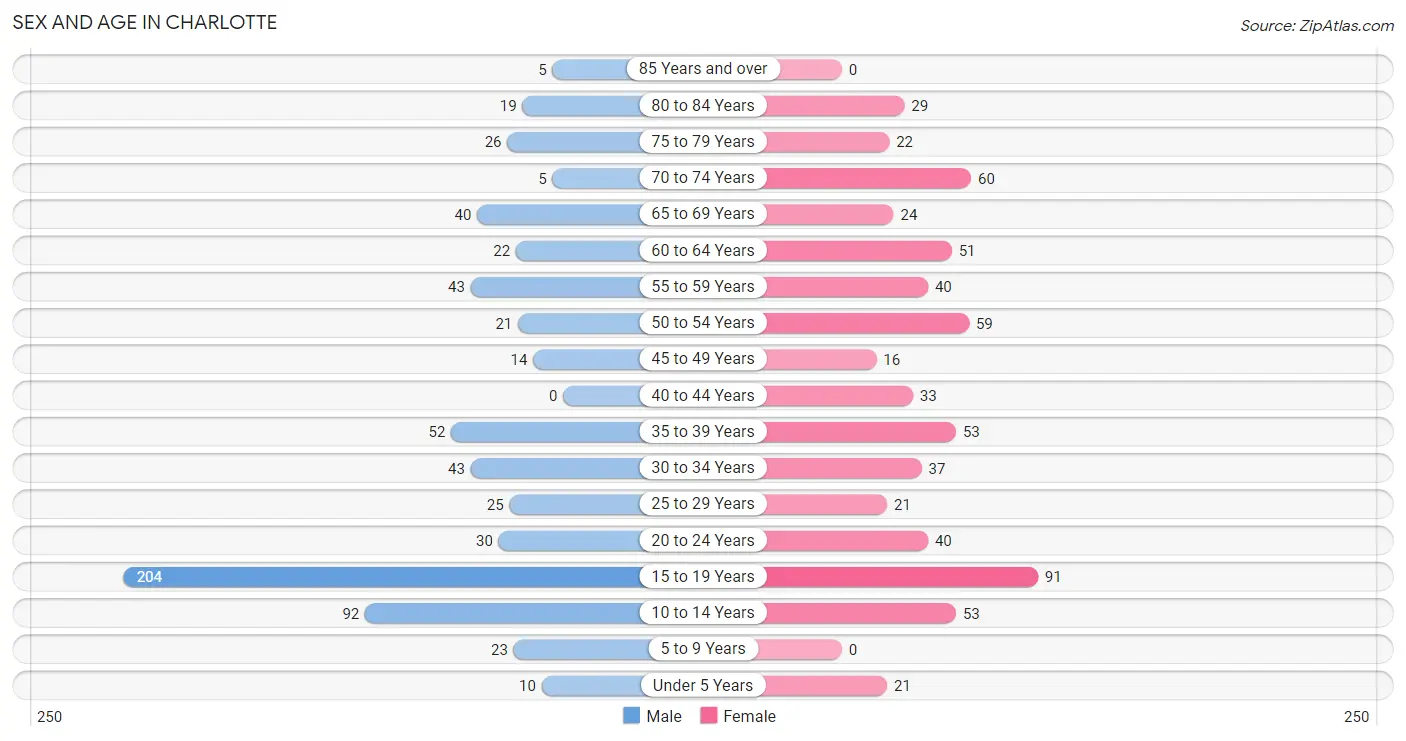
| Age Bracket | Male | Female |
| Under 5 Years | 10 (1.5%) | 21 (3.2%) |
| 5 to 9 Years | 23 (3.4%) | 0 (0.0%) |
| 10 to 14 Years | 92 (13.7%) | 53 (8.2%) |
| 15 to 19 Years | 204 (30.3%) | 91 (14.0%) |
| 20 to 24 Years | 30 (4.4%) | 40 (6.1%) |
| 25 to 29 Years | 25 (3.7%) | 21 (3.2%) |
| 30 to 34 Years | 43 (6.4%) | 37 (5.7%) |
| 35 to 39 Years | 52 (7.7%) | 53 (8.2%) |
| 40 to 44 Years | 0 (0.0%) | 33 (5.1%) |
| 45 to 49 Years | 14 (2.1%) | 16 (2.5%) |
| 50 to 54 Years | 21 (3.1%) | 59 (9.1%) |
| 55 to 59 Years | 43 (6.4%) | 40 (6.1%) |
| 60 to 64 Years | 22 (3.3%) | 51 (7.9%) |
| 65 to 69 Years | 40 (5.9%) | 24 (3.7%) |
| 70 to 74 Years | 5 (0.7%) | 60 (9.2%) |
| 75 to 79 Years | 26 (3.9%) | 22 (3.4%) |
| 80 to 84 Years | 19 (2.8%) | 29 (4.5%) |
| 85 Years and over | 5 (0.7%) | 0 (0.0%) |
| Total | 674 (100.0%) | 650 (100.0%) |
Families and Households in Charlotte
Median Family Size in Charlotte
The median family size in Charlotte is 3.29 persons per family, with single male/father families (37 | 10.5%) accounting for the largest median family size of 4.81 persons per family. On the other hand, single female/mother families (73 | 20.7%) represent the smallest median family size with 2.85 persons per family.
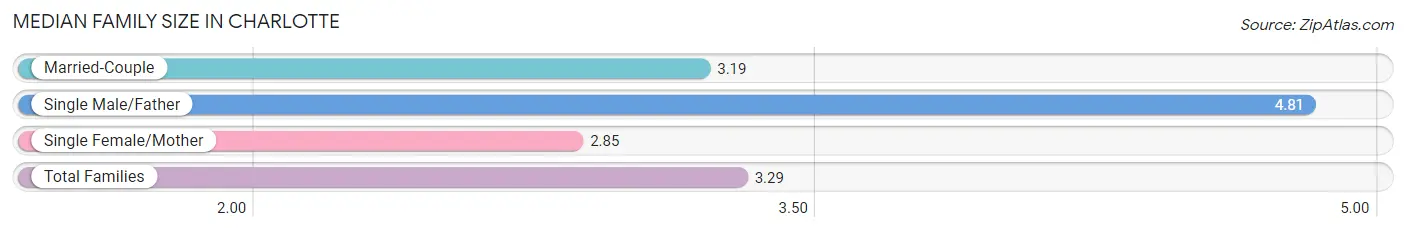
| Family Type | # Families | Family Size |
| Married-Couple | 242 (68.8%) | 3.19 |
| Single Male/Father | 37 (10.5%) | 4.81 |
| Single Female/Mother | 73 (20.7%) | 2.85 |
| Total Families | 352 (100.0%) | 3.29 |
Median Household Size in Charlotte
The median household size in Charlotte is 2.66 persons per household, with single male/father households (37 | 7.4%) accounting for the largest median household size of 5.27 persons per household. non-family households (146 | 29.3%) represent the smallest median household size with 1.03 persons per household.
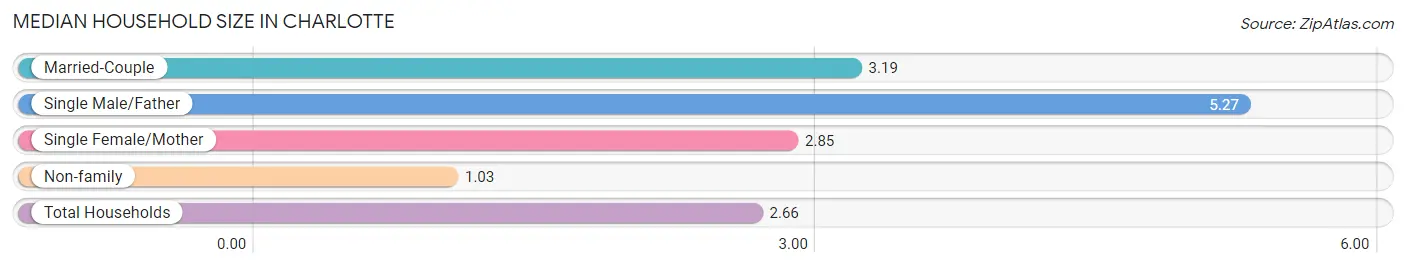
| Household Type | # Households | Household Size |
| Married-Couple | 242 (48.6%) | 3.19 |
| Single Male/Father | 37 (7.4%) | 5.27 |
| Single Female/Mother | 73 (14.7%) | 2.85 |
| Non-family | 146 (29.3%) | 1.03 |
| Total Households | 498 (100.0%) | 2.66 |
Household Size by Marriage Status in Charlotte
Out of a total of 498 households in Charlotte, 352 (70.7%) are family households, while 146 (29.3%) are nonfamily households. The most numerous type of family households are 2-person households, comprising 111, and the most common type of nonfamily households are 1-person households, comprising 139.
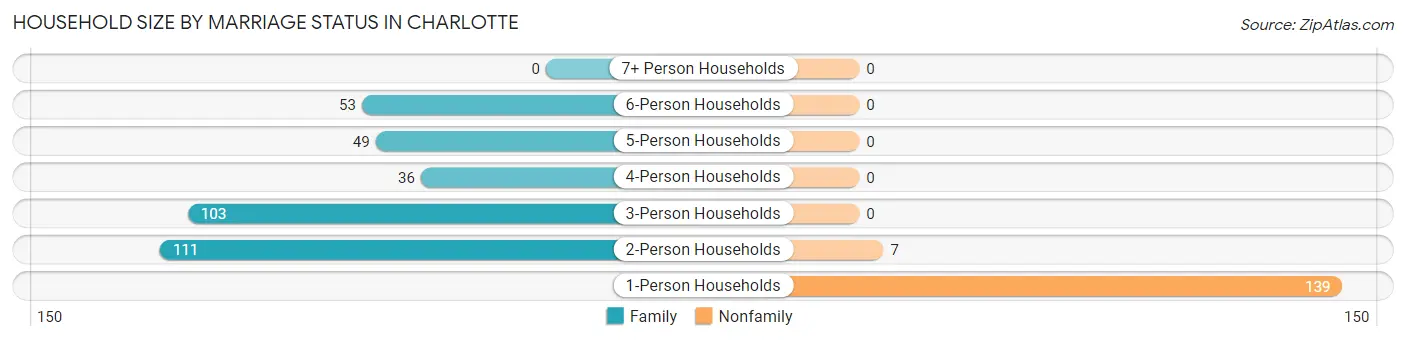
| Household Size | Family Households | Nonfamily Households |
| 1-Person Households | - | 139 (27.9%) |
| 2-Person Households | 111 (22.3%) | 7 (1.4%) |
| 3-Person Households | 103 (20.7%) | 0 (0.0%) |
| 4-Person Households | 36 (7.2%) | 0 (0.0%) |
| 5-Person Households | 49 (9.8%) | 0 (0.0%) |
| 6-Person Households | 53 (10.6%) | 0 (0.0%) |
| 7+ Person Households | 0 (0.0%) | 0 (0.0%) |
| Total | 352 (70.7%) | 146 (29.3%) |
Female Fertility in Charlotte
Fertility by Age in Charlotte
Average fertility rate in Charlotte is 64.0 births per 1,000 women. Women in the age bracket of 15 to 19 years have the highest fertility rate with 154.0 births per 1,000 women. Women in the age bracket of 15 to 19 years acount for 70.0% of all women with births.
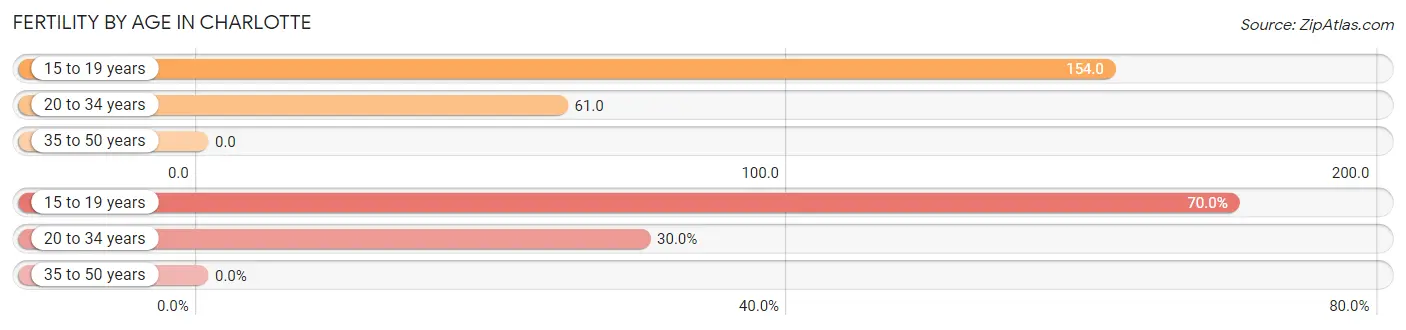
| Age Bracket | Women with Births | Births / 1,000 Women |
| 15 to 19 years | 14 (70.0%) | 154.0 |
| 20 to 34 years | 6 (30.0%) | 61.0 |
| 35 to 50 years | 0 (0.0%) | 0.0 |
| Total | 20 (100.0%) | 64.0 |
Fertility by Age by Marriage Status in Charlotte
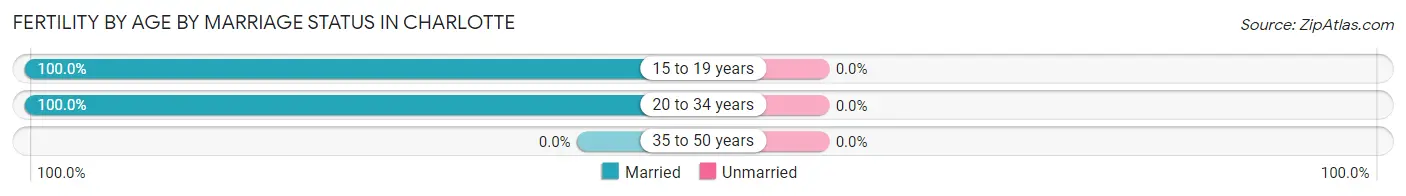
| Age Bracket | Married | Unmarried |
| 15 to 19 years | 14 (100.0%) | 0 (0.0%) |
| 20 to 34 years | 6 (100.0%) | 0 (0.0%) |
| 35 to 50 years | 0 (0.0%) | 0 (0.0%) |
| Total | 20 (100.0%) | 0 (0.0%) |
Fertility by Education in Charlotte
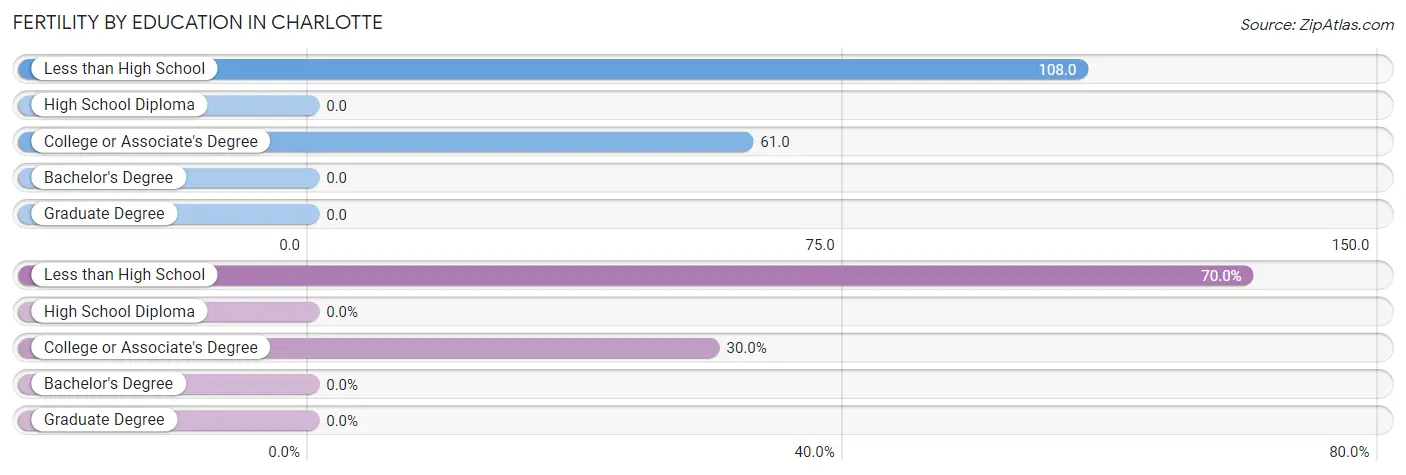
| Educational Attainment | Women with Births | Births / 1,000 Women |
| Less than High School | 14 (70.0%) | 108.0 |
| High School Diploma | 0 (0.0%) | 0.0 |
| College or Associate's Degree | 6 (30.0%) | 61.0 |
| Bachelor's Degree | 0 (0.0%) | 0.0 |
| Graduate Degree | 0 (0.0%) | 0.0 |
| Total | 20 (100.0%) | 64.0 |
Fertility by Education by Marriage Status in Charlotte
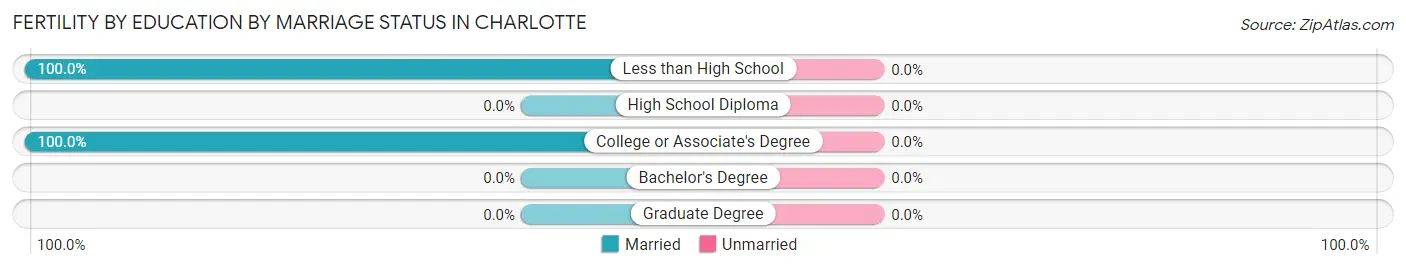
| Educational Attainment | Married | Unmarried |
| Less than High School | 14 (100.0%) | 0 (0.0%) |
| High School Diploma | 0 (0.0%) | 0 (0.0%) |
| College or Associate's Degree | 6 (100.0%) | 0 (0.0%) |
| Bachelor's Degree | 0 (0.0%) | 0 (0.0%) |
| Graduate Degree | 0 (0.0%) | 0 (0.0%) |
| Total | 20 (100.0%) | 0 (0.0%) |
Employment Characteristics in Charlotte
Employment by Class of Employer in Charlotte
Among the 525 employed individuals in Charlotte, private company employees (322 | 61.3%), self-employed (not incorporated) (91 | 17.3%), and local government employees (86 | 16.4%) make up the most common classes of employment.
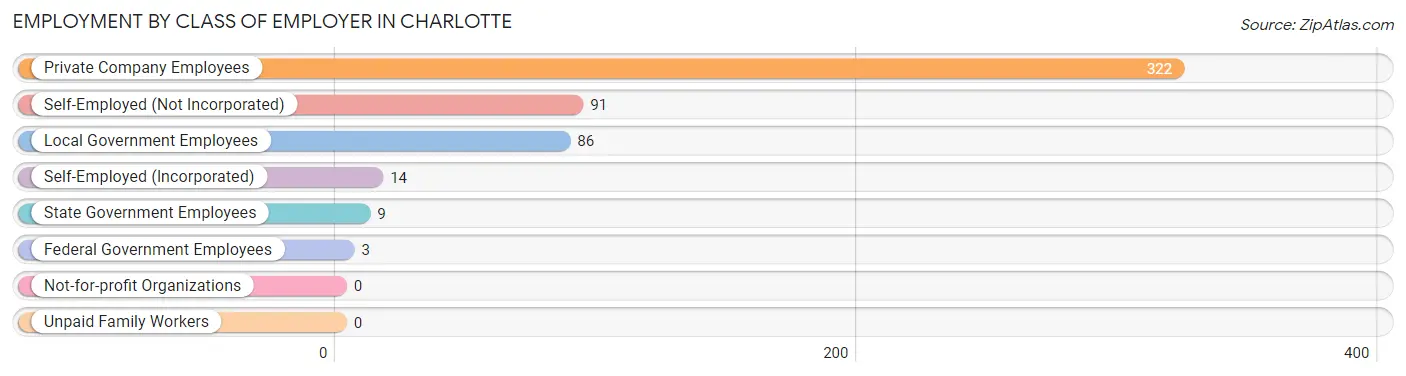
| Employer Class | # Employees | % Employees |
| Private Company Employees | 322 | 61.3% |
| Self-Employed (Incorporated) | 14 | 2.7% |
| Self-Employed (Not Incorporated) | 91 | 17.3% |
| Not-for-profit Organizations | 0 | 0.0% |
| Local Government Employees | 86 | 16.4% |
| State Government Employees | 9 | 1.7% |
| Federal Government Employees | 3 | 0.6% |
| Unpaid Family Workers | 0 | 0.0% |
| Total | 525 | 100.0% |
Employment Status by Age in Charlotte
According to the labor force statistics for Charlotte, out of the total population over 16 years of age (1,041), 53.7% or 559 individuals are in the labor force, with 6.1% or 34 of them unemployed. The age group with the highest labor force participation rate is 20 to 24 years, with 100.0% or 70 individuals in the labor force. Within the labor force, the 35 to 44 years age range has the highest percentage of unemployed individuals, with 23.9% or 33 of them being unemployed.
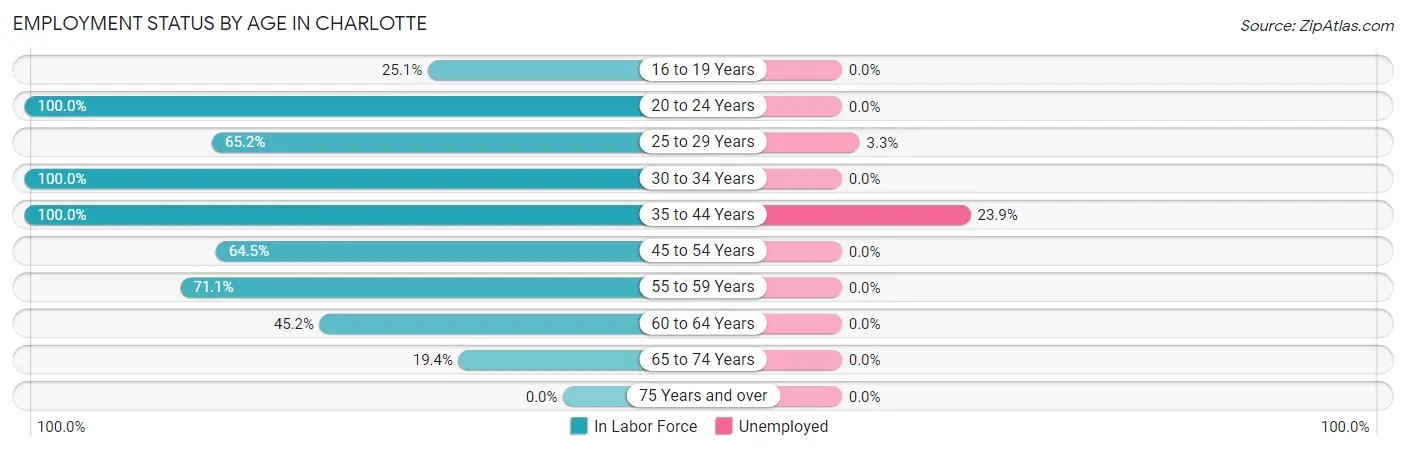
| Age Bracket | In Labor Force | Unemployed |
| 16 to 19 Years | 53 (25.1%) | 0 (0.0%) |
| 20 to 24 Years | 70 (100.0%) | 0 (0.0%) |
| 25 to 29 Years | 30 (65.2%) | 1 (3.3%) |
| 30 to 34 Years | 80 (100.0%) | 0 (0.0%) |
| 35 to 44 Years | 138 (100.0%) | 33 (23.9%) |
| 45 to 54 Years | 71 (64.5%) | 0 (0.0%) |
| 55 to 59 Years | 59 (71.1%) | 0 (0.0%) |
| 60 to 64 Years | 33 (45.2%) | 0 (0.0%) |
| 65 to 74 Years | 25 (19.4%) | 0 (0.0%) |
| 75 Years and over | 0 (0.0%) | 0 (0.0%) |
| Total | 559 (53.7%) | 34 (6.1%) |
Employment Status by Educational Attainment in Charlotte
According to labor force statistics for Charlotte, 77.5% of individuals (411) out of the total population between 25 and 64 years of age (530) are in the labor force, with 8.3% or 34 of them being unemployed. The group with the highest labor force participation rate are those with the educational attainment of college / associate degree, with 92.8% or 90 individuals in the labor force. Within the labor force, individuals with less than high school education have the highest percentage of unemployment, with 12.7% or 16 of them being unemployed.
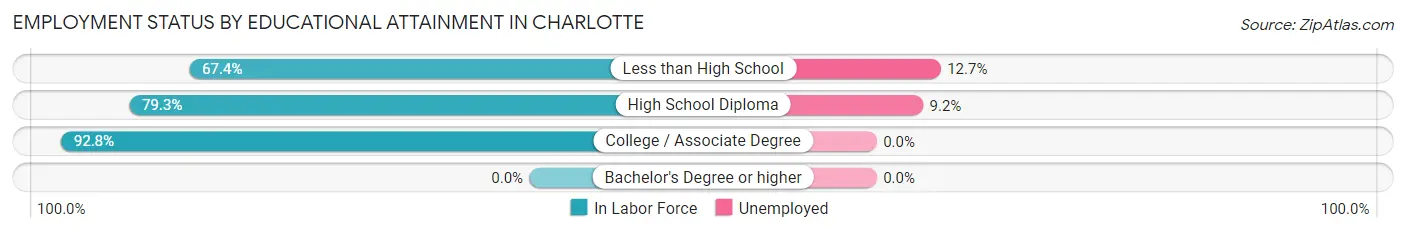
| Educational Attainment | In Labor Force | Unemployed |
| Less than High School | 126 (67.4%) | 24 (12.7%) |
| High School Diploma | 195 (79.3%) | 23 (9.2%) |
| College / Associate Degree | 90 (92.8%) | 0 (0.0%) |
| Bachelor's Degree or higher | 0 (0.0%) | 0 (0.0%) |
| Total | 411 (77.5%) | 44 (8.3%) |
Employment Occupations by Sex in Charlotte
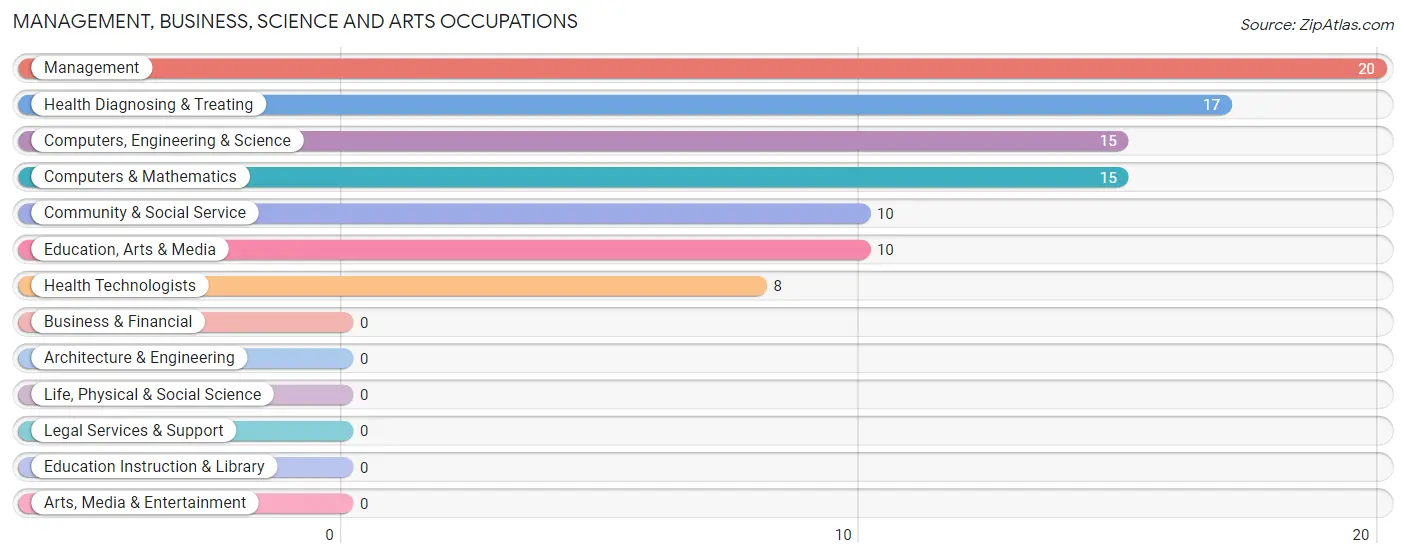
Management, Business, Science and Arts Occupations
The most common Management, Business, Science and Arts occupations in Charlotte are Management (20 | 3.8%), Health Diagnosing & Treating (17 | 3.2%), Computers, Engineering & Science (15 | 2.9%), Computers & Mathematics (15 | 2.9%), and Community & Social Service (10 | 1.9%).
Management, Business, Science and Arts Occupations by Sex
Within the Management, Business, Science and Arts occupations in Charlotte, the most male-oriented occupations are Management (100.0%), Computers, Engineering & Science (100.0%), and Computers & Mathematics (100.0%), while the most female-oriented occupations are Community & Social Service (100.0%), Education, Arts & Media (100.0%), and Health Diagnosing & Treating (52.9%).
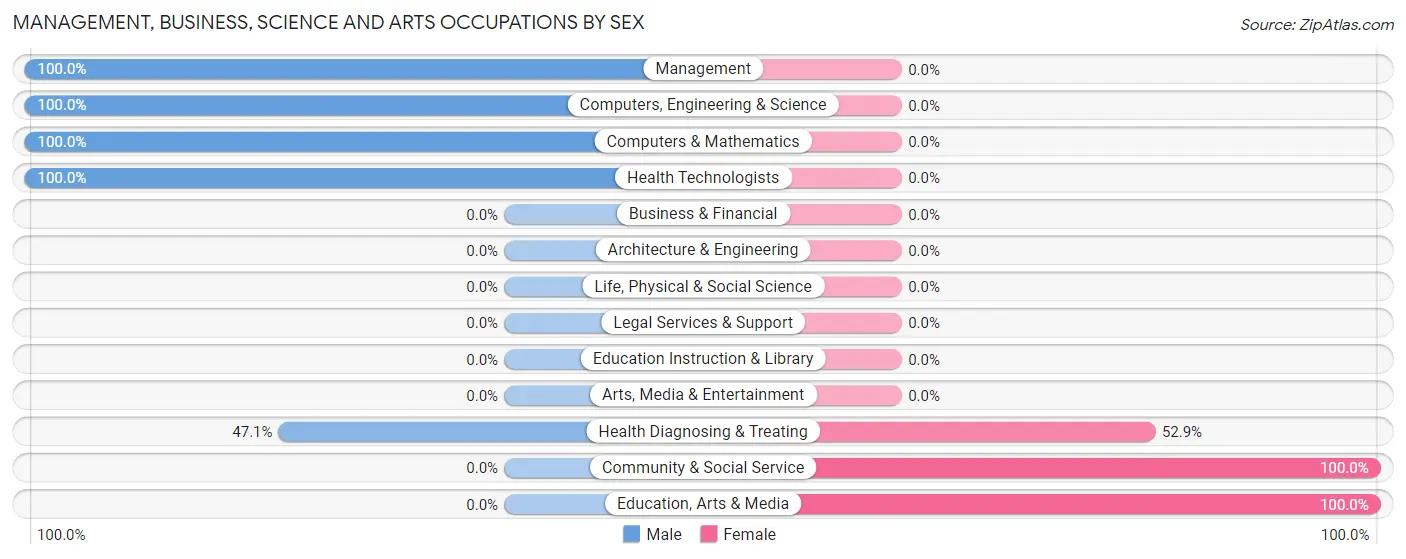
| Occupation | Male | Female |
| Management | 20 (100.0%) | 0 (0.0%) |
| Business & Financial | 0 (0.0%) | 0 (0.0%) |
| Computers, Engineering & Science | 15 (100.0%) | 0 (0.0%) |
| Computers & Mathematics | 15 (100.0%) | 0 (0.0%) |
| Architecture & Engineering | 0 (0.0%) | 0 (0.0%) |
| Life, Physical & Social Science | 0 (0.0%) | 0 (0.0%) |
| Community & Social Service | 0 (0.0%) | 10 (100.0%) |
| Education, Arts & Media | 0 (0.0%) | 10 (100.0%) |
| Legal Services & Support | 0 (0.0%) | 0 (0.0%) |
| Education Instruction & Library | 0 (0.0%) | 0 (0.0%) |
| Arts, Media & Entertainment | 0 (0.0%) | 0 (0.0%) |
| Health Diagnosing & Treating | 8 (47.1%) | 9 (52.9%) |
| Health Technologists | 8 (100.0%) | 0 (0.0%) |
| Total (Category) | 43 (69.4%) | 19 (30.6%) |
| Total (Overall) | 247 (47.0%) | 278 (52.9%) |
Services Occupations
The most common Services occupations in Charlotte are Cleaning & Maintenance (175 | 33.3%), Food Preparation & Serving (25 | 4.8%), Security & Protection (21 | 4.0%), Law Enforcement (21 | 4.0%), and Healthcare Support (12 | 2.3%).
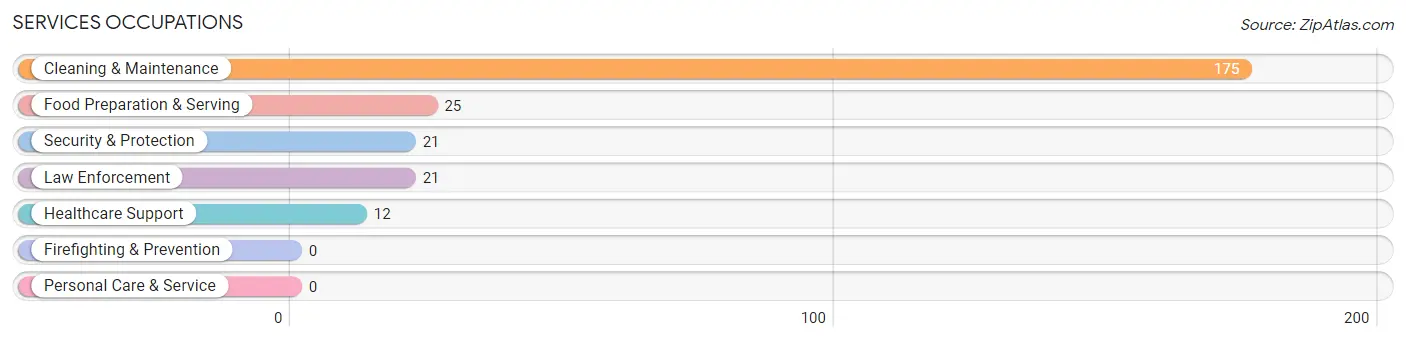
Services Occupations by Sex
Within the Services occupations in Charlotte, the most male-oriented occupations are Food Preparation & Serving (48.0%), Security & Protection (33.3%), and Law Enforcement (33.3%), while the most female-oriented occupations are Healthcare Support (100.0%), Cleaning & Maintenance (81.7%), and Security & Protection (66.7%).
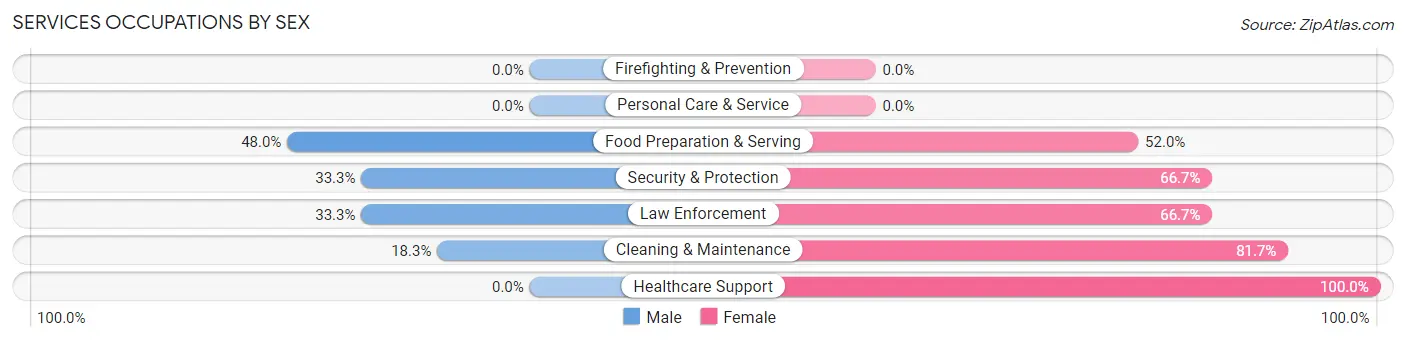
| Occupation | Male | Female |
| Healthcare Support | 0 (0.0%) | 12 (100.0%) |
| Security & Protection | 7 (33.3%) | 14 (66.7%) |
| Firefighting & Prevention | 0 (0.0%) | 0 (0.0%) |
| Law Enforcement | 7 (33.3%) | 14 (66.7%) |
| Food Preparation & Serving | 12 (48.0%) | 13 (52.0%) |
| Cleaning & Maintenance | 32 (18.3%) | 143 (81.7%) |
| Personal Care & Service | 0 (0.0%) | 0 (0.0%) |
| Total (Category) | 51 (21.9%) | 182 (78.1%) |
| Total (Overall) | 247 (47.0%) | 278 (52.9%) |
Sales and Office Occupations
The most common Sales and Office occupations in Charlotte are Sales & Related (63 | 12.0%), and Office & Administration (32 | 6.1%).

Sales and Office Occupations by Sex

| Occupation | Male | Female |
| Sales & Related | 0 (0.0%) | 63 (100.0%) |
| Office & Administration | 18 (56.2%) | 14 (43.8%) |
| Total (Category) | 18 (19.0%) | 77 (81.0%) |
| Total (Overall) | 247 (47.0%) | 278 (52.9%) |
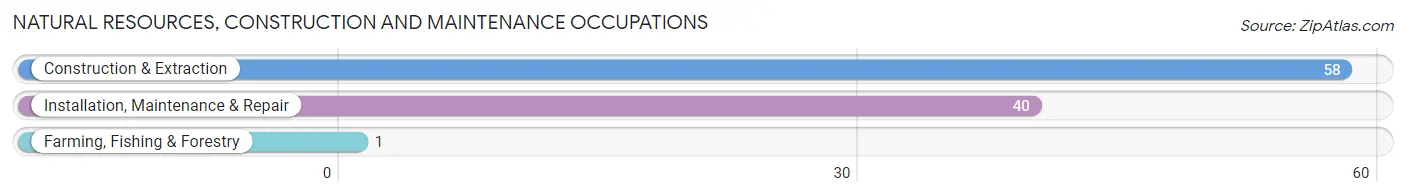
Natural Resources, Construction and Maintenance Occupations
The most common Natural Resources, Construction and Maintenance occupations in Charlotte are Construction & Extraction (58 | 11.1%), Installation, Maintenance & Repair (40 | 7.6%), and Farming, Fishing & Forestry (1 | 0.2%).
Natural Resources, Construction and Maintenance Occupations by Sex

| Occupation | Male | Female |
| Farming, Fishing & Forestry | 1 (100.0%) | 0 (0.0%) |
| Construction & Extraction | 58 (100.0%) | 0 (0.0%) |
| Installation, Maintenance & Repair | 40 (100.0%) | 0 (0.0%) |
| Total (Category) | 99 (100.0%) | 0 (0.0%) |
| Total (Overall) | 247 (47.0%) | 278 (52.9%) |
Production, Transportation and Moving Occupations
The most common Production, Transportation and Moving occupations in Charlotte are Material Moving (25 | 4.8%), and Production (11 | 2.1%).
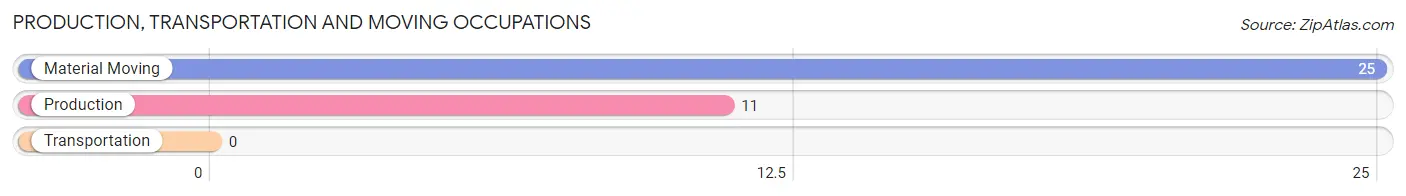
Production, Transportation and Moving Occupations by Sex
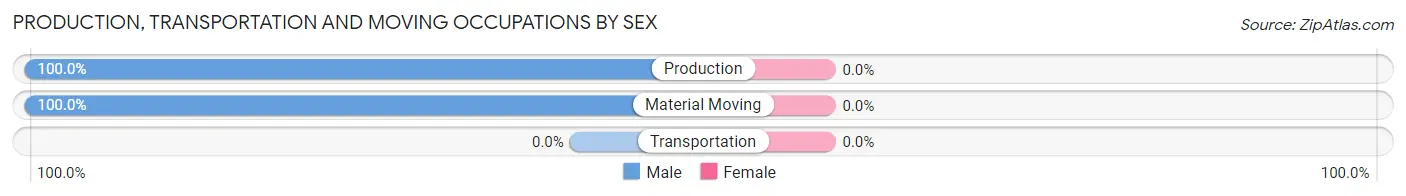
| Occupation | Male | Female |
| Production | 11 (100.0%) | 0 (0.0%) |
| Transportation | 0 (0.0%) | 0 (0.0%) |
| Material Moving | 25 (100.0%) | 0 (0.0%) |
| Total (Category) | 36 (100.0%) | 0 (0.0%) |
| Total (Overall) | 247 (47.0%) | 278 (52.9%) |
Employment Industries by Sex in Charlotte
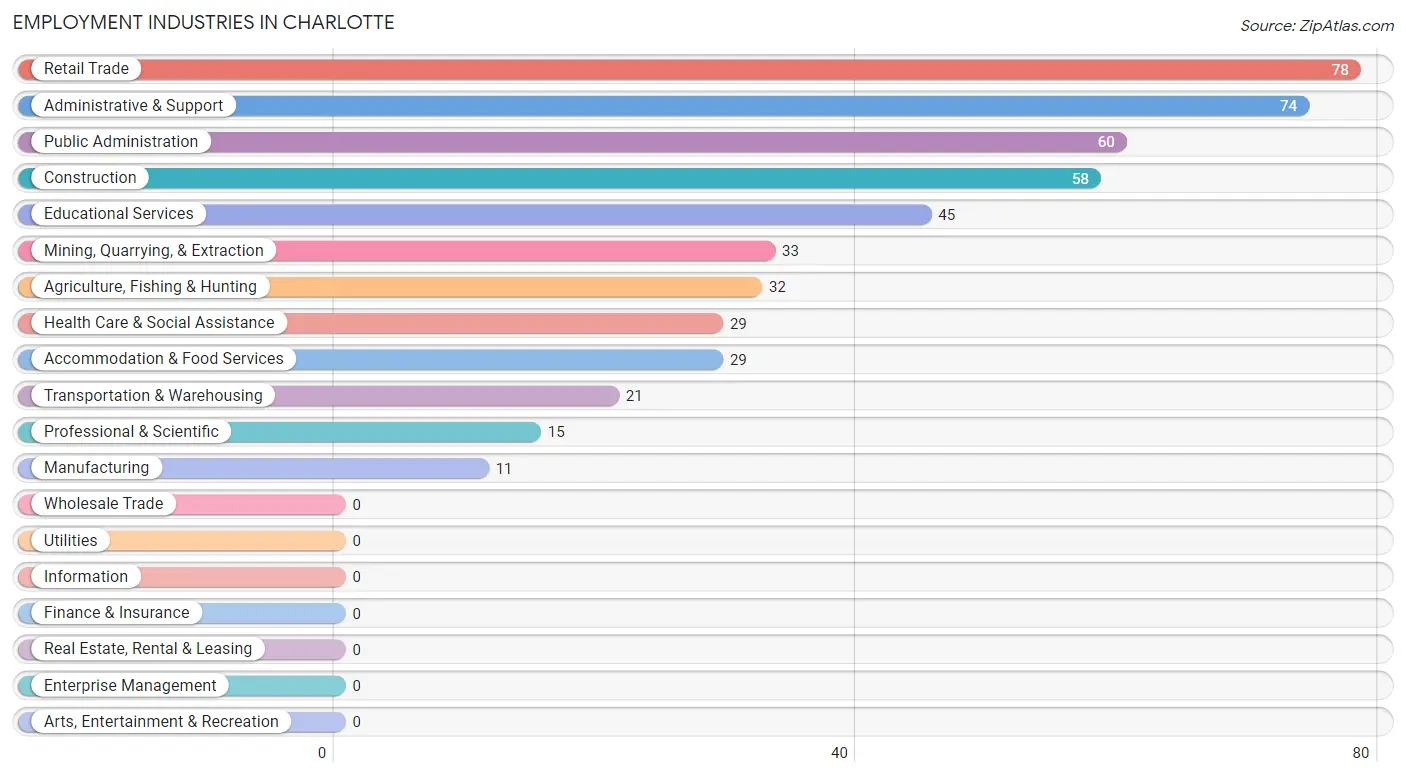
Employment Industries in Charlotte
The major employment industries in Charlotte include Retail Trade (78 | 14.9%), Administrative & Support (74 | 14.1%), Public Administration (60 | 11.4%), Construction (58 | 11.1%), and Educational Services (45 | 8.6%).
Employment Industries by Sex in Charlotte
The Charlotte industries that see more men than women are Construction (100.0%), Manufacturing (100.0%), and Professional & Scientific (100.0%), whereas the industries that tend to have a higher number of women are Retail Trade (85.9%), Educational Services (77.8%), and Health Care & Social Assistance (72.4%).
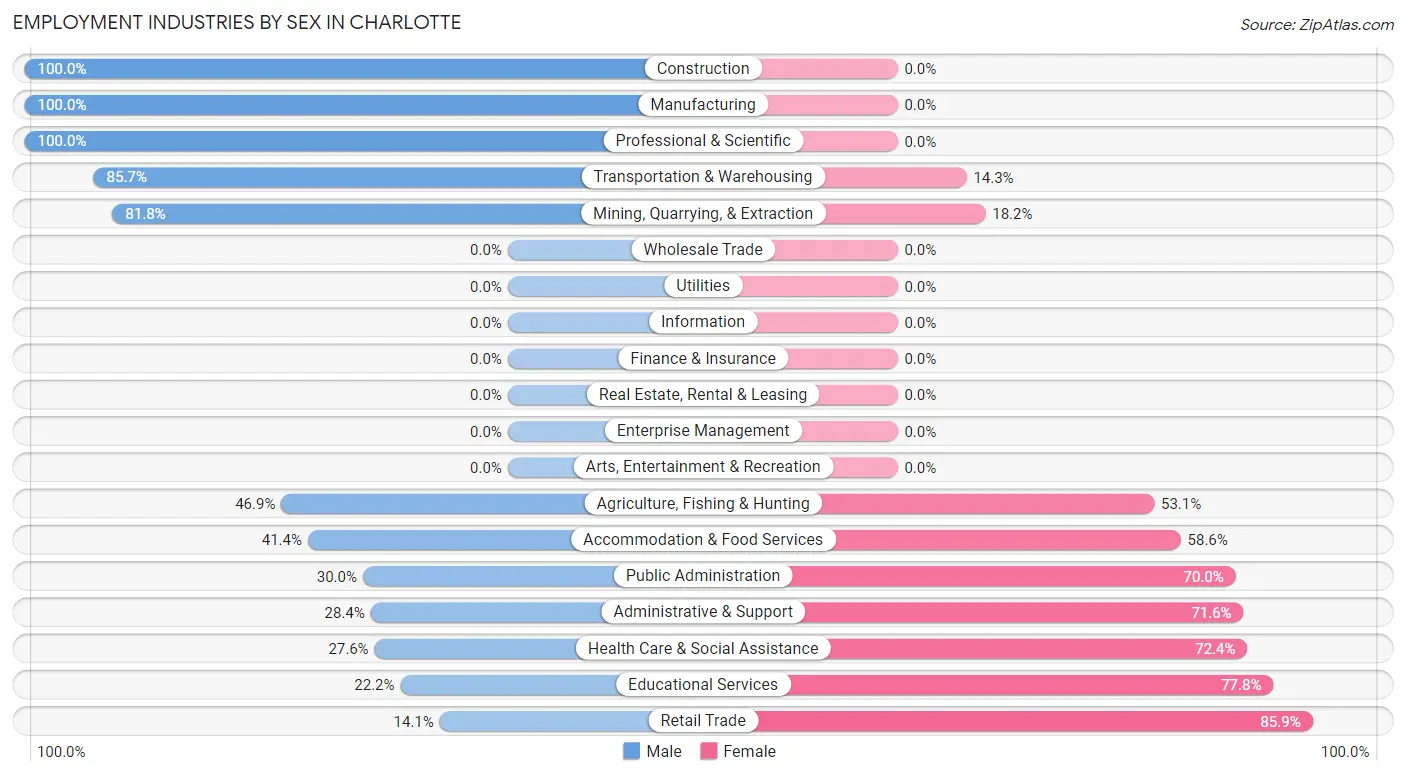
| Industry | Male | Female |
| Agriculture, Fishing & Hunting | 15 (46.9%) | 17 (53.1%) |
| Mining, Quarrying, & Extraction | 27 (81.8%) | 6 (18.2%) |
| Construction | 58 (100.0%) | 0 (0.0%) |
| Manufacturing | 11 (100.0%) | 0 (0.0%) |
| Wholesale Trade | 0 (0.0%) | 0 (0.0%) |
| Retail Trade | 11 (14.1%) | 67 (85.9%) |
| Transportation & Warehousing | 18 (85.7%) | 3 (14.3%) |
| Utilities | 0 (0.0%) | 0 (0.0%) |
| Information | 0 (0.0%) | 0 (0.0%) |
| Finance & Insurance | 0 (0.0%) | 0 (0.0%) |
| Real Estate, Rental & Leasing | 0 (0.0%) | 0 (0.0%) |
| Professional & Scientific | 15 (100.0%) | 0 (0.0%) |
| Enterprise Management | 0 (0.0%) | 0 (0.0%) |
| Administrative & Support | 21 (28.4%) | 53 (71.6%) |
| Educational Services | 10 (22.2%) | 35 (77.8%) |
| Health Care & Social Assistance | 8 (27.6%) | 21 (72.4%) |
| Arts, Entertainment & Recreation | 0 (0.0%) | 0 (0.0%) |
| Accommodation & Food Services | 12 (41.4%) | 17 (58.6%) |
| Public Administration | 18 (30.0%) | 42 (70.0%) |
| Total | 247 (47.0%) | 278 (52.9%) |
Education in Charlotte
School Enrollment in Charlotte
The most common levels of schooling among the 411 students in Charlotte are high school (275 | 66.9%), middle school (94 | 22.9%), and elementary school (42 | 10.2%).
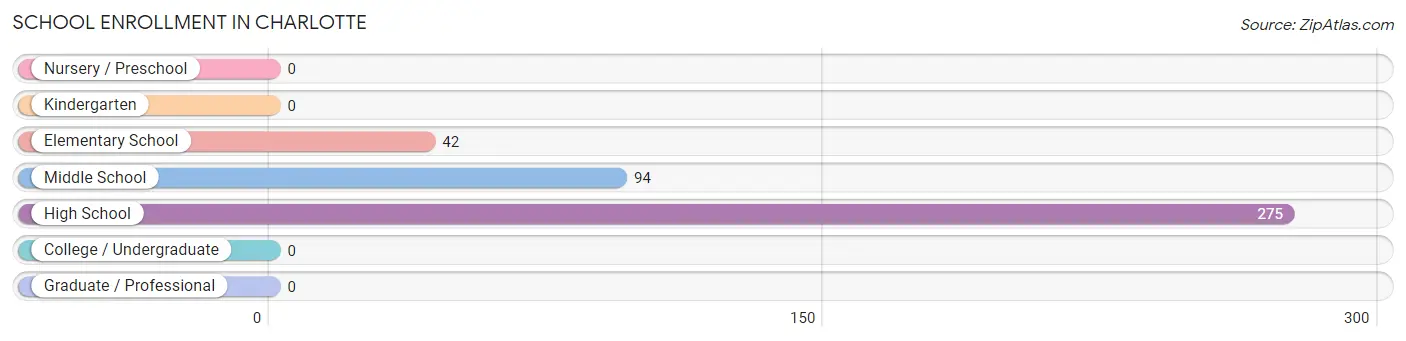
| School Level | # Students | % Students |
| Nursery / Preschool | 0 | 0.0% |
| Kindergarten | 0 | 0.0% |
| Elementary School | 42 | 10.2% |
| Middle School | 94 | 22.9% |
| High School | 275 | 66.9% |
| College / Undergraduate | 0 | 0.0% |
| Graduate / Professional | 0 | 0.0% |
| Total | 411 | 100.0% |
School Enrollment by Age by Funding Source in Charlotte
Out of a total of 411 students who are enrolled in schools in Charlotte, 7 (1.7%) attend a private institution, while the remaining 404 (98.3%) are enrolled in public schools. The age group of 10 to 14 year olds has the highest likelihood of being enrolled in private schools, with 7 (4.8% in the age bracket) enrolled. Conversely, the age group of 5 to 9 year old has the lowest likelihood of being enrolled in a private school, with 23 (100.0% in the age bracket) attending a public institution.
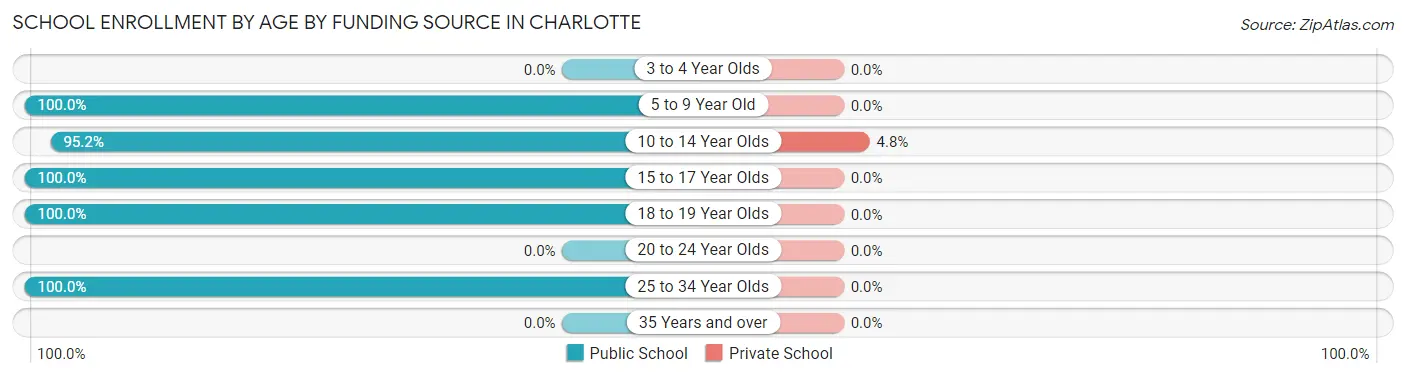
| Age Bracket | Public School | Private School |
| 3 to 4 Year Olds | 0 (0.0%) | 0 (0.0%) |
| 5 to 9 Year Old | 23 (100.0%) | 0 (0.0%) |
| 10 to 14 Year Olds | 138 (95.2%) | 7 (4.8%) |
| 15 to 17 Year Olds | 174 (100.0%) | 0 (0.0%) |
| 18 to 19 Year Olds | 55 (100.0%) | 0 (0.0%) |
| 20 to 24 Year Olds | 0 (0.0%) | 0 (0.0%) |
| 25 to 34 Year Olds | 14 (100.0%) | 0 (0.0%) |
| 35 Years and over | 0 (0.0%) | 0 (0.0%) |
| Total | 404 (98.3%) | 7 (1.7%) |
Educational Attainment by Field of Study in Charlotte
Education (11 | 57.9%), and liberal arts & history (8 | 42.1%) are the most common fields of study among 19 individuals in Charlotte who have obtained a bachelor's degree or higher.
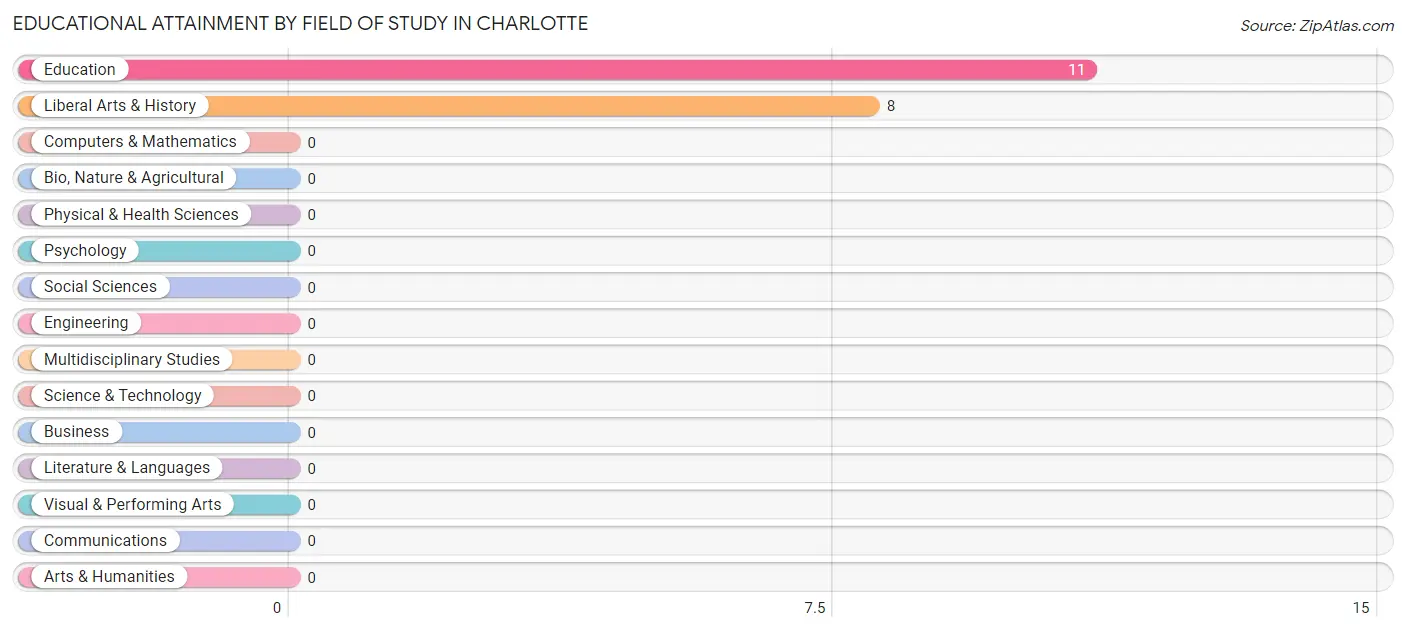
| Field of Study | # Graduates | % Graduates |
| Computers & Mathematics | 0 | 0.0% |
| Bio, Nature & Agricultural | 0 | 0.0% |
| Physical & Health Sciences | 0 | 0.0% |
| Psychology | 0 | 0.0% |
| Social Sciences | 0 | 0.0% |
| Engineering | 0 | 0.0% |
| Multidisciplinary Studies | 0 | 0.0% |
| Science & Technology | 0 | 0.0% |
| Business | 0 | 0.0% |
| Education | 11 | 57.9% |
| Literature & Languages | 0 | 0.0% |
| Liberal Arts & History | 8 | 42.1% |
| Visual & Performing Arts | 0 | 0.0% |
| Communications | 0 | 0.0% |
| Arts & Humanities | 0 | 0.0% |
| Total | 19 | 100.0% |
Transportation & Commute in Charlotte
Vehicle Availability by Sex in Charlotte
The most prevalent vehicle ownership categories in Charlotte are males with 2 vehicles (136, accounting for 55.1%) and females with 2 vehicles (127, making up 48.9%).
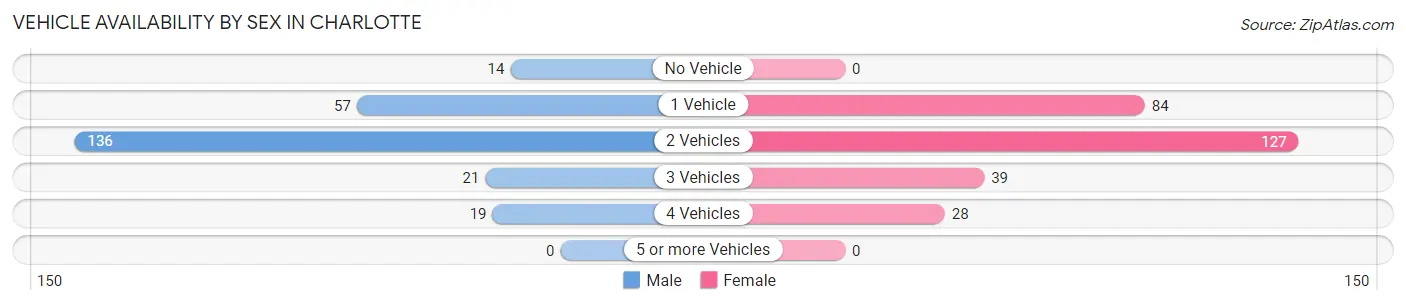
| Vehicles Available | Male | Female |
| No Vehicle | 14 (5.7%) | 0 (0.0%) |
| 1 Vehicle | 57 (23.1%) | 84 (30.2%) |
| 2 Vehicles | 136 (55.1%) | 127 (45.7%) |
| 3 Vehicles | 21 (8.5%) | 39 (14.0%) |
| 4 Vehicles | 19 (7.7%) | 28 (10.1%) |
| 5 or more Vehicles | 0 (0.0%) | 0 (0.0%) |
| Total | 247 (100.0%) | 278 (100.0%) |
Commute Time in Charlotte
The most frequently occuring commute durations in Charlotte are 30 to 34 minutes (91 commuters, 18.6%), 5 to 9 minutes (78 commuters, 15.9%), and 10 to 14 minutes (66 commuters, 13.5%).
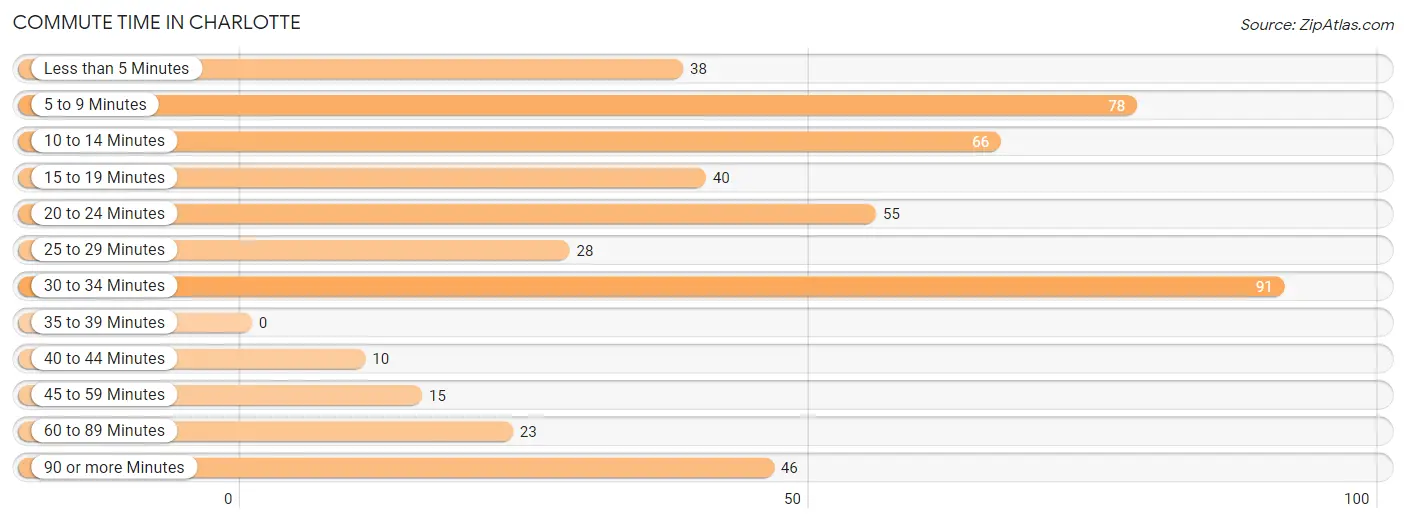
| Commute Time | # Commuters | % Commuters |
| Less than 5 Minutes | 38 | 7.8% |
| 5 to 9 Minutes | 78 | 15.9% |
| 10 to 14 Minutes | 66 | 13.5% |
| 15 to 19 Minutes | 40 | 8.2% |
| 20 to 24 Minutes | 55 | 11.2% |
| 25 to 29 Minutes | 28 | 5.7% |
| 30 to 34 Minutes | 91 | 18.6% |
| 35 to 39 Minutes | 0 | 0.0% |
| 40 to 44 Minutes | 10 | 2.0% |
| 45 to 59 Minutes | 15 | 3.1% |
| 60 to 89 Minutes | 23 | 4.7% |
| 90 or more Minutes | 46 | 9.4% |
Commute Time by Sex in Charlotte
The most common commute times in Charlotte are 90 or more minutes (46 commuters, 21.7%) for males and 30 to 34 minutes (66 commuters, 23.7%) for females.
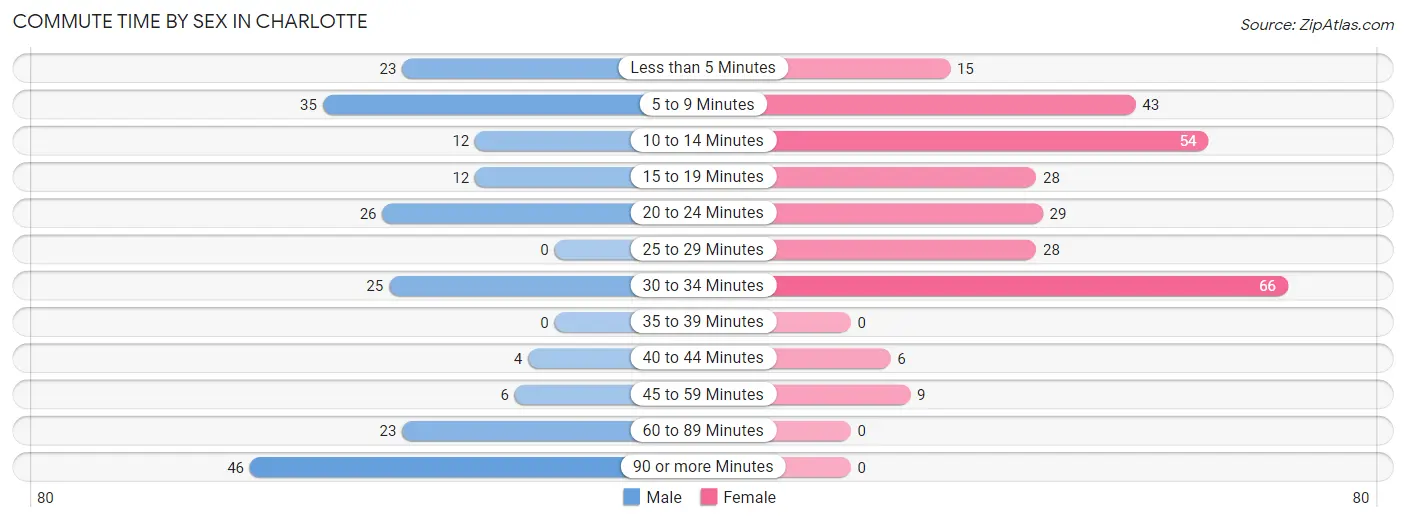
| Commute Time | Male | Female |
| Less than 5 Minutes | 23 (10.8%) | 15 (5.4%) |
| 5 to 9 Minutes | 35 (16.5%) | 43 (15.5%) |
| 10 to 14 Minutes | 12 (5.7%) | 54 (19.4%) |
| 15 to 19 Minutes | 12 (5.7%) | 28 (10.1%) |
| 20 to 24 Minutes | 26 (12.3%) | 29 (10.4%) |
| 25 to 29 Minutes | 0 (0.0%) | 28 (10.1%) |
| 30 to 34 Minutes | 25 (11.8%) | 66 (23.7%) |
| 35 to 39 Minutes | 0 (0.0%) | 0 (0.0%) |
| 40 to 44 Minutes | 4 (1.9%) | 6 (2.2%) |
| 45 to 59 Minutes | 6 (2.8%) | 9 (3.2%) |
| 60 to 89 Minutes | 23 (10.8%) | 0 (0.0%) |
| 90 or more Minutes | 46 (21.7%) | 0 (0.0%) |
Time of Departure to Work by Sex in Charlotte
The most frequent times of departure to work in Charlotte are 7:00 AM to 7:29 AM (57, 26.9%) for males and 9:00 AM to 9:59 AM (75, 27.0%) for females.
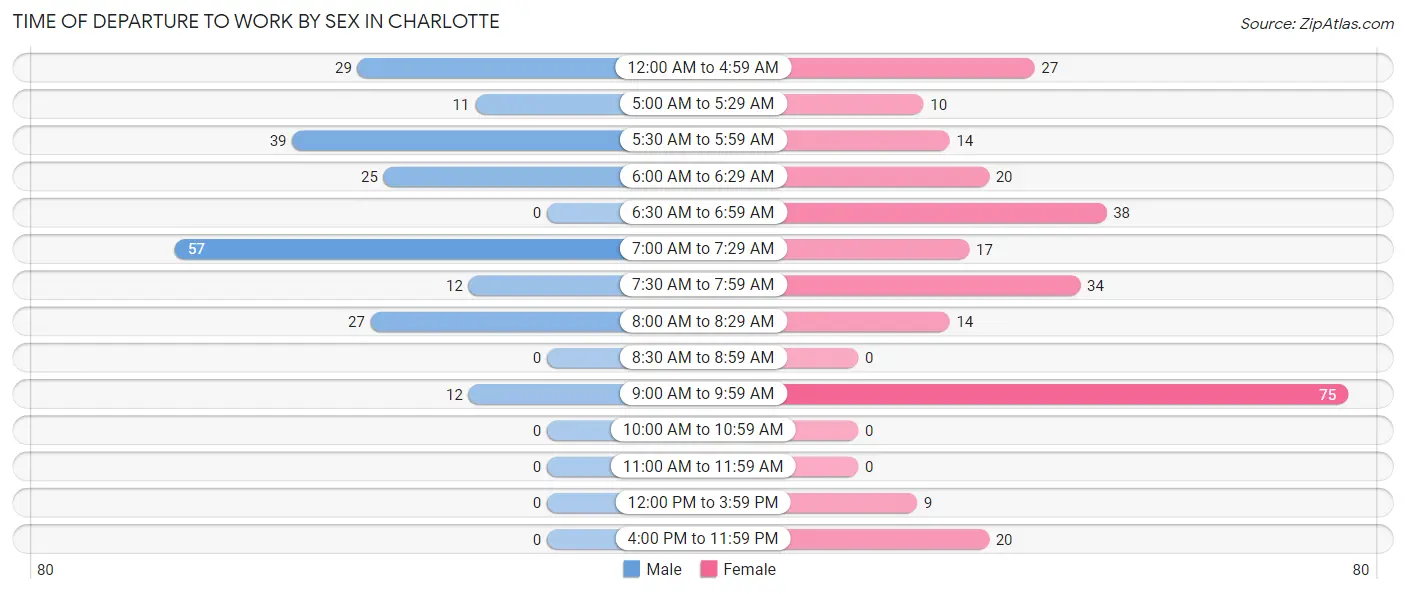
| Time of Departure | Male | Female |
| 12:00 AM to 4:59 AM | 29 (13.7%) | 27 (9.7%) |
| 5:00 AM to 5:29 AM | 11 (5.2%) | 10 (3.6%) |
| 5:30 AM to 5:59 AM | 39 (18.4%) | 14 (5.0%) |
| 6:00 AM to 6:29 AM | 25 (11.8%) | 20 (7.2%) |
| 6:30 AM to 6:59 AM | 0 (0.0%) | 38 (13.7%) |
| 7:00 AM to 7:29 AM | 57 (26.9%) | 17 (6.1%) |
| 7:30 AM to 7:59 AM | 12 (5.7%) | 34 (12.2%) |
| 8:00 AM to 8:29 AM | 27 (12.7%) | 14 (5.0%) |
| 8:30 AM to 8:59 AM | 0 (0.0%) | 0 (0.0%) |
| 9:00 AM to 9:59 AM | 12 (5.7%) | 75 (27.0%) |
| 10:00 AM to 10:59 AM | 0 (0.0%) | 0 (0.0%) |
| 11:00 AM to 11:59 AM | 0 (0.0%) | 0 (0.0%) |
| 12:00 PM to 3:59 PM | 0 (0.0%) | 9 (3.2%) |
| 4:00 PM to 11:59 PM | 0 (0.0%) | 20 (7.2%) |
| Total | 212 (100.0%) | 278 (100.0%) |
Housing Occupancy in Charlotte
Occupancy by Ownership in Charlotte
Of the total 498 dwellings in Charlotte, owner-occupied units account for 474 (95.2%), while renter-occupied units make up 24 (4.8%).
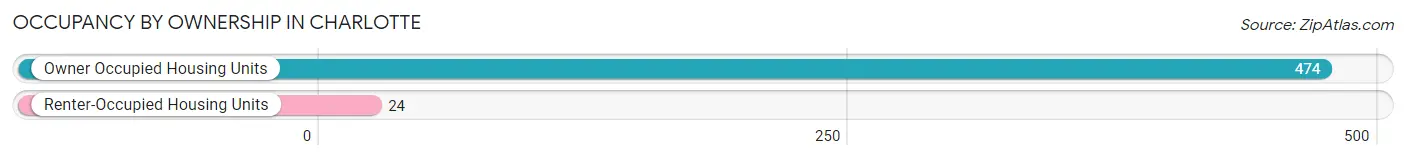
| Occupancy | # Housing Units | % Housing Units |
| Owner Occupied Housing Units | 474 | 95.2% |
| Renter-Occupied Housing Units | 24 | 4.8% |
| Total Occupied Housing Units | 498 | 100.0% |
Occupancy by Household Size in Charlotte
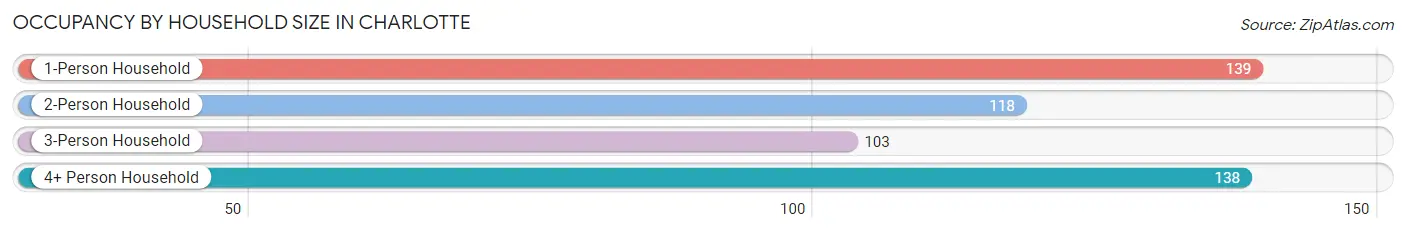
| Household Size | # Housing Units | % Housing Units |
| 1-Person Household | 139 | 27.9% |
| 2-Person Household | 118 | 23.7% |
| 3-Person Household | 103 | 20.7% |
| 4+ Person Household | 138 | 27.7% |
| Total Housing Units | 498 | 100.0% |
Occupancy by Ownership by Household Size in Charlotte
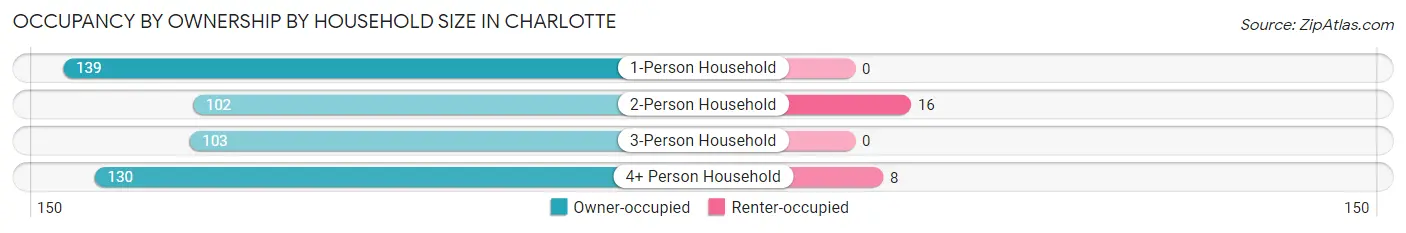
| Household Size | Owner-occupied | Renter-occupied |
| 1-Person Household | 139 (100.0%) | 0 (0.0%) |
| 2-Person Household | 102 (86.4%) | 16 (13.6%) |
| 3-Person Household | 103 (100.0%) | 0 (0.0%) |
| 4+ Person Household | 130 (94.2%) | 8 (5.8%) |
| Total Housing Units | 474 (95.2%) | 24 (4.8%) |
Occupancy by Educational Attainment in Charlotte
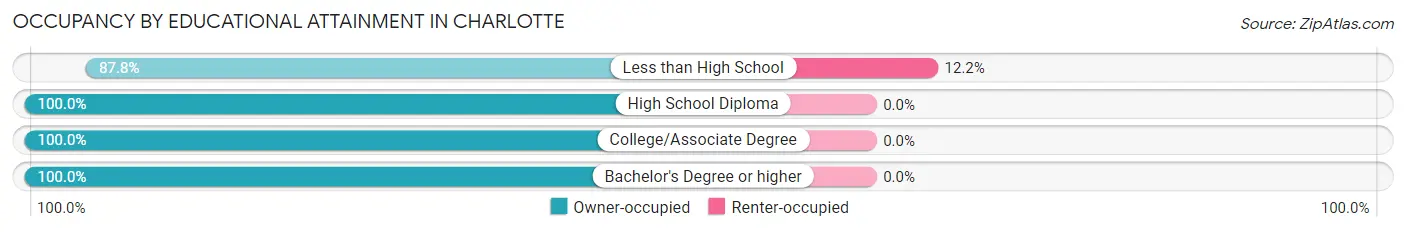
| Household Size | Owner-occupied | Renter-occupied |
| Less than High School | 173 (87.8%) | 24 (12.2%) |
| High School Diploma | 182 (100.0%) | 0 (0.0%) |
| College/Associate Degree | 100 (100.0%) | 0 (0.0%) |
| Bachelor's Degree or higher | 19 (100.0%) | 0 (0.0%) |
Occupancy by Age of Householder in Charlotte
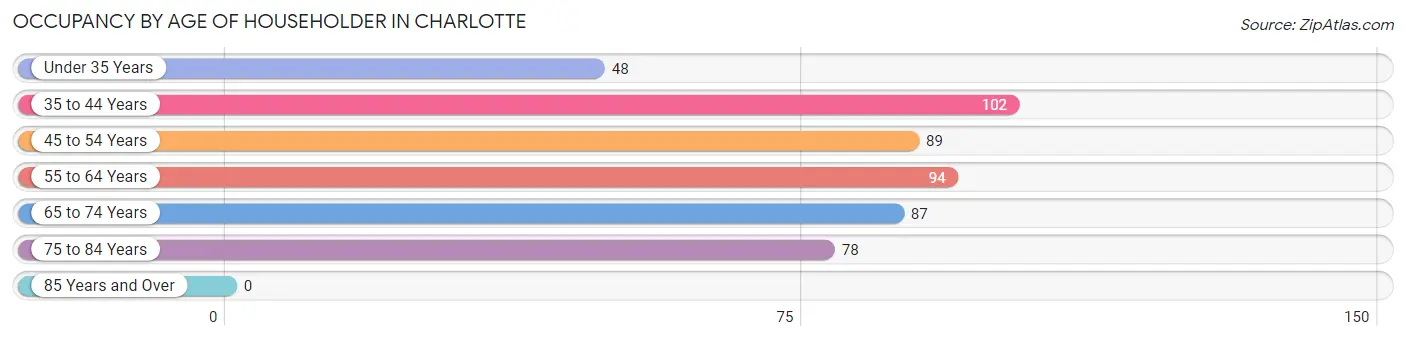
| Age Bracket | # Households | % Households |
| Under 35 Years | 48 | 9.6% |
| 35 to 44 Years | 102 | 20.5% |
| 45 to 54 Years | 89 | 17.9% |
| 55 to 64 Years | 94 | 18.9% |
| 65 to 74 Years | 87 | 17.5% |
| 75 to 84 Years | 78 | 15.7% |
| 85 Years and Over | 0 | 0.0% |
| Total | 498 | 100.0% |
Housing Finances in Charlotte
Median Income by Occupancy in Charlotte
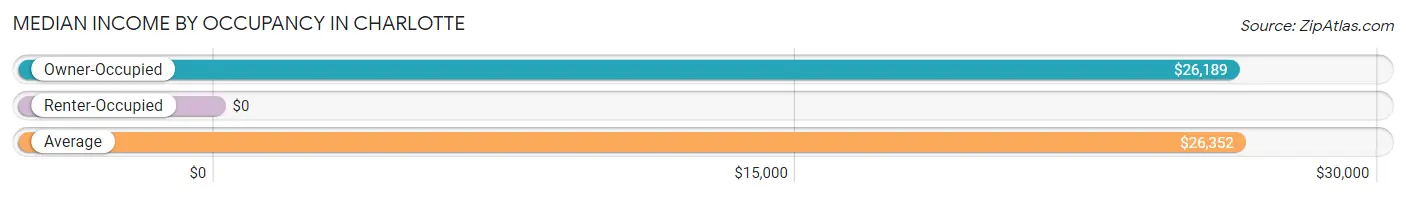
| Occupancy Type | # Households | Median Income |
| Owner-Occupied | 474 (95.2%) | $26,189 |
| Renter-Occupied | 24 (4.8%) | $0 |
| Average | 498 (100.0%) | $26,352 |
Occupancy by Householder Income Bracket in Charlotte
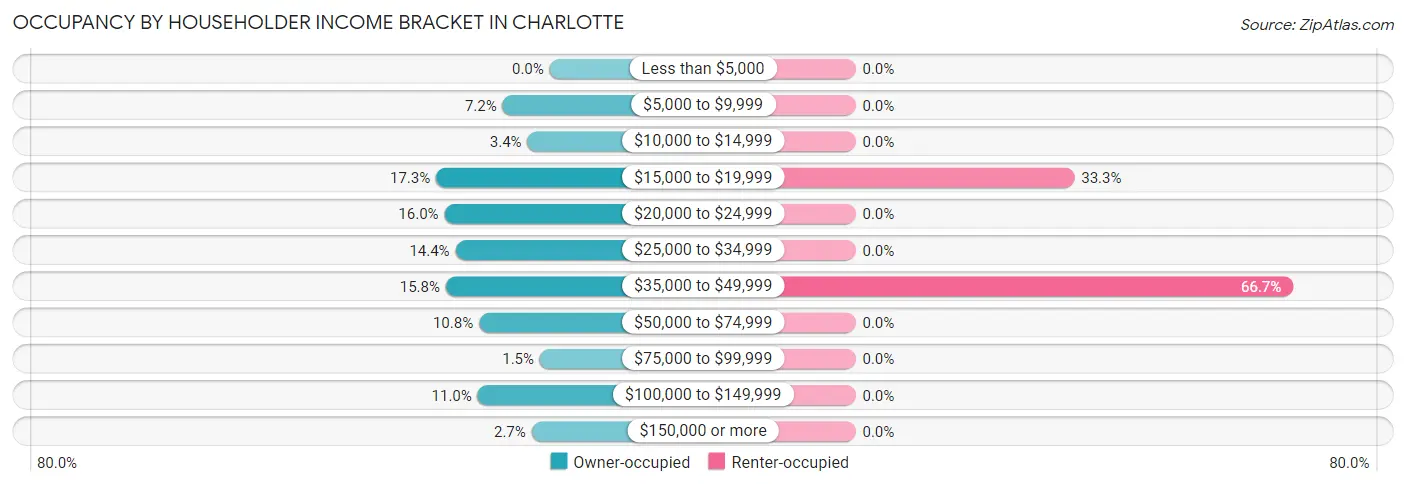
| Income Bracket | Owner-occupied | Renter-occupied |
| Less than $5,000 | 0 (0.0%) | 0 (0.0%) |
| $5,000 to $9,999 | 34 (7.2%) | 0 (0.0%) |
| $10,000 to $14,999 | 16 (3.4%) | 0 (0.0%) |
| $15,000 to $19,999 | 82 (17.3%) | 8 (33.3%) |
| $20,000 to $24,999 | 76 (16.0%) | 0 (0.0%) |
| $25,000 to $34,999 | 68 (14.3%) | 0 (0.0%) |
| $35,000 to $49,999 | 75 (15.8%) | 16 (66.7%) |
| $50,000 to $74,999 | 51 (10.8%) | 0 (0.0%) |
| $75,000 to $99,999 | 7 (1.5%) | 0 (0.0%) |
| $100,000 to $149,999 | 52 (11.0%) | 0 (0.0%) |
| $150,000 or more | 13 (2.7%) | 0 (0.0%) |
| Total | 474 (100.0%) | 24 (100.0%) |
Monthly Housing Cost Tiers in Charlotte
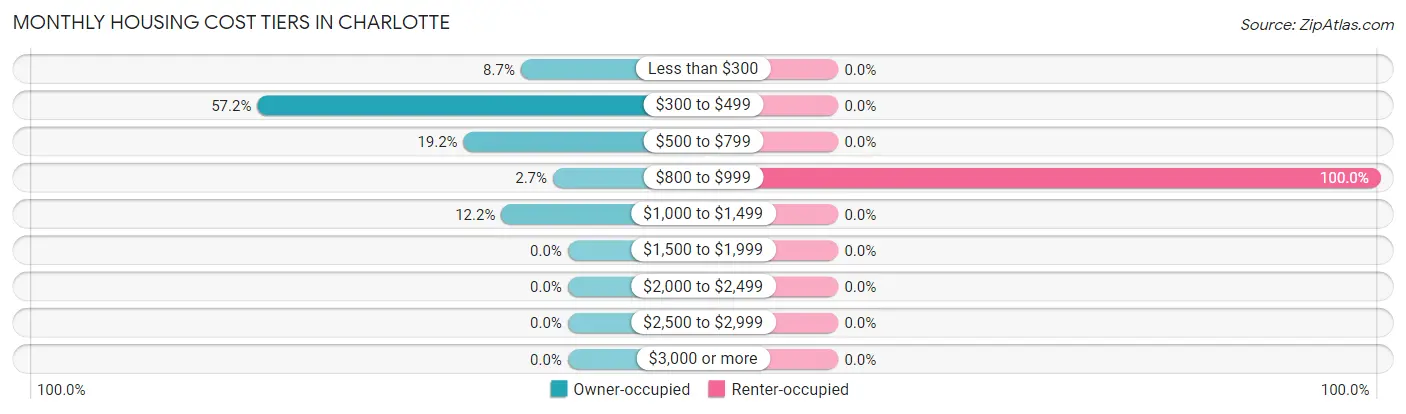
| Monthly Cost | Owner-occupied | Renter-occupied |
| Less than $300 | 41 (8.6%) | 0 (0.0%) |
| $300 to $499 | 271 (57.2%) | 0 (0.0%) |
| $500 to $799 | 91 (19.2%) | 0 (0.0%) |
| $800 to $999 | 13 (2.7%) | 24 (100.0%) |
| $1,000 to $1,499 | 58 (12.2%) | 0 (0.0%) |
| $1,500 to $1,999 | 0 (0.0%) | 0 (0.0%) |
| $2,000 to $2,499 | 0 (0.0%) | 0 (0.0%) |
| $2,500 to $2,999 | 0 (0.0%) | 0 (0.0%) |
| $3,000 or more | 0 (0.0%) | 0 (0.0%) |
| Total | 474 (100.0%) | 24 (100.0%) |
Physical Housing Characteristics in Charlotte
Housing Structures in Charlotte
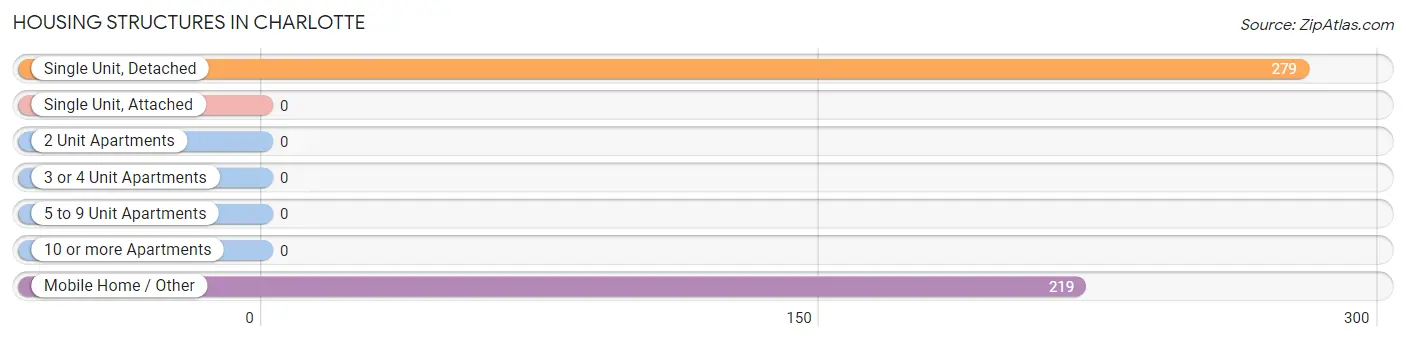
| Structure Type | # Housing Units | % Housing Units |
| Single Unit, Detached | 279 | 56.0% |
| Single Unit, Attached | 0 | 0.0% |
| 2 Unit Apartments | 0 | 0.0% |
| 3 or 4 Unit Apartments | 0 | 0.0% |
| 5 to 9 Unit Apartments | 0 | 0.0% |
| 10 or more Apartments | 0 | 0.0% |
| Mobile Home / Other | 219 | 44.0% |
| Total | 498 | 100.0% |
Housing Structures by Occupancy in Charlotte
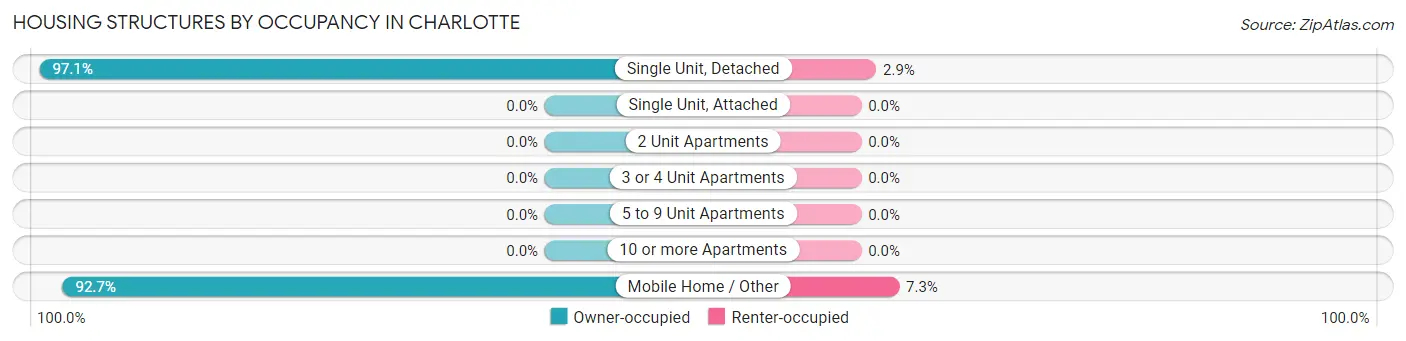
| Structure Type | Owner-occupied | Renter-occupied |
| Single Unit, Detached | 271 (97.1%) | 8 (2.9%) |
| Single Unit, Attached | 0 (0.0%) | 0 (0.0%) |
| 2 Unit Apartments | 0 (0.0%) | 0 (0.0%) |
| 3 or 4 Unit Apartments | 0 (0.0%) | 0 (0.0%) |
| 5 to 9 Unit Apartments | 0 (0.0%) | 0 (0.0%) |
| 10 or more Apartments | 0 (0.0%) | 0 (0.0%) |
| Mobile Home / Other | 203 (92.7%) | 16 (7.3%) |
| Total | 474 (95.2%) | 24 (4.8%) |
Housing Structures by Number of Rooms in Charlotte
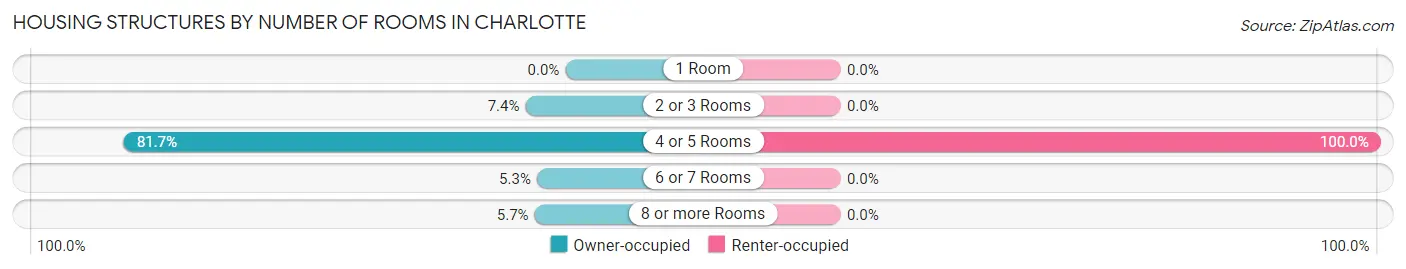
| Number of Rooms | Owner-occupied | Renter-occupied |
| 1 Room | 0 (0.0%) | 0 (0.0%) |
| 2 or 3 Rooms | 35 (7.4%) | 0 (0.0%) |
| 4 or 5 Rooms | 387 (81.7%) | 24 (100.0%) |
| 6 or 7 Rooms | 25 (5.3%) | 0 (0.0%) |
| 8 or more Rooms | 27 (5.7%) | 0 (0.0%) |
| Total | 474 (100.0%) | 24 (100.0%) |
Housing Structure by Heating Type in Charlotte
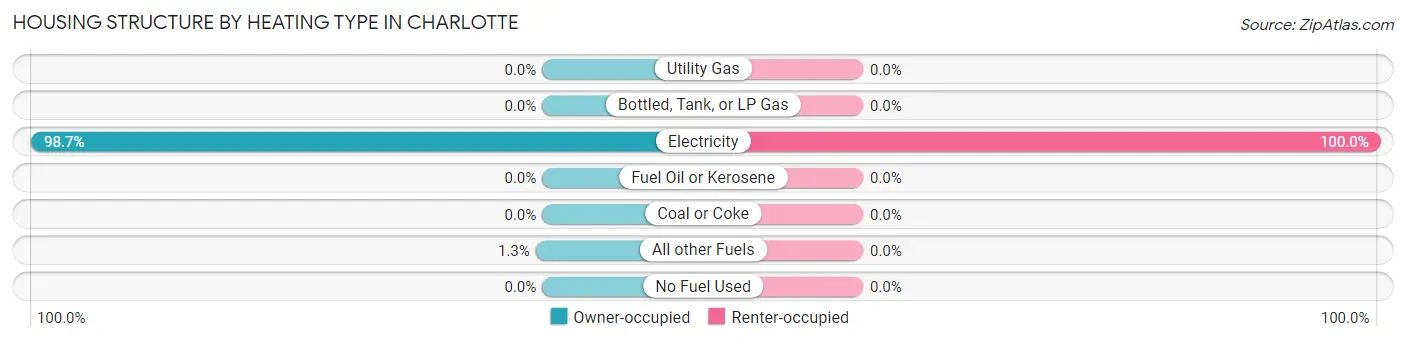
| Heating Type | Owner-occupied | Renter-occupied |
| Utility Gas | 0 (0.0%) | 0 (0.0%) |
| Bottled, Tank, or LP Gas | 0 (0.0%) | 0 (0.0%) |
| Electricity | 468 (98.7%) | 24 (100.0%) |
| Fuel Oil or Kerosene | 0 (0.0%) | 0 (0.0%) |
| Coal or Coke | 0 (0.0%) | 0 (0.0%) |
| All other Fuels | 6 (1.3%) | 0 (0.0%) |
| No Fuel Used | 0 (0.0%) | 0 (0.0%) |
| Total | 474 (100.0%) | 24 (100.0%) |
Household Vehicle Usage in Charlotte
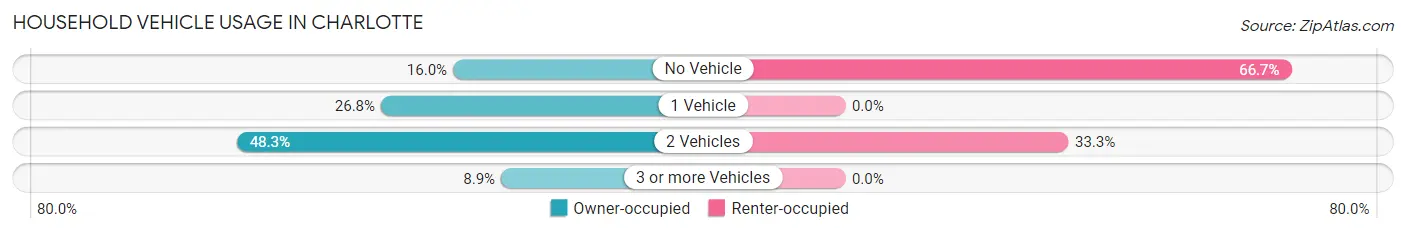
| Vehicles per Household | Owner-occupied | Renter-occupied |
| No Vehicle | 76 (16.0%) | 16 (66.7%) |
| 1 Vehicle | 127 (26.8%) | 0 (0.0%) |
| 2 Vehicles | 229 (48.3%) | 8 (33.3%) |
| 3 or more Vehicles | 42 (8.9%) | 0 (0.0%) |
| Total | 474 (100.0%) | 24 (100.0%) |
Real Estate & Mortgages in Charlotte
Real Estate and Mortgage Overview in Charlotte
| Characteristic | Without Mortgage | With Mortgage |
| Housing Units | 403 | 71 |
| Median Property Value | $52,600 | $0 |
| Median Household Income | $25,102 | $6 |
| Monthly Housing Costs | $412 | $0 |
| Real Estate Taxes | $975 | $0 |
Property Value by Mortgage Status in Charlotte
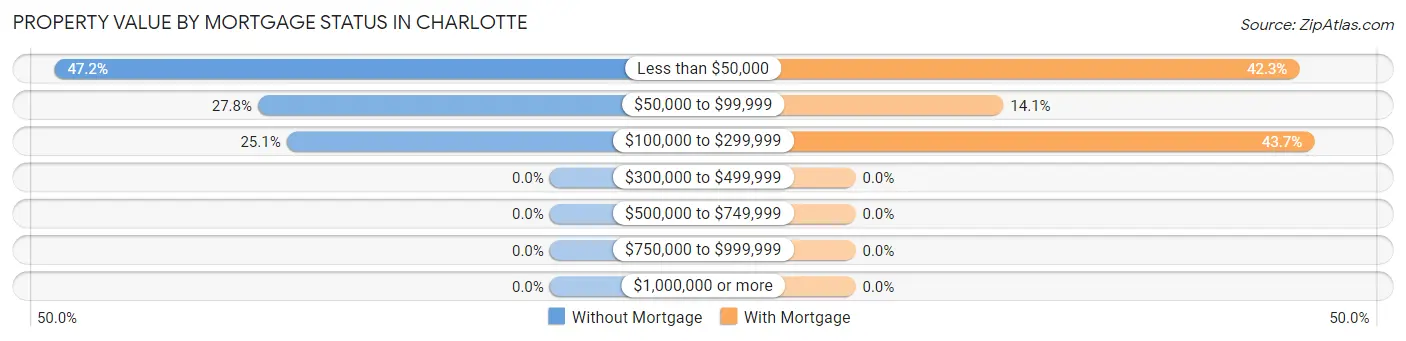
| Property Value | Without Mortgage | With Mortgage |
| Less than $50,000 | 190 (47.1%) | 30 (42.2%) |
| $50,000 to $99,999 | 112 (27.8%) | 10 (14.1%) |
| $100,000 to $299,999 | 101 (25.1%) | 31 (43.7%) |
| $300,000 to $499,999 | 0 (0.0%) | 0 (0.0%) |
| $500,000 to $749,999 | 0 (0.0%) | 0 (0.0%) |
| $750,000 to $999,999 | 0 (0.0%) | 0 (0.0%) |
| $1,000,000 or more | 0 (0.0%) | 0 (0.0%) |
| Total | 403 (100.0%) | 71 (100.0%) |
Household Income by Mortgage Status in Charlotte
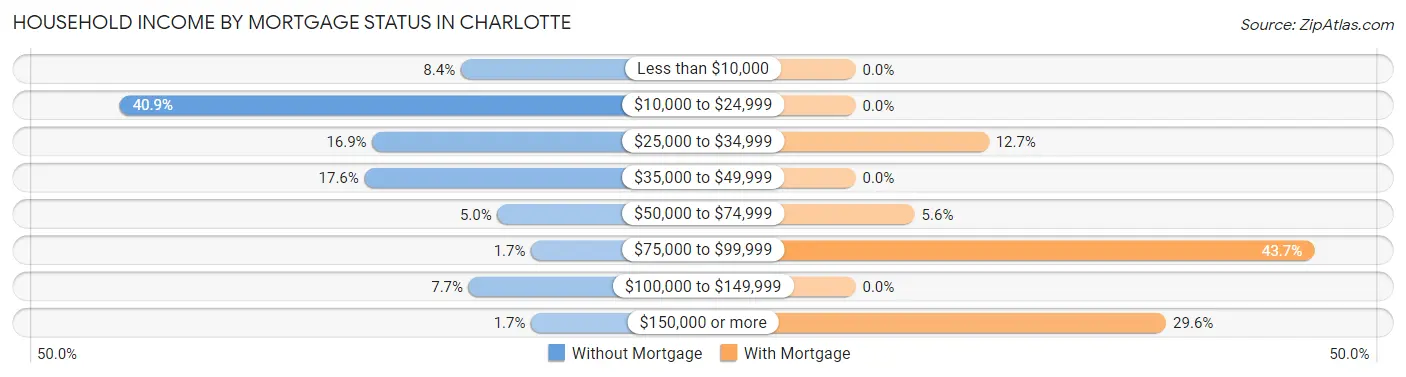
| Household Income | Without Mortgage | With Mortgage |
| Less than $10,000 | 34 (8.4%) | 0 (0.0%) |
| $10,000 to $24,999 | 165 (40.9%) | 0 (0.0%) |
| $25,000 to $34,999 | 68 (16.9%) | 9 (12.7%) |
| $35,000 to $49,999 | 71 (17.6%) | 0 (0.0%) |
| $50,000 to $74,999 | 20 (5.0%) | 4 (5.6%) |
| $75,000 to $99,999 | 7 (1.7%) | 31 (43.7%) |
| $100,000 to $149,999 | 31 (7.7%) | 0 (0.0%) |
| $150,000 or more | 7 (1.7%) | 21 (29.6%) |
| Total | 403 (100.0%) | 71 (100.0%) |
Property Value to Household Income Ratio in Charlotte
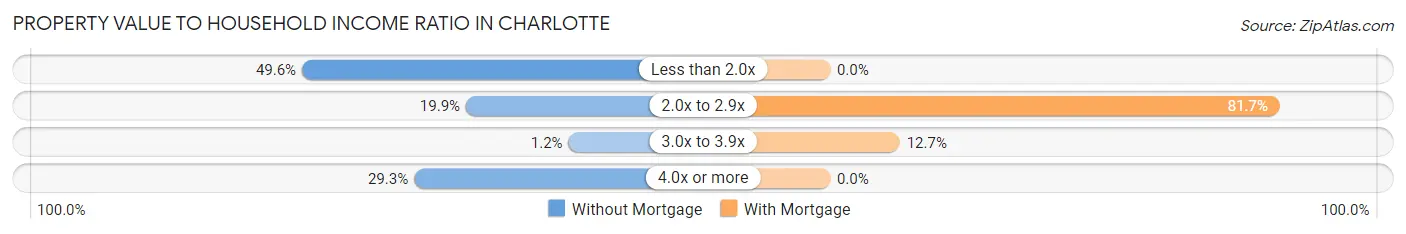
| Value-to-Income Ratio | Without Mortgage | With Mortgage |
| Less than 2.0x | 200 (49.6%) | 0 (0.0%) |
| 2.0x to 2.9x | 80 (19.9%) | 58 (81.7%) |
| 3.0x to 3.9x | 5 (1.2%) | 9 (12.7%) |
| 4.0x or more | 118 (29.3%) | 0 (0.0%) |
| Total | 403 (100.0%) | 71 (100.0%) |
Real Estate Taxes by Mortgage Status in Charlotte
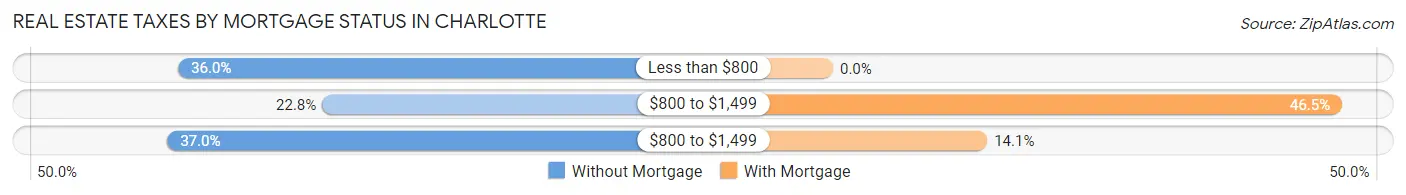
| Property Taxes | Without Mortgage | With Mortgage |
| Less than $800 | 145 (36.0%) | 0 (0.0%) |
| $800 to $1,499 | 92 (22.8%) | 33 (46.5%) |
| $800 to $1,499 | 149 (37.0%) | 10 (14.1%) |
| Total | 403 (100.0%) | 71 (100.0%) |
Health & Disability in Charlotte
Health Insurance Coverage by Age in Charlotte
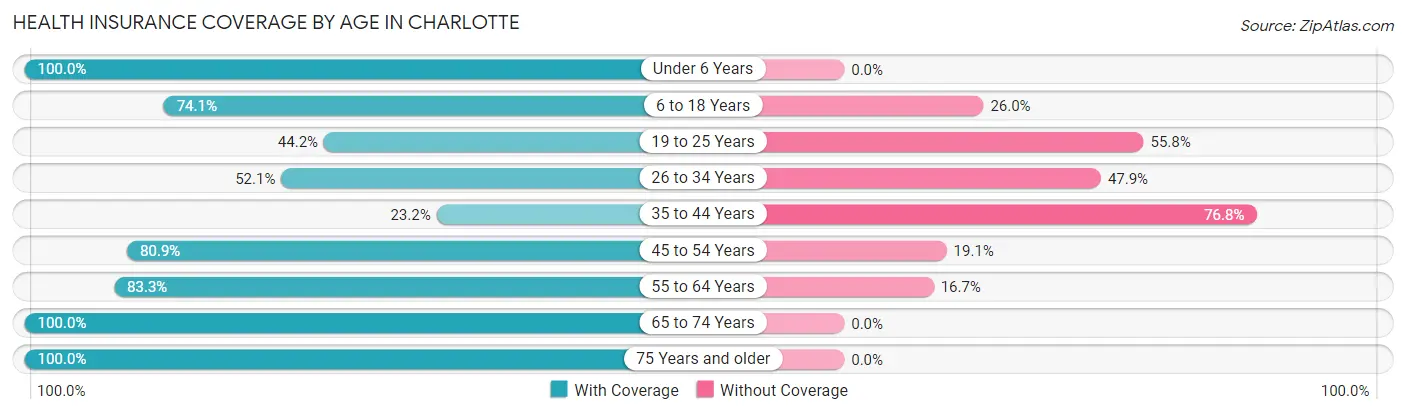
| Age Bracket | With Coverage | Without Coverage |
| Under 6 Years | 31 (100.0%) | 0 (0.0%) |
| 6 to 18 Years | 274 (74.1%) | 96 (26.0%) |
| 19 to 25 Years | 76 (44.2%) | 96 (55.8%) |
| 26 to 34 Years | 61 (52.1%) | 56 (47.9%) |
| 35 to 44 Years | 32 (23.2%) | 106 (76.8%) |
| 45 to 54 Years | 89 (80.9%) | 21 (19.1%) |
| 55 to 64 Years | 130 (83.3%) | 26 (16.7%) |
| 65 to 74 Years | 129 (100.0%) | 0 (0.0%) |
| 75 Years and older | 101 (100.0%) | 0 (0.0%) |
| Total | 923 (69.7%) | 401 (30.3%) |
Health Insurance Coverage by Citizenship Status in Charlotte

| Citizenship Status | With Coverage | Without Coverage |
| Native Born | 31 (100.0%) | 0 (0.0%) |
| Foreign Born, Citizen | 274 (74.1%) | 96 (26.0%) |
| Foreign Born, not a Citizen | 76 (44.2%) | 96 (55.8%) |
Health Insurance Coverage by Household Income in Charlotte
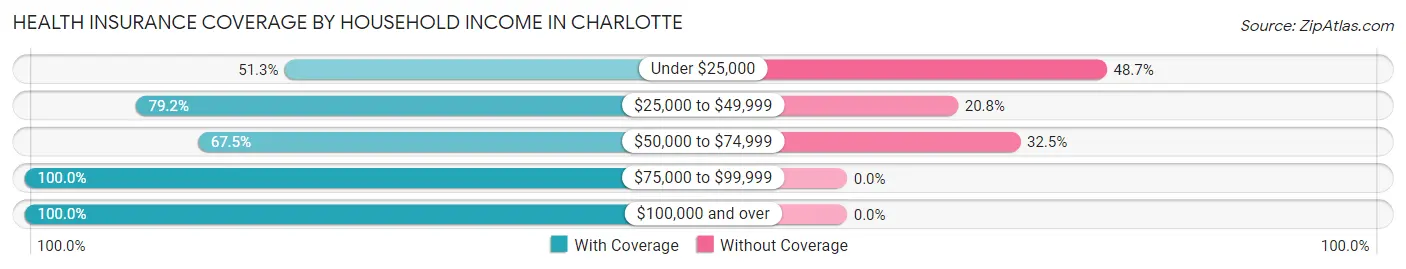
| Household Income | With Coverage | Without Coverage |
| Under $25,000 | 269 (51.3%) | 255 (48.7%) |
| $25,000 to $49,999 | 320 (79.2%) | 84 (20.8%) |
| $50,000 to $74,999 | 129 (67.5%) | 62 (32.5%) |
| $75,000 to $99,999 | 36 (100.0%) | 0 (0.0%) |
| $100,000 and over | 169 (100.0%) | 0 (0.0%) |
Public vs Private Health Insurance Coverage by Age in Charlotte
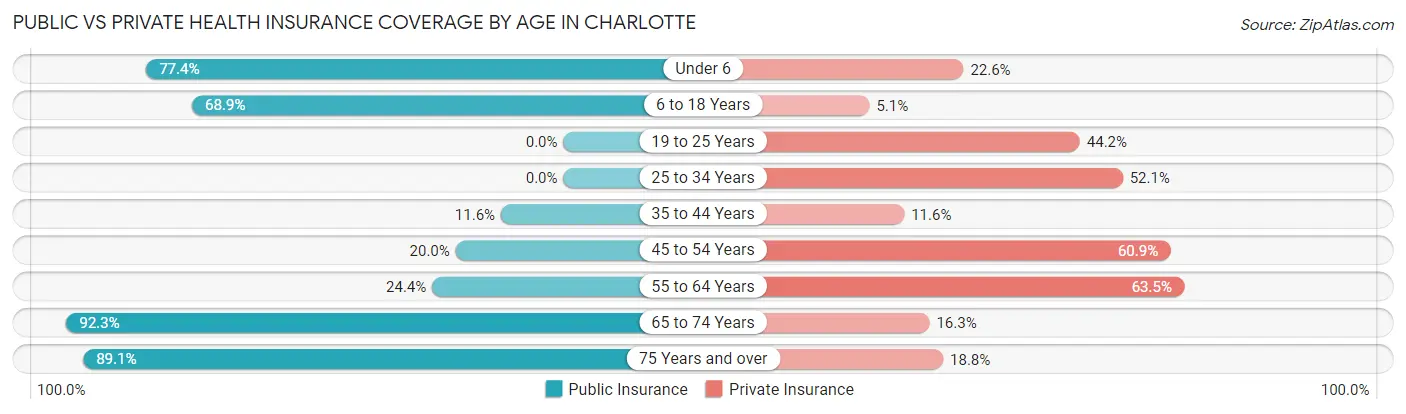
| Age Bracket | Public Insurance | Private Insurance |
| Under 6 | 24 (77.4%) | 7 (22.6%) |
| 6 to 18 Years | 255 (68.9%) | 19 (5.1%) |
| 19 to 25 Years | 0 (0.0%) | 76 (44.2%) |
| 25 to 34 Years | 0 (0.0%) | 61 (52.1%) |
| 35 to 44 Years | 16 (11.6%) | 16 (11.6%) |
| 45 to 54 Years | 22 (20.0%) | 67 (60.9%) |
| 55 to 64 Years | 38 (24.4%) | 99 (63.5%) |
| 65 to 74 Years | 119 (92.2%) | 21 (16.3%) |
| 75 Years and over | 90 (89.1%) | 19 (18.8%) |
| Total | 564 (42.6%) | 385 (29.1%) |
Disability Status by Sex by Age in Charlotte
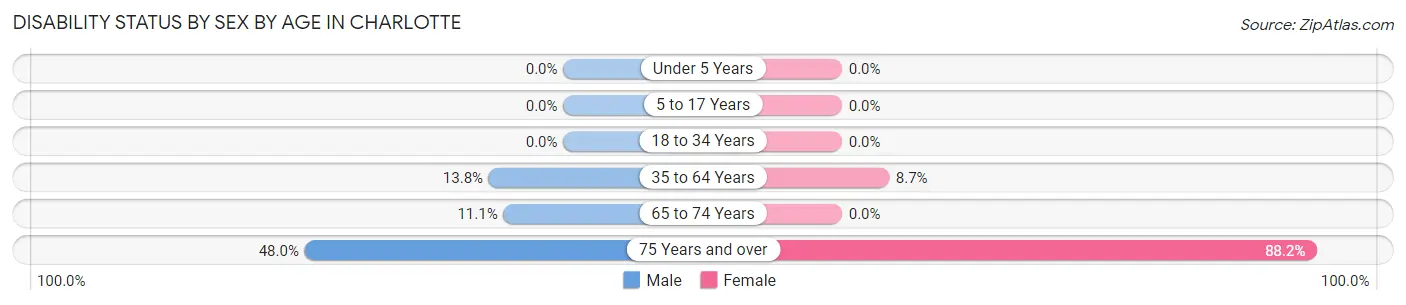
| Age Bracket | Male | Female |
| Under 5 Years | 0 (0.0%) | 0 (0.0%) |
| 5 to 17 Years | 0 (0.0%) | 0 (0.0%) |
| 18 to 34 Years | 0 (0.0%) | 0 (0.0%) |
| 35 to 64 Years | 21 (13.8%) | 22 (8.7%) |
| 65 to 74 Years | 5 (11.1%) | 0 (0.0%) |
| 75 Years and over | 24 (48.0%) | 45 (88.2%) |
Disability Class by Sex by Age in Charlotte
Disability Class: Hearing Difficulty
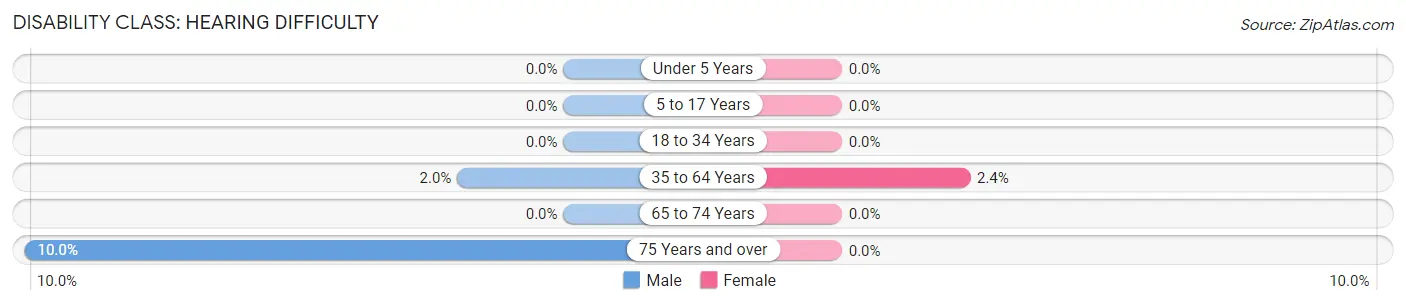
| Age Bracket | Male | Female |
| Under 5 Years | 0 (0.0%) | 0 (0.0%) |
| 5 to 17 Years | 0 (0.0%) | 0 (0.0%) |
| 18 to 34 Years | 0 (0.0%) | 0 (0.0%) |
| 35 to 64 Years | 3 (2.0%) | 6 (2.4%) |
| 65 to 74 Years | 0 (0.0%) | 0 (0.0%) |
| 75 Years and over | 5 (10.0%) | 0 (0.0%) |
Disability Class: Vision Difficulty
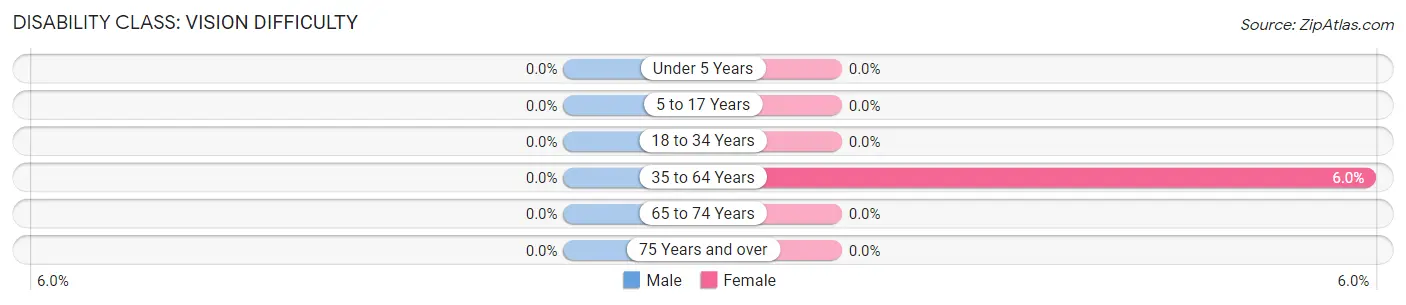
| Age Bracket | Male | Female |
| Under 5 Years | 0 (0.0%) | 0 (0.0%) |
| 5 to 17 Years | 0 (0.0%) | 0 (0.0%) |
| 18 to 34 Years | 0 (0.0%) | 0 (0.0%) |
| 35 to 64 Years | 0 (0.0%) | 15 (5.9%) |
| 65 to 74 Years | 0 (0.0%) | 0 (0.0%) |
| 75 Years and over | 0 (0.0%) | 0 (0.0%) |
Disability Class: Cognitive Difficulty
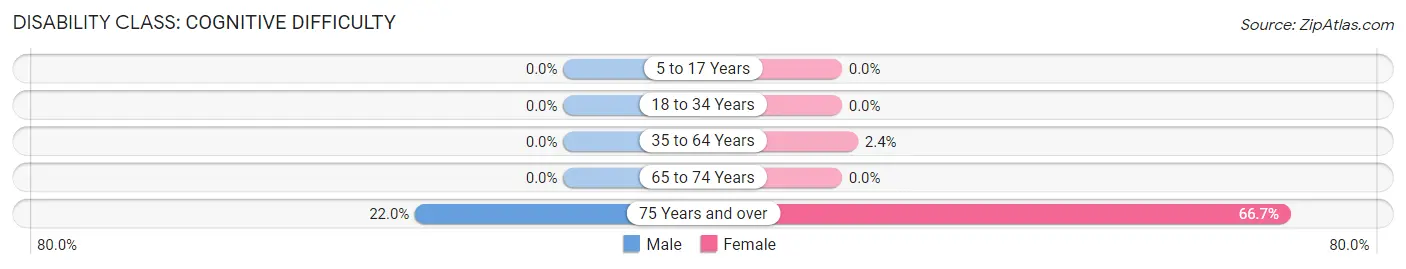
| Age Bracket | Male | Female |
| 5 to 17 Years | 0 (0.0%) | 0 (0.0%) |
| 18 to 34 Years | 0 (0.0%) | 0 (0.0%) |
| 35 to 64 Years | 0 (0.0%) | 6 (2.4%) |
| 65 to 74 Years | 0 (0.0%) | 0 (0.0%) |
| 75 Years and over | 11 (22.0%) | 34 (66.7%) |
Disability Class: Ambulatory Difficulty
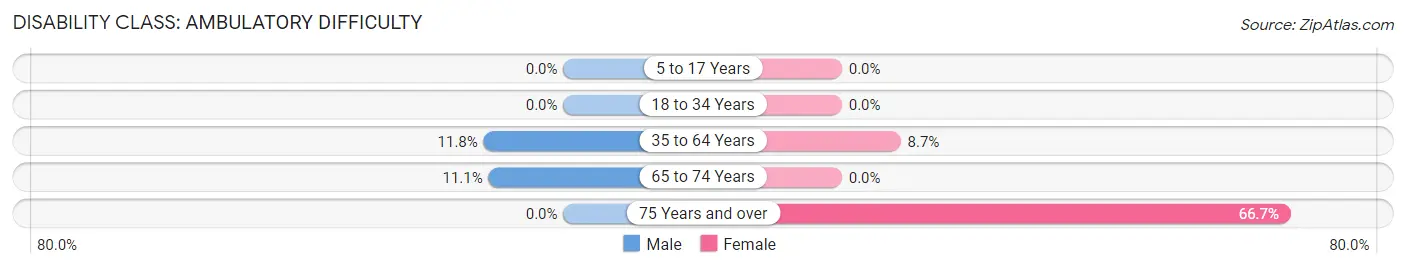
| Age Bracket | Male | Female |
| 5 to 17 Years | 0 (0.0%) | 0 (0.0%) |
| 18 to 34 Years | 0 (0.0%) | 0 (0.0%) |
| 35 to 64 Years | 18 (11.8%) | 22 (8.7%) |
| 65 to 74 Years | 5 (11.1%) | 0 (0.0%) |
| 75 Years and over | 0 (0.0%) | 34 (66.7%) |
Disability Class: Self-Care Difficulty
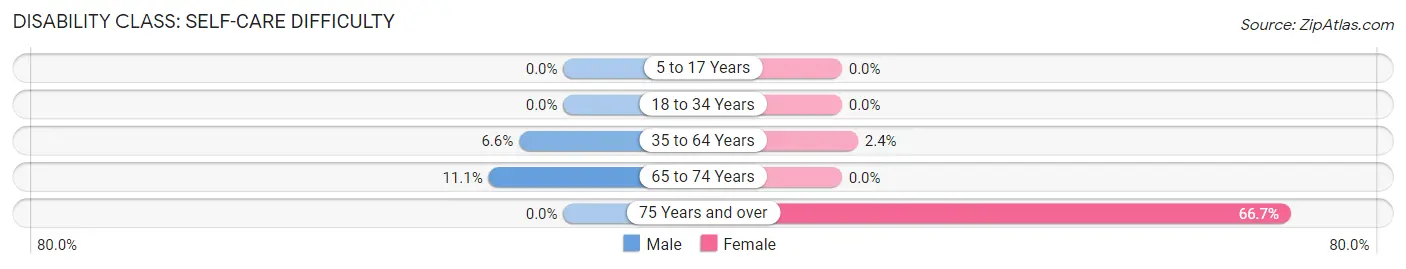
| Age Bracket | Male | Female |
| 5 to 17 Years | 0 (0.0%) | 0 (0.0%) |
| 18 to 34 Years | 0 (0.0%) | 0 (0.0%) |
| 35 to 64 Years | 10 (6.6%) | 6 (2.4%) |
| 65 to 74 Years | 5 (11.1%) | 0 (0.0%) |
| 75 Years and over | 0 (0.0%) | 34 (66.7%) |
Technology Access in Charlotte
Computing Device Access in Charlotte
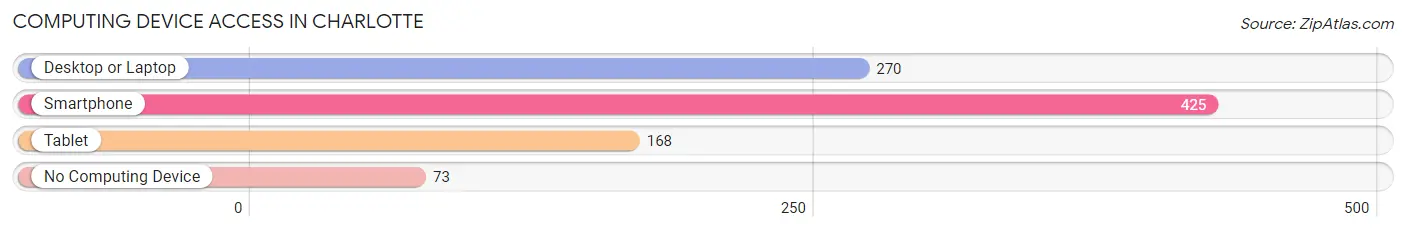
| Device Type | # Households | % Households |
| Desktop or Laptop | 270 | 54.2% |
| Smartphone | 425 | 85.3% |
| Tablet | 168 | 33.7% |
| No Computing Device | 73 | 14.7% |
| Total | 498 | 100.0% |
Internet Access in Charlotte
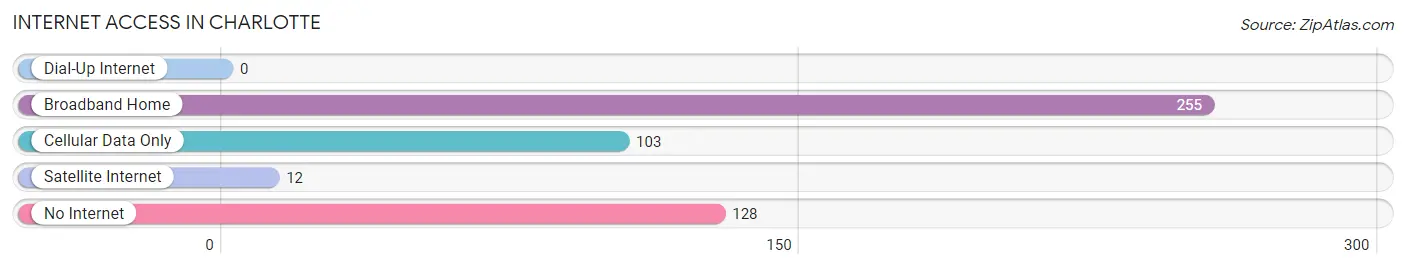
| Internet Type | # Households | % Households |
| Dial-Up Internet | 0 | 0.0% |
| Broadband Home | 255 | 51.2% |
| Cellular Data Only | 103 | 20.7% |
| Satellite Internet | 12 | 2.4% |
| No Internet | 128 | 25.7% |
| Total | 498 | 100.0% |
Charlotte Summary
Charlotte, Texas is a small town located in the southeastern corner of San Patricio County, Texas. It is situated on the banks of the Nueces River, approximately 30 miles south of Corpus Christi. The town was founded in 1852 and named after Charlotte, the daughter of a local rancher. The population of Charlotte was estimated to be 1,093 in 2019.
History
Charlotte was founded in 1852 by a group of settlers from the nearby town of Refugio. The settlers were led by a man named William H. King, who named the town after his daughter, Charlotte. The town was originally located on the banks of the Nueces River, but was moved to its current location in 1854 due to flooding.
In the late 1800s, Charlotte was a thriving agricultural community, with cotton, corn, and sugar cane being the main crops. The town also had a number of businesses, including a general store, a blacksmith shop, and a hotel.
In the early 1900s, Charlotte began to experience a decline in population due to the Great Depression and the Dust Bowl. The population of Charlotte dropped from 1,000 in 1930 to just 500 in 1940.
In the 1950s, Charlotte began to experience a resurgence in population and economic activity. The town was home to a number of businesses, including a cotton gin, a feed mill, and a lumber yard. The population of Charlotte increased to 1,000 in 1960.
Geography
Charlotte is located in the southeastern corner of San Patricio County, Texas. It is situated on the banks of the Nueces River, approximately 30 miles south of Corpus Christi. The town is surrounded by farmland and is located near the Gulf of Mexico.
The climate in Charlotte is subtropical, with hot summers and mild winters. The average temperature in the summer is around 90 degrees Fahrenheit, while the average temperature in the winter is around 60 degrees Fahrenheit.
Economy
The economy of Charlotte is largely based on agriculture. The town is home to a number of farms, which produce cotton, corn, and sugar cane. The town also has a number of businesses, including a feed mill, a lumber yard, and a cotton gin.
In addition to agriculture, Charlotte is home to a number of small businesses, including restaurants, retail stores, and auto repair shops. The town is also home to a number of manufacturing companies, including a plastics factory and a metal fabrication plant.
Demographics
As of 2019, the population of Charlotte was estimated to be 1,093. The town is predominantly white, with approximately 85% of the population being white. The remaining 15% of the population is made up of African Americans, Hispanics, and other ethnicities.
The median household income in Charlotte is $41,000, which is slightly lower than the national average. The median home value in Charlotte is $90,000, which is also lower than the national average. The town has a poverty rate of 17.5%, which is higher than the national average.
Common Questions
What is Per Capita Income in Charlotte?
Per Capita income in Charlotte is $16,415.
What is the Median Family Income in Charlotte?
Median Family Income in Charlotte is $26,939.
What is the Median Household income in Charlotte?
Median Household Income in Charlotte is $26,352.
What is Income or Wage Gap in Charlotte?
Income or Wage Gap in Charlotte is 35.7%.
Women in Charlotte earn 64.3 cents for every dollar earned by a man.
What is Inequality or Gini Index in Charlotte?
Inequality or Gini Index in Charlotte is 0.44.
What is the Total Population of Charlotte?
Total Population of Charlotte is 1,324.
What is the Total Male Population of Charlotte?
Total Male Population of Charlotte is 674.
What is the Total Female Population of Charlotte?
Total Female Population of Charlotte is 650.
What is the Ratio of Males per 100 Females in Charlotte?
There are 103.69 Males per 100 Females in Charlotte.
What is the Ratio of Females per 100 Males in Charlotte?
There are 96.44 Females per 100 Males in Charlotte.
What is the Median Population Age in Charlotte?
Median Population Age in Charlotte is 33.2 Years.
What is the Average Family Size in Charlotte
Average Family Size in Charlotte is 3.3 People.
What is the Average Household Size in Charlotte
Average Household Size in Charlotte is 2.7 People.
How Large is the Labor Force in Charlotte?
There are 559 People in the Labor Forcein in Charlotte.
What is the Percentage of People in the Labor Force in Charlotte?
53.7% of People are in the Labor Force in Charlotte.
What is the Unemployment Rate in Charlotte?
Unemployment Rate in Charlotte is 6.1%.