Hawaiian Ocean View, HI Map & Demographics
Hawaiian Ocean View Map
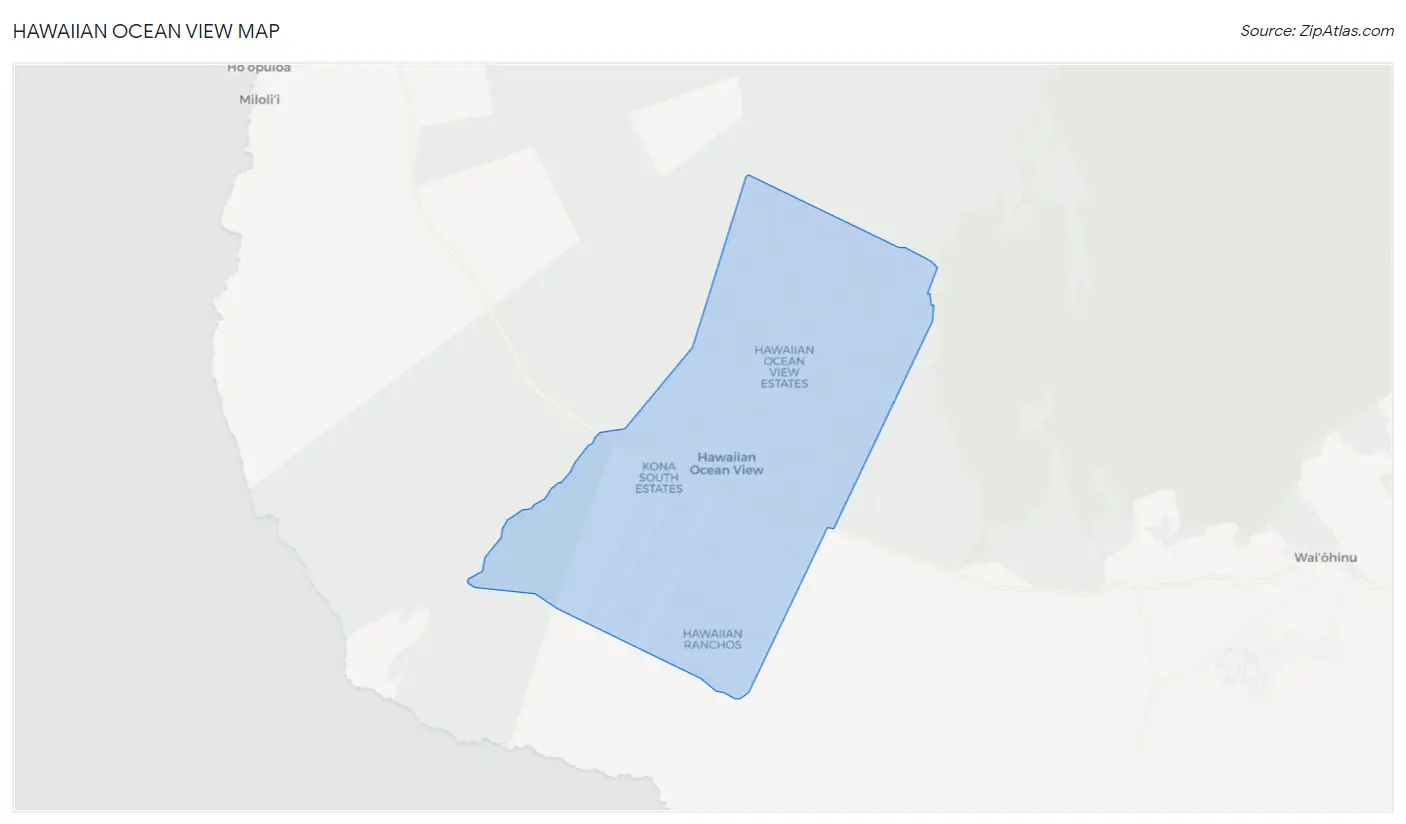
Hawaiian Ocean View Overview
$23,132
PER CAPITA INCOME
$44,250
AVG FAMILY INCOME
$36,462
AVG HOUSEHOLD INCOME
32.8%
WAGE / INCOME GAP [ % ]
67.2¢/ $1
WAGE / INCOME GAP [ $ ]
0.45
INEQUALITY / GINI INDEX
3,587
TOTAL POPULATION
1,832
MALE POPULATION
1,755
FEMALE POPULATION
104.39
MALES / 100 FEMALES
95.80
FEMALES / 100 MALES
47.3
MEDIAN AGE
2.8
AVG FAMILY SIZE
2.0
AVG HOUSEHOLD SIZE
1,391
LABOR FORCE [ PEOPLE ]
47.4%
PERCENT IN LABOR FORCE
11.9%
UNEMPLOYMENT RATE
Income in Hawaiian Ocean View
Income Overview in Hawaiian Ocean View
Per Capita Income in Hawaiian Ocean View is $23,132, while median incomes of families and households are $44,250 and $36,462 respectively.
| Characteristic | Number | Measure |
| Per Capita Income | 3,587 | $23,132 |
| Median Family Income | 852 | $44,250 |
| Mean Family Income | 852 | $57,287 |
| Median Household Income | 1,749 | $36,462 |
| Mean Household Income | 1,749 | $44,411 |
| Income Deficit | 852 | $0 |
| Wage / Income Gap (%) | 3,587 | 32.83% |
| Wage / Income Gap ($) | 3,587 | 67.17¢ per $1 |
| Gini / Inequality Index | 3,587 | 0.45 |
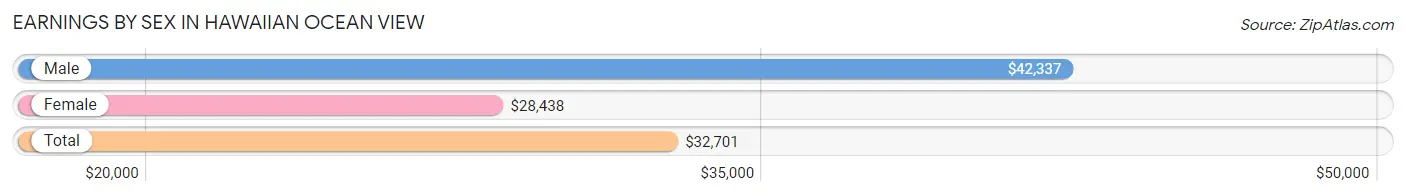
Earnings by Sex in Hawaiian Ocean View
Average Earnings in Hawaiian Ocean View are $32,701, $42,337 for men and $28,438 for women, a difference of 32.8%.
| Sex | Number | Average Earnings |
| Male | 929 (60.7%) | $42,337 |
| Female | 601 (39.3%) | $28,438 |
| Total | 1,530 (100.0%) | $32,701 |
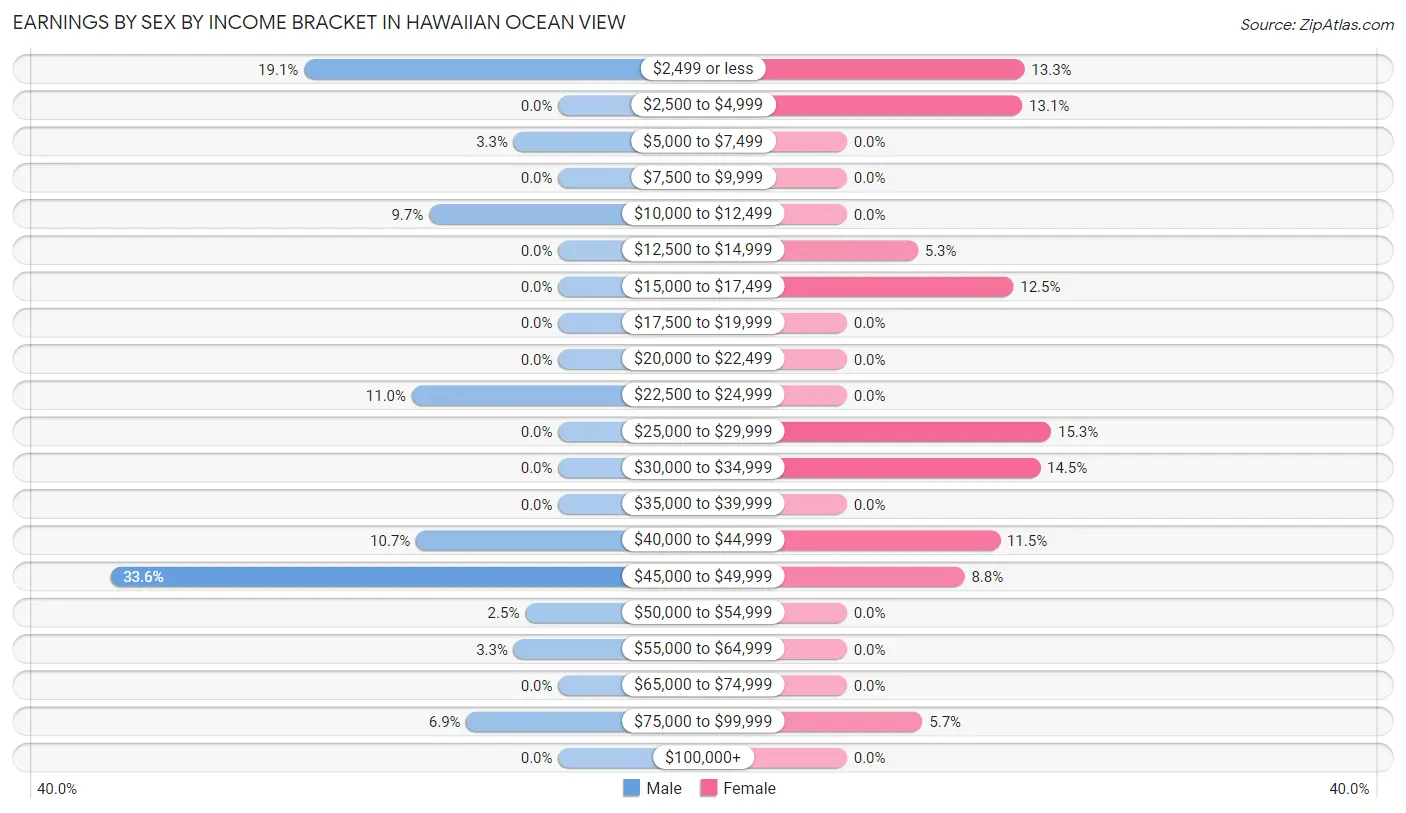
Earnings by Sex by Income Bracket in Hawaiian Ocean View
The most common earnings brackets in Hawaiian Ocean View are $45,000 to $49,999 for men (312 | 33.6%) and $25,000 to $29,999 for women (92 | 15.3%).
| Income | Male | Female |
| $2,499 or less | 177 (19.1%) | 80 (13.3%) |
| $2,500 to $4,999 | 0 (0.0%) | 79 (13.1%) |
| $5,000 to $7,499 | 31 (3.3%) | 0 (0.0%) |
| $7,500 to $9,999 | 0 (0.0%) | 0 (0.0%) |
| $10,000 to $12,499 | 90 (9.7%) | 0 (0.0%) |
| $12,500 to $14,999 | 0 (0.0%) | 32 (5.3%) |
| $15,000 to $17,499 | 0 (0.0%) | 75 (12.5%) |
| $17,500 to $19,999 | 0 (0.0%) | 0 (0.0%) |
| $20,000 to $22,499 | 0 (0.0%) | 0 (0.0%) |
| $22,500 to $24,999 | 102 (11.0%) | 0 (0.0%) |
| $25,000 to $29,999 | 0 (0.0%) | 92 (15.3%) |
| $30,000 to $34,999 | 0 (0.0%) | 87 (14.5%) |
| $35,000 to $39,999 | 0 (0.0%) | 0 (0.0%) |
| $40,000 to $44,999 | 99 (10.7%) | 69 (11.5%) |
| $45,000 to $49,999 | 312 (33.6%) | 53 (8.8%) |
| $50,000 to $54,999 | 23 (2.5%) | 0 (0.0%) |
| $55,000 to $64,999 | 31 (3.3%) | 0 (0.0%) |
| $65,000 to $74,999 | 0 (0.0%) | 0 (0.0%) |
| $75,000 to $99,999 | 64 (6.9%) | 34 (5.7%) |
| $100,000+ | 0 (0.0%) | 0 (0.0%) |
| Total | 929 (100.0%) | 601 (100.0%) |
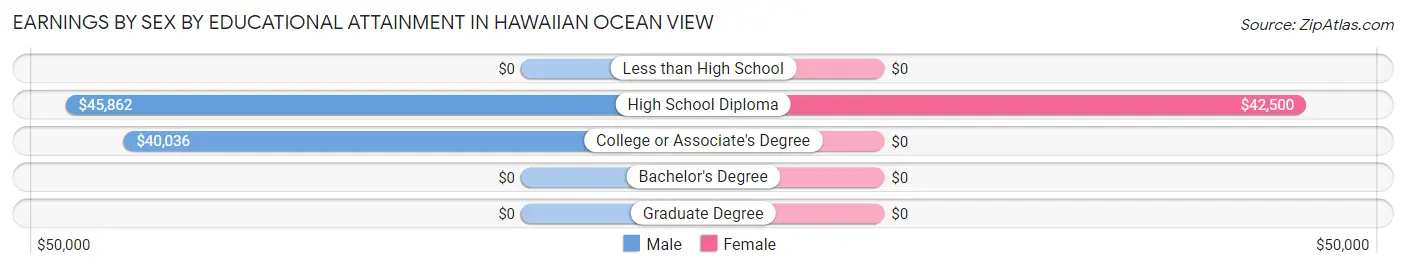
Earnings by Sex by Educational Attainment in Hawaiian Ocean View
Average earnings in Hawaiian Ocean View are $43,875 for men and $28,872 for women, a difference of 34.2%. Men with an educational attainment of high school diploma enjoy the highest average annual earnings of $45,862, while those with college or associate's degree education earn the least with $40,036. Women with an educational attainment of high school diploma earn the most with the average annual earnings of $42,500, while those with high school diploma education have the smallest earnings of $42,500.
| Educational Attainment | Male Income | Female Income |
| Less than High School | - | - |
| High School Diploma | $45,862 | $42,500 |
| College or Associate's Degree | $40,036 | $0 |
| Bachelor's Degree | - | - |
| Graduate Degree | - | - |
| Total | $43,875 | $28,872 |
Family Income in Hawaiian Ocean View
Family Income Brackets in Hawaiian Ocean View
According to the Hawaiian Ocean View family income data, there are 151 families falling into the $50,000 to $74,999 income range, which is the most common income bracket and makes up 17.7% of all families.
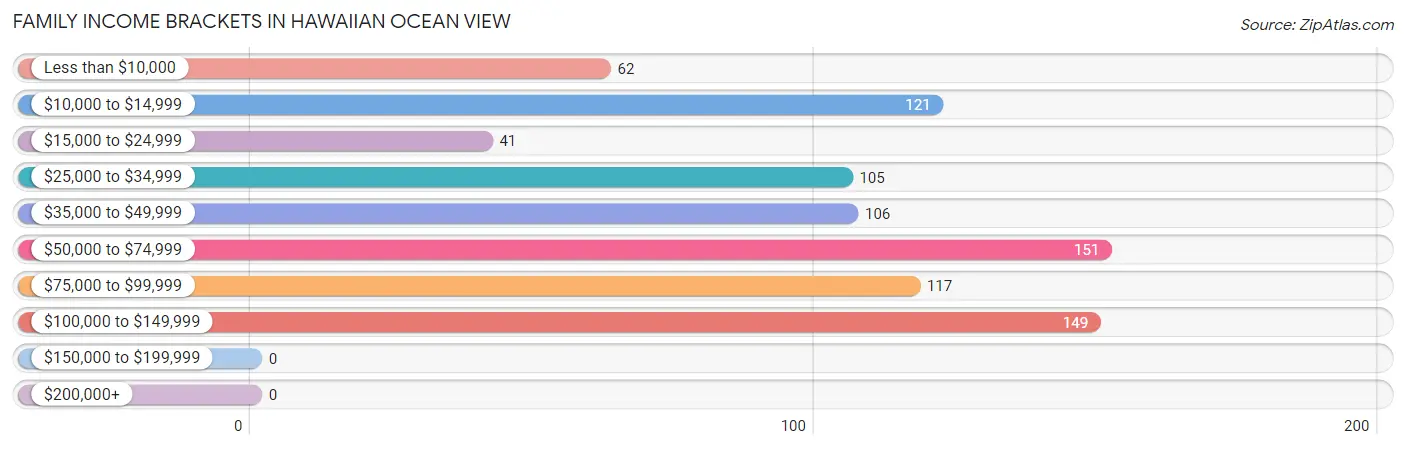
| Income Bracket | # Families | % Families |
| Less than $10,000 | 62 | 7.3% |
| $10,000 to $14,999 | 121 | 14.2% |
| $15,000 to $24,999 | 41 | 4.8% |
| $25,000 to $34,999 | 105 | 12.3% |
| $35,000 to $49,999 | 106 | 12.4% |
| $50,000 to $74,999 | 151 | 17.7% |
| $75,000 to $99,999 | 117 | 13.7% |
| $100,000 to $149,999 | 149 | 17.5% |
| $150,000 to $199,999 | 0 | 0.0% |
| $200,000+ | 0 | 0.0% |
Family Income by Famaliy Size in Hawaiian Ocean View
4-person families (120 | 14.1%) account for the highest median family income in Hawaiian Ocean View with $86,133 per family, while 4-person families (120 | 14.1%) have the highest median income of $21,533 per family member.
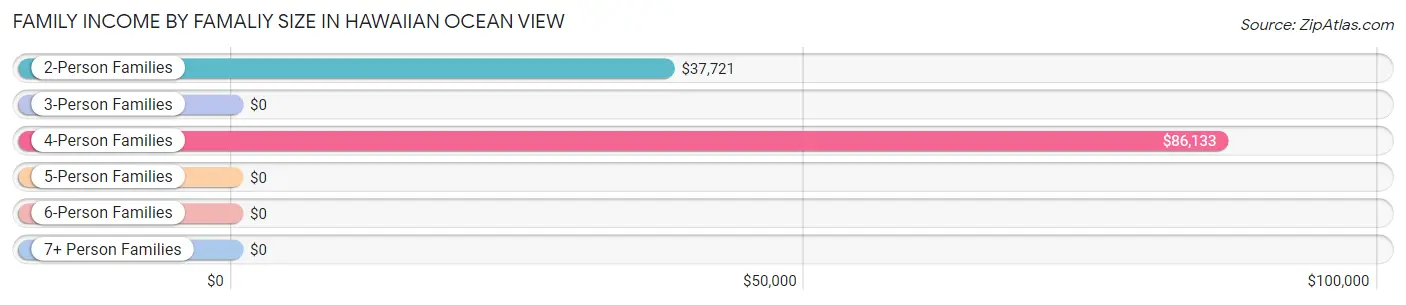
| Income Bracket | # Families | Median Income |
| 2-Person Families | 395 (46.4%) | $37,721 |
| 3-Person Families | 305 (35.8%) | $0 |
| 4-Person Families | 120 (14.1%) | $86,133 |
| 5-Person Families | 32 (3.8%) | $0 |
| 6-Person Families | 0 (0.0%) | $0 |
| 7+ Person Families | 0 (0.0%) | $0 |
| Total | 852 (100.0%) | $44,250 |
Family Income by Number of Earners in Hawaiian Ocean View
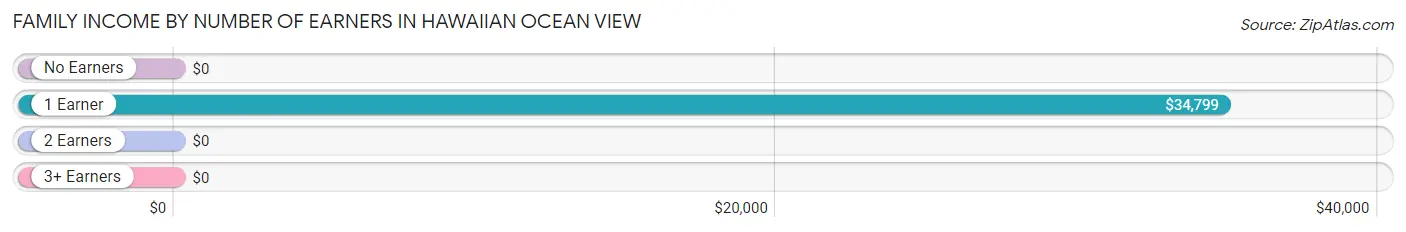
| Number of Earners | # Families | Median Income |
| No Earners | 192 (22.5%) | $0 |
| 1 Earner | 500 (58.7%) | $34,799 |
| 2 Earners | 135 (15.9%) | $0 |
| 3+ Earners | 25 (2.9%) | $0 |
| Total | 852 (100.0%) | $44,250 |
Household Income in Hawaiian Ocean View
Household Income Brackets in Hawaiian Ocean View
With 345 households falling in the category, the $50,000 to $74,999 income range is the most frequent in Hawaiian Ocean View, accounting for 19.7% of all households.
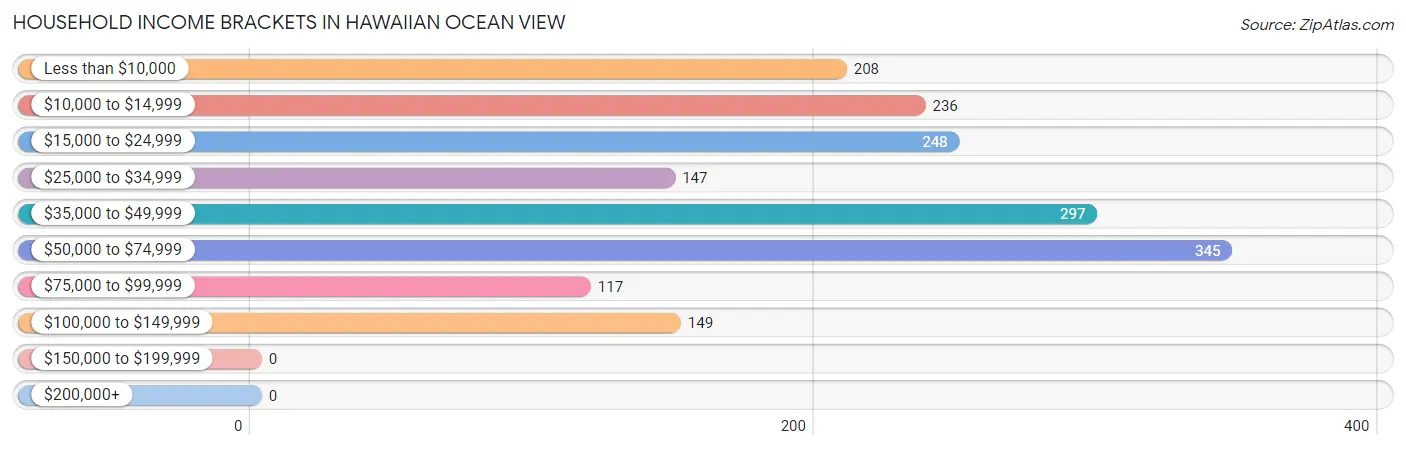
| Income Bracket | # Households | % Households |
| Less than $10,000 | 208 | 11.9% |
| $10,000 to $14,999 | 236 | 13.5% |
| $15,000 to $24,999 | 248 | 14.2% |
| $25,000 to $34,999 | 147 | 8.4% |
| $35,000 to $49,999 | 297 | 17.0% |
| $50,000 to $74,999 | 345 | 19.7% |
| $75,000 to $99,999 | 117 | 6.7% |
| $100,000 to $149,999 | 149 | 8.5% |
| $150,000 to $199,999 | 0 | 0.0% |
| $200,000+ | 0 | 0.0% |
Household Income by Householder Age in Hawaiian Ocean View
The median household income in Hawaiian Ocean View is $36,462, with the highest median household income of $43,404 found in the 65+ years age bracket for the primary householder. A total of 605 households (34.6%) fall into this category.
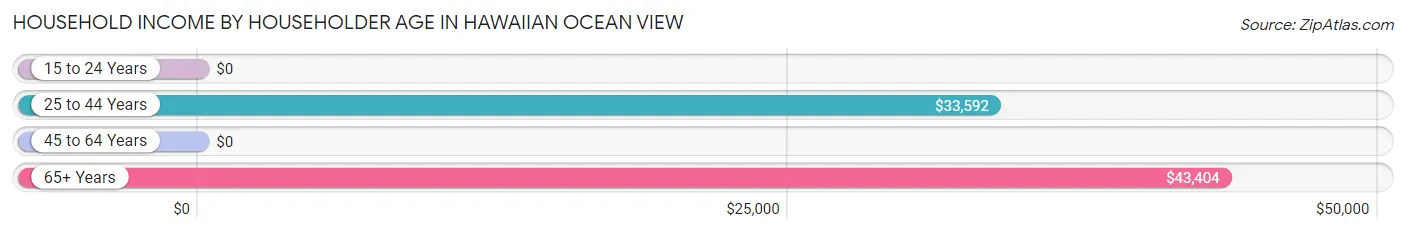
| Income Bracket | # Households | Median Income |
| 15 to 24 Years | 0 (0.0%) | $0 |
| 25 to 44 Years | 488 (27.9%) | $33,592 |
| 45 to 64 Years | 656 (37.5%) | $0 |
| 65+ Years | 605 (34.6%) | $43,404 |
| Total | 1,749 (100.0%) | $36,462 |
Poverty in Hawaiian Ocean View
Income Below Poverty by Sex and Age in Hawaiian Ocean View
With 28.5% poverty level for males and 30.4% for females among the residents of Hawaiian Ocean View, 12 to 14 year old males and 45 to 54 year old females are the most vulnerable to poverty, with 22 males (100.0%) and 104 females (52.8%) in their respective age groups living below the poverty level.
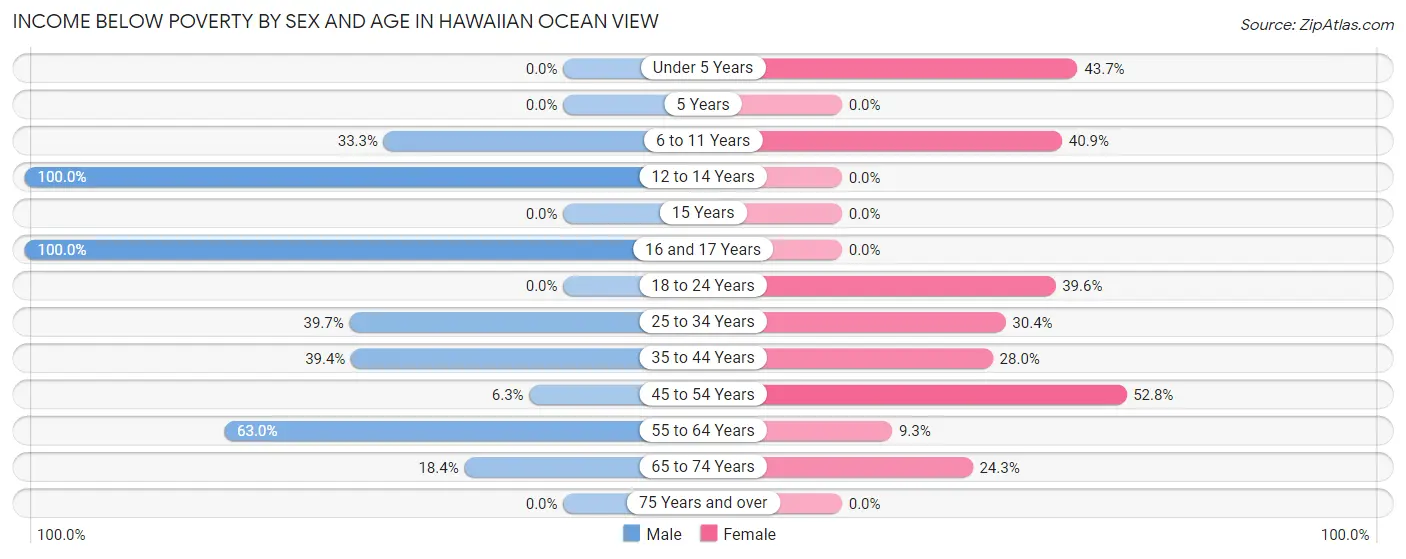
| Age Bracket | Male | Female |
| Under 5 Years | 0 (0.0%) | 115 (43.7%) |
| 5 Years | 0 (0.0%) | 0 (0.0%) |
| 6 to 11 Years | 30 (33.3%) | 58 (40.8%) |
| 12 to 14 Years | 22 (100.0%) | 0 (0.0%) |
| 15 Years | 0 (0.0%) | 0 (0.0%) |
| 16 and 17 Years | 42 (100.0%) | 0 (0.0%) |
| 18 to 24 Years | 0 (0.0%) | 21 (39.6%) |
| 25 to 34 Years | 102 (39.7%) | 106 (30.4%) |
| 35 to 44 Years | 126 (39.4%) | 21 (28.0%) |
| 45 to 54 Years | 22 (6.3%) | 104 (52.8%) |
| 55 to 64 Years | 119 (63.0%) | 26 (9.3%) |
| 65 to 74 Years | 60 (18.3%) | 82 (24.3%) |
| 75 Years and over | 0 (0.0%) | 0 (0.0%) |
| Total | 523 (28.5%) | 533 (30.4%) |
Income Above Poverty by Sex and Age in Hawaiian Ocean View
According to the poverty statistics in Hawaiian Ocean View, males aged under 5 years and females aged 75 years and over are the age groups that are most secure financially, with 100.0% of males and 100.0% of females in these age groups living above the poverty line.
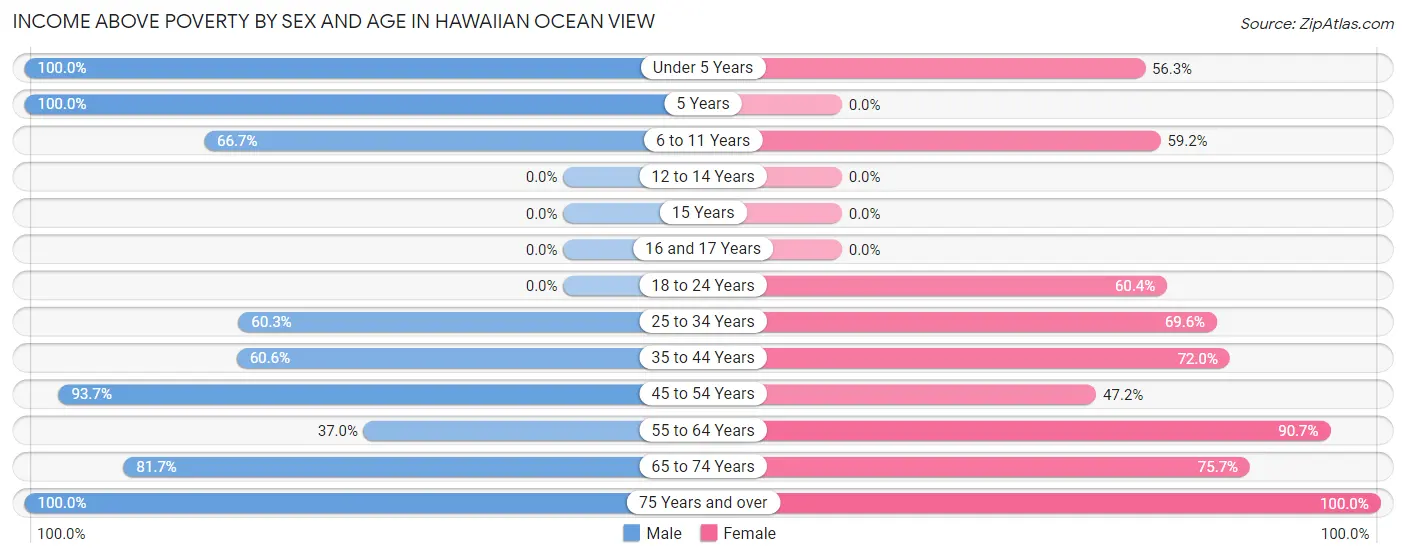
| Age Bracket | Male | Female |
| Under 5 Years | 78 (100.0%) | 148 (56.3%) |
| 5 Years | 58 (100.0%) | 0 (0.0%) |
| 6 to 11 Years | 60 (66.7%) | 84 (59.2%) |
| 12 to 14 Years | 0 (0.0%) | 0 (0.0%) |
| 15 Years | 0 (0.0%) | 0 (0.0%) |
| 16 and 17 Years | 0 (0.0%) | 0 (0.0%) |
| 18 to 24 Years | 0 (0.0%) | 32 (60.4%) |
| 25 to 34 Years | 155 (60.3%) | 243 (69.6%) |
| 35 to 44 Years | 194 (60.6%) | 54 (72.0%) |
| 45 to 54 Years | 327 (93.7%) | 93 (47.2%) |
| 55 to 64 Years | 70 (37.0%) | 253 (90.7%) |
| 65 to 74 Years | 267 (81.7%) | 256 (75.7%) |
| 75 Years and over | 100 (100.0%) | 59 (100.0%) |
| Total | 1,309 (71.5%) | 1,222 (69.6%) |
Income Below Poverty Among Married-Couple Families in Hawaiian Ocean View
The poverty statistics for married-couple families in Hawaiian Ocean View show that 26.9% or 153 of the total 569 families live below the poverty line. Families with 1 or 2 children have the highest poverty rate of 65.6%, comprising of 122 families. On the other hand, families with 3 or 4 children have the lowest poverty rate of 0.0%, which includes 0 families.
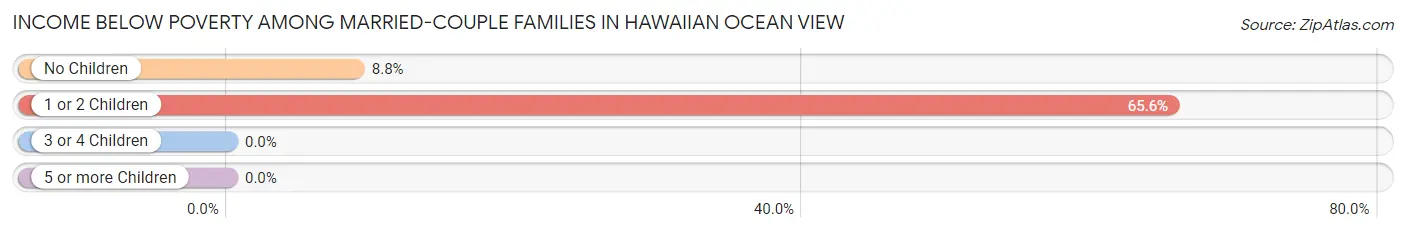
| Children | Above Poverty | Below Poverty |
| No Children | 320 (91.2%) | 31 (8.8%) |
| 1 or 2 Children | 64 (34.4%) | 122 (65.6%) |
| 3 or 4 Children | 32 (100.0%) | 0 (0.0%) |
| 5 or more Children | 0 (0.0%) | 0 (0.0%) |
| Total | 416 (73.1%) | 153 (26.9%) |
Income Below Poverty Among Single-Parent Households in Hawaiian Ocean View
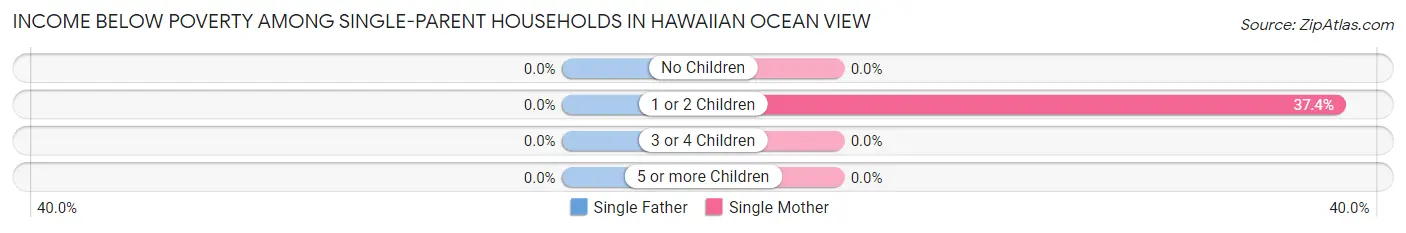
| Children | Single Father | Single Mother |
| No Children | 0 (0.0%) | 0 (0.0%) |
| 1 or 2 Children | 0 (0.0%) | 52 (37.4%) |
| 3 or 4 Children | 0 (0.0%) | 0 (0.0%) |
| 5 or more Children | 0 (0.0%) | 0 (0.0%) |
| Total | 0 (0.0%) | 52 (27.1%) |
Income Below Poverty Among Married-Couple vs Single-Parent Households in Hawaiian Ocean View
The poverty data for Hawaiian Ocean View shows that 153 of the married-couple family households (26.9%) and 52 of the single-parent households (18.4%) are living below the poverty level. Within the married-couple family households, those with 1 or 2 children have the highest poverty rate, with 122 households (65.6%) falling below the poverty line. Among the single-parent households, those with 1 or 2 children have the highest poverty rate, with 52 household (22.6%) living below poverty.
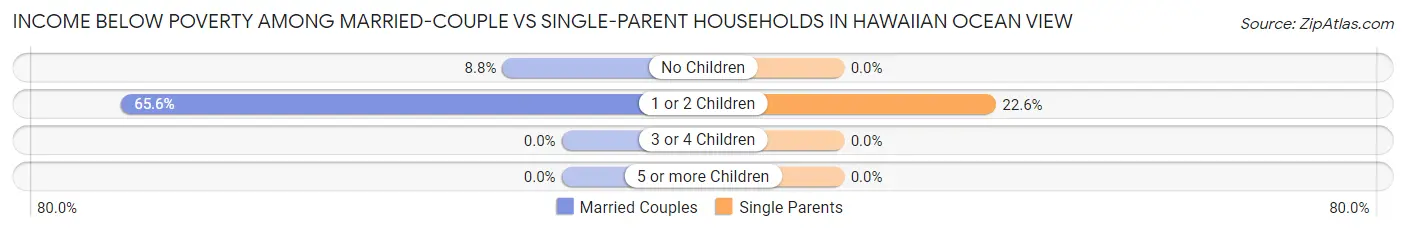
| Children | Married-Couple Families | Single-Parent Households |
| No Children | 31 (8.8%) | 0 (0.0%) |
| 1 or 2 Children | 122 (65.6%) | 52 (22.6%) |
| 3 or 4 Children | 0 (0.0%) | 0 (0.0%) |
| 5 or more Children | 0 (0.0%) | 0 (0.0%) |
| Total | 153 (26.9%) | 52 (18.4%) |
Race in Hawaiian Ocean View
The most populous races in Hawaiian Ocean View are Two or more Races (1,631 | 45.5%), White / Caucasian (1,232 | 34.4%), and Hispanic or Latino (768 | 21.4%).
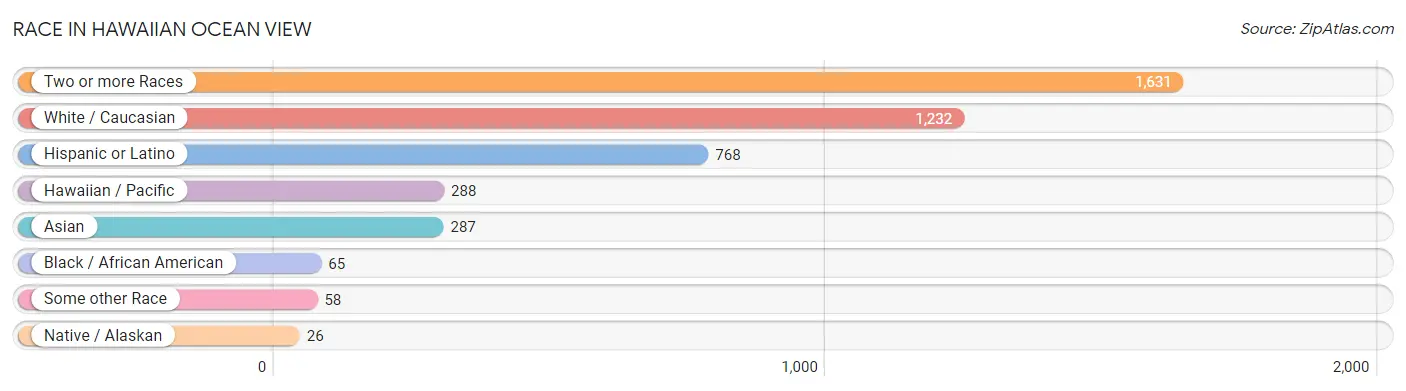
| Race | # Population | % Population |
| Asian | 287 | 8.0% |
| Black / African American | 65 | 1.8% |
| Hawaiian / Pacific | 288 | 8.0% |
| Hispanic or Latino | 768 | 21.4% |
| Native / Alaskan | 26 | 0.7% |
| White / Caucasian | 1,232 | 34.4% |
| Two or more Races | 1,631 | 45.5% |
| Some other Race | 58 | 1.6% |
| Total | 3,587 | 100.0% |
Ancestry in Hawaiian Ocean View
The most populous ancestries reported in Hawaiian Ocean View are Native Hawaiian (1,588 | 44.3%), German (705 | 19.7%), Korean (620 | 17.3%), Indian (Asian) (421 | 11.7%), and Puerto Rican (361 | 10.1%), together accounting for 103.0% of all Hawaiian Ocean View residents.
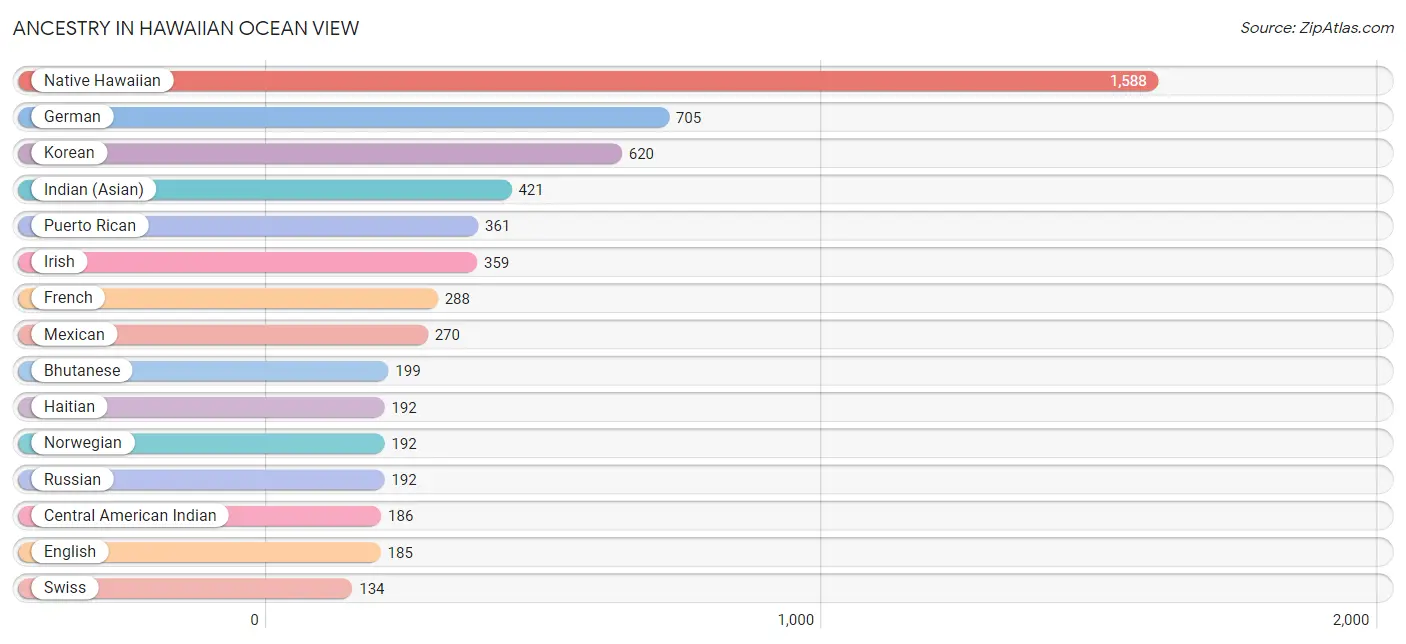
| Ancestry | # Population | % Population |
| American | 17 | 0.5% |
| Bhutanese | 199 | 5.6% |
| Burmese | 28 | 0.8% |
| Central American Indian | 186 | 5.2% |
| Cherokee | 88 | 2.5% |
| English | 185 | 5.2% |
| European | 111 | 3.1% |
| French | 288 | 8.0% |
| German | 705 | 19.7% |
| Greek | 60 | 1.7% |
| Haitian | 192 | 5.3% |
| Indian (Asian) | 421 | 11.7% |
| Irish | 359 | 10.0% |
| Korean | 620 | 17.3% |
| Mexican | 270 | 7.5% |
| Mexican American Indian | 26 | 0.7% |
| Native Hawaiian | 1,588 | 44.3% |
| Norwegian | 192 | 5.3% |
| Pakistani | 110 | 3.1% |
| Pennsylvania German | 59 | 1.6% |
| Polish | 31 | 0.9% |
| Portuguese | 120 | 3.4% |
| Puerto Rican | 361 | 10.1% |
| Russian | 192 | 5.3% |
| Scandinavian | 60 | 1.7% |
| Scottish | 64 | 1.8% |
| Sioux | 88 | 2.5% |
| Spanish | 49 | 1.4% |
| Swiss | 134 | 3.7% | View All 29 Rows |
Immigrants in Hawaiian Ocean View
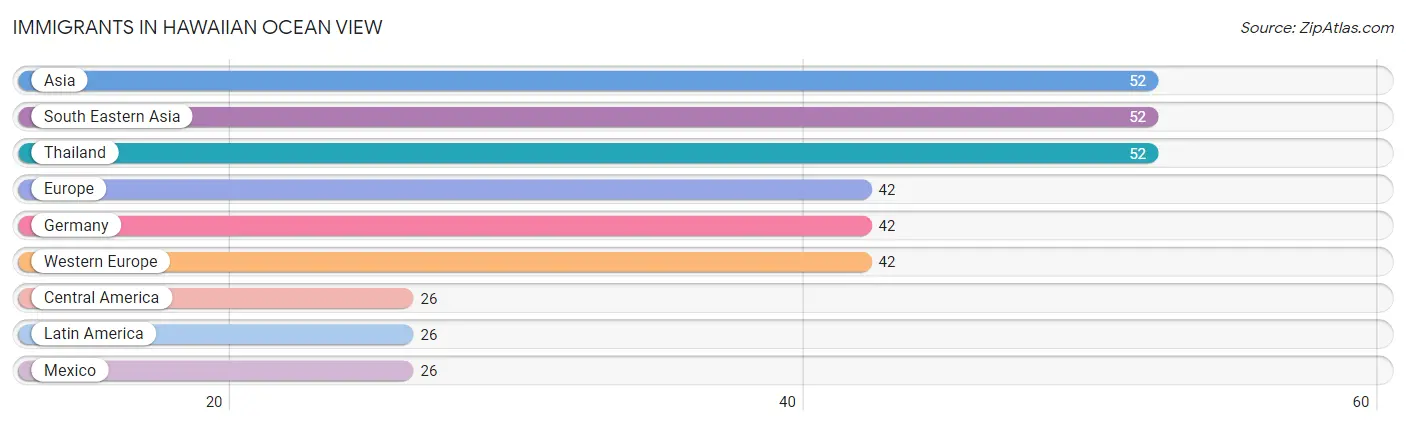
The most numerous immigrant groups reported in Hawaiian Ocean View came from Asia (52 | 1.5%), South Eastern Asia (52 | 1.5%), Thailand (52 | 1.5%), Europe (42 | 1.2%), and Germany (42 | 1.2%), together accounting for 6.7% of all Hawaiian Ocean View residents.
| Immigration Origin | # Population | % Population |
| Asia | 52 | 1.5% |
| Central America | 26 | 0.7% |
| Europe | 42 | 1.2% |
| Germany | 42 | 1.2% |
| Latin America | 26 | 0.7% |
| Mexico | 26 | 0.7% |
| South Eastern Asia | 52 | 1.5% |
| Thailand | 52 | 1.5% |
| Western Europe | 42 | 1.2% | View All 9 Rows |
Sex and Age in Hawaiian Ocean View
Sex and Age in Hawaiian Ocean View
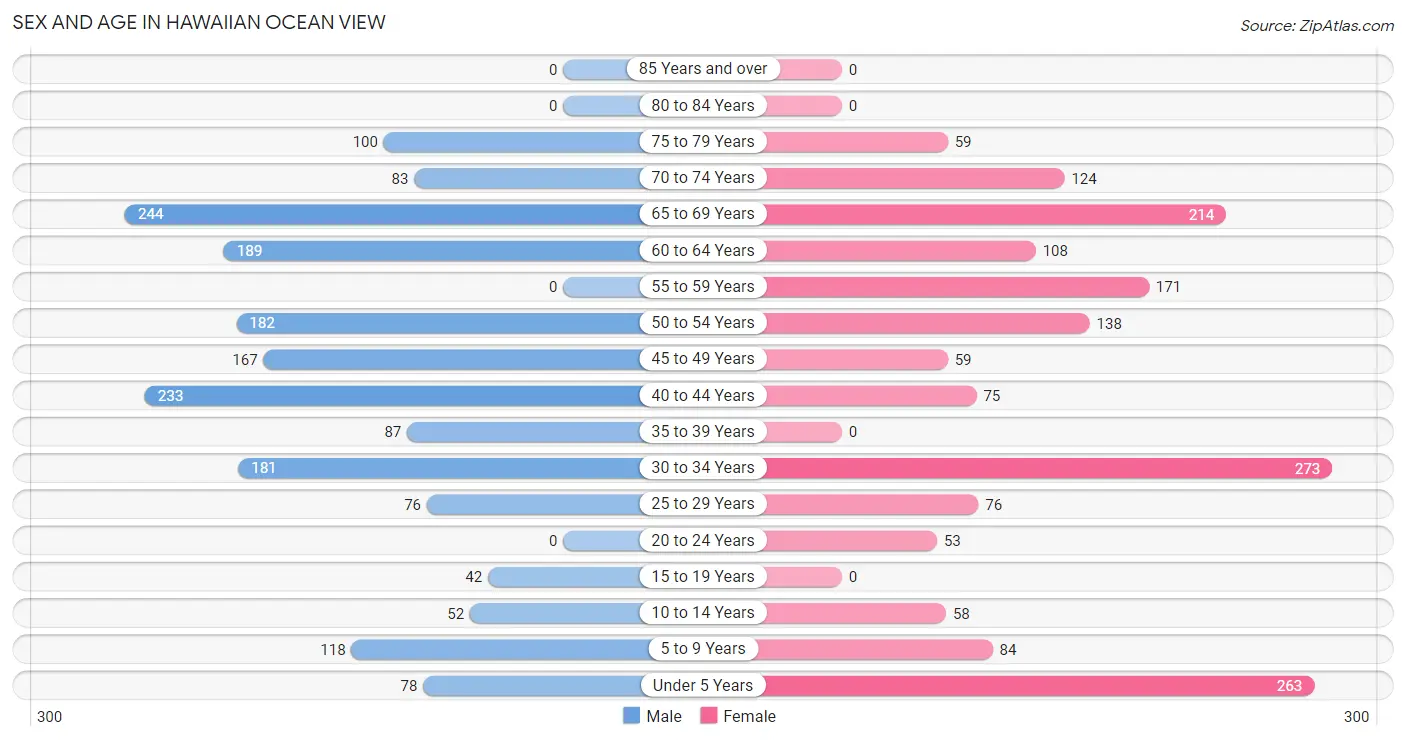
The most populous age groups in Hawaiian Ocean View are 65 to 69 Years (244 | 13.3%) for men and 30 to 34 Years (273 | 15.6%) for women.
| Age Bracket | Male | Female |
| Under 5 Years | 78 (4.3%) | 263 (15.0%) |
| 5 to 9 Years | 118 (6.4%) | 84 (4.8%) |
| 10 to 14 Years | 52 (2.8%) | 58 (3.3%) |
| 15 to 19 Years | 42 (2.3%) | 0 (0.0%) |
| 20 to 24 Years | 0 (0.0%) | 53 (3.0%) |
| 25 to 29 Years | 76 (4.2%) | 76 (4.3%) |
| 30 to 34 Years | 181 (9.9%) | 273 (15.6%) |
| 35 to 39 Years | 87 (4.8%) | 0 (0.0%) |
| 40 to 44 Years | 233 (12.7%) | 75 (4.3%) |
| 45 to 49 Years | 167 (9.1%) | 59 (3.4%) |
| 50 to 54 Years | 182 (9.9%) | 138 (7.9%) |
| 55 to 59 Years | 0 (0.0%) | 171 (9.7%) |
| 60 to 64 Years | 189 (10.3%) | 108 (6.1%) |
| 65 to 69 Years | 244 (13.3%) | 214 (12.2%) |
| 70 to 74 Years | 83 (4.5%) | 124 (7.1%) |
| 75 to 79 Years | 100 (5.5%) | 59 (3.4%) |
| 80 to 84 Years | 0 (0.0%) | 0 (0.0%) |
| 85 Years and over | 0 (0.0%) | 0 (0.0%) |
| Total | 1,832 (100.0%) | 1,755 (100.0%) |
Families and Households in Hawaiian Ocean View
Median Family Size in Hawaiian Ocean View
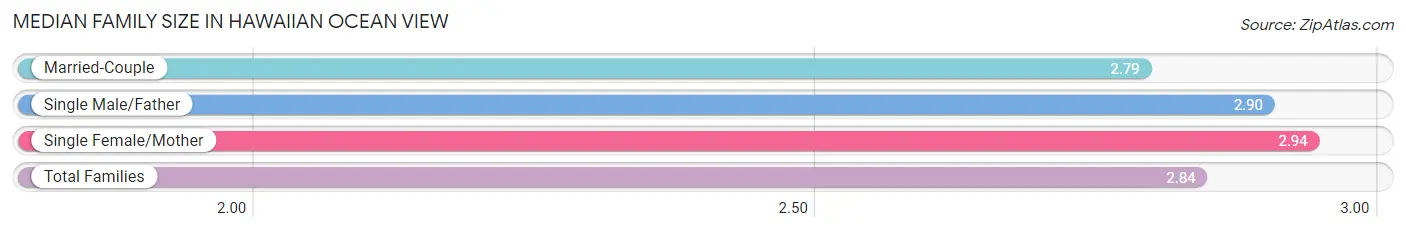
The median family size in Hawaiian Ocean View is 2.84 persons per family, with single female/mother families (192 | 22.5%) accounting for the largest median family size of 2.94 persons per family. On the other hand, married-couple families (569 | 66.8%) represent the smallest median family size with 2.79 persons per family.
| Family Type | # Families | Family Size |
| Married-Couple | 569 (66.8%) | 2.79 |
| Single Male/Father | 91 (10.7%) | 2.90 |
| Single Female/Mother | 192 (22.5%) | 2.94 |
| Total Families | 852 (100.0%) | 2.84 |
Median Household Size in Hawaiian Ocean View
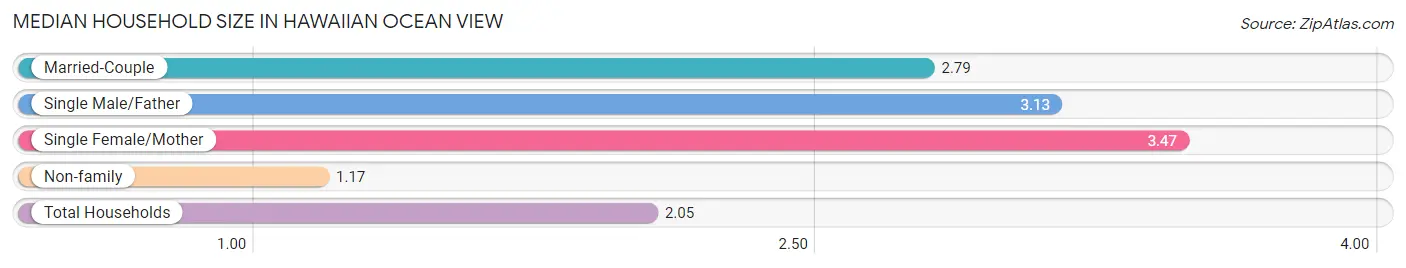
The median household size in Hawaiian Ocean View is 2.05 persons per household, with single female/mother households (192 | 11.0%) accounting for the largest median household size of 3.47 persons per household. non-family households (897 | 51.3%) represent the smallest median household size with 1.17 persons per household.
| Household Type | # Households | Household Size |
| Married-Couple | 569 (32.5%) | 2.79 |
| Single Male/Father | 91 (5.2%) | 3.13 |
| Single Female/Mother | 192 (11.0%) | 3.47 |
| Non-family | 897 (51.3%) | 1.17 |
| Total Households | 1,749 (100.0%) | 2.05 |
Household Size by Marriage Status in Hawaiian Ocean View
Out of a total of 1,749 households in Hawaiian Ocean View, 852 (48.7%) are family households, while 897 (51.3%) are nonfamily households. The most numerous type of family households are 3-person households, comprising 362, and the most common type of nonfamily households are 1-person households, comprising 805.
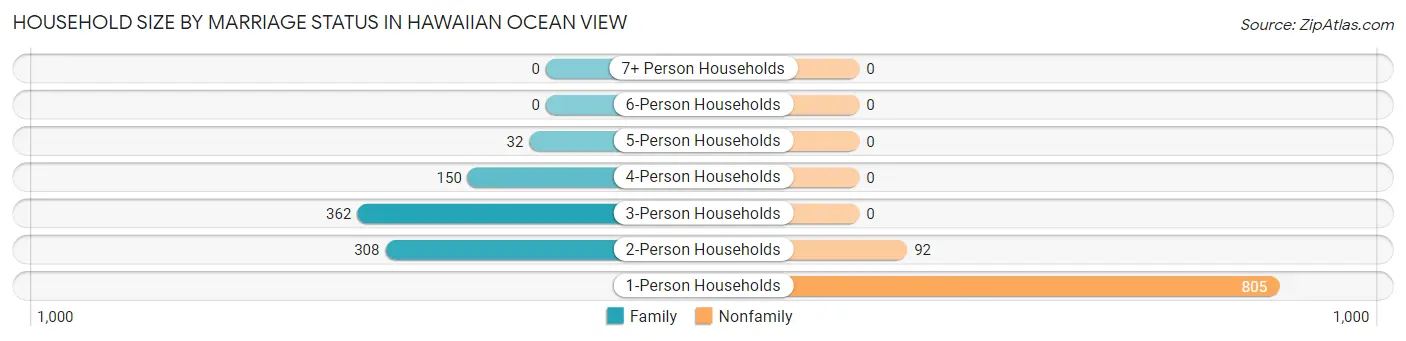
| Household Size | Family Households | Nonfamily Households |
| 1-Person Households | - | 805 (46.0%) |
| 2-Person Households | 308 (17.6%) | 92 (5.3%) |
| 3-Person Households | 362 (20.7%) | 0 (0.0%) |
| 4-Person Households | 150 (8.6%) | 0 (0.0%) |
| 5-Person Households | 32 (1.8%) | 0 (0.0%) |
| 6-Person Households | 0 (0.0%) | 0 (0.0%) |
| 7+ Person Households | 0 (0.0%) | 0 (0.0%) |
| Total | 852 (48.7%) | 897 (51.3%) |
Female Fertility in Hawaiian Ocean View
Fertility by Age in Hawaiian Ocean View
Average fertility rate in Hawaiian Ocean View is 31.0 births per 1,000 women. Women in the age bracket of 20 to 34 years have the highest fertility rate with 52.0 births per 1,000 women. Women in the age bracket of 20 to 34 years acount for 100.0% of all women with births.
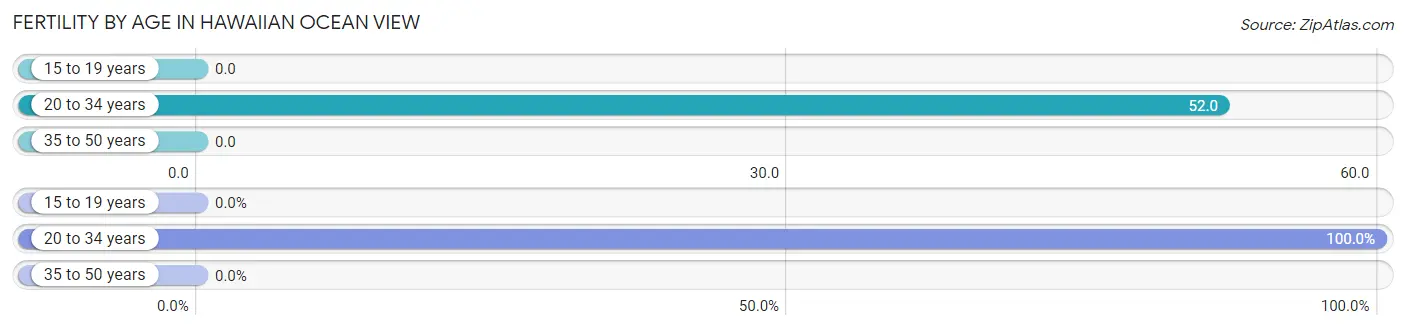
| Age Bracket | Women with Births | Births / 1,000 Women |
| 15 to 19 years | 0 (0.0%) | 0.0 |
| 20 to 34 years | 21 (100.0%) | 52.0 |
| 35 to 50 years | 0 (0.0%) | 0.0 |
| Total | 21 (100.0%) | 31.0 |
Fertility by Age by Marriage Status in Hawaiian Ocean View
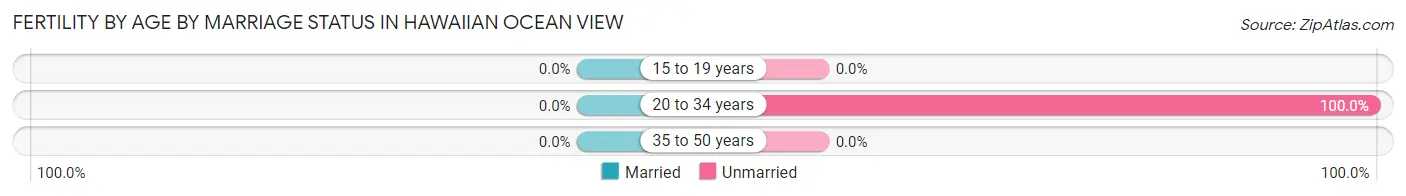
| Age Bracket | Married | Unmarried |
| 15 to 19 years | 0 (0.0%) | 0 (0.0%) |
| 20 to 34 years | 0 (0.0%) | 21 (100.0%) |
| 35 to 50 years | 0 (0.0%) | 0 (0.0%) |
| Total | 0 (0.0%) | 21 (100.0%) |
Fertility by Education in Hawaiian Ocean View
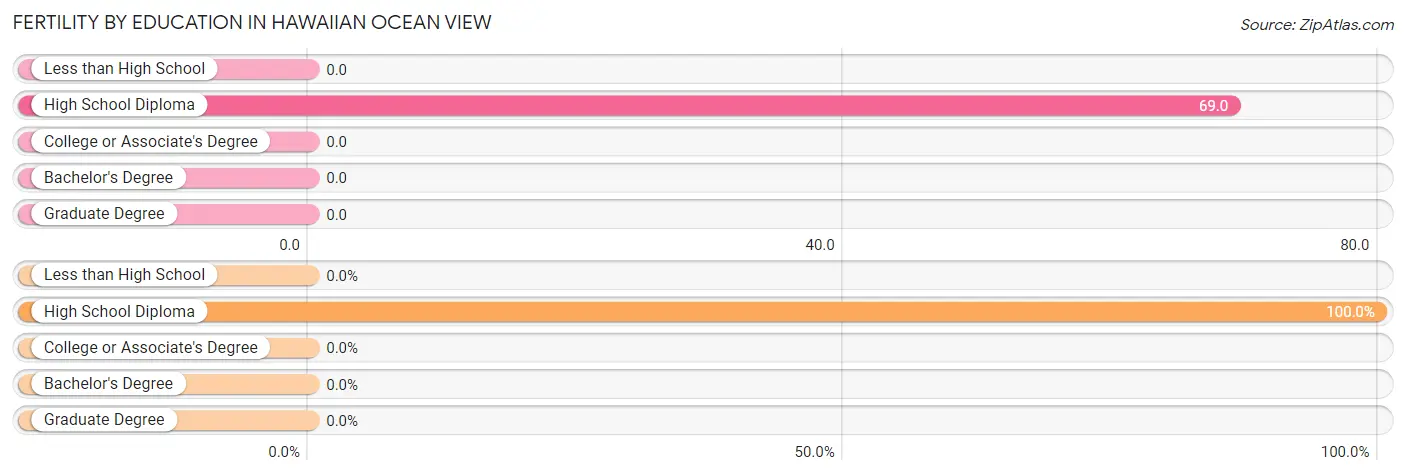
| Educational Attainment | Women with Births | Births / 1,000 Women |
| Less than High School | 0 (0.0%) | 0.0 |
| High School Diploma | 21 (100.0%) | 69.0 |
| College or Associate's Degree | 0 (0.0%) | 0.0 |
| Bachelor's Degree | 0 (0.0%) | 0.0 |
| Graduate Degree | 0 (0.0%) | 0.0 |
| Total | 21 (100.0%) | 31.0 |
Fertility by Education by Marriage Status in Hawaiian Ocean View
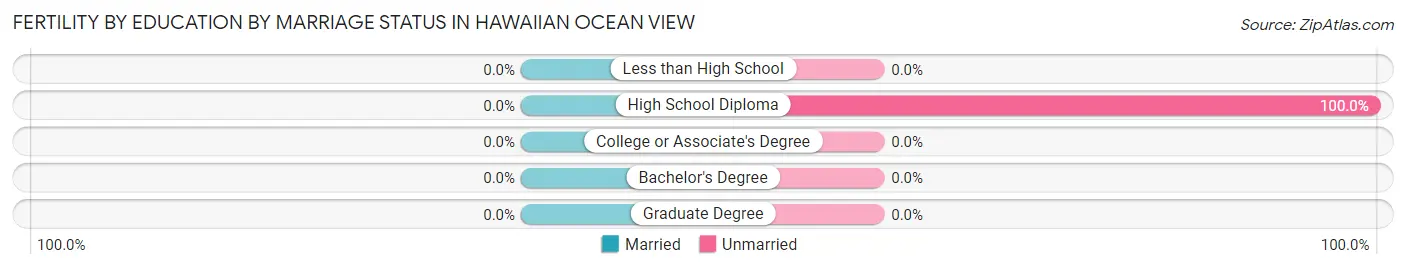
| Educational Attainment | Married | Unmarried |
| Less than High School | 0 (0.0%) | 0 (0.0%) |
| High School Diploma | 0 (0.0%) | 21 (100.0%) |
| College or Associate's Degree | 0 (0.0%) | 0 (0.0%) |
| Bachelor's Degree | 0 (0.0%) | 0 (0.0%) |
| Graduate Degree | 0 (0.0%) | 0 (0.0%) |
| Total | 0 (0.0%) | 21 (100.0%) |
Employment Characteristics in Hawaiian Ocean View
Employment by Class of Employer in Hawaiian Ocean View
Among the 1,117 employed individuals in Hawaiian Ocean View, private company employees (686 | 61.4%), state government employees (117 | 10.5%), and self-employed (incorporated) (69 | 6.2%) make up the most common classes of employment.
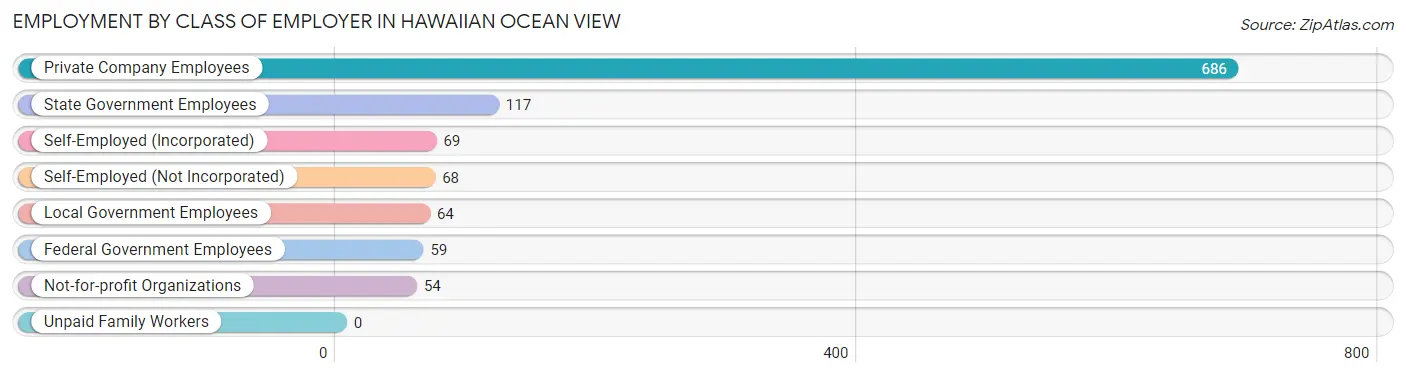
| Employer Class | # Employees | % Employees |
| Private Company Employees | 686 | 61.4% |
| Self-Employed (Incorporated) | 69 | 6.2% |
| Self-Employed (Not Incorporated) | 68 | 6.1% |
| Not-for-profit Organizations | 54 | 4.8% |
| Local Government Employees | 64 | 5.7% |
| State Government Employees | 117 | 10.5% |
| Federal Government Employees | 59 | 5.3% |
| Unpaid Family Workers | 0 | 0.0% |
| Total | 1,117 | 100.0% |
Employment Status by Age in Hawaiian Ocean View
According to the labor force statistics for Hawaiian Ocean View, out of the total population over 16 years of age (2,934), 47.4% or 1,391 individuals are in the labor force, with 11.9% or 166 of them unemployed. The age group with the highest labor force participation rate is 55 to 59 years, with 84.8% or 145 individuals in the labor force. Within the labor force, the 30 to 34 years age range has the highest percentage of unemployed individuals, with 28.9% or 79 of them being unemployed.
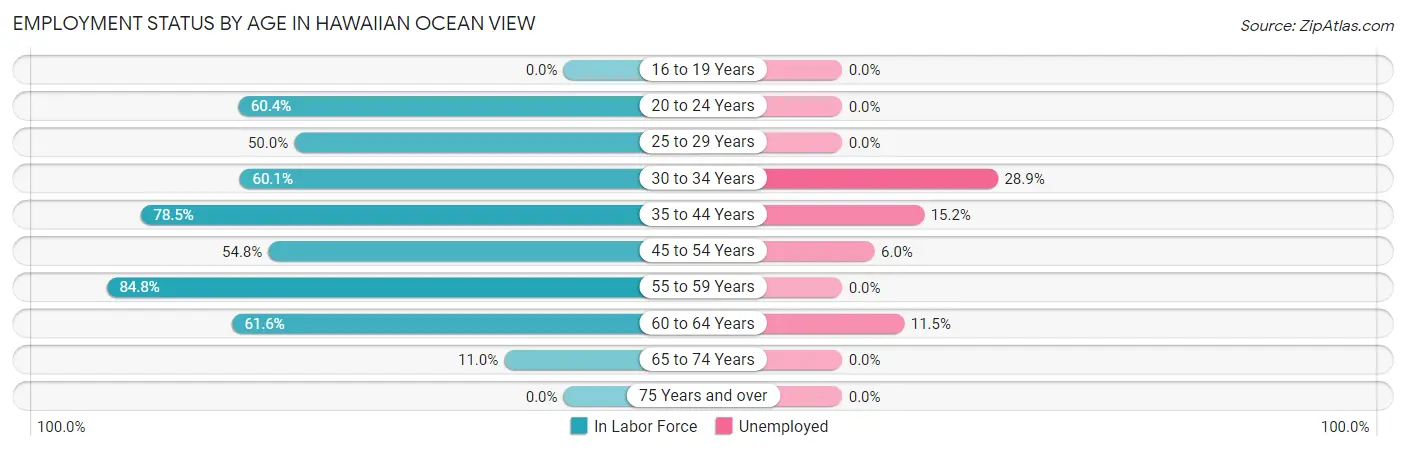
| Age Bracket | In Labor Force | Unemployed |
| 16 to 19 Years | 0 (0.0%) | 0 (0.0%) |
| 20 to 24 Years | 32 (60.4%) | 0 (0.0%) |
| 25 to 29 Years | 76 (50.0%) | 0 (0.0%) |
| 30 to 34 Years | 273 (60.1%) | 79 (28.9%) |
| 35 to 44 Years | 310 (78.5%) | 47 (15.2%) |
| 45 to 54 Years | 299 (54.8%) | 18 (6.0%) |
| 55 to 59 Years | 145 (84.8%) | 0 (0.0%) |
| 60 to 64 Years | 183 (61.6%) | 21 (11.5%) |
| 65 to 74 Years | 73 (11.0%) | 0 (0.0%) |
| 75 Years and over | 0 (0.0%) | 0 (0.0%) |
| Total | 1,391 (47.4%) | 166 (11.9%) |
Employment Status by Educational Attainment in Hawaiian Ocean View
According to labor force statistics for Hawaiian Ocean View, 63.8% of individuals (1,286) out of the total population between 25 and 64 years of age (2,015) are in the labor force, with 12.8% or 165 of them being unemployed. The group with the highest labor force participation rate are those with the educational attainment of high school diploma, with 69.3% or 759 individuals in the labor force. Within the labor force, individuals with bachelor's degree or higher education have the highest percentage of unemployment, with 40.4% or 21 of them being unemployed.
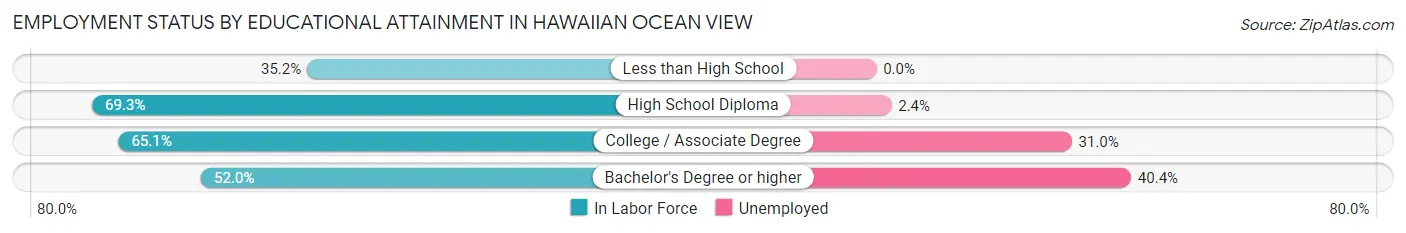
| Educational Attainment | In Labor Force | Unemployed |
| Less than High School | 69 (35.2%) | 0 (0.0%) |
| High School Diploma | 759 (69.3%) | 26 (2.4%) |
| College / Associate Degree | 406 (65.1%) | 193 (31.0%) |
| Bachelor's Degree or higher | 52 (52.0%) | 40 (40.4%) |
| Total | 1,286 (63.8%) | 258 (12.8%) |
Employment Occupations by Sex in Hawaiian Ocean View
Management, Business, Science and Arts Occupations
The most common Management, Business, Science and Arts occupations in Hawaiian Ocean View are Management (132 | 10.8%), Community & Social Service (34 | 2.8%), and Education, Arts & Media (34 | 2.8%).
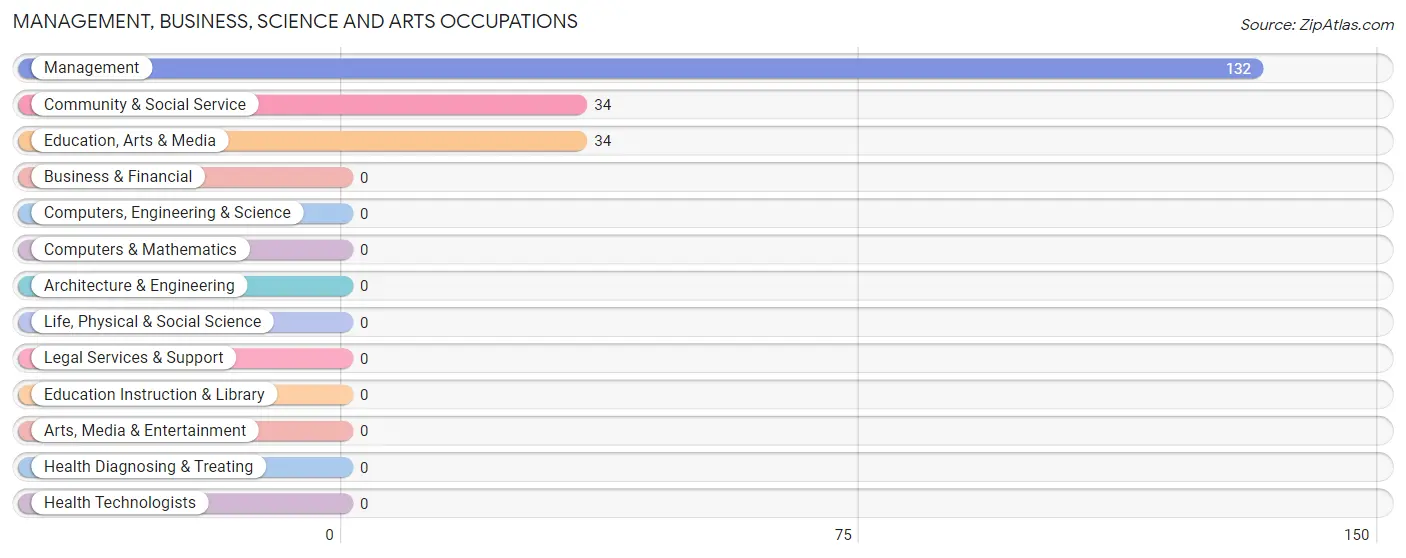
Management, Business, Science and Arts Occupations by Sex
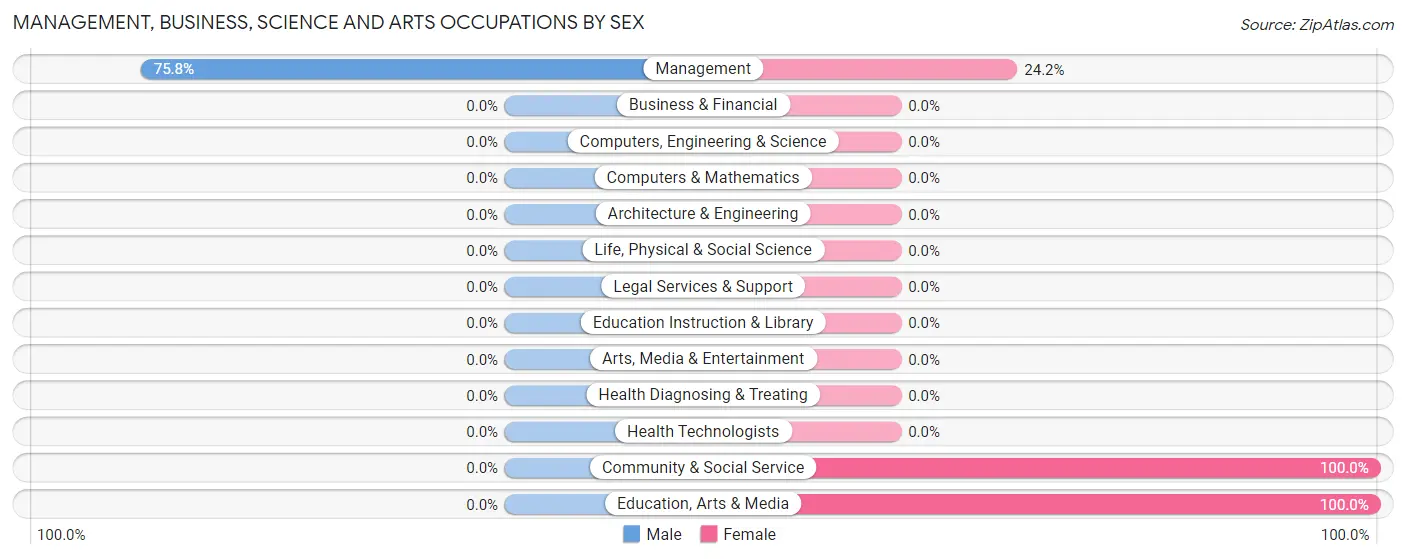
| Occupation | Male | Female |
| Management | 100 (75.8%) | 32 (24.2%) |
| Business & Financial | 0 (0.0%) | 0 (0.0%) |
| Computers, Engineering & Science | 0 (0.0%) | 0 (0.0%) |
| Computers & Mathematics | 0 (0.0%) | 0 (0.0%) |
| Architecture & Engineering | 0 (0.0%) | 0 (0.0%) |
| Life, Physical & Social Science | 0 (0.0%) | 0 (0.0%) |
| Community & Social Service | 0 (0.0%) | 34 (100.0%) |
| Education, Arts & Media | 0 (0.0%) | 34 (100.0%) |
| Legal Services & Support | 0 (0.0%) | 0 (0.0%) |
| Education Instruction & Library | 0 (0.0%) | 0 (0.0%) |
| Arts, Media & Entertainment | 0 (0.0%) | 0 (0.0%) |
| Health Diagnosing & Treating | 0 (0.0%) | 0 (0.0%) |
| Health Technologists | 0 (0.0%) | 0 (0.0%) |
| Total (Category) | 100 (60.2%) | 66 (39.8%) |
| Total (Overall) | 735 (60.0%) | 491 (40.1%) |
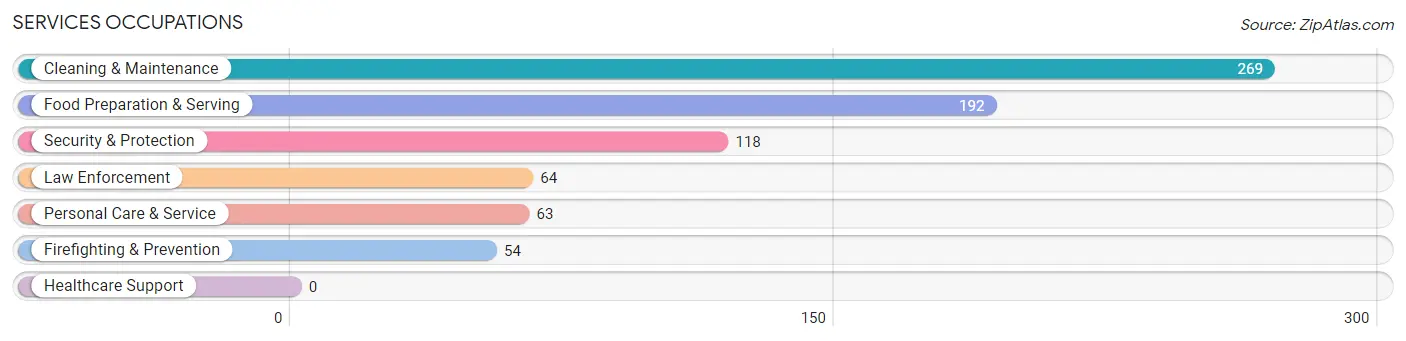
Services Occupations
The most common Services occupations in Hawaiian Ocean View are Cleaning & Maintenance (269 | 21.9%), Food Preparation & Serving (192 | 15.7%), Security & Protection (118 | 9.6%), Law Enforcement (64 | 5.2%), and Personal Care & Service (63 | 5.1%).
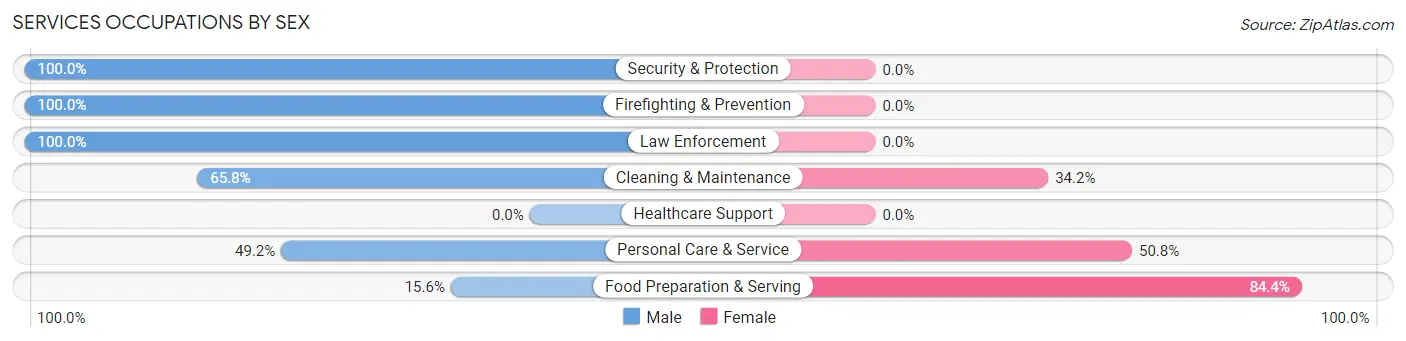
Services Occupations by Sex
Within the Services occupations in Hawaiian Ocean View, the most male-oriented occupations are Security & Protection (100.0%), Firefighting & Prevention (100.0%), and Law Enforcement (100.0%), while the most female-oriented occupations are Food Preparation & Serving (84.4%), Personal Care & Service (50.8%), and Cleaning & Maintenance (34.2%).
| Occupation | Male | Female |
| Healthcare Support | 0 (0.0%) | 0 (0.0%) |
| Security & Protection | 118 (100.0%) | 0 (0.0%) |
| Firefighting & Prevention | 54 (100.0%) | 0 (0.0%) |
| Law Enforcement | 64 (100.0%) | 0 (0.0%) |
| Food Preparation & Serving | 30 (15.6%) | 162 (84.4%) |
| Cleaning & Maintenance | 177 (65.8%) | 92 (34.2%) |
| Personal Care & Service | 31 (49.2%) | 32 (50.8%) |
| Total (Category) | 356 (55.4%) | 286 (44.6%) |
| Total (Overall) | 735 (60.0%) | 491 (40.1%) |
Sales and Office Occupations
Sales and Office Occupations by Sex
| Occupation | Male | Female |
| Sales & Related | 0 (0.0%) | 0 (0.0%) |
| Office & Administration | 0 (0.0%) | 0 (0.0%) |
| Total (Category) | 0 (0.0%) | 0 (0.0%) |
| Total (Overall) | 735 (60.0%) | 491 (40.1%) |
Natural Resources, Construction and Maintenance Occupations
The most common Natural Resources, Construction and Maintenance occupations in Hawaiian Ocean View are Construction & Extraction (109 | 8.9%), Farming, Fishing & Forestry (68 | 5.6%), and Installation, Maintenance & Repair (23 | 1.9%).
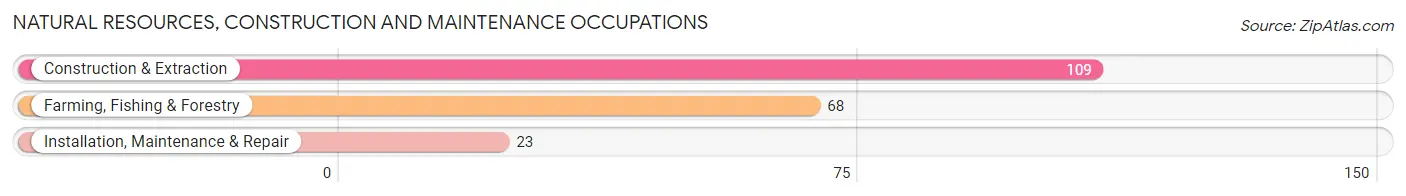
Natural Resources, Construction and Maintenance Occupations by Sex
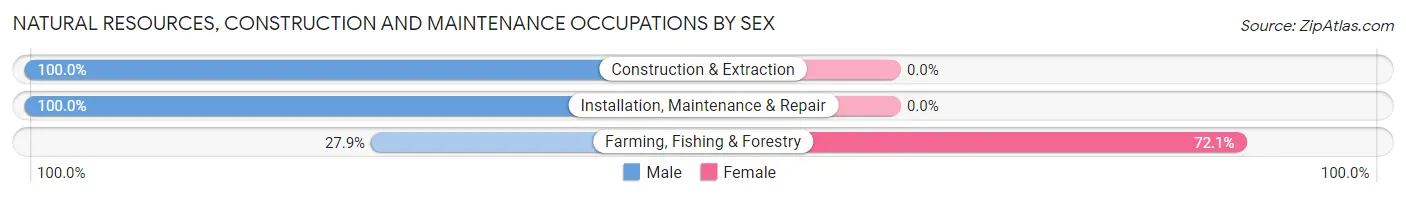
| Occupation | Male | Female |
| Farming, Fishing & Forestry | 19 (27.9%) | 49 (72.1%) |
| Construction & Extraction | 109 (100.0%) | 0 (0.0%) |
| Installation, Maintenance & Repair | 23 (100.0%) | 0 (0.0%) |
| Total (Category) | 151 (75.5%) | 49 (24.5%) |
| Total (Overall) | 735 (60.0%) | 491 (40.1%) |
Production, Transportation and Moving Occupations
The most common Production, Transportation and Moving occupations in Hawaiian Ocean View are Material Moving (96 | 7.8%), Transportation (69 | 5.6%), and Production (53 | 4.3%).
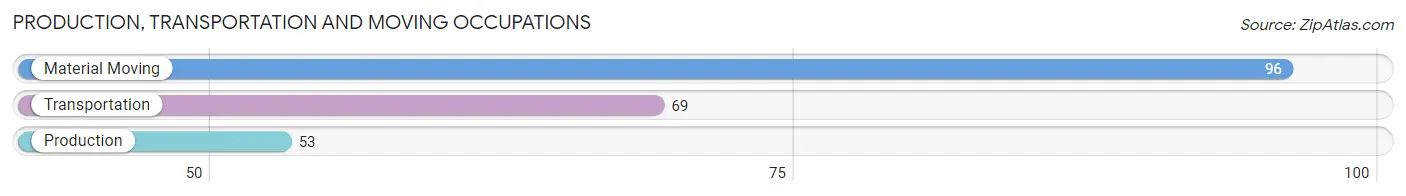
Production, Transportation and Moving Occupations by Sex
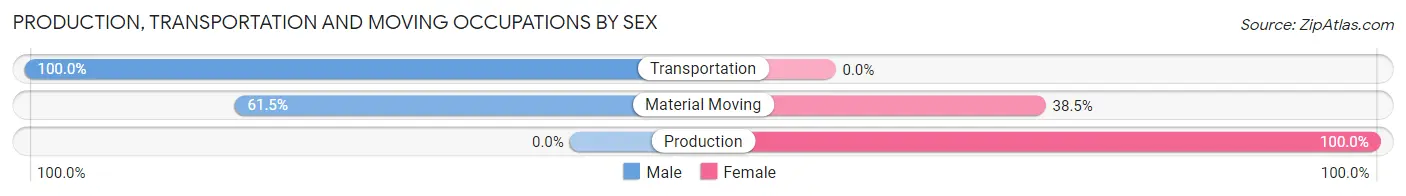
| Occupation | Male | Female |
| Production | 0 (0.0%) | 53 (100.0%) |
| Transportation | 69 (100.0%) | 0 (0.0%) |
| Material Moving | 59 (61.5%) | 37 (38.5%) |
| Total (Category) | 128 (58.7%) | 90 (41.3%) |
| Total (Overall) | 735 (60.0%) | 491 (40.1%) |
Employment Industries by Sex in Hawaiian Ocean View
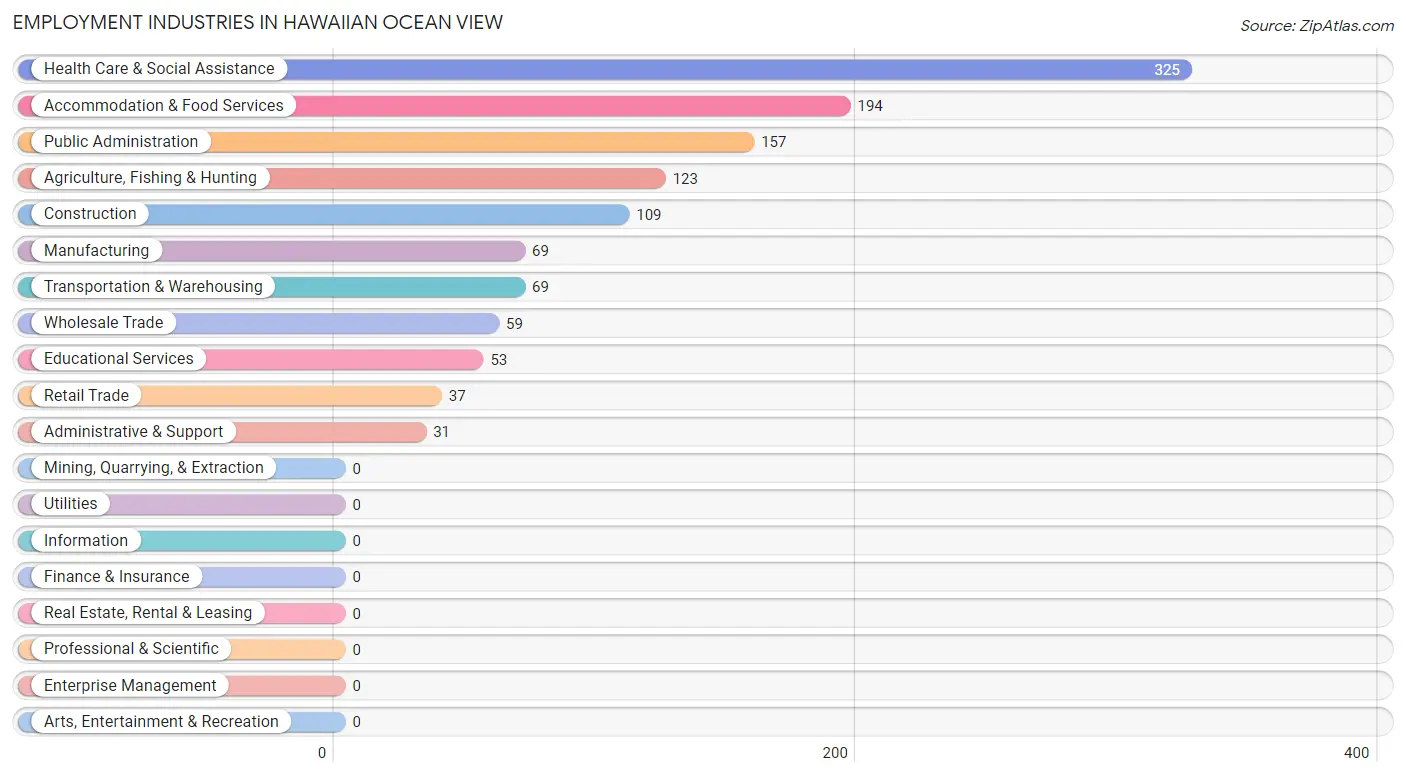
Employment Industries in Hawaiian Ocean View
The major employment industries in Hawaiian Ocean View include Health Care & Social Assistance (325 | 26.5%), Accommodation & Food Services (194 | 15.8%), Public Administration (157 | 12.8%), Agriculture, Fishing & Hunting (123 | 10.0%), and Construction (109 | 8.9%).
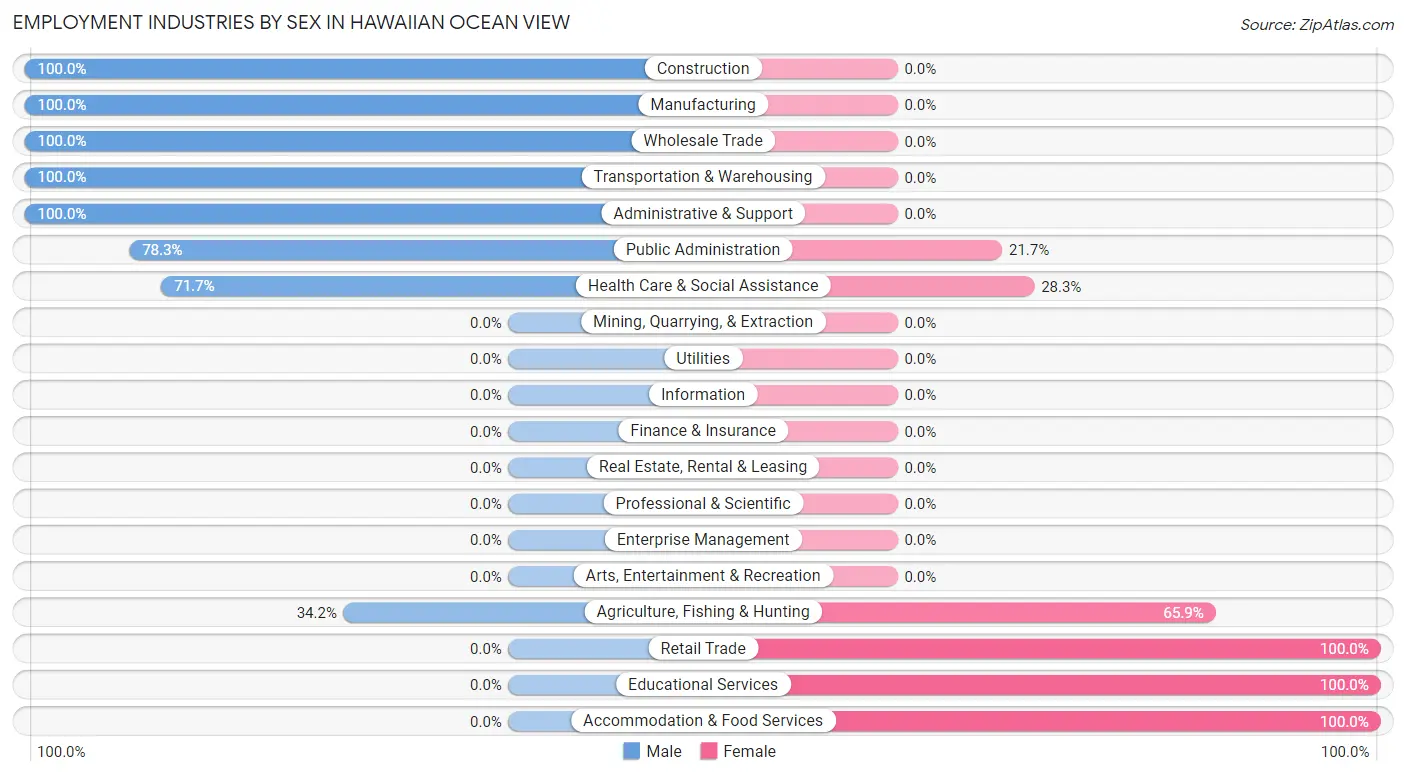
Employment Industries by Sex in Hawaiian Ocean View
The Hawaiian Ocean View industries that see more men than women are Construction (100.0%), Manufacturing (100.0%), and Wholesale Trade (100.0%), whereas the industries that tend to have a higher number of women are Retail Trade (100.0%), Educational Services (100.0%), and Accommodation & Food Services (100.0%).
| Industry | Male | Female |
| Agriculture, Fishing & Hunting | 42 (34.2%) | 81 (65.8%) |
| Mining, Quarrying, & Extraction | 0 (0.0%) | 0 (0.0%) |
| Construction | 109 (100.0%) | 0 (0.0%) |
| Manufacturing | 69 (100.0%) | 0 (0.0%) |
| Wholesale Trade | 59 (100.0%) | 0 (0.0%) |
| Retail Trade | 0 (0.0%) | 37 (100.0%) |
| Transportation & Warehousing | 69 (100.0%) | 0 (0.0%) |
| Utilities | 0 (0.0%) | 0 (0.0%) |
| Information | 0 (0.0%) | 0 (0.0%) |
| Finance & Insurance | 0 (0.0%) | 0 (0.0%) |
| Real Estate, Rental & Leasing | 0 (0.0%) | 0 (0.0%) |
| Professional & Scientific | 0 (0.0%) | 0 (0.0%) |
| Enterprise Management | 0 (0.0%) | 0 (0.0%) |
| Administrative & Support | 31 (100.0%) | 0 (0.0%) |
| Educational Services | 0 (0.0%) | 53 (100.0%) |
| Health Care & Social Assistance | 233 (71.7%) | 92 (28.3%) |
| Arts, Entertainment & Recreation | 0 (0.0%) | 0 (0.0%) |
| Accommodation & Food Services | 0 (0.0%) | 194 (100.0%) |
| Public Administration | 123 (78.3%) | 34 (21.7%) |
| Total | 735 (60.0%) | 491 (40.1%) |
Education in Hawaiian Ocean View
School Enrollment in Hawaiian Ocean View
The most common levels of schooling among the 504 students in Hawaiian Ocean View are elementary school (232 | 46.0%), nursery / preschool (120 | 23.8%), and kindergarten (58 | 11.5%).
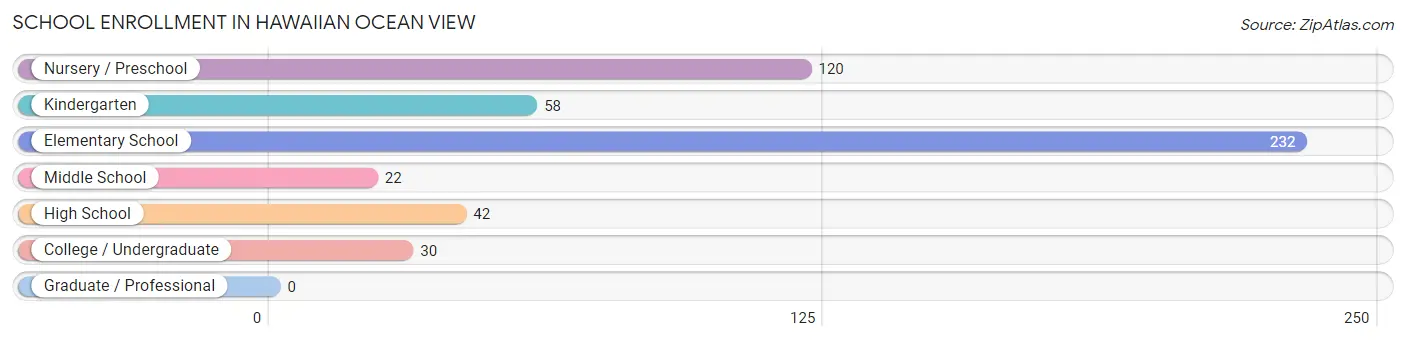
| School Level | # Students | % Students |
| Nursery / Preschool | 120 | 23.8% |
| Kindergarten | 58 | 11.5% |
| Elementary School | 232 | 46.0% |
| Middle School | 22 | 4.4% |
| High School | 42 | 8.3% |
| College / Undergraduate | 30 | 5.9% |
| Graduate / Professional | 0 | 0.0% |
| Total | 504 | 100.0% |
School Enrollment by Age by Funding Source in Hawaiian Ocean View
Out of a total of 504 students who are enrolled in schools in Hawaiian Ocean View, 128 (25.4%) attend a private institution, while the remaining 376 (74.6%) are enrolled in public schools. The age group of 3 to 4 year olds has the highest likelihood of being enrolled in private schools, with 70 (58.3% in the age bracket) enrolled. Conversely, the age group of 10 to 14 year olds has the lowest likelihood of being enrolled in a private school, with 110 (100.0% in the age bracket) attending a public institution.
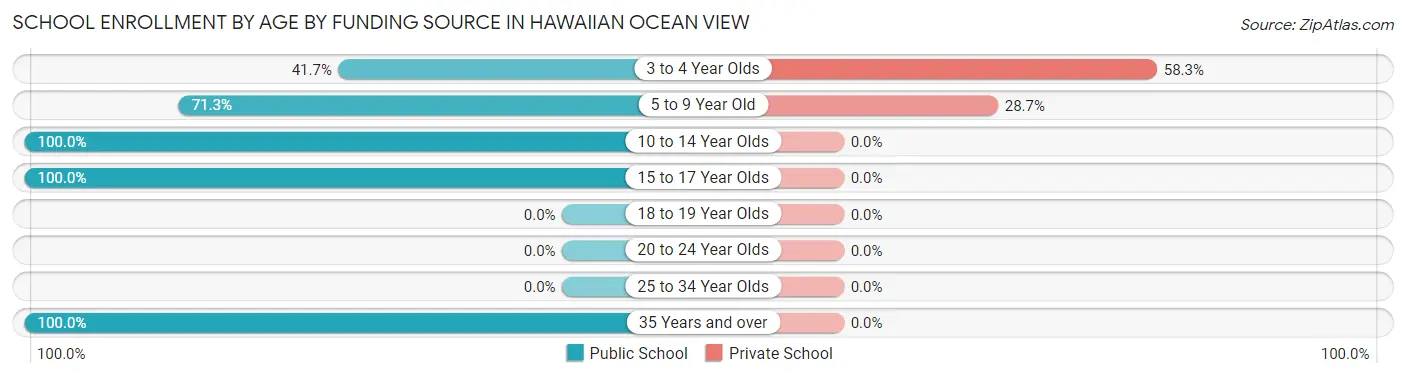
| Age Bracket | Public School | Private School |
| 3 to 4 Year Olds | 50 (41.7%) | 70 (58.3%) |
| 5 to 9 Year Old | 144 (71.3%) | 58 (28.7%) |
| 10 to 14 Year Olds | 110 (100.0%) | 0 (0.0%) |
| 15 to 17 Year Olds | 42 (100.0%) | 0 (0.0%) |
| 18 to 19 Year Olds | 0 (0.0%) | 0 (0.0%) |
| 20 to 24 Year Olds | 0 (0.0%) | 0 (0.0%) |
| 25 to 34 Year Olds | 0 (0.0%) | 0 (0.0%) |
| 35 Years and over | 30 (100.0%) | 0 (0.0%) |
| Total | 376 (74.6%) | 128 (25.4%) |
Educational Attainment by Field of Study in Hawaiian Ocean View
Bio, nature & agricultural (150 | 45.7%), science & technology (59 | 18.0%), liberal arts & history (45 | 13.7%), physical & health sciences (31 | 9.5%), and computers & mathematics (22 | 6.7%) are the most common fields of study among 328 individuals in Hawaiian Ocean View who have obtained a bachelor's degree or higher.
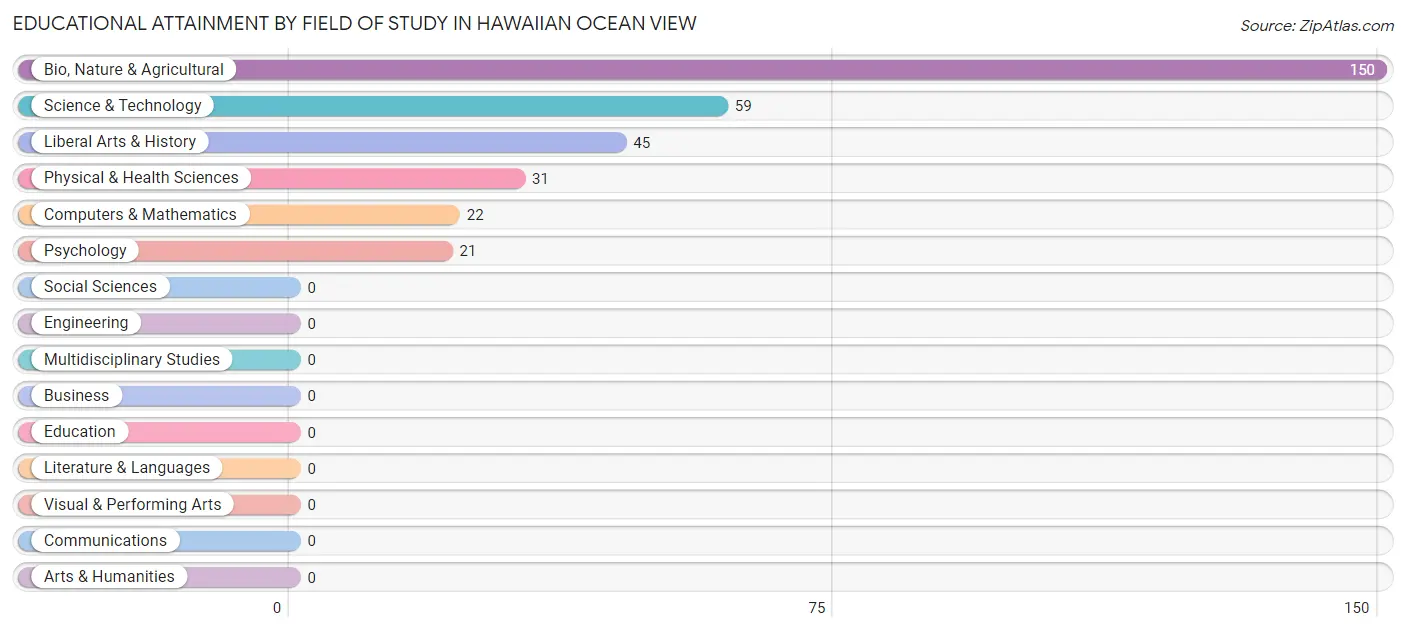
| Field of Study | # Graduates | % Graduates |
| Computers & Mathematics | 22 | 6.7% |
| Bio, Nature & Agricultural | 150 | 45.7% |
| Physical & Health Sciences | 31 | 9.5% |
| Psychology | 21 | 6.4% |
| Social Sciences | 0 | 0.0% |
| Engineering | 0 | 0.0% |
| Multidisciplinary Studies | 0 | 0.0% |
| Science & Technology | 59 | 18.0% |
| Business | 0 | 0.0% |
| Education | 0 | 0.0% |
| Literature & Languages | 0 | 0.0% |
| Liberal Arts & History | 45 | 13.7% |
| Visual & Performing Arts | 0 | 0.0% |
| Communications | 0 | 0.0% |
| Arts & Humanities | 0 | 0.0% |
| Total | 328 | 100.0% |
Transportation & Commute in Hawaiian Ocean View
Vehicle Availability by Sex in Hawaiian Ocean View
The most prevalent vehicle ownership categories in Hawaiian Ocean View are males with 1 vehicle (291, accounting for 46.5%) and females with 1 vehicle (216, making up 59.3%).
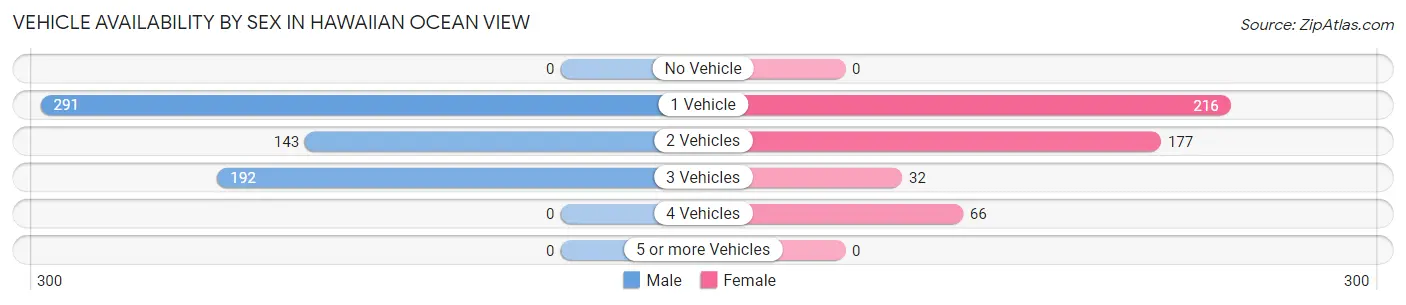
| Vehicles Available | Male | Female |
| No Vehicle | 0 (0.0%) | 0 (0.0%) |
| 1 Vehicle | 291 (46.5%) | 216 (44.0%) |
| 2 Vehicles | 143 (22.8%) | 177 (36.0%) |
| 3 Vehicles | 192 (30.7%) | 32 (6.5%) |
| 4 Vehicles | 0 (0.0%) | 66 (13.4%) |
| 5 or more Vehicles | 0 (0.0%) | 0 (0.0%) |
| Total | 626 (100.0%) | 491 (100.0%) |
Commute Time in Hawaiian Ocean View
The most frequently occuring commute durations in Hawaiian Ocean View are 60 to 89 minutes (371 commuters, 33.2%), 90 or more minutes (336 commuters, 30.1%), and 45 to 59 minutes (138 commuters, 12.3%).
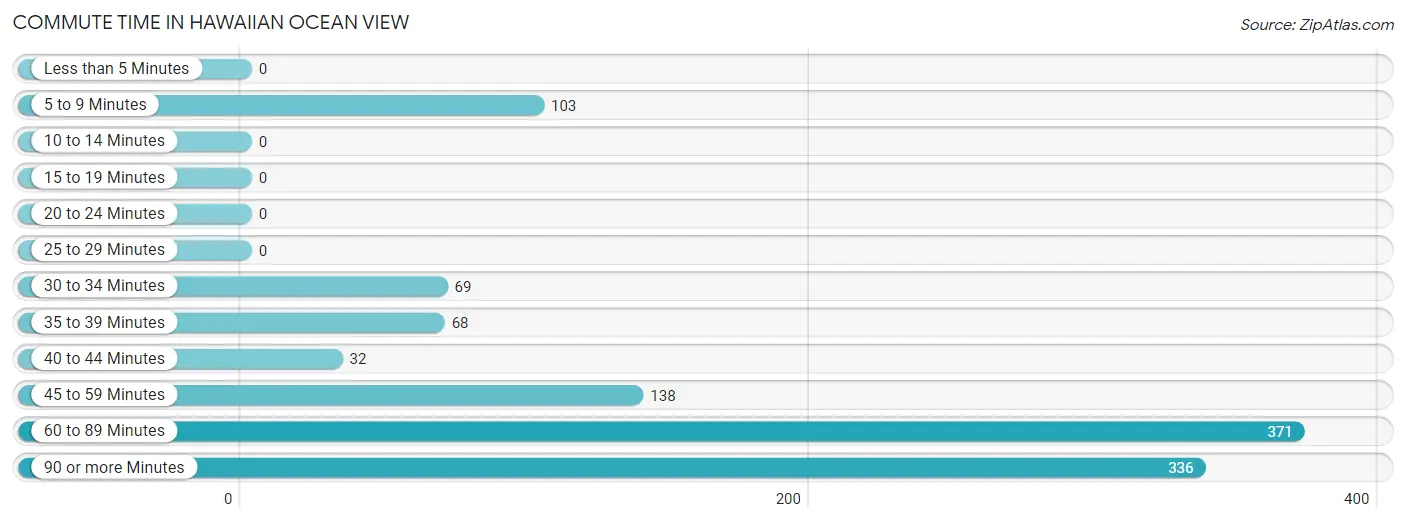
| Commute Time | # Commuters | % Commuters |
| Less than 5 Minutes | 0 | 0.0% |
| 5 to 9 Minutes | 103 | 9.2% |
| 10 to 14 Minutes | 0 | 0.0% |
| 15 to 19 Minutes | 0 | 0.0% |
| 20 to 24 Minutes | 0 | 0.0% |
| 25 to 29 Minutes | 0 | 0.0% |
| 30 to 34 Minutes | 69 | 6.2% |
| 35 to 39 Minutes | 68 | 6.1% |
| 40 to 44 Minutes | 32 | 2.9% |
| 45 to 59 Minutes | 138 | 12.3% |
| 60 to 89 Minutes | 371 | 33.2% |
| 90 or more Minutes | 336 | 30.1% |
Commute Time by Sex in Hawaiian Ocean View
The most common commute times in Hawaiian Ocean View are 90 or more minutes (244 commuters, 39.0%) for males and 60 to 89 minutes (158 commuters, 32.2%) for females.
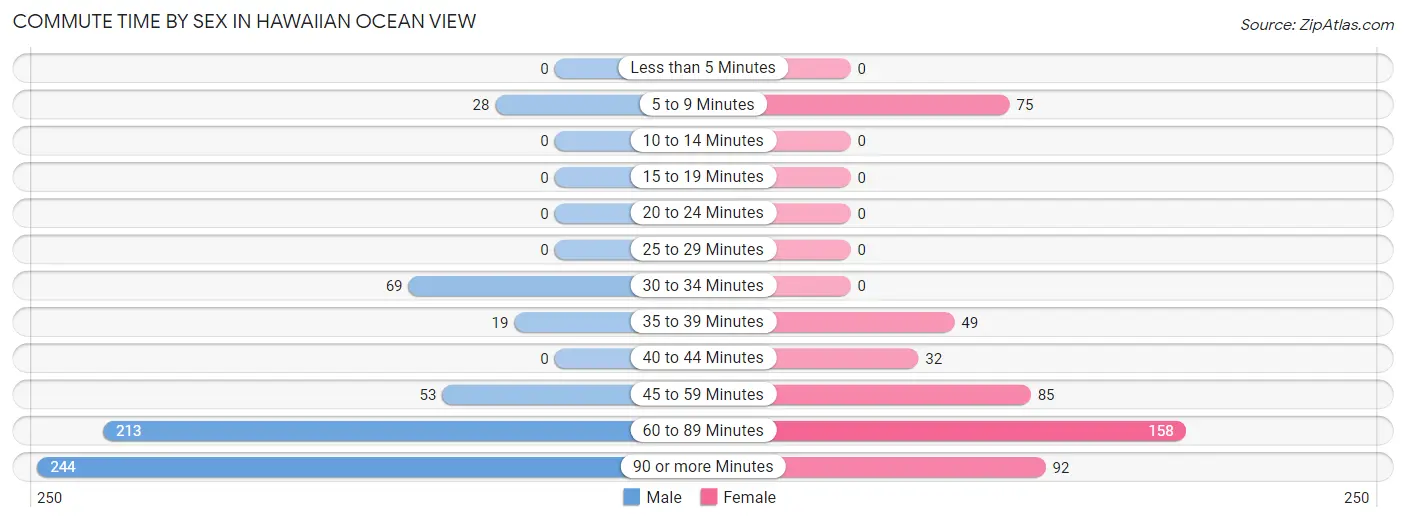
| Commute Time | Male | Female |
| Less than 5 Minutes | 0 (0.0%) | 0 (0.0%) |
| 5 to 9 Minutes | 28 (4.5%) | 75 (15.3%) |
| 10 to 14 Minutes | 0 (0.0%) | 0 (0.0%) |
| 15 to 19 Minutes | 0 (0.0%) | 0 (0.0%) |
| 20 to 24 Minutes | 0 (0.0%) | 0 (0.0%) |
| 25 to 29 Minutes | 0 (0.0%) | 0 (0.0%) |
| 30 to 34 Minutes | 69 (11.0%) | 0 (0.0%) |
| 35 to 39 Minutes | 19 (3.0%) | 49 (10.0%) |
| 40 to 44 Minutes | 0 (0.0%) | 32 (6.5%) |
| 45 to 59 Minutes | 53 (8.5%) | 85 (17.3%) |
| 60 to 89 Minutes | 213 (34.0%) | 158 (32.2%) |
| 90 or more Minutes | 244 (39.0%) | 92 (18.7%) |
Time of Departure to Work by Sex in Hawaiian Ocean View
The most frequent times of departure to work in Hawaiian Ocean View are 12:00 AM to 4:59 AM (288, 46.0%) for males and 12:00 AM to 4:59 AM (263, 53.6%) for females.
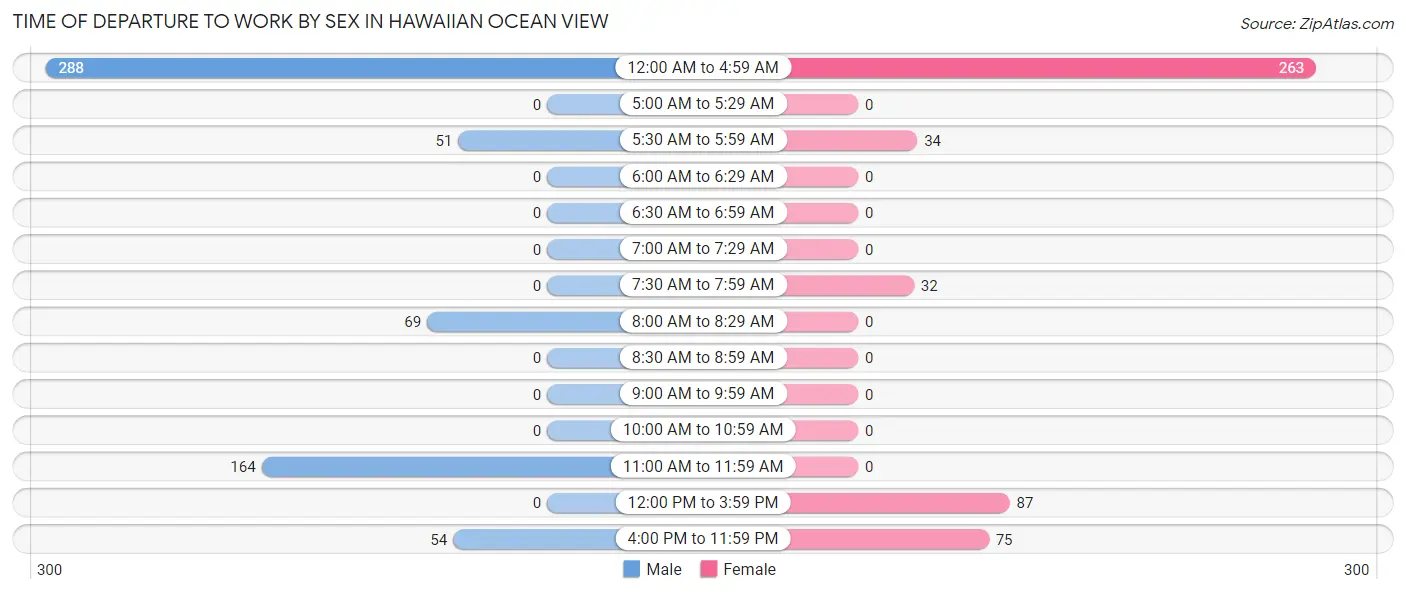
| Time of Departure | Male | Female |
| 12:00 AM to 4:59 AM | 288 (46.0%) | 263 (53.6%) |
| 5:00 AM to 5:29 AM | 0 (0.0%) | 0 (0.0%) |
| 5:30 AM to 5:59 AM | 51 (8.2%) | 34 (6.9%) |
| 6:00 AM to 6:29 AM | 0 (0.0%) | 0 (0.0%) |
| 6:30 AM to 6:59 AM | 0 (0.0%) | 0 (0.0%) |
| 7:00 AM to 7:29 AM | 0 (0.0%) | 0 (0.0%) |
| 7:30 AM to 7:59 AM | 0 (0.0%) | 32 (6.5%) |
| 8:00 AM to 8:29 AM | 69 (11.0%) | 0 (0.0%) |
| 8:30 AM to 8:59 AM | 0 (0.0%) | 0 (0.0%) |
| 9:00 AM to 9:59 AM | 0 (0.0%) | 0 (0.0%) |
| 10:00 AM to 10:59 AM | 0 (0.0%) | 0 (0.0%) |
| 11:00 AM to 11:59 AM | 164 (26.2%) | 0 (0.0%) |
| 12:00 PM to 3:59 PM | 0 (0.0%) | 87 (17.7%) |
| 4:00 PM to 11:59 PM | 54 (8.6%) | 75 (15.3%) |
| Total | 626 (100.0%) | 491 (100.0%) |
Housing Occupancy in Hawaiian Ocean View
Occupancy by Ownership in Hawaiian Ocean View
Of the total 1,749 dwellings in Hawaiian Ocean View, owner-occupied units account for 1,294 (74.0%), while renter-occupied units make up 455 (26.0%).
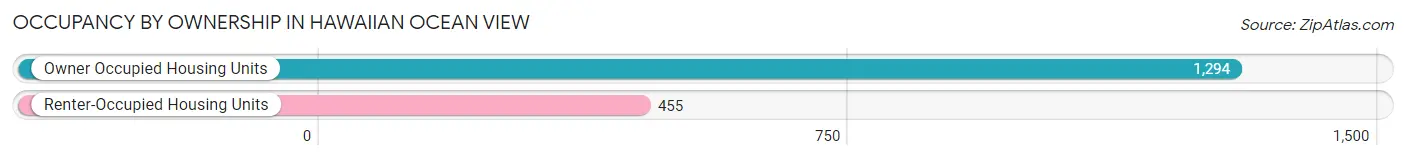
| Occupancy | # Housing Units | % Housing Units |
| Owner Occupied Housing Units | 1,294 | 74.0% |
| Renter-Occupied Housing Units | 455 | 26.0% |
| Total Occupied Housing Units | 1,749 | 100.0% |
Occupancy by Household Size in Hawaiian Ocean View
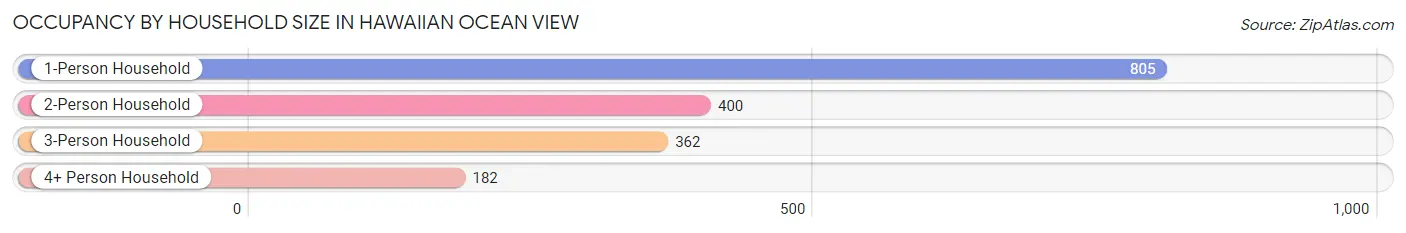
| Household Size | # Housing Units | % Housing Units |
| 1-Person Household | 805 | 46.0% |
| 2-Person Household | 400 | 22.9% |
| 3-Person Household | 362 | 20.7% |
| 4+ Person Household | 182 | 10.4% |
| Total Housing Units | 1,749 | 100.0% |
Occupancy by Ownership by Household Size in Hawaiian Ocean View
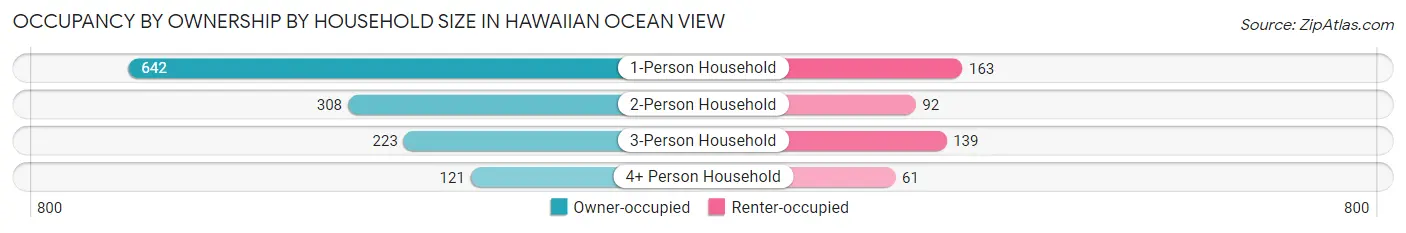
| Household Size | Owner-occupied | Renter-occupied |
| 1-Person Household | 642 (79.7%) | 163 (20.3%) |
| 2-Person Household | 308 (77.0%) | 92 (23.0%) |
| 3-Person Household | 223 (61.6%) | 139 (38.4%) |
| 4+ Person Household | 121 (66.5%) | 61 (33.5%) |
| Total Housing Units | 1,294 (74.0%) | 455 (26.0%) |
Occupancy by Educational Attainment in Hawaiian Ocean View
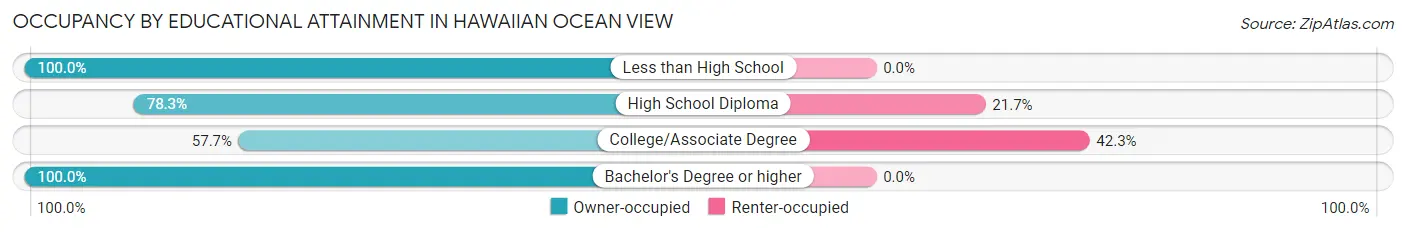
| Household Size | Owner-occupied | Renter-occupied |
| Less than High School | 69 (100.0%) | 0 (0.0%) |
| High School Diploma | 734 (78.3%) | 203 (21.7%) |
| College/Associate Degree | 344 (57.7%) | 252 (42.3%) |
| Bachelor's Degree or higher | 147 (100.0%) | 0 (0.0%) |
Occupancy by Age of Householder in Hawaiian Ocean View
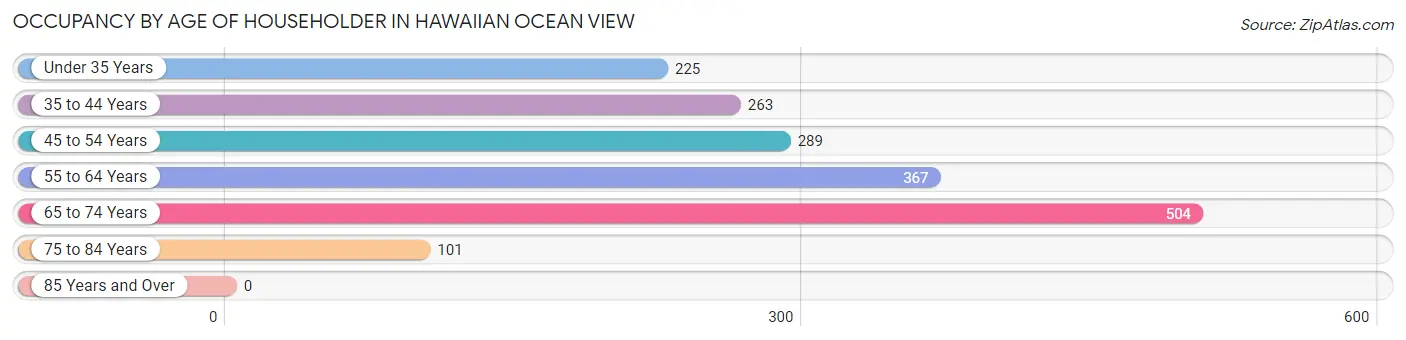
| Age Bracket | # Households | % Households |
| Under 35 Years | 225 | 12.9% |
| 35 to 44 Years | 263 | 15.0% |
| 45 to 54 Years | 289 | 16.5% |
| 55 to 64 Years | 367 | 21.0% |
| 65 to 74 Years | 504 | 28.8% |
| 75 to 84 Years | 101 | 5.8% |
| 85 Years and Over | 0 | 0.0% |
| Total | 1,749 | 100.0% |
Housing Finances in Hawaiian Ocean View
Median Income by Occupancy in Hawaiian Ocean View
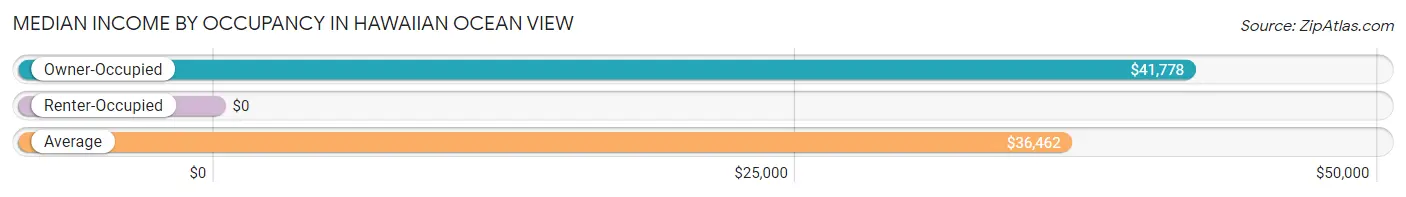
| Occupancy Type | # Households | Median Income |
| Owner-Occupied | 1,294 (74.0%) | $41,778 |
| Renter-Occupied | 455 (26.0%) | $0 |
| Average | 1,749 (100.0%) | $36,462 |
Occupancy by Householder Income Bracket in Hawaiian Ocean View
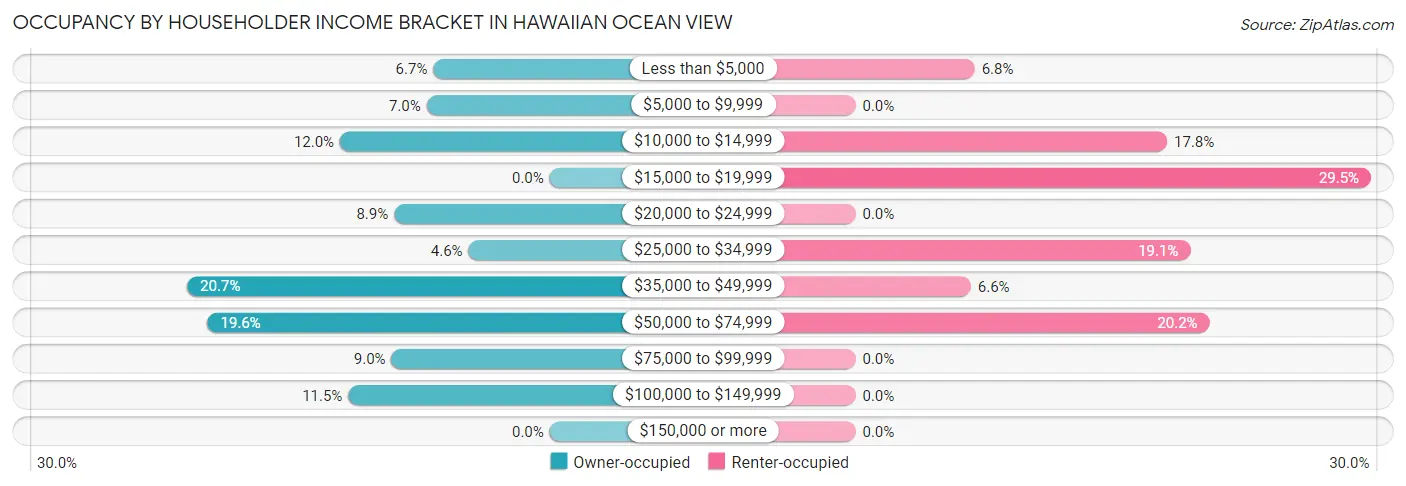
| Income Bracket | Owner-occupied | Renter-occupied |
| Less than $5,000 | 86 (6.7%) | 31 (6.8%) |
| $5,000 to $9,999 | 91 (7.0%) | 0 (0.0%) |
| $10,000 to $14,999 | 155 (12.0%) | 81 (17.8%) |
| $15,000 to $19,999 | 0 (0.0%) | 134 (29.4%) |
| $20,000 to $24,999 | 115 (8.9%) | 0 (0.0%) |
| $25,000 to $34,999 | 60 (4.6%) | 87 (19.1%) |
| $35,000 to $49,999 | 268 (20.7%) | 30 (6.6%) |
| $50,000 to $74,999 | 253 (19.6%) | 92 (20.2%) |
| $75,000 to $99,999 | 117 (9.0%) | 0 (0.0%) |
| $100,000 to $149,999 | 149 (11.5%) | 0 (0.0%) |
| $150,000 or more | 0 (0.0%) | 0 (0.0%) |
| Total | 1,294 (100.0%) | 455 (100.0%) |
Monthly Housing Cost Tiers in Hawaiian Ocean View
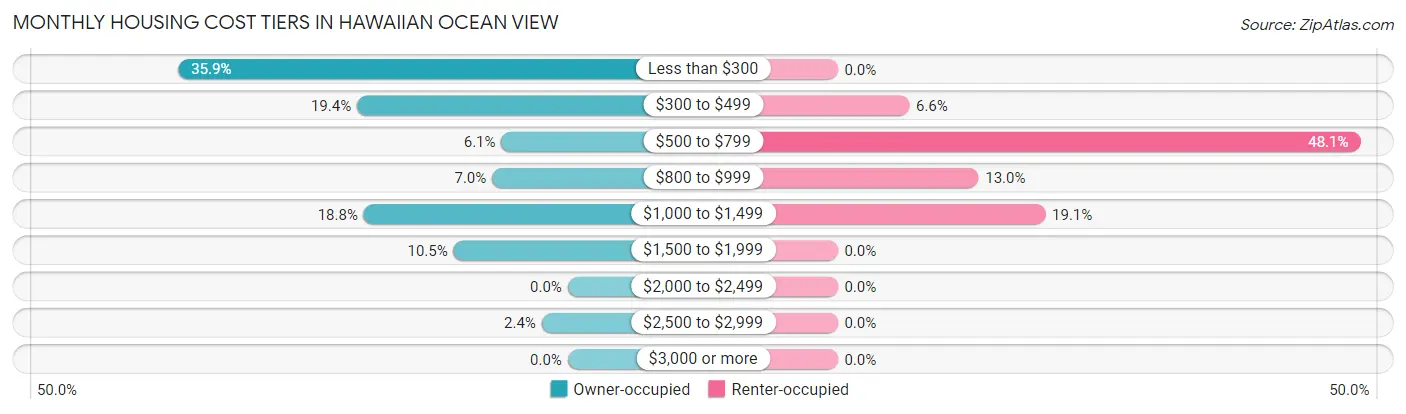
| Monthly Cost | Owner-occupied | Renter-occupied |
| Less than $300 | 464 (35.9%) | 0 (0.0%) |
| $300 to $499 | 251 (19.4%) | 30 (6.6%) |
| $500 to $799 | 79 (6.1%) | 219 (48.1%) |
| $800 to $999 | 90 (7.0%) | 59 (13.0%) |
| $1,000 to $1,499 | 243 (18.8%) | 87 (19.1%) |
| $1,500 to $1,999 | 136 (10.5%) | 0 (0.0%) |
| $2,000 to $2,499 | 0 (0.0%) | 0 (0.0%) |
| $2,500 to $2,999 | 31 (2.4%) | 0 (0.0%) |
| $3,000 or more | 0 (0.0%) | 0 (0.0%) |
| Total | 1,294 (100.0%) | 455 (100.0%) |
Physical Housing Characteristics in Hawaiian Ocean View
Housing Structures in Hawaiian Ocean View
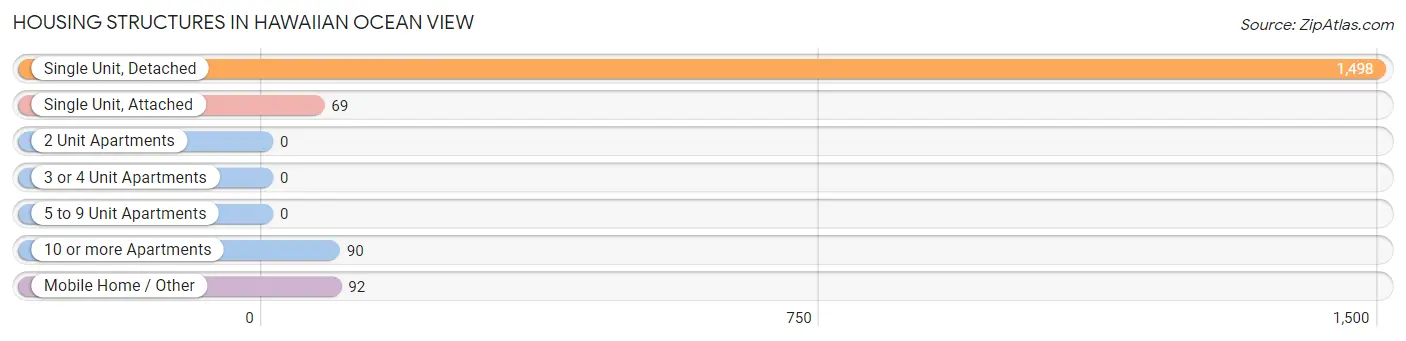
| Structure Type | # Housing Units | % Housing Units |
| Single Unit, Detached | 1,498 | 85.7% |
| Single Unit, Attached | 69 | 4.0% |
| 2 Unit Apartments | 0 | 0.0% |
| 3 or 4 Unit Apartments | 0 | 0.0% |
| 5 to 9 Unit Apartments | 0 | 0.0% |
| 10 or more Apartments | 90 | 5.1% |
| Mobile Home / Other | 92 | 5.3% |
| Total | 1,749 | 100.0% |
Housing Structures by Occupancy in Hawaiian Ocean View
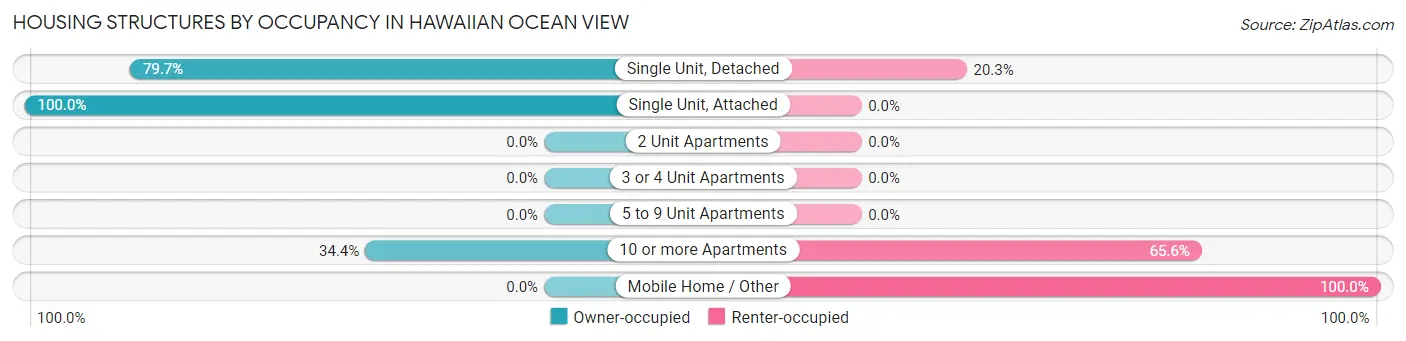
| Structure Type | Owner-occupied | Renter-occupied |
| Single Unit, Detached | 1,194 (79.7%) | 304 (20.3%) |
| Single Unit, Attached | 69 (100.0%) | 0 (0.0%) |
| 2 Unit Apartments | 0 (0.0%) | 0 (0.0%) |
| 3 or 4 Unit Apartments | 0 (0.0%) | 0 (0.0%) |
| 5 to 9 Unit Apartments | 0 (0.0%) | 0 (0.0%) |
| 10 or more Apartments | 31 (34.4%) | 59 (65.6%) |
| Mobile Home / Other | 0 (0.0%) | 92 (100.0%) |
| Total | 1,294 (74.0%) | 455 (26.0%) |
Housing Structures by Number of Rooms in Hawaiian Ocean View
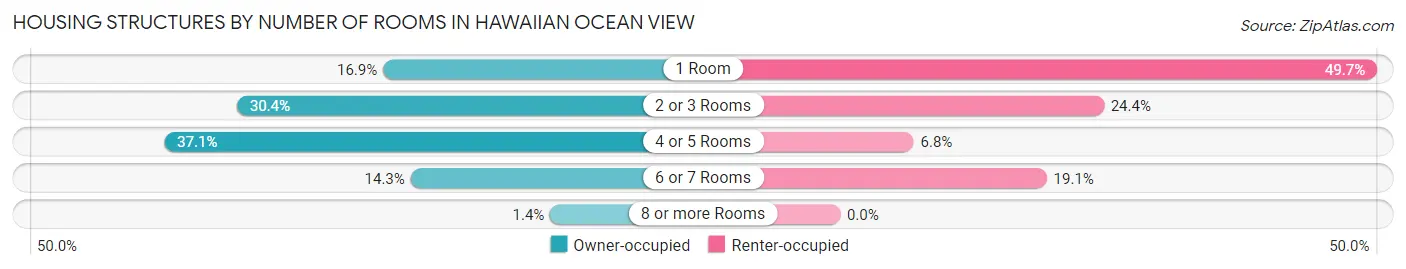
| Number of Rooms | Owner-occupied | Renter-occupied |
| 1 Room | 218 (16.9%) | 226 (49.7%) |
| 2 or 3 Rooms | 393 (30.4%) | 111 (24.4%) |
| 4 or 5 Rooms | 480 (37.1%) | 31 (6.8%) |
| 6 or 7 Rooms | 185 (14.3%) | 87 (19.1%) |
| 8 or more Rooms | 18 (1.4%) | 0 (0.0%) |
| Total | 1,294 (100.0%) | 455 (100.0%) |
Housing Structure by Heating Type in Hawaiian Ocean View
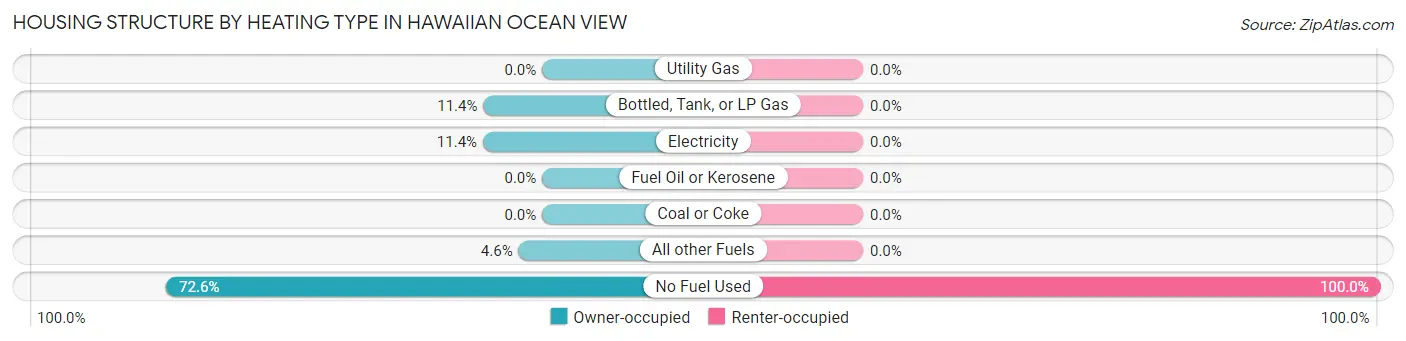
| Heating Type | Owner-occupied | Renter-occupied |
| Utility Gas | 0 (0.0%) | 0 (0.0%) |
| Bottled, Tank, or LP Gas | 147 (11.4%) | 0 (0.0%) |
| Electricity | 148 (11.4%) | 0 (0.0%) |
| Fuel Oil or Kerosene | 0 (0.0%) | 0 (0.0%) |
| Coal or Coke | 0 (0.0%) | 0 (0.0%) |
| All other Fuels | 59 (4.6%) | 0 (0.0%) |
| No Fuel Used | 940 (72.6%) | 455 (100.0%) |
| Total | 1,294 (100.0%) | 455 (100.0%) |
Household Vehicle Usage in Hawaiian Ocean View
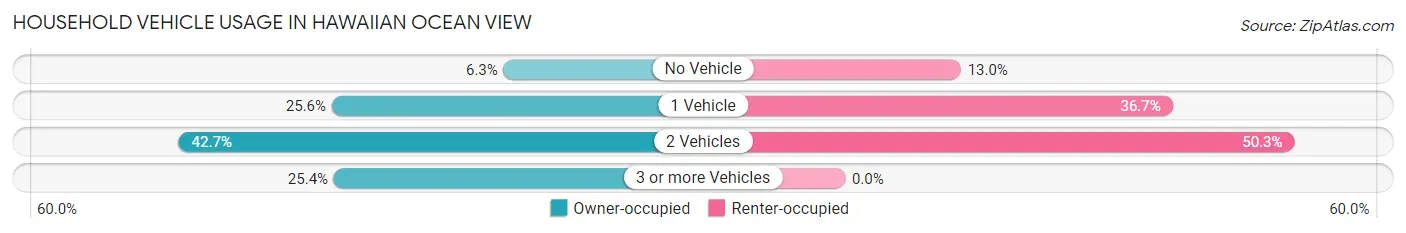
| Vehicles per Household | Owner-occupied | Renter-occupied |
| No Vehicle | 82 (6.3%) | 59 (13.0%) |
| 1 Vehicle | 331 (25.6%) | 167 (36.7%) |
| 2 Vehicles | 553 (42.7%) | 229 (50.3%) |
| 3 or more Vehicles | 328 (25.4%) | 0 (0.0%) |
| Total | 1,294 (100.0%) | 455 (100.0%) |
Real Estate & Mortgages in Hawaiian Ocean View
Real Estate and Mortgage Overview in Hawaiian Ocean View
| Characteristic | Without Mortgage | With Mortgage |
| Housing Units | 784 | 510 |
| Median Property Value | $172,200 | $222,800 |
| Median Household Income | - | - |
| Monthly Housing Costs | $264 | $0 |
| Real Estate Taxes | - | - |
Property Value by Mortgage Status in Hawaiian Ocean View
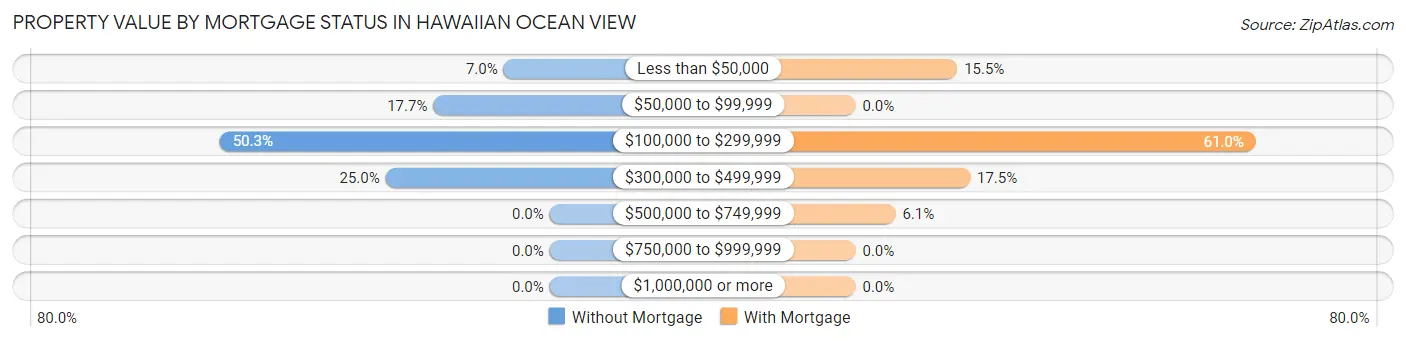
| Property Value | Without Mortgage | With Mortgage |
| Less than $50,000 | 55 (7.0%) | 79 (15.5%) |
| $50,000 to $99,999 | 139 (17.7%) | 0 (0.0%) |
| $100,000 to $299,999 | 394 (50.3%) | 311 (61.0%) |
| $300,000 to $499,999 | 196 (25.0%) | 89 (17.4%) |
| $500,000 to $749,999 | 0 (0.0%) | 31 (6.1%) |
| $750,000 to $999,999 | 0 (0.0%) | 0 (0.0%) |
| $1,000,000 or more | 0 (0.0%) | 0 (0.0%) |
| Total | 784 (100.0%) | 510 (100.0%) |
Household Income by Mortgage Status in Hawaiian Ocean View
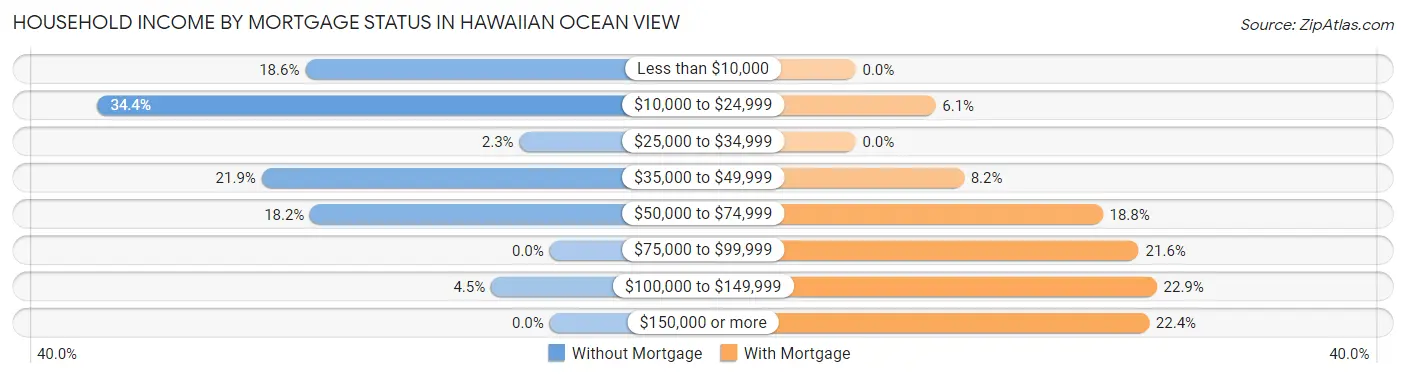
| Household Income | Without Mortgage | With Mortgage |
| Less than $10,000 | 146 (18.6%) | 0 (0.0%) |
| $10,000 to $24,999 | 270 (34.4%) | 31 (6.1%) |
| $25,000 to $34,999 | 18 (2.3%) | 0 (0.0%) |
| $35,000 to $49,999 | 172 (21.9%) | 42 (8.2%) |
| $50,000 to $74,999 | 143 (18.2%) | 96 (18.8%) |
| $75,000 to $99,999 | 0 (0.0%) | 110 (21.6%) |
| $100,000 to $149,999 | 35 (4.5%) | 117 (22.9%) |
| $150,000 or more | 0 (0.0%) | 114 (22.4%) |
| Total | 784 (100.0%) | 510 (100.0%) |
Property Value to Household Income Ratio in Hawaiian Ocean View
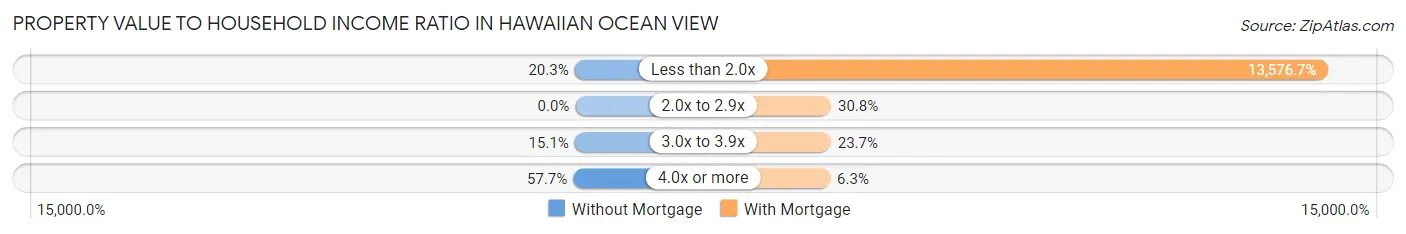
| Value-to-Income Ratio | Without Mortgage | With Mortgage |
| Less than 2.0x | 159 (20.3%) | 69,241 (13,576.7%) |
| 2.0x to 2.9x | 0 (0.0%) | 157 (30.8%) |
| 3.0x to 3.9x | 118 (15.0%) | 121 (23.7%) |
| 4.0x or more | 452 (57.7%) | 32 (6.3%) |
| Total | 784 (100.0%) | 510 (100.0%) |
Real Estate Taxes by Mortgage Status in Hawaiian Ocean View
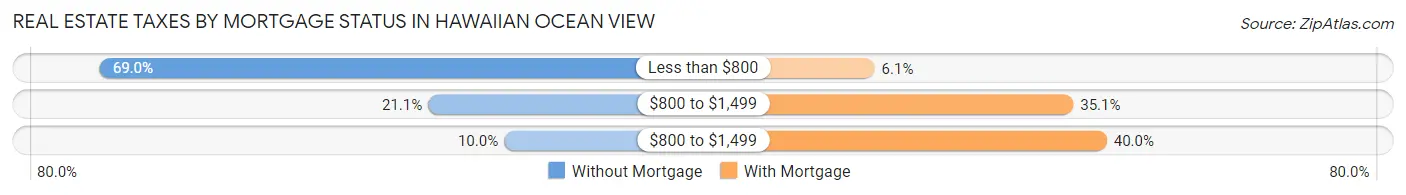
| Property Taxes | Without Mortgage | With Mortgage |
| Less than $800 | 541 (69.0%) | 31 (6.1%) |
| $800 to $1,499 | 165 (21.0%) | 179 (35.1%) |
| $800 to $1,499 | 78 (10.0%) | 204 (40.0%) |
| Total | 784 (100.0%) | 510 (100.0%) |
Health & Disability in Hawaiian Ocean View
Health Insurance Coverage by Age in Hawaiian Ocean View
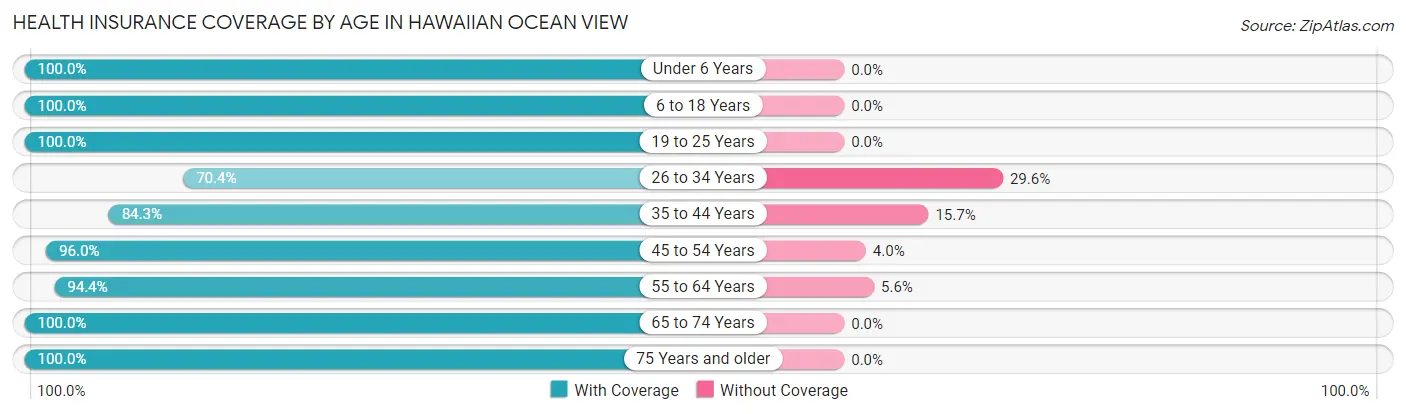
| Age Bracket | With Coverage | Without Coverage |
| Under 6 Years | 399 (100.0%) | 0 (0.0%) |
| 6 to 18 Years | 296 (100.0%) | 0 (0.0%) |
| 19 to 25 Years | 98 (100.0%) | 0 (0.0%) |
| 26 to 34 Years | 395 (70.4%) | 166 (29.6%) |
| 35 to 44 Years | 333 (84.3%) | 62 (15.7%) |
| 45 to 54 Years | 524 (96.0%) | 22 (4.0%) |
| 55 to 64 Years | 442 (94.4%) | 26 (5.6%) |
| 65 to 74 Years | 665 (100.0%) | 0 (0.0%) |
| 75 Years and older | 159 (100.0%) | 0 (0.0%) |
| Total | 3,311 (92.3%) | 276 (7.7%) |
Health Insurance Coverage by Citizenship Status in Hawaiian Ocean View
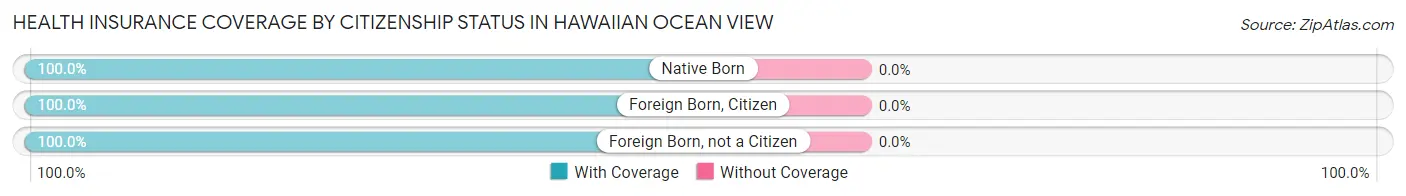
| Citizenship Status | With Coverage | Without Coverage |
| Native Born | 399 (100.0%) | 0 (0.0%) |
| Foreign Born, Citizen | 296 (100.0%) | 0 (0.0%) |
| Foreign Born, not a Citizen | 98 (100.0%) | 0 (0.0%) |
Health Insurance Coverage by Household Income in Hawaiian Ocean View
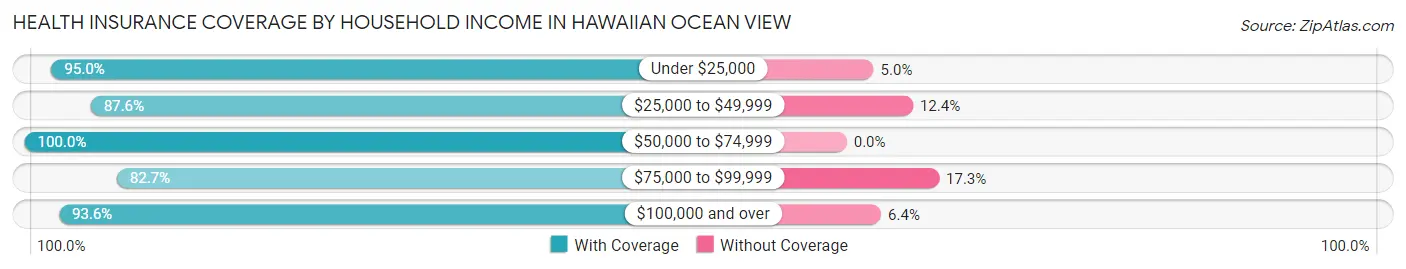
| Household Income | With Coverage | Without Coverage |
| Under $25,000 | 1,077 (95.0%) | 57 (5.0%) |
| $25,000 to $49,999 | 770 (87.6%) | 109 (12.4%) |
| $50,000 to $74,999 | 636 (100.0%) | 0 (0.0%) |
| $75,000 to $99,999 | 378 (82.7%) | 79 (17.3%) |
| $100,000 and over | 450 (93.6%) | 31 (6.4%) |
Public vs Private Health Insurance Coverage by Age in Hawaiian Ocean View
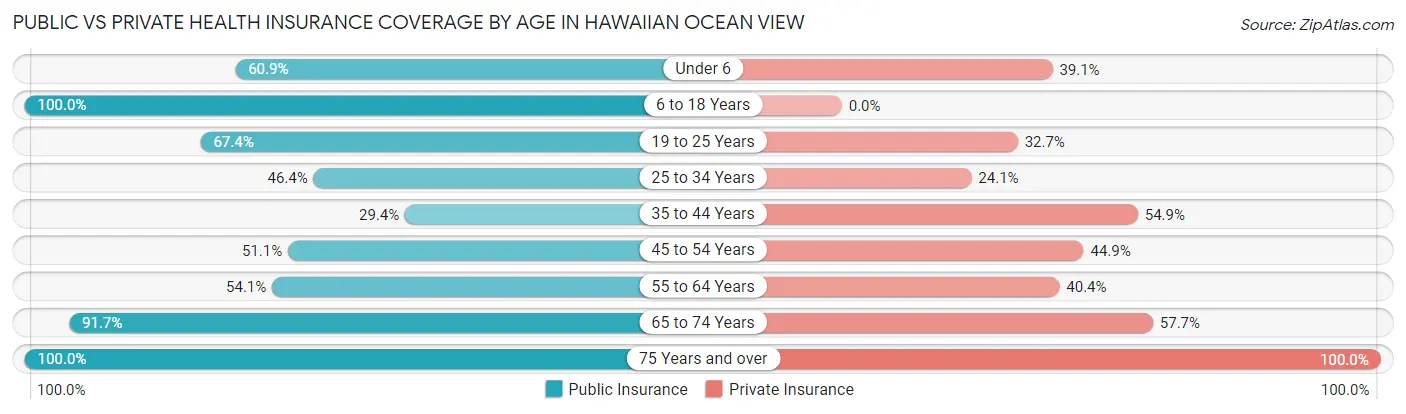
| Age Bracket | Public Insurance | Private Insurance |
| Under 6 | 243 (60.9%) | 156 (39.1%) |
| 6 to 18 Years | 296 (100.0%) | 0 (0.0%) |
| 19 to 25 Years | 66 (67.3%) | 32 (32.7%) |
| 25 to 34 Years | 260 (46.4%) | 135 (24.1%) |
| 35 to 44 Years | 116 (29.4%) | 217 (54.9%) |
| 45 to 54 Years | 279 (51.1%) | 245 (44.9%) |
| 55 to 64 Years | 253 (54.1%) | 189 (40.4%) |
| 65 to 74 Years | 610 (91.7%) | 384 (57.7%) |
| 75 Years and over | 159 (100.0%) | 159 (100.0%) |
| Total | 2,282 (63.6%) | 1,517 (42.3%) |
Disability Status by Sex by Age in Hawaiian Ocean View
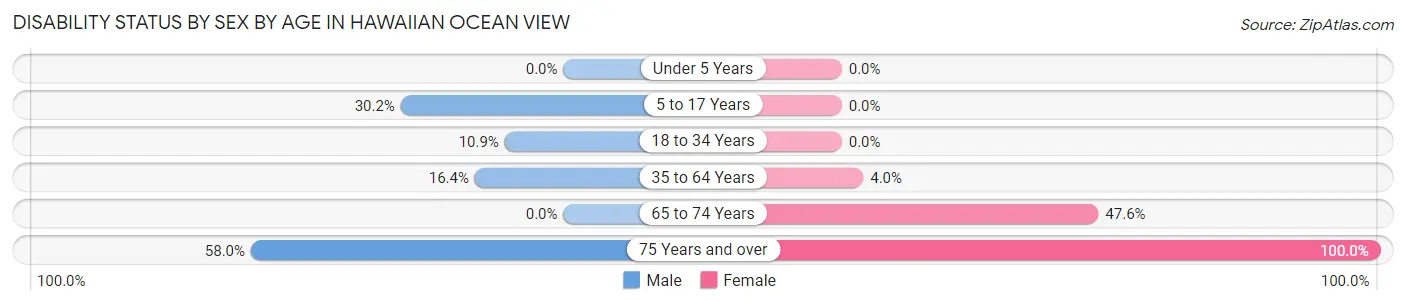
| Age Bracket | Male | Female |
| Under 5 Years | 0 (0.0%) | 0 (0.0%) |
| 5 to 17 Years | 64 (30.2%) | 0 (0.0%) |
| 18 to 34 Years | 28 (10.9%) | 0 (0.0%) |
| 35 to 64 Years | 141 (16.4%) | 22 (4.0%) |
| 65 to 74 Years | 0 (0.0%) | 161 (47.6%) |
| 75 Years and over | 58 (58.0%) | 59 (100.0%) |
Disability Class by Sex by Age in Hawaiian Ocean View
Disability Class: Hearing Difficulty
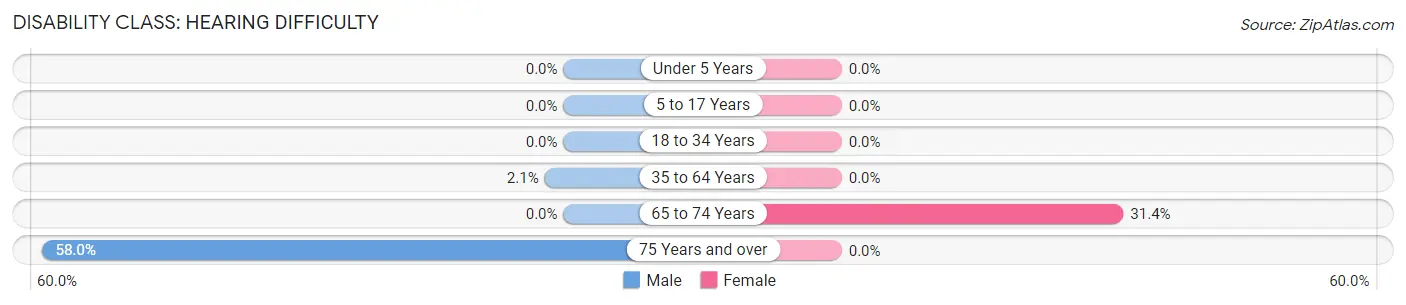
| Age Bracket | Male | Female |
| Under 5 Years | 0 (0.0%) | 0 (0.0%) |
| 5 to 17 Years | 0 (0.0%) | 0 (0.0%) |
| 18 to 34 Years | 0 (0.0%) | 0 (0.0%) |
| 35 to 64 Years | 18 (2.1%) | 0 (0.0%) |
| 65 to 74 Years | 0 (0.0%) | 106 (31.4%) |
| 75 Years and over | 58 (58.0%) | 0 (0.0%) |
Disability Class: Vision Difficulty
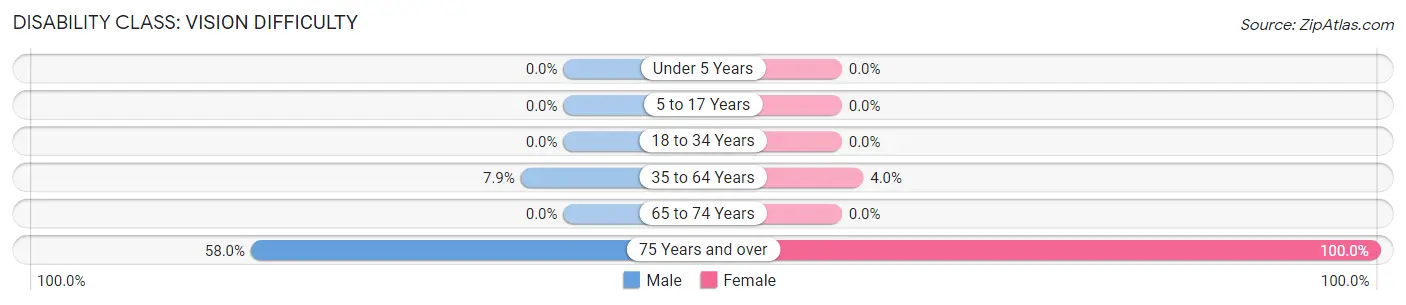
| Age Bracket | Male | Female |
| Under 5 Years | 0 (0.0%) | 0 (0.0%) |
| 5 to 17 Years | 0 (0.0%) | 0 (0.0%) |
| 18 to 34 Years | 0 (0.0%) | 0 (0.0%) |
| 35 to 64 Years | 68 (7.9%) | 22 (4.0%) |
| 65 to 74 Years | 0 (0.0%) | 0 (0.0%) |
| 75 Years and over | 58 (58.0%) | 59 (100.0%) |
Disability Class: Cognitive Difficulty
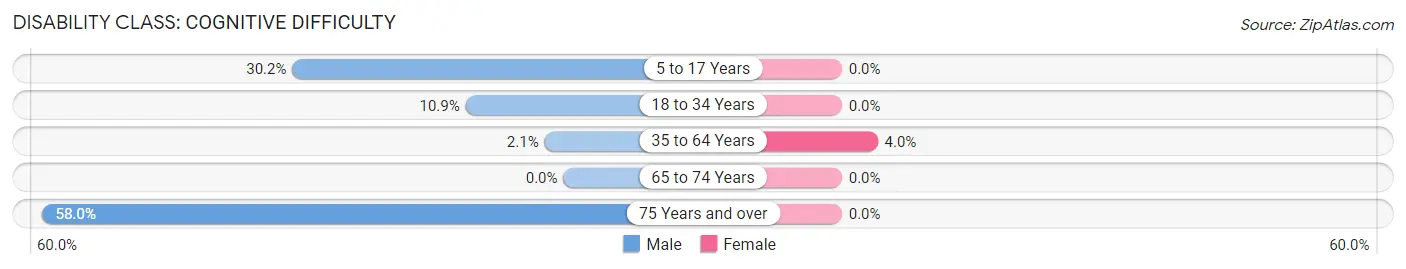
| Age Bracket | Male | Female |
| 5 to 17 Years | 64 (30.2%) | 0 (0.0%) |
| 18 to 34 Years | 28 (10.9%) | 0 (0.0%) |
| 35 to 64 Years | 18 (2.1%) | 22 (4.0%) |
| 65 to 74 Years | 0 (0.0%) | 0 (0.0%) |
| 75 Years and over | 58 (58.0%) | 0 (0.0%) |
Disability Class: Ambulatory Difficulty
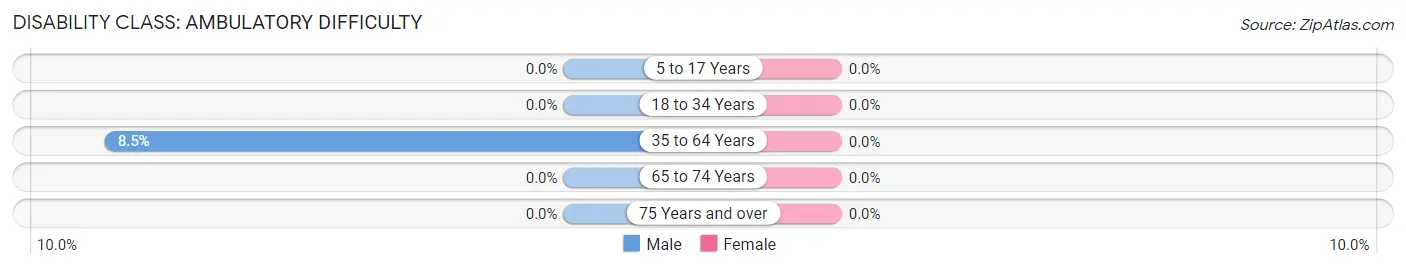
| Age Bracket | Male | Female |
| 5 to 17 Years | 0 (0.0%) | 0 (0.0%) |
| 18 to 34 Years | 0 (0.0%) | 0 (0.0%) |
| 35 to 64 Years | 73 (8.5%) | 0 (0.0%) |
| 65 to 74 Years | 0 (0.0%) | 0 (0.0%) |
| 75 Years and over | 0 (0.0%) | 0 (0.0%) |
Disability Class: Self-Care Difficulty
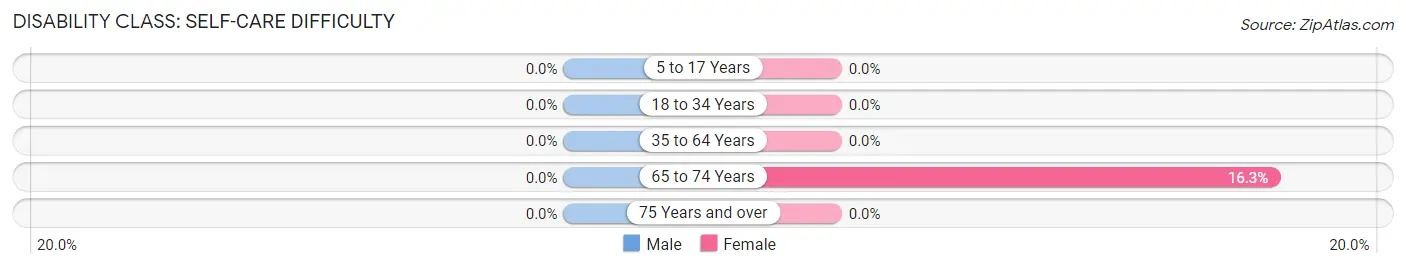
| Age Bracket | Male | Female |
| 5 to 17 Years | 0 (0.0%) | 0 (0.0%) |
| 18 to 34 Years | 0 (0.0%) | 0 (0.0%) |
| 35 to 64 Years | 0 (0.0%) | 0 (0.0%) |
| 65 to 74 Years | 0 (0.0%) | 55 (16.3%) |
| 75 Years and over | 0 (0.0%) | 0 (0.0%) |
Technology Access in Hawaiian Ocean View
Computing Device Access in Hawaiian Ocean View
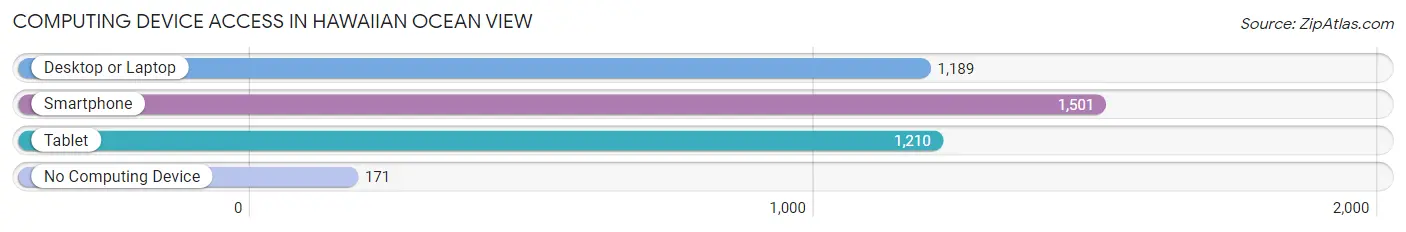
| Device Type | # Households | % Households |
| Desktop or Laptop | 1,189 | 68.0% |
| Smartphone | 1,501 | 85.8% |
| Tablet | 1,210 | 69.2% |
| No Computing Device | 171 | 9.8% |
| Total | 1,749 | 100.0% |
Internet Access in Hawaiian Ocean View
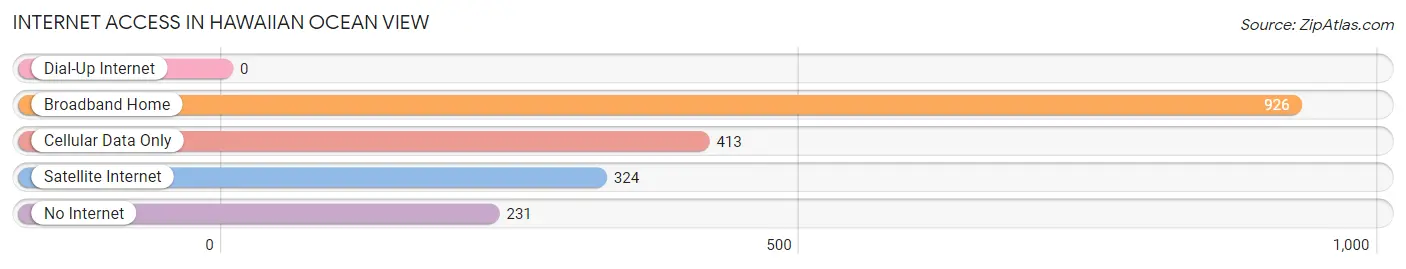
| Internet Type | # Households | % Households |
| Dial-Up Internet | 0 | 0.0% |
| Broadband Home | 926 | 52.9% |
| Cellular Data Only | 413 | 23.6% |
| Satellite Internet | 324 | 18.5% |
| No Internet | 231 | 13.2% |
| Total | 1,749 | 100.0% |
Hawaiian Ocean View Summary
Hawaiian Ocean View is a census-designated place (CDP) located in the Kaʻū District on the Big Island of Hawaii in the United States. The population was 1,976 at the 2010 census.
Geography
Hawaiian Ocean View is located at coordinates 19°25′N 155°37′W. It is located at an elevation of 1,890 feet (576 m). The CDP has a total area of 4.2 square miles (10.8 km2), all of it land.
History
The area now known as Hawaiian Ocean View was first settled by Native Hawaiians in the late 1700s. The area was used for farming and ranching, and the land was divided into ahupuaʻa, or traditional land divisions. In the early 1900s, the area was developed for sugar cane production. The Hawaiian Ocean View Sugar Company was established in the area in the 1920s, and the company built a railroad to transport the sugar cane to the nearby port of Kawaihae. The company also built a school and a store in the area.
In the 1950s, the sugar cane industry began to decline, and the Hawaiian Ocean View Sugar Company closed in 1959. The area then became a residential community, and the population began to grow. In the 1970s, the area was annexed by the County of Hawaii, and the Hawaiian Ocean View CDP was established in 1980.
Economy
The economy of Hawaiian Ocean View is largely based on tourism and agriculture. The area is home to several tourist attractions, including the Hawaiian Ocean View Ranch, which offers horseback riding, ATV tours, and other activities. The area is also home to several farms, which produce coffee, macadamia nuts, and other crops.
Demographics
As of the 2010 census, there were 1,976 people, 690 households, and 517 families residing in the CDP. The population density was 471.2 people per square mile (182.1/km2). There were 790 housing units at an average density of 189.3 per square mile (73.0/km2). The racial makeup of the CDP was 64.2% White, 0.3% African American, 0.3% Native American, 11.2% Asian, 0.2% Pacific Islander, 19.2% from other races, and 4.7% from two or more races. Hispanic or Latino of any race were 28.2% of the population.
There were 690 households, out of which 33.3% had children under the age of 18 living with them, 54.3% were married couples living together, 11.3% had a female householder with no husband present, and 28.3% were non-families. 22.2% of all households were made up of individuals, and 8.3% had someone living alone who was 65 years of age or older. The average household size was 2.86 and the average family size was 3.37.
In the CDP, the population was spread out, with 25.7% under the age of 18, 8.2% from 18 to 24, 25.2% from 25 to 44, 28.2% from 45 to 64, and 12.7% who were 65 years of age or older. The median age was 38 years. For every 100 females, there were 103.2 males. For every 100 females age 18 and over, there were 103.2 males.
The median income for a household in the CDP was $45,938, and the median income for a family was $50,000. Males had a median income of $31,250 versus $25,000 for females. The per capita income for the CDP was $19,945. About 8.3% of families and 11.2% of the population were below the poverty line, including 15.2% of those under age 18 and 4.2% of those age 65 or over.
Common Questions
What is Per Capita Income in Hawaiian Ocean View?
Per Capita income in Hawaiian Ocean View is $23,132.
What is the Median Family Income in Hawaiian Ocean View?
Median Family Income in Hawaiian Ocean View is $44,250.
What is the Median Household income in Hawaiian Ocean View?
Median Household Income in Hawaiian Ocean View is $36,462.
What is Income or Wage Gap in Hawaiian Ocean View?
Income or Wage Gap in Hawaiian Ocean View is 32.8%.
Women in Hawaiian Ocean View earn 67.2 cents for every dollar earned by a man.
What is Inequality or Gini Index in Hawaiian Ocean View?
Inequality or Gini Index in Hawaiian Ocean View is 0.45.
What is the Total Population of Hawaiian Ocean View?
Total Population of Hawaiian Ocean View is 3,587.
What is the Total Male Population of Hawaiian Ocean View?
Total Male Population of Hawaiian Ocean View is 1,832.
What is the Total Female Population of Hawaiian Ocean View?
Total Female Population of Hawaiian Ocean View is 1,755.
What is the Ratio of Males per 100 Females in Hawaiian Ocean View?
There are 104.39 Males per 100 Females in Hawaiian Ocean View.
What is the Ratio of Females per 100 Males in Hawaiian Ocean View?
There are 95.80 Females per 100 Males in Hawaiian Ocean View.
What is the Median Population Age in Hawaiian Ocean View?
Median Population Age in Hawaiian Ocean View is 47.3 Years.
What is the Average Family Size in Hawaiian Ocean View
Average Family Size in Hawaiian Ocean View is 2.8 People.
What is the Average Household Size in Hawaiian Ocean View
Average Household Size in Hawaiian Ocean View is 2.0 People.
How Large is the Labor Force in Hawaiian Ocean View?
There are 1,391 People in the Labor Forcein in Hawaiian Ocean View.
What is the Percentage of People in the Labor Force in Hawaiian Ocean View?
47.4% of People are in the Labor Force in Hawaiian Ocean View.
What is the Unemployment Rate in Hawaiian Ocean View?
Unemployment Rate in Hawaiian Ocean View is 11.9%.