Indian Hills, NM Map & Demographics
Indian Hills Map
Indian Hills Overview
$32,469
PER CAPITA INCOME
$68,403
AVG FAMILY INCOME
$57,431
AVG HOUSEHOLD INCOME
45.5%
WAGE / INCOME GAP [ % ]
54.5¢/ $1
WAGE / INCOME GAP [ $ ]
0.53
INEQUALITY / GINI INDEX
1,197
TOTAL POPULATION
511
MALE POPULATION
686
FEMALE POPULATION
74.49
MALES / 100 FEMALES
134.25
FEMALES / 100 MALES
40.2
MEDIAN AGE
3.7
AVG FAMILY SIZE
3.3
AVG HOUSEHOLD SIZE
542
LABOR FORCE [ PEOPLE ]
55.1%
PERCENT IN LABOR FORCE
19.4%
UNEMPLOYMENT RATE
Income in Indian Hills
Income Overview in Indian Hills
Per Capita Income in Indian Hills is $32,469, while median incomes of families and households are $68,403 and $57,431 respectively.
| Characteristic | Number | Measure |
| Per Capita Income | 1,197 | $32,469 |
| Median Family Income | 287 | $68,403 |
| Mean Family Income | 287 | $90,485 |
| Median Household Income | 358 | $57,431 |
| Mean Household Income | 358 | $104,408 |
| Income Deficit | 287 | $0 |
| Wage / Income Gap (%) | 1,197 | 45.53% |
| Wage / Income Gap ($) | 1,197 | 54.47¢ per $1 |
| Gini / Inequality Index | 1,197 | 0.53 |
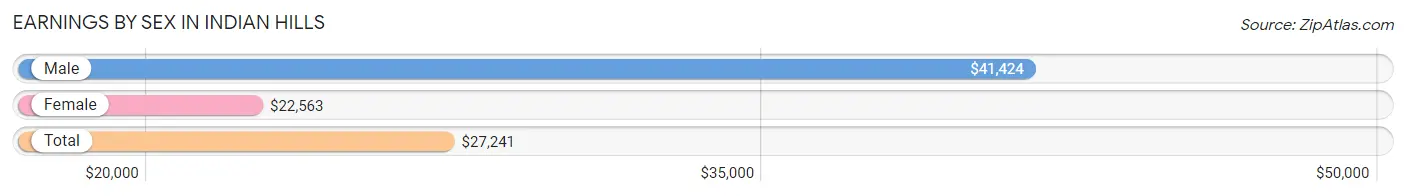
Earnings by Sex in Indian Hills
Average Earnings in Indian Hills are $27,241, $41,424 for men and $22,563 for women, a difference of 45.5%.
| Sex | Number | Average Earnings |
| Male | 255 (49.2%) | $41,424 |
| Female | 263 (50.8%) | $22,563 |
| Total | 518 (100.0%) | $27,241 |
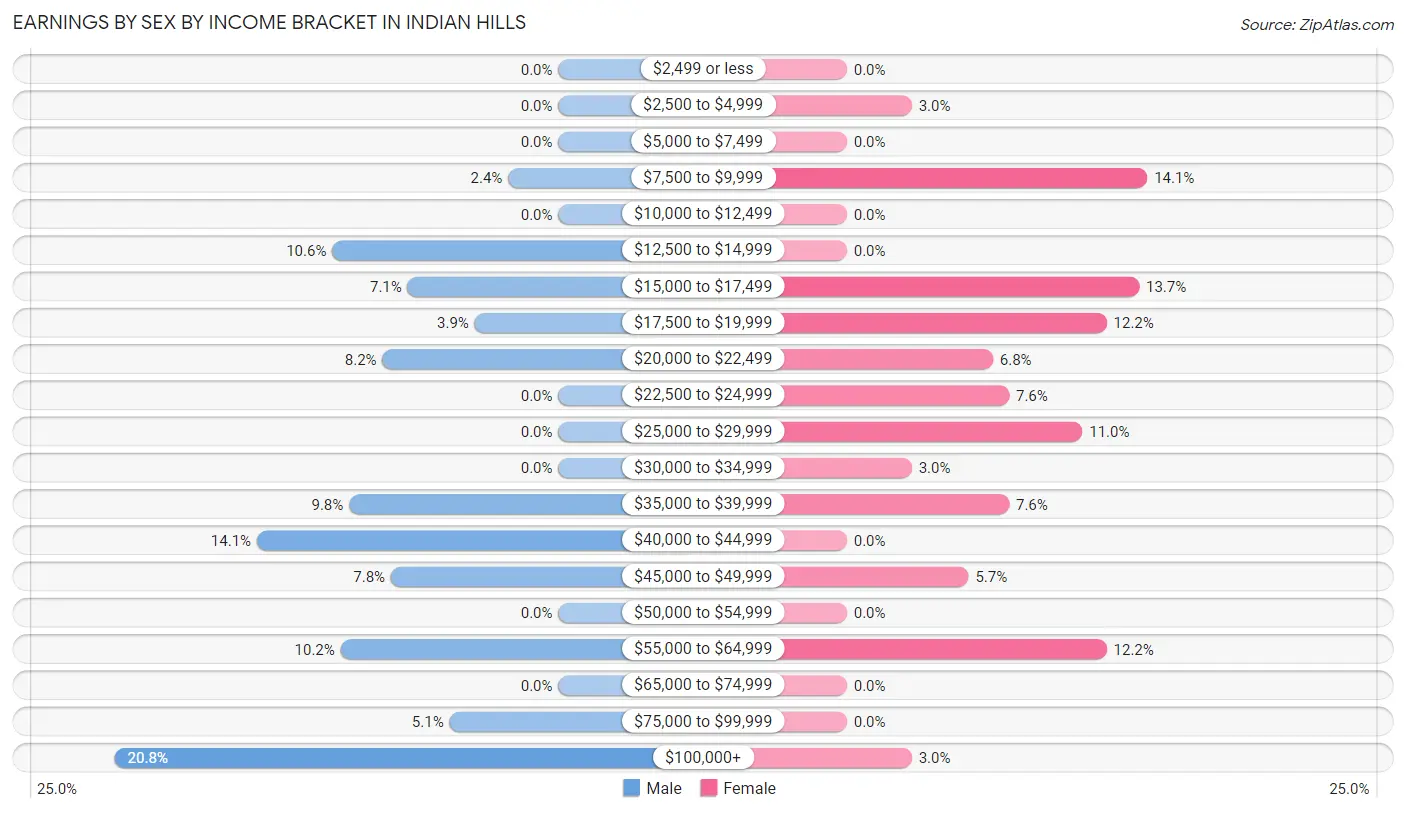
Earnings by Sex by Income Bracket in Indian Hills
The most common earnings brackets in Indian Hills are $100,000+ for men (53 | 20.8%) and $7,500 to $9,999 for women (37 | 14.1%).
| Income | Male | Female |
| $2,499 or less | 0 (0.0%) | 0 (0.0%) |
| $2,500 to $4,999 | 0 (0.0%) | 8 (3.0%) |
| $5,000 to $7,499 | 0 (0.0%) | 0 (0.0%) |
| $7,500 to $9,999 | 6 (2.4%) | 37 (14.1%) |
| $10,000 to $12,499 | 0 (0.0%) | 0 (0.0%) |
| $12,500 to $14,999 | 27 (10.6%) | 0 (0.0%) |
| $15,000 to $17,499 | 18 (7.1%) | 36 (13.7%) |
| $17,500 to $19,999 | 10 (3.9%) | 32 (12.2%) |
| $20,000 to $22,499 | 21 (8.2%) | 18 (6.8%) |
| $22,500 to $24,999 | 0 (0.0%) | 20 (7.6%) |
| $25,000 to $29,999 | 0 (0.0%) | 29 (11.0%) |
| $30,000 to $34,999 | 0 (0.0%) | 8 (3.0%) |
| $35,000 to $39,999 | 25 (9.8%) | 20 (7.6%) |
| $40,000 to $44,999 | 36 (14.1%) | 0 (0.0%) |
| $45,000 to $49,999 | 20 (7.8%) | 15 (5.7%) |
| $50,000 to $54,999 | 0 (0.0%) | 0 (0.0%) |
| $55,000 to $64,999 | 26 (10.2%) | 32 (12.2%) |
| $65,000 to $74,999 | 0 (0.0%) | 0 (0.0%) |
| $75,000 to $99,999 | 13 (5.1%) | 0 (0.0%) |
| $100,000+ | 53 (20.8%) | 8 (3.0%) |
| Total | 255 (100.0%) | 263 (100.0%) |
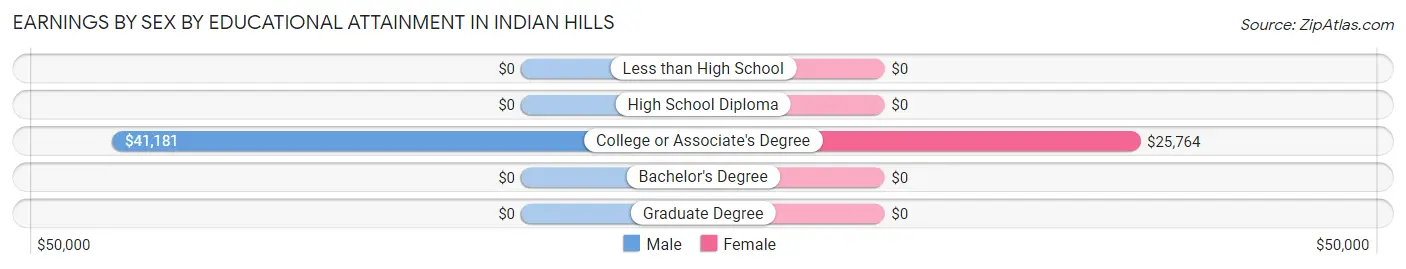
Earnings by Sex by Educational Attainment in Indian Hills
Average earnings in Indian Hills are $42,153 for men and $25,345 for women, a difference of 39.9%. Men with an educational attainment of college or associate's degree enjoy the highest average annual earnings of $41,181, while those with college or associate's degree education earn the least with $41,181. Women with an educational attainment of college or associate's degree earn the most with the average annual earnings of $25,764, while those with college or associate's degree education have the smallest earnings of $25,764.
| Educational Attainment | Male Income | Female Income |
| Less than High School | - | - |
| High School Diploma | - | - |
| College or Associate's Degree | $41,181 | $25,764 |
| Bachelor's Degree | - | - |
| Graduate Degree | - | - |
| Total | $42,153 | $25,345 |
Family Income in Indian Hills
Family Income Brackets in Indian Hills
According to the Indian Hills family income data, there are 92 families falling into the $35,000 to $49,999 income range, which is the most common income bracket and makes up 32.1% of all families.
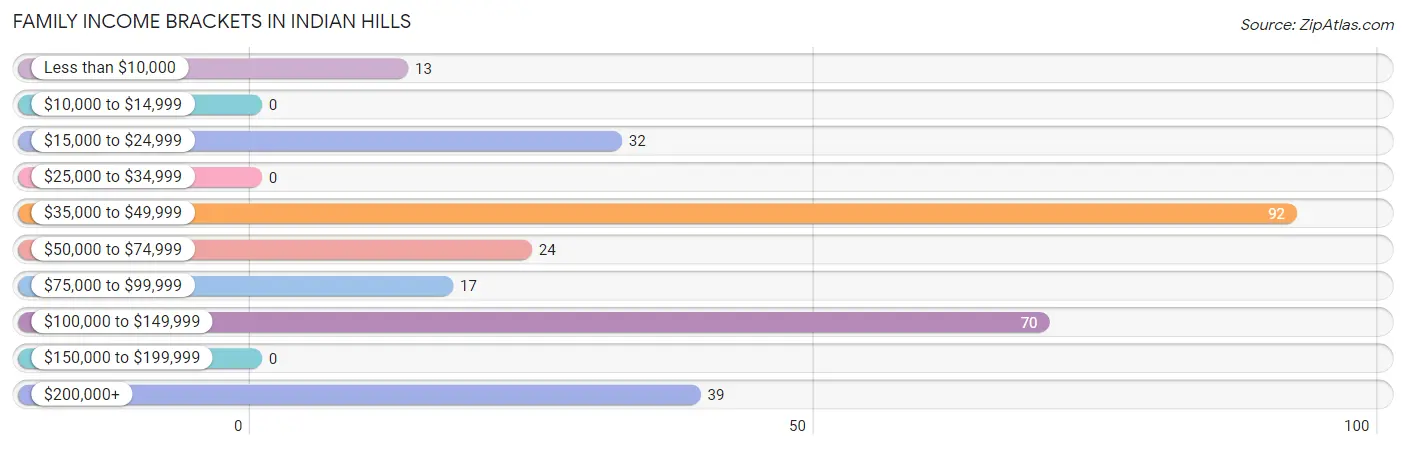
| Income Bracket | # Families | % Families |
| Less than $10,000 | 13 | 4.5% |
| $10,000 to $14,999 | 0 | 0.0% |
| $15,000 to $24,999 | 32 | 11.1% |
| $25,000 to $34,999 | 0 | 0.0% |
| $35,000 to $49,999 | 92 | 32.1% |
| $50,000 to $74,999 | 24 | 8.4% |
| $75,000 to $99,999 | 17 | 5.9% |
| $100,000 to $149,999 | 70 | 24.4% |
| $150,000 to $199,999 | 0 | 0.0% |
| $200,000+ | 39 | 13.6% |
Family Income by Famaliy Size in Indian Hills
5-person families (57 | 19.9%) account for the highest median family income in Indian Hills with $248,173 per family, while 5-person families (57 | 19.9%) have the highest median income of $49,635 per family member.
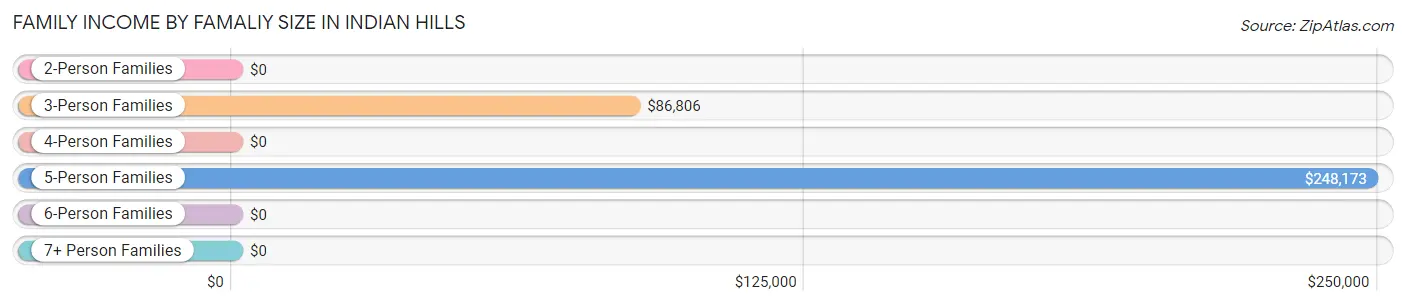
| Income Bracket | # Families | Median Income |
| 2-Person Families | 120 (41.8%) | $0 |
| 3-Person Families | 67 (23.3%) | $86,806 |
| 4-Person Families | 37 (12.9%) | $0 |
| 5-Person Families | 57 (19.9%) | $248,173 |
| 6-Person Families | 6 (2.1%) | $0 |
| 7+ Person Families | 0 (0.0%) | $0 |
| Total | 287 (100.0%) | $68,403 |
Family Income by Number of Earners in Indian Hills
The median family income in Indian Hills is $68,403, with families comprising 2 earners (109) having the highest median family income of $142,847, while families with no earners (71) have the lowest median family income of $38,480, accounting for 38.0% and 24.7% of families, respectively.
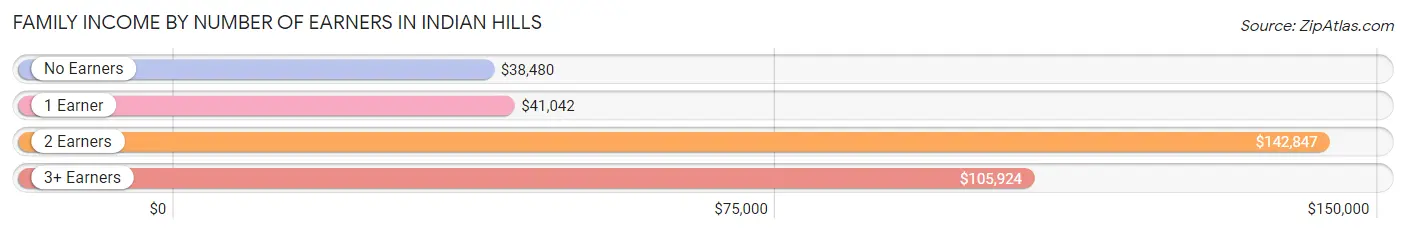
| Number of Earners | # Families | Median Income |
| No Earners | 71 (24.7%) | $38,480 |
| 1 Earner | 78 (27.2%) | $41,042 |
| 2 Earners | 109 (38.0%) | $142,847 |
| 3+ Earners | 29 (10.1%) | $105,924 |
| Total | 287 (100.0%) | $68,403 |
Household Income in Indian Hills
Household Income Brackets in Indian Hills
With 81 households falling in the category, the $100,000 to $149,999 income range is the most frequent in Indian Hills, accounting for 22.6% of all households.
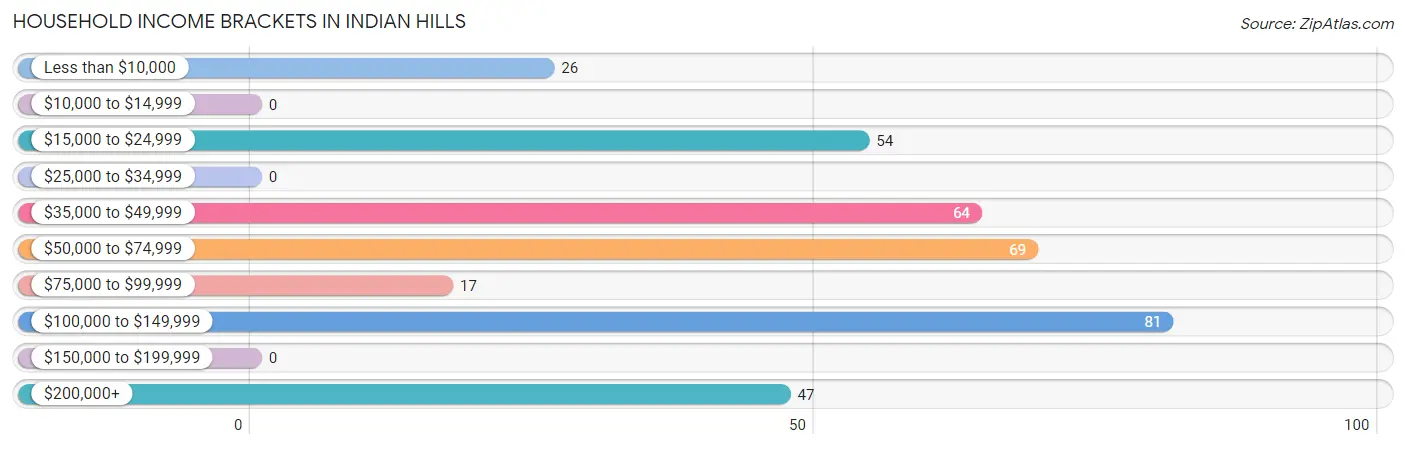
| Income Bracket | # Households | % Households |
| Less than $10,000 | 26 | 7.3% |
| $10,000 to $14,999 | 0 | 0.0% |
| $15,000 to $24,999 | 54 | 15.1% |
| $25,000 to $34,999 | 0 | 0.0% |
| $35,000 to $49,999 | 64 | 17.9% |
| $50,000 to $74,999 | 69 | 19.3% |
| $75,000 to $99,999 | 17 | 4.7% |
| $100,000 to $149,999 | 81 | 22.6% |
| $150,000 to $199,999 | 0 | 0.0% |
| $200,000+ | 47 | 13.1% |
Household Income by Householder Age in Indian Hills
The median household income in Indian Hills is $57,431, with the highest median household income of $106,033 found in the 45 to 64 years age bracket for the primary householder. A total of 211 households (58.9%) fall into this category.
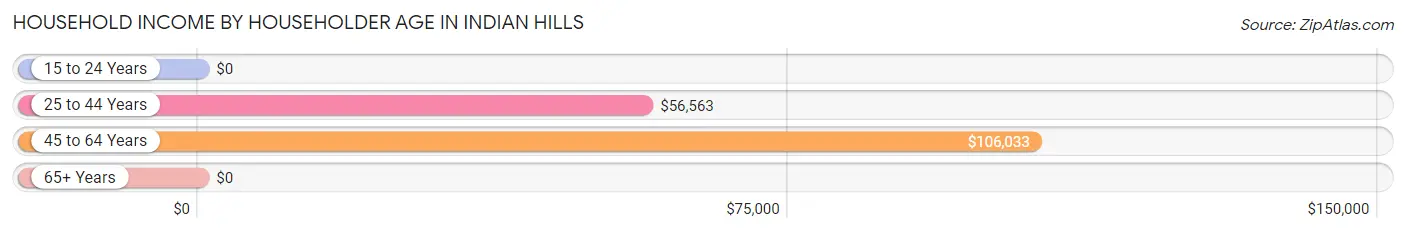
| Income Bracket | # Households | Median Income |
| 15 to 24 Years | 0 (0.0%) | $0 |
| 25 to 44 Years | 81 (22.6%) | $56,563 |
| 45 to 64 Years | 211 (58.9%) | $106,033 |
| 65+ Years | 66 (18.4%) | $0 |
| Total | 358 (100.0%) | $57,431 |
Poverty in Indian Hills
Income Below Poverty by Sex and Age in Indian Hills
With 14.5% poverty level for males and 16.2% for females among the residents of Indian Hills, under 5 year old males and 65 to 74 year old females are the most vulnerable to poverty, with 9 males (100.0%) and 37 females (46.8%) in their respective age groups living below the poverty level.
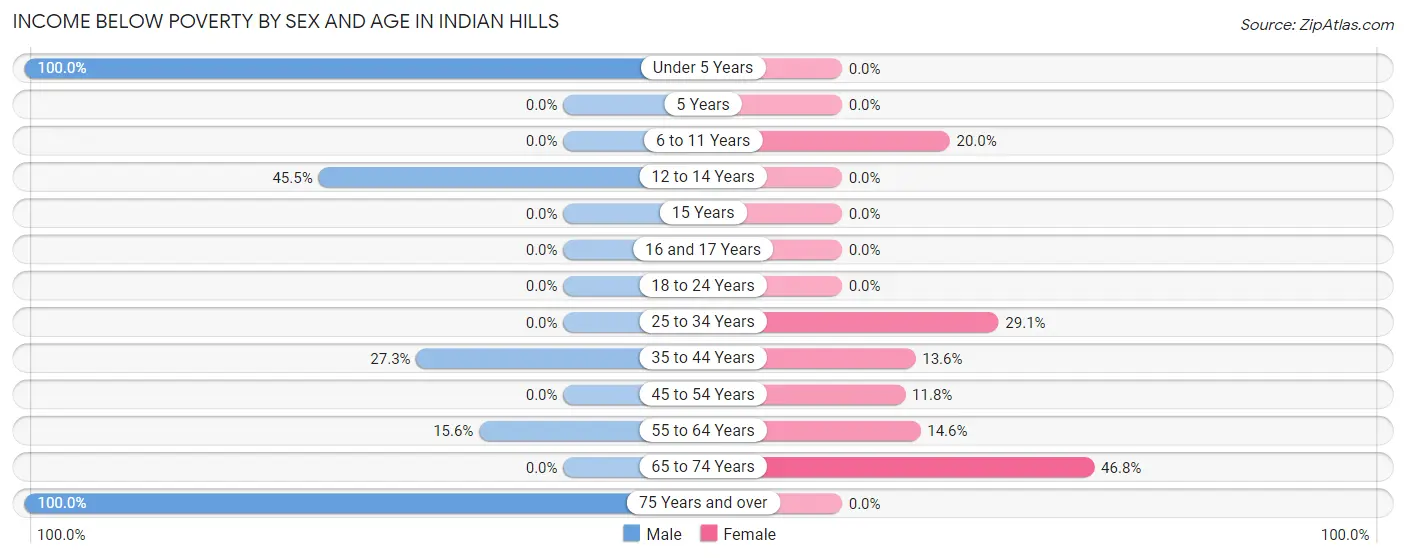
| Age Bracket | Male | Female |
| Under 5 Years | 9 (100.0%) | 0 (0.0%) |
| 5 Years | 0 (0.0%) | 0 (0.0%) |
| 6 to 11 Years | 0 (0.0%) | 10 (20.0%) |
| 12 to 14 Years | 10 (45.5%) | 0 (0.0%) |
| 15 Years | 0 (0.0%) | 0 (0.0%) |
| 16 and 17 Years | 0 (0.0%) | 0 (0.0%) |
| 18 to 24 Years | 0 (0.0%) | 0 (0.0%) |
| 25 to 34 Years | 0 (0.0%) | 25 (29.1%) |
| 35 to 44 Years | 18 (27.3%) | 9 (13.6%) |
| 45 to 54 Years | 0 (0.0%) | 8 (11.8%) |
| 55 to 64 Years | 15 (15.6%) | 22 (14.6%) |
| 65 to 74 Years | 0 (0.0%) | 37 (46.8%) |
| 75 Years and over | 22 (100.0%) | 0 (0.0%) |
| Total | 74 (14.5%) | 111 (16.2%) |
Income Above Poverty by Sex and Age in Indian Hills
According to the poverty statistics in Indian Hills, males aged 6 to 11 years and females aged under 5 years are the age groups that are most secure financially, with 100.0% of males and 100.0% of females in these age groups living above the poverty line.
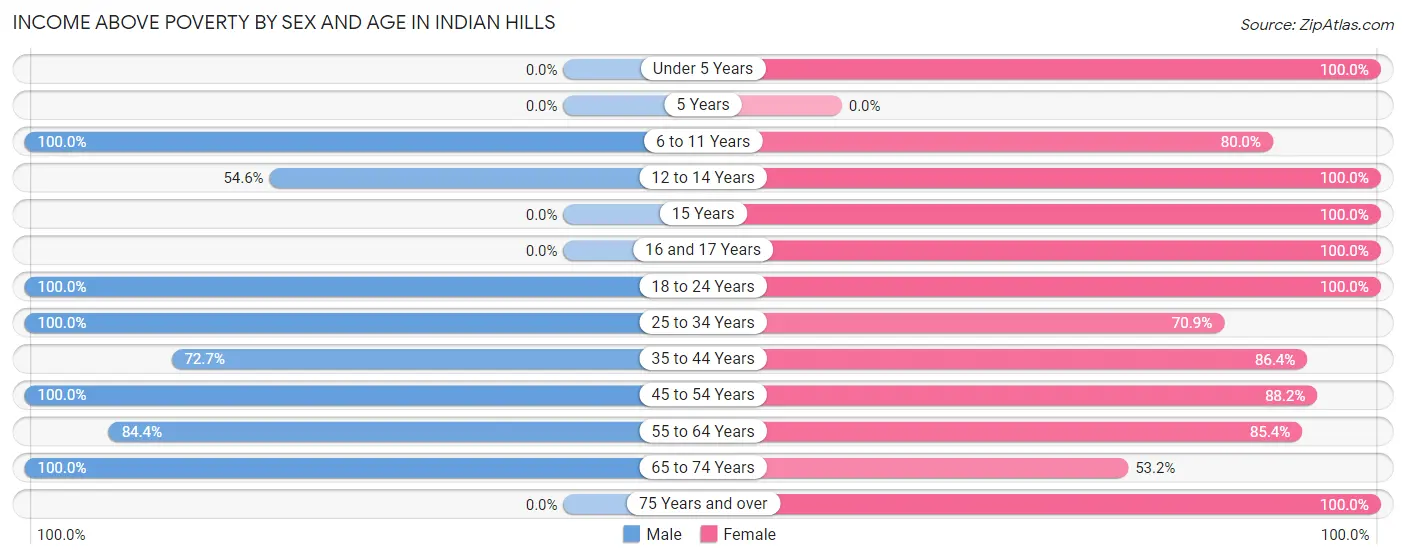
| Age Bracket | Male | Female |
| Under 5 Years | 0 (0.0%) | 33 (100.0%) |
| 5 Years | 0 (0.0%) | 0 (0.0%) |
| 6 to 11 Years | 45 (100.0%) | 40 (80.0%) |
| 12 to 14 Years | 12 (54.5%) | 39 (100.0%) |
| 15 Years | 0 (0.0%) | 16 (100.0%) |
| 16 and 17 Years | 0 (0.0%) | 10 (100.0%) |
| 18 to 24 Years | 21 (100.0%) | 37 (100.0%) |
| 25 to 34 Years | 129 (100.0%) | 61 (70.9%) |
| 35 to 44 Years | 48 (72.7%) | 57 (86.4%) |
| 45 to 54 Years | 48 (100.0%) | 60 (88.2%) |
| 55 to 64 Years | 81 (84.4%) | 129 (85.4%) |
| 65 to 74 Years | 53 (100.0%) | 42 (53.2%) |
| 75 Years and over | 0 (0.0%) | 51 (100.0%) |
| Total | 437 (85.5%) | 575 (83.8%) |
Income Below Poverty Among Married-Couple Families in Indian Hills
The poverty statistics for married-couple families in Indian Hills show that 6.2% or 12 of the total 194 families live below the poverty line. Families with no children have the highest poverty rate of 10.3%, comprising of 12 families. On the other hand, families with 1 or 2 children have the lowest poverty rate of 0.0%, which includes 0 families.
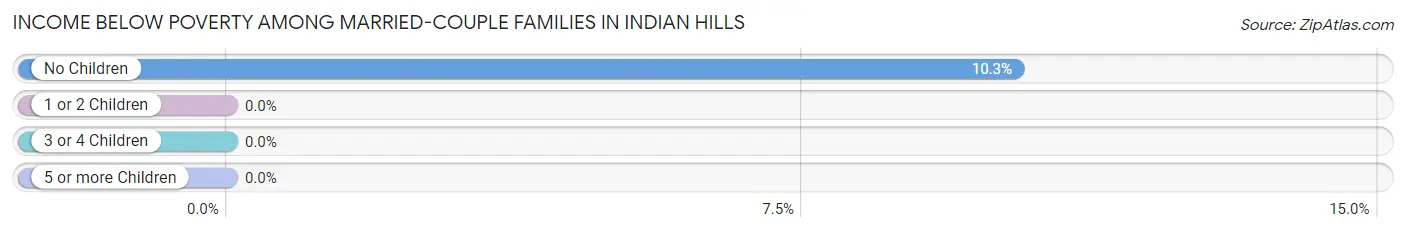
| Children | Above Poverty | Below Poverty |
| No Children | 105 (89.7%) | 12 (10.3%) |
| 1 or 2 Children | 67 (100.0%) | 0 (0.0%) |
| 3 or 4 Children | 10 (100.0%) | 0 (0.0%) |
| 5 or more Children | 0 (0.0%) | 0 (0.0%) |
| Total | 182 (93.8%) | 12 (6.2%) |
Income Below Poverty Among Single-Parent Households in Indian Hills
According to the poverty data in Indian Hills, 24.0% or 18 single-father households and 50.0% or 9 single-mother households are living below the poverty line. Among single-father households, those with no children have the highest poverty rate, with 18 households (58.1%) experiencing poverty. Likewise, among single-mother households, those with 3 or 4 children have the highest poverty rate, with 9 households (100.0%) falling below the poverty line.
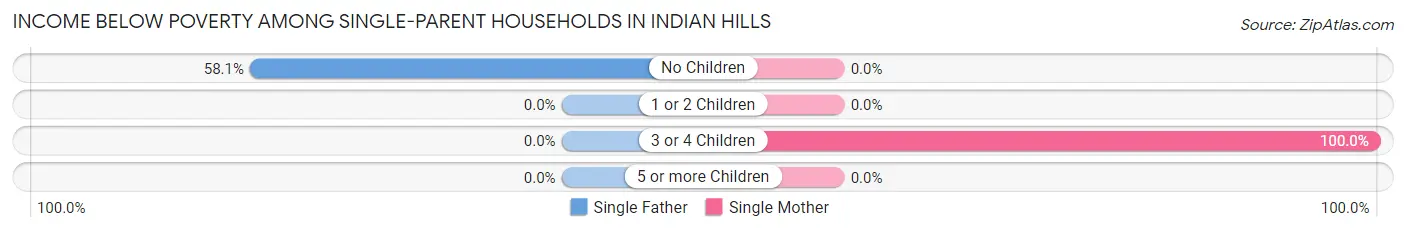
| Children | Single Father | Single Mother |
| No Children | 18 (58.1%) | 0 (0.0%) |
| 1 or 2 Children | 0 (0.0%) | 0 (0.0%) |
| 3 or 4 Children | 0 (0.0%) | 9 (100.0%) |
| 5 or more Children | 0 (0.0%) | 0 (0.0%) |
| Total | 18 (24.0%) | 9 (50.0%) |
Income Below Poverty Among Married-Couple vs Single-Parent Households in Indian Hills
The poverty data for Indian Hills shows that 12 of the married-couple family households (6.2%) and 27 of the single-parent households (29.0%) are living below the poverty level. Within the married-couple family households, those with no children have the highest poverty rate, with 12 households (10.3%) falling below the poverty line. Among the single-parent households, those with 3 or 4 children have the highest poverty rate, with 9 household (100.0%) living below poverty.
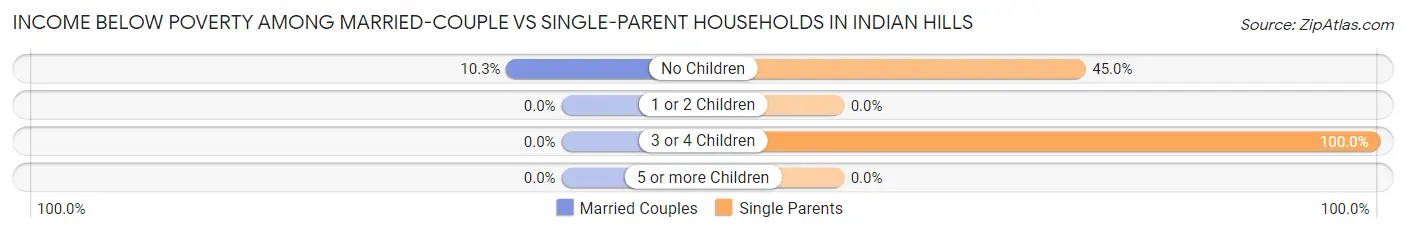
| Children | Married-Couple Families | Single-Parent Households |
| No Children | 12 (10.3%) | 18 (45.0%) |
| 1 or 2 Children | 0 (0.0%) | 0 (0.0%) |
| 3 or 4 Children | 0 (0.0%) | 9 (100.0%) |
| 5 or more Children | 0 (0.0%) | 0 (0.0%) |
| Total | 12 (6.2%) | 27 (29.0%) |
Race in Indian Hills
The most populous races in Indian Hills are White / Caucasian (883 | 73.8%), Hispanic or Latino (472 | 39.4%), and Two or more Races (147 | 12.3%).
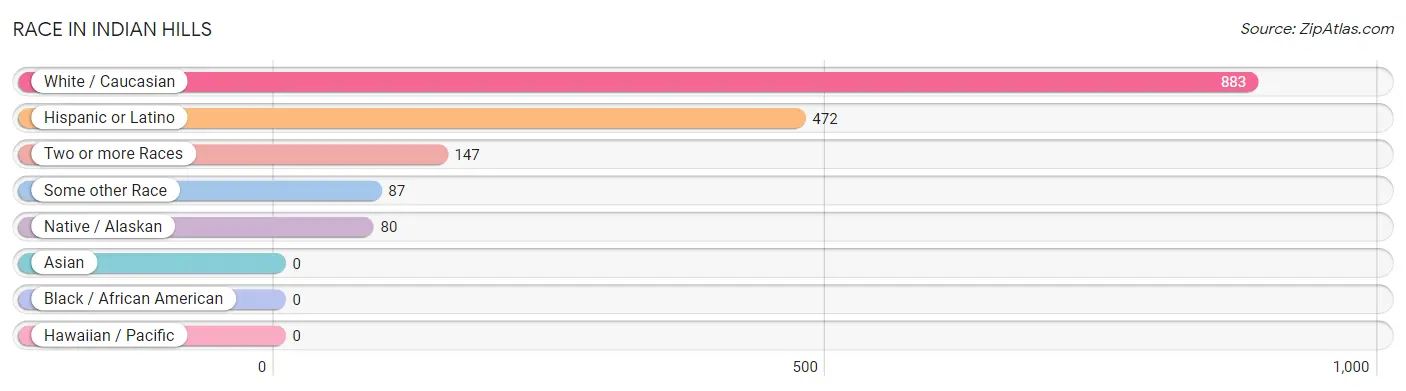
| Race | # Population | % Population |
| Asian | 0 | 0.0% |
| Black / African American | 0 | 0.0% |
| Hawaiian / Pacific | 0 | 0.0% |
| Hispanic or Latino | 472 | 39.4% |
| Native / Alaskan | 80 | 6.7% |
| White / Caucasian | 883 | 73.8% |
| Two or more Races | 147 | 12.3% |
| Some other Race | 87 | 7.3% |
| Total | 1,197 | 100.0% |
Ancestry in Indian Hills
The most populous ancestries reported in Indian Hills are Mexican (365 | 30.5%), Irish (254 | 21.2%), German (231 | 19.3%), American (112 | 9.4%), and Central American (80 | 6.7%), together accounting for 87.0% of all Indian Hills residents.
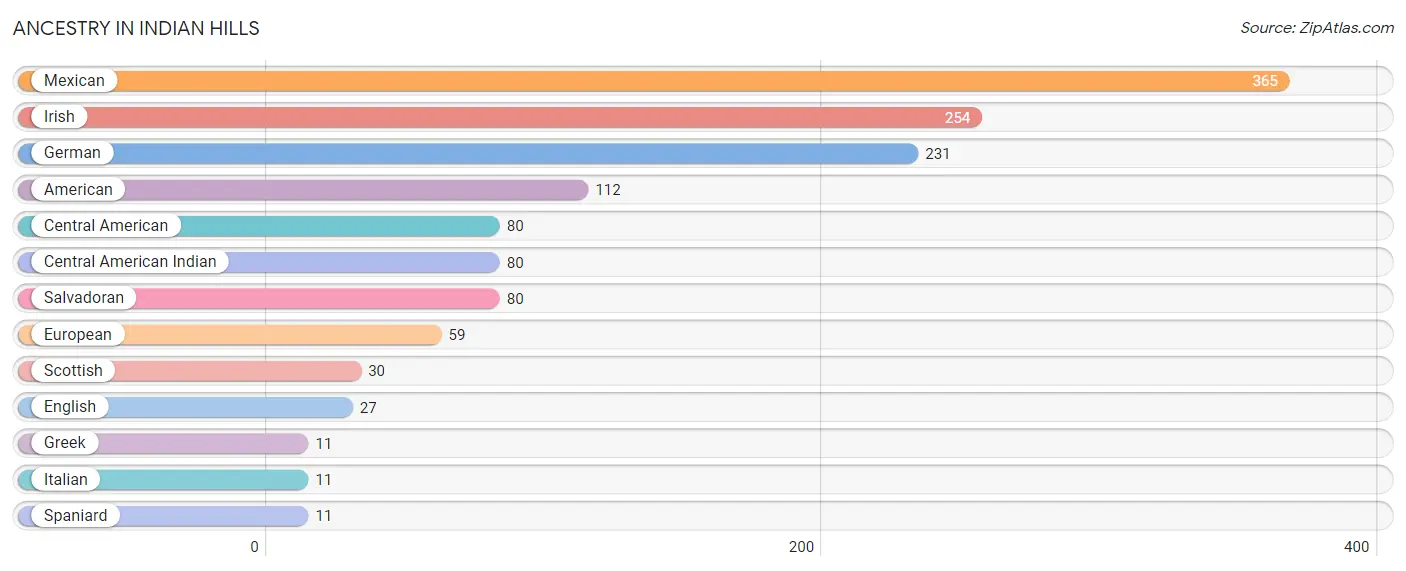
| Ancestry | # Population | % Population |
| American | 112 | 9.4% |
| Central American | 80 | 6.7% |
| Central American Indian | 80 | 6.7% |
| English | 27 | 2.3% |
| European | 59 | 4.9% |
| German | 231 | 19.3% |
| Greek | 11 | 0.9% |
| Irish | 254 | 21.2% |
| Italian | 11 | 0.9% |
| Mexican | 365 | 30.5% |
| Salvadoran | 80 | 6.7% |
| Scottish | 30 | 2.5% |
| Spaniard | 11 | 0.9% | View All 13 Rows |
Immigrants in Indian Hills
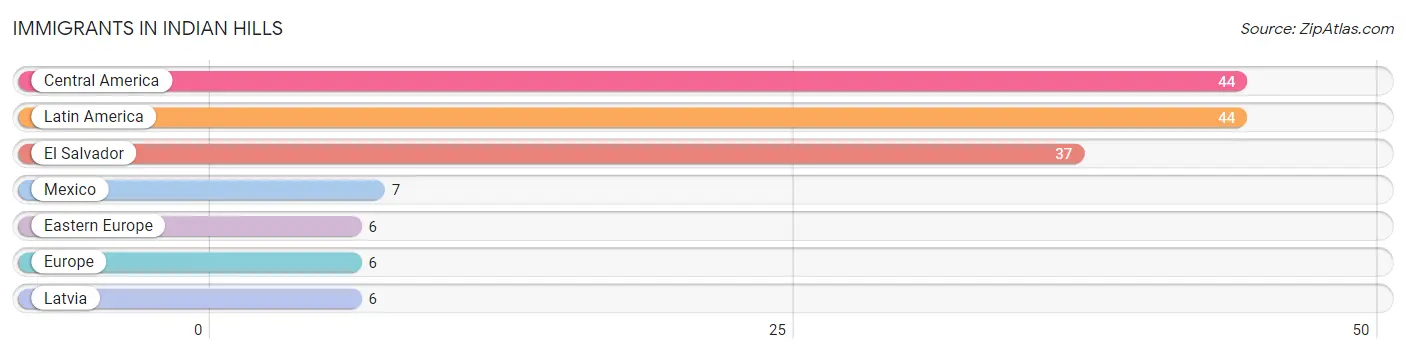
The most numerous immigrant groups reported in Indian Hills came from Central America (44 | 3.7%), Latin America (44 | 3.7%), El Salvador (37 | 3.1%), Mexico (7 | 0.6%), and Eastern Europe (6 | 0.5%), together accounting for 11.5% of all Indian Hills residents.
| Immigration Origin | # Population | % Population |
| Central America | 44 | 3.7% |
| Eastern Europe | 6 | 0.5% |
| El Salvador | 37 | 3.1% |
| Europe | 6 | 0.5% |
| Latin America | 44 | 3.7% |
| Latvia | 6 | 0.5% |
| Mexico | 7 | 0.6% | View All 7 Rows |
Sex and Age in Indian Hills
Sex and Age in Indian Hills
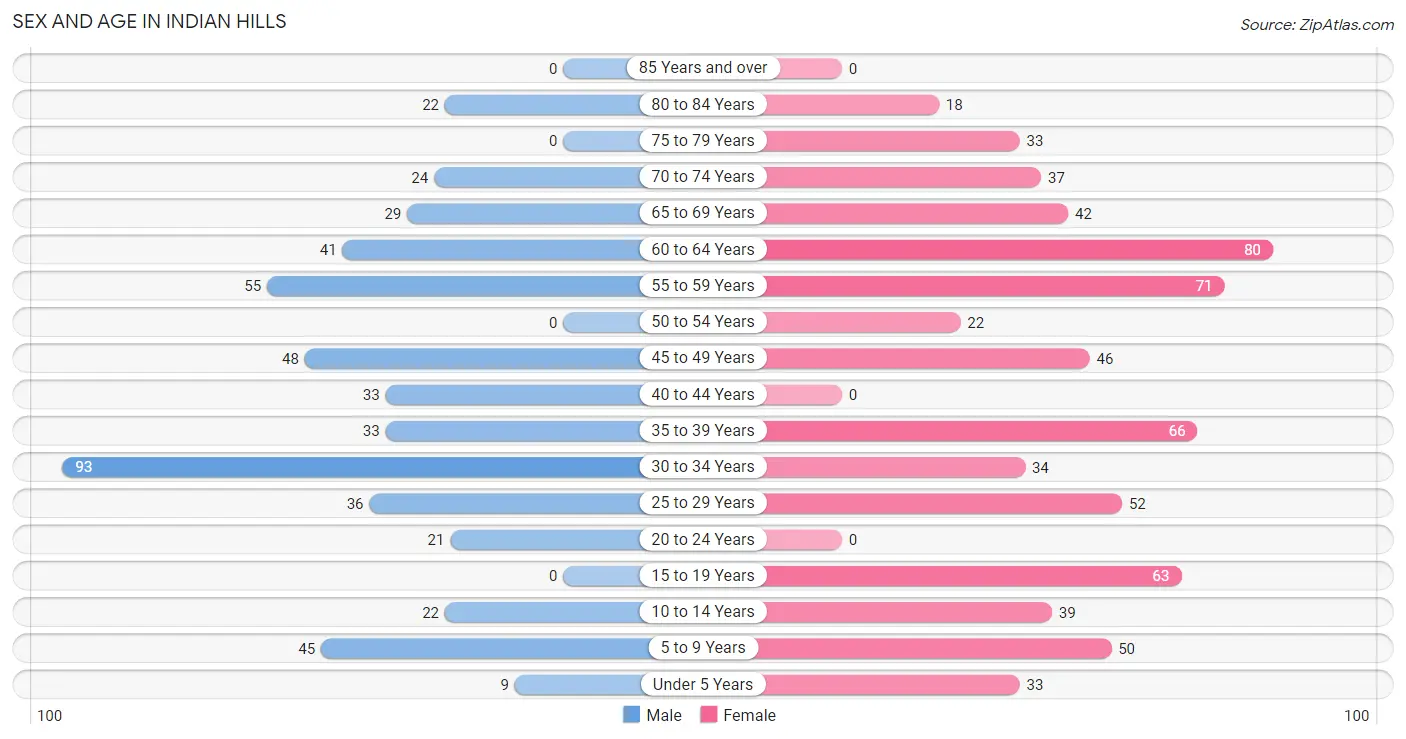
The most populous age groups in Indian Hills are 30 to 34 Years (93 | 18.2%) for men and 60 to 64 Years (80 | 11.7%) for women.
| Age Bracket | Male | Female |
| Under 5 Years | 9 (1.8%) | 33 (4.8%) |
| 5 to 9 Years | 45 (8.8%) | 50 (7.3%) |
| 10 to 14 Years | 22 (4.3%) | 39 (5.7%) |
| 15 to 19 Years | 0 (0.0%) | 63 (9.2%) |
| 20 to 24 Years | 21 (4.1%) | 0 (0.0%) |
| 25 to 29 Years | 36 (7.0%) | 52 (7.6%) |
| 30 to 34 Years | 93 (18.2%) | 34 (5.0%) |
| 35 to 39 Years | 33 (6.5%) | 66 (9.6%) |
| 40 to 44 Years | 33 (6.5%) | 0 (0.0%) |
| 45 to 49 Years | 48 (9.4%) | 46 (6.7%) |
| 50 to 54 Years | 0 (0.0%) | 22 (3.2%) |
| 55 to 59 Years | 55 (10.8%) | 71 (10.3%) |
| 60 to 64 Years | 41 (8.0%) | 80 (11.7%) |
| 65 to 69 Years | 29 (5.7%) | 42 (6.1%) |
| 70 to 74 Years | 24 (4.7%) | 37 (5.4%) |
| 75 to 79 Years | 0 (0.0%) | 33 (4.8%) |
| 80 to 84 Years | 22 (4.3%) | 18 (2.6%) |
| 85 Years and over | 0 (0.0%) | 0 (0.0%) |
| Total | 511 (100.0%) | 686 (100.0%) |
Families and Households in Indian Hills
Median Family Size in Indian Hills
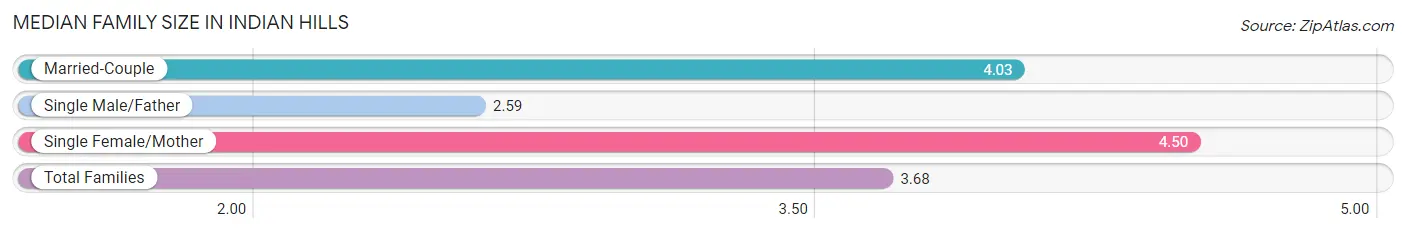
The median family size in Indian Hills is 3.68 persons per family, with single female/mother families (18 | 6.3%) accounting for the largest median family size of 4.5 persons per family. On the other hand, single male/father families (75 | 26.1%) represent the smallest median family size with 2.59 persons per family.
| Family Type | # Families | Family Size |
| Married-Couple | 194 (67.6%) | 4.03 |
| Single Male/Father | 75 (26.1%) | 2.59 |
| Single Female/Mother | 18 (6.3%) | 4.50 |
| Total Families | 287 (100.0%) | 3.68 |
Median Household Size in Indian Hills
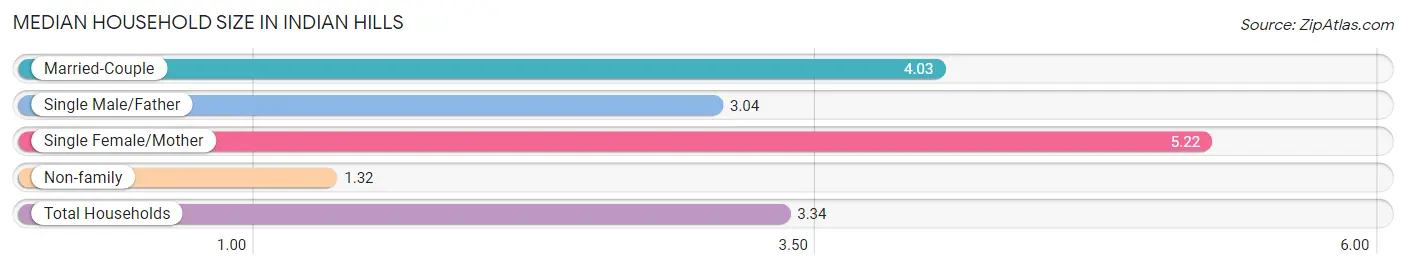
The median household size in Indian Hills is 3.34 persons per household, with single female/mother households (18 | 5.0%) accounting for the largest median household size of 5.22 persons per household. non-family households (71 | 19.8%) represent the smallest median household size with 1.32 persons per household.
| Household Type | # Households | Household Size |
| Married-Couple | 194 (54.2%) | 4.03 |
| Single Male/Father | 75 (20.9%) | 3.04 |
| Single Female/Mother | 18 (5.0%) | 5.22 |
| Non-family | 71 (19.8%) | 1.32 |
| Total Households | 358 (100.0%) | 3.34 |
Household Size by Marriage Status in Indian Hills
Out of a total of 358 households in Indian Hills, 287 (80.2%) are family households, while 71 (19.8%) are nonfamily households. The most numerous type of family households are 3-person households, comprising 116, and the most common type of nonfamily households are 1-person households, comprising 52.
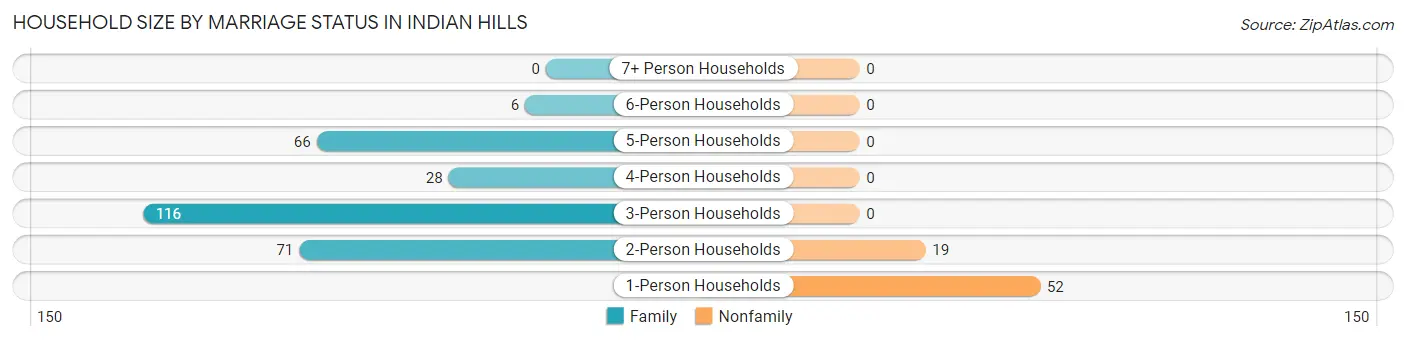
| Household Size | Family Households | Nonfamily Households |
| 1-Person Households | - | 52 (14.5%) |
| 2-Person Households | 71 (19.8%) | 19 (5.3%) |
| 3-Person Households | 116 (32.4%) | 0 (0.0%) |
| 4-Person Households | 28 (7.8%) | 0 (0.0%) |
| 5-Person Households | 66 (18.4%) | 0 (0.0%) |
| 6-Person Households | 6 (1.7%) | 0 (0.0%) |
| 7+ Person Households | 0 (0.0%) | 0 (0.0%) |
| Total | 287 (80.2%) | 71 (19.8%) |
Female Fertility in Indian Hills
Fertility by Age in Indian Hills
Average fertility rate in Indian Hills is 96.0 births per 1,000 women. Women in the age bracket of 20 to 34 years have the highest fertility rate with 291.0 births per 1,000 women. Women in the age bracket of 20 to 34 years acount for 100.0% of all women with births.
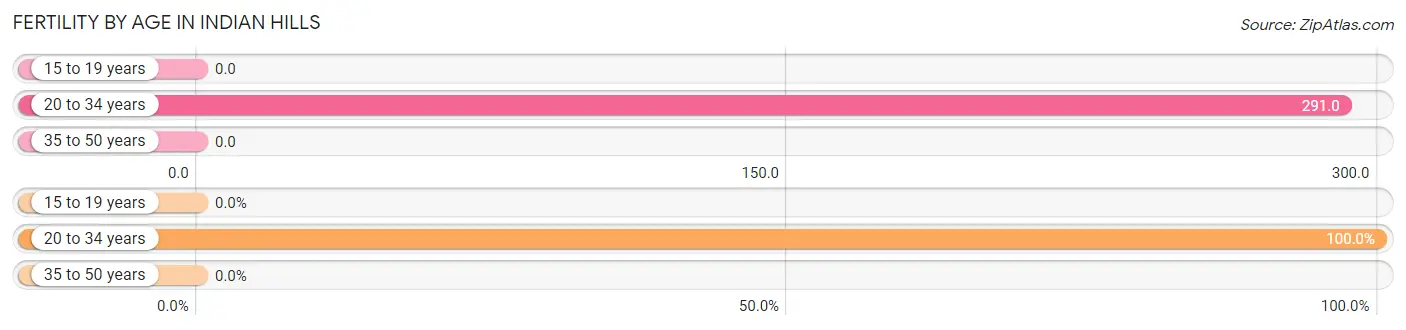
| Age Bracket | Women with Births | Births / 1,000 Women |
| 15 to 19 years | 0 (0.0%) | 0.0 |
| 20 to 34 years | 25 (100.0%) | 291.0 |
| 35 to 50 years | 0 (0.0%) | 0.0 |
| Total | 25 (100.0%) | 96.0 |
Fertility by Age by Marriage Status in Indian Hills
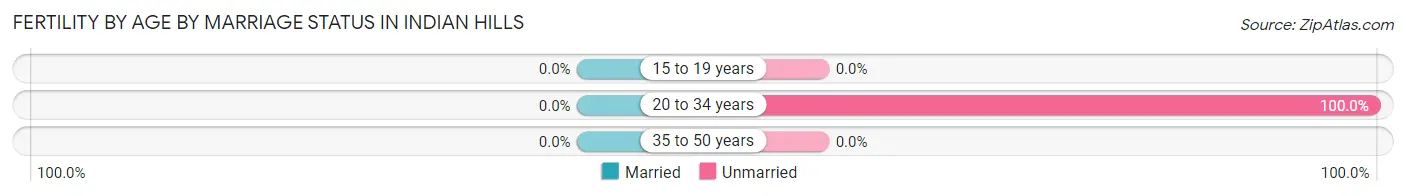
| Age Bracket | Married | Unmarried |
| 15 to 19 years | 0 (0.0%) | 0 (0.0%) |
| 20 to 34 years | 0 (0.0%) | 25 (100.0%) |
| 35 to 50 years | 0 (0.0%) | 0 (0.0%) |
| Total | 0 (0.0%) | 25 (100.0%) |
Fertility by Education in Indian Hills
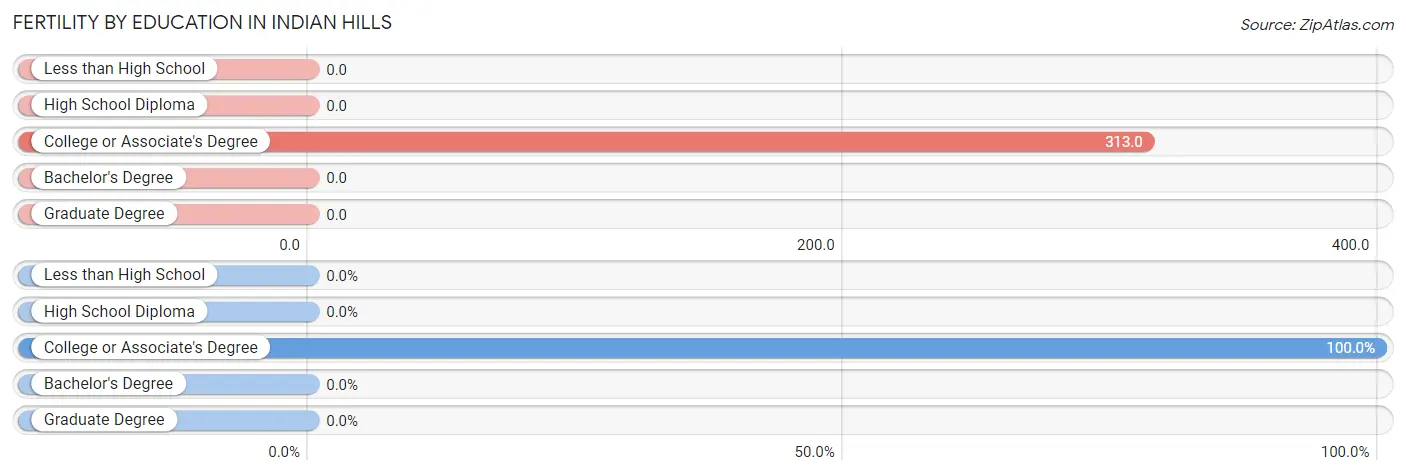
| Educational Attainment | Women with Births | Births / 1,000 Women |
| Less than High School | 0 (0.0%) | 0.0 |
| High School Diploma | 0 (0.0%) | 0.0 |
| College or Associate's Degree | 25 (100.0%) | 313.0 |
| Bachelor's Degree | 0 (0.0%) | 0.0 |
| Graduate Degree | 0 (0.0%) | 0.0 |
| Total | 25 (100.0%) | 96.0 |
Fertility by Education by Marriage Status in Indian Hills
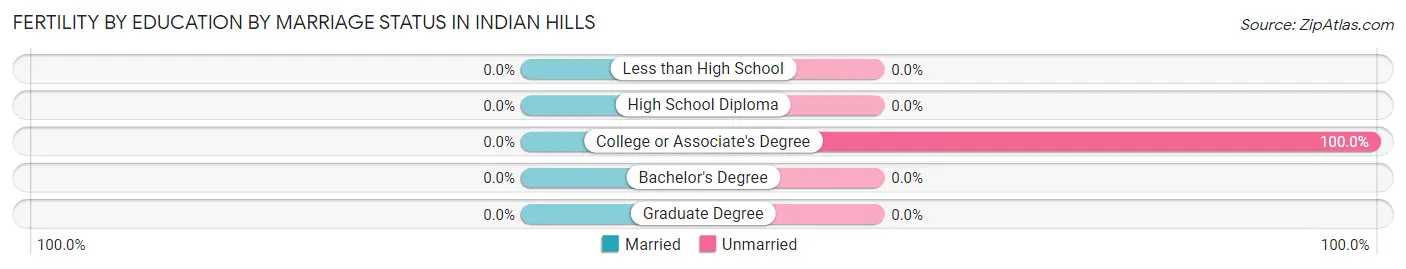
| Educational Attainment | Married | Unmarried |
| Less than High School | 0 (0.0%) | 0 (0.0%) |
| High School Diploma | 0 (0.0%) | 0 (0.0%) |
| College or Associate's Degree | 0 (0.0%) | 25 (100.0%) |
| Bachelor's Degree | 0 (0.0%) | 0 (0.0%) |
| Graduate Degree | 0 (0.0%) | 0 (0.0%) |
| Total | 0 (0.0%) | 25 (100.0%) |
Employment Characteristics in Indian Hills
Employment by Class of Employer in Indian Hills
Among the 437 employed individuals in Indian Hills, private company employees (311 | 71.2%), state government employees (60 | 13.7%), and self-employed (not incorporated) (39 | 8.9%) make up the most common classes of employment.
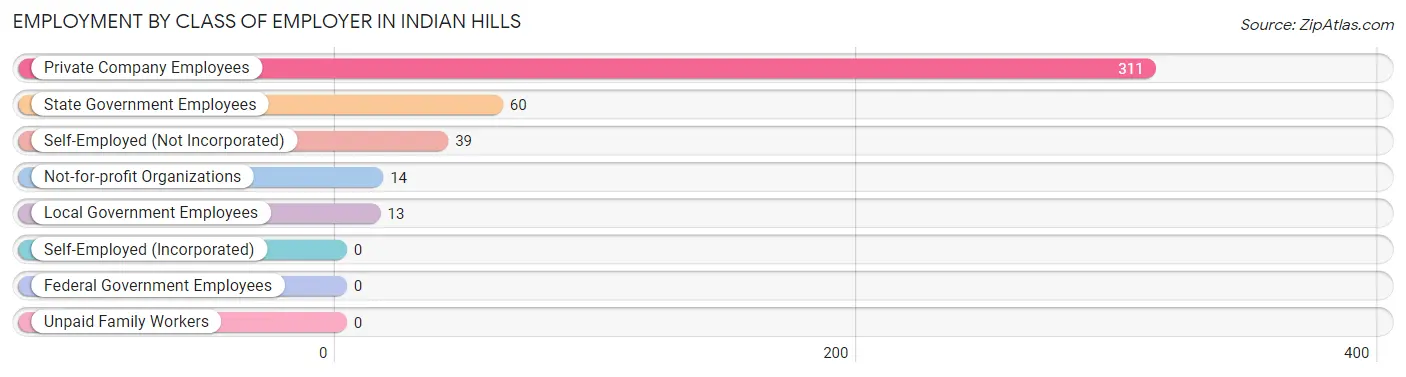
| Employer Class | # Employees | % Employees |
| Private Company Employees | 311 | 71.2% |
| Self-Employed (Incorporated) | 0 | 0.0% |
| Self-Employed (Not Incorporated) | 39 | 8.9% |
| Not-for-profit Organizations | 14 | 3.2% |
| Local Government Employees | 13 | 3.0% |
| State Government Employees | 60 | 13.7% |
| Federal Government Employees | 0 | 0.0% |
| Unpaid Family Workers | 0 | 0.0% |
| Total | 437 | 100.0% |
Employment Status by Age in Indian Hills
According to the labor force statistics for Indian Hills, out of the total population over 16 years of age (983), 55.1% or 542 individuals are in the labor force, with 19.4% or 105 of them unemployed. The age group with the highest labor force participation rate is 16 to 19 years, with 100.0% or 47 individuals in the labor force. Within the labor force, the 35 to 44 years age range has the highest percentage of unemployed individuals, with 53.4% or 55 of them being unemployed.
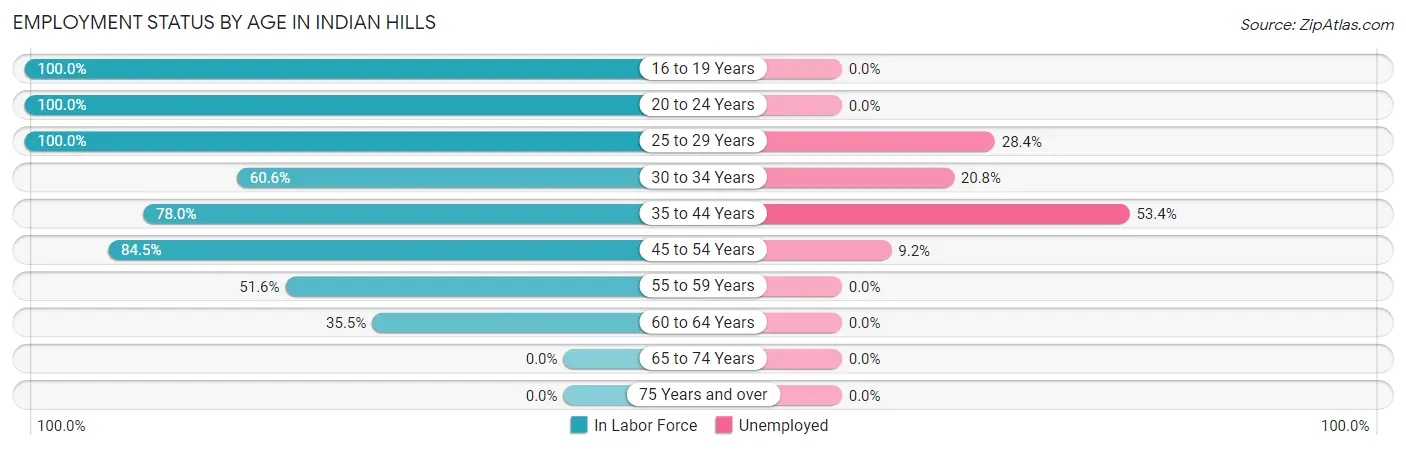
| Age Bracket | In Labor Force | Unemployed |
| 16 to 19 Years | 47 (100.0%) | 0 (0.0%) |
| 20 to 24 Years | 21 (100.0%) | 0 (0.0%) |
| 25 to 29 Years | 88 (100.0%) | 25 (28.4%) |
| 30 to 34 Years | 77 (60.6%) | 16 (20.8%) |
| 35 to 44 Years | 103 (78.0%) | 55 (53.4%) |
| 45 to 54 Years | 98 (84.5%) | 9 (9.2%) |
| 55 to 59 Years | 65 (51.6%) | 0 (0.0%) |
| 60 to 64 Years | 43 (35.5%) | 0 (0.0%) |
| 65 to 74 Years | 0 (0.0%) | 0 (0.0%) |
| 75 Years and over | 0 (0.0%) | 0 (0.0%) |
| Total | 542 (55.1%) | 105 (19.4%) |
Employment Status by Educational Attainment in Indian Hills
According to labor force statistics for Indian Hills, 66.8% of individuals (474) out of the total population between 25 and 64 years of age (710) are in the labor force, with 22.2% or 105 of them being unemployed. The group with the highest labor force participation rate are those with the educational attainment of bachelor's degree or higher, with 78.9% or 30 individuals in the labor force. Within the labor force, individuals with less than high school education have the highest percentage of unemployment, with 28.1% or 9 of them being unemployed.
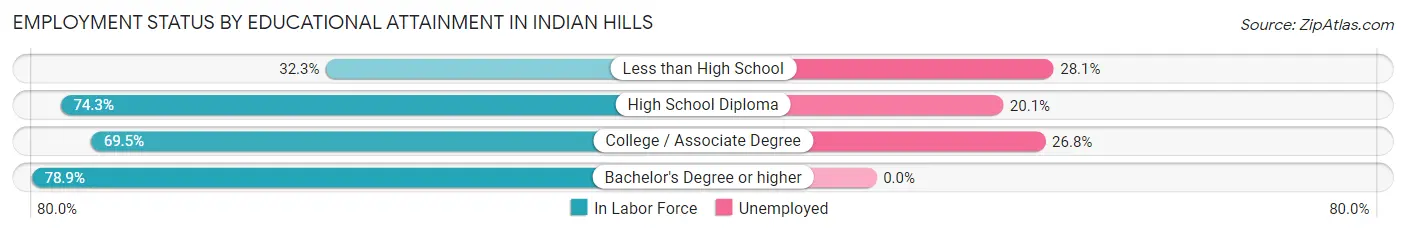
| Educational Attainment | In Labor Force | Unemployed |
| Less than High School | 32 (32.3%) | 28 (28.1%) |
| High School Diploma | 214 (74.3%) | 58 (20.1%) |
| College / Associate Degree | 198 (69.5%) | 76 (26.8%) |
| Bachelor's Degree or higher | 30 (78.9%) | 0 (0.0%) |
| Total | 474 (66.8%) | 158 (22.2%) |
Employment Occupations by Sex in Indian Hills
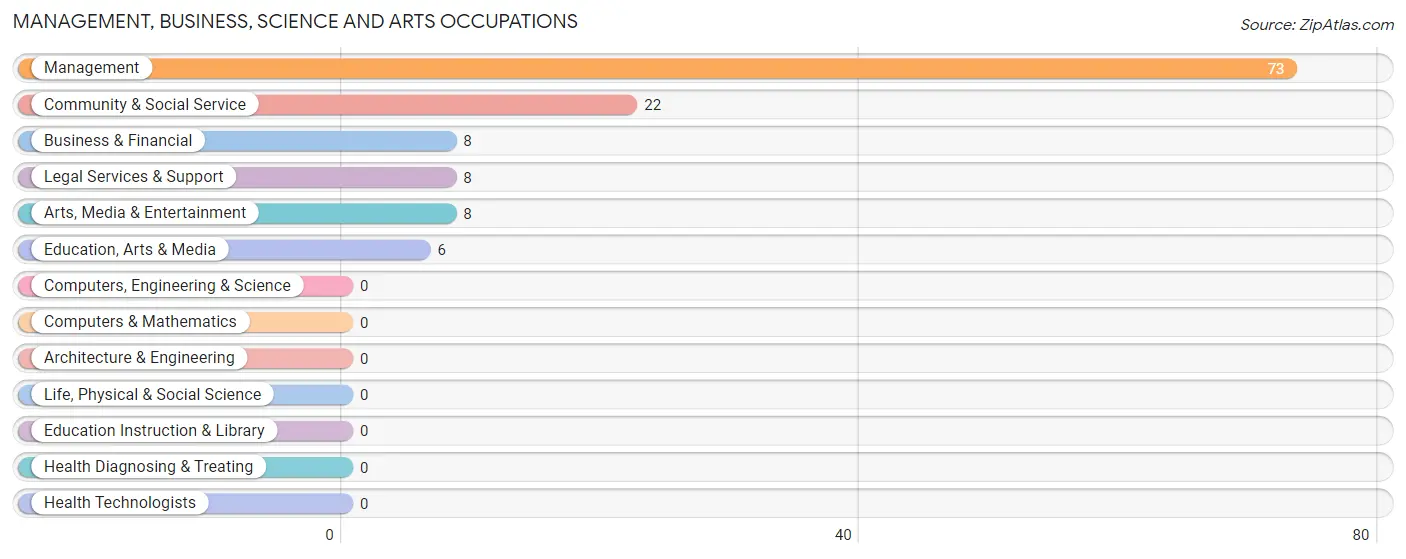
Management, Business, Science and Arts Occupations
The most common Management, Business, Science and Arts occupations in Indian Hills are Management (73 | 16.7%), Community & Social Service (22 | 5.0%), Business & Financial (8 | 1.8%), Legal Services & Support (8 | 1.8%), and Arts, Media & Entertainment (8 | 1.8%).
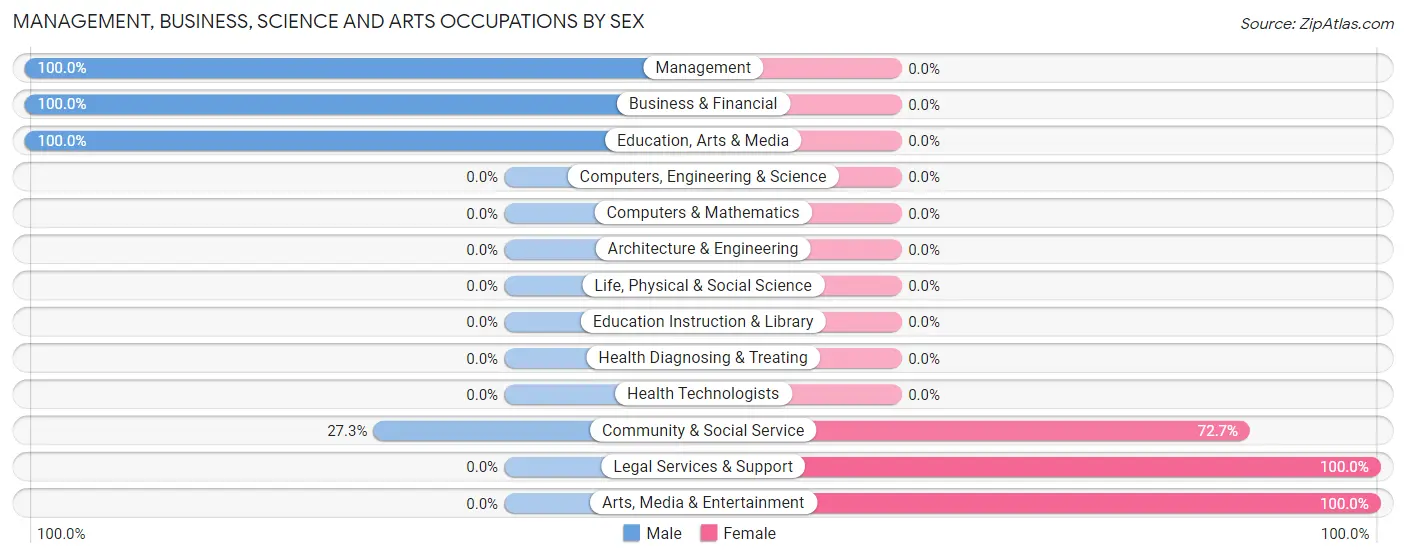
Management, Business, Science and Arts Occupations by Sex
Within the Management, Business, Science and Arts occupations in Indian Hills, the most male-oriented occupations are Management (100.0%), Business & Financial (100.0%), and Education, Arts & Media (100.0%), while the most female-oriented occupations are Legal Services & Support (100.0%), Arts, Media & Entertainment (100.0%), and Community & Social Service (72.7%).
| Occupation | Male | Female |
| Management | 73 (100.0%) | 0 (0.0%) |
| Business & Financial | 8 (100.0%) | 0 (0.0%) |
| Computers, Engineering & Science | 0 (0.0%) | 0 (0.0%) |
| Computers & Mathematics | 0 (0.0%) | 0 (0.0%) |
| Architecture & Engineering | 0 (0.0%) | 0 (0.0%) |
| Life, Physical & Social Science | 0 (0.0%) | 0 (0.0%) |
| Community & Social Service | 6 (27.3%) | 16 (72.7%) |
| Education, Arts & Media | 6 (100.0%) | 0 (0.0%) |
| Legal Services & Support | 0 (0.0%) | 8 (100.0%) |
| Education Instruction & Library | 0 (0.0%) | 0 (0.0%) |
| Arts, Media & Entertainment | 0 (0.0%) | 8 (100.0%) |
| Health Diagnosing & Treating | 0 (0.0%) | 0 (0.0%) |
| Health Technologists | 0 (0.0%) | 0 (0.0%) |
| Total (Category) | 87 (84.5%) | 16 (15.5%) |
| Total (Overall) | 228 (52.2%) | 209 (47.8%) |
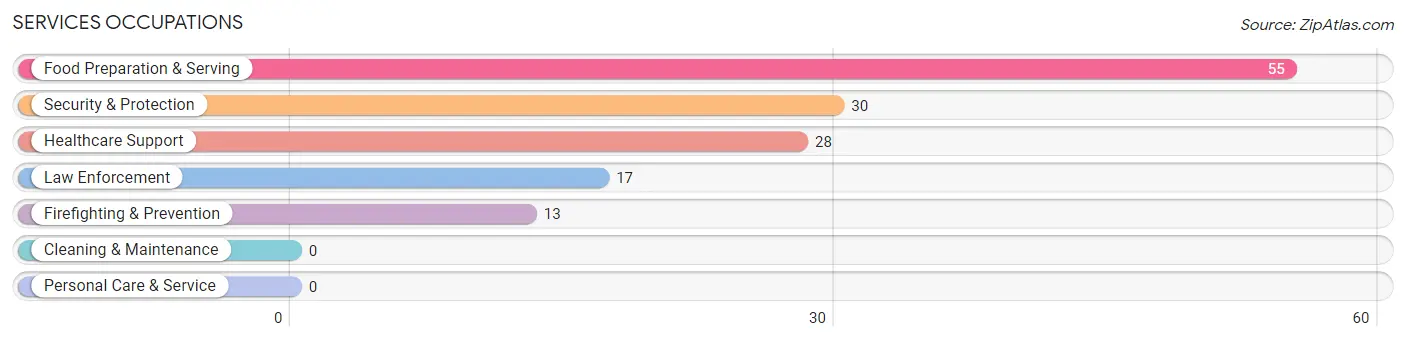
Services Occupations
The most common Services occupations in Indian Hills are Food Preparation & Serving (55 | 12.6%), Security & Protection (30 | 6.9%), Healthcare Support (28 | 6.4%), Law Enforcement (17 | 3.9%), and Firefighting & Prevention (13 | 3.0%).
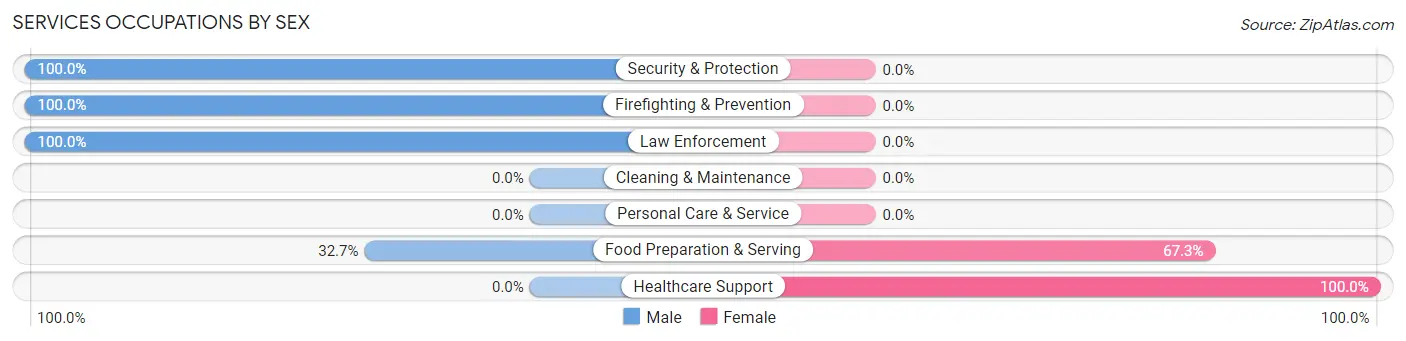
Services Occupations by Sex
Within the Services occupations in Indian Hills, the most male-oriented occupations are Security & Protection (100.0%), Firefighting & Prevention (100.0%), and Law Enforcement (100.0%), while the most female-oriented occupations are Healthcare Support (100.0%), and Food Preparation & Serving (67.3%).
| Occupation | Male | Female |
| Healthcare Support | 0 (0.0%) | 28 (100.0%) |
| Security & Protection | 30 (100.0%) | 0 (0.0%) |
| Firefighting & Prevention | 13 (100.0%) | 0 (0.0%) |
| Law Enforcement | 17 (100.0%) | 0 (0.0%) |
| Food Preparation & Serving | 18 (32.7%) | 37 (67.3%) |
| Cleaning & Maintenance | 0 (0.0%) | 0 (0.0%) |
| Personal Care & Service | 0 (0.0%) | 0 (0.0%) |
| Total (Category) | 48 (42.5%) | 65 (57.5%) |
| Total (Overall) | 228 (52.2%) | 209 (47.8%) |
Sales and Office Occupations
The most common Sales and Office occupations in Indian Hills are Office & Administration (96 | 22.0%), and Sales & Related (40 | 9.1%).
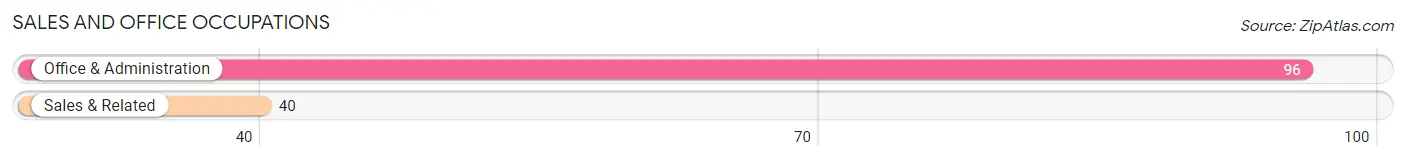
Sales and Office Occupations by Sex
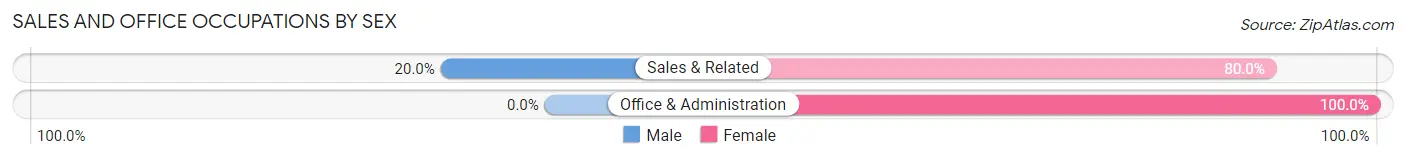
| Occupation | Male | Female |
| Sales & Related | 8 (20.0%) | 32 (80.0%) |
| Office & Administration | 0 (0.0%) | 96 (100.0%) |
| Total (Category) | 8 (5.9%) | 128 (94.1%) |
| Total (Overall) | 228 (52.2%) | 209 (47.8%) |
Natural Resources, Construction and Maintenance Occupations
The most common Natural Resources, Construction and Maintenance occupations in Indian Hills are Construction & Extraction (10 | 2.3%), and Installation, Maintenance & Repair (5 | 1.1%).
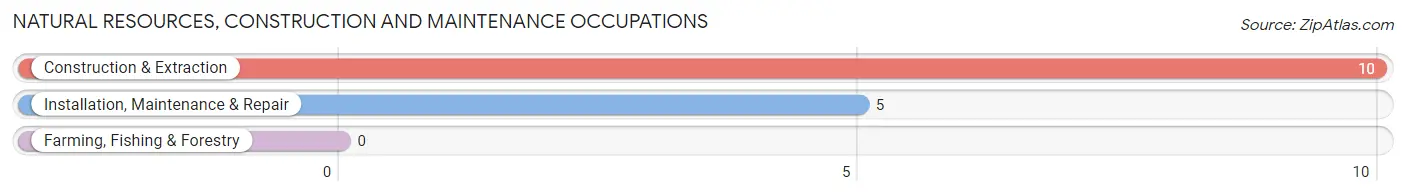
Natural Resources, Construction and Maintenance Occupations by Sex
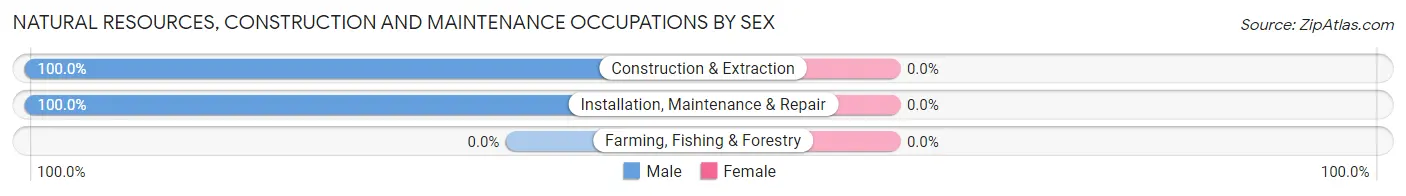
| Occupation | Male | Female |
| Farming, Fishing & Forestry | 0 (0.0%) | 0 (0.0%) |
| Construction & Extraction | 10 (100.0%) | 0 (0.0%) |
| Installation, Maintenance & Repair | 5 (100.0%) | 0 (0.0%) |
| Total (Category) | 15 (100.0%) | 0 (0.0%) |
| Total (Overall) | 228 (52.2%) | 209 (47.8%) |
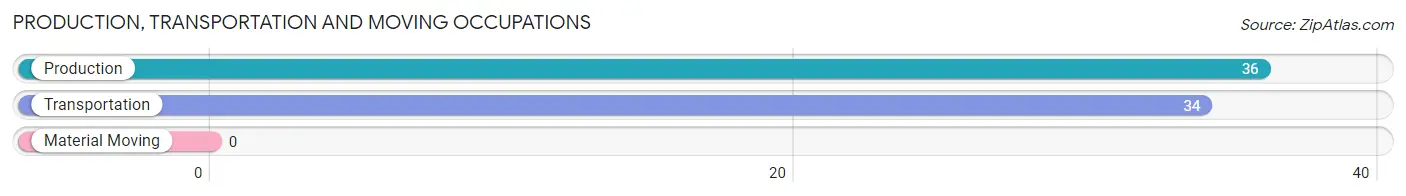
Production, Transportation and Moving Occupations
The most common Production, Transportation and Moving occupations in Indian Hills are Production (36 | 8.2%), and Transportation (34 | 7.8%).
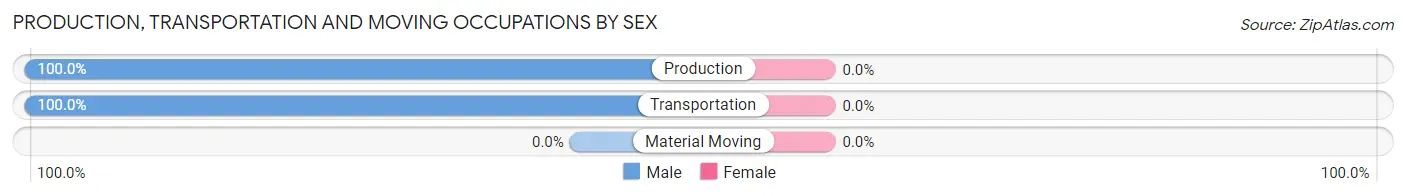
Production, Transportation and Moving Occupations by Sex
| Occupation | Male | Female |
| Production | 36 (100.0%) | 0 (0.0%) |
| Transportation | 34 (100.0%) | 0 (0.0%) |
| Material Moving | 0 (0.0%) | 0 (0.0%) |
| Total (Category) | 70 (100.0%) | 0 (0.0%) |
| Total (Overall) | 228 (52.2%) | 209 (47.8%) |
Employment Industries by Sex in Indian Hills
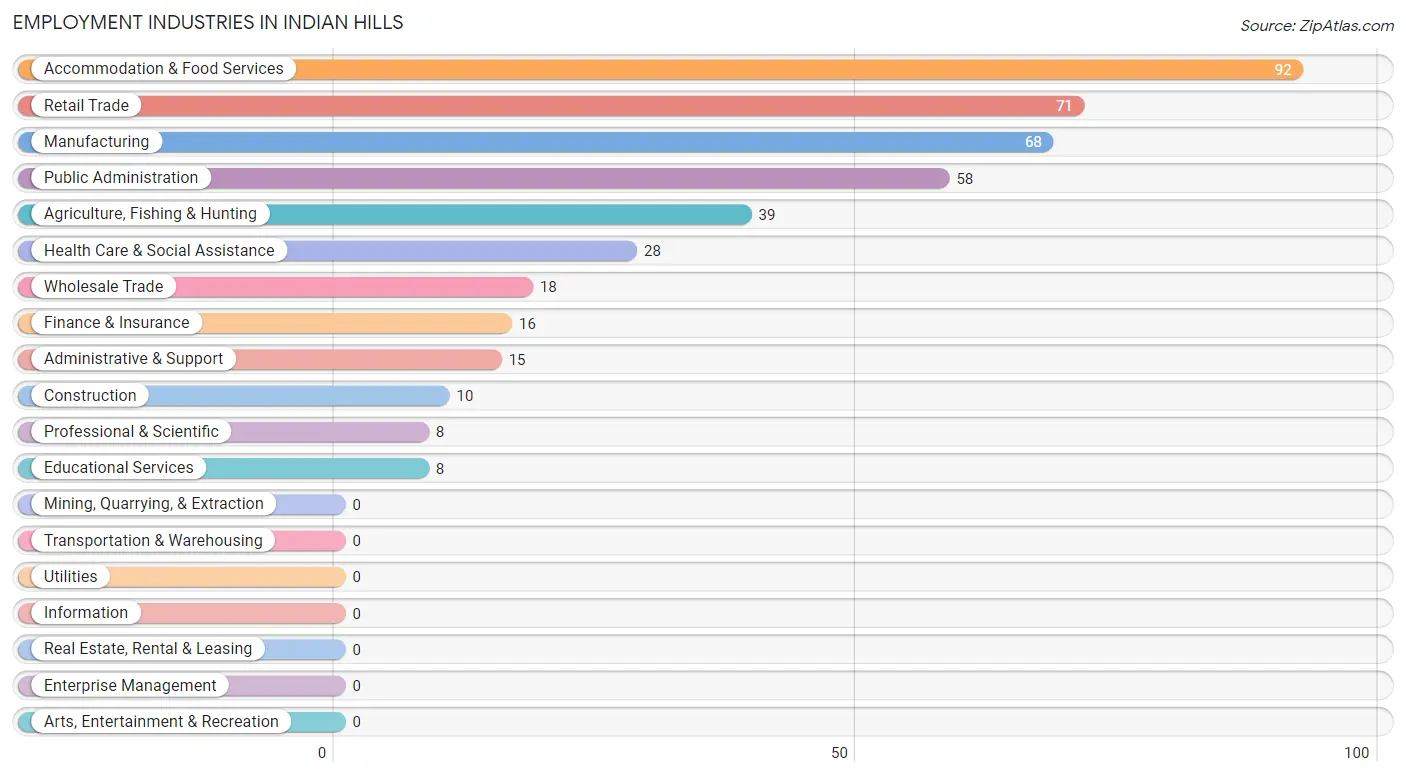
Employment Industries in Indian Hills
The major employment industries in Indian Hills include Accommodation & Food Services (92 | 21.0%), Retail Trade (71 | 16.3%), Manufacturing (68 | 15.6%), Public Administration (58 | 13.3%), and Agriculture, Fishing & Hunting (39 | 8.9%).
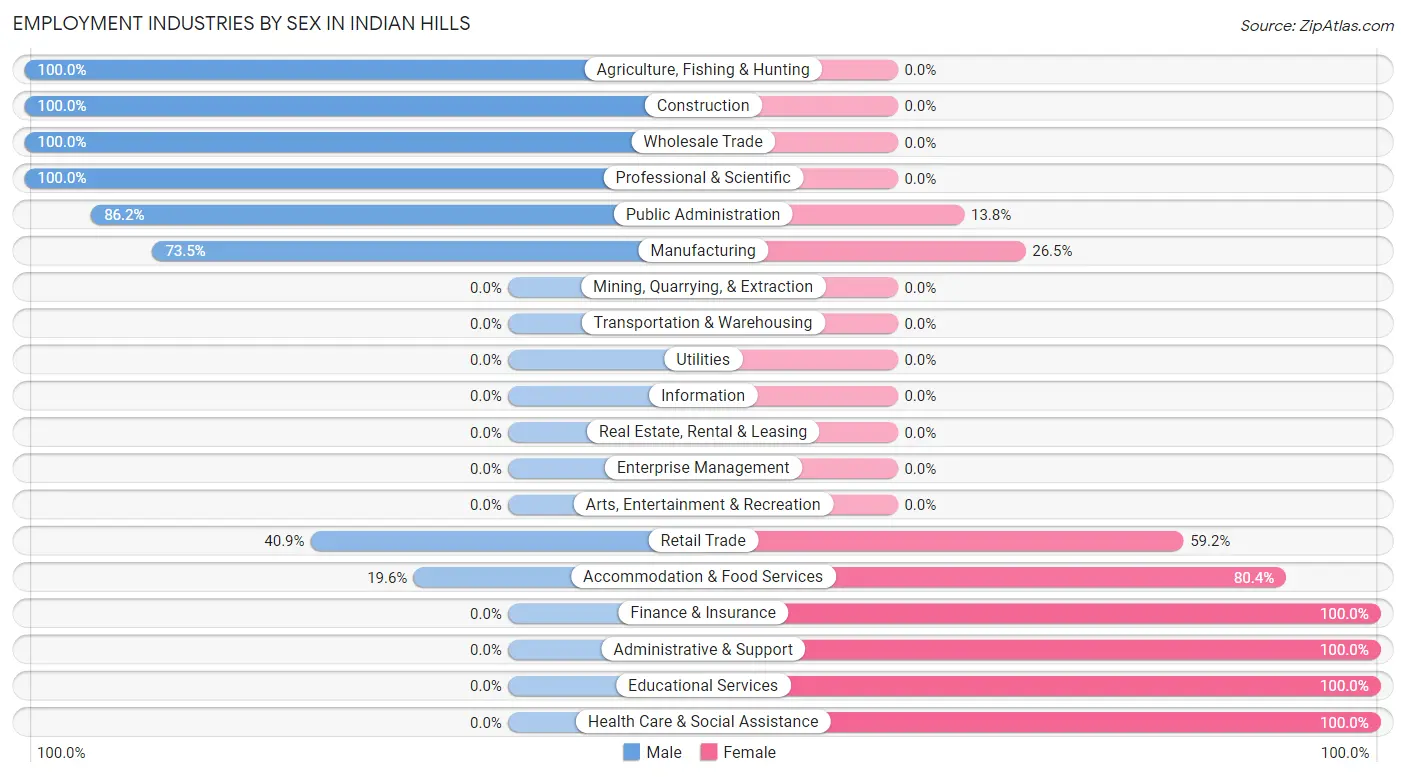
Employment Industries by Sex in Indian Hills
The Indian Hills industries that see more men than women are Agriculture, Fishing & Hunting (100.0%), Construction (100.0%), and Wholesale Trade (100.0%), whereas the industries that tend to have a higher number of women are Finance & Insurance (100.0%), Administrative & Support (100.0%), and Educational Services (100.0%).
| Industry | Male | Female |
| Agriculture, Fishing & Hunting | 39 (100.0%) | 0 (0.0%) |
| Mining, Quarrying, & Extraction | 0 (0.0%) | 0 (0.0%) |
| Construction | 10 (100.0%) | 0 (0.0%) |
| Manufacturing | 50 (73.5%) | 18 (26.5%) |
| Wholesale Trade | 18 (100.0%) | 0 (0.0%) |
| Retail Trade | 29 (40.8%) | 42 (59.2%) |
| Transportation & Warehousing | 0 (0.0%) | 0 (0.0%) |
| Utilities | 0 (0.0%) | 0 (0.0%) |
| Information | 0 (0.0%) | 0 (0.0%) |
| Finance & Insurance | 0 (0.0%) | 16 (100.0%) |
| Real Estate, Rental & Leasing | 0 (0.0%) | 0 (0.0%) |
| Professional & Scientific | 8 (100.0%) | 0 (0.0%) |
| Enterprise Management | 0 (0.0%) | 0 (0.0%) |
| Administrative & Support | 0 (0.0%) | 15 (100.0%) |
| Educational Services | 0 (0.0%) | 8 (100.0%) |
| Health Care & Social Assistance | 0 (0.0%) | 28 (100.0%) |
| Arts, Entertainment & Recreation | 0 (0.0%) | 0 (0.0%) |
| Accommodation & Food Services | 18 (19.6%) | 74 (80.4%) |
| Public Administration | 50 (86.2%) | 8 (13.8%) |
| Total | 228 (52.2%) | 209 (47.8%) |
Education in Indian Hills
School Enrollment in Indian Hills
The most common levels of schooling among the 237 students in Indian Hills are elementary school (95 | 40.1%), high school (63 | 26.6%), and middle school (61 | 25.7%).
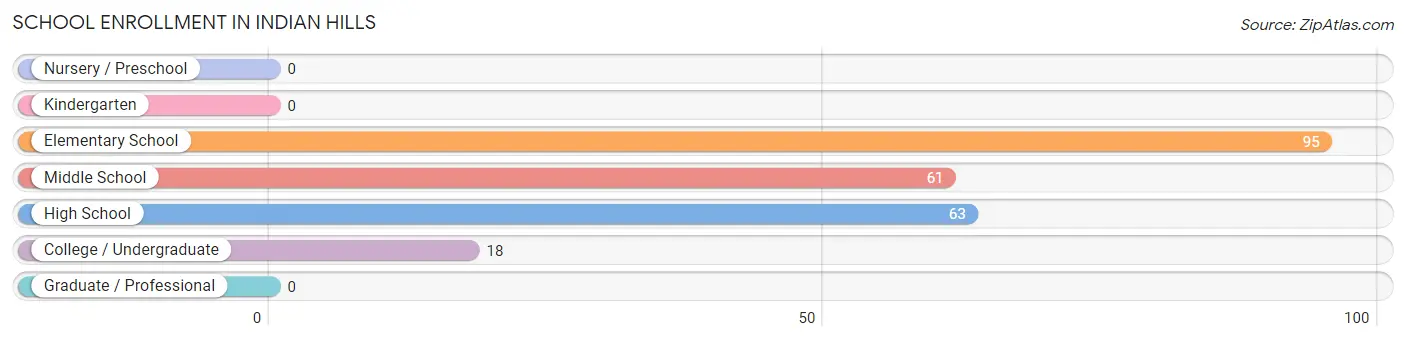
| School Level | # Students | % Students |
| Nursery / Preschool | 0 | 0.0% |
| Kindergarten | 0 | 0.0% |
| Elementary School | 95 | 40.1% |
| Middle School | 61 | 25.7% |
| High School | 63 | 26.6% |
| College / Undergraduate | 18 | 7.6% |
| Graduate / Professional | 0 | 0.0% |
| Total | 237 | 100.0% |
School Enrollment by Age by Funding Source in Indian Hills
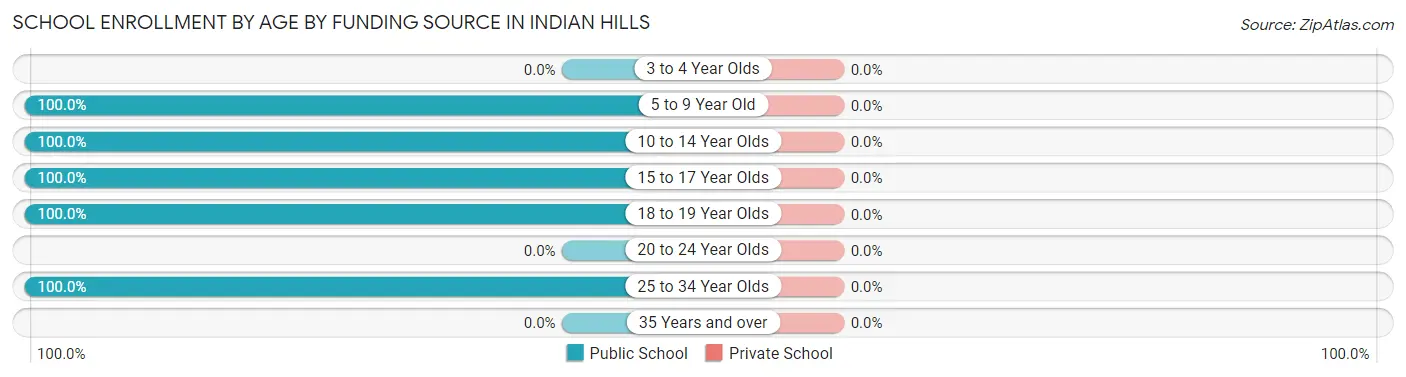
| Age Bracket | Public School | Private School |
| 3 to 4 Year Olds | 0 (0.0%) | 0 (0.0%) |
| 5 to 9 Year Old | 95 (100.0%) | 0 (0.0%) |
| 10 to 14 Year Olds | 61 (100.0%) | 0 (0.0%) |
| 15 to 17 Year Olds | 26 (100.0%) | 0 (0.0%) |
| 18 to 19 Year Olds | 37 (100.0%) | 0 (0.0%) |
| 20 to 24 Year Olds | 0 (0.0%) | 0 (0.0%) |
| 25 to 34 Year Olds | 18 (100.0%) | 0 (0.0%) |
| 35 Years and over | 0 (0.0%) | 0 (0.0%) |
| Total | 237 (100.0%) | 0 (0.0%) |
Educational Attainment by Field of Study in Indian Hills
Education (14 | 31.8%), liberal arts & history (14 | 31.8%), computers & mathematics (8 | 18.2%), and literature & languages (8 | 18.2%) are the most common fields of study among 44 individuals in Indian Hills who have obtained a bachelor's degree or higher.
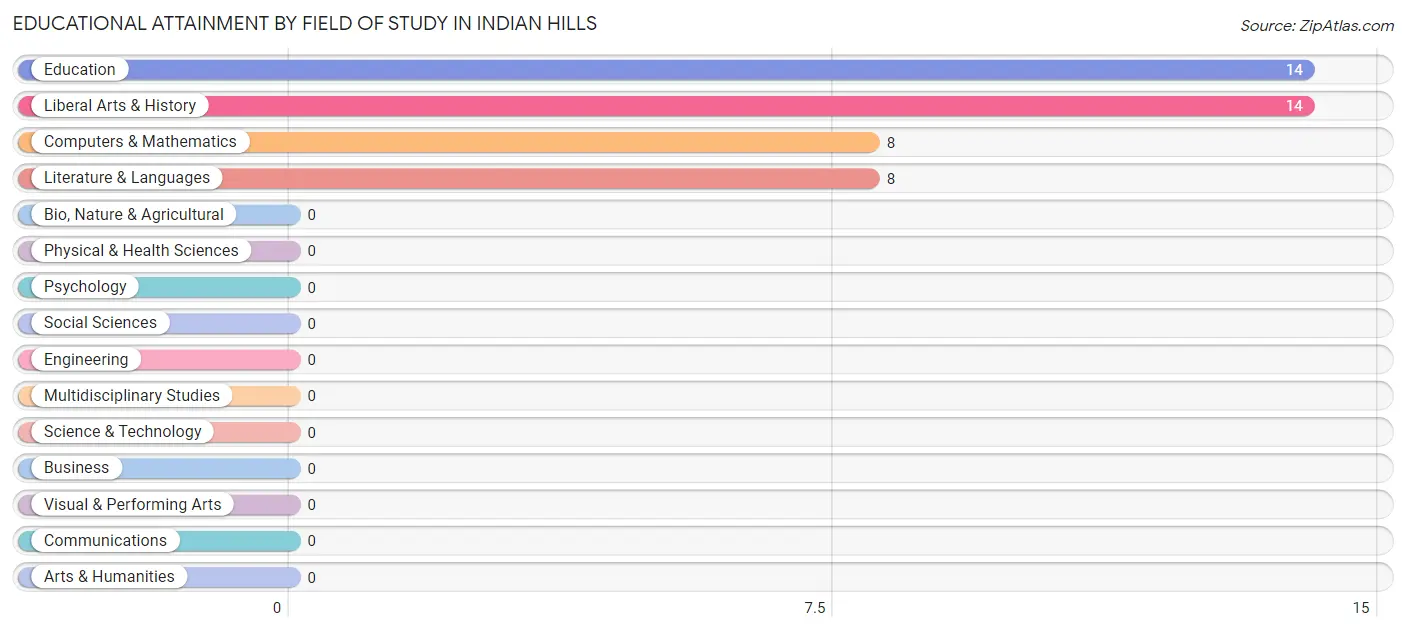
| Field of Study | # Graduates | % Graduates |
| Computers & Mathematics | 8 | 18.2% |
| Bio, Nature & Agricultural | 0 | 0.0% |
| Physical & Health Sciences | 0 | 0.0% |
| Psychology | 0 | 0.0% |
| Social Sciences | 0 | 0.0% |
| Engineering | 0 | 0.0% |
| Multidisciplinary Studies | 0 | 0.0% |
| Science & Technology | 0 | 0.0% |
| Business | 0 | 0.0% |
| Education | 14 | 31.8% |
| Literature & Languages | 8 | 18.2% |
| Liberal Arts & History | 14 | 31.8% |
| Visual & Performing Arts | 0 | 0.0% |
| Communications | 0 | 0.0% |
| Arts & Humanities | 0 | 0.0% |
| Total | 44 | 100.0% |
Transportation & Commute in Indian Hills
Vehicle Availability by Sex in Indian Hills
The most prevalent vehicle ownership categories in Indian Hills are males with 3 vehicles (81, accounting for 35.5%) and females with 3 vehicles (121, making up 38.8%).
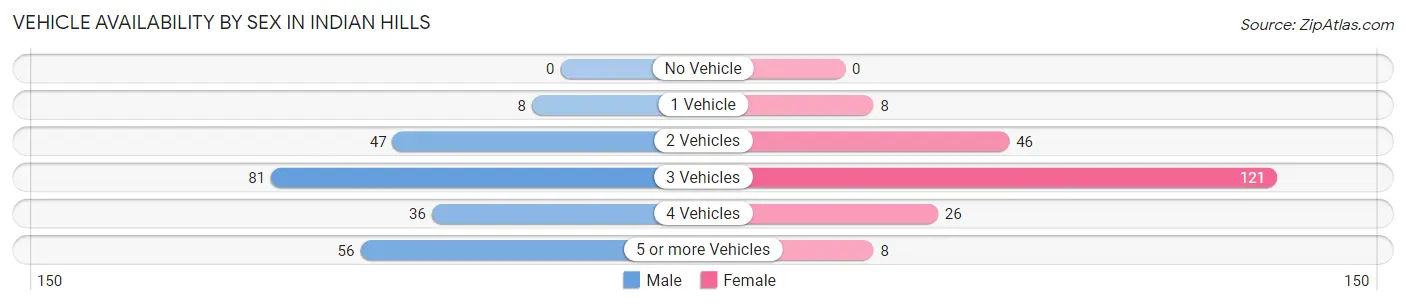
| Vehicles Available | Male | Female |
| No Vehicle | 0 (0.0%) | 0 (0.0%) |
| 1 Vehicle | 8 (3.5%) | 8 (3.8%) |
| 2 Vehicles | 47 (20.6%) | 46 (22.0%) |
| 3 Vehicles | 81 (35.5%) | 121 (57.9%) |
| 4 Vehicles | 36 (15.8%) | 26 (12.4%) |
| 5 or more Vehicles | 56 (24.6%) | 8 (3.8%) |
| Total | 228 (100.0%) | 209 (100.0%) |
Commute Time in Indian Hills
The most frequently occuring commute durations in Indian Hills are 35 to 39 minutes (103 commuters, 25.9%), 60 to 89 minutes (77 commuters, 19.4%), and 30 to 34 minutes (76 commuters, 19.1%).
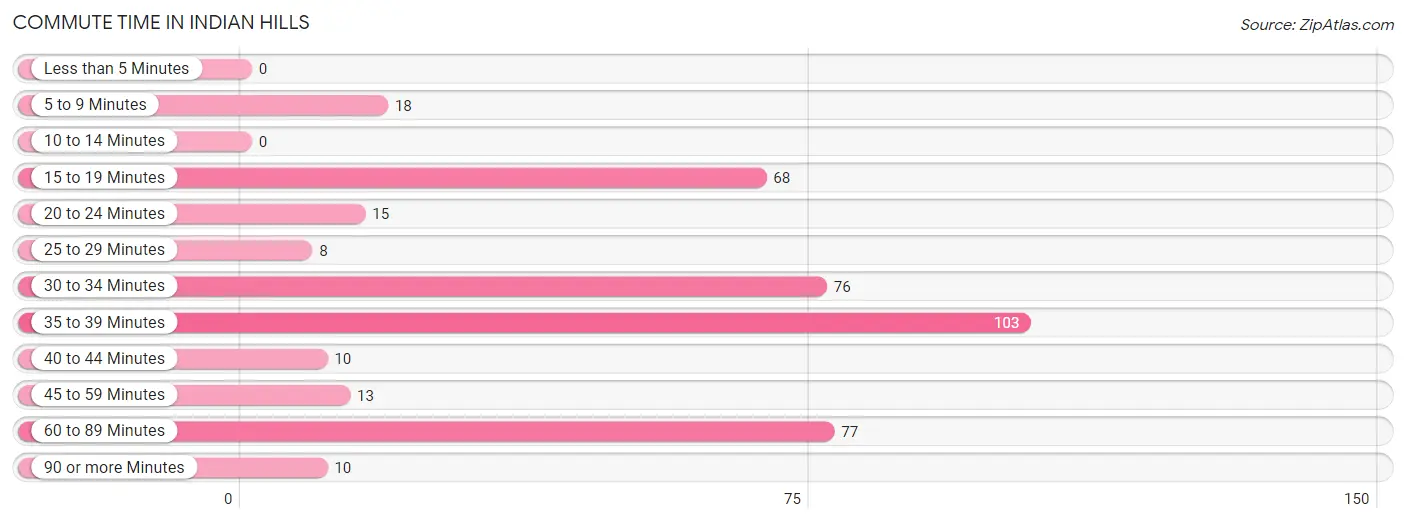
| Commute Time | # Commuters | % Commuters |
| Less than 5 Minutes | 0 | 0.0% |
| 5 to 9 Minutes | 18 | 4.5% |
| 10 to 14 Minutes | 0 | 0.0% |
| 15 to 19 Minutes | 68 | 17.1% |
| 20 to 24 Minutes | 15 | 3.8% |
| 25 to 29 Minutes | 8 | 2.0% |
| 30 to 34 Minutes | 76 | 19.1% |
| 35 to 39 Minutes | 103 | 25.9% |
| 40 to 44 Minutes | 10 | 2.5% |
| 45 to 59 Minutes | 13 | 3.3% |
| 60 to 89 Minutes | 77 | 19.4% |
| 90 or more Minutes | 10 | 2.5% |
Commute Time by Sex in Indian Hills
The most common commute times in Indian Hills are 35 to 39 minutes (50 commuters, 26.5%) for males and 30 to 34 minutes (59 commuters, 28.2%) for females.
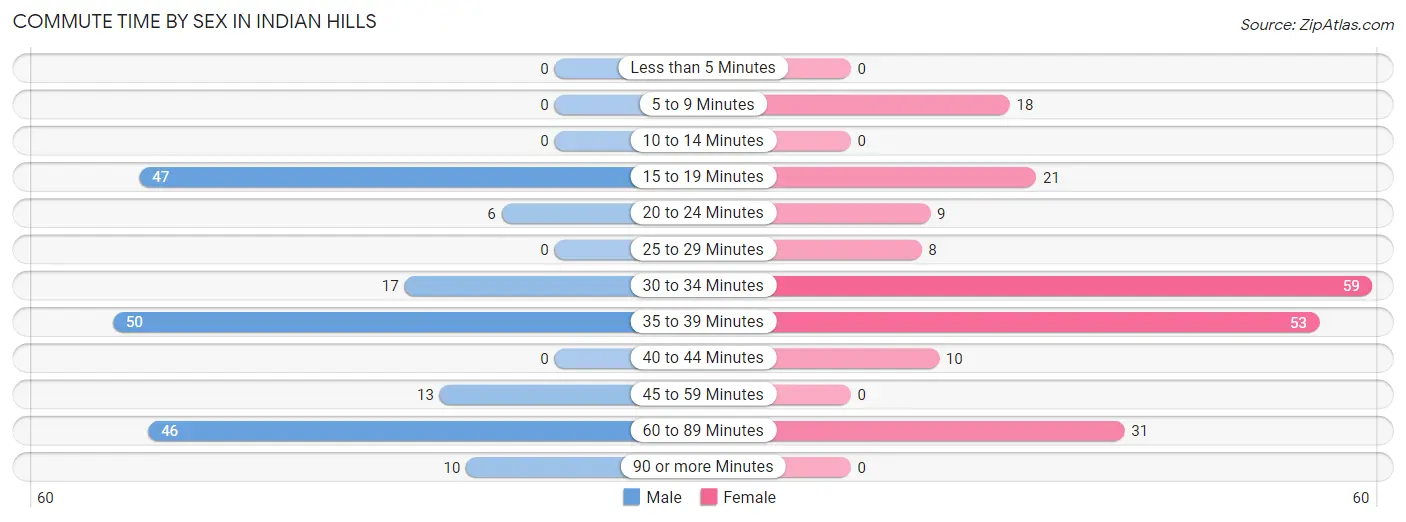
| Commute Time | Male | Female |
| Less than 5 Minutes | 0 (0.0%) | 0 (0.0%) |
| 5 to 9 Minutes | 0 (0.0%) | 18 (8.6%) |
| 10 to 14 Minutes | 0 (0.0%) | 0 (0.0%) |
| 15 to 19 Minutes | 47 (24.9%) | 21 (10.1%) |
| 20 to 24 Minutes | 6 (3.2%) | 9 (4.3%) |
| 25 to 29 Minutes | 0 (0.0%) | 8 (3.8%) |
| 30 to 34 Minutes | 17 (9.0%) | 59 (28.2%) |
| 35 to 39 Minutes | 50 (26.5%) | 53 (25.4%) |
| 40 to 44 Minutes | 0 (0.0%) | 10 (4.8%) |
| 45 to 59 Minutes | 13 (6.9%) | 0 (0.0%) |
| 60 to 89 Minutes | 46 (24.3%) | 31 (14.8%) |
| 90 or more Minutes | 10 (5.3%) | 0 (0.0%) |
Time of Departure to Work by Sex in Indian Hills
The most frequent times of departure to work in Indian Hills are 8:30 AM to 8:59 AM (57, 30.2%) for males and 7:30 AM to 7:59 AM (37, 17.7%) for females.
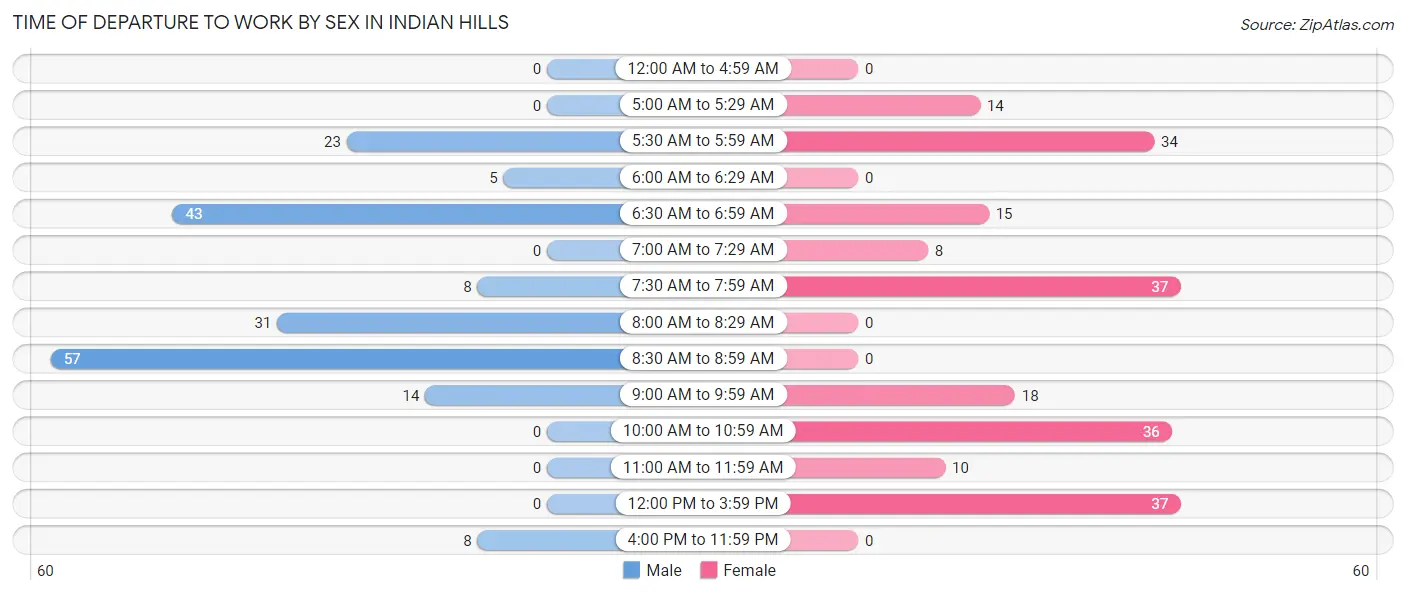
| Time of Departure | Male | Female |
| 12:00 AM to 4:59 AM | 0 (0.0%) | 0 (0.0%) |
| 5:00 AM to 5:29 AM | 0 (0.0%) | 14 (6.7%) |
| 5:30 AM to 5:59 AM | 23 (12.2%) | 34 (16.3%) |
| 6:00 AM to 6:29 AM | 5 (2.6%) | 0 (0.0%) |
| 6:30 AM to 6:59 AM | 43 (22.8%) | 15 (7.2%) |
| 7:00 AM to 7:29 AM | 0 (0.0%) | 8 (3.8%) |
| 7:30 AM to 7:59 AM | 8 (4.2%) | 37 (17.7%) |
| 8:00 AM to 8:29 AM | 31 (16.4%) | 0 (0.0%) |
| 8:30 AM to 8:59 AM | 57 (30.2%) | 0 (0.0%) |
| 9:00 AM to 9:59 AM | 14 (7.4%) | 18 (8.6%) |
| 10:00 AM to 10:59 AM | 0 (0.0%) | 36 (17.2%) |
| 11:00 AM to 11:59 AM | 0 (0.0%) | 10 (4.8%) |
| 12:00 PM to 3:59 PM | 0 (0.0%) | 37 (17.7%) |
| 4:00 PM to 11:59 PM | 8 (4.2%) | 0 (0.0%) |
| Total | 189 (100.0%) | 209 (100.0%) |
Housing Occupancy in Indian Hills
Occupancy by Ownership in Indian Hills
Of the total 358 dwellings in Indian Hills, owner-occupied units account for 331 (92.5%), while renter-occupied units make up 27 (7.5%).
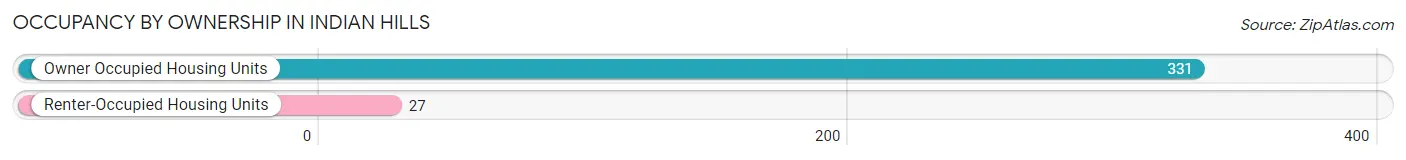
| Occupancy | # Housing Units | % Housing Units |
| Owner Occupied Housing Units | 331 | 92.5% |
| Renter-Occupied Housing Units | 27 | 7.5% |
| Total Occupied Housing Units | 358 | 100.0% |
Occupancy by Household Size in Indian Hills
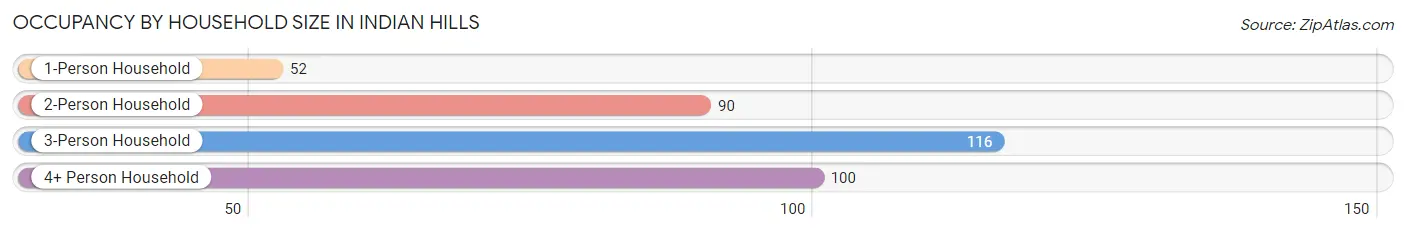
| Household Size | # Housing Units | % Housing Units |
| 1-Person Household | 52 | 14.5% |
| 2-Person Household | 90 | 25.1% |
| 3-Person Household | 116 | 32.4% |
| 4+ Person Household | 100 | 27.9% |
| Total Housing Units | 358 | 100.0% |
Occupancy by Ownership by Household Size in Indian Hills
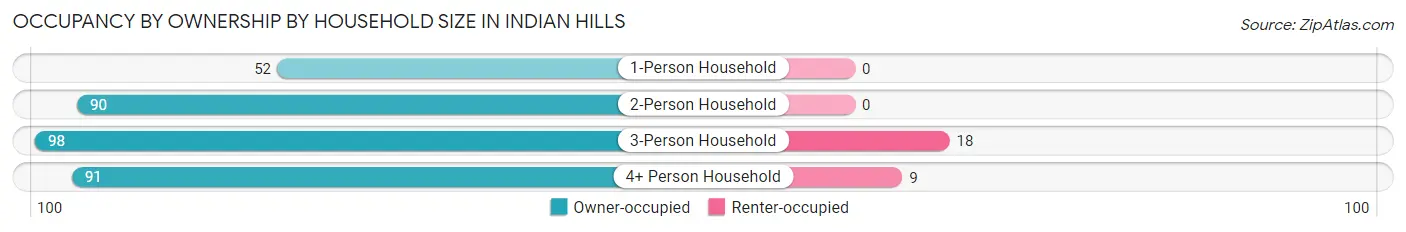
| Household Size | Owner-occupied | Renter-occupied |
| 1-Person Household | 52 (100.0%) | 0 (0.0%) |
| 2-Person Household | 90 (100.0%) | 0 (0.0%) |
| 3-Person Household | 98 (84.5%) | 18 (15.5%) |
| 4+ Person Household | 91 (91.0%) | 9 (9.0%) |
| Total Housing Units | 331 (92.5%) | 27 (7.5%) |
Occupancy by Educational Attainment in Indian Hills
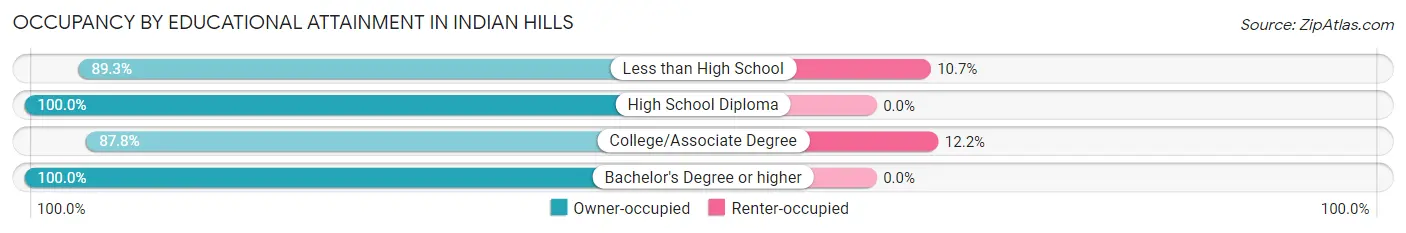
| Household Size | Owner-occupied | Renter-occupied |
| Less than High School | 75 (89.3%) | 9 (10.7%) |
| High School Diploma | 97 (100.0%) | 0 (0.0%) |
| College/Associate Degree | 129 (87.8%) | 18 (12.2%) |
| Bachelor's Degree or higher | 30 (100.0%) | 0 (0.0%) |
Occupancy by Age of Householder in Indian Hills
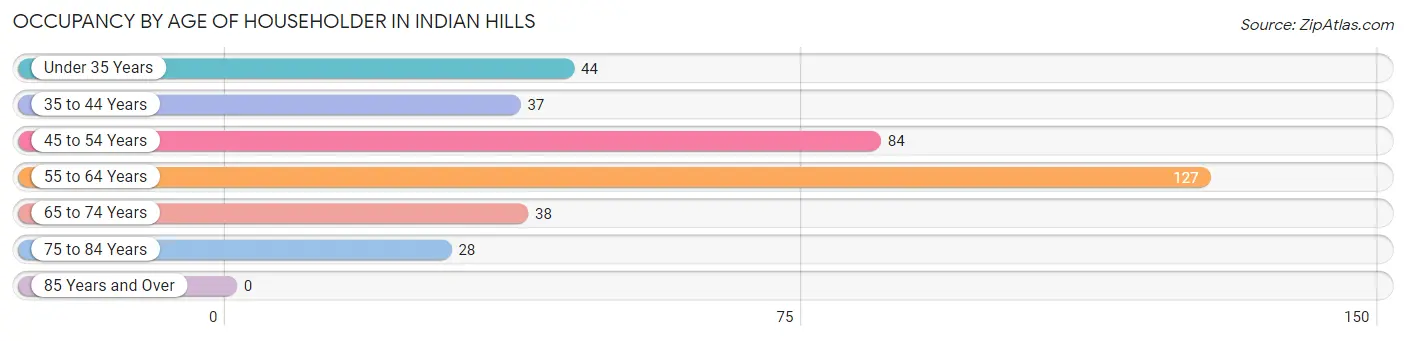
| Age Bracket | # Households | % Households |
| Under 35 Years | 44 | 12.3% |
| 35 to 44 Years | 37 | 10.3% |
| 45 to 54 Years | 84 | 23.5% |
| 55 to 64 Years | 127 | 35.5% |
| 65 to 74 Years | 38 | 10.6% |
| 75 to 84 Years | 28 | 7.8% |
| 85 Years and Over | 0 | 0.0% |
| Total | 358 | 100.0% |
Housing Finances in Indian Hills
Median Income by Occupancy in Indian Hills
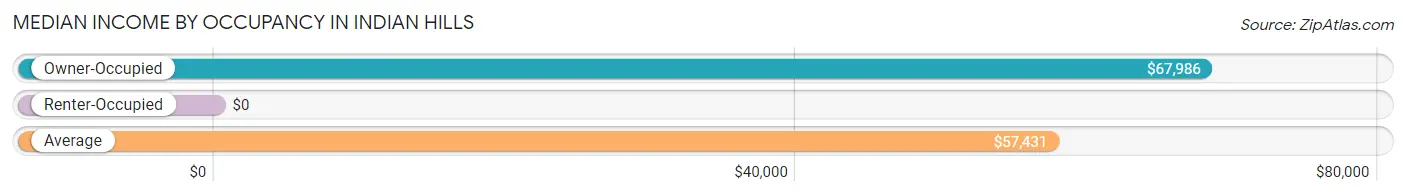
| Occupancy Type | # Households | Median Income |
| Owner-Occupied | 331 (92.5%) | $67,986 |
| Renter-Occupied | 27 (7.5%) | $0 |
| Average | 358 (100.0%) | $57,431 |
Occupancy by Householder Income Bracket in Indian Hills

| Income Bracket | Owner-occupied | Renter-occupied |
| Less than $5,000 | 22 (6.7%) | 0 (0.0%) |
| $5,000 to $9,999 | 4 (1.2%) | 0 (0.0%) |
| $10,000 to $14,999 | 0 (0.0%) | 0 (0.0%) |
| $15,000 to $19,999 | 14 (4.2%) | 0 (0.0%) |
| $20,000 to $24,999 | 22 (6.7%) | 18 (66.7%) |
| $25,000 to $34,999 | 0 (0.0%) | 0 (0.0%) |
| $35,000 to $49,999 | 64 (19.3%) | 0 (0.0%) |
| $50,000 to $74,999 | 60 (18.1%) | 9 (33.3%) |
| $75,000 to $99,999 | 17 (5.1%) | 0 (0.0%) |
| $100,000 to $149,999 | 81 (24.5%) | 0 (0.0%) |
| $150,000 or more | 47 (14.2%) | 0 (0.0%) |
| Total | 331 (100.0%) | 27 (100.0%) |
Monthly Housing Cost Tiers in Indian Hills
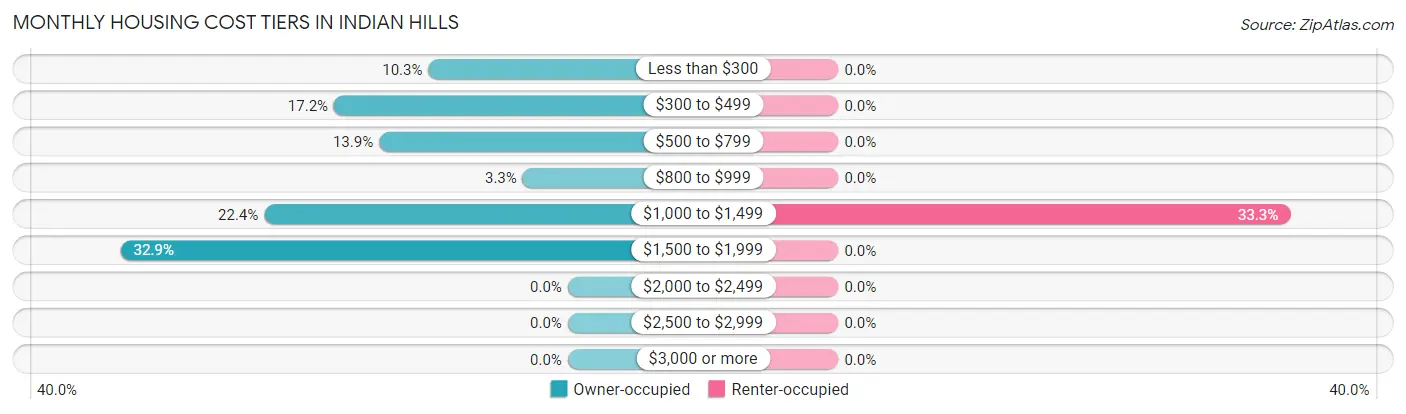
| Monthly Cost | Owner-occupied | Renter-occupied |
| Less than $300 | 34 (10.3%) | 0 (0.0%) |
| $300 to $499 | 57 (17.2%) | 0 (0.0%) |
| $500 to $799 | 46 (13.9%) | 0 (0.0%) |
| $800 to $999 | 11 (3.3%) | 0 (0.0%) |
| $1,000 to $1,499 | 74 (22.4%) | 9 (33.3%) |
| $1,500 to $1,999 | 109 (32.9%) | 0 (0.0%) |
| $2,000 to $2,499 | 0 (0.0%) | 0 (0.0%) |
| $2,500 to $2,999 | 0 (0.0%) | 0 (0.0%) |
| $3,000 or more | 0 (0.0%) | 0 (0.0%) |
| Total | 331 (100.0%) | 27 (100.0%) |
Physical Housing Characteristics in Indian Hills
Housing Structures in Indian Hills
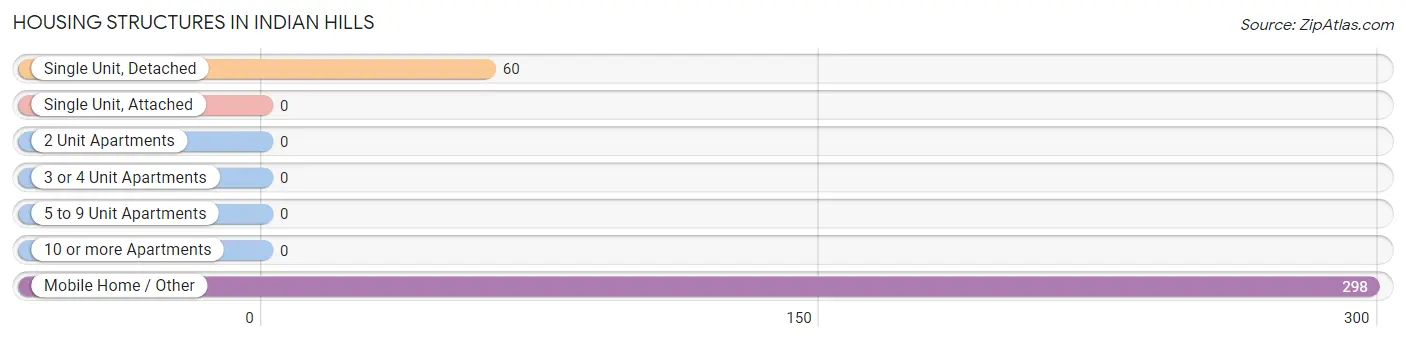
| Structure Type | # Housing Units | % Housing Units |
| Single Unit, Detached | 60 | 16.8% |
| Single Unit, Attached | 0 | 0.0% |
| 2 Unit Apartments | 0 | 0.0% |
| 3 or 4 Unit Apartments | 0 | 0.0% |
| 5 to 9 Unit Apartments | 0 | 0.0% |
| 10 or more Apartments | 0 | 0.0% |
| Mobile Home / Other | 298 | 83.2% |
| Total | 358 | 100.0% |
Housing Structures by Occupancy in Indian Hills
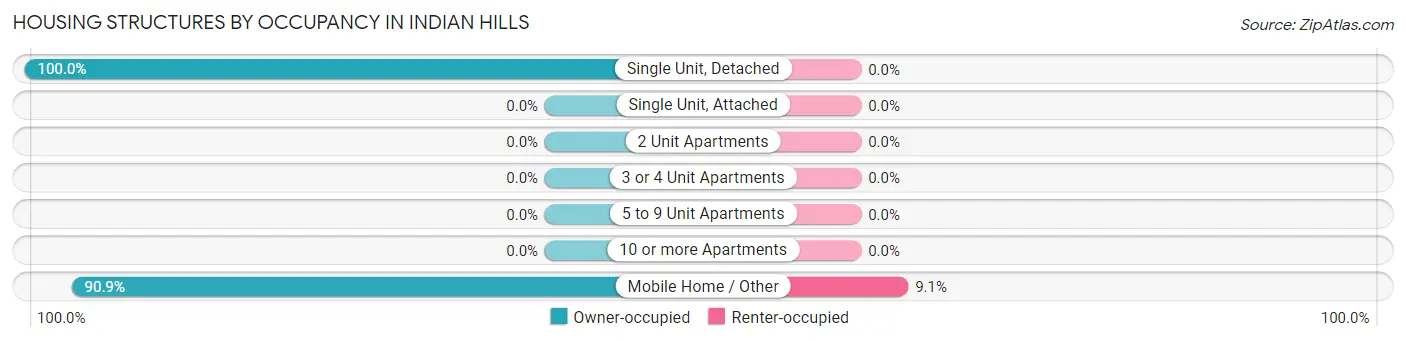
| Structure Type | Owner-occupied | Renter-occupied |
| Single Unit, Detached | 60 (100.0%) | 0 (0.0%) |
| Single Unit, Attached | 0 (0.0%) | 0 (0.0%) |
| 2 Unit Apartments | 0 (0.0%) | 0 (0.0%) |
| 3 or 4 Unit Apartments | 0 (0.0%) | 0 (0.0%) |
| 5 to 9 Unit Apartments | 0 (0.0%) | 0 (0.0%) |
| 10 or more Apartments | 0 (0.0%) | 0 (0.0%) |
| Mobile Home / Other | 271 (90.9%) | 27 (9.1%) |
| Total | 331 (92.5%) | 27 (7.5%) |
Housing Structures by Number of Rooms in Indian Hills
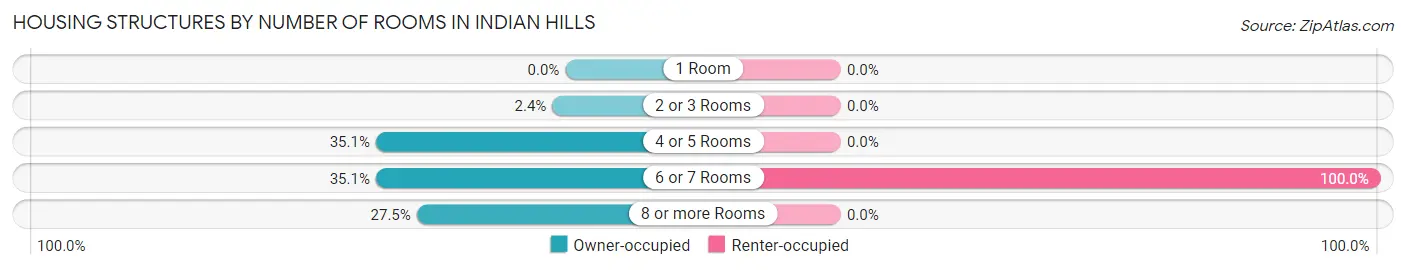
| Number of Rooms | Owner-occupied | Renter-occupied |
| 1 Room | 0 (0.0%) | 0 (0.0%) |
| 2 or 3 Rooms | 8 (2.4%) | 0 (0.0%) |
| 4 or 5 Rooms | 116 (35.0%) | 0 (0.0%) |
| 6 or 7 Rooms | 116 (35.0%) | 27 (100.0%) |
| 8 or more Rooms | 91 (27.5%) | 0 (0.0%) |
| Total | 331 (100.0%) | 27 (100.0%) |
Housing Structure by Heating Type in Indian Hills
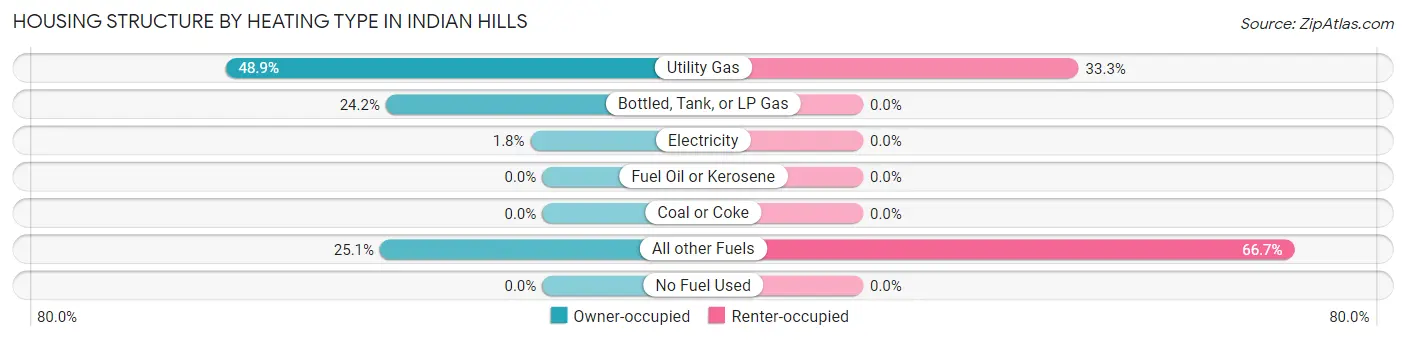
| Heating Type | Owner-occupied | Renter-occupied |
| Utility Gas | 162 (48.9%) | 9 (33.3%) |
| Bottled, Tank, or LP Gas | 80 (24.2%) | 0 (0.0%) |
| Electricity | 6 (1.8%) | 0 (0.0%) |
| Fuel Oil or Kerosene | 0 (0.0%) | 0 (0.0%) |
| Coal or Coke | 0 (0.0%) | 0 (0.0%) |
| All other Fuels | 83 (25.1%) | 18 (66.7%) |
| No Fuel Used | 0 (0.0%) | 0 (0.0%) |
| Total | 331 (100.0%) | 27 (100.0%) |
Household Vehicle Usage in Indian Hills
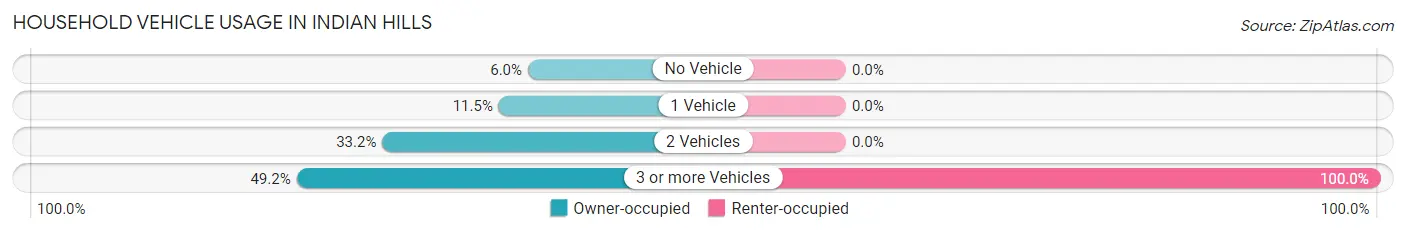
| Vehicles per Household | Owner-occupied | Renter-occupied |
| No Vehicle | 20 (6.0%) | 0 (0.0%) |
| 1 Vehicle | 38 (11.5%) | 0 (0.0%) |
| 2 Vehicles | 110 (33.2%) | 0 (0.0%) |
| 3 or more Vehicles | 163 (49.2%) | 27 (100.0%) |
| Total | 331 (100.0%) | 27 (100.0%) |
Real Estate & Mortgages in Indian Hills
Real Estate and Mortgage Overview in Indian Hills
| Characteristic | Without Mortgage | With Mortgage |
| Housing Units | 137 | 194 |
| Median Property Value | $150,400 | $161,500 |
| Median Household Income | $39,831 | $39 |
| Monthly Housing Costs | $381 | $0 |
| Real Estate Taxes | $633 | $13 |
Property Value by Mortgage Status in Indian Hills
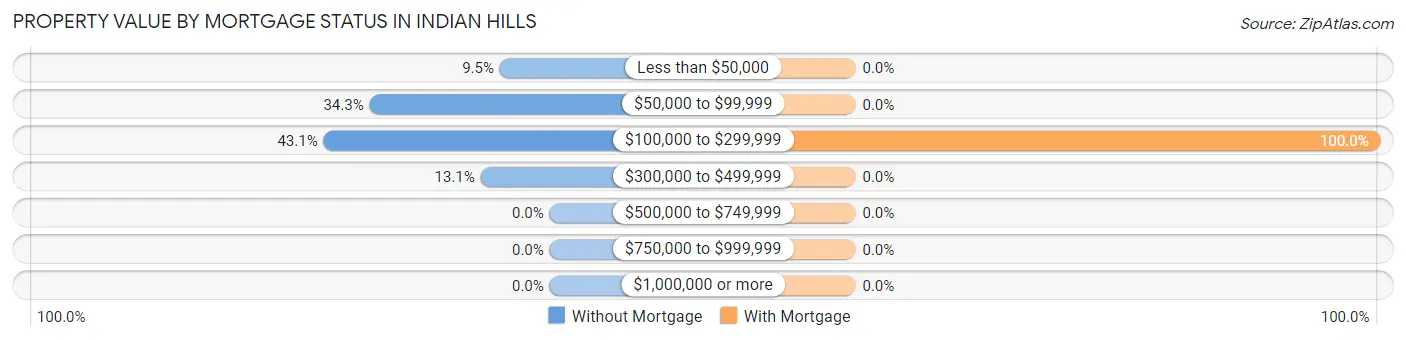
| Property Value | Without Mortgage | With Mortgage |
| Less than $50,000 | 13 (9.5%) | 0 (0.0%) |
| $50,000 to $99,999 | 47 (34.3%) | 0 (0.0%) |
| $100,000 to $299,999 | 59 (43.1%) | 194 (100.0%) |
| $300,000 to $499,999 | 18 (13.1%) | 0 (0.0%) |
| $500,000 to $749,999 | 0 (0.0%) | 0 (0.0%) |
| $750,000 to $999,999 | 0 (0.0%) | 0 (0.0%) |
| $1,000,000 or more | 0 (0.0%) | 0 (0.0%) |
| Total | 137 (100.0%) | 194 (100.0%) |
Household Income by Mortgage Status in Indian Hills
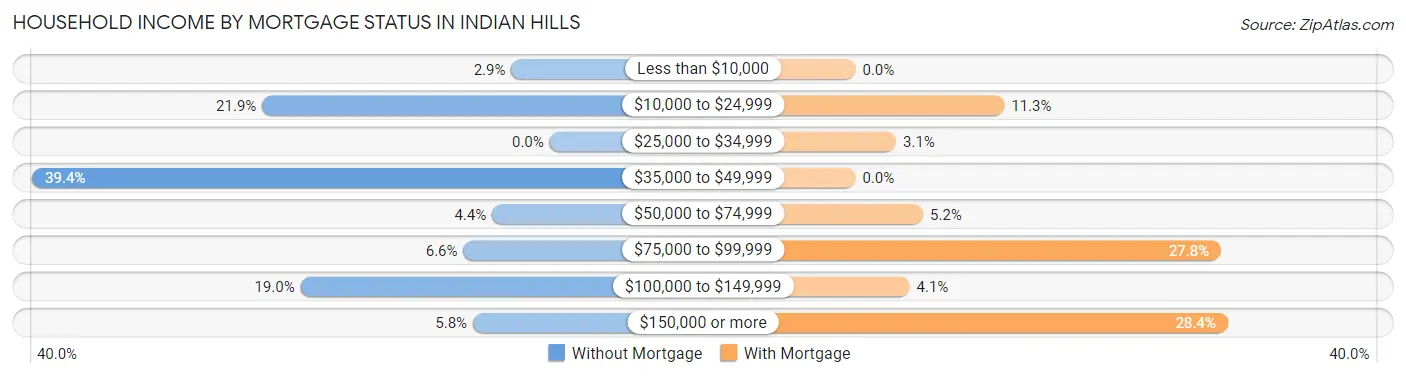
| Household Income | Without Mortgage | With Mortgage |
| Less than $10,000 | 4 (2.9%) | 0 (0.0%) |
| $10,000 to $24,999 | 30 (21.9%) | 22 (11.3%) |
| $25,000 to $34,999 | 0 (0.0%) | 6 (3.1%) |
| $35,000 to $49,999 | 54 (39.4%) | 0 (0.0%) |
| $50,000 to $74,999 | 6 (4.4%) | 10 (5.1%) |
| $75,000 to $99,999 | 9 (6.6%) | 54 (27.8%) |
| $100,000 to $149,999 | 26 (19.0%) | 8 (4.1%) |
| $150,000 or more | 8 (5.8%) | 55 (28.3%) |
| Total | 137 (100.0%) | 194 (100.0%) |
Property Value to Household Income Ratio in Indian Hills
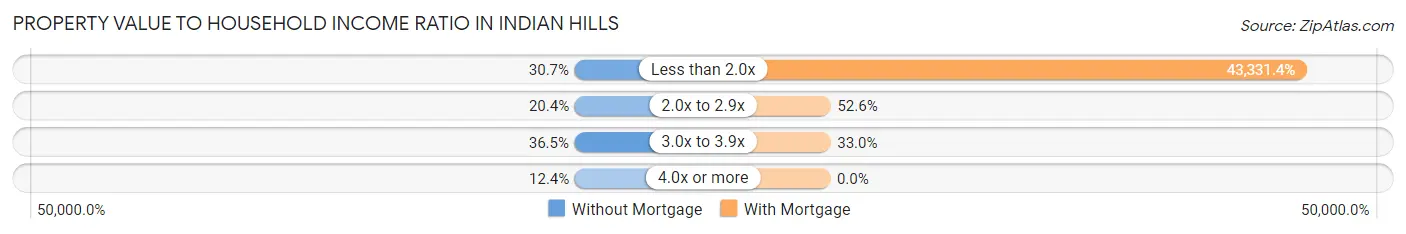
| Value-to-Income Ratio | Without Mortgage | With Mortgage |
| Less than 2.0x | 42 (30.7%) | 84,063 (43,331.4%) |
| 2.0x to 2.9x | 28 (20.4%) | 102 (52.6%) |
| 3.0x to 3.9x | 50 (36.5%) | 64 (33.0%) |
| 4.0x or more | 17 (12.4%) | 0 (0.0%) |
| Total | 137 (100.0%) | 194 (100.0%) |
Real Estate Taxes by Mortgage Status in Indian Hills
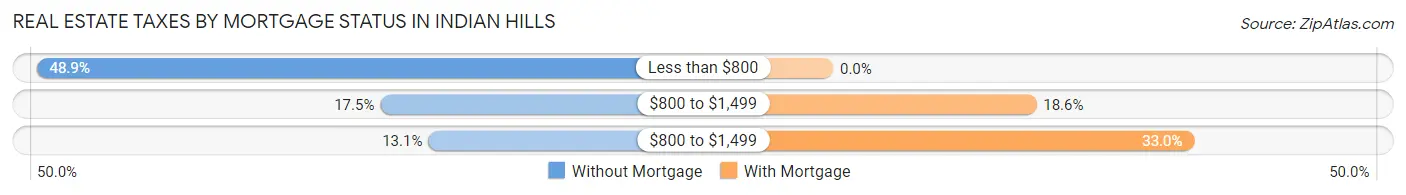
| Property Taxes | Without Mortgage | With Mortgage |
| Less than $800 | 67 (48.9%) | 0 (0.0%) |
| $800 to $1,499 | 24 (17.5%) | 36 (18.6%) |
| $800 to $1,499 | 18 (13.1%) | 64 (33.0%) |
| Total | 137 (100.0%) | 194 (100.0%) |
Health & Disability in Indian Hills
Health Insurance Coverage by Age in Indian Hills
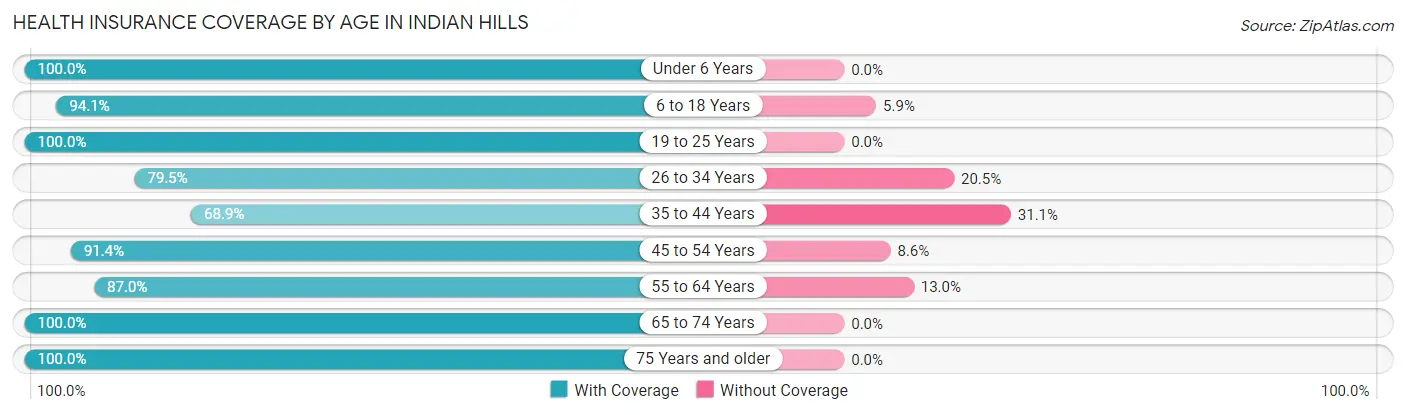
| Age Bracket | With Coverage | Without Coverage |
| Under 6 Years | 42 (100.0%) | 0 (0.0%) |
| 6 to 18 Years | 206 (94.1%) | 13 (5.9%) |
| 19 to 25 Years | 21 (100.0%) | 0 (0.0%) |
| 26 to 34 Years | 171 (79.5%) | 44 (20.5%) |
| 35 to 44 Years | 91 (68.9%) | 41 (31.1%) |
| 45 to 54 Years | 106 (91.4%) | 10 (8.6%) |
| 55 to 64 Years | 215 (87.0%) | 32 (13.0%) |
| 65 to 74 Years | 132 (100.0%) | 0 (0.0%) |
| 75 Years and older | 73 (100.0%) | 0 (0.0%) |
| Total | 1,057 (88.3%) | 140 (11.7%) |
Health Insurance Coverage by Citizenship Status in Indian Hills
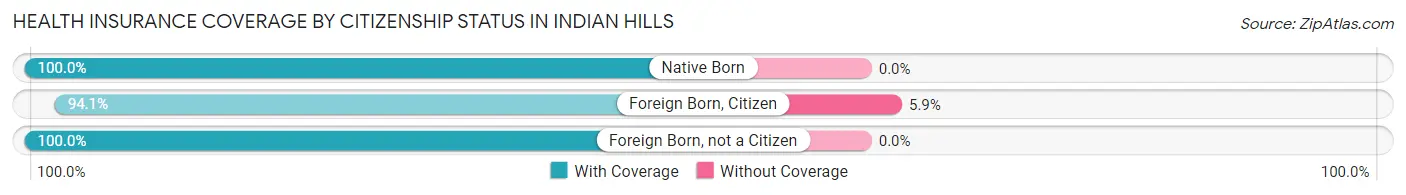
| Citizenship Status | With Coverage | Without Coverage |
| Native Born | 42 (100.0%) | 0 (0.0%) |
| Foreign Born, Citizen | 206 (94.1%) | 13 (5.9%) |
| Foreign Born, not a Citizen | 21 (100.0%) | 0 (0.0%) |
Health Insurance Coverage by Household Income in Indian Hills
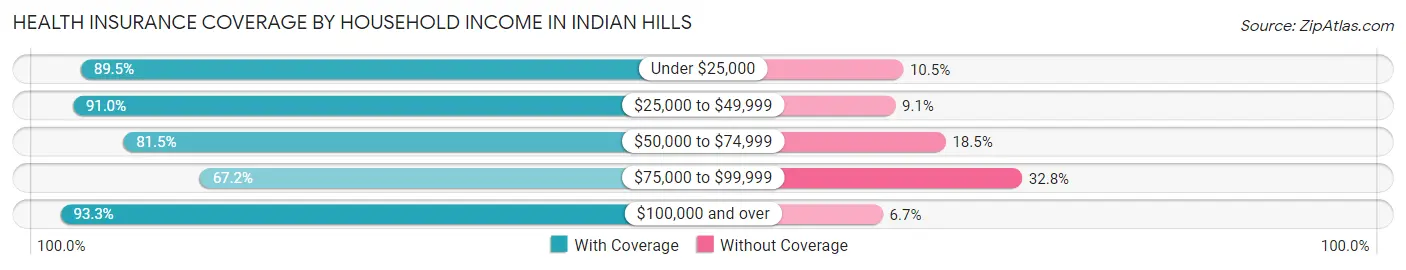
| Household Income | With Coverage | Without Coverage |
| Under $25,000 | 153 (89.5%) | 18 (10.5%) |
| $25,000 to $49,999 | 201 (90.9%) | 20 (9.0%) |
| $50,000 to $74,999 | 216 (81.5%) | 49 (18.5%) |
| $75,000 to $99,999 | 43 (67.2%) | 21 (32.8%) |
| $100,000 and over | 444 (93.3%) | 32 (6.7%) |
Public vs Private Health Insurance Coverage by Age in Indian Hills
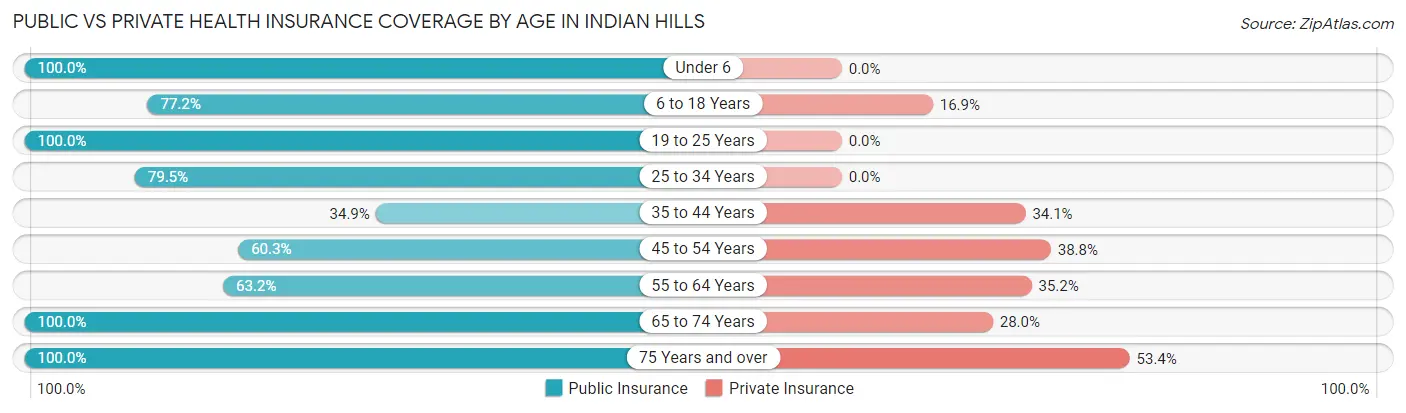
| Age Bracket | Public Insurance | Private Insurance |
| Under 6 | 42 (100.0%) | 0 (0.0%) |
| 6 to 18 Years | 169 (77.2%) | 37 (16.9%) |
| 19 to 25 Years | 21 (100.0%) | 0 (0.0%) |
| 25 to 34 Years | 171 (79.5%) | 0 (0.0%) |
| 35 to 44 Years | 46 (34.8%) | 45 (34.1%) |
| 45 to 54 Years | 70 (60.3%) | 45 (38.8%) |
| 55 to 64 Years | 156 (63.2%) | 87 (35.2%) |
| 65 to 74 Years | 132 (100.0%) | 37 (28.0%) |
| 75 Years and over | 73 (100.0%) | 39 (53.4%) |
| Total | 880 (73.5%) | 290 (24.2%) |
Disability Status by Sex by Age in Indian Hills
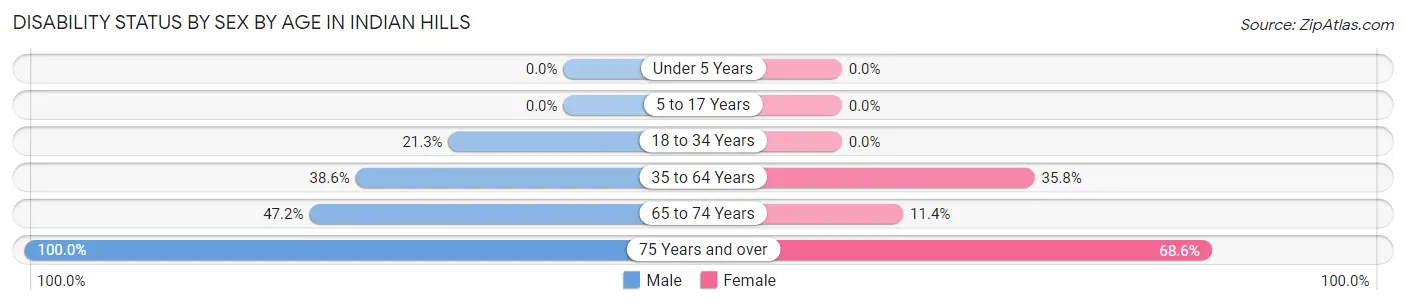
| Age Bracket | Male | Female |
| Under 5 Years | 0 (0.0%) | 0 (0.0%) |
| 5 to 17 Years | 0 (0.0%) | 0 (0.0%) |
| 18 to 34 Years | 32 (21.3%) | 0 (0.0%) |
| 35 to 64 Years | 81 (38.6%) | 102 (35.8%) |
| 65 to 74 Years | 25 (47.2%) | 9 (11.4%) |
| 75 Years and over | 22 (100.0%) | 35 (68.6%) |
Disability Class by Sex by Age in Indian Hills
Disability Class: Hearing Difficulty
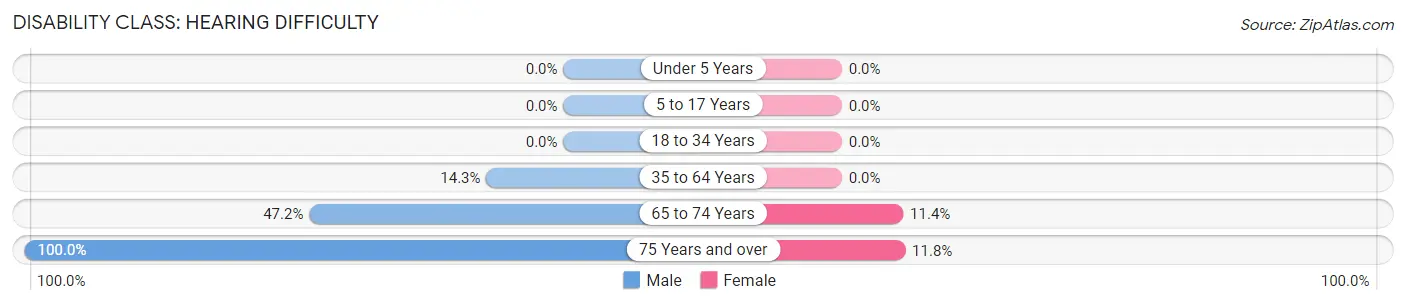
| Age Bracket | Male | Female |
| Under 5 Years | 0 (0.0%) | 0 (0.0%) |
| 5 to 17 Years | 0 (0.0%) | 0 (0.0%) |
| 18 to 34 Years | 0 (0.0%) | 0 (0.0%) |
| 35 to 64 Years | 30 (14.3%) | 0 (0.0%) |
| 65 to 74 Years | 25 (47.2%) | 9 (11.4%) |
| 75 Years and over | 22 (100.0%) | 6 (11.8%) |
Disability Class: Vision Difficulty
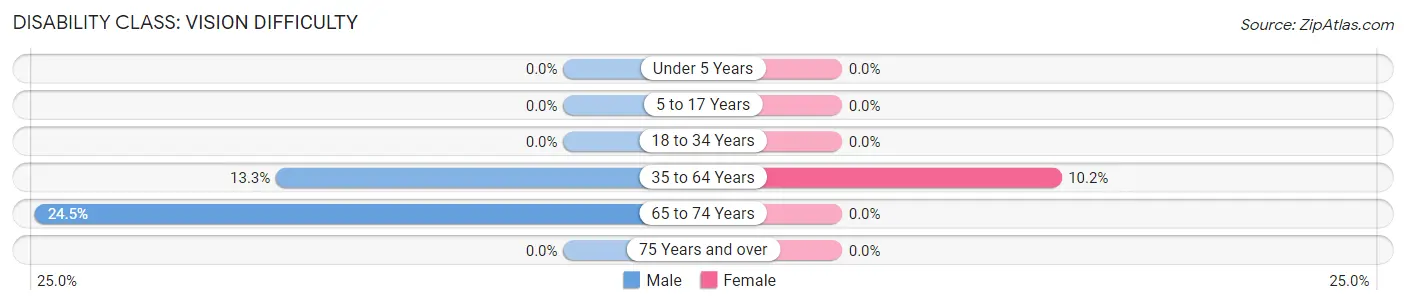
| Age Bracket | Male | Female |
| Under 5 Years | 0 (0.0%) | 0 (0.0%) |
| 5 to 17 Years | 0 (0.0%) | 0 (0.0%) |
| 18 to 34 Years | 0 (0.0%) | 0 (0.0%) |
| 35 to 64 Years | 28 (13.3%) | 29 (10.2%) |
| 65 to 74 Years | 13 (24.5%) | 0 (0.0%) |
| 75 Years and over | 0 (0.0%) | 0 (0.0%) |
Disability Class: Cognitive Difficulty
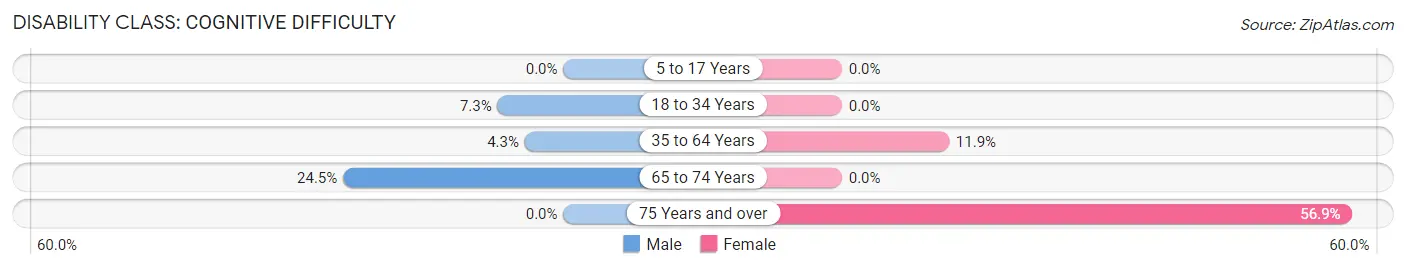
| Age Bracket | Male | Female |
| 5 to 17 Years | 0 (0.0%) | 0 (0.0%) |
| 18 to 34 Years | 11 (7.3%) | 0 (0.0%) |
| 35 to 64 Years | 9 (4.3%) | 34 (11.9%) |
| 65 to 74 Years | 13 (24.5%) | 0 (0.0%) |
| 75 Years and over | 0 (0.0%) | 29 (56.9%) |
Disability Class: Ambulatory Difficulty
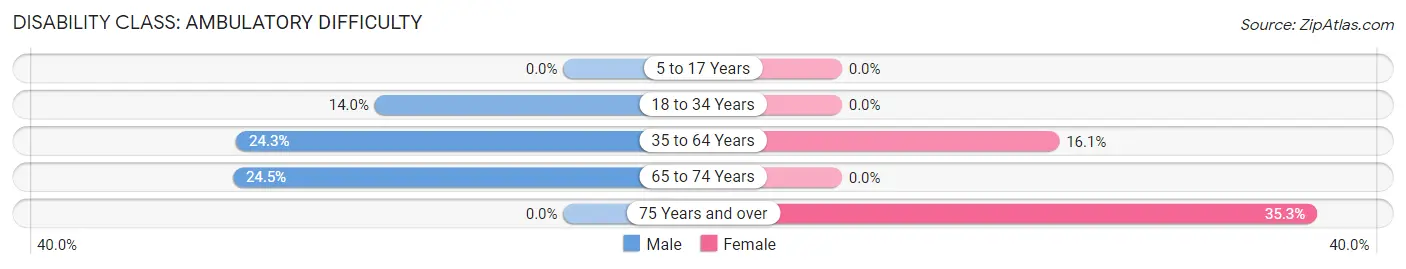
| Age Bracket | Male | Female |
| 5 to 17 Years | 0 (0.0%) | 0 (0.0%) |
| 18 to 34 Years | 21 (14.0%) | 0 (0.0%) |
| 35 to 64 Years | 51 (24.3%) | 46 (16.1%) |
| 65 to 74 Years | 13 (24.5%) | 0 (0.0%) |
| 75 Years and over | 0 (0.0%) | 18 (35.3%) |
Disability Class: Self-Care Difficulty
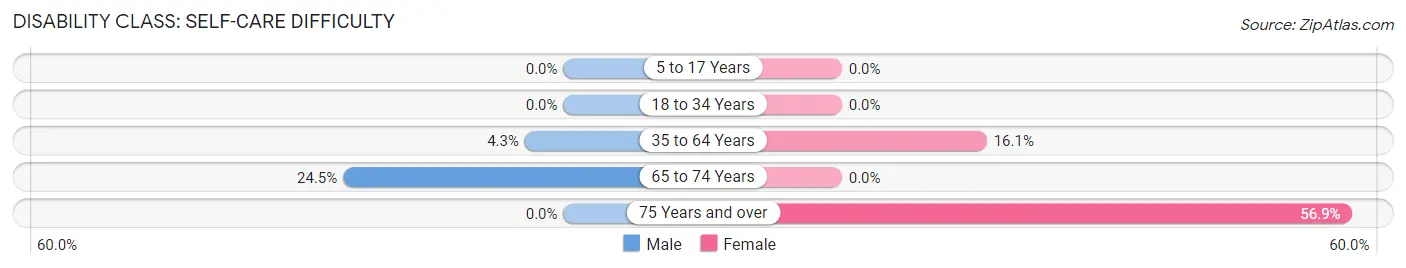
| Age Bracket | Male | Female |
| 5 to 17 Years | 0 (0.0%) | 0 (0.0%) |
| 18 to 34 Years | 0 (0.0%) | 0 (0.0%) |
| 35 to 64 Years | 9 (4.3%) | 46 (16.1%) |
| 65 to 74 Years | 13 (24.5%) | 0 (0.0%) |
| 75 Years and over | 0 (0.0%) | 29 (56.9%) |
Technology Access in Indian Hills
Computing Device Access in Indian Hills
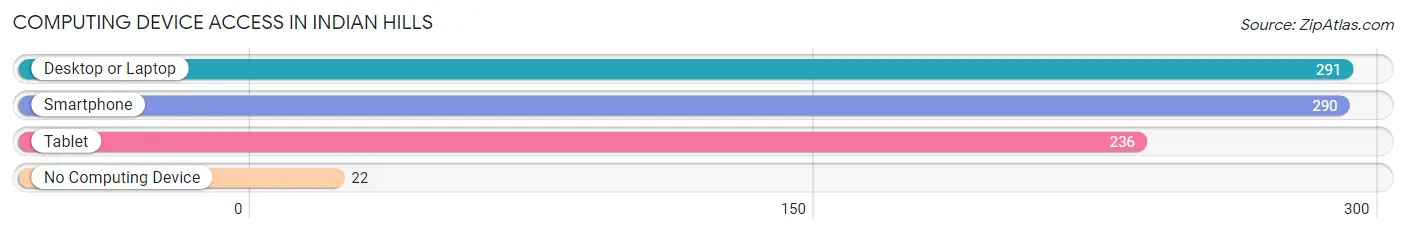
| Device Type | # Households | % Households |
| Desktop or Laptop | 291 | 81.3% |
| Smartphone | 290 | 81.0% |
| Tablet | 236 | 65.9% |
| No Computing Device | 22 | 6.1% |
| Total | 358 | 100.0% |
Internet Access in Indian Hills
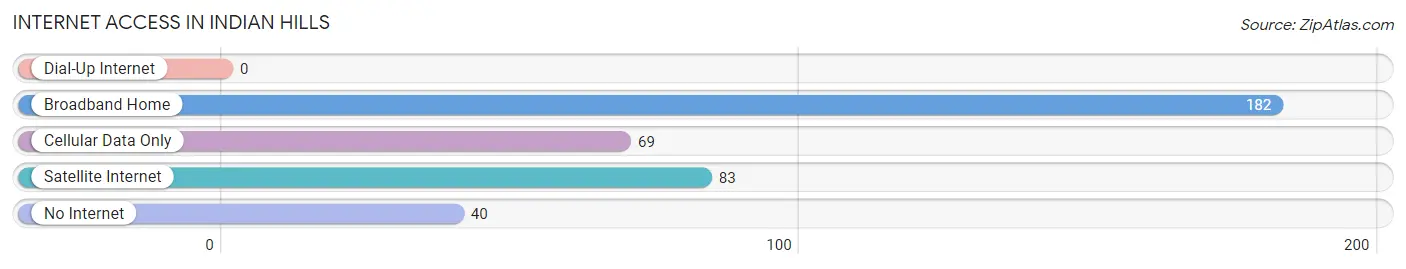
| Internet Type | # Households | % Households |
| Dial-Up Internet | 0 | 0.0% |
| Broadband Home | 182 | 50.8% |
| Cellular Data Only | 69 | 19.3% |
| Satellite Internet | 83 | 23.2% |
| No Internet | 40 | 11.2% |
| Total | 358 | 100.0% |
Indian Hills Summary
History
Indian Hills is a small unincorporated community located in the foothills of the Sangre de Cristo Mountains in Taos County, New Mexico. The area was first settled by the Taos Indians in the late 1700s and was later home to a number of Hispanic and Anglo settlers. The area was originally known as “La Loma de los Indios” or “The Hill of the Indians” and was later changed to Indian Hills.
The area was first settled by the Taos Indians in the late 1700s and was later home to a number of Hispanic and Anglo settlers. The area was originally known as “La Loma de los Indios” or “The Hill of the Indians” and was later changed to Indian Hills. The area was first settled by the Taos Indians in the late 1700s and was later home to a number of Hispanic and Anglo settlers. The area was originally known as “La Loma de los Indios” or “The Hill of the Indians” and was later changed to Indian Hills.
The area was first settled by the Taos Indians in the late 1700s and was later home to a number of Hispanic and Anglo settlers. The area was originally known as “La Loma de los Indios” or “The Hill of the Indians” and was later changed to Indian Hills. The area was first settled by the Taos Indians in the late 1700s and was later home to a number of Hispanic and Anglo settlers. The area was originally known as “La Loma de los Indios” or “The Hill of the Indians” and was later changed to Indian Hills.
The area was first settled by the Taos Indians in the late 1700s and was later home to a number of Hispanic and Anglo settlers. The area was originally known as “La Loma de los Indios” or “The Hill of the Indians” and was later changed to Indian Hills. The area was first settled by the Taos Indians in the late 1700s and was later home to a number of Hispanic and Anglo settlers. The area was originally known as “La Loma de los Indios” or “The Hill of the Indians” and was later changed to Indian Hills.
The area was first settled by the Taos Indians in the late 1700s and was later home to a number of Hispanic and Anglo settlers. The area was originally known as “La Loma de los Indios” or “The Hill of the Indians” and was later changed to Indian Hills. The area was first settled by the Taos Indians in the late 1700s and was later home to a number of Hispanic and Anglo settlers. The area was originally known as “La Loma de los Indios” or “The Hill of the Indians” and was later changed to Indian Hills.
In the late 1800s, the area was home to a number of small ranches and farms. The area was also home to a number of small businesses, including a general store, a post office, a blacksmith shop, and a saloon. The area was also home to a number of churches, including the Catholic Church of Our Lady of Guadalupe, which was built in 1891.
In the early 1900s, the area began to experience a population boom as more people moved to the area to take advantage of the area’s natural resources. The area was home to a number of small businesses, including a general store, a post office, a blacksmith shop, and a saloon. The area was also home to a number of churches, including the Catholic Church of Our Lady of Guadalupe, which was built in 1891.
In the mid-1900s, the area began to experience a decline in population as people moved away from the area in search of better economic opportunities. The area was also affected by the Great Depression, which caused many of the area’s businesses to close.
In the late 1900s, the area began to experience a resurgence in population as people began to move back to the area in search of a more rural lifestyle. The area is now home to a number of small businesses, including a general store, a post office, a blacksmith shop, and a saloon. The area is also home to a number of churches, including the Catholic Church of Our Lady of Guadalupe, which was built in 1891.
Geography
Indian Hills is located in the foothills of the Sangre de Cristo Mountains in Taos County, New Mexico. The area is located at an elevation of 6,000 feet and is surrounded by the Carson National Forest. The area is home to a number of small streams and rivers, including the Rio Grande, the Red River, and the Pecos River. The area is also home to a number of small lakes, including the Rio Grande Reservoir and the Red River Reservoir.
The area is home to a variety of wildlife, including deer, elk, bear, mountain lions, and a variety of birds. The area is also home to a number of plants, including juniper, piñon, and ponderosa pine.
Economy
The economy of Indian Hills is largely based on tourism and agriculture. The area is home to a number of small businesses, including a general store, a post office, a blacksmith shop, and a saloon. The area is also home to a number of churches, including the Catholic Church of Our Lady of Guadalupe, which was built in 1891.
The area is also home to a number of small farms and ranches, which produce a variety of crops, including hay, alfalfa, and corn. The area is also home to a number of small businesses, including a general store, a post office, a blacksmith shop, and a saloon.
Demographics
As of the 2010 census, the population of Indian Hills was 1,845. The population is largely Hispanic, with a small percentage of Anglo and Native American residents. The median age of the population is 44.7 years, and the median household income is $37,917. The area is largely rural, with a small percentage of the population living in urban areas. The area is home to a number of small businesses, including a general store, a post office, a blacksmith shop, and a saloon. The area is also home to a number of churches, including the Catholic Church of Our Lady of Guadalupe, which was built in 1891.
Common Questions
What is Per Capita Income in Indian Hills?
Per Capita income in Indian Hills is $32,469.
What is the Median Family Income in Indian Hills?
Median Family Income in Indian Hills is $68,403.
What is the Median Household income in Indian Hills?
Median Household Income in Indian Hills is $57,431.
What is Income or Wage Gap in Indian Hills?
Income or Wage Gap in Indian Hills is 45.5%.
Women in Indian Hills earn 54.5 cents for every dollar earned by a man.
What is Inequality or Gini Index in Indian Hills?
Inequality or Gini Index in Indian Hills is 0.53.
What is the Total Population of Indian Hills?
Total Population of Indian Hills is 1,197.
What is the Total Male Population of Indian Hills?
Total Male Population of Indian Hills is 511.
What is the Total Female Population of Indian Hills?
Total Female Population of Indian Hills is 686.
What is the Ratio of Males per 100 Females in Indian Hills?
There are 74.49 Males per 100 Females in Indian Hills.
What is the Ratio of Females per 100 Males in Indian Hills?
There are 134.25 Females per 100 Males in Indian Hills.
What is the Median Population Age in Indian Hills?
Median Population Age in Indian Hills is 40.2 Years.
What is the Average Family Size in Indian Hills
Average Family Size in Indian Hills is 3.7 People.
What is the Average Household Size in Indian Hills
Average Household Size in Indian Hills is 3.3 People.
How Large is the Labor Force in Indian Hills?
There are 542 People in the Labor Forcein in Indian Hills.
What is the Percentage of People in the Labor Force in Indian Hills?
55.1% of People are in the Labor Force in Indian Hills.
What is the Unemployment Rate in Indian Hills?
Unemployment Rate in Indian Hills is 19.4%.