East Ellijay, GA Map & Demographics
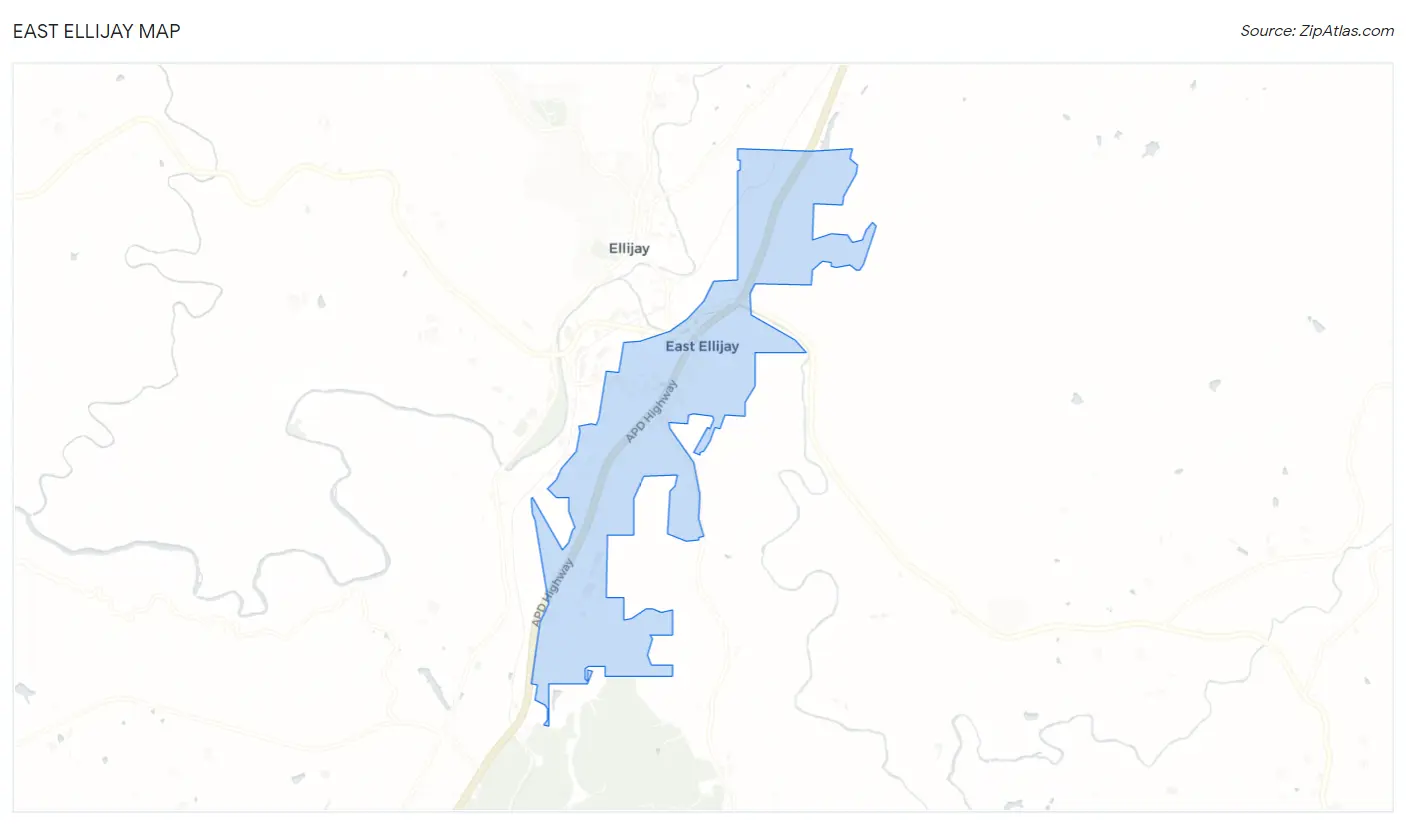
East Ellijay Map
East Ellijay Overview
$41,665
PER CAPITA INCOME
$60,714
AVG FAMILY INCOME
$26,691
AVG HOUSEHOLD INCOME
$10,039
FAMILY INCOME DEFICIT
0.63
INEQUALITY / GINI INDEX
530
TOTAL POPULATION
228
MALE POPULATION
302
FEMALE POPULATION
75.50
MALES / 100 FEMALES
132.46
FEMALES / 100 MALES
50.4
MEDIAN AGE
2.8
AVG FAMILY SIZE
1.8
AVG HOUSEHOLD SIZE
233
LABOR FORCE [ PEOPLE ]
51.4%
PERCENT IN LABOR FORCE
10.7%
UNEMPLOYMENT RATE
East Ellijay Zip Codes
East Ellijay Area Codes
Income in East Ellijay
Income Overview in East Ellijay
Per Capita Income in East Ellijay is $41,665, while median incomes of families and households are $60,714 and $26,691 respectively.
| Characteristic | Number | Measure |
| Per Capita Income | 530 | $41,665 |
| Median Family Income | 102 | $60,714 |
| Mean Family Income | 102 | $98,922 |
| Median Household Income | 289 | $26,691 |
| Mean Household Income | 289 | $67,729 |
| Income Deficit | 102 | $10,039 |
| Wage / Income Gap (%) | 530 | 0.00% |
| Wage / Income Gap ($) | 530 | 100.00¢ per $1 |
| Gini / Inequality Index | 530 | 0.63 |
Earnings by Sex in East Ellijay
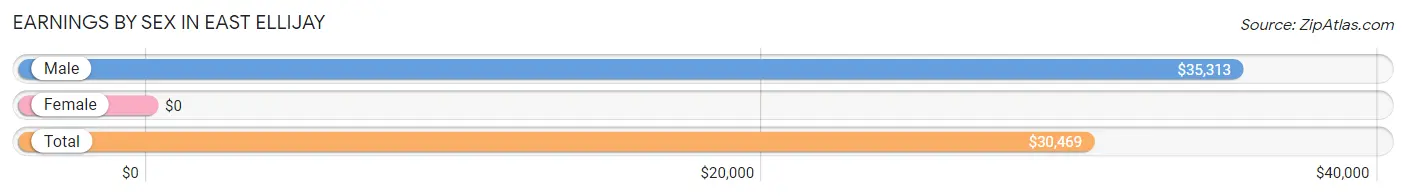
| Sex | Number | Average Earnings |
| Male | 125 (53.6%) | $35,313 |
| Female | 108 (46.4%) | $0 |
| Total | 233 (100.0%) | $30,469 |
Earnings by Sex by Income Bracket in East Ellijay
The most common earnings brackets in East Ellijay are $55,000 to $64,999 for men (19 | 15.2%) and $55,000 to $64,999 for women (17 | 15.7%).
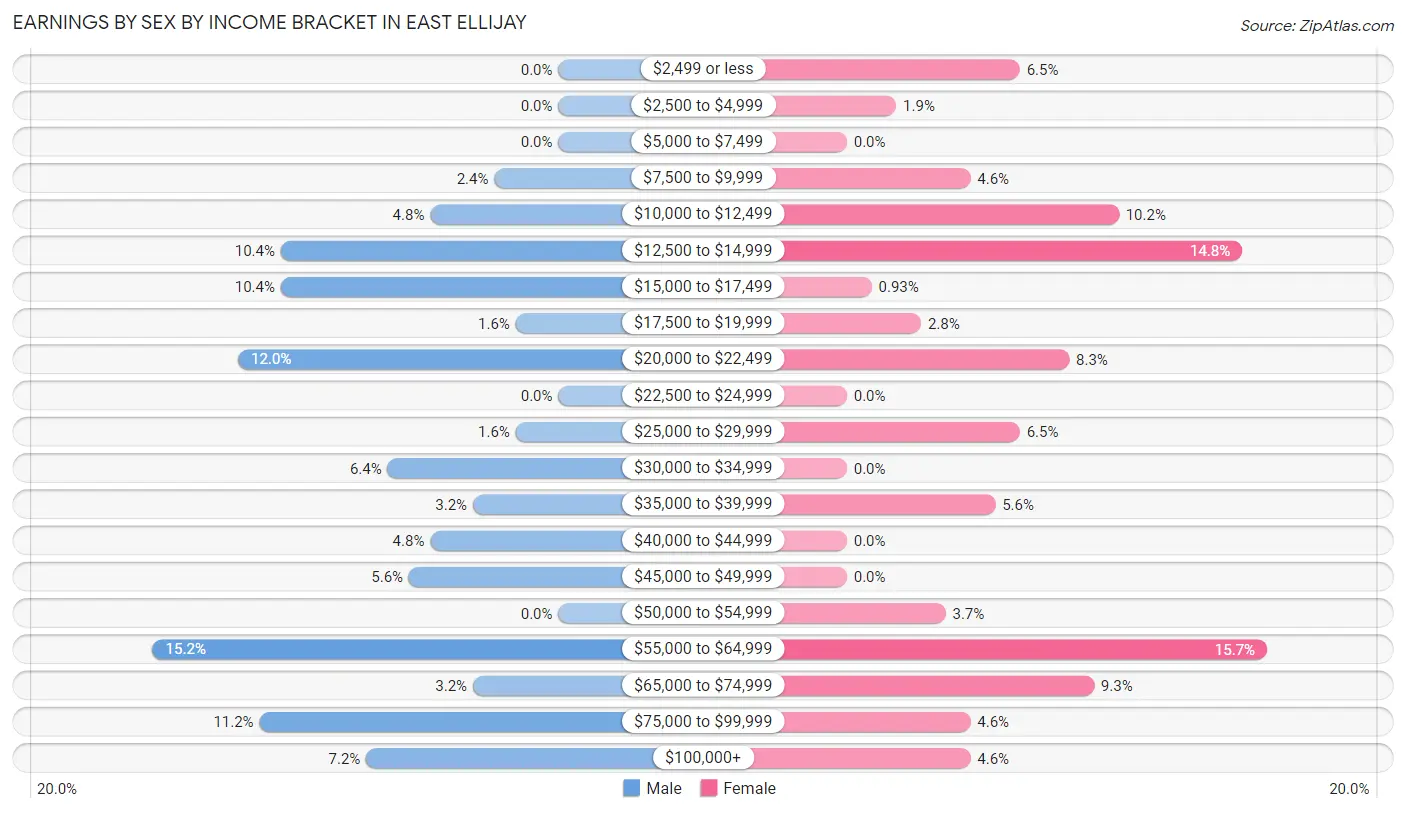
| Income | Male | Female |
| $2,499 or less | 0 (0.0%) | 7 (6.5%) |
| $2,500 to $4,999 | 0 (0.0%) | 2 (1.8%) |
| $5,000 to $7,499 | 0 (0.0%) | 0 (0.0%) |
| $7,500 to $9,999 | 3 (2.4%) | 5 (4.6%) |
| $10,000 to $12,499 | 6 (4.8%) | 11 (10.2%) |
| $12,500 to $14,999 | 13 (10.4%) | 16 (14.8%) |
| $15,000 to $17,499 | 13 (10.4%) | 1 (0.9%) |
| $17,500 to $19,999 | 2 (1.6%) | 3 (2.8%) |
| $20,000 to $22,499 | 15 (12.0%) | 9 (8.3%) |
| $22,500 to $24,999 | 0 (0.0%) | 0 (0.0%) |
| $25,000 to $29,999 | 2 (1.6%) | 7 (6.5%) |
| $30,000 to $34,999 | 8 (6.4%) | 0 (0.0%) |
| $35,000 to $39,999 | 4 (3.2%) | 6 (5.6%) |
| $40,000 to $44,999 | 6 (4.8%) | 0 (0.0%) |
| $45,000 to $49,999 | 7 (5.6%) | 0 (0.0%) |
| $50,000 to $54,999 | 0 (0.0%) | 4 (3.7%) |
| $55,000 to $64,999 | 19 (15.2%) | 17 (15.7%) |
| $65,000 to $74,999 | 4 (3.2%) | 10 (9.3%) |
| $75,000 to $99,999 | 14 (11.2%) | 5 (4.6%) |
| $100,000+ | 9 (7.2%) | 5 (4.6%) |
| Total | 125 (100.0%) | 108 (100.0%) |
Earnings by Sex by Educational Attainment in East Ellijay
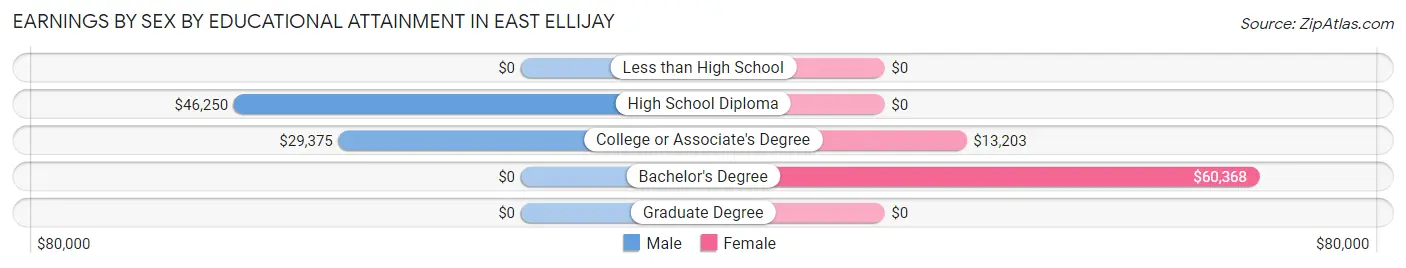
| Educational Attainment | Male Income | Female Income |
| Less than High School | - | - |
| High School Diploma | $46,250 | $0 |
| College or Associate's Degree | $29,375 | $13,203 |
| Bachelor's Degree | - | - |
| Graduate Degree | - | - |
| Total | $40,208 | $0 |
Family Income in East Ellijay
Family Income Brackets in East Ellijay
According to the East Ellijay family income data, there are 23 families falling into the $150,000 to $199,999 income range, which is the most common income bracket and makes up 22.6% of all families.
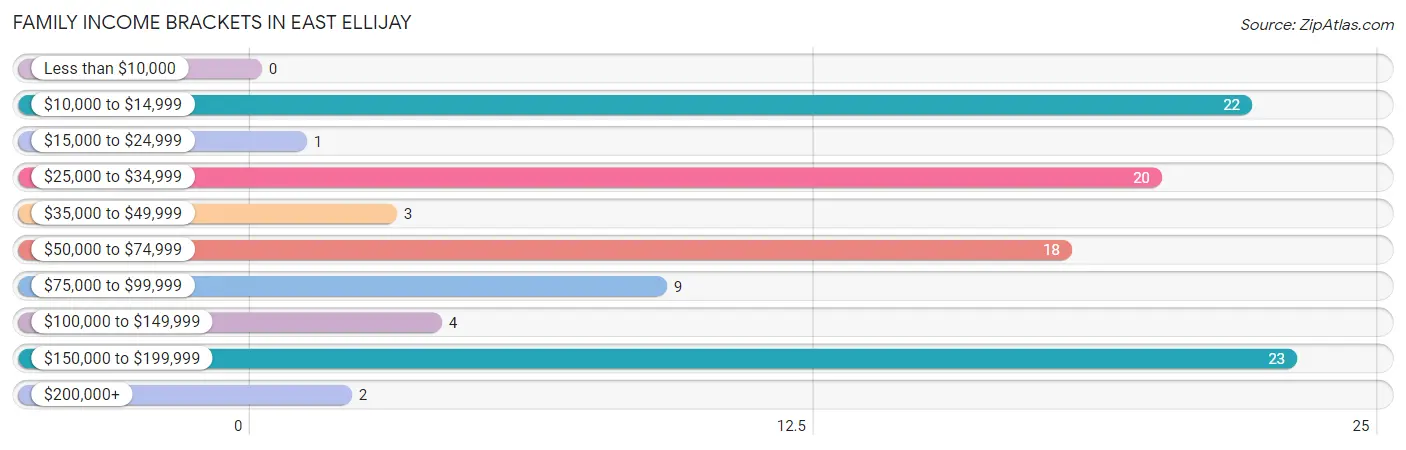
| Income Bracket | # Families | % Families |
| Less than $10,000 | 0 | 0.0% |
| $10,000 to $14,999 | 22 | 21.6% |
| $15,000 to $24,999 | 1 | 1.0% |
| $25,000 to $34,999 | 20 | 19.6% |
| $35,000 to $49,999 | 3 | 2.9% |
| $50,000 to $74,999 | 18 | 17.6% |
| $75,000 to $99,999 | 9 | 8.8% |
| $100,000 to $149,999 | 4 | 3.9% |
| $150,000 to $199,999 | 23 | 22.5% |
| $200,000+ | 2 | 2.0% |
Family Income by Famaliy Size in East Ellijay
| Income Bracket | # Families | Median Income |
| 2-Person Families | 54 (52.9%) | $0 |
| 3-Person Families | 27 (26.5%) | $0 |
| 4-Person Families | 13 (12.8%) | $0 |
| 5-Person Families | 8 (7.8%) | $0 |
| 6-Person Families | 0 (0.0%) | $0 |
| 7+ Person Families | 0 (0.0%) | $0 |
| Total | 102 (100.0%) | $60,714 |
Family Income by Number of Earners in East Ellijay
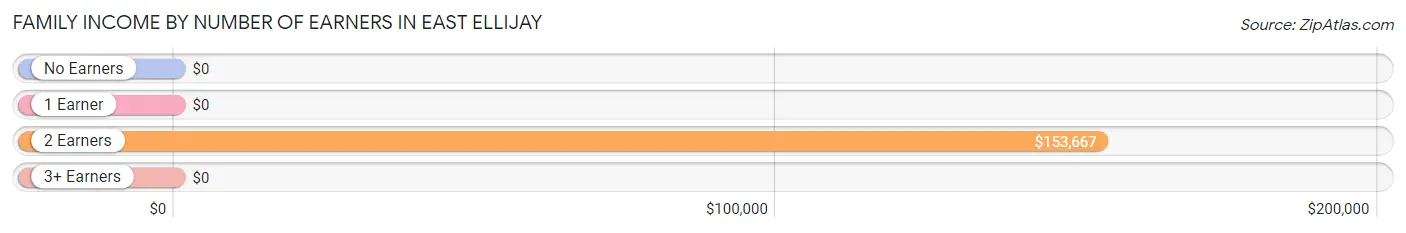
| Number of Earners | # Families | Median Income |
| No Earners | 15 (14.7%) | $0 |
| 1 Earner | 58 (56.9%) | $0 |
| 2 Earners | 24 (23.5%) | $153,667 |
| 3+ Earners | 5 (4.9%) | $0 |
| Total | 102 (100.0%) | $60,714 |
Household Income in East Ellijay
Household Income Brackets in East Ellijay
With 72 households falling in the category, the $15,000 to $24,999 income range is the most frequent in East Ellijay, accounting for 24.9% of all households. In contrast, only 4 households (1.4%) fall into the $200,000+ income bracket, making it the least populous group.
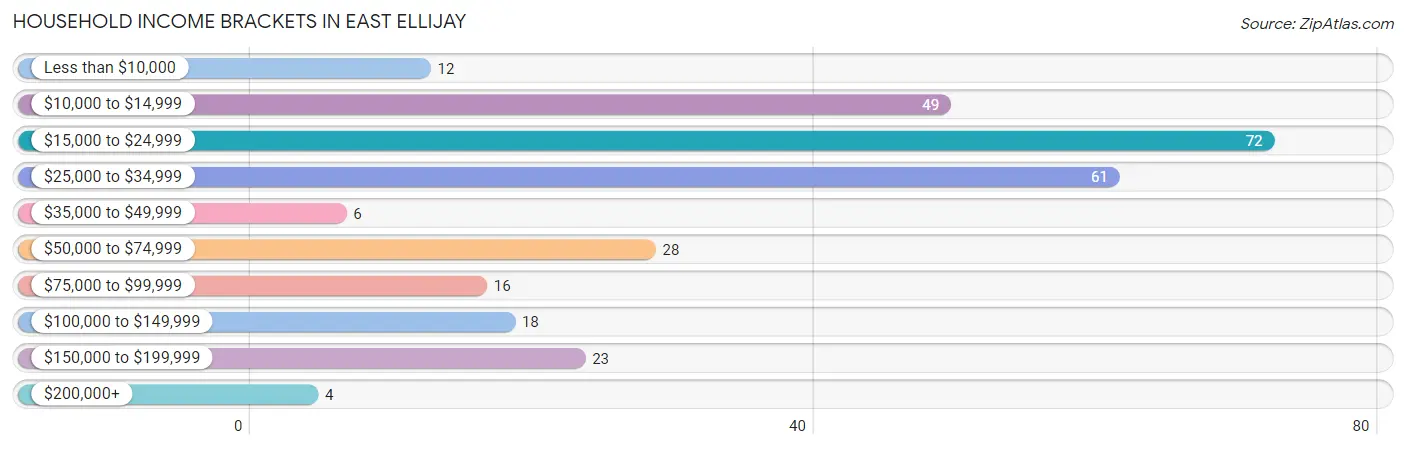
| Income Bracket | # Households | % Households |
| Less than $10,000 | 12 | 4.2% |
| $10,000 to $14,999 | 49 | 17.0% |
| $15,000 to $24,999 | 72 | 24.9% |
| $25,000 to $34,999 | 61 | 21.1% |
| $35,000 to $49,999 | 6 | 2.1% |
| $50,000 to $74,999 | 28 | 9.7% |
| $75,000 to $99,999 | 16 | 5.5% |
| $100,000 to $149,999 | 18 | 6.2% |
| $150,000 to $199,999 | 23 | 8.0% |
| $200,000+ | 4 | 1.4% |
Household Income by Householder Age in East Ellijay
The median household income in East Ellijay is $26,691, with the highest median household income of $22,381 found in the 65+ years age bracket for the primary householder. A total of 136 households (47.1%) fall into this category. Meanwhile, the 15 to 24 years age bracket for the primary householder has the lowest median household income of $0, with 3 households (1.0%) in this group.
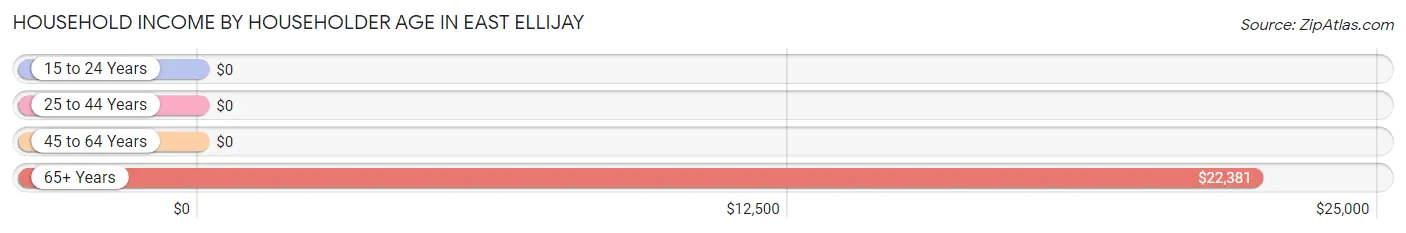
| Income Bracket | # Households | Median Income |
| 15 to 24 Years | 3 (1.0%) | $0 |
| 25 to 44 Years | 84 (29.1%) | $0 |
| 45 to 64 Years | 66 (22.8%) | $0 |
| 65+ Years | 136 (47.1%) | $22,381 |
| Total | 289 (100.0%) | $26,691 |
Poverty in East Ellijay
Income Below Poverty by Sex and Age in East Ellijay
With 15.8% poverty level for males and 39.4% for females among the residents of East Ellijay, under 5 year old males and under 5 year old females are the most vulnerable to poverty, with 15 males (60.0%) and 9 females (100.0%) in their respective age groups living below the poverty level.
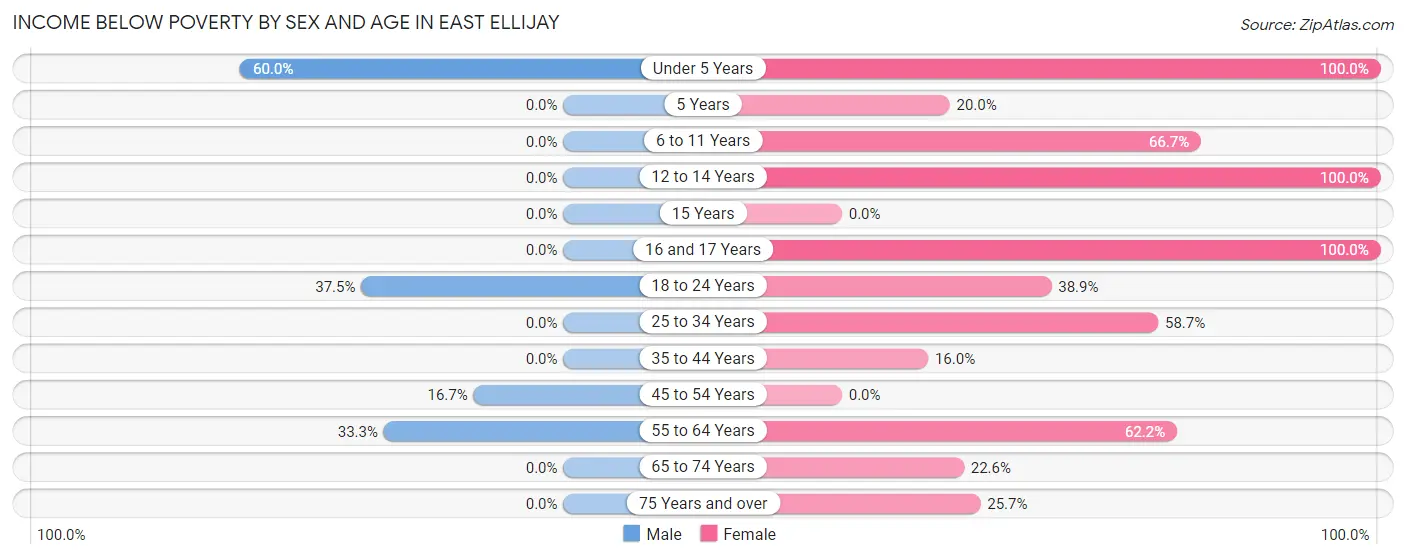
| Age Bracket | Male | Female |
| Under 5 Years | 15 (60.0%) | 9 (100.0%) |
| 5 Years | 0 (0.0%) | 1 (20.0%) |
| 6 to 11 Years | 0 (0.0%) | 6 (66.7%) |
| 12 to 14 Years | 0 (0.0%) | 4 (100.0%) |
| 15 Years | 0 (0.0%) | 0 (0.0%) |
| 16 and 17 Years | 0 (0.0%) | 3 (100.0%) |
| 18 to 24 Years | 3 (37.5%) | 7 (38.9%) |
| 25 to 34 Years | 0 (0.0%) | 27 (58.7%) |
| 35 to 44 Years | 0 (0.0%) | 4 (16.0%) |
| 45 to 54 Years | 5 (16.7%) | 0 (0.0%) |
| 55 to 64 Years | 13 (33.3%) | 28 (62.2%) |
| 65 to 74 Years | 0 (0.0%) | 12 (22.6%) |
| 75 Years and over | 0 (0.0%) | 18 (25.7%) |
| Total | 36 (15.8%) | 119 (39.4%) |
Income Above Poverty by Sex and Age in East Ellijay
According to the poverty statistics in East Ellijay, males aged 5 years and females aged 45 to 54 years are the age groups that are most secure financially, with 100.0% of males and 100.0% of females in these age groups living above the poverty line.
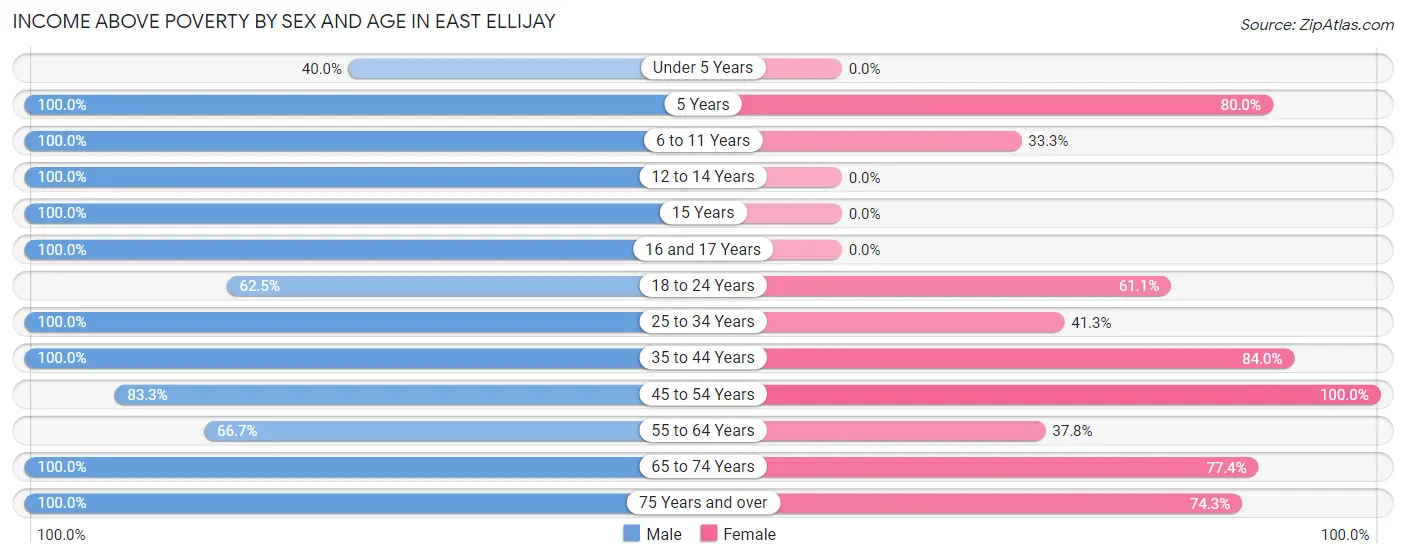
| Age Bracket | Male | Female |
| Under 5 Years | 10 (40.0%) | 0 (0.0%) |
| 5 Years | 7 (100.0%) | 4 (80.0%) |
| 6 to 11 Years | 3 (100.0%) | 3 (33.3%) |
| 12 to 14 Years | 13 (100.0%) | 0 (0.0%) |
| 15 Years | 2 (100.0%) | 0 (0.0%) |
| 16 and 17 Years | 6 (100.0%) | 0 (0.0%) |
| 18 to 24 Years | 5 (62.5%) | 11 (61.1%) |
| 25 to 34 Years | 36 (100.0%) | 19 (41.3%) |
| 35 to 44 Years | 24 (100.0%) | 21 (84.0%) |
| 45 to 54 Years | 25 (83.3%) | 15 (100.0%) |
| 55 to 64 Years | 26 (66.7%) | 17 (37.8%) |
| 65 to 74 Years | 19 (100.0%) | 41 (77.4%) |
| 75 Years and over | 16 (100.0%) | 52 (74.3%) |
| Total | 192 (84.2%) | 183 (60.6%) |
Income Below Poverty Among Married-Couple Families in East Ellijay
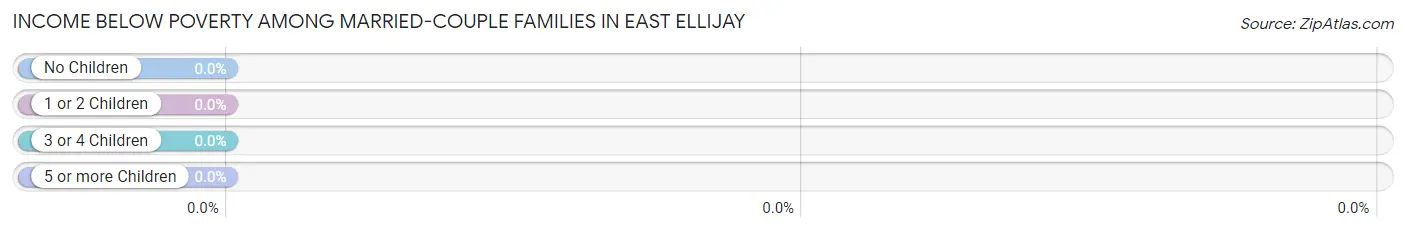
| Children | Above Poverty | Below Poverty |
| No Children | 41 (100.0%) | 0 (0.0%) |
| 1 or 2 Children | 14 (100.0%) | 0 (0.0%) |
| 3 or 4 Children | 0 (0.0%) | 0 (0.0%) |
| 5 or more Children | 0 (0.0%) | 0 (0.0%) |
| Total | 55 (100.0%) | 0 (0.0%) |
Income Below Poverty Among Single-Parent Households in East Ellijay
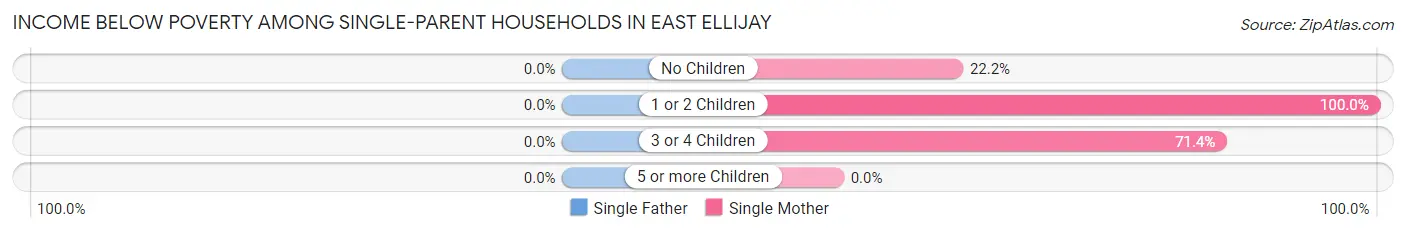
| Children | Single Father | Single Mother |
| No Children | 0 (0.0%) | 2 (22.2%) |
| 1 or 2 Children | 0 (0.0%) | 16 (100.0%) |
| 3 or 4 Children | 0 (0.0%) | 5 (71.4%) |
| 5 or more Children | 0 (0.0%) | 0 (0.0%) |
| Total | 0 (0.0%) | 23 (71.9%) |
Income Below Poverty Among Married-Couple vs Single-Parent Households in East Ellijay
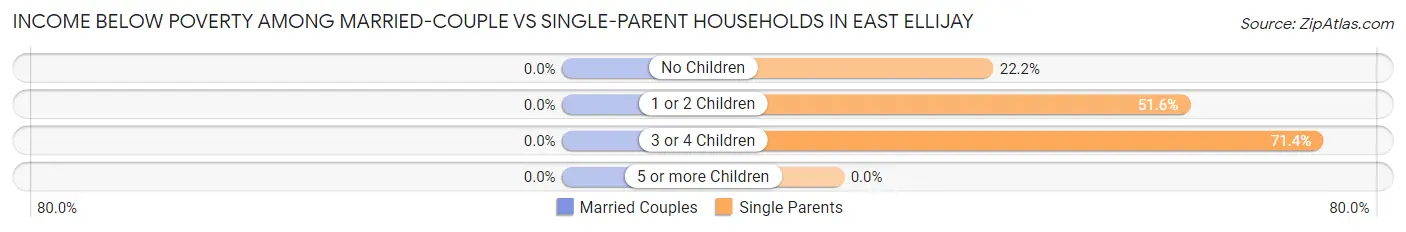
| Children | Married-Couple Families | Single-Parent Households |
| No Children | 0 (0.0%) | 2 (22.2%) |
| 1 or 2 Children | 0 (0.0%) | 16 (51.6%) |
| 3 or 4 Children | 0 (0.0%) | 5 (71.4%) |
| 5 or more Children | 0 (0.0%) | 0 (0.0%) |
| Total | 0 (0.0%) | 23 (48.9%) |
Race in East Ellijay
The most populous races in East Ellijay are White / Caucasian (453 | 85.5%), Hispanic or Latino (59 | 11.1%), and Two or more Races (24 | 4.5%).
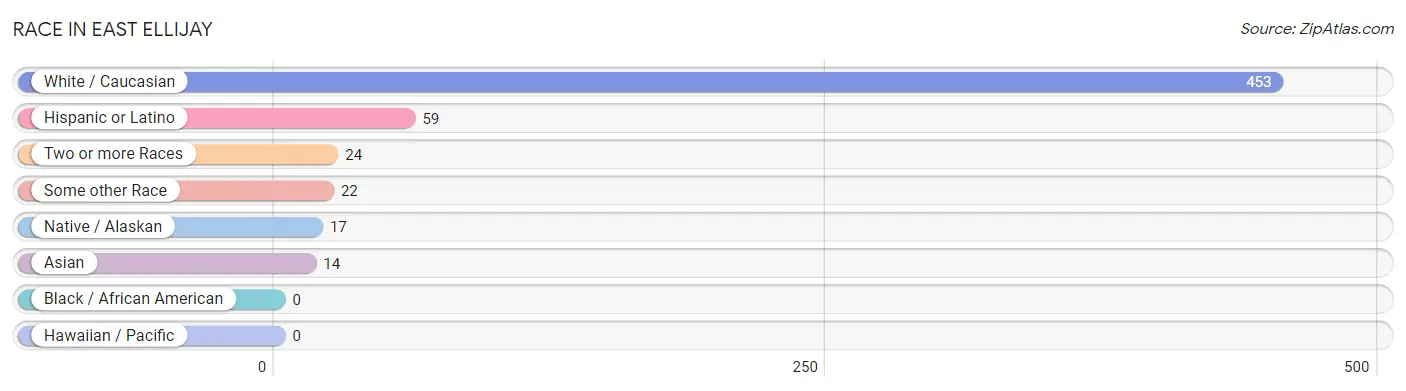
| Race | # Population | % Population |
| Asian | 14 | 2.6% |
| Black / African American | 0 | 0.0% |
| Hawaiian / Pacific | 0 | 0.0% |
| Hispanic or Latino | 59 | 11.1% |
| Native / Alaskan | 17 | 3.2% |
| White / Caucasian | 453 | 85.5% |
| Two or more Races | 24 | 4.5% |
| Some other Race | 22 | 4.2% |
| Total | 530 | 100.0% |
Ancestry in East Ellijay
The most populous ancestries reported in East Ellijay are Irish (90 | 17.0%), American (76 | 14.3%), European (48 | 9.1%), Central American (39 | 7.4%), and Guatemalan (39 | 7.4%), together accounting for 55.1% of all East Ellijay residents.
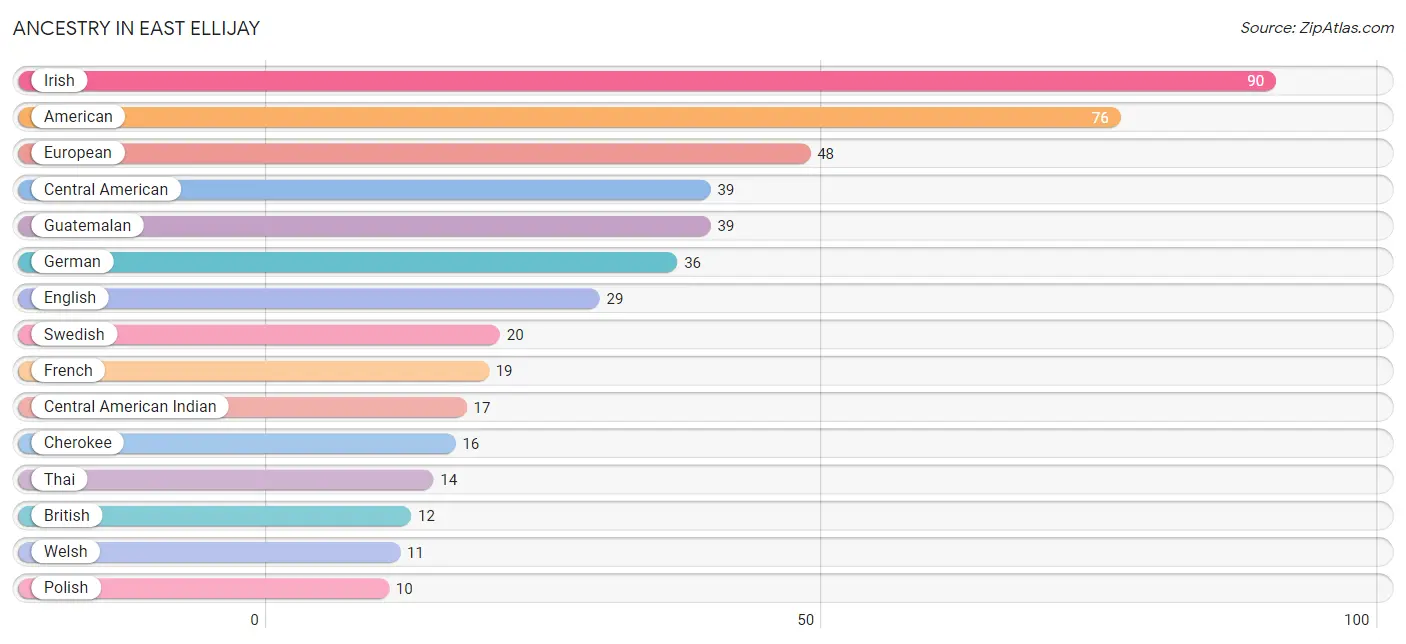
| Ancestry | # Population | % Population |
| American | 76 | 14.3% |
| Belgian | 2 | 0.4% |
| British | 12 | 2.3% |
| Central American | 39 | 7.4% |
| Central American Indian | 17 | 3.2% |
| Cherokee | 16 | 3.0% |
| Croatian | 3 | 0.6% |
| Czech | 1 | 0.2% |
| English | 29 | 5.5% |
| European | 48 | 9.1% |
| French | 19 | 3.6% |
| German | 36 | 6.8% |
| Guatemalan | 39 | 7.4% |
| Irish | 90 | 17.0% |
| Italian | 8 | 1.5% |
| Mexican | 6 | 1.1% |
| Northern European | 4 | 0.7% |
| Polish | 10 | 1.9% |
| Puerto Rican | 7 | 1.3% |
| Scotch-Irish | 2 | 0.4% |
| Scottish | 3 | 0.6% |
| Swedish | 20 | 3.8% |
| Thai | 14 | 2.6% |
| Welsh | 11 | 2.1% | View All 24 Rows |
Immigrants in East Ellijay
The most numerous immigrant groups reported in East Ellijay came from Central America (11 | 2.1%), Guatemala (11 | 2.1%), Latin America (11 | 2.1%), Asia (7 | 1.3%), and India (7 | 1.3%), together accounting for 8.9% of all East Ellijay residents.
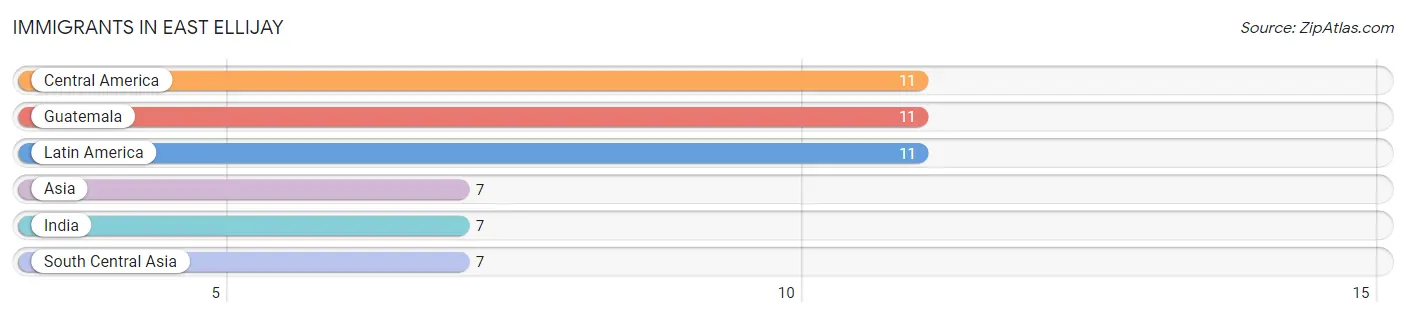
| Immigration Origin | # Population | % Population |
| Asia | 7 | 1.3% |
| Central America | 11 | 2.1% |
| Guatemala | 11 | 2.1% |
| India | 7 | 1.3% |
| Latin America | 11 | 2.1% |
| South Central Asia | 7 | 1.3% | View All 6 Rows |
Sex and Age in East Ellijay
Sex and Age in East Ellijay
The most populous age groups in East Ellijay are 25 to 29 Years (30 | 13.2%) for men and 70 to 74 Years (38 | 12.6%) for women.
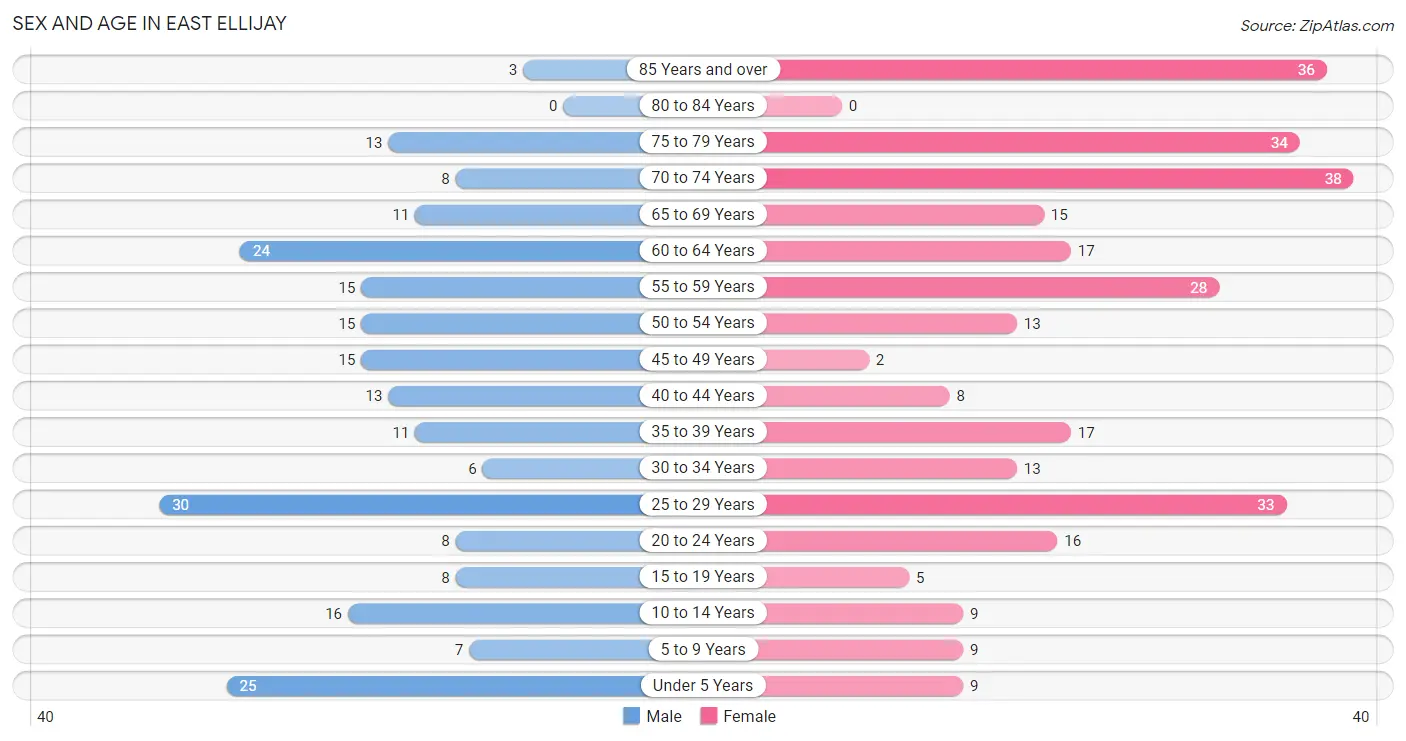
| Age Bracket | Male | Female |
| Under 5 Years | 25 (11.0%) | 9 (3.0%) |
| 5 to 9 Years | 7 (3.1%) | 9 (3.0%) |
| 10 to 14 Years | 16 (7.0%) | 9 (3.0%) |
| 15 to 19 Years | 8 (3.5%) | 5 (1.7%) |
| 20 to 24 Years | 8 (3.5%) | 16 (5.3%) |
| 25 to 29 Years | 30 (13.2%) | 33 (10.9%) |
| 30 to 34 Years | 6 (2.6%) | 13 (4.3%) |
| 35 to 39 Years | 11 (4.8%) | 17 (5.6%) |
| 40 to 44 Years | 13 (5.7%) | 8 (2.6%) |
| 45 to 49 Years | 15 (6.6%) | 2 (0.7%) |
| 50 to 54 Years | 15 (6.6%) | 13 (4.3%) |
| 55 to 59 Years | 15 (6.6%) | 28 (9.3%) |
| 60 to 64 Years | 24 (10.5%) | 17 (5.6%) |
| 65 to 69 Years | 11 (4.8%) | 15 (5.0%) |
| 70 to 74 Years | 8 (3.5%) | 38 (12.6%) |
| 75 to 79 Years | 13 (5.7%) | 34 (11.3%) |
| 80 to 84 Years | 0 (0.0%) | 0 (0.0%) |
| 85 Years and over | 3 (1.3%) | 36 (11.9%) |
| Total | 228 (100.0%) | 302 (100.0%) |
Families and Households in East Ellijay
Median Family Size in East Ellijay
The median family size in East Ellijay is 2.75 persons per family, with single female/mother families (32 | 31.4%) accounting for the largest median family size of 3.31 persons per family. On the other hand, single male/father families (15 | 14.7%) represent the smallest median family size with 1.80 persons per family.
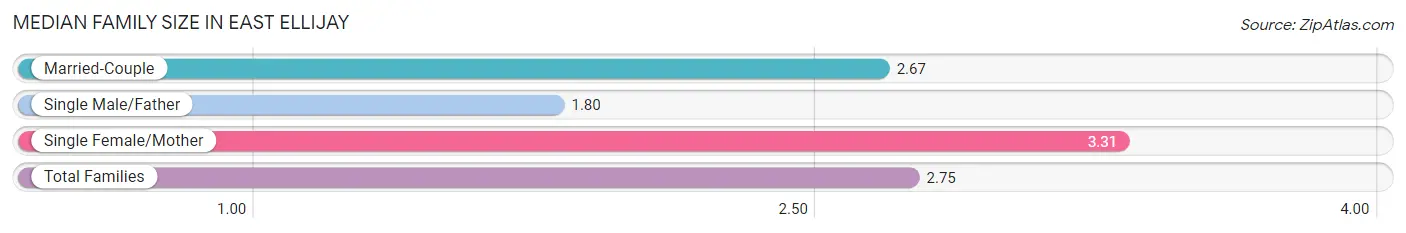
| Family Type | # Families | Family Size |
| Married-Couple | 55 (53.9%) | 2.67 |
| Single Male/Father | 15 (14.7%) | 1.80 |
| Single Female/Mother | 32 (31.4%) | 3.31 |
| Total Families | 102 (100.0%) | 2.75 |
Median Household Size in East Ellijay
The median household size in East Ellijay is 1.83 persons per household, with single female/mother households (32 | 11.1%) accounting for the largest median household size of 3.84 persons per household. non-family households (187 | 64.7%) represent the smallest median household size with 1.25 persons per household.
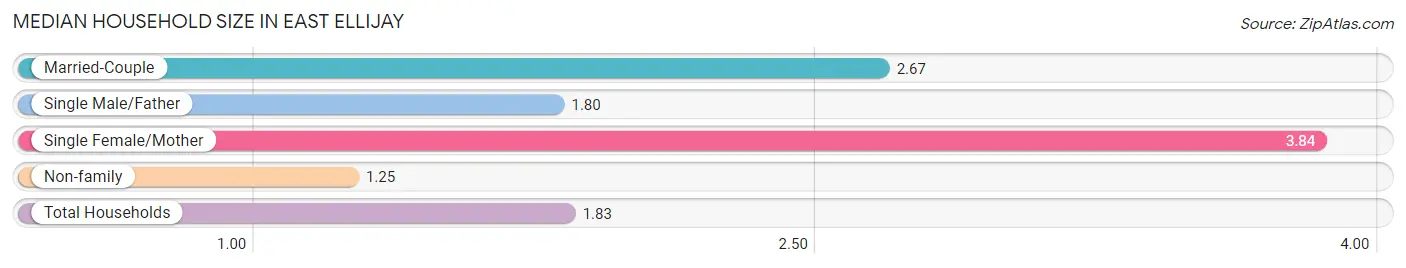
| Household Type | # Households | Household Size |
| Married-Couple | 55 (19.0%) | 2.67 |
| Single Male/Father | 15 (5.2%) | 1.80 |
| Single Female/Mother | 32 (11.1%) | 3.84 |
| Non-family | 187 (64.7%) | 1.25 |
| Total Households | 289 (100.0%) | 1.83 |
Household Size by Marriage Status in East Ellijay
Out of a total of 289 households in East Ellijay, 102 (35.3%) are family households, while 187 (64.7%) are nonfamily households. The most numerous type of family households are 2-person households, comprising 54, and the most common type of nonfamily households are 1-person households, comprising 157.
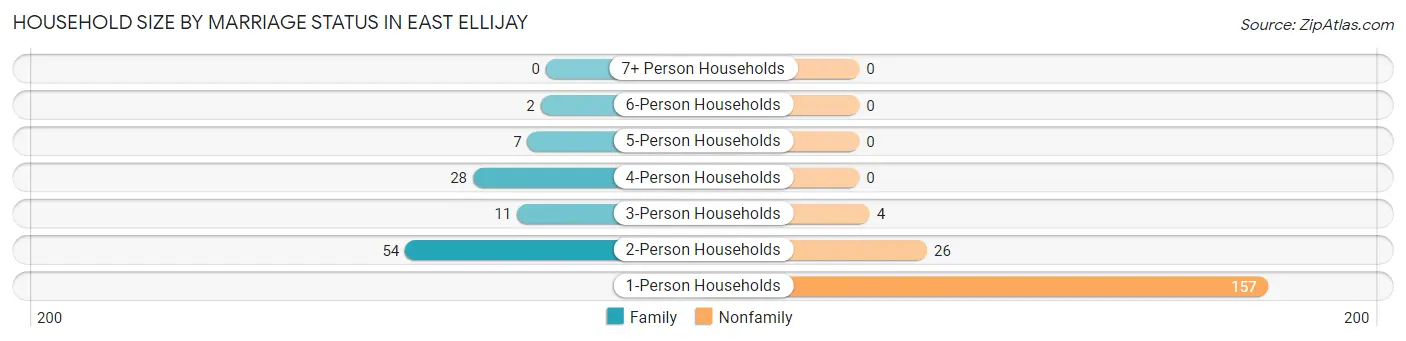
| Household Size | Family Households | Nonfamily Households |
| 1-Person Households | - | 157 (54.3%) |
| 2-Person Households | 54 (18.7%) | 26 (9.0%) |
| 3-Person Households | 11 (3.8%) | 4 (1.4%) |
| 4-Person Households | 28 (9.7%) | 0 (0.0%) |
| 5-Person Households | 7 (2.4%) | 0 (0.0%) |
| 6-Person Households | 2 (0.7%) | 0 (0.0%) |
| 7+ Person Households | 0 (0.0%) | 0 (0.0%) |
| Total | 102 (35.3%) | 187 (64.7%) |
Female Fertility in East Ellijay
Fertility by Age in East Ellijay
Average fertility rate in East Ellijay is 180.0 births per 1,000 women. Women in the age bracket of 15 to 19 years have the highest fertility rate with 400.0 births per 1,000 women. Women in the age bracket of 20 to 34 years acount for 88.9% of all women with births.
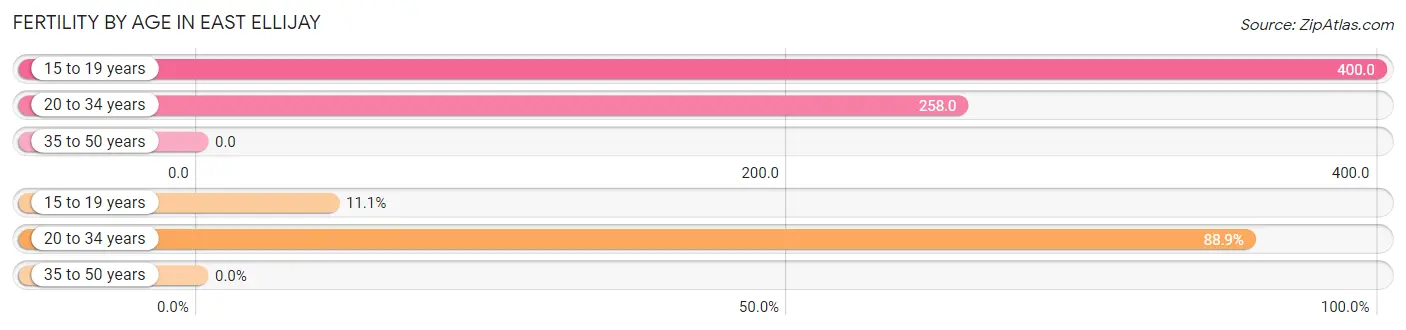
| Age Bracket | Women with Births | Births / 1,000 Women |
| 15 to 19 years | 2 (11.1%) | 400.0 |
| 20 to 34 years | 16 (88.9%) | 258.0 |
| 35 to 50 years | 0 (0.0%) | 0.0 |
| Total | 18 (100.0%) | 180.0 |
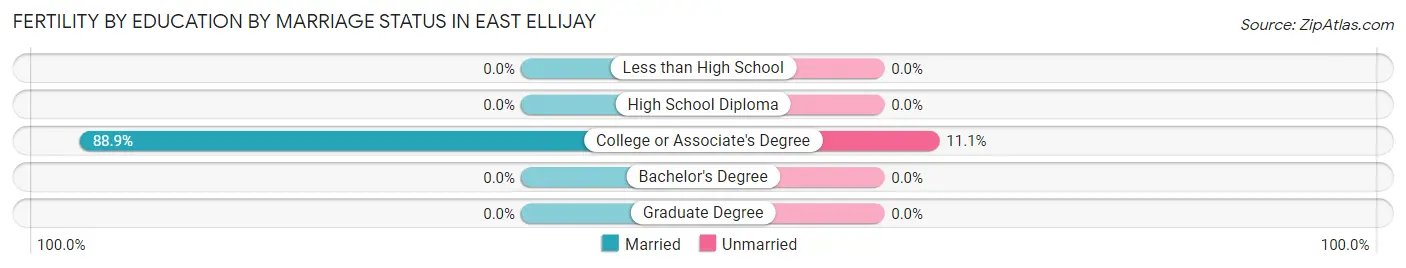
Fertility by Age by Marriage Status in East Ellijay
88.9% of women with births (18) in East Ellijay are married. The highest percentage of unmarried women with births falls into 15 to 19 years age bracket with 100.0% of them unmarried at the time of birth, while the lowest percentage of unmarried women with births belong to 20 to 34 years age bracket with 0.0% of them unmarried.
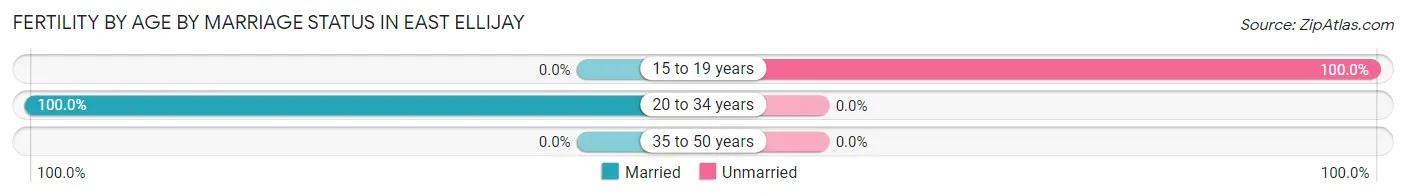
| Age Bracket | Married | Unmarried |
| 15 to 19 years | 0 (0.0%) | 2 (100.0%) |
| 20 to 34 years | 16 (100.0%) | 0 (0.0%) |
| 35 to 50 years | 0 (0.0%) | 0 (0.0%) |
| Total | 16 (88.9%) | 2 (11.1%) |
Fertility by Education in East Ellijay
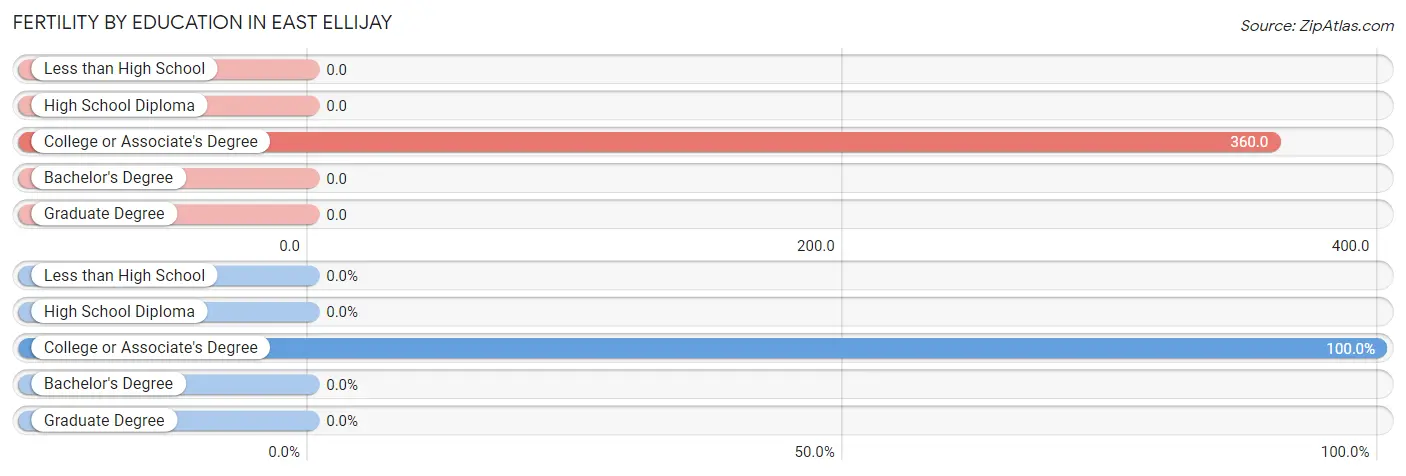
| Educational Attainment | Women with Births | Births / 1,000 Women |
| Less than High School | 0 (0.0%) | 0.0 |
| High School Diploma | 0 (0.0%) | 0.0 |
| College or Associate's Degree | 18 (100.0%) | 360.0 |
| Bachelor's Degree | 0 (0.0%) | 0.0 |
| Graduate Degree | 0 (0.0%) | 0.0 |
| Total | 18 (100.0%) | 180.0 |
Fertility by Education by Marriage Status in East Ellijay
11.1% of women with births in East Ellijay are unmarried. Women with the educational attainment of college or associate's degree are most likely to be married with 88.9% of them married at childbirth, while women with the educational attainment of college or associate's degree are least likely to be married with 11.1% of them unmarried at childbirth.
| Educational Attainment | Married | Unmarried |
| Less than High School | 0 (0.0%) | 0 (0.0%) |
| High School Diploma | 0 (0.0%) | 0 (0.0%) |
| College or Associate's Degree | 16 (88.9%) | 2 (11.1%) |
| Bachelor's Degree | 0 (0.0%) | 0 (0.0%) |
| Graduate Degree | 0 (0.0%) | 0 (0.0%) |
| Total | 16 (88.9%) | 2 (11.1%) |
Employment Characteristics in East Ellijay
Employment by Class of Employer in East Ellijay
Among the 208 employed individuals in East Ellijay, private company employees (142 | 68.3%), self-employed (not incorporated) (31 | 14.9%), and local government employees (23 | 11.1%) make up the most common classes of employment.
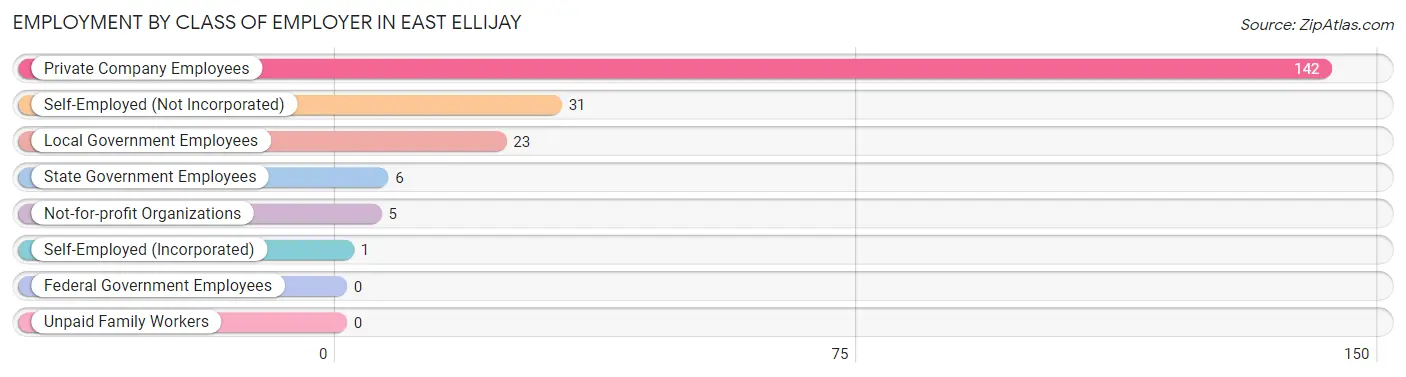
| Employer Class | # Employees | % Employees |
| Private Company Employees | 142 | 68.3% |
| Self-Employed (Incorporated) | 1 | 0.5% |
| Self-Employed (Not Incorporated) | 31 | 14.9% |
| Not-for-profit Organizations | 5 | 2.4% |
| Local Government Employees | 23 | 11.1% |
| State Government Employees | 6 | 2.9% |
| Federal Government Employees | 0 | 0.0% |
| Unpaid Family Workers | 0 | 0.0% |
| Total | 208 | 100.0% |
Employment Status by Age in East Ellijay
According to the labor force statistics for East Ellijay, out of the total population over 16 years of age (453), 51.4% or 233 individuals are in the labor force, with 10.7% or 25 of them unemployed. The age group with the highest labor force participation rate is 20 to 24 years, with 100.0% or 24 individuals in the labor force. Within the labor force, the 20 to 24 years age range has the highest percentage of unemployed individuals, with 41.7% or 10 of them being unemployed.
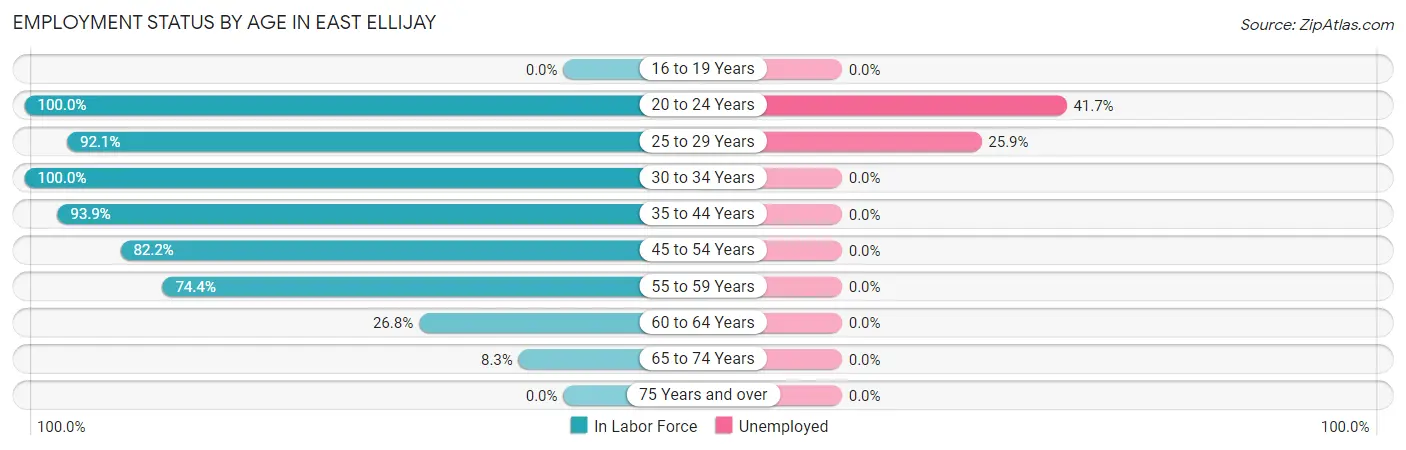
| Age Bracket | In Labor Force | Unemployed |
| 16 to 19 Years | 0 (0.0%) | 0 (0.0%) |
| 20 to 24 Years | 24 (100.0%) | 10 (41.7%) |
| 25 to 29 Years | 58 (92.1%) | 15 (25.9%) |
| 30 to 34 Years | 19 (100.0%) | 0 (0.0%) |
| 35 to 44 Years | 46 (93.9%) | 0 (0.0%) |
| 45 to 54 Years | 37 (82.2%) | 0 (0.0%) |
| 55 to 59 Years | 32 (74.4%) | 0 (0.0%) |
| 60 to 64 Years | 11 (26.8%) | 0 (0.0%) |
| 65 to 74 Years | 6 (8.3%) | 0 (0.0%) |
| 75 Years and over | 0 (0.0%) | 0 (0.0%) |
| Total | 233 (51.4%) | 25 (10.7%) |
Employment Status by Educational Attainment in East Ellijay
According to labor force statistics for East Ellijay, 78.1% of individuals (203) out of the total population between 25 and 64 years of age (260) are in the labor force, with 7.4% or 15 of them being unemployed. The group with the highest labor force participation rate are those with the educational attainment of bachelor's degree or higher, with 95.8% or 68 individuals in the labor force. Within the labor force, individuals with less than high school education have the highest percentage of unemployment, with 55.6% or 10 of them being unemployed.
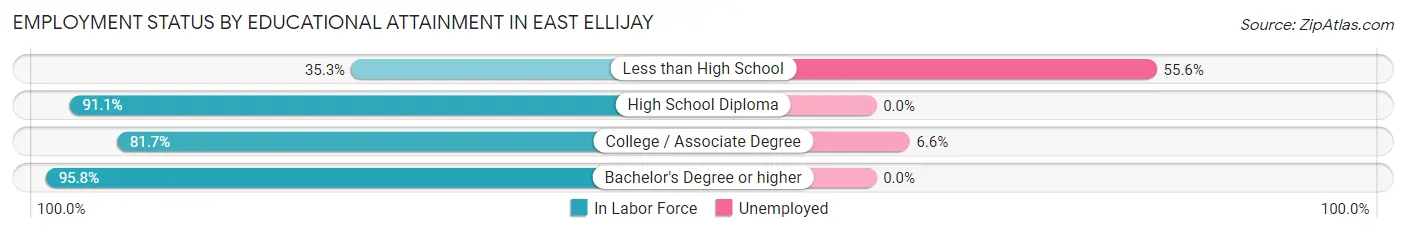
| Educational Attainment | In Labor Force | Unemployed |
| Less than High School | 18 (35.3%) | 28 (55.6%) |
| High School Diploma | 41 (91.1%) | 0 (0.0%) |
| College / Associate Degree | 76 (81.7%) | 6 (6.6%) |
| Bachelor's Degree or higher | 68 (95.8%) | 0 (0.0%) |
| Total | 203 (78.1%) | 19 (7.4%) |
Employment Occupations by Sex in East Ellijay
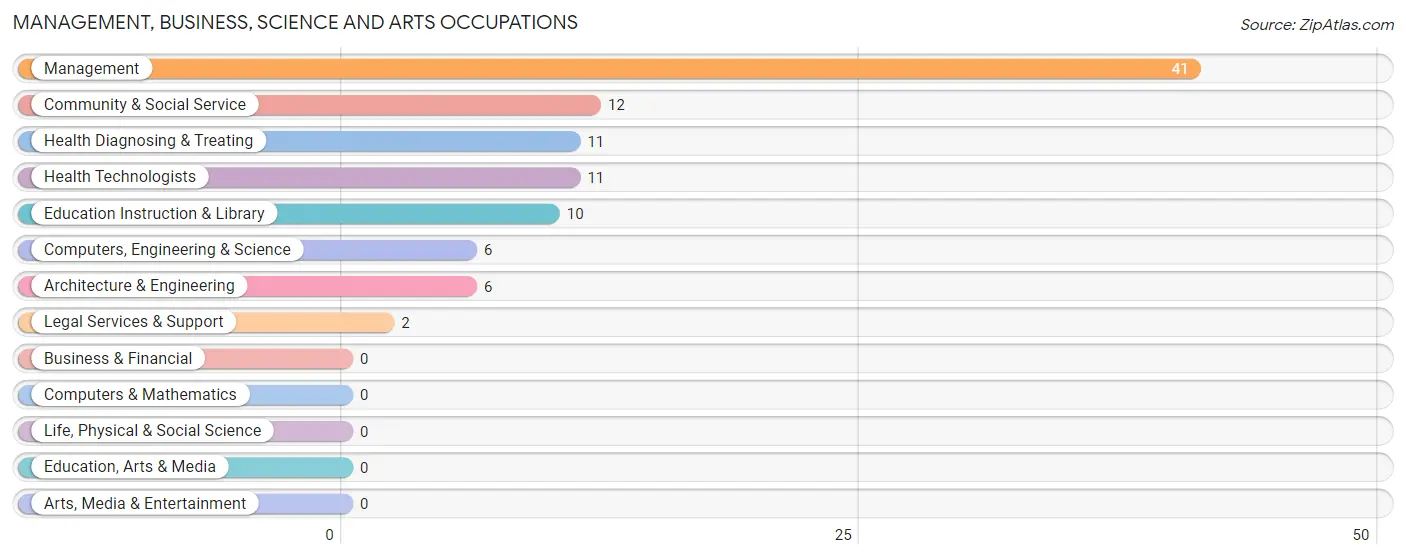
Management, Business, Science and Arts Occupations
The most common Management, Business, Science and Arts occupations in East Ellijay are Management (41 | 19.7%), Community & Social Service (12 | 5.8%), Health Diagnosing & Treating (11 | 5.3%), Health Technologists (11 | 5.3%), and Education Instruction & Library (10 | 4.8%).
Management, Business, Science and Arts Occupations by Sex
Within the Management, Business, Science and Arts occupations in East Ellijay, the most male-oriented occupations are Computers, Engineering & Science (100.0%), Architecture & Engineering (100.0%), and Education Instruction & Library (100.0%), while the most female-oriented occupations are Legal Services & Support (100.0%), Health Diagnosing & Treating (63.6%), and Health Technologists (63.6%).
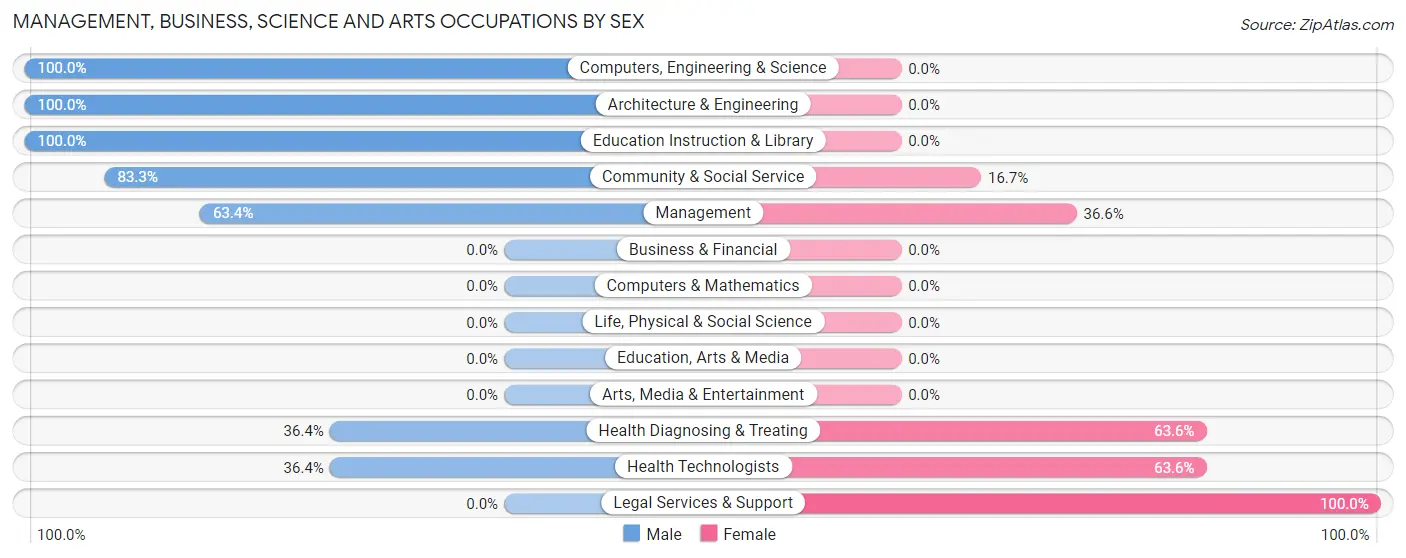
| Occupation | Male | Female |
| Management | 26 (63.4%) | 15 (36.6%) |
| Business & Financial | 0 (0.0%) | 0 (0.0%) |
| Computers, Engineering & Science | 6 (100.0%) | 0 (0.0%) |
| Computers & Mathematics | 0 (0.0%) | 0 (0.0%) |
| Architecture & Engineering | 6 (100.0%) | 0 (0.0%) |
| Life, Physical & Social Science | 0 (0.0%) | 0 (0.0%) |
| Community & Social Service | 10 (83.3%) | 2 (16.7%) |
| Education, Arts & Media | 0 (0.0%) | 0 (0.0%) |
| Legal Services & Support | 0 (0.0%) | 2 (100.0%) |
| Education Instruction & Library | 10 (100.0%) | 0 (0.0%) |
| Arts, Media & Entertainment | 0 (0.0%) | 0 (0.0%) |
| Health Diagnosing & Treating | 4 (36.4%) | 7 (63.6%) |
| Health Technologists | 4 (36.4%) | 7 (63.6%) |
| Total (Category) | 46 (65.7%) | 24 (34.3%) |
| Total (Overall) | 112 (53.8%) | 96 (46.2%) |
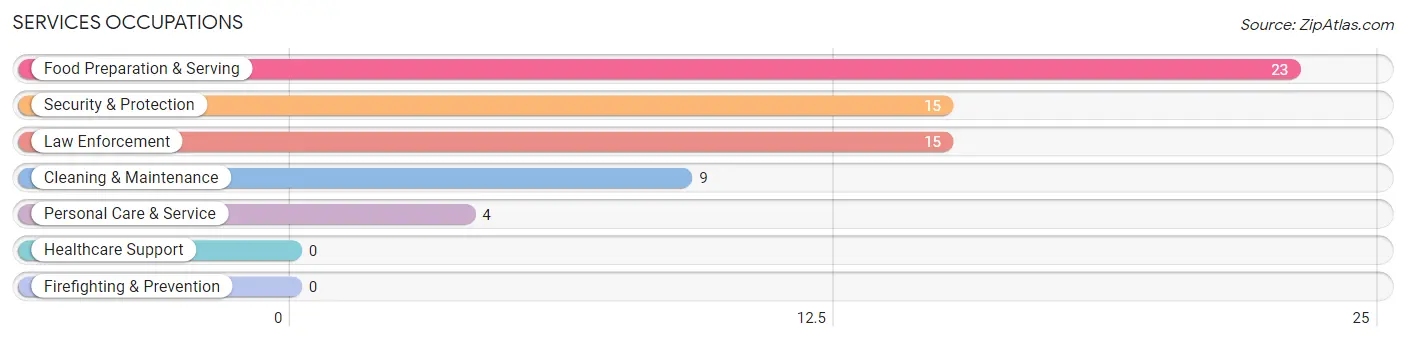
Services Occupations
The most common Services occupations in East Ellijay are Food Preparation & Serving (23 | 11.1%), Security & Protection (15 | 7.2%), Law Enforcement (15 | 7.2%), Cleaning & Maintenance (9 | 4.3%), and Personal Care & Service (4 | 1.9%).
Services Occupations by Sex
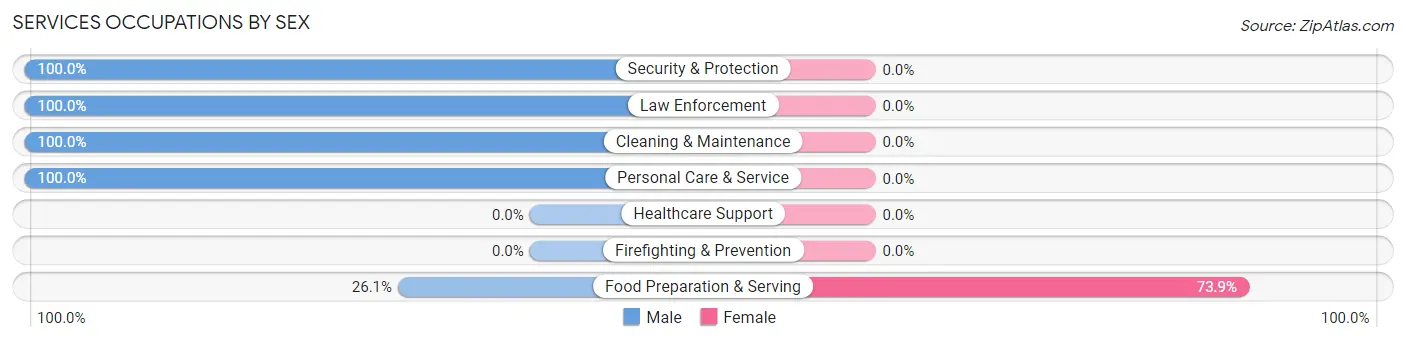
| Occupation | Male | Female |
| Healthcare Support | 0 (0.0%) | 0 (0.0%) |
| Security & Protection | 15 (100.0%) | 0 (0.0%) |
| Firefighting & Prevention | 0 (0.0%) | 0 (0.0%) |
| Law Enforcement | 15 (100.0%) | 0 (0.0%) |
| Food Preparation & Serving | 6 (26.1%) | 17 (73.9%) |
| Cleaning & Maintenance | 9 (100.0%) | 0 (0.0%) |
| Personal Care & Service | 4 (100.0%) | 0 (0.0%) |
| Total (Category) | 34 (66.7%) | 17 (33.3%) |
| Total (Overall) | 112 (53.8%) | 96 (46.2%) |
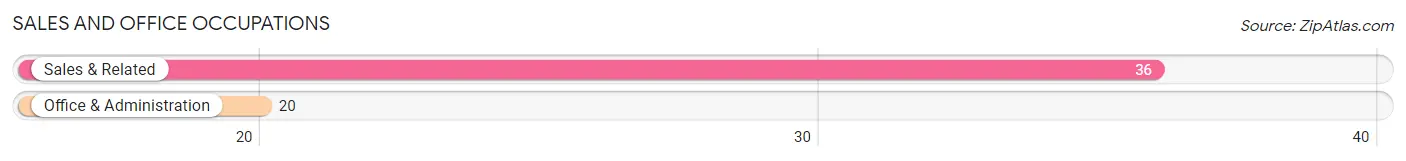
Sales and Office Occupations
The most common Sales and Office occupations in East Ellijay are Sales & Related (36 | 17.3%), and Office & Administration (20 | 9.6%).
Sales and Office Occupations by Sex
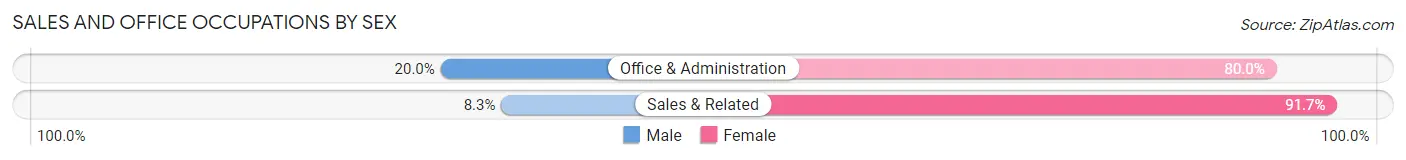
| Occupation | Male | Female |
| Sales & Related | 3 (8.3%) | 33 (91.7%) |
| Office & Administration | 4 (20.0%) | 16 (80.0%) |
| Total (Category) | 7 (12.5%) | 49 (87.5%) |
| Total (Overall) | 112 (53.8%) | 96 (46.2%) |
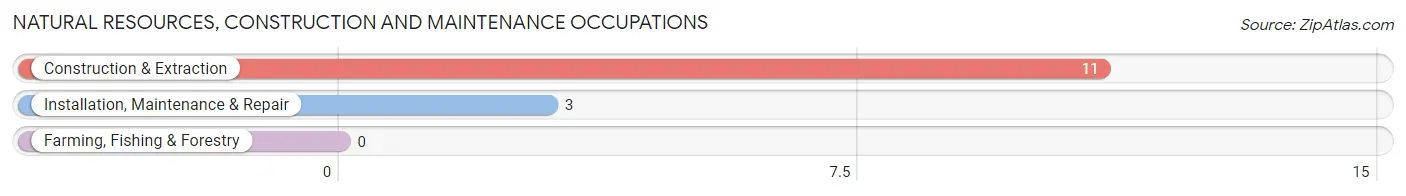
Natural Resources, Construction and Maintenance Occupations
The most common Natural Resources, Construction and Maintenance occupations in East Ellijay are Construction & Extraction (11 | 5.3%), and Installation, Maintenance & Repair (3 | 1.4%).
Natural Resources, Construction and Maintenance Occupations by Sex
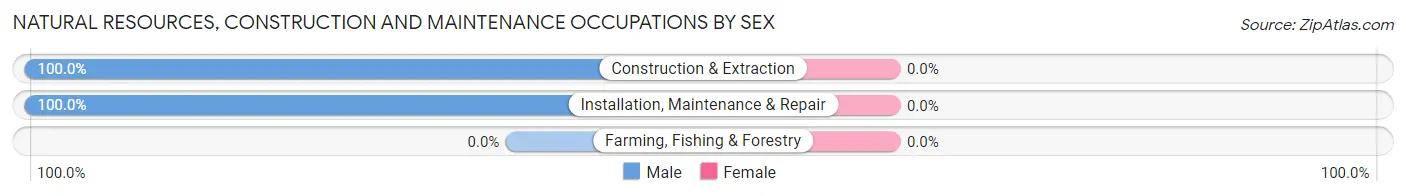
| Occupation | Male | Female |
| Farming, Fishing & Forestry | 0 (0.0%) | 0 (0.0%) |
| Construction & Extraction | 11 (100.0%) | 0 (0.0%) |
| Installation, Maintenance & Repair | 3 (100.0%) | 0 (0.0%) |
| Total (Category) | 14 (100.0%) | 0 (0.0%) |
| Total (Overall) | 112 (53.8%) | 96 (46.2%) |
Production, Transportation and Moving Occupations
The most common Production, Transportation and Moving occupations in East Ellijay are Production (15 | 7.2%), and Material Moving (2 | 1.0%).
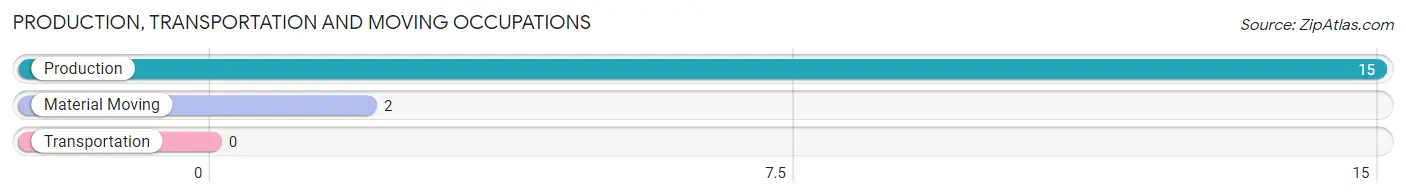
Production, Transportation and Moving Occupations by Sex
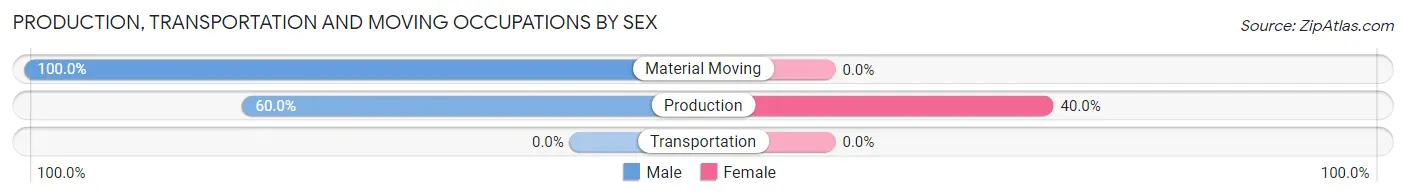
| Occupation | Male | Female |
| Production | 9 (60.0%) | 6 (40.0%) |
| Transportation | 0 (0.0%) | 0 (0.0%) |
| Material Moving | 2 (100.0%) | 0 (0.0%) |
| Total (Category) | 11 (64.7%) | 6 (35.3%) |
| Total (Overall) | 112 (53.8%) | 96 (46.2%) |
Employment Industries by Sex in East Ellijay
Employment Industries in East Ellijay
The major employment industries in East Ellijay include Accommodation & Food Services (47 | 22.6%), Manufacturing (28 | 13.5%), Administrative & Support (26 | 12.5%), Retail Trade (25 | 12.0%), and Public Administration (19 | 9.1%).
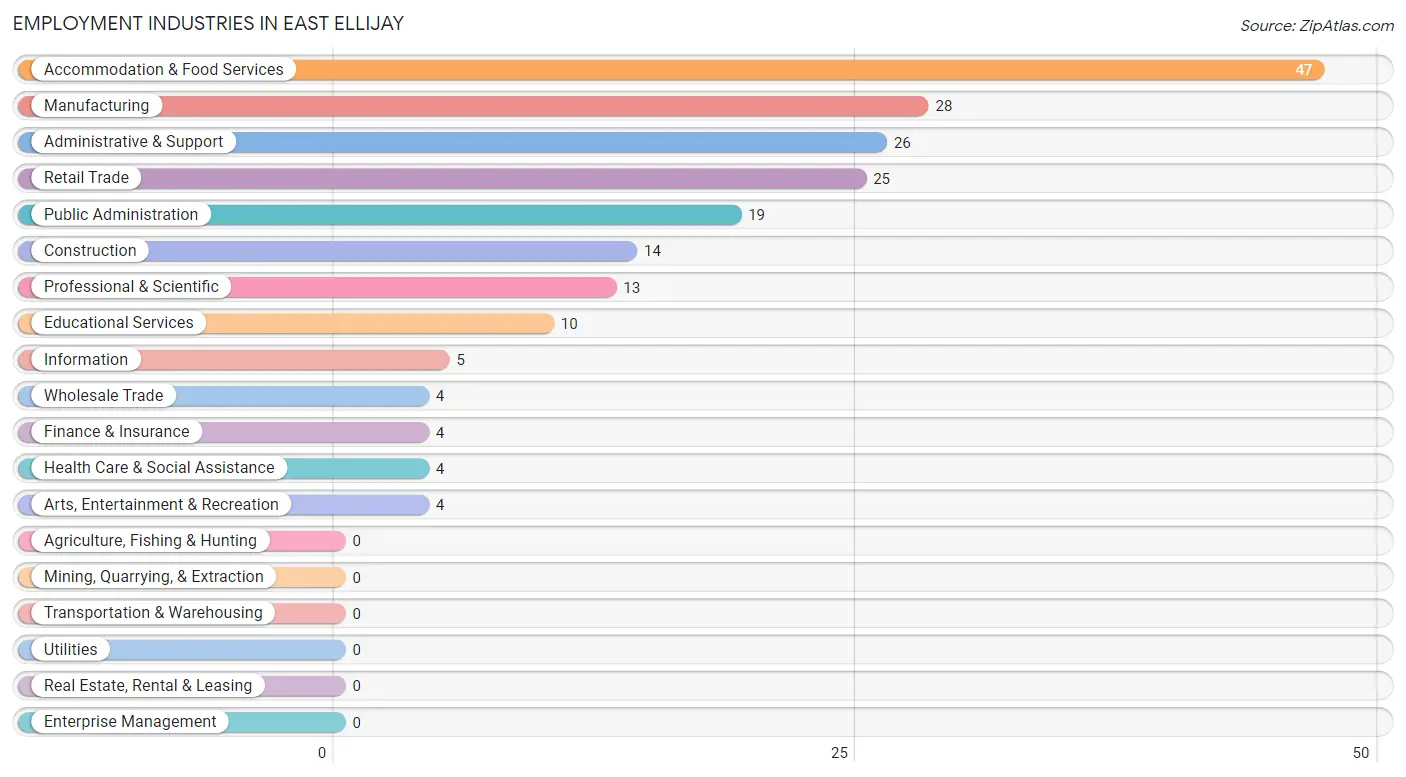
Employment Industries by Sex in East Ellijay
The East Ellijay industries that see more men than women are Wholesale Trade (100.0%), Educational Services (100.0%), and Health Care & Social Assistance (100.0%), whereas the industries that tend to have a higher number of women are Information (100.0%), Finance & Insurance (100.0%), and Retail Trade (88.0%).
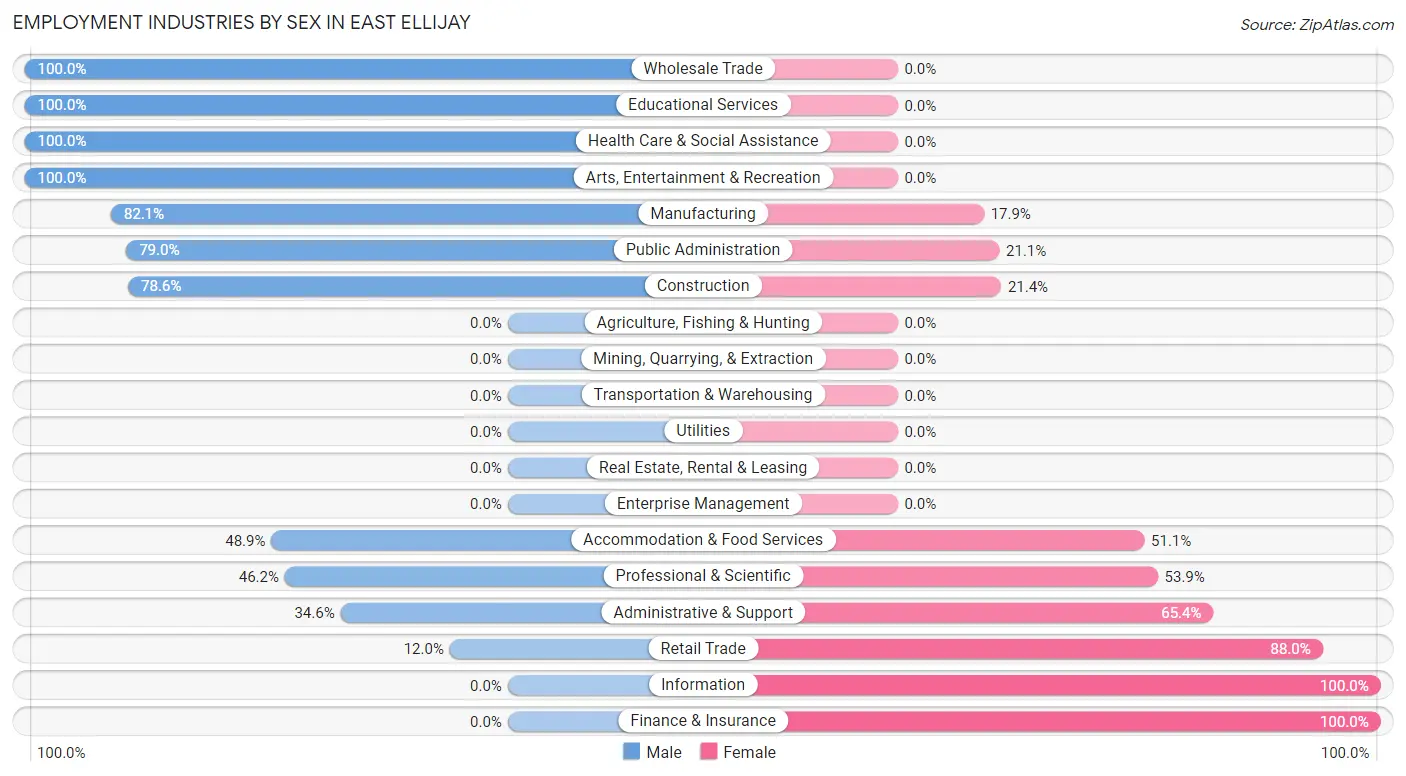
| Industry | Male | Female |
| Agriculture, Fishing & Hunting | 0 (0.0%) | 0 (0.0%) |
| Mining, Quarrying, & Extraction | 0 (0.0%) | 0 (0.0%) |
| Construction | 11 (78.6%) | 3 (21.4%) |
| Manufacturing | 23 (82.1%) | 5 (17.9%) |
| Wholesale Trade | 4 (100.0%) | 0 (0.0%) |
| Retail Trade | 3 (12.0%) | 22 (88.0%) |
| Transportation & Warehousing | 0 (0.0%) | 0 (0.0%) |
| Utilities | 0 (0.0%) | 0 (0.0%) |
| Information | 0 (0.0%) | 5 (100.0%) |
| Finance & Insurance | 0 (0.0%) | 4 (100.0%) |
| Real Estate, Rental & Leasing | 0 (0.0%) | 0 (0.0%) |
| Professional & Scientific | 6 (46.2%) | 7 (53.8%) |
| Enterprise Management | 0 (0.0%) | 0 (0.0%) |
| Administrative & Support | 9 (34.6%) | 17 (65.4%) |
| Educational Services | 10 (100.0%) | 0 (0.0%) |
| Health Care & Social Assistance | 4 (100.0%) | 0 (0.0%) |
| Arts, Entertainment & Recreation | 4 (100.0%) | 0 (0.0%) |
| Accommodation & Food Services | 23 (48.9%) | 24 (51.1%) |
| Public Administration | 15 (78.9%) | 4 (21.0%) |
| Total | 112 (53.8%) | 96 (46.2%) |
Education in East Ellijay
School Enrollment in East Ellijay
The most common levels of schooling among the 70 students in East Ellijay are middle school (24 | 34.3%), college / undergraduate (18 | 25.7%), and high school (9 | 12.9%).
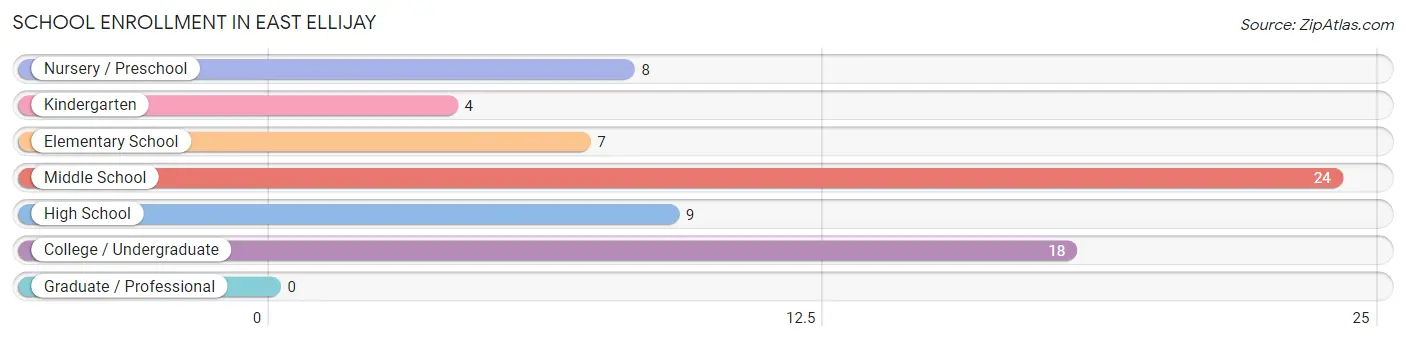
| School Level | # Students | % Students |
| Nursery / Preschool | 8 | 11.4% |
| Kindergarten | 4 | 5.7% |
| Elementary School | 7 | 10.0% |
| Middle School | 24 | 34.3% |
| High School | 9 | 12.9% |
| College / Undergraduate | 18 | 25.7% |
| Graduate / Professional | 0 | 0.0% |
| Total | 70 | 100.0% |
School Enrollment by Age by Funding Source in East Ellijay
Out of a total of 70 students who are enrolled in schools in East Ellijay, 18 (25.7%) attend a private institution, while the remaining 52 (74.3%) are enrolled in public schools. The age group of 5 to 9 year old has the highest likelihood of being enrolled in private schools, with 7 (43.8% in the age bracket) enrolled. Conversely, the age group of 15 to 17 year olds has the lowest likelihood of being enrolled in a private school, with 11 (100.0% in the age bracket) attending a public institution.
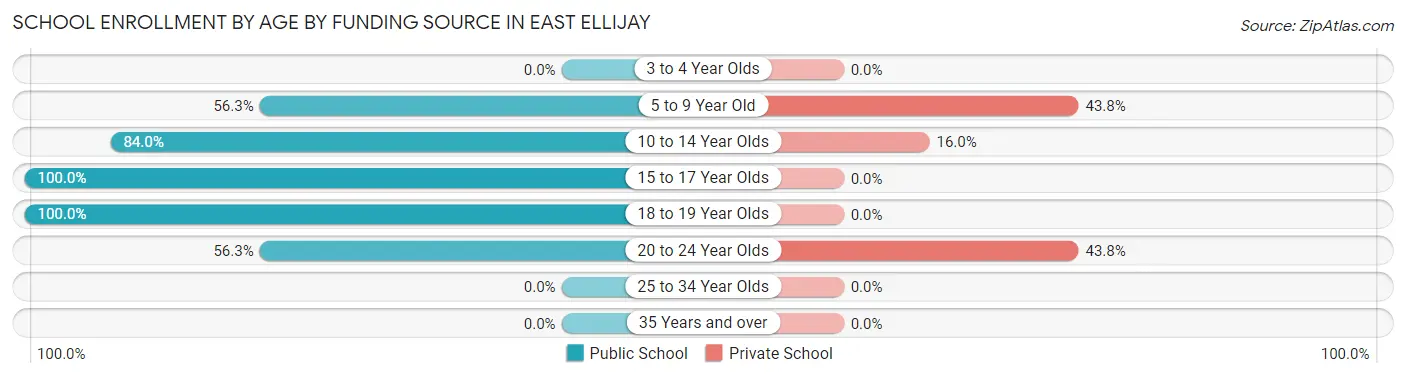
| Age Bracket | Public School | Private School |
| 3 to 4 Year Olds | 0 (0.0%) | 0 (0.0%) |
| 5 to 9 Year Old | 9 (56.2%) | 7 (43.8%) |
| 10 to 14 Year Olds | 21 (84.0%) | 4 (16.0%) |
| 15 to 17 Year Olds | 11 (100.0%) | 0 (0.0%) |
| 18 to 19 Year Olds | 2 (100.0%) | 0 (0.0%) |
| 20 to 24 Year Olds | 9 (56.2%) | 7 (43.8%) |
| 25 to 34 Year Olds | 0 (0.0%) | 0 (0.0%) |
| 35 Years and over | 0 (0.0%) | 0 (0.0%) |
| Total | 52 (74.3%) | 18 (25.7%) |
Educational Attainment by Field of Study in East Ellijay
Computers & mathematics (18 | 16.8%), visual & performing arts (17 | 15.9%), business (16 | 14.9%), education (15 | 14.0%), and arts & humanities (15 | 14.0%) are the most common fields of study among 107 individuals in East Ellijay who have obtained a bachelor's degree or higher.
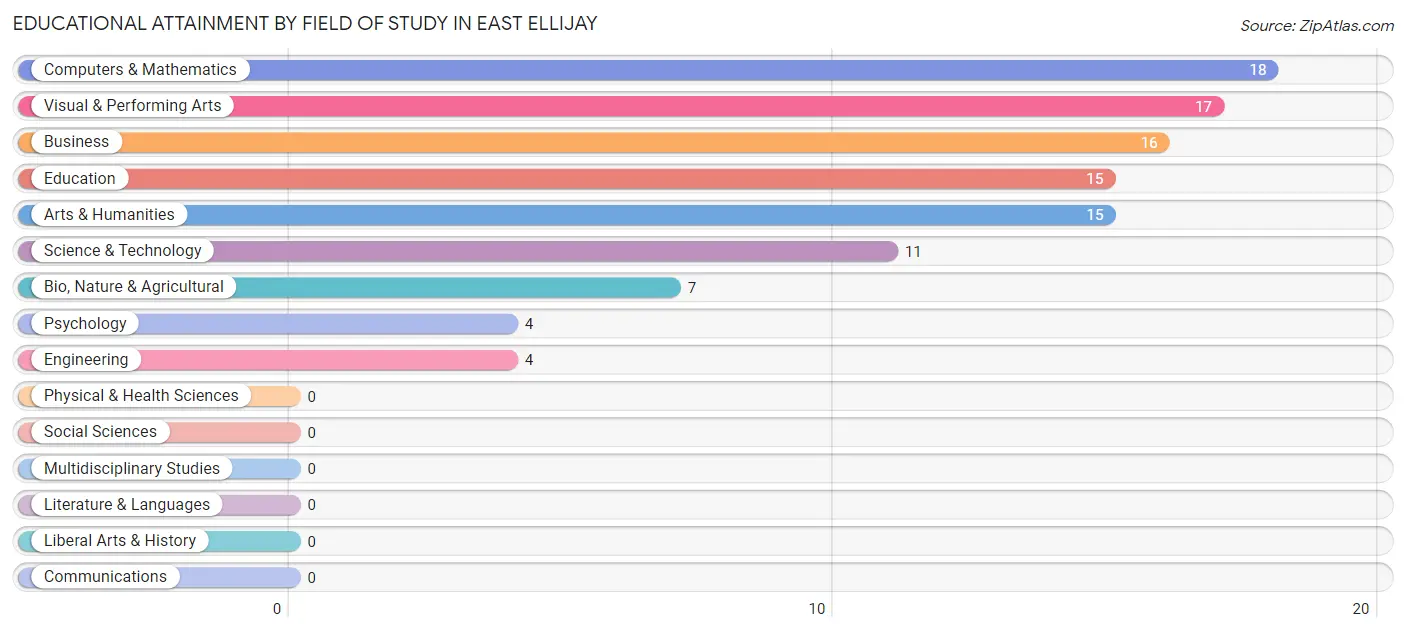
| Field of Study | # Graduates | % Graduates |
| Computers & Mathematics | 18 | 16.8% |
| Bio, Nature & Agricultural | 7 | 6.5% |
| Physical & Health Sciences | 0 | 0.0% |
| Psychology | 4 | 3.7% |
| Social Sciences | 0 | 0.0% |
| Engineering | 4 | 3.7% |
| Multidisciplinary Studies | 0 | 0.0% |
| Science & Technology | 11 | 10.3% |
| Business | 16 | 14.9% |
| Education | 15 | 14.0% |
| Literature & Languages | 0 | 0.0% |
| Liberal Arts & History | 0 | 0.0% |
| Visual & Performing Arts | 17 | 15.9% |
| Communications | 0 | 0.0% |
| Arts & Humanities | 15 | 14.0% |
| Total | 107 | 100.0% |
Transportation & Commute in East Ellijay
Vehicle Availability by Sex in East Ellijay
The most prevalent vehicle ownership categories in East Ellijay are males with 2 vehicles (44, accounting for 39.3%) and females with 2 vehicles (46, making up 45.8%).
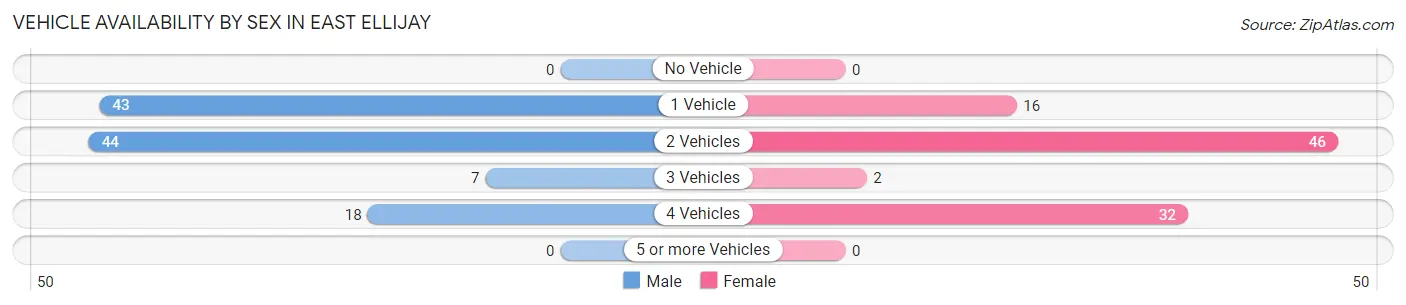
| Vehicles Available | Male | Female |
| No Vehicle | 0 (0.0%) | 0 (0.0%) |
| 1 Vehicle | 43 (38.4%) | 16 (16.7%) |
| 2 Vehicles | 44 (39.3%) | 46 (47.9%) |
| 3 Vehicles | 7 (6.2%) | 2 (2.1%) |
| 4 Vehicles | 18 (16.1%) | 32 (33.3%) |
| 5 or more Vehicles | 0 (0.0%) | 0 (0.0%) |
| Total | 112 (100.0%) | 96 (100.0%) |
Commute Time in East Ellijay
The most frequently occuring commute durations in East Ellijay are 5 to 9 minutes (44 commuters, 25.7%), 10 to 14 minutes (24 commuters, 14.0%), and 45 to 59 minutes (22 commuters, 12.9%).
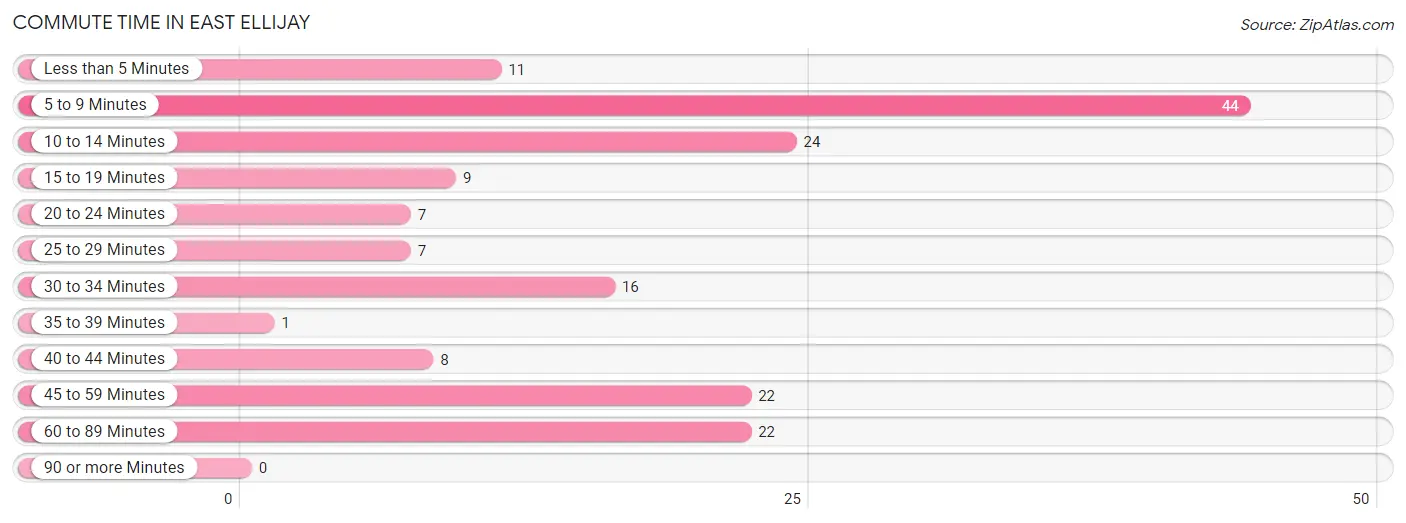
| Commute Time | # Commuters | % Commuters |
| Less than 5 Minutes | 11 | 6.4% |
| 5 to 9 Minutes | 44 | 25.7% |
| 10 to 14 Minutes | 24 | 14.0% |
| 15 to 19 Minutes | 9 | 5.3% |
| 20 to 24 Minutes | 7 | 4.1% |
| 25 to 29 Minutes | 7 | 4.1% |
| 30 to 34 Minutes | 16 | 9.4% |
| 35 to 39 Minutes | 1 | 0.6% |
| 40 to 44 Minutes | 8 | 4.7% |
| 45 to 59 Minutes | 22 | 12.9% |
| 60 to 89 Minutes | 22 | 12.9% |
| 90 or more Minutes | 0 | 0.0% |
Commute Time by Sex in East Ellijay
The most common commute times in East Ellijay are 5 to 9 minutes (36 commuters, 34.3%) for males and 45 to 59 minutes (16 commuters, 24.2%) for females.
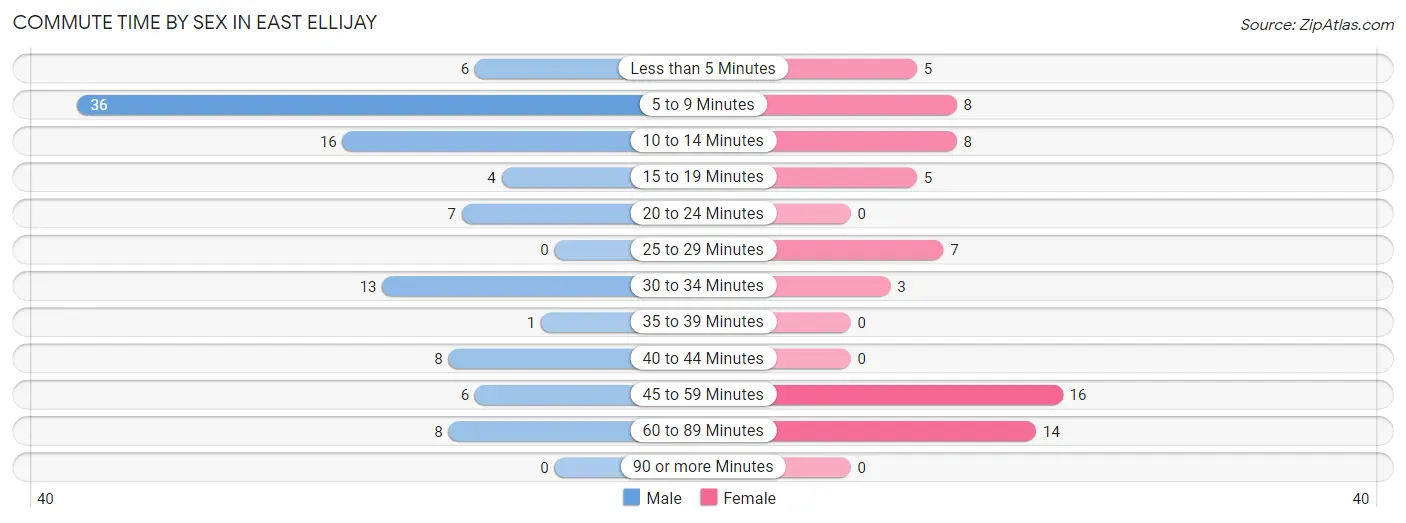
| Commute Time | Male | Female |
| Less than 5 Minutes | 6 (5.7%) | 5 (7.6%) |
| 5 to 9 Minutes | 36 (34.3%) | 8 (12.1%) |
| 10 to 14 Minutes | 16 (15.2%) | 8 (12.1%) |
| 15 to 19 Minutes | 4 (3.8%) | 5 (7.6%) |
| 20 to 24 Minutes | 7 (6.7%) | 0 (0.0%) |
| 25 to 29 Minutes | 0 (0.0%) | 7 (10.6%) |
| 30 to 34 Minutes | 13 (12.4%) | 3 (4.5%) |
| 35 to 39 Minutes | 1 (0.9%) | 0 (0.0%) |
| 40 to 44 Minutes | 8 (7.6%) | 0 (0.0%) |
| 45 to 59 Minutes | 6 (5.7%) | 16 (24.2%) |
| 60 to 89 Minutes | 8 (7.6%) | 14 (21.2%) |
| 90 or more Minutes | 0 (0.0%) | 0 (0.0%) |
Time of Departure to Work by Sex in East Ellijay
The most frequent times of departure to work in East Ellijay are 8:30 AM to 8:59 AM (21, 20.0%) for males and 5:00 AM to 5:29 AM (16, 24.2%) for females.
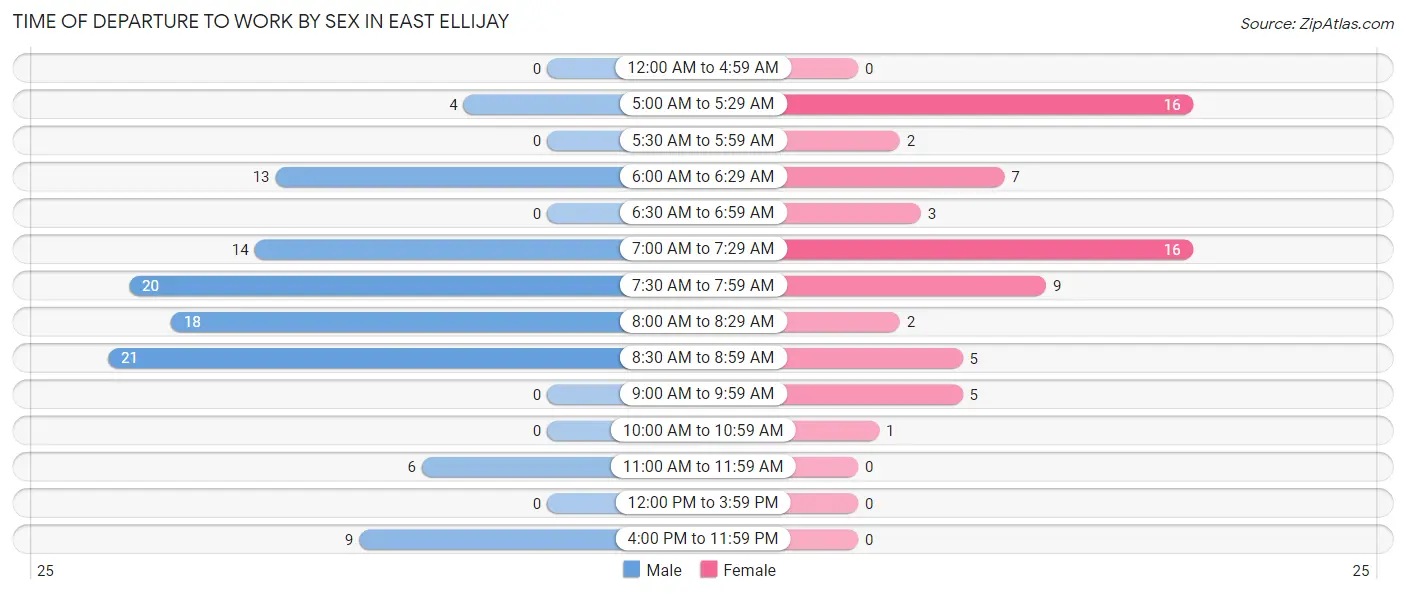
| Time of Departure | Male | Female |
| 12:00 AM to 4:59 AM | 0 (0.0%) | 0 (0.0%) |
| 5:00 AM to 5:29 AM | 4 (3.8%) | 16 (24.2%) |
| 5:30 AM to 5:59 AM | 0 (0.0%) | 2 (3.0%) |
| 6:00 AM to 6:29 AM | 13 (12.4%) | 7 (10.6%) |
| 6:30 AM to 6:59 AM | 0 (0.0%) | 3 (4.5%) |
| 7:00 AM to 7:29 AM | 14 (13.3%) | 16 (24.2%) |
| 7:30 AM to 7:59 AM | 20 (19.1%) | 9 (13.6%) |
| 8:00 AM to 8:29 AM | 18 (17.1%) | 2 (3.0%) |
| 8:30 AM to 8:59 AM | 21 (20.0%) | 5 (7.6%) |
| 9:00 AM to 9:59 AM | 0 (0.0%) | 5 (7.6%) |
| 10:00 AM to 10:59 AM | 0 (0.0%) | 1 (1.5%) |
| 11:00 AM to 11:59 AM | 6 (5.7%) | 0 (0.0%) |
| 12:00 PM to 3:59 PM | 0 (0.0%) | 0 (0.0%) |
| 4:00 PM to 11:59 PM | 9 (8.6%) | 0 (0.0%) |
| Total | 105 (100.0%) | 66 (100.0%) |
Housing Occupancy in East Ellijay
Occupancy by Ownership in East Ellijay
Of the total 289 dwellings in East Ellijay, owner-occupied units account for 162 (56.1%), while renter-occupied units make up 127 (43.9%).
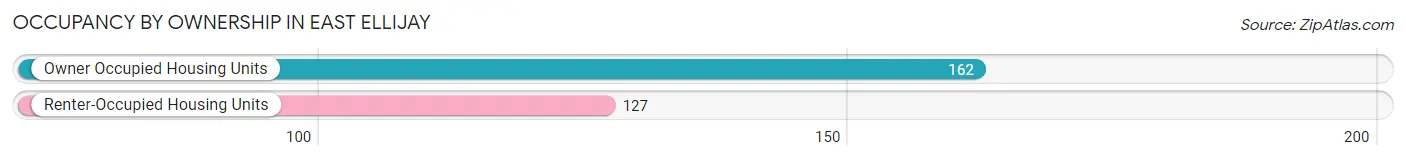
| Occupancy | # Housing Units | % Housing Units |
| Owner Occupied Housing Units | 162 | 56.1% |
| Renter-Occupied Housing Units | 127 | 43.9% |
| Total Occupied Housing Units | 289 | 100.0% |
Occupancy by Household Size in East Ellijay
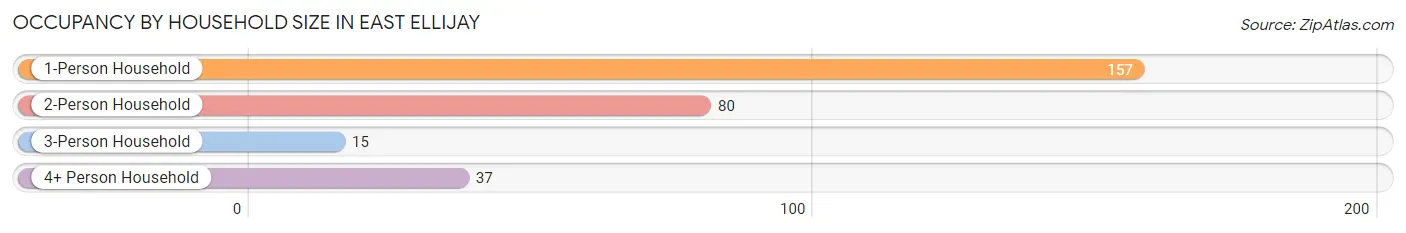
| Household Size | # Housing Units | % Housing Units |
| 1-Person Household | 157 | 54.3% |
| 2-Person Household | 80 | 27.7% |
| 3-Person Household | 15 | 5.2% |
| 4+ Person Household | 37 | 12.8% |
| Total Housing Units | 289 | 100.0% |
Occupancy by Ownership by Household Size in East Ellijay
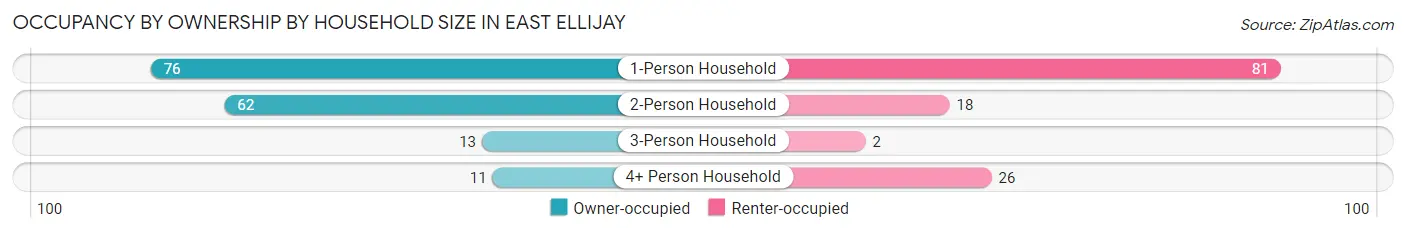
| Household Size | Owner-occupied | Renter-occupied |
| 1-Person Household | 76 (48.4%) | 81 (51.6%) |
| 2-Person Household | 62 (77.5%) | 18 (22.5%) |
| 3-Person Household | 13 (86.7%) | 2 (13.3%) |
| 4+ Person Household | 11 (29.7%) | 26 (70.3%) |
| Total Housing Units | 162 (56.1%) | 127 (43.9%) |
Occupancy by Educational Attainment in East Ellijay
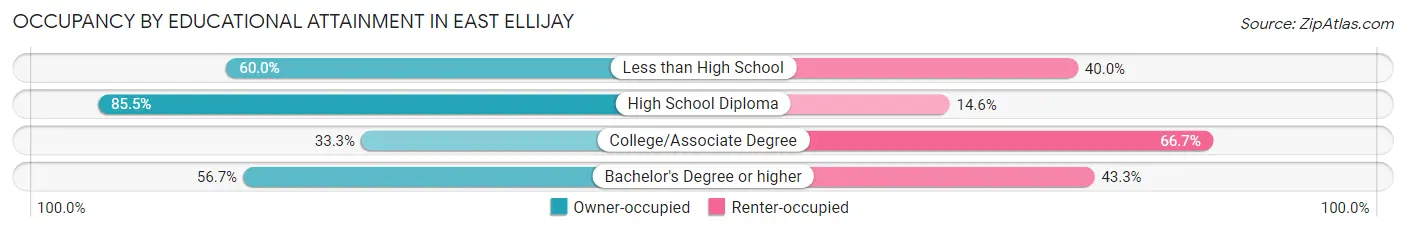
| Household Size | Owner-occupied | Renter-occupied |
| Less than High School | 48 (60.0%) | 32 (40.0%) |
| High School Diploma | 47 (85.5%) | 8 (14.5%) |
| College/Associate Degree | 29 (33.3%) | 58 (66.7%) |
| Bachelor's Degree or higher | 38 (56.7%) | 29 (43.3%) |
Occupancy by Age of Householder in East Ellijay
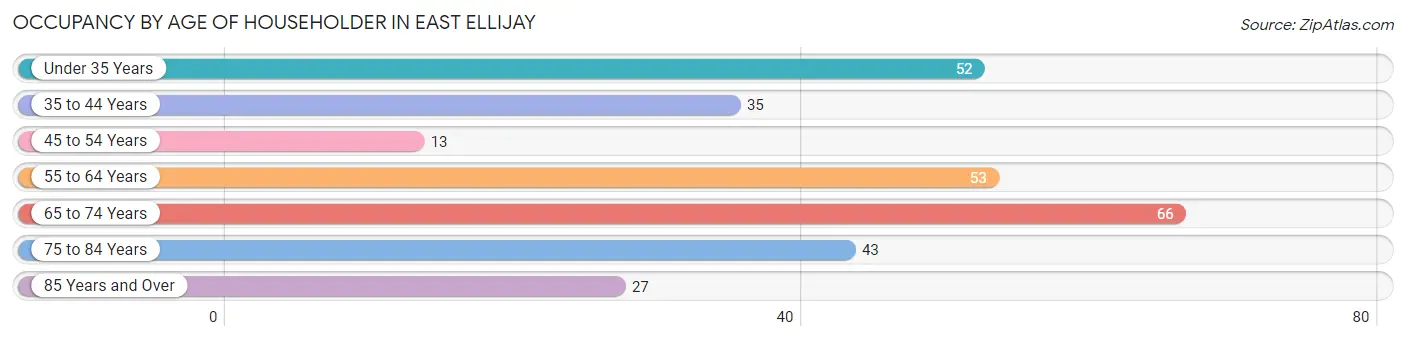
| Age Bracket | # Households | % Households |
| Under 35 Years | 52 | 18.0% |
| 35 to 44 Years | 35 | 12.1% |
| 45 to 54 Years | 13 | 4.5% |
| 55 to 64 Years | 53 | 18.3% |
| 65 to 74 Years | 66 | 22.8% |
| 75 to 84 Years | 43 | 14.9% |
| 85 Years and Over | 27 | 9.3% |
| Total | 289 | 100.0% |
Housing Finances in East Ellijay
Median Income by Occupancy in East Ellijay
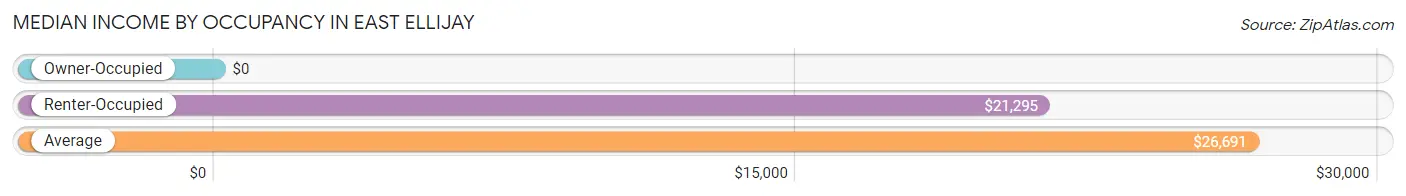
| Occupancy Type | # Households | Median Income |
| Owner-Occupied | 162 (56.1%) | $0 |
| Renter-Occupied | 127 (43.9%) | $21,295 |
| Average | 289 (100.0%) | $26,691 |
Occupancy by Householder Income Bracket in East Ellijay
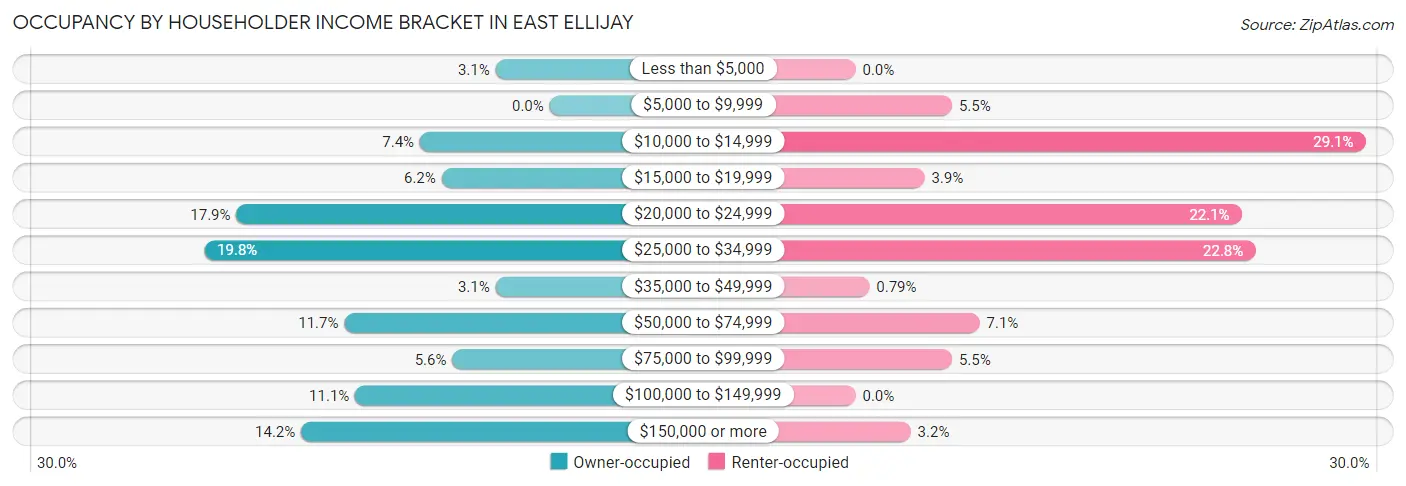
| Income Bracket | Owner-occupied | Renter-occupied |
| Less than $5,000 | 5 (3.1%) | 0 (0.0%) |
| $5,000 to $9,999 | 0 (0.0%) | 7 (5.5%) |
| $10,000 to $14,999 | 12 (7.4%) | 37 (29.1%) |
| $15,000 to $19,999 | 10 (6.2%) | 5 (3.9%) |
| $20,000 to $24,999 | 29 (17.9%) | 28 (22.1%) |
| $25,000 to $34,999 | 32 (19.8%) | 29 (22.8%) |
| $35,000 to $49,999 | 5 (3.1%) | 1 (0.8%) |
| $50,000 to $74,999 | 19 (11.7%) | 9 (7.1%) |
| $75,000 to $99,999 | 9 (5.6%) | 7 (5.5%) |
| $100,000 to $149,999 | 18 (11.1%) | 0 (0.0%) |
| $150,000 or more | 23 (14.2%) | 4 (3.2%) |
| Total | 162 (100.0%) | 127 (100.0%) |
Monthly Housing Cost Tiers in East Ellijay
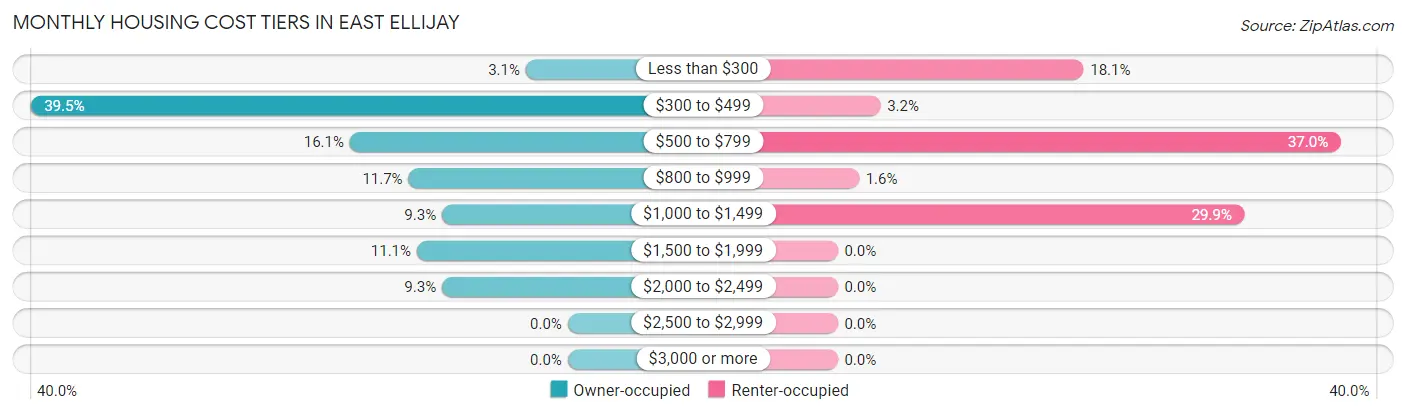
| Monthly Cost | Owner-occupied | Renter-occupied |
| Less than $300 | 5 (3.1%) | 23 (18.1%) |
| $300 to $499 | 64 (39.5%) | 4 (3.2%) |
| $500 to $799 | 26 (16.1%) | 47 (37.0%) |
| $800 to $999 | 19 (11.7%) | 2 (1.6%) |
| $1,000 to $1,499 | 15 (9.3%) | 38 (29.9%) |
| $1,500 to $1,999 | 18 (11.1%) | 0 (0.0%) |
| $2,000 to $2,499 | 15 (9.3%) | 0 (0.0%) |
| $2,500 to $2,999 | 0 (0.0%) | 0 (0.0%) |
| $3,000 or more | 0 (0.0%) | 0 (0.0%) |
| Total | 162 (100.0%) | 127 (100.0%) |
Physical Housing Characteristics in East Ellijay
Housing Structures in East Ellijay
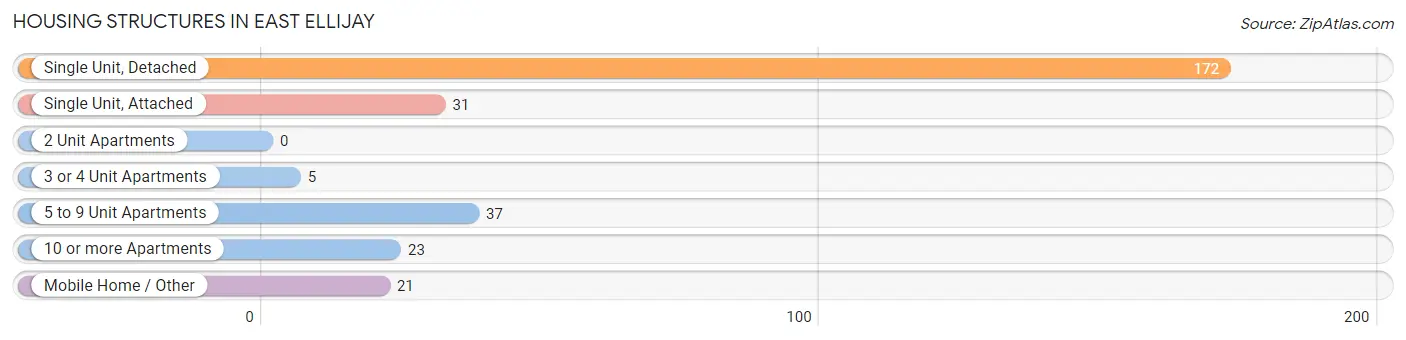
| Structure Type | # Housing Units | % Housing Units |
| Single Unit, Detached | 172 | 59.5% |
| Single Unit, Attached | 31 | 10.7% |
| 2 Unit Apartments | 0 | 0.0% |
| 3 or 4 Unit Apartments | 5 | 1.7% |
| 5 to 9 Unit Apartments | 37 | 12.8% |
| 10 or more Apartments | 23 | 8.0% |
| Mobile Home / Other | 21 | 7.3% |
| Total | 289 | 100.0% |
Housing Structures by Occupancy in East Ellijay
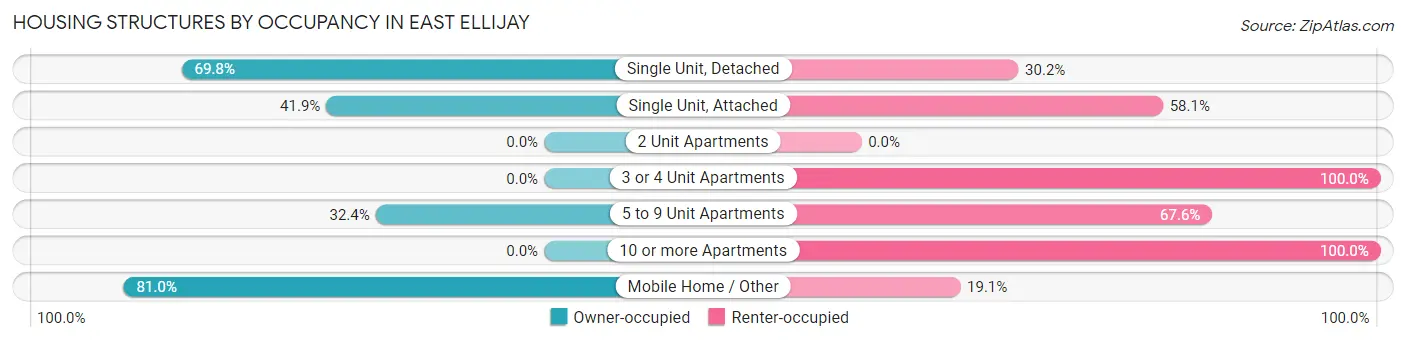
| Structure Type | Owner-occupied | Renter-occupied |
| Single Unit, Detached | 120 (69.8%) | 52 (30.2%) |
| Single Unit, Attached | 13 (41.9%) | 18 (58.1%) |
| 2 Unit Apartments | 0 (0.0%) | 0 (0.0%) |
| 3 or 4 Unit Apartments | 0 (0.0%) | 5 (100.0%) |
| 5 to 9 Unit Apartments | 12 (32.4%) | 25 (67.6%) |
| 10 or more Apartments | 0 (0.0%) | 23 (100.0%) |
| Mobile Home / Other | 17 (80.9%) | 4 (19.1%) |
| Total | 162 (56.1%) | 127 (43.9%) |
Housing Structures by Number of Rooms in East Ellijay
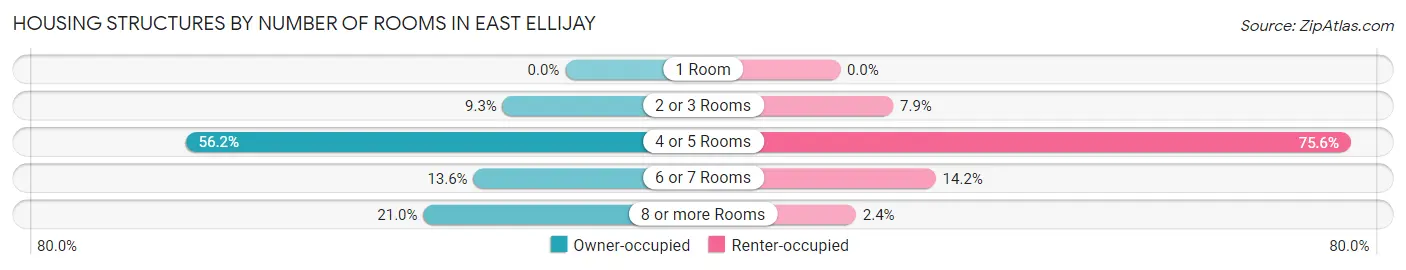
| Number of Rooms | Owner-occupied | Renter-occupied |
| 1 Room | 0 (0.0%) | 0 (0.0%) |
| 2 or 3 Rooms | 15 (9.3%) | 10 (7.9%) |
| 4 or 5 Rooms | 91 (56.2%) | 96 (75.6%) |
| 6 or 7 Rooms | 22 (13.6%) | 18 (14.2%) |
| 8 or more Rooms | 34 (21.0%) | 3 (2.4%) |
| Total | 162 (100.0%) | 127 (100.0%) |
Housing Structure by Heating Type in East Ellijay
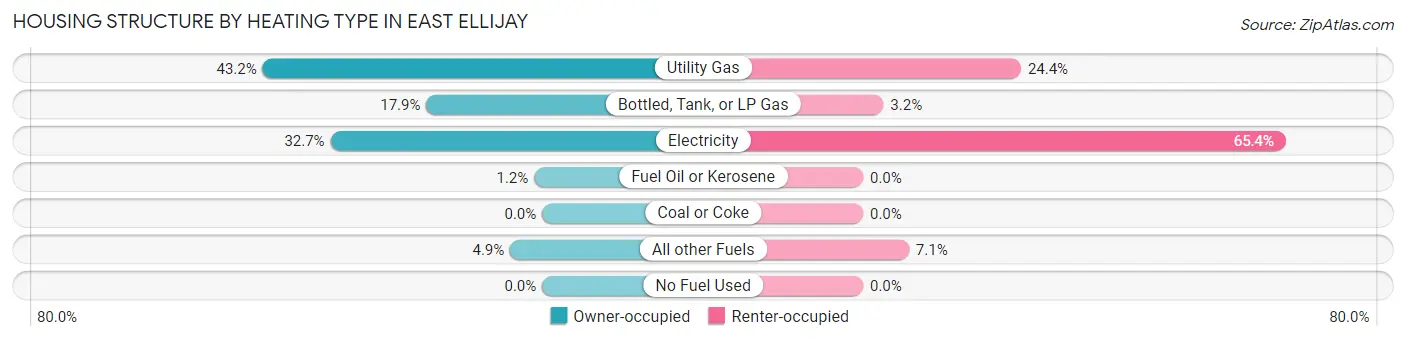
| Heating Type | Owner-occupied | Renter-occupied |
| Utility Gas | 70 (43.2%) | 31 (24.4%) |
| Bottled, Tank, or LP Gas | 29 (17.9%) | 4 (3.2%) |
| Electricity | 53 (32.7%) | 83 (65.3%) |
| Fuel Oil or Kerosene | 2 (1.2%) | 0 (0.0%) |
| Coal or Coke | 0 (0.0%) | 0 (0.0%) |
| All other Fuels | 8 (4.9%) | 9 (7.1%) |
| No Fuel Used | 0 (0.0%) | 0 (0.0%) |
| Total | 162 (100.0%) | 127 (100.0%) |
Household Vehicle Usage in East Ellijay
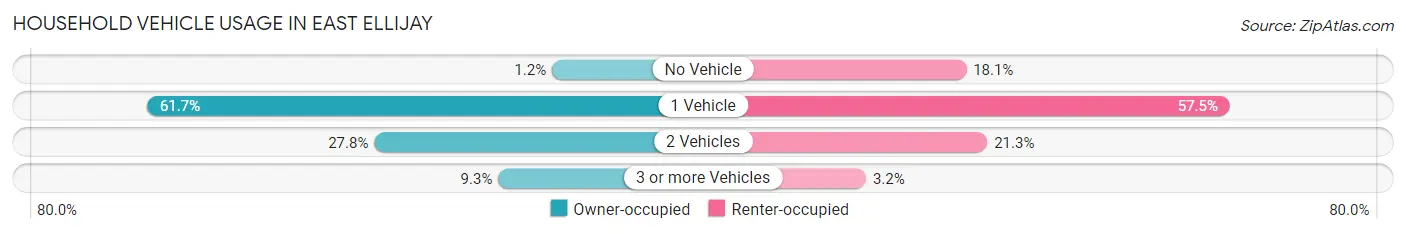
| Vehicles per Household | Owner-occupied | Renter-occupied |
| No Vehicle | 2 (1.2%) | 23 (18.1%) |
| 1 Vehicle | 100 (61.7%) | 73 (57.5%) |
| 2 Vehicles | 45 (27.8%) | 27 (21.3%) |
| 3 or more Vehicles | 15 (9.3%) | 4 (3.2%) |
| Total | 162 (100.0%) | 127 (100.0%) |
Real Estate & Mortgages in East Ellijay
Real Estate and Mortgage Overview in East Ellijay
| Characteristic | Without Mortgage | With Mortgage |
| Housing Units | 101 | 61 |
| Median Property Value | $161,800 | $0 |
| Median Household Income | $24,491 | $19 |
| Monthly Housing Costs | $379 | $0 |
| Real Estate Taxes | $644 | $0 |
Property Value by Mortgage Status in East Ellijay
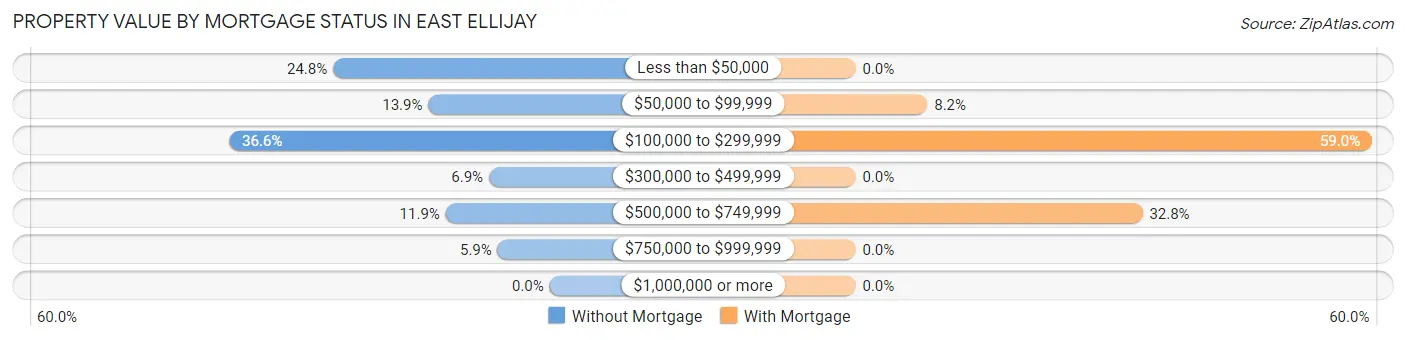
| Property Value | Without Mortgage | With Mortgage |
| Less than $50,000 | 25 (24.7%) | 0 (0.0%) |
| $50,000 to $99,999 | 14 (13.9%) | 5 (8.2%) |
| $100,000 to $299,999 | 37 (36.6%) | 36 (59.0%) |
| $300,000 to $499,999 | 7 (6.9%) | 0 (0.0%) |
| $500,000 to $749,999 | 12 (11.9%) | 20 (32.8%) |
| $750,000 to $999,999 | 6 (5.9%) | 0 (0.0%) |
| $1,000,000 or more | 0 (0.0%) | 0 (0.0%) |
| Total | 101 (100.0%) | 61 (100.0%) |
Household Income by Mortgage Status in East Ellijay
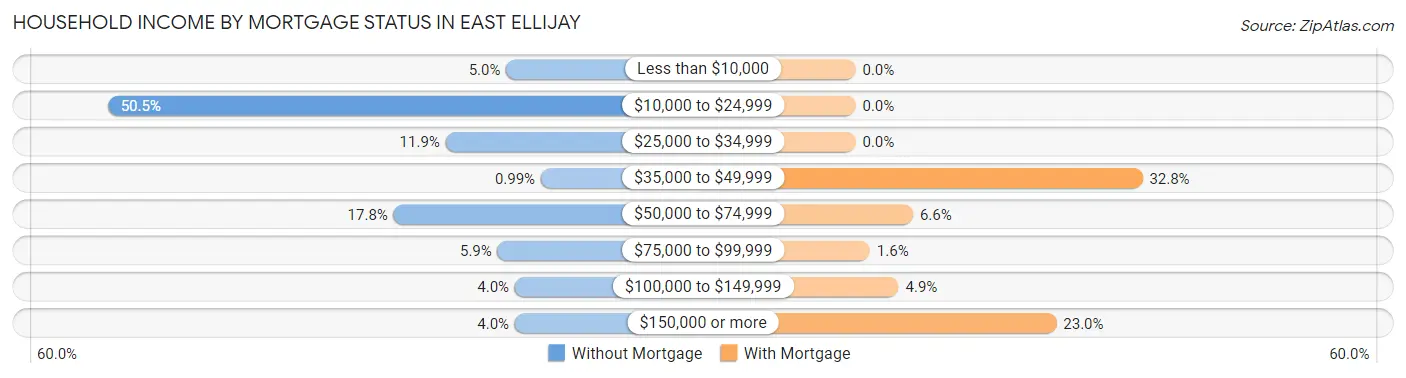
| Household Income | Without Mortgage | With Mortgage |
| Less than $10,000 | 5 (5.0%) | 0 (0.0%) |
| $10,000 to $24,999 | 51 (50.5%) | 0 (0.0%) |
| $25,000 to $34,999 | 12 (11.9%) | 0 (0.0%) |
| $35,000 to $49,999 | 1 (1.0%) | 20 (32.8%) |
| $50,000 to $74,999 | 18 (17.8%) | 4 (6.6%) |
| $75,000 to $99,999 | 6 (5.9%) | 1 (1.6%) |
| $100,000 to $149,999 | 4 (4.0%) | 3 (4.9%) |
| $150,000 or more | 4 (4.0%) | 14 (23.0%) |
| Total | 101 (100.0%) | 61 (100.0%) |
Property Value to Household Income Ratio in East Ellijay
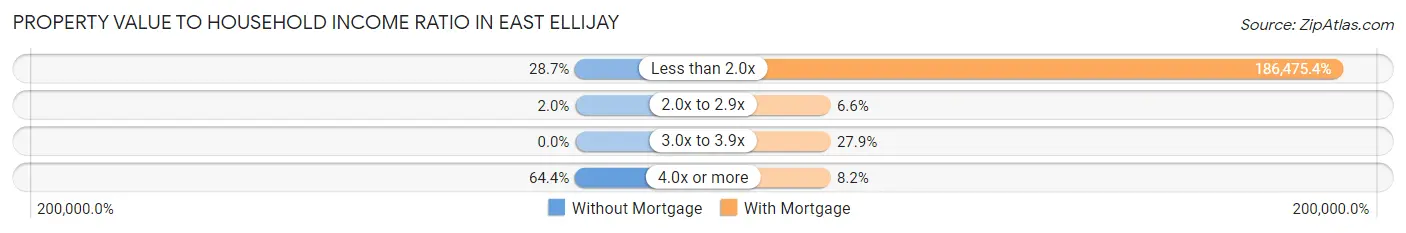
| Value-to-Income Ratio | Without Mortgage | With Mortgage |
| Less than 2.0x | 29 (28.7%) | 113,750 (186,475.4%) |
| 2.0x to 2.9x | 2 (2.0%) | 4 (6.6%) |
| 3.0x to 3.9x | 0 (0.0%) | 17 (27.9%) |
| 4.0x or more | 65 (64.4%) | 5 (8.2%) |
| Total | 101 (100.0%) | 61 (100.0%) |
Real Estate Taxes by Mortgage Status in East Ellijay
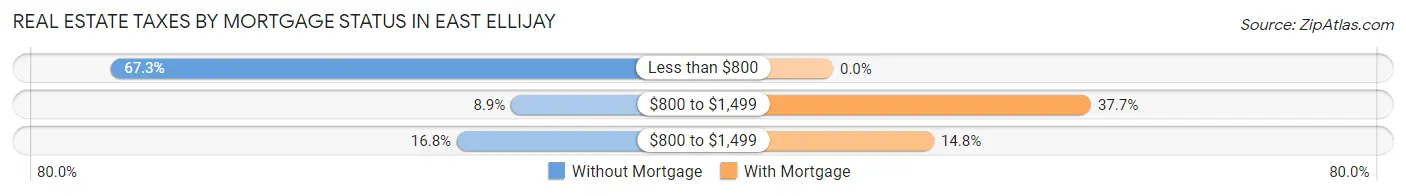
| Property Taxes | Without Mortgage | With Mortgage |
| Less than $800 | 68 (67.3%) | 0 (0.0%) |
| $800 to $1,499 | 9 (8.9%) | 23 (37.7%) |
| $800 to $1,499 | 17 (16.8%) | 9 (14.7%) |
| Total | 101 (100.0%) | 61 (100.0%) |
Health & Disability in East Ellijay
Health Insurance Coverage by Age in East Ellijay
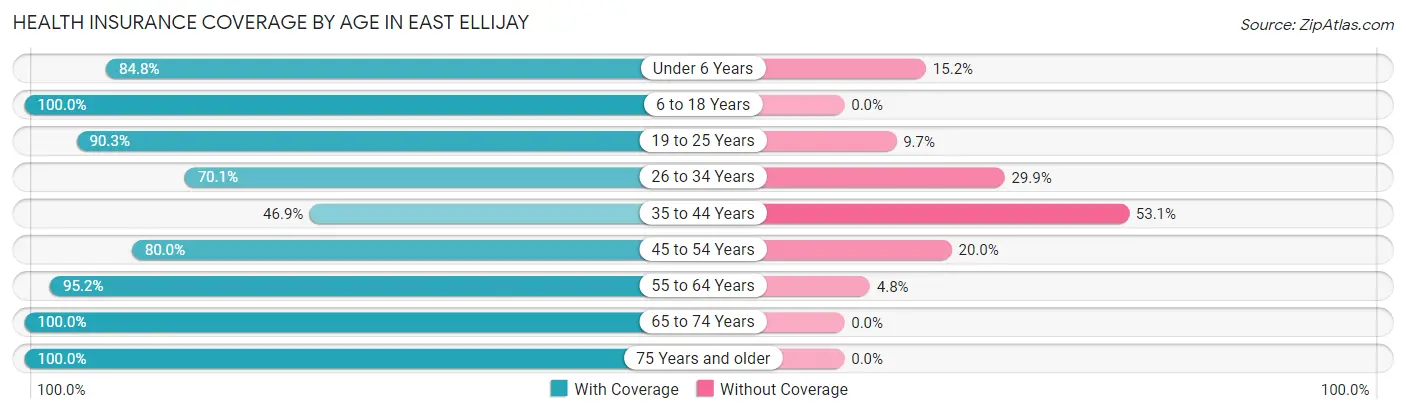
| Age Bracket | With Coverage | Without Coverage |
| Under 6 Years | 39 (84.8%) | 7 (15.2%) |
| 6 to 18 Years | 40 (100.0%) | 0 (0.0%) |
| 19 to 25 Years | 28 (90.3%) | 3 (9.7%) |
| 26 to 34 Years | 54 (70.1%) | 23 (29.9%) |
| 35 to 44 Years | 23 (46.9%) | 26 (53.1%) |
| 45 to 54 Years | 36 (80.0%) | 9 (20.0%) |
| 55 to 64 Years | 80 (95.2%) | 4 (4.8%) |
| 65 to 74 Years | 72 (100.0%) | 0 (0.0%) |
| 75 Years and older | 86 (100.0%) | 0 (0.0%) |
| Total | 458 (86.4%) | 72 (13.6%) |
Health Insurance Coverage by Citizenship Status in East Ellijay
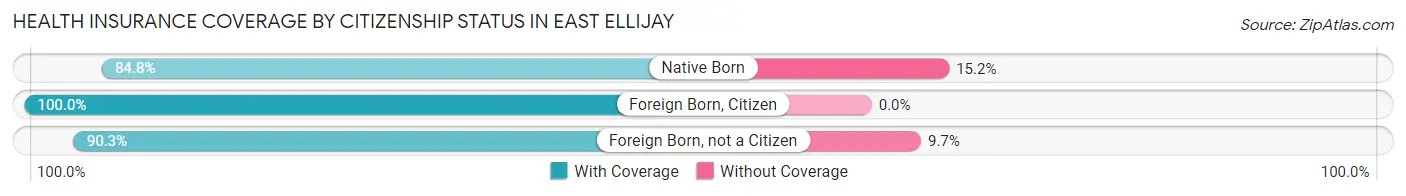
| Citizenship Status | With Coverage | Without Coverage |
| Native Born | 39 (84.8%) | 7 (15.2%) |
| Foreign Born, Citizen | 40 (100.0%) | 0 (0.0%) |
| Foreign Born, not a Citizen | 28 (90.3%) | 3 (9.7%) |
Health Insurance Coverage by Household Income in East Ellijay
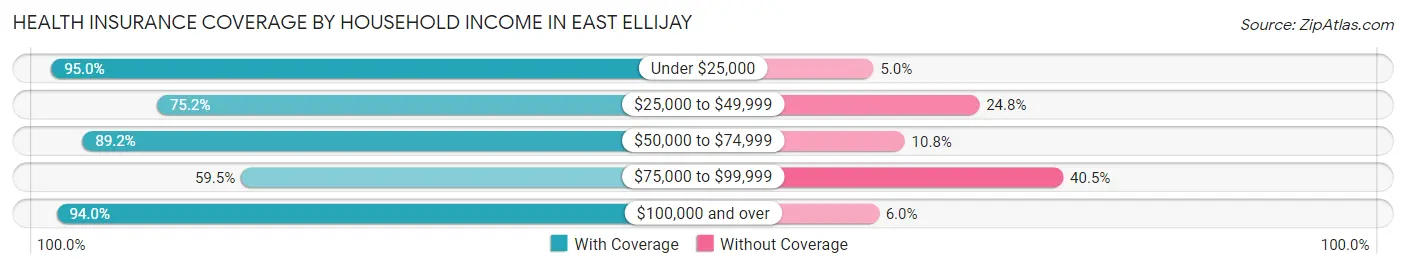
| Household Income | With Coverage | Without Coverage |
| Under $25,000 | 152 (95.0%) | 8 (5.0%) |
| $25,000 to $49,999 | 100 (75.2%) | 33 (24.8%) |
| $50,000 to $74,999 | 74 (89.2%) | 9 (10.8%) |
| $75,000 to $99,999 | 22 (59.5%) | 15 (40.5%) |
| $100,000 and over | 110 (94.0%) | 7 (6.0%) |
Public vs Private Health Insurance Coverage by Age in East Ellijay
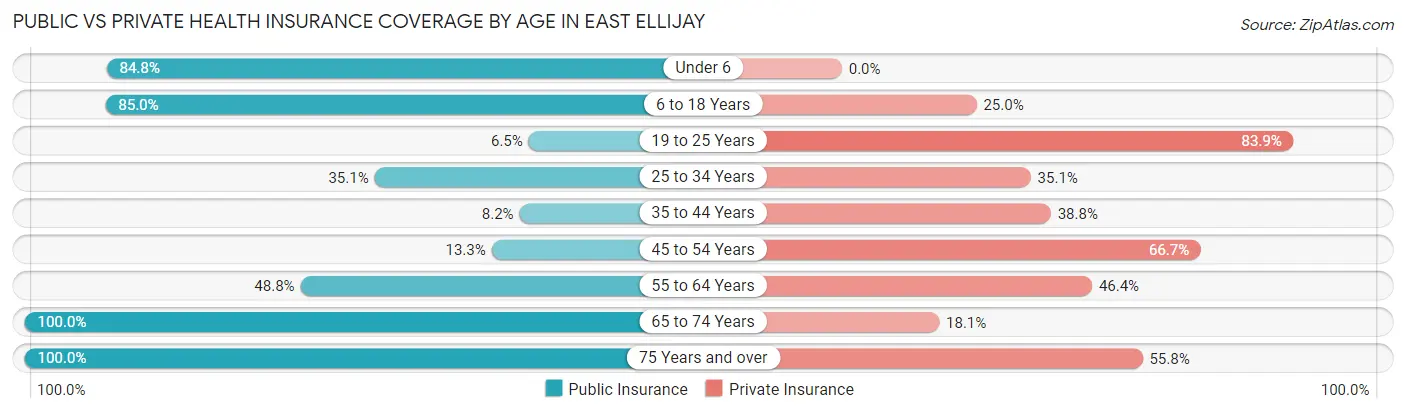
| Age Bracket | Public Insurance | Private Insurance |
| Under 6 | 39 (84.8%) | 0 (0.0%) |
| 6 to 18 Years | 34 (85.0%) | 10 (25.0%) |
| 19 to 25 Years | 2 (6.5%) | 26 (83.9%) |
| 25 to 34 Years | 27 (35.1%) | 27 (35.1%) |
| 35 to 44 Years | 4 (8.2%) | 19 (38.8%) |
| 45 to 54 Years | 6 (13.3%) | 30 (66.7%) |
| 55 to 64 Years | 41 (48.8%) | 39 (46.4%) |
| 65 to 74 Years | 72 (100.0%) | 13 (18.1%) |
| 75 Years and over | 86 (100.0%) | 48 (55.8%) |
| Total | 311 (58.7%) | 212 (40.0%) |
Disability Status by Sex by Age in East Ellijay
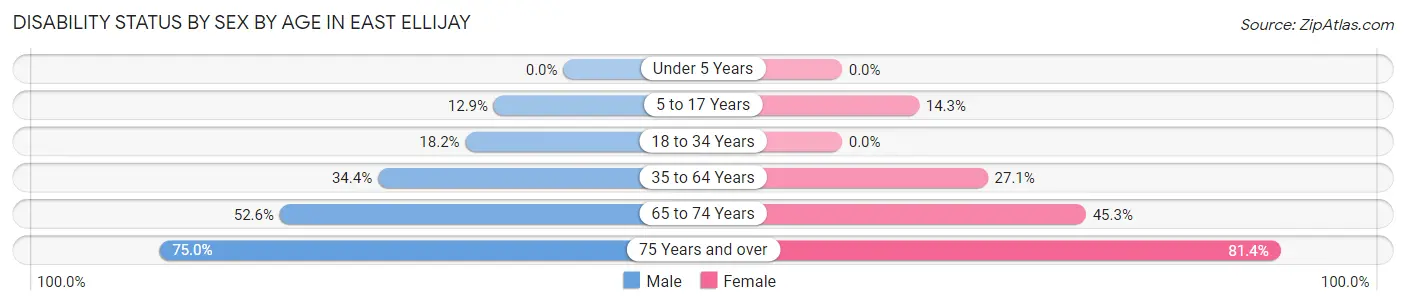
| Age Bracket | Male | Female |
| Under 5 Years | 0 (0.0%) | 0 (0.0%) |
| 5 to 17 Years | 4 (12.9%) | 3 (14.3%) |
| 18 to 34 Years | 8 (18.2%) | 0 (0.0%) |
| 35 to 64 Years | 32 (34.4%) | 23 (27.1%) |
| 65 to 74 Years | 10 (52.6%) | 24 (45.3%) |
| 75 Years and over | 12 (75.0%) | 57 (81.4%) |
Disability Class by Sex by Age in East Ellijay
Disability Class: Hearing Difficulty
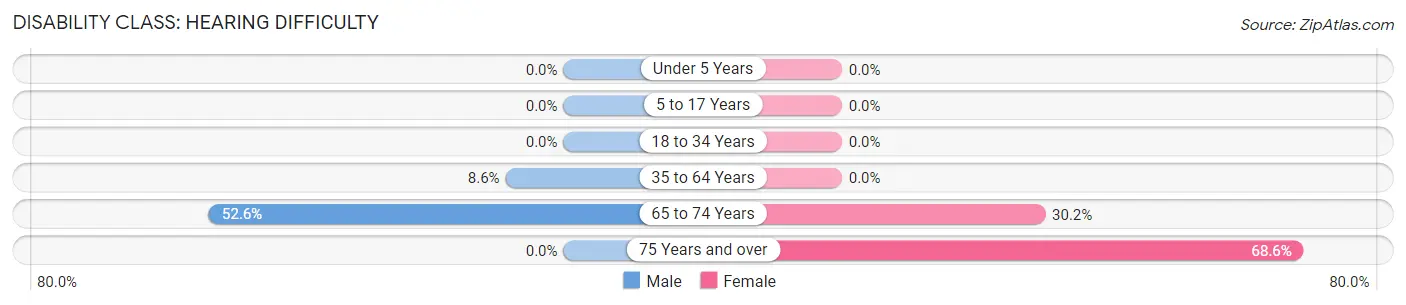
| Age Bracket | Male | Female |
| Under 5 Years | 0 (0.0%) | 0 (0.0%) |
| 5 to 17 Years | 0 (0.0%) | 0 (0.0%) |
| 18 to 34 Years | 0 (0.0%) | 0 (0.0%) |
| 35 to 64 Years | 8 (8.6%) | 0 (0.0%) |
| 65 to 74 Years | 10 (52.6%) | 16 (30.2%) |
| 75 Years and over | 0 (0.0%) | 48 (68.6%) |
Disability Class: Vision Difficulty
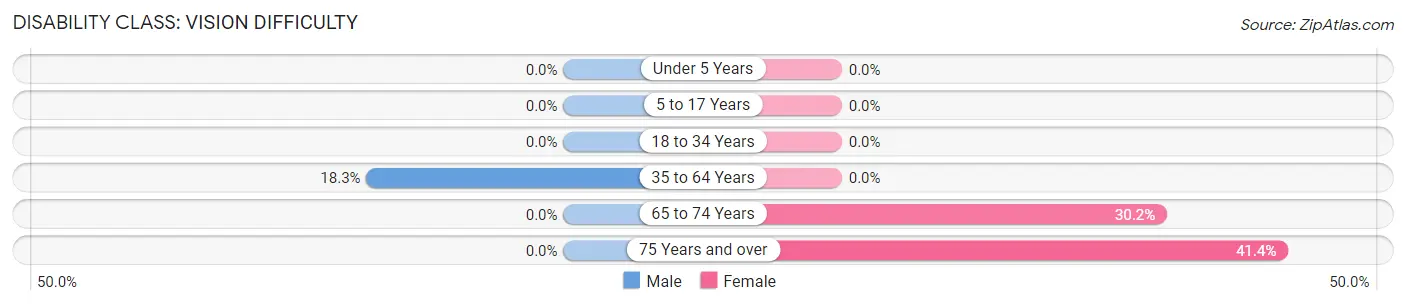
| Age Bracket | Male | Female |
| Under 5 Years | 0 (0.0%) | 0 (0.0%) |
| 5 to 17 Years | 0 (0.0%) | 0 (0.0%) |
| 18 to 34 Years | 0 (0.0%) | 0 (0.0%) |
| 35 to 64 Years | 17 (18.3%) | 0 (0.0%) |
| 65 to 74 Years | 0 (0.0%) | 16 (30.2%) |
| 75 Years and over | 0 (0.0%) | 29 (41.4%) |
Disability Class: Cognitive Difficulty
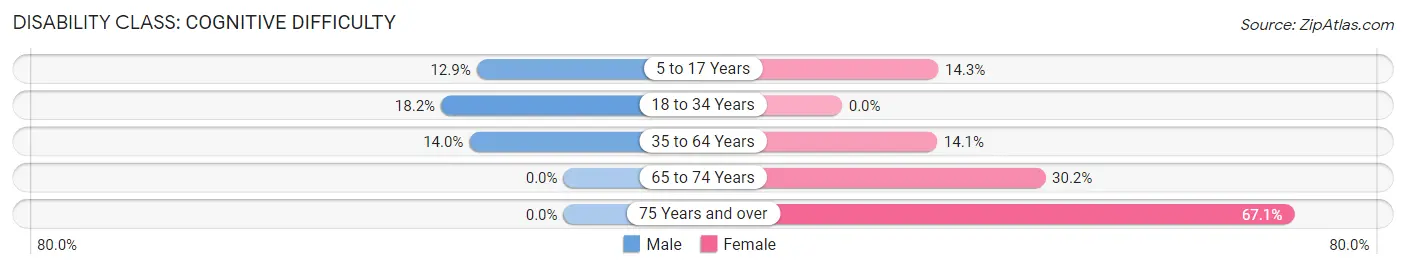
| Age Bracket | Male | Female |
| 5 to 17 Years | 4 (12.9%) | 3 (14.3%) |
| 18 to 34 Years | 8 (18.2%) | 0 (0.0%) |
| 35 to 64 Years | 13 (14.0%) | 12 (14.1%) |
| 65 to 74 Years | 0 (0.0%) | 16 (30.2%) |
| 75 Years and over | 0 (0.0%) | 47 (67.1%) |
Disability Class: Ambulatory Difficulty
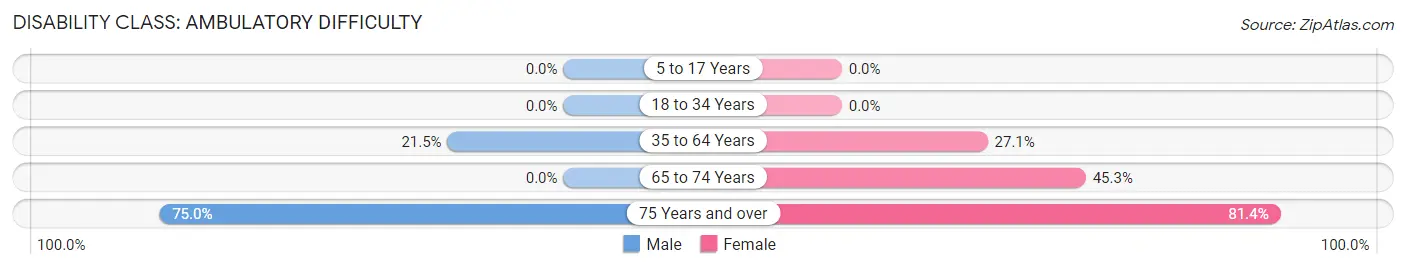
| Age Bracket | Male | Female |
| 5 to 17 Years | 0 (0.0%) | 0 (0.0%) |
| 18 to 34 Years | 0 (0.0%) | 0 (0.0%) |
| 35 to 64 Years | 20 (21.5%) | 23 (27.1%) |
| 65 to 74 Years | 0 (0.0%) | 24 (45.3%) |
| 75 Years and over | 12 (75.0%) | 57 (81.4%) |
Disability Class: Self-Care Difficulty
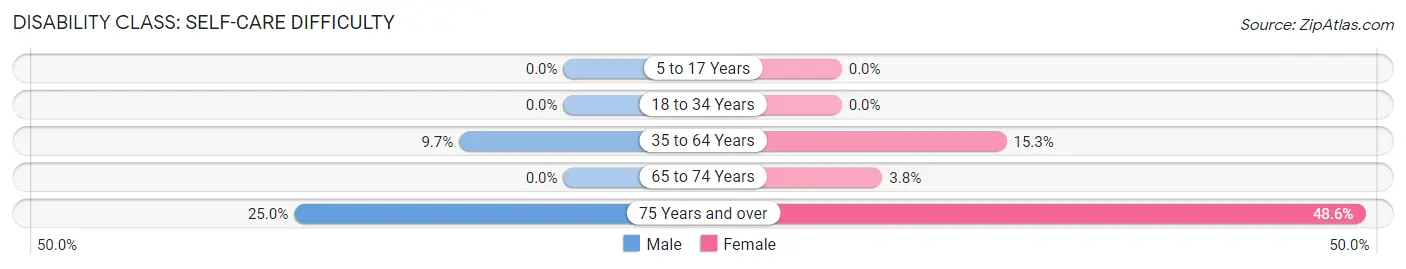
| Age Bracket | Male | Female |
| 5 to 17 Years | 0 (0.0%) | 0 (0.0%) |
| 18 to 34 Years | 0 (0.0%) | 0 (0.0%) |
| 35 to 64 Years | 9 (9.7%) | 13 (15.3%) |
| 65 to 74 Years | 0 (0.0%) | 2 (3.8%) |
| 75 Years and over | 4 (25.0%) | 34 (48.6%) |
Technology Access in East Ellijay
Computing Device Access in East Ellijay
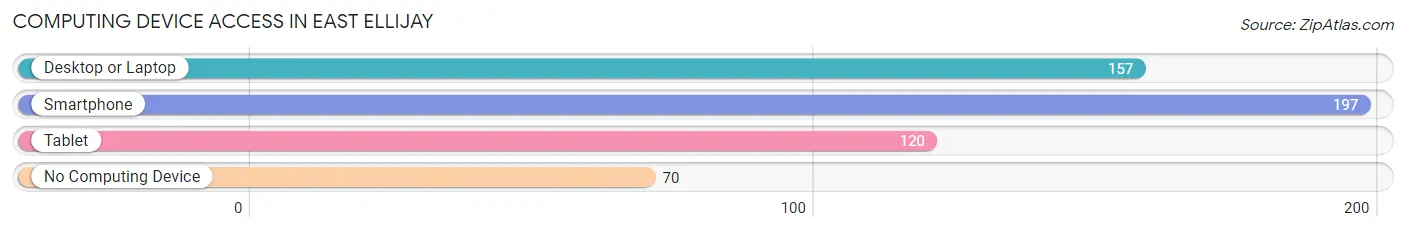
| Device Type | # Households | % Households |
| Desktop or Laptop | 157 | 54.3% |
| Smartphone | 197 | 68.2% |
| Tablet | 120 | 41.5% |
| No Computing Device | 70 | 24.2% |
| Total | 289 | 100.0% |
Internet Access in East Ellijay
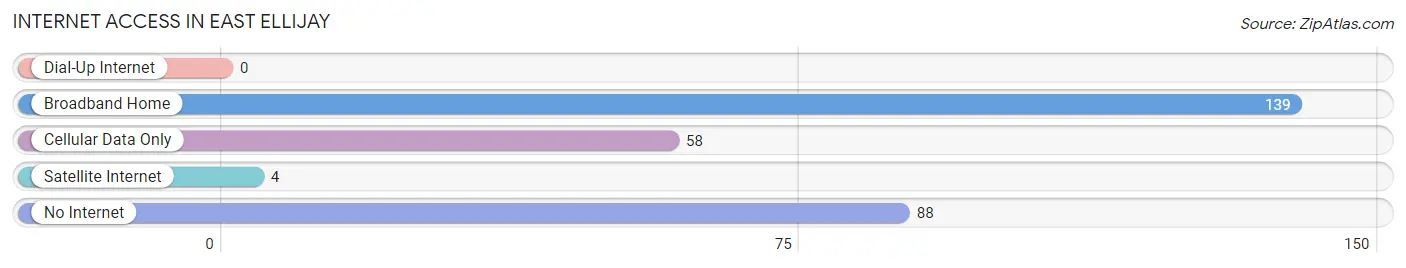
| Internet Type | # Households | % Households |
| Dial-Up Internet | 0 | 0.0% |
| Broadband Home | 139 | 48.1% |
| Cellular Data Only | 58 | 20.1% |
| Satellite Internet | 4 | 1.4% |
| No Internet | 88 | 30.4% |
| Total | 289 | 100.0% |
East Ellijay Summary
East Ellijay is a small city located in Gilmer County, Georgia, United States. It is the county seat of Gilmer County and is part of the larger Atlanta metropolitan area. The city is situated in the foothills of the Appalachian Mountains and is known for its scenic beauty and outdoor recreation opportunities.
History
East Ellijay was founded in 1834 by settlers from North Carolina. The city was named after the nearby Ellijay River, which was named after the Cherokee word for “new ground”. The city was originally a trading post and was the site of a Civil War battle in 1864. After the war, the city grew rapidly and became a center for the timber and apple industries.
In the early 20th century, East Ellijay was a popular tourist destination, with many visitors coming to enjoy the area’s natural beauty and outdoor recreation opportunities. The city was also home to several resorts, including the historic Mountain View Hotel.
Geography
East Ellijay is located in the foothills of the Appalachian Mountains in northern Georgia. The city is situated at the confluence of the Ellijay and Cartecay Rivers. The city is surrounded by the Chattahoochee National Forest and is located near the Cohutta Wilderness Area.
The city has a total area of 4.2 square miles, all of which is land. The city has a humid subtropical climate, with hot, humid summers and mild winters.
Economy
East Ellijay’s economy is largely based on tourism and outdoor recreation. The city is home to several resorts and is a popular destination for fishing, camping, hiking, and other outdoor activities. The city is also home to several wineries and is a popular destination for wine tasting.
The city is also home to several manufacturing companies, including a furniture factory and a paper mill. The city is also home to several retail stores and restaurants.
Demographics
As of the 2010 census, East Ellijay had a population of 1,584. The racial makeup of the city was 94.3% White, 0.9% African American, 0.3% Native American, 0.3% Asian, 0.1% Pacific Islander, 2.2% from other races, and 1.9% from two or more races. Hispanic or Latino of any race were 4.2% of the population.
The median household income in East Ellijay was $37,917, and the median family income was $45,000. The per capita income for the city was $20,845. About 11.3% of families and 14.2% of the population were below the poverty line, including 19.2% of those under age 18 and 8.3% of those age 65 or over.
Common Questions
What is Per Capita Income in East Ellijay?
Per Capita income in East Ellijay is $41,665.
What is the Median Family Income in East Ellijay?
Median Family Income in East Ellijay is $60,714.
What is the Median Household income in East Ellijay?
Median Household Income in East Ellijay is $26,691.
What is Family Income Deficit in East Ellijay?
Family Income Deficit in East Ellijay is $10,039.
Families that are below poverty line in East Ellijay earn $10,039 less on average than the poverty threshold level.
What is Inequality or Gini Index in East Ellijay?
Inequality or Gini Index in East Ellijay is 0.63.
What is the Total Population of East Ellijay?
Total Population of East Ellijay is 530.
What is the Total Male Population of East Ellijay?
Total Male Population of East Ellijay is 228.
What is the Total Female Population of East Ellijay?
Total Female Population of East Ellijay is 302.
What is the Ratio of Males per 100 Females in East Ellijay?
There are 75.50 Males per 100 Females in East Ellijay.
What is the Ratio of Females per 100 Males in East Ellijay?
There are 132.46 Females per 100 Males in East Ellijay.
What is the Median Population Age in East Ellijay?
Median Population Age in East Ellijay is 50.4 Years.
What is the Average Family Size in East Ellijay
Average Family Size in East Ellijay is 2.8 People.
What is the Average Household Size in East Ellijay
Average Household Size in East Ellijay is 1.8 People.
How Large is the Labor Force in East Ellijay?
There are 233 People in the Labor Forcein in East Ellijay.
What is the Percentage of People in the Labor Force in East Ellijay?
51.4% of People are in the Labor Force in East Ellijay.
What is the Unemployment Rate in East Ellijay?
Unemployment Rate in East Ellijay is 10.7%.