Oak Point, TX Map & Demographics
Oak Point Map
Oak Point Overview
$46,527
PER CAPITA INCOME
$119,250
AVG FAMILY INCOME
$104,120
AVG HOUSEHOLD INCOME
23.2%
WAGE / INCOME GAP [ % ]
76.8¢/ $1
WAGE / INCOME GAP [ $ ]
0.37
INEQUALITY / GINI INDEX
4,957
TOTAL POPULATION
2,460
MALE POPULATION
2,497
FEMALE POPULATION
98.52
MALES / 100 FEMALES
101.50
FEMALES / 100 MALES
34.2
MEDIAN AGE
3.3
AVG FAMILY SIZE
2.7
AVG HOUSEHOLD SIZE
2,561
LABOR FORCE [ PEOPLE ]
69.8%
PERCENT IN LABOR FORCE
1.5%
UNEMPLOYMENT RATE
Oak Point Area Codes
Income in Oak Point
Income Overview in Oak Point
Per Capita Income in Oak Point is $46,527, while median incomes of families and households are $119,250 and $104,120 respectively.
| Characteristic | Number | Measure |
| Per Capita Income | 4,957 | $46,527 |
| Median Family Income | 1,246 | $119,250 |
| Mean Family Income | 1,246 | $140,721 |
| Median Household Income | 1,821 | $104,120 |
| Mean Household Income | 1,821 | $124,775 |
| Income Deficit | 1,246 | $0 |
| Wage / Income Gap (%) | 4,957 | 23.20% |
| Wage / Income Gap ($) | 4,957 | 76.80¢ per $1 |
| Gini / Inequality Index | 4,957 | 0.37 |
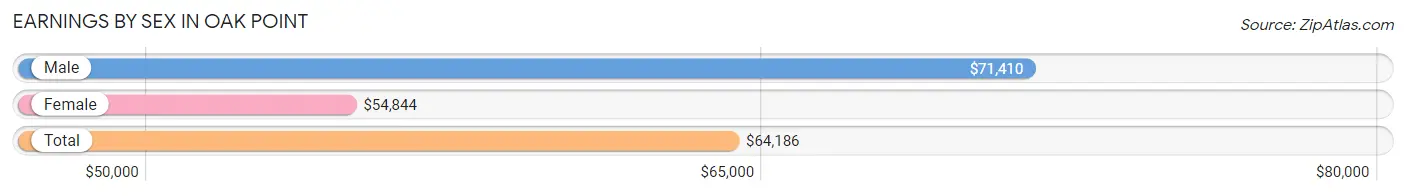
Earnings by Sex in Oak Point
Average Earnings in Oak Point are $64,186, $71,410 for men and $54,844 for women, a difference of 23.2%.
| Sex | Number | Average Earnings |
| Male | 1,299 (48.9%) | $71,410 |
| Female | 1,355 (51.1%) | $54,844 |
| Total | 2,654 (100.0%) | $64,186 |
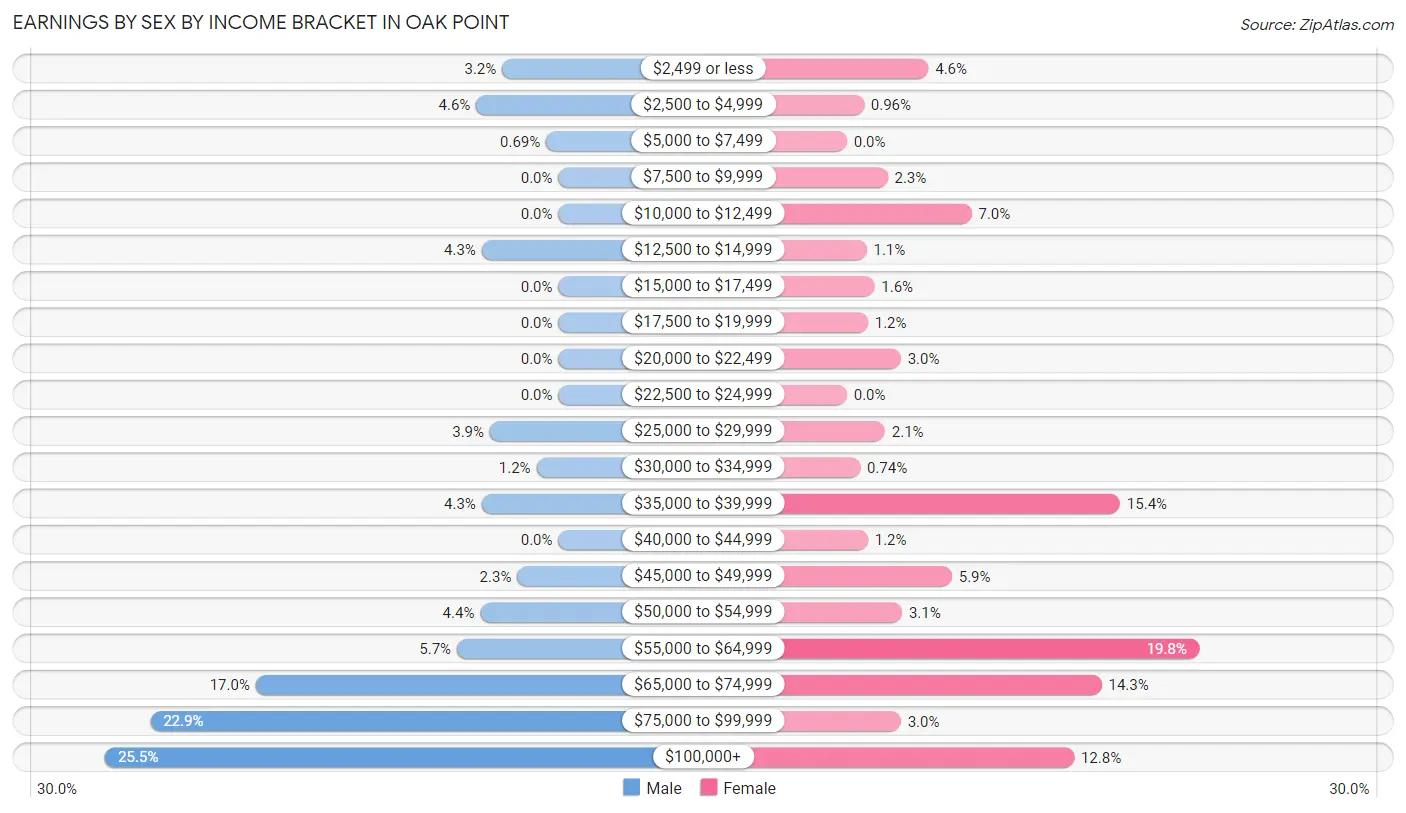
Earnings by Sex by Income Bracket in Oak Point
The most common earnings brackets in Oak Point are $100,000+ for men (331 | 25.5%) and $55,000 to $64,999 for women (268 | 19.8%).
| Income | Male | Female |
| $2,499 or less | 41 (3.2%) | 62 (4.6%) |
| $2,500 to $4,999 | 60 (4.6%) | 13 (1.0%) |
| $5,000 to $7,499 | 9 (0.7%) | 0 (0.0%) |
| $7,500 to $9,999 | 0 (0.0%) | 31 (2.3%) |
| $10,000 to $12,499 | 0 (0.0%) | 95 (7.0%) |
| $12,500 to $14,999 | 56 (4.3%) | 15 (1.1%) |
| $15,000 to $17,499 | 0 (0.0%) | 21 (1.5%) |
| $17,500 to $19,999 | 0 (0.0%) | 16 (1.2%) |
| $20,000 to $22,499 | 0 (0.0%) | 41 (3.0%) |
| $22,500 to $24,999 | 0 (0.0%) | 0 (0.0%) |
| $25,000 to $29,999 | 50 (3.8%) | 29 (2.1%) |
| $30,000 to $34,999 | 16 (1.2%) | 10 (0.7%) |
| $35,000 to $39,999 | 56 (4.3%) | 208 (15.3%) |
| $40,000 to $44,999 | 0 (0.0%) | 16 (1.2%) |
| $45,000 to $49,999 | 30 (2.3%) | 80 (5.9%) |
| $50,000 to $54,999 | 57 (4.4%) | 42 (3.1%) |
| $55,000 to $64,999 | 74 (5.7%) | 268 (19.8%) |
| $65,000 to $74,999 | 221 (17.0%) | 194 (14.3%) |
| $75,000 to $99,999 | 298 (22.9%) | 41 (3.0%) |
| $100,000+ | 331 (25.5%) | 173 (12.8%) |
| Total | 1,299 (100.0%) | 1,355 (100.0%) |
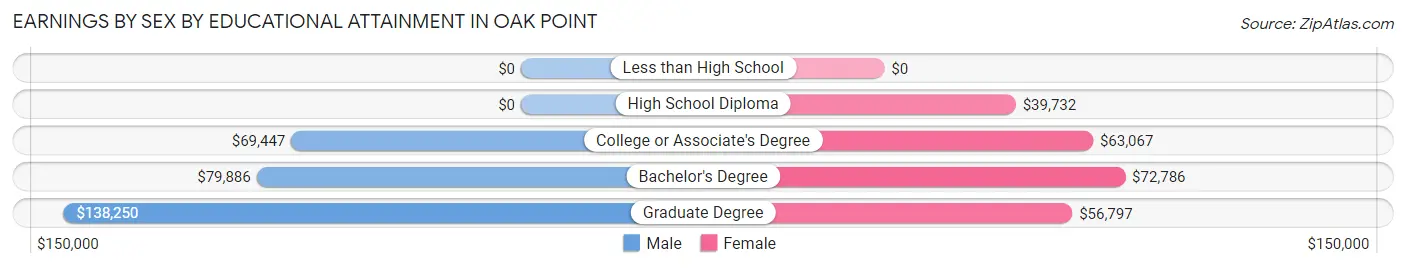
Earnings by Sex by Educational Attainment in Oak Point
Average earnings in Oak Point are $77,633 for men and $57,202 for women, a difference of 26.3%. Men with an educational attainment of graduate degree enjoy the highest average annual earnings of $138,250, while those with college or associate's degree education earn the least with $69,447. Women with an educational attainment of bachelor's degree earn the most with the average annual earnings of $72,786, while those with high school diploma education have the smallest earnings of $39,732.
| Educational Attainment | Male Income | Female Income |
| Less than High School | - | - |
| High School Diploma | - | - |
| College or Associate's Degree | $69,447 | $63,067 |
| Bachelor's Degree | $79,886 | $72,786 |
| Graduate Degree | $138,250 | $56,797 |
| Total | $77,633 | $57,202 |
Family Income in Oak Point
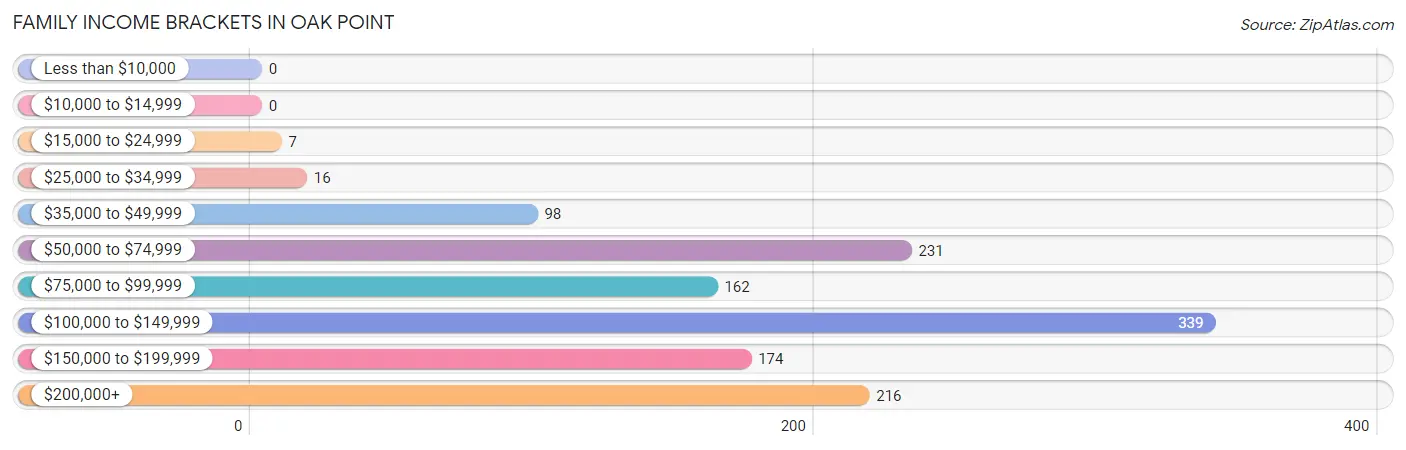
Family Income Brackets in Oak Point
According to the Oak Point family income data, there are 339 families falling into the $100,000 to $149,999 income range, which is the most common income bracket and makes up 27.2% of all families.
| Income Bracket | # Families | % Families |
| Less than $10,000 | 0 | 0.0% |
| $10,000 to $14,999 | 0 | 0.0% |
| $15,000 to $24,999 | 7 | 0.6% |
| $25,000 to $34,999 | 16 | 1.3% |
| $35,000 to $49,999 | 98 | 7.9% |
| $50,000 to $74,999 | 231 | 18.5% |
| $75,000 to $99,999 | 162 | 13.0% |
| $100,000 to $149,999 | 339 | 27.2% |
| $150,000 to $199,999 | 174 | 14.0% |
| $200,000+ | 216 | 17.3% |
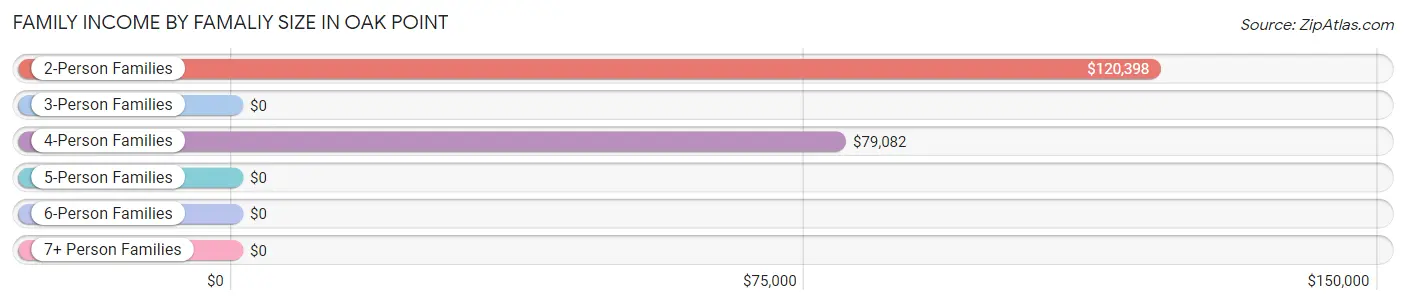
Family Income by Famaliy Size in Oak Point
2-person families (483 | 38.8%) account for the highest median family income in Oak Point with $120,398 per family, while 2-person families (483 | 38.8%) have the highest median income of $60,199 per family member.
| Income Bracket | # Families | Median Income |
| 2-Person Families | 483 (38.8%) | $120,398 |
| 3-Person Families | 241 (19.3%) | $0 |
| 4-Person Families | 321 (25.8%) | $79,082 |
| 5-Person Families | 176 (14.1%) | $0 |
| 6-Person Families | 25 (2.0%) | $0 |
| 7+ Person Families | 0 (0.0%) | $0 |
| Total | 1,246 (100.0%) | $119,250 |
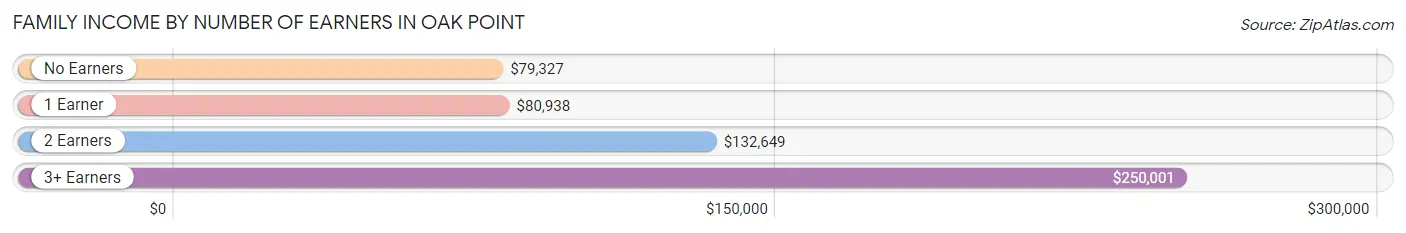
Family Income by Number of Earners in Oak Point
The median family income in Oak Point is $119,250, with families comprising 3+ earners (111) having the highest median family income of $250,001, while families with no earners (145) have the lowest median family income of $79,327, accounting for 8.9% and 11.6% of families, respectively.
| Number of Earners | # Families | Median Income |
| No Earners | 145 (11.6%) | $79,327 |
| 1 Earner | 515 (41.3%) | $80,938 |
| 2 Earners | 475 (38.1%) | $132,649 |
| 3+ Earners | 111 (8.9%) | $250,001 |
| Total | 1,246 (100.0%) | $119,250 |
Household Income in Oak Point
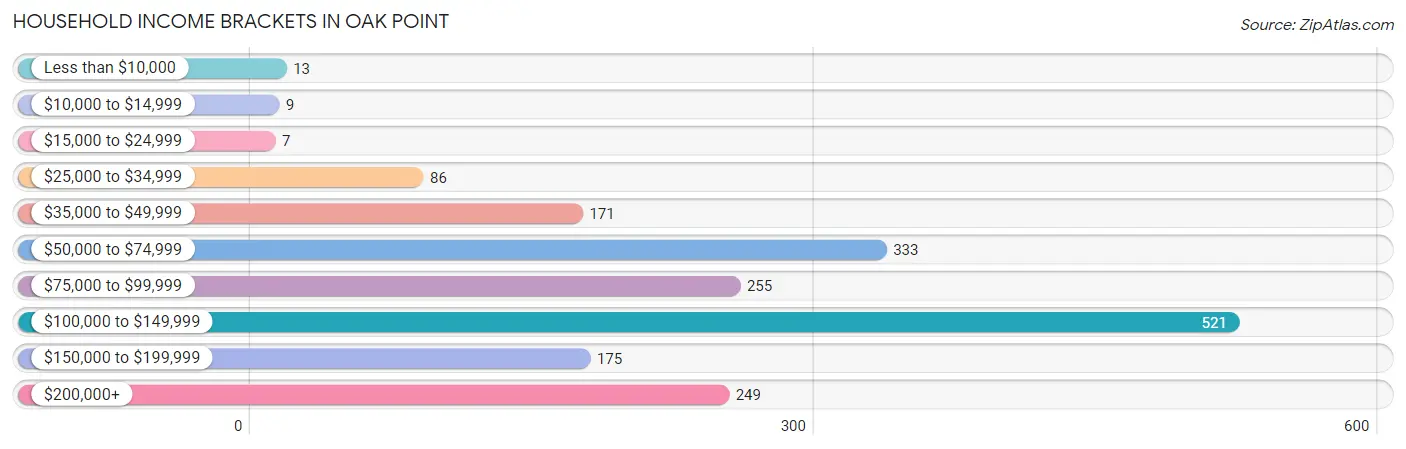
Household Income Brackets in Oak Point
With 521 households falling in the category, the $100,000 to $149,999 income range is the most frequent in Oak Point, accounting for 28.6% of all households. In contrast, only 7 households (0.4%) fall into the $15,000 to $24,999 income bracket, making it the least populous group.
| Income Bracket | # Households | % Households |
| Less than $10,000 | 13 | 0.7% |
| $10,000 to $14,999 | 9 | 0.5% |
| $15,000 to $24,999 | 7 | 0.4% |
| $25,000 to $34,999 | 86 | 4.7% |
| $35,000 to $49,999 | 171 | 9.4% |
| $50,000 to $74,999 | 333 | 18.3% |
| $75,000 to $99,999 | 255 | 14.0% |
| $100,000 to $149,999 | 521 | 28.6% |
| $150,000 to $199,999 | 175 | 9.6% |
| $200,000+ | 249 | 13.7% |
Household Income by Householder Age in Oak Point
The median household income in Oak Point is $104,120, with the highest median household income of $133,532 found in the 45 to 64 years age bracket for the primary householder. A total of 443 households (24.3%) fall into this category.
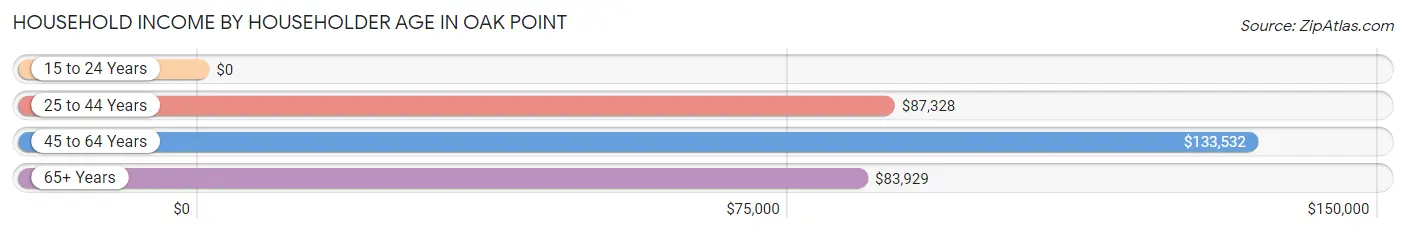
| Income Bracket | # Households | Median Income |
| 15 to 24 Years | 0 (0.0%) | $0 |
| 25 to 44 Years | 966 (53.0%) | $87,328 |
| 45 to 64 Years | 443 (24.3%) | $133,532 |
| 65+ Years | 412 (22.6%) | $83,929 |
| Total | 1,821 (100.0%) | $104,120 |
Poverty in Oak Point
Income Below Poverty by Sex and Age in Oak Point
With 2.1% poverty level for males and 0.8% for females among the residents of Oak Point, 75 year old and over males and 75 year old and over females are the most vulnerable to poverty, with 21 males (38.9%) and 11 females (31.4%) in their respective age groups living below the poverty level.
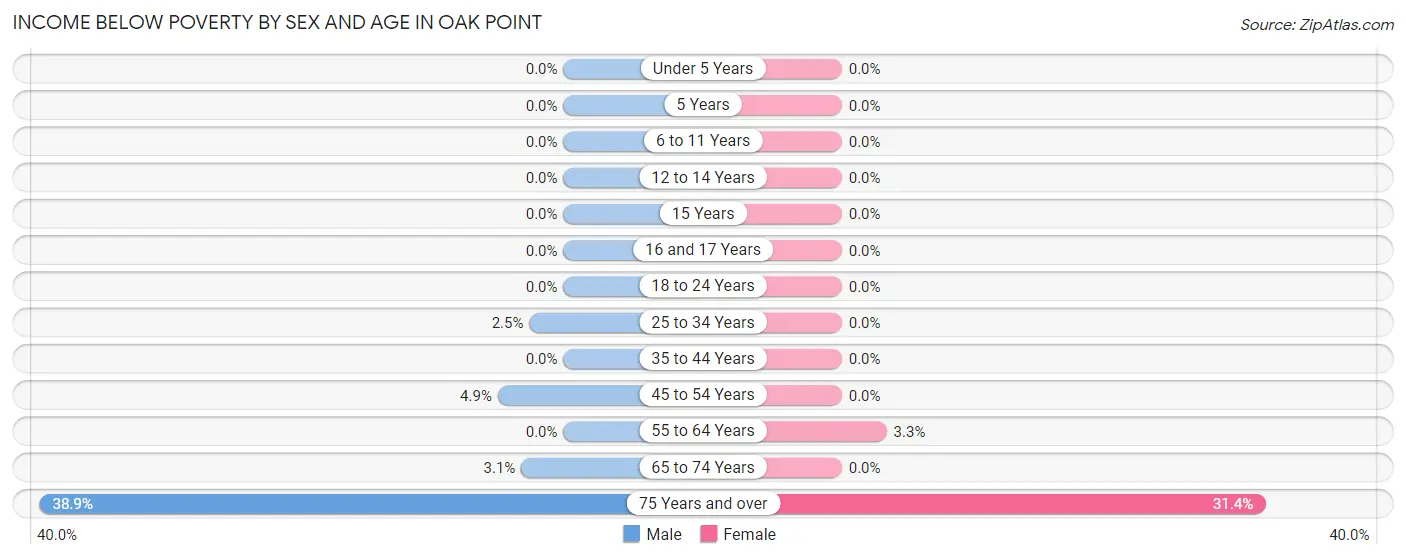
| Age Bracket | Male | Female |
| Under 5 Years | 0 (0.0%) | 0 (0.0%) |
| 5 Years | 0 (0.0%) | 0 (0.0%) |
| 6 to 11 Years | 0 (0.0%) | 0 (0.0%) |
| 12 to 14 Years | 0 (0.0%) | 0 (0.0%) |
| 15 Years | 0 (0.0%) | 0 (0.0%) |
| 16 and 17 Years | 0 (0.0%) | 0 (0.0%) |
| 18 to 24 Years | 0 (0.0%) | 0 (0.0%) |
| 25 to 34 Years | 10 (2.5%) | 0 (0.0%) |
| 35 to 44 Years | 0 (0.0%) | 0 (0.0%) |
| 45 to 54 Years | 11 (4.9%) | 0 (0.0%) |
| 55 to 64 Years | 0 (0.0%) | 9 (3.3%) |
| 65 to 74 Years | 10 (3.1%) | 0 (0.0%) |
| 75 Years and over | 21 (38.9%) | 11 (31.4%) |
| Total | 52 (2.1%) | 20 (0.8%) |
Income Above Poverty by Sex and Age in Oak Point
According to the poverty statistics in Oak Point, males aged under 5 years and females aged under 5 years are the age groups that are most secure financially, with 100.0% of males and 100.0% of females in these age groups living above the poverty line.
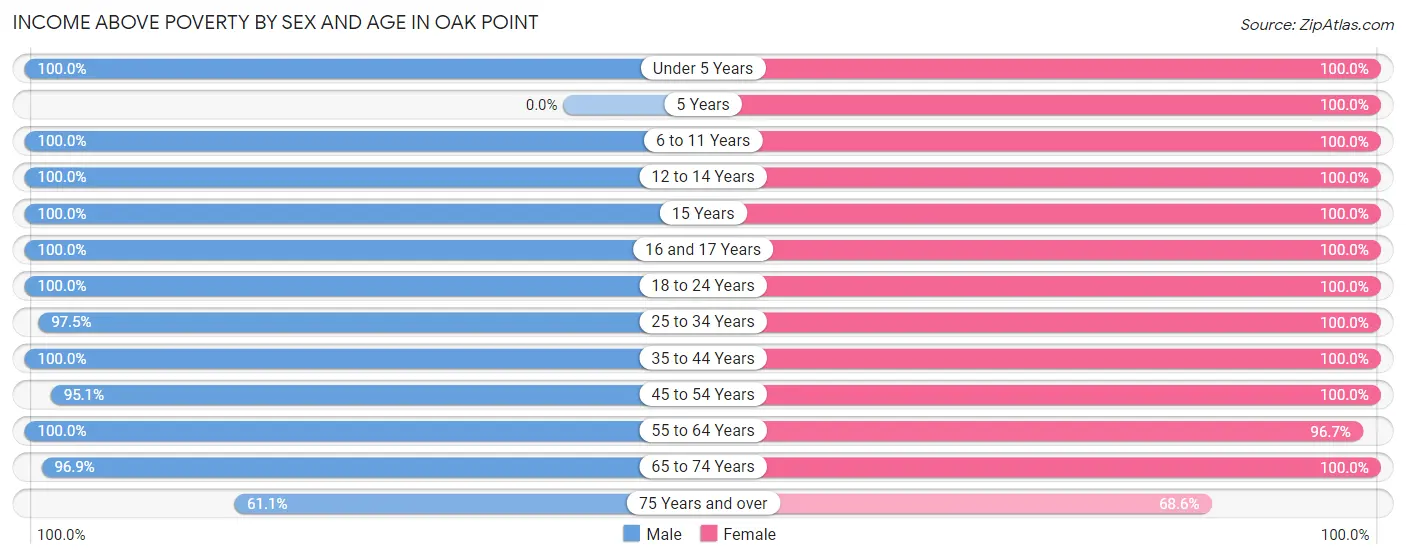
| Age Bracket | Male | Female |
| Under 5 Years | 285 (100.0%) | 220 (100.0%) |
| 5 Years | 0 (0.0%) | 58 (100.0%) |
| 6 to 11 Years | 298 (100.0%) | 137 (100.0%) |
| 12 to 14 Years | 52 (100.0%) | 110 (100.0%) |
| 15 Years | 92 (100.0%) | 19 (100.0%) |
| 16 and 17 Years | 105 (100.0%) | 21 (100.0%) |
| 18 to 24 Years | 94 (100.0%) | 151 (100.0%) |
| 25 to 34 Years | 386 (97.5%) | 728 (100.0%) |
| 35 to 44 Years | 345 (100.0%) | 399 (100.0%) |
| 45 to 54 Years | 215 (95.1%) | 139 (100.0%) |
| 55 to 64 Years | 177 (100.0%) | 261 (96.7%) |
| 65 to 74 Years | 309 (96.9%) | 210 (100.0%) |
| 75 Years and over | 33 (61.1%) | 24 (68.6%) |
| Total | 2,391 (97.9%) | 2,477 (99.2%) |
Income Below Poverty Among Married-Couple Families in Oak Point
The poverty statistics for married-couple families in Oak Point show that 0.8% or 8 of the total 1,050 families live below the poverty line. Families with no children have the highest poverty rate of 1.5%, comprising of 8 families. On the other hand, families with 1 or 2 children have the lowest poverty rate of 0.0%, which includes 0 families.
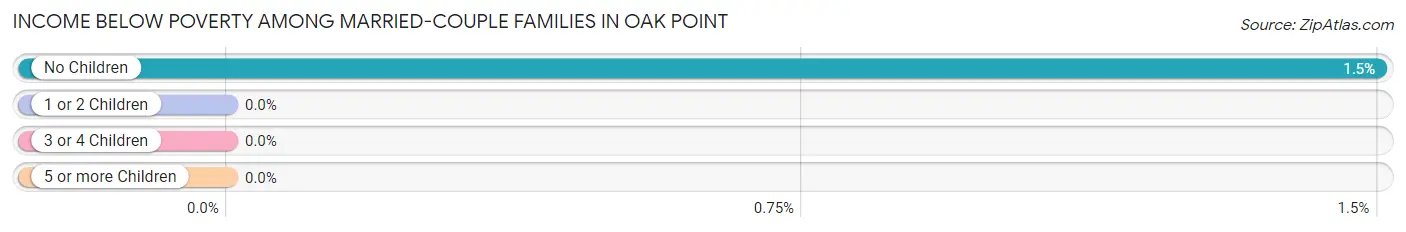
| Children | Above Poverty | Below Poverty |
| No Children | 525 (98.5%) | 8 (1.5%) |
| 1 or 2 Children | 374 (100.0%) | 0 (0.0%) |
| 3 or 4 Children | 143 (100.0%) | 0 (0.0%) |
| 5 or more Children | 0 (0.0%) | 0 (0.0%) |
| Total | 1,042 (99.2%) | 8 (0.8%) |
Income Below Poverty Among Single-Parent Households in Oak Point
| Children | Single Father | Single Mother |
| No Children | 0 (0.0%) | 0 (0.0%) |
| 1 or 2 Children | 0 (0.0%) | 0 (0.0%) |
| 3 or 4 Children | 0 (0.0%) | 0 (0.0%) |
| 5 or more Children | 0 (0.0%) | 0 (0.0%) |
| Total | 0 (0.0%) | 0 (0.0%) |
Income Below Poverty Among Married-Couple vs Single-Parent Households in Oak Point
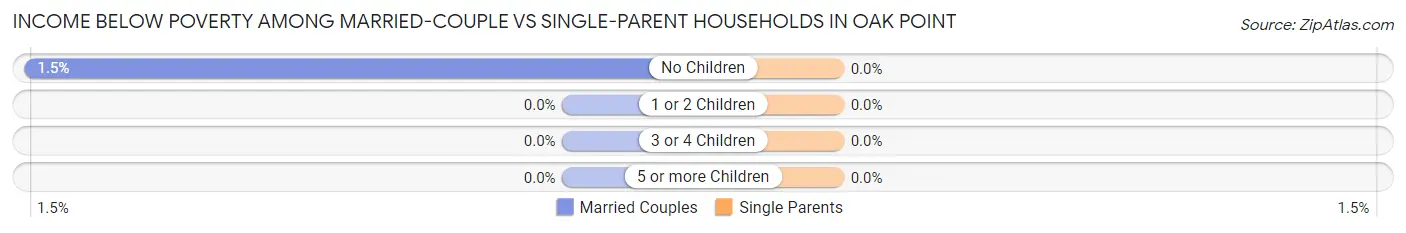
| Children | Married-Couple Families | Single-Parent Households |
| No Children | 8 (1.5%) | 0 (0.0%) |
| 1 or 2 Children | 0 (0.0%) | 0 (0.0%) |
| 3 or 4 Children | 0 (0.0%) | 0 (0.0%) |
| 5 or more Children | 0 (0.0%) | 0 (0.0%) |
| Total | 8 (0.8%) | 0 (0.0%) |
Race in Oak Point
The most populous races in Oak Point are White / Caucasian (3,823 | 77.1%), Hispanic or Latino (1,341 | 27.1%), and Two or more Races (766 | 15.4%).
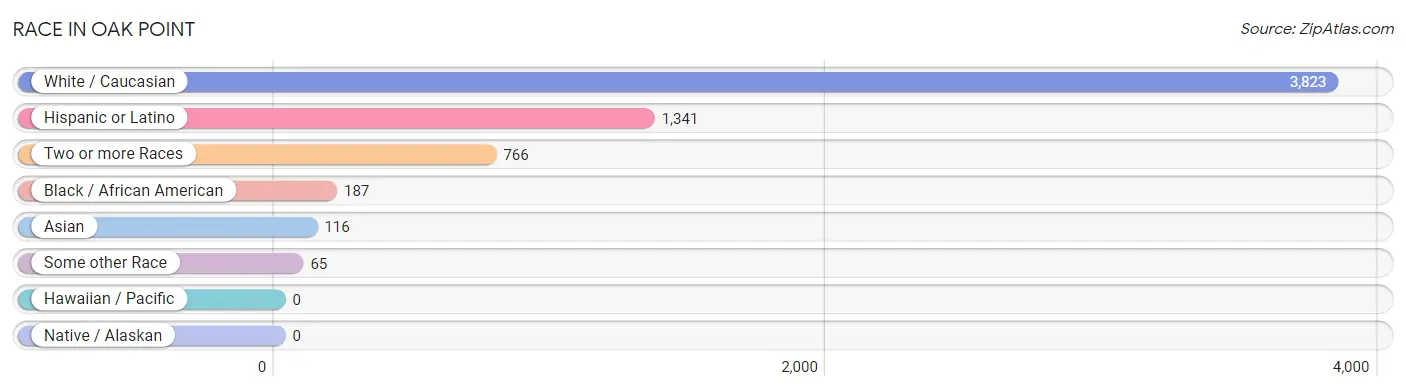
| Race | # Population | % Population |
| Asian | 116 | 2.3% |
| Black / African American | 187 | 3.8% |
| Hawaiian / Pacific | 0 | 0.0% |
| Hispanic or Latino | 1,341 | 27.1% |
| Native / Alaskan | 0 | 0.0% |
| White / Caucasian | 3,823 | 77.1% |
| Two or more Races | 766 | 15.4% |
| Some other Race | 65 | 1.3% |
| Total | 4,957 | 100.0% |
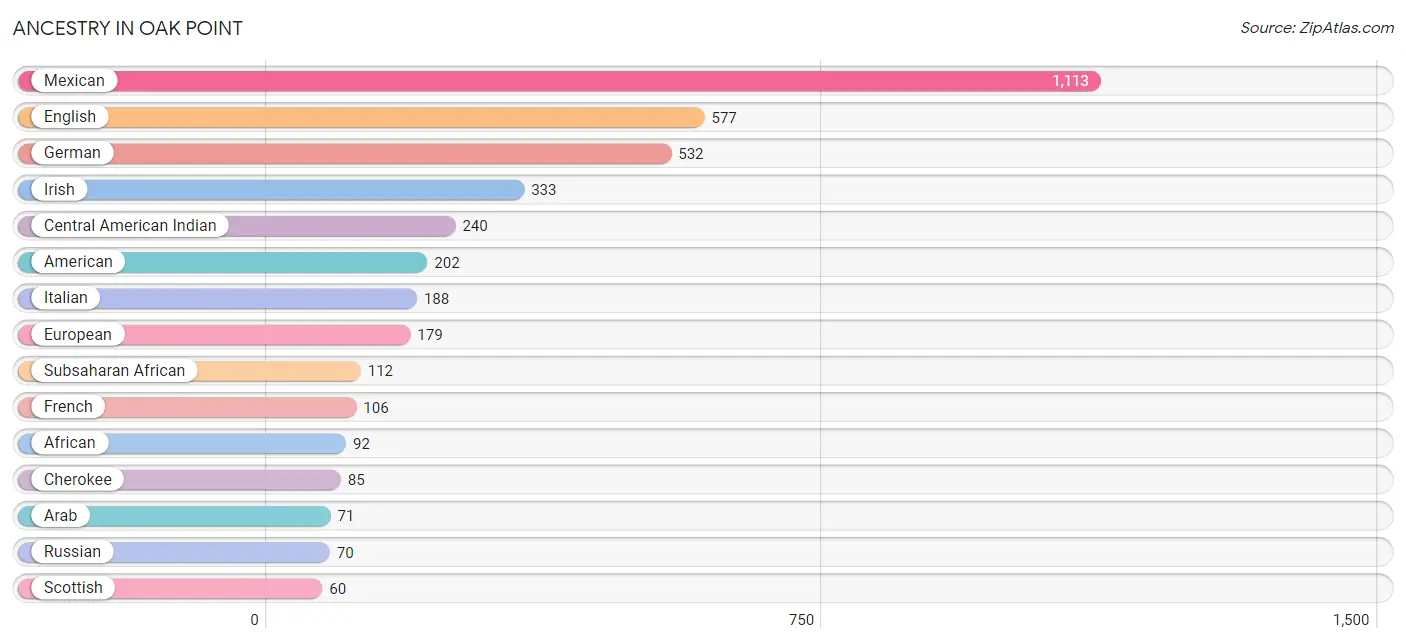
Ancestry in Oak Point
The most populous ancestries reported in Oak Point are Mexican (1,113 | 22.5%), English (577 | 11.6%), German (532 | 10.7%), Irish (333 | 6.7%), and Central American Indian (240 | 4.8%), together accounting for 56.4% of all Oak Point residents.
| Ancestry | # Population | % Population |
| African | 92 | 1.9% |
| American | 202 | 4.1% |
| Arab | 71 | 1.4% |
| Austrian | 11 | 0.2% |
| British | 8 | 0.2% |
| Burmese | 9 | 0.2% |
| Central American | 48 | 1.0% |
| Central American Indian | 240 | 4.8% |
| Cherokee | 85 | 1.7% |
| Choctaw | 3 | 0.1% |
| Colombian | 52 | 1.1% |
| Costa Rican | 14 | 0.3% |
| Czech | 20 | 0.4% |
| Czechoslovakian | 14 | 0.3% |
| Dutch | 8 | 0.2% |
| English | 577 | 11.6% |
| European | 179 | 3.6% |
| French | 106 | 2.1% |
| German | 532 | 10.7% |
| Greek | 45 | 0.9% |
| Guatemalan | 34 | 0.7% |
| Iranian | 49 | 1.0% |
| Irish | 333 | 6.7% |
| Italian | 188 | 3.8% |
| Kenyan | 20 | 0.4% |
| Mexican | 1,113 | 22.5% |
| Palestinian | 15 | 0.3% |
| Polish | 13 | 0.3% |
| Portuguese | 13 | 0.3% |
| Russian | 70 | 1.4% |
| Scandinavian | 7 | 0.1% |
| Scotch-Irish | 12 | 0.2% |
| Scottish | 60 | 1.2% |
| South American | 52 | 1.1% |
| Spanish | 27 | 0.5% |
| Sri Lankan | 14 | 0.3% |
| Subsaharan African | 112 | 2.3% |
| Swedish | 43 | 0.9% |
| Swiss | 13 | 0.3% |
| Syrian | 56 | 1.1% |
| Thai | 58 | 1.2% |
| Turkish | 16 | 0.3% | View All 42 Rows |
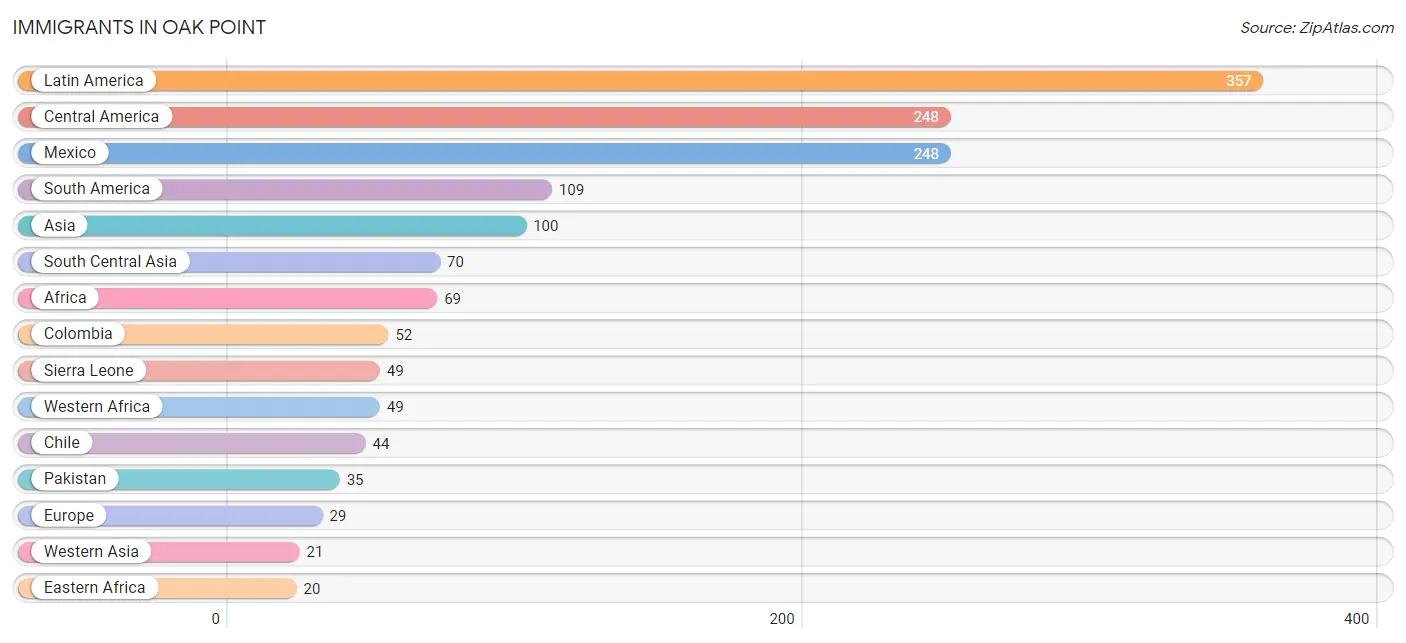
Immigrants in Oak Point
The most numerous immigrant groups reported in Oak Point came from Latin America (357 | 7.2%), Central America (248 | 5.0%), Mexico (248 | 5.0%), South America (109 | 2.2%), and Asia (100 | 2.0%), together accounting for 21.4% of all Oak Point residents.
| Immigration Origin | # Population | % Population |
| Africa | 69 | 1.4% |
| Asia | 100 | 2.0% |
| Brazil | 13 | 0.3% |
| Canada | 8 | 0.2% |
| Central America | 248 | 5.0% |
| Chile | 44 | 0.9% |
| Colombia | 52 | 1.1% |
| Eastern Africa | 20 | 0.4% |
| Eastern Asia | 9 | 0.2% |
| England | 13 | 0.3% |
| Europe | 29 | 0.6% |
| Germany | 16 | 0.3% |
| India | 19 | 0.4% |
| Iran | 16 | 0.3% |
| Israel | 15 | 0.3% |
| Kenya | 20 | 0.4% |
| Korea | 9 | 0.2% |
| Latin America | 357 | 7.2% |
| Mexico | 248 | 5.0% |
| Northern Europe | 13 | 0.3% |
| Pakistan | 35 | 0.7% |
| Sierra Leone | 49 | 1.0% |
| South America | 109 | 2.2% |
| South Central Asia | 70 | 1.4% |
| Western Africa | 49 | 1.0% |
| Western Asia | 21 | 0.4% |
| Western Europe | 16 | 0.3% | View All 27 Rows |
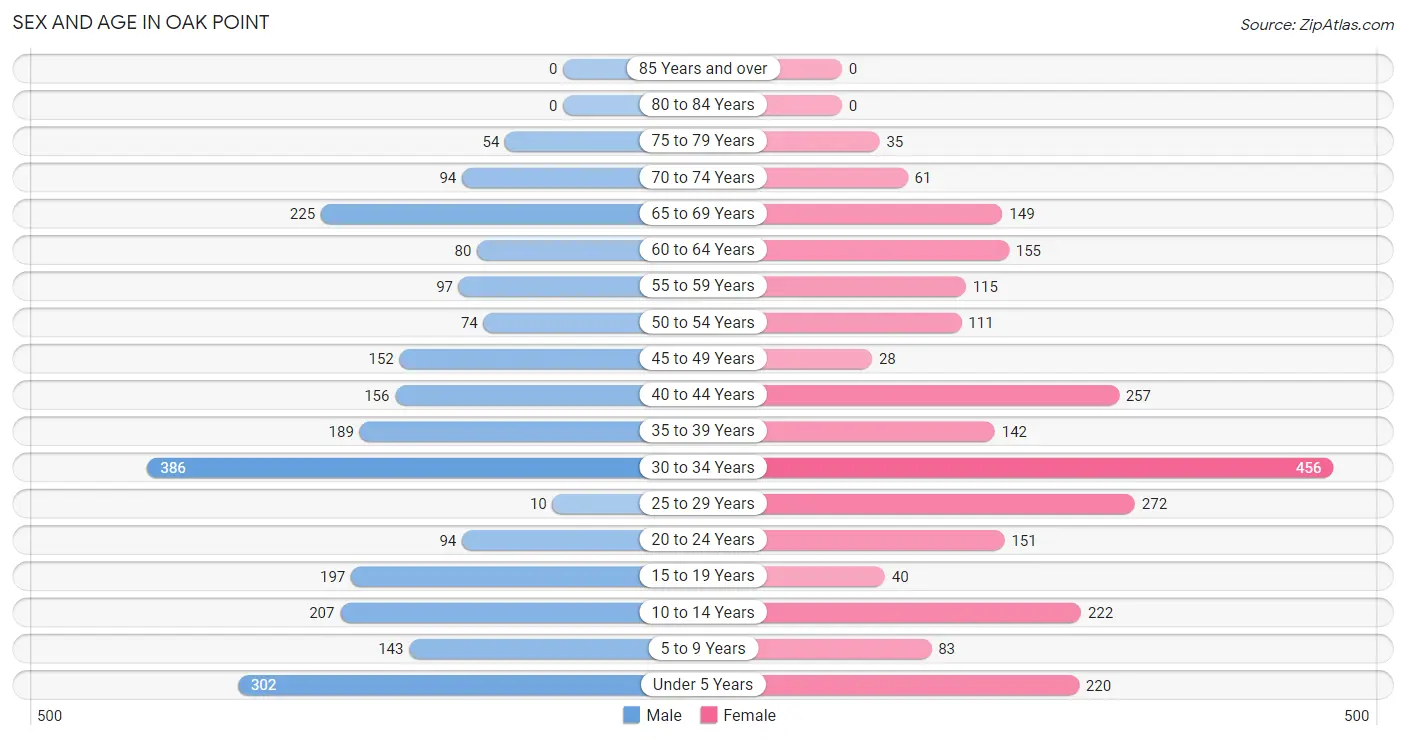
Sex and Age in Oak Point
Sex and Age in Oak Point
The most populous age groups in Oak Point are 30 to 34 Years (386 | 15.7%) for men and 30 to 34 Years (456 | 18.3%) for women.
| Age Bracket | Male | Female |
| Under 5 Years | 302 (12.3%) | 220 (8.8%) |
| 5 to 9 Years | 143 (5.8%) | 83 (3.3%) |
| 10 to 14 Years | 207 (8.4%) | 222 (8.9%) |
| 15 to 19 Years | 197 (8.0%) | 40 (1.6%) |
| 20 to 24 Years | 94 (3.8%) | 151 (6.0%) |
| 25 to 29 Years | 10 (0.4%) | 272 (10.9%) |
| 30 to 34 Years | 386 (15.7%) | 456 (18.3%) |
| 35 to 39 Years | 189 (7.7%) | 142 (5.7%) |
| 40 to 44 Years | 156 (6.3%) | 257 (10.3%) |
| 45 to 49 Years | 152 (6.2%) | 28 (1.1%) |
| 50 to 54 Years | 74 (3.0%) | 111 (4.4%) |
| 55 to 59 Years | 97 (3.9%) | 115 (4.6%) |
| 60 to 64 Years | 80 (3.3%) | 155 (6.2%) |
| 65 to 69 Years | 225 (9.1%) | 149 (6.0%) |
| 70 to 74 Years | 94 (3.8%) | 61 (2.4%) |
| 75 to 79 Years | 54 (2.2%) | 35 (1.4%) |
| 80 to 84 Years | 0 (0.0%) | 0 (0.0%) |
| 85 Years and over | 0 (0.0%) | 0 (0.0%) |
| Total | 2,460 (100.0%) | 2,497 (100.0%) |
Families and Households in Oak Point
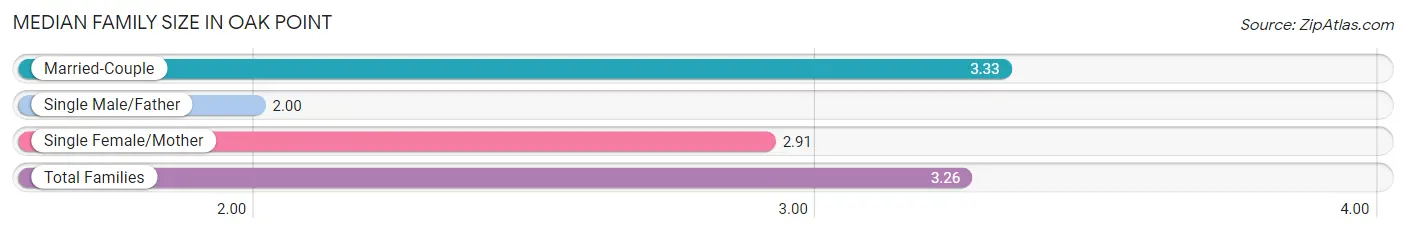
Median Family Size in Oak Point
The median family size in Oak Point is 3.26 persons per family, with married-couple families (1,050 | 84.3%) accounting for the largest median family size of 3.33 persons per family. On the other hand, single male/father families (4 | 0.3%) represent the smallest median family size with 2.00 persons per family.
| Family Type | # Families | Family Size |
| Married-Couple | 1,050 (84.3%) | 3.33 |
| Single Male/Father | 4 (0.3%) | 2.00 |
| Single Female/Mother | 192 (15.4%) | 2.91 |
| Total Families | 1,246 (100.0%) | 3.26 |
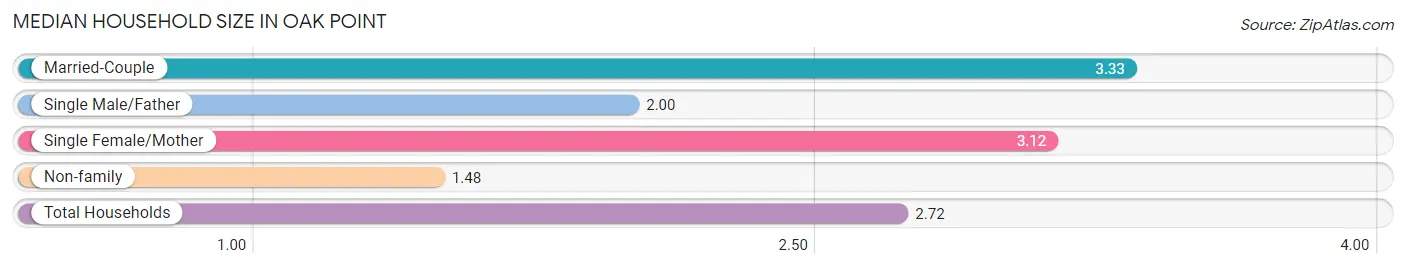
Median Household Size in Oak Point
The median household size in Oak Point is 2.72 persons per household, with married-couple households (1,050 | 57.7%) accounting for the largest median household size of 3.33 persons per household. non-family households (575 | 31.6%) represent the smallest median household size with 1.48 persons per household.
| Household Type | # Households | Household Size |
| Married-Couple | 1,050 (57.7%) | 3.33 |
| Single Male/Father | 4 (0.2%) | 2.00 |
| Single Female/Mother | 192 (10.5%) | 3.12 |
| Non-family | 575 (31.6%) | 1.48 |
| Total Households | 1,821 (100.0%) | 2.72 |
Household Size by Marriage Status in Oak Point
Out of a total of 1,821 households in Oak Point, 1,246 (68.4%) are family households, while 575 (31.6%) are nonfamily households. The most numerous type of family households are 2-person households, comprising 452, and the most common type of nonfamily households are 1-person households, comprising 378.
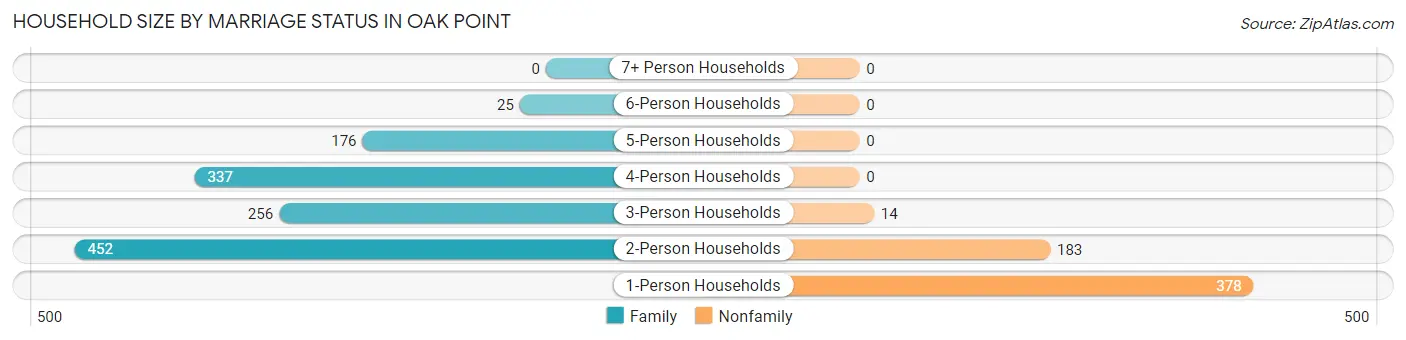
| Household Size | Family Households | Nonfamily Households |
| 1-Person Households | - | 378 (20.8%) |
| 2-Person Households | 452 (24.8%) | 183 (10.1%) |
| 3-Person Households | 256 (14.1%) | 14 (0.8%) |
| 4-Person Households | 337 (18.5%) | 0 (0.0%) |
| 5-Person Households | 176 (9.7%) | 0 (0.0%) |
| 6-Person Households | 25 (1.4%) | 0 (0.0%) |
| 7+ Person Households | 0 (0.0%) | 0 (0.0%) |
| Total | 1,246 (68.4%) | 575 (31.6%) |
Female Fertility in Oak Point
Fertility by Age in Oak Point
Average fertility rate in Oak Point is 82.0 births per 1,000 women. Women in the age bracket of 35 to 50 years have the highest fertility rate with 158.0 births per 1,000 women. Women in the age bracket of 35 to 50 years acount for 63.1% of all women with births.
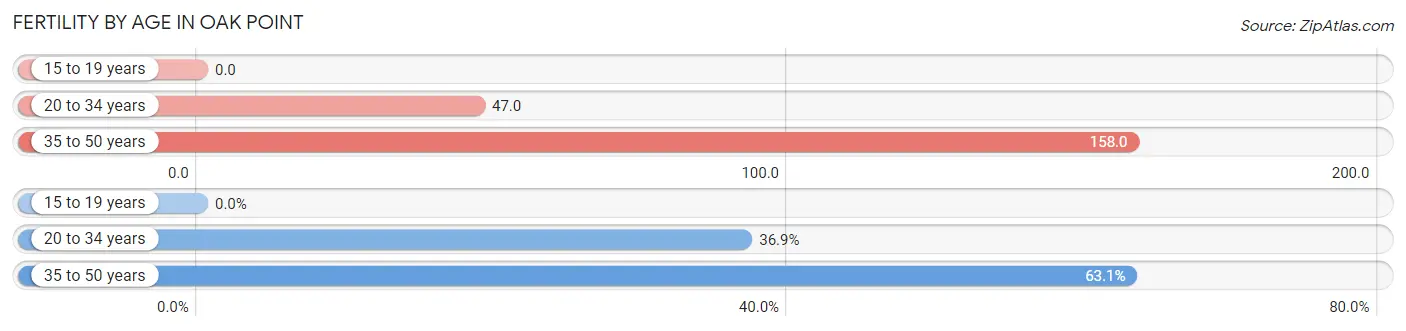
| Age Bracket | Women with Births | Births / 1,000 Women |
| 15 to 19 years | 0 (0.0%) | 0.0 |
| 20 to 34 years | 41 (36.9%) | 47.0 |
| 35 to 50 years | 70 (63.1%) | 158.0 |
| Total | 111 (100.0%) | 82.0 |
Fertility by Age by Marriage Status in Oak Point
88.3% of women with births (111) in Oak Point are married. The highest percentage of unmarried women with births falls into 20 to 34 years age bracket with 31.7% of them unmarried at the time of birth, while the lowest percentage of unmarried women with births belong to 35 to 50 years age bracket with 0.0% of them unmarried.
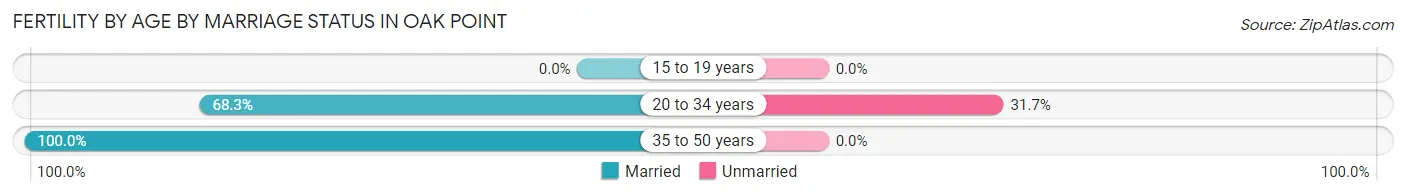
| Age Bracket | Married | Unmarried |
| 15 to 19 years | 0 (0.0%) | 0 (0.0%) |
| 20 to 34 years | 28 (68.3%) | 13 (31.7%) |
| 35 to 50 years | 70 (100.0%) | 0 (0.0%) |
| Total | 98 (88.3%) | 13 (11.7%) |
Fertility by Education in Oak Point
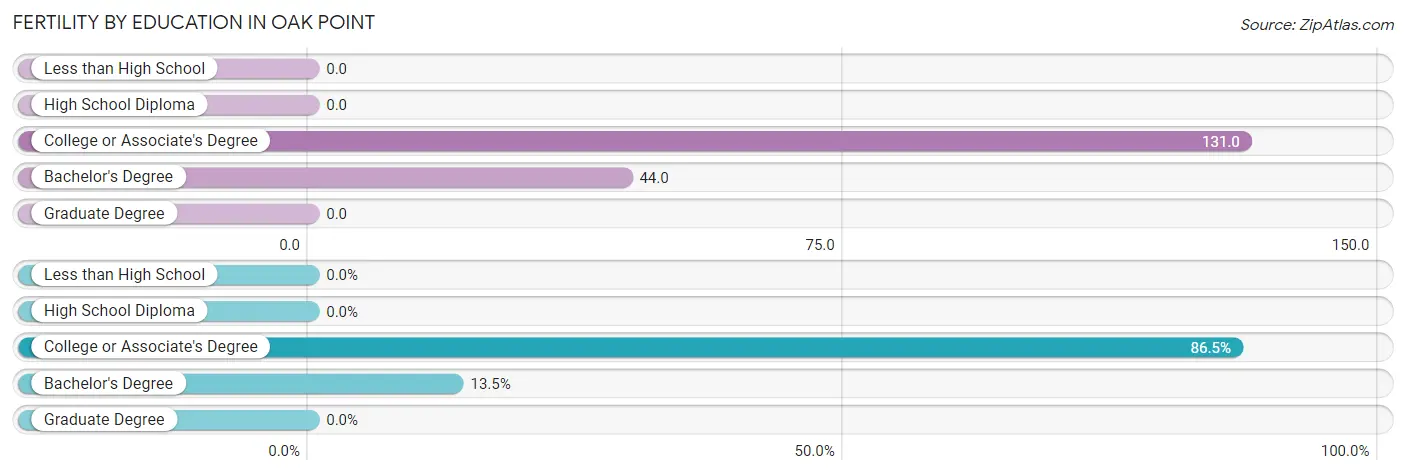
| Educational Attainment | Women with Births | Births / 1,000 Women |
| Less than High School | 0 (0.0%) | 0.0 |
| High School Diploma | 0 (0.0%) | 0.0 |
| College or Associate's Degree | 96 (86.5%) | 131.0 |
| Bachelor's Degree | 15 (13.5%) | 44.0 |
| Graduate Degree | 0 (0.0%) | 0.0 |
| Total | 111 (100.0%) | 82.0 |
Fertility by Education by Marriage Status in Oak Point
11.7% of women with births in Oak Point are unmarried. Women with the educational attainment of bachelor's degree are most likely to be married with 100.0% of them married at childbirth, while women with the educational attainment of college or associate's degree are least likely to be married with 13.5% of them unmarried at childbirth.
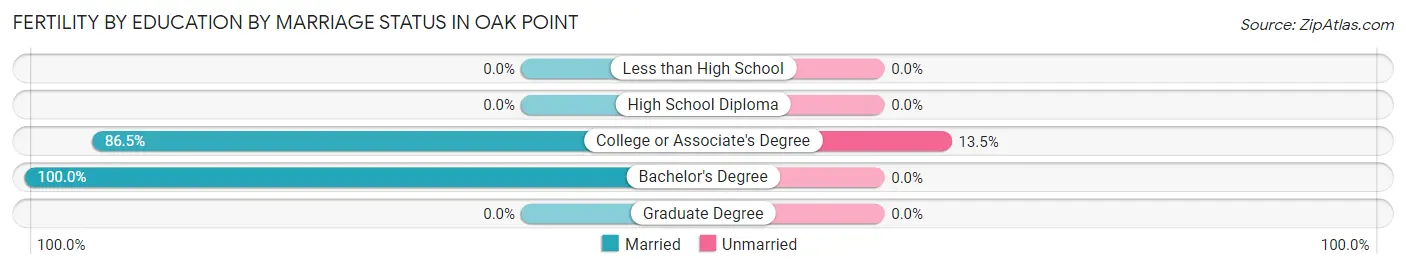
| Educational Attainment | Married | Unmarried |
| Less than High School | 0 (0.0%) | 0 (0.0%) |
| High School Diploma | 0 (0.0%) | 0 (0.0%) |
| College or Associate's Degree | 83 (86.5%) | 13 (13.5%) |
| Bachelor's Degree | 15 (100.0%) | 0 (0.0%) |
| Graduate Degree | 0 (0.0%) | 0 (0.0%) |
| Total | 98 (88.3%) | 13 (11.7%) |
Employment Characteristics in Oak Point
Employment by Class of Employer in Oak Point
Among the 2,314 employed individuals in Oak Point, private company employees (1,664 | 71.9%), local government employees (188 | 8.1%), and state government employees (168 | 7.3%) make up the most common classes of employment.
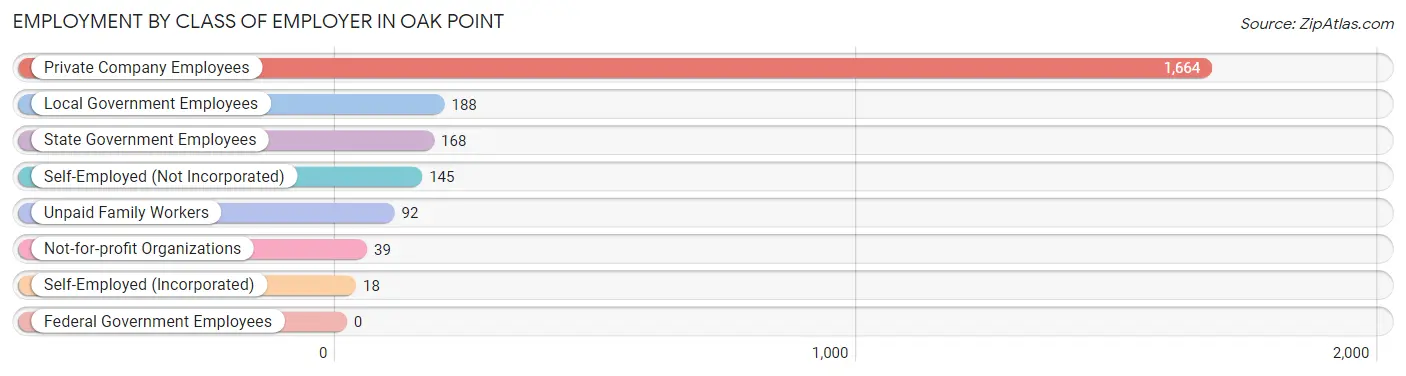
| Employer Class | # Employees | % Employees |
| Private Company Employees | 1,664 | 71.9% |
| Self-Employed (Incorporated) | 18 | 0.8% |
| Self-Employed (Not Incorporated) | 145 | 6.3% |
| Not-for-profit Organizations | 39 | 1.7% |
| Local Government Employees | 188 | 8.1% |
| State Government Employees | 168 | 7.3% |
| Federal Government Employees | 0 | 0.0% |
| Unpaid Family Workers | 92 | 4.0% |
| Total | 2,314 | 100.0% |
Employment Status by Age in Oak Point
According to the labor force statistics for Oak Point, out of the total population over 16 years of age (3,669), 69.8% or 2,561 individuals are in the labor force, with 1.5% or 38 of them unemployed. The age group with the highest labor force participation rate is 20 to 24 years, with 100.0% or 245 individuals in the labor force. Within the labor force, the 60 to 64 years age range has the highest percentage of unemployed individuals, with 8.8% or 5 of them being unemployed.
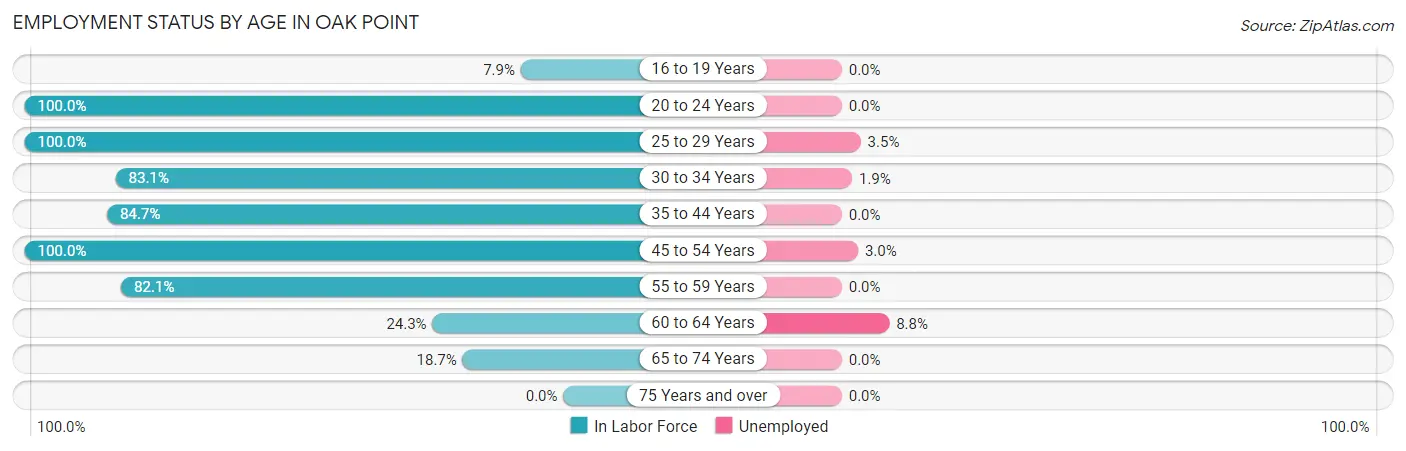
| Age Bracket | In Labor Force | Unemployed |
| 16 to 19 Years | 10 (7.9%) | 0 (0.0%) |
| 20 to 24 Years | 245 (100.0%) | 0 (0.0%) |
| 25 to 29 Years | 282 (100.0%) | 10 (3.5%) |
| 30 to 34 Years | 700 (83.1%) | 13 (1.9%) |
| 35 to 44 Years | 630 (84.7%) | 0 (0.0%) |
| 45 to 54 Years | 365 (100.0%) | 11 (3.0%) |
| 55 to 59 Years | 174 (82.1%) | 0 (0.0%) |
| 60 to 64 Years | 57 (24.3%) | 5 (8.8%) |
| 65 to 74 Years | 99 (18.7%) | 0 (0.0%) |
| 75 Years and over | 0 (0.0%) | 0 (0.0%) |
| Total | 2,561 (69.8%) | 38 (1.5%) |
Employment Status by Educational Attainment in Oak Point
According to labor force statistics for Oak Point, 82.4% of individuals (2,208) out of the total population between 25 and 64 years of age (2,680) are in the labor force, with 1.8% or 40 of them being unemployed. The group with the highest labor force participation rate are those with the educational attainment of less than high school, with 92.9% or 118 individuals in the labor force. Within the labor force, individuals with high school diploma education have the highest percentage of unemployment, with 4.7% or 13 of them being unemployed.
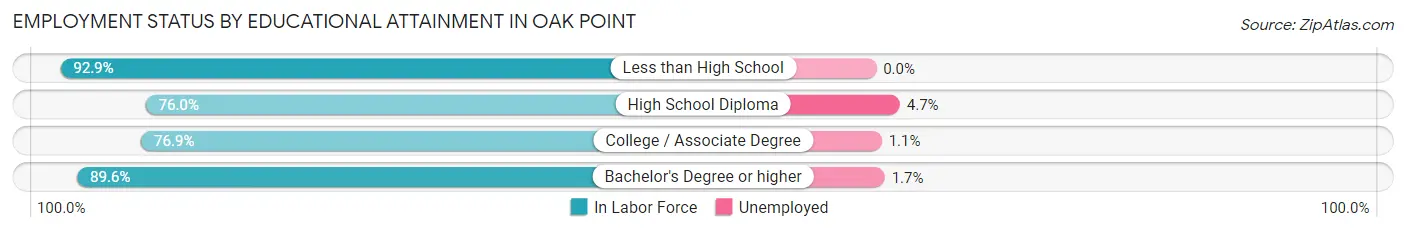
| Educational Attainment | In Labor Force | Unemployed |
| Less than High School | 118 (92.9%) | 0 (0.0%) |
| High School Diploma | 279 (76.0%) | 17 (4.7%) |
| College / Associate Degree | 894 (76.9%) | 13 (1.1%) |
| Bachelor's Degree or higher | 917 (89.6%) | 17 (1.7%) |
| Total | 2,208 (82.4%) | 48 (1.8%) |
Employment Occupations by Sex in Oak Point
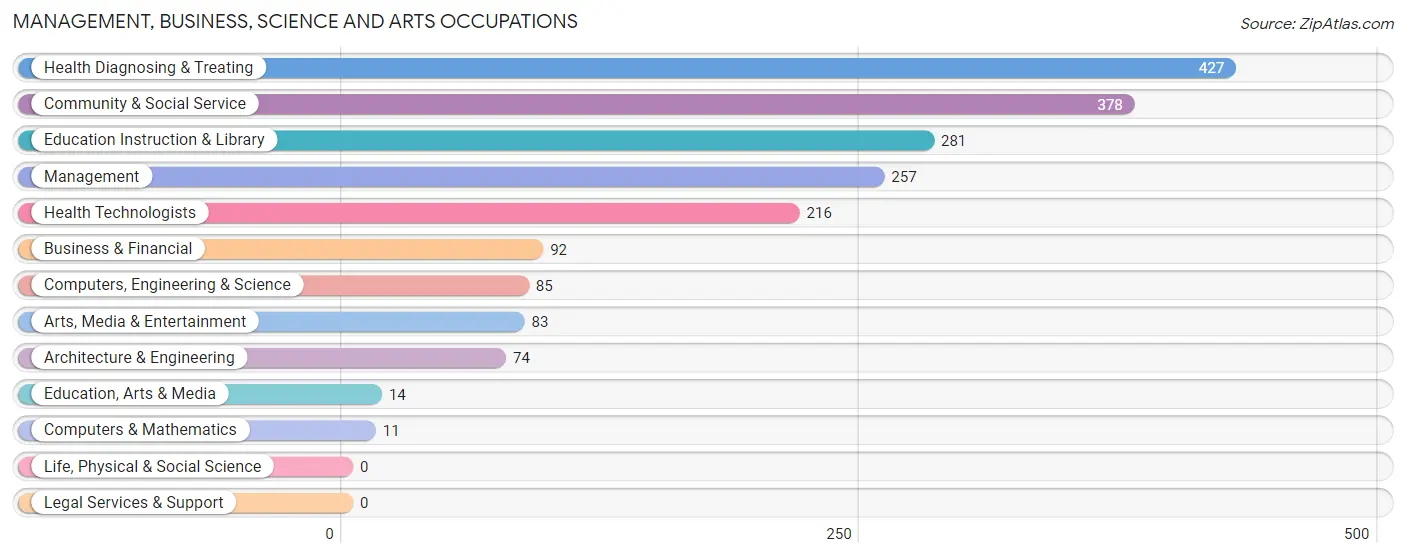
Management, Business, Science and Arts Occupations
The most common Management, Business, Science and Arts occupations in Oak Point are Health Diagnosing & Treating (427 | 16.9%), Community & Social Service (378 | 15.0%), Education Instruction & Library (281 | 11.1%), Management (257 | 10.2%), and Health Technologists (216 | 8.6%).
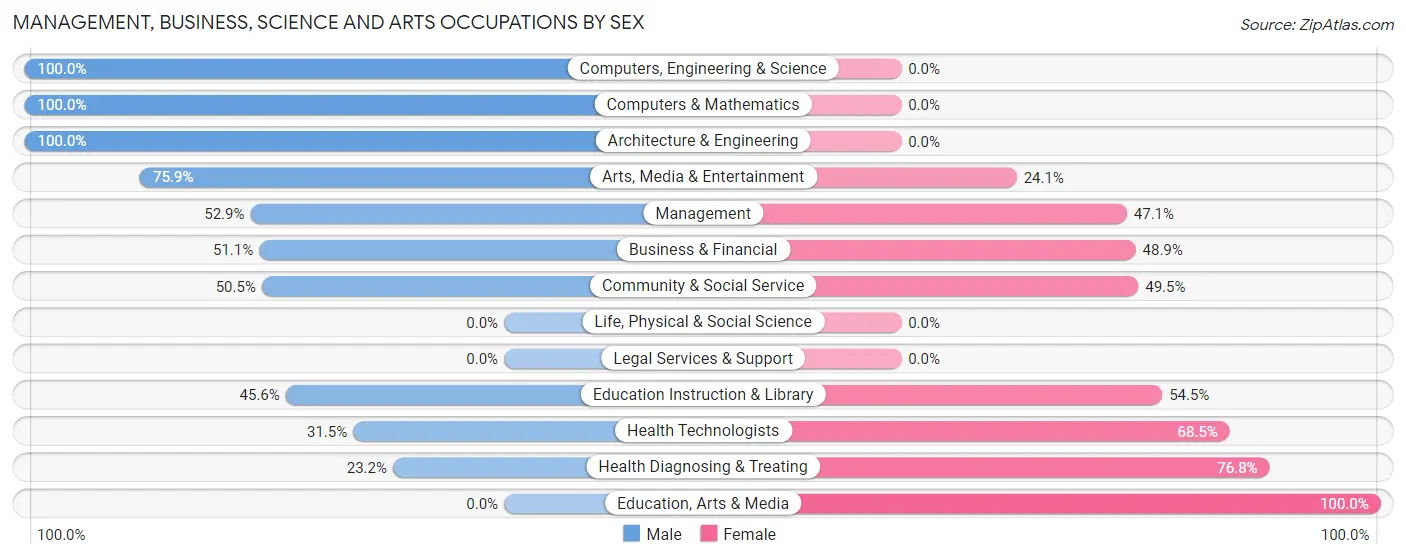
Management, Business, Science and Arts Occupations by Sex
Within the Management, Business, Science and Arts occupations in Oak Point, the most male-oriented occupations are Computers, Engineering & Science (100.0%), Computers & Mathematics (100.0%), and Architecture & Engineering (100.0%), while the most female-oriented occupations are Education, Arts & Media (100.0%), Health Diagnosing & Treating (76.8%), and Health Technologists (68.5%).
| Occupation | Male | Female |
| Management | 136 (52.9%) | 121 (47.1%) |
| Business & Financial | 47 (51.1%) | 45 (48.9%) |
| Computers, Engineering & Science | 85 (100.0%) | 0 (0.0%) |
| Computers & Mathematics | 11 (100.0%) | 0 (0.0%) |
| Architecture & Engineering | 74 (100.0%) | 0 (0.0%) |
| Life, Physical & Social Science | 0 (0.0%) | 0 (0.0%) |
| Community & Social Service | 191 (50.5%) | 187 (49.5%) |
| Education, Arts & Media | 0 (0.0%) | 14 (100.0%) |
| Legal Services & Support | 0 (0.0%) | 0 (0.0%) |
| Education Instruction & Library | 128 (45.6%) | 153 (54.4%) |
| Arts, Media & Entertainment | 63 (75.9%) | 20 (24.1%) |
| Health Diagnosing & Treating | 99 (23.2%) | 328 (76.8%) |
| Health Technologists | 68 (31.5%) | 148 (68.5%) |
| Total (Category) | 558 (45.0%) | 681 (55.0%) |
| Total (Overall) | 1,195 (47.4%) | 1,328 (52.6%) |
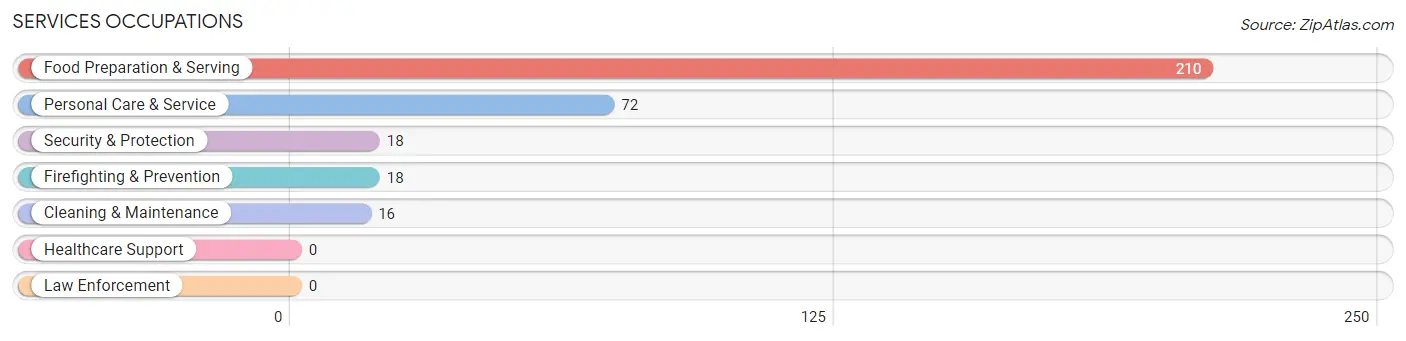
Services Occupations
The most common Services occupations in Oak Point are Food Preparation & Serving (210 | 8.3%), Personal Care & Service (72 | 2.9%), Security & Protection (18 | 0.7%), Firefighting & Prevention (18 | 0.7%), and Cleaning & Maintenance (16 | 0.6%).
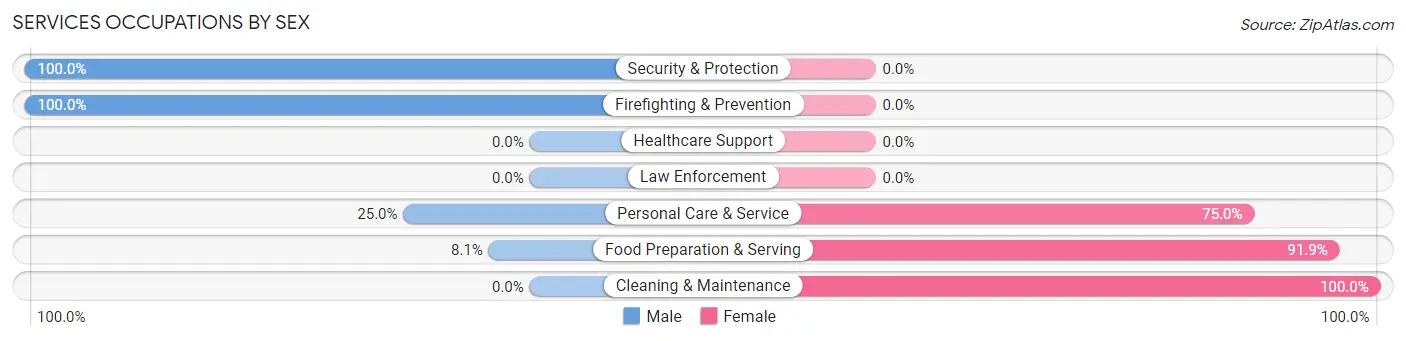
Services Occupations by Sex
Within the Services occupations in Oak Point, the most male-oriented occupations are Security & Protection (100.0%), Firefighting & Prevention (100.0%), and Personal Care & Service (25.0%), while the most female-oriented occupations are Cleaning & Maintenance (100.0%), Food Preparation & Serving (91.9%), and Personal Care & Service (75.0%).
| Occupation | Male | Female |
| Healthcare Support | 0 (0.0%) | 0 (0.0%) |
| Security & Protection | 18 (100.0%) | 0 (0.0%) |
| Firefighting & Prevention | 18 (100.0%) | 0 (0.0%) |
| Law Enforcement | 0 (0.0%) | 0 (0.0%) |
| Food Preparation & Serving | 17 (8.1%) | 193 (91.9%) |
| Cleaning & Maintenance | 0 (0.0%) | 16 (100.0%) |
| Personal Care & Service | 18 (25.0%) | 54 (75.0%) |
| Total (Category) | 53 (16.8%) | 263 (83.2%) |
| Total (Overall) | 1,195 (47.4%) | 1,328 (52.6%) |
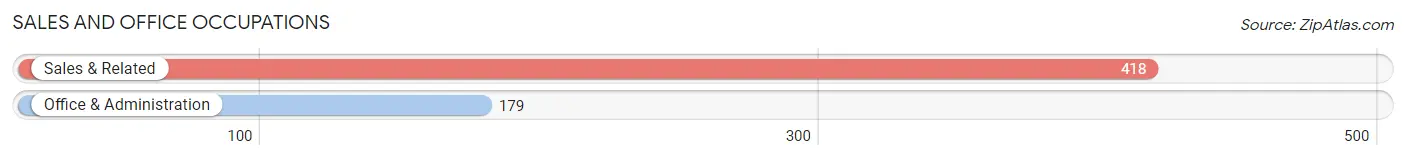
Sales and Office Occupations
The most common Sales and Office occupations in Oak Point are Sales & Related (418 | 16.6%), and Office & Administration (179 | 7.1%).
Sales and Office Occupations by Sex

| Occupation | Male | Female |
| Sales & Related | 301 (72.0%) | 117 (28.0%) |
| Office & Administration | 10 (5.6%) | 169 (94.4%) |
| Total (Category) | 311 (52.1%) | 286 (47.9%) |
| Total (Overall) | 1,195 (47.4%) | 1,328 (52.6%) |
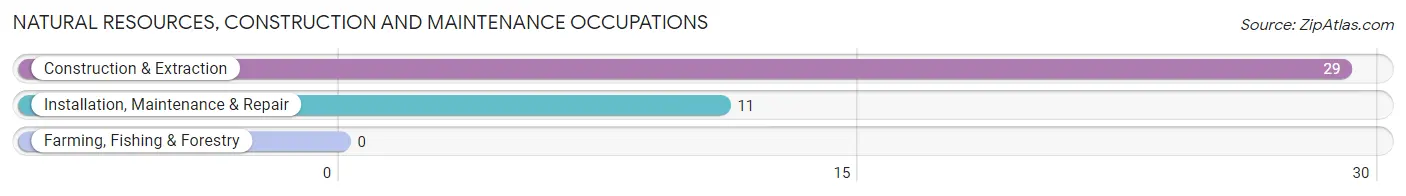
Natural Resources, Construction and Maintenance Occupations
The most common Natural Resources, Construction and Maintenance occupations in Oak Point are Construction & Extraction (29 | 1.1%), and Installation, Maintenance & Repair (11 | 0.4%).
Natural Resources, Construction and Maintenance Occupations by Sex
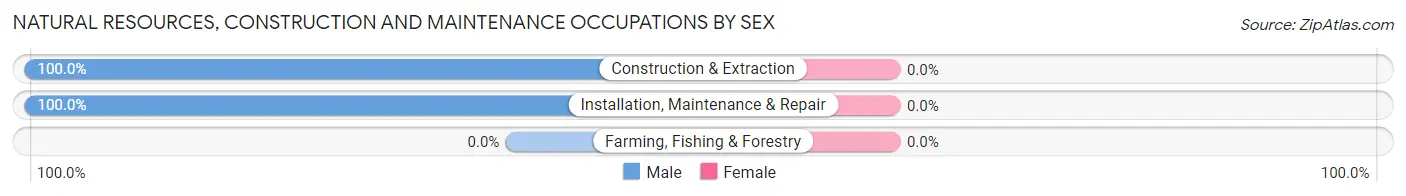
| Occupation | Male | Female |
| Farming, Fishing & Forestry | 0 (0.0%) | 0 (0.0%) |
| Construction & Extraction | 29 (100.0%) | 0 (0.0%) |
| Installation, Maintenance & Repair | 11 (100.0%) | 0 (0.0%) |
| Total (Category) | 40 (100.0%) | 0 (0.0%) |
| Total (Overall) | 1,195 (47.4%) | 1,328 (52.6%) |
Production, Transportation and Moving Occupations
The most common Production, Transportation and Moving occupations in Oak Point are Material Moving (232 | 9.2%), Transportation (58 | 2.3%), and Production (41 | 1.6%).
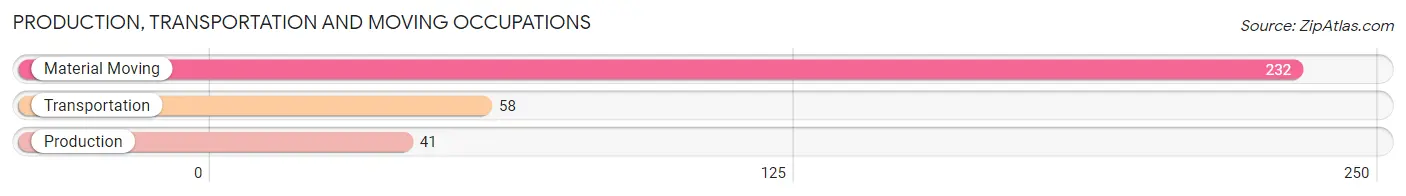
Production, Transportation and Moving Occupations by Sex
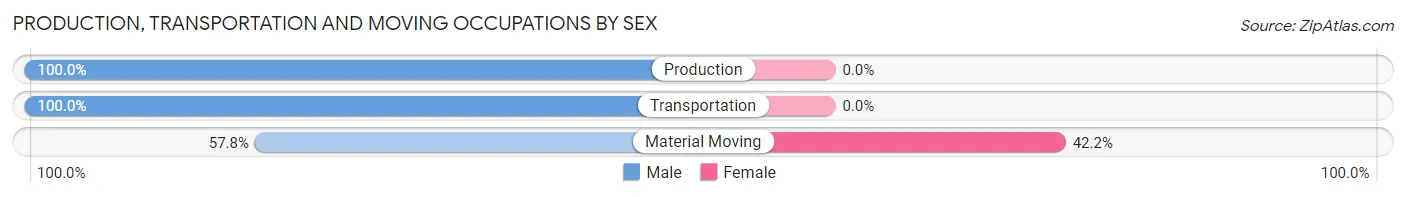
| Occupation | Male | Female |
| Production | 41 (100.0%) | 0 (0.0%) |
| Transportation | 58 (100.0%) | 0 (0.0%) |
| Material Moving | 134 (57.8%) | 98 (42.2%) |
| Total (Category) | 233 (70.4%) | 98 (29.6%) |
| Total (Overall) | 1,195 (47.4%) | 1,328 (52.6%) |
Employment Industries by Sex in Oak Point
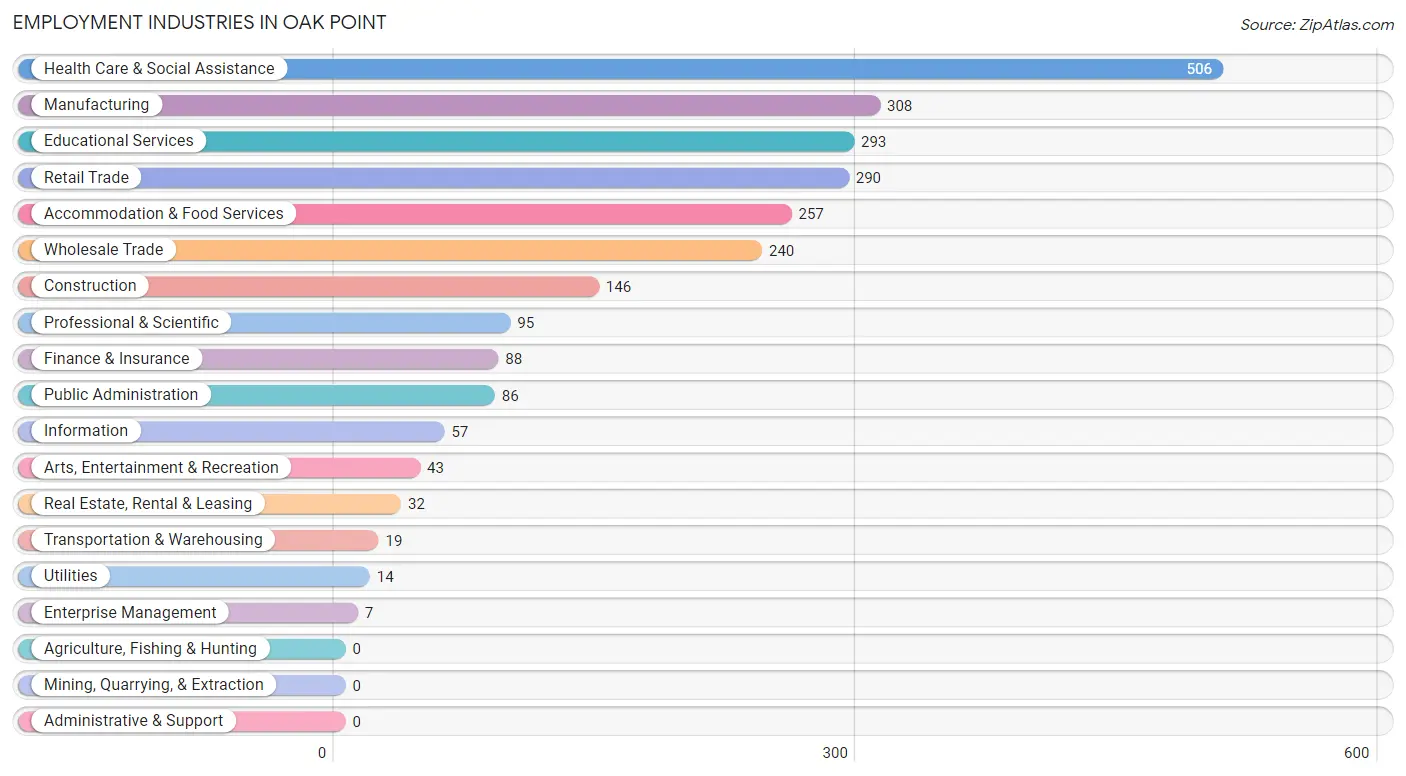
Employment Industries in Oak Point
The major employment industries in Oak Point include Health Care & Social Assistance (506 | 20.1%), Manufacturing (308 | 12.2%), Educational Services (293 | 11.6%), Retail Trade (290 | 11.5%), and Accommodation & Food Services (257 | 10.2%).
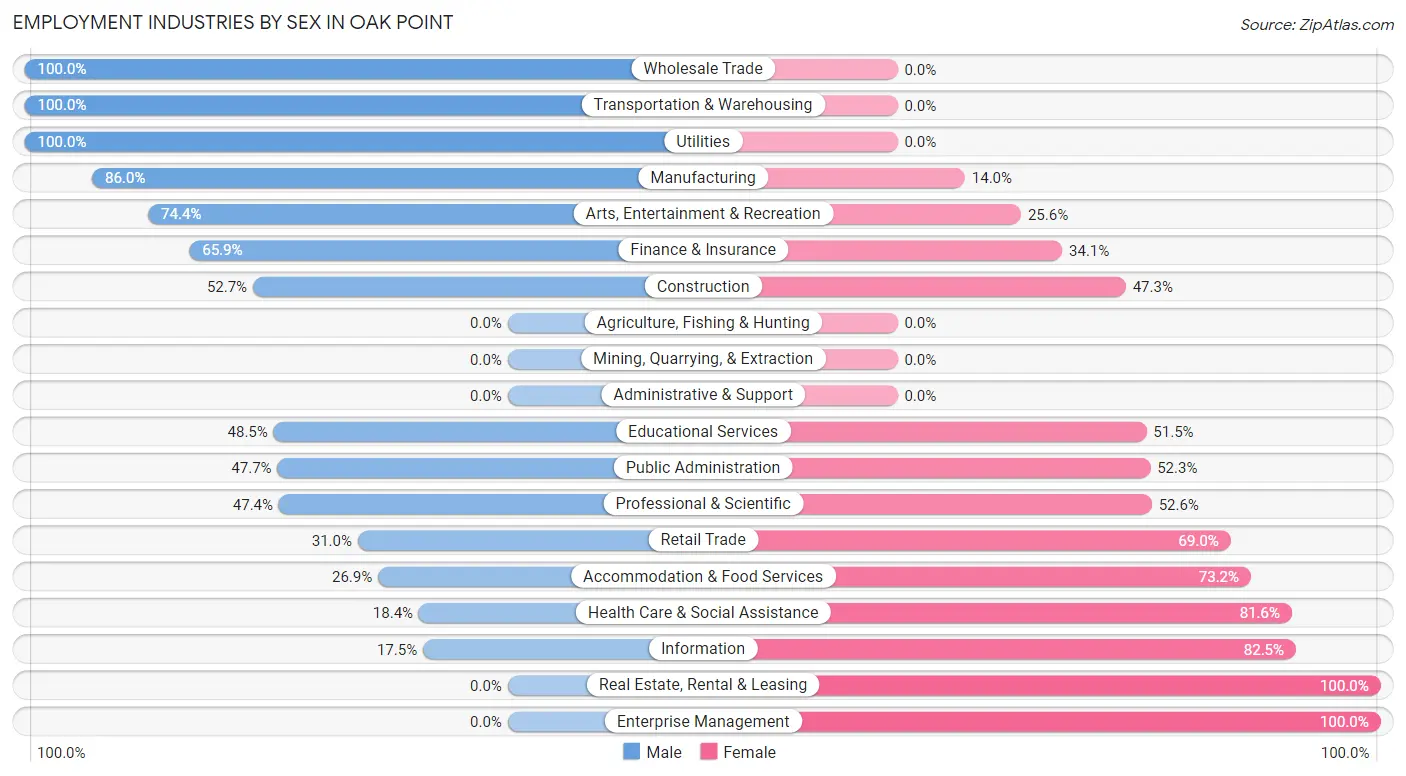
Employment Industries by Sex in Oak Point
The Oak Point industries that see more men than women are Wholesale Trade (100.0%), Transportation & Warehousing (100.0%), and Utilities (100.0%), whereas the industries that tend to have a higher number of women are Real Estate, Rental & Leasing (100.0%), Enterprise Management (100.0%), and Information (82.5%).
| Industry | Male | Female |
| Agriculture, Fishing & Hunting | 0 (0.0%) | 0 (0.0%) |
| Mining, Quarrying, & Extraction | 0 (0.0%) | 0 (0.0%) |
| Construction | 77 (52.7%) | 69 (47.3%) |
| Manufacturing | 265 (86.0%) | 43 (14.0%) |
| Wholesale Trade | 240 (100.0%) | 0 (0.0%) |
| Retail Trade | 90 (31.0%) | 200 (69.0%) |
| Transportation & Warehousing | 19 (100.0%) | 0 (0.0%) |
| Utilities | 14 (100.0%) | 0 (0.0%) |
| Information | 10 (17.5%) | 47 (82.5%) |
| Finance & Insurance | 58 (65.9%) | 30 (34.1%) |
| Real Estate, Rental & Leasing | 0 (0.0%) | 32 (100.0%) |
| Professional & Scientific | 45 (47.4%) | 50 (52.6%) |
| Enterprise Management | 0 (0.0%) | 7 (100.0%) |
| Administrative & Support | 0 (0.0%) | 0 (0.0%) |
| Educational Services | 142 (48.5%) | 151 (51.5%) |
| Health Care & Social Assistance | 93 (18.4%) | 413 (81.6%) |
| Arts, Entertainment & Recreation | 32 (74.4%) | 11 (25.6%) |
| Accommodation & Food Services | 69 (26.9%) | 188 (73.2%) |
| Public Administration | 41 (47.7%) | 45 (52.3%) |
| Total | 1,195 (47.4%) | 1,328 (52.6%) |
Education in Oak Point
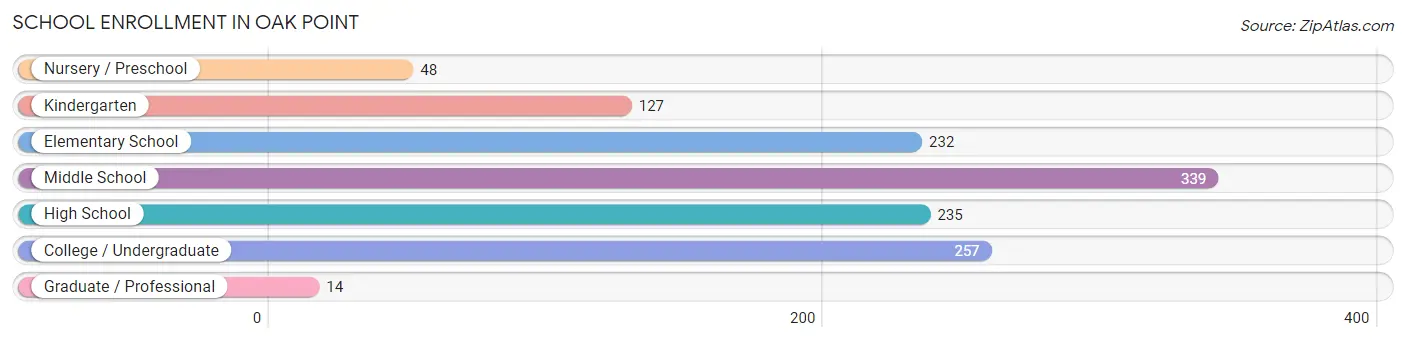
School Enrollment in Oak Point
The most common levels of schooling among the 1,252 students in Oak Point are middle school (339 | 27.1%), college / undergraduate (257 | 20.5%), and high school (235 | 18.8%).
| School Level | # Students | % Students |
| Nursery / Preschool | 48 | 3.8% |
| Kindergarten | 127 | 10.1% |
| Elementary School | 232 | 18.5% |
| Middle School | 339 | 27.1% |
| High School | 235 | 18.8% |
| College / Undergraduate | 257 | 20.5% |
| Graduate / Professional | 14 | 1.1% |
| Total | 1,252 | 100.0% |
School Enrollment by Age by Funding Source in Oak Point
Out of a total of 1,252 students who are enrolled in schools in Oak Point, 259 (20.7%) attend a private institution, while the remaining 993 (79.3%) are enrolled in public schools. The age group of 3 to 4 year olds has the highest likelihood of being enrolled in private schools, with 100 (85.5% in the age bracket) enrolled. Conversely, the age group of 20 to 24 year olds has the lowest likelihood of being enrolled in a private school, with 160 (100.0% in the age bracket) attending a public institution.
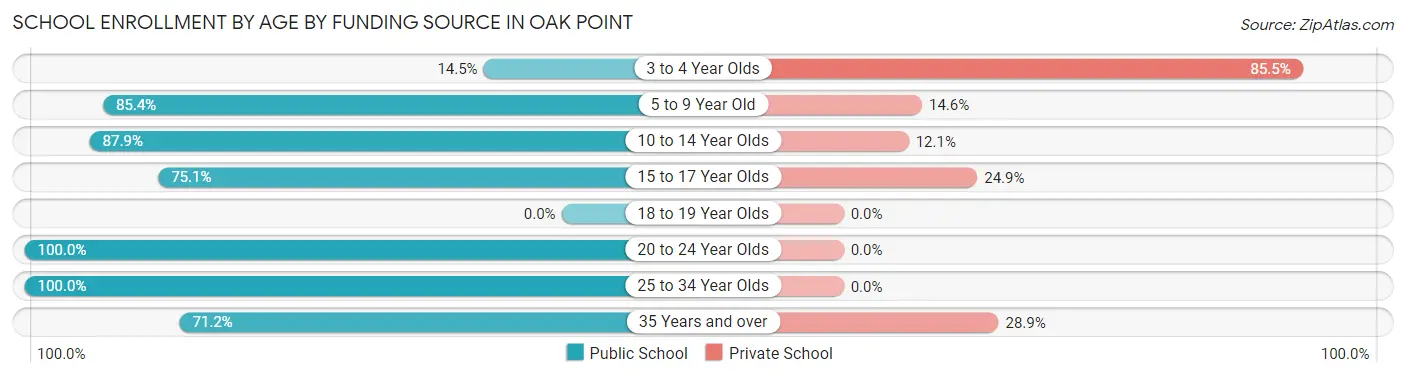
| Age Bracket | Public School | Private School |
| 3 to 4 Year Olds | 17 (14.5%) | 100 (85.5%) |
| 5 to 9 Year Old | 193 (85.4%) | 33 (14.6%) |
| 10 to 14 Year Olds | 377 (87.9%) | 52 (12.1%) |
| 15 to 17 Year Olds | 178 (75.1%) | 59 (24.9%) |
| 18 to 19 Year Olds | 0 (0.0%) | 0 (0.0%) |
| 20 to 24 Year Olds | 160 (100.0%) | 0 (0.0%) |
| 25 to 34 Year Olds | 31 (100.0%) | 0 (0.0%) |
| 35 Years and over | 37 (71.2%) | 15 (28.8%) |
| Total | 993 (79.3%) | 259 (20.7%) |
Educational Attainment by Field of Study in Oak Point
Business (233 | 17.2%), engineering (204 | 15.1%), science & technology (184 | 13.6%), education (172 | 12.7%), and liberal arts & history (119 | 8.8%) are the most common fields of study among 1,352 individuals in Oak Point who have obtained a bachelor's degree or higher.
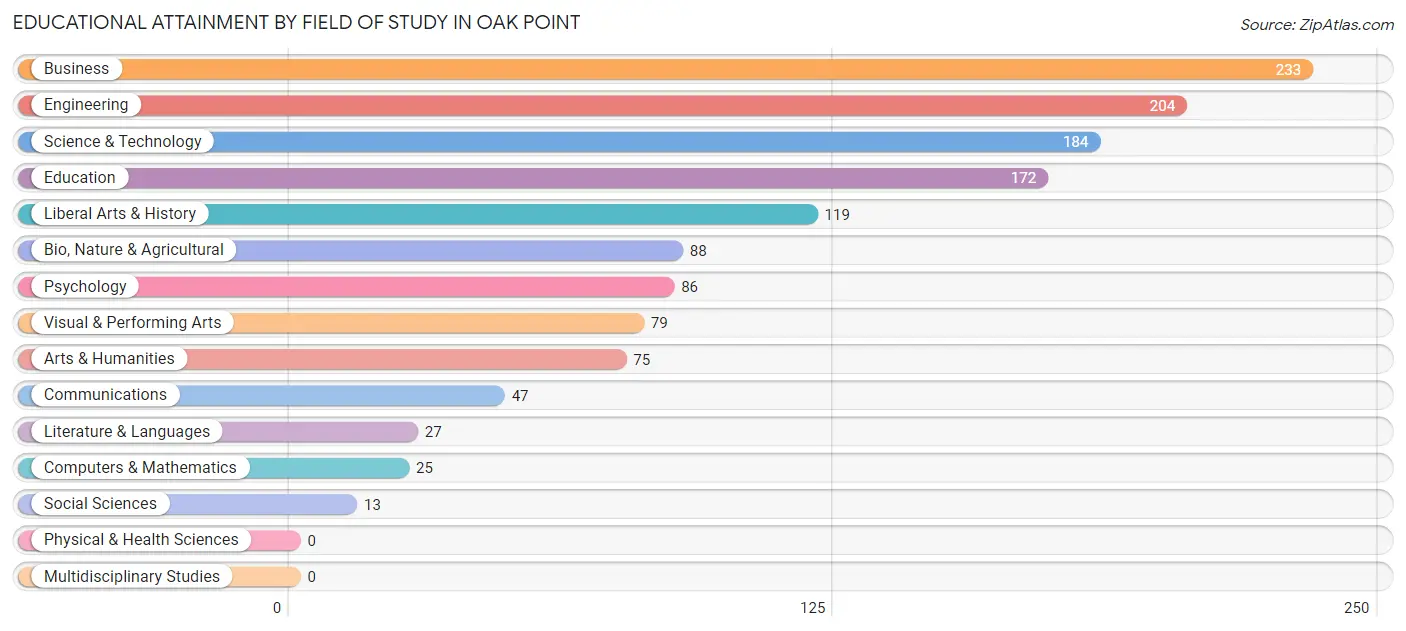
| Field of Study | # Graduates | % Graduates |
| Computers & Mathematics | 25 | 1.8% |
| Bio, Nature & Agricultural | 88 | 6.5% |
| Physical & Health Sciences | 0 | 0.0% |
| Psychology | 86 | 6.4% |
| Social Sciences | 13 | 1.0% |
| Engineering | 204 | 15.1% |
| Multidisciplinary Studies | 0 | 0.0% |
| Science & Technology | 184 | 13.6% |
| Business | 233 | 17.2% |
| Education | 172 | 12.7% |
| Literature & Languages | 27 | 2.0% |
| Liberal Arts & History | 119 | 8.8% |
| Visual & Performing Arts | 79 | 5.8% |
| Communications | 47 | 3.5% |
| Arts & Humanities | 75 | 5.6% |
| Total | 1,352 | 100.0% |
Transportation & Commute in Oak Point
Vehicle Availability by Sex in Oak Point
The most prevalent vehicle ownership categories in Oak Point are males with 2 vehicles (686, accounting for 62.2%) and females with 2 vehicles (499, making up 56.7%).
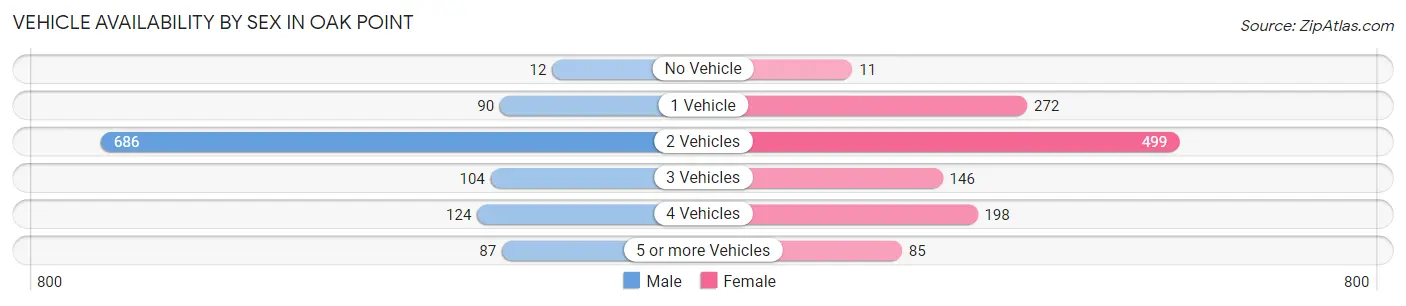
| Vehicles Available | Male | Female |
| No Vehicle | 12 (1.1%) | 11 (0.9%) |
| 1 Vehicle | 90 (8.2%) | 272 (22.5%) |
| 2 Vehicles | 686 (62.2%) | 499 (41.2%) |
| 3 Vehicles | 104 (9.4%) | 146 (12.1%) |
| 4 Vehicles | 124 (11.2%) | 198 (16.4%) |
| 5 or more Vehicles | 87 (7.9%) | 85 (7.0%) |
| Total | 1,103 (100.0%) | 1,211 (100.0%) |
Commute Time in Oak Point
The most frequently occuring commute durations in Oak Point are 45 to 59 minutes (297 commuters, 19.9%), 25 to 29 minutes (251 commuters, 16.8%), and 20 to 24 minutes (207 commuters, 13.9%).
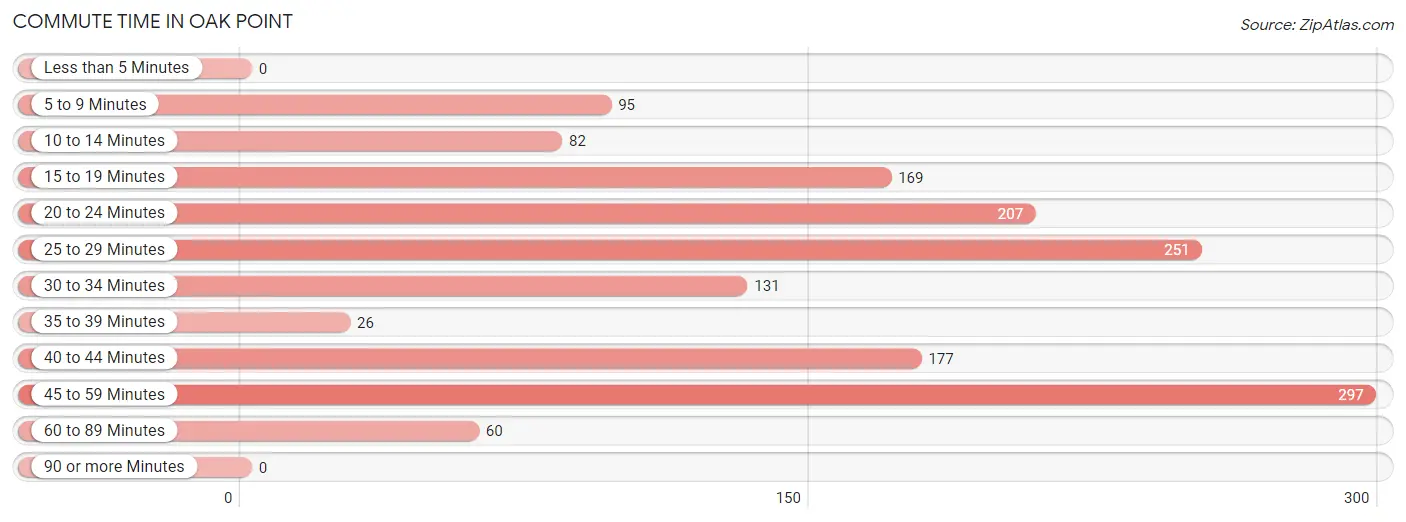
| Commute Time | # Commuters | % Commuters |
| Less than 5 Minutes | 0 | 0.0% |
| 5 to 9 Minutes | 95 | 6.4% |
| 10 to 14 Minutes | 82 | 5.5% |
| 15 to 19 Minutes | 169 | 11.3% |
| 20 to 24 Minutes | 207 | 13.9% |
| 25 to 29 Minutes | 251 | 16.8% |
| 30 to 34 Minutes | 131 | 8.8% |
| 35 to 39 Minutes | 26 | 1.7% |
| 40 to 44 Minutes | 177 | 11.8% |
| 45 to 59 Minutes | 297 | 19.9% |
| 60 to 89 Minutes | 60 | 4.0% |
| 90 or more Minutes | 0 | 0.0% |
Commute Time by Sex in Oak Point
The most common commute times in Oak Point are 45 to 59 minutes (219 commuters, 29.3%) for males and 20 to 24 minutes (155 commuters, 20.7%) for females.
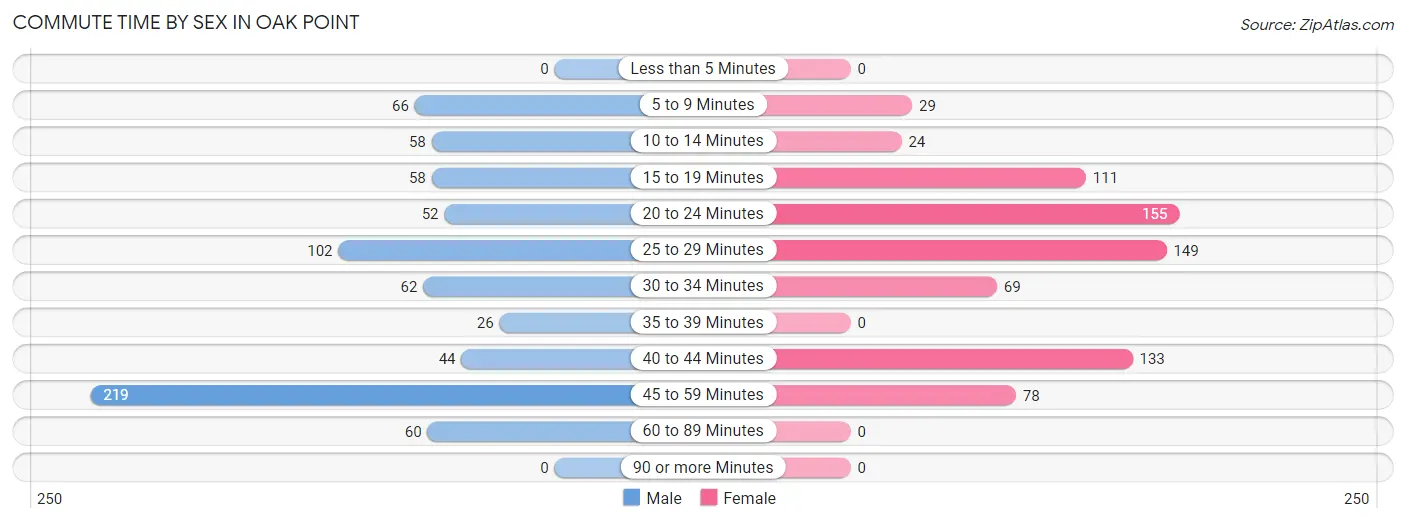
| Commute Time | Male | Female |
| Less than 5 Minutes | 0 (0.0%) | 0 (0.0%) |
| 5 to 9 Minutes | 66 (8.8%) | 29 (3.9%) |
| 10 to 14 Minutes | 58 (7.8%) | 24 (3.2%) |
| 15 to 19 Minutes | 58 (7.8%) | 111 (14.8%) |
| 20 to 24 Minutes | 52 (7.0%) | 155 (20.7%) |
| 25 to 29 Minutes | 102 (13.7%) | 149 (19.9%) |
| 30 to 34 Minutes | 62 (8.3%) | 69 (9.2%) |
| 35 to 39 Minutes | 26 (3.5%) | 0 (0.0%) |
| 40 to 44 Minutes | 44 (5.9%) | 133 (17.8%) |
| 45 to 59 Minutes | 219 (29.3%) | 78 (10.4%) |
| 60 to 89 Minutes | 60 (8.0%) | 0 (0.0%) |
| 90 or more Minutes | 0 (0.0%) | 0 (0.0%) |
Time of Departure to Work by Sex in Oak Point
The most frequent times of departure to work in Oak Point are 6:00 AM to 6:29 AM (253, 33.9%) for males and 9:00 AM to 9:59 AM (161, 21.5%) for females.
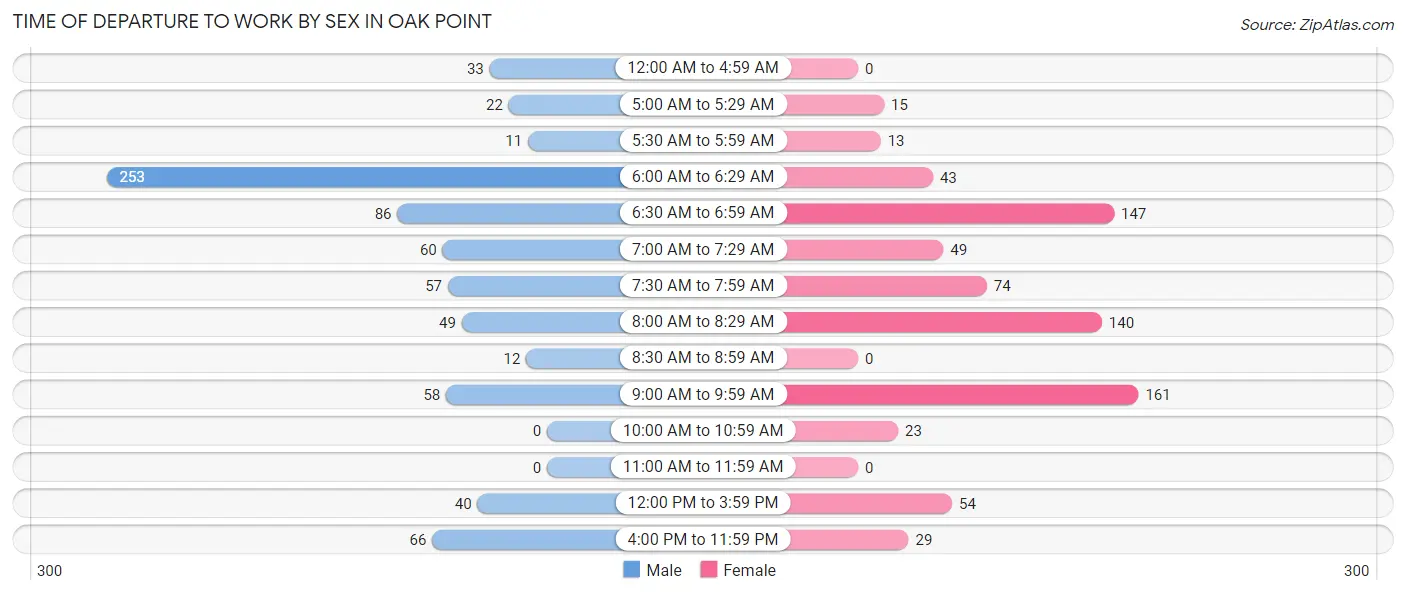
| Time of Departure | Male | Female |
| 12:00 AM to 4:59 AM | 33 (4.4%) | 0 (0.0%) |
| 5:00 AM to 5:29 AM | 22 (2.9%) | 15 (2.0%) |
| 5:30 AM to 5:59 AM | 11 (1.5%) | 13 (1.7%) |
| 6:00 AM to 6:29 AM | 253 (33.9%) | 43 (5.8%) |
| 6:30 AM to 6:59 AM | 86 (11.5%) | 147 (19.7%) |
| 7:00 AM to 7:29 AM | 60 (8.0%) | 49 (6.6%) |
| 7:30 AM to 7:59 AM | 57 (7.6%) | 74 (9.9%) |
| 8:00 AM to 8:29 AM | 49 (6.6%) | 140 (18.7%) |
| 8:30 AM to 8:59 AM | 12 (1.6%) | 0 (0.0%) |
| 9:00 AM to 9:59 AM | 58 (7.8%) | 161 (21.5%) |
| 10:00 AM to 10:59 AM | 0 (0.0%) | 23 (3.1%) |
| 11:00 AM to 11:59 AM | 0 (0.0%) | 0 (0.0%) |
| 12:00 PM to 3:59 PM | 40 (5.3%) | 54 (7.2%) |
| 4:00 PM to 11:59 PM | 66 (8.8%) | 29 (3.9%) |
| Total | 747 (100.0%) | 748 (100.0%) |
Housing Occupancy in Oak Point
Occupancy by Ownership in Oak Point
Of the total 1,821 dwellings in Oak Point, owner-occupied units account for 1,577 (86.6%), while renter-occupied units make up 244 (13.4%).
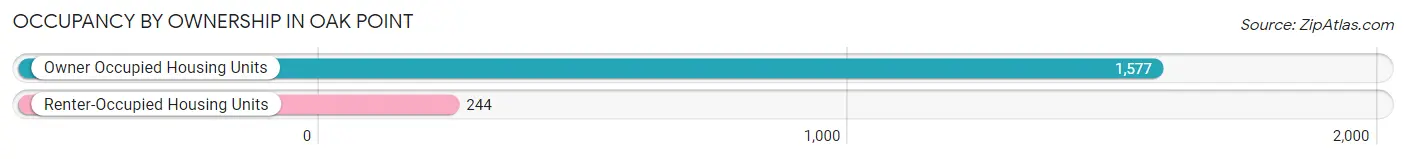
| Occupancy | # Housing Units | % Housing Units |
| Owner Occupied Housing Units | 1,577 | 86.6% |
| Renter-Occupied Housing Units | 244 | 13.4% |
| Total Occupied Housing Units | 1,821 | 100.0% |
Occupancy by Household Size in Oak Point
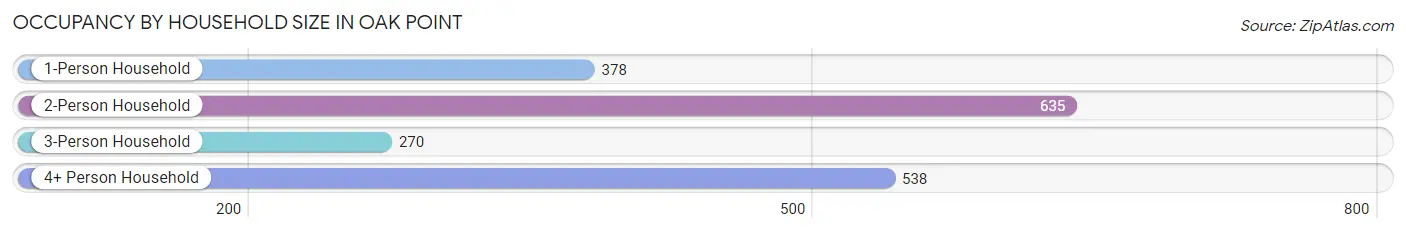
| Household Size | # Housing Units | % Housing Units |
| 1-Person Household | 378 | 20.8% |
| 2-Person Household | 635 | 34.9% |
| 3-Person Household | 270 | 14.8% |
| 4+ Person Household | 538 | 29.5% |
| Total Housing Units | 1,821 | 100.0% |
Occupancy by Ownership by Household Size in Oak Point
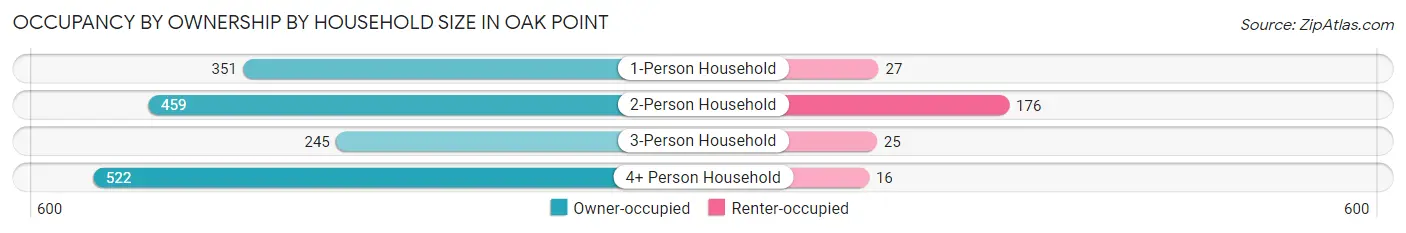
| Household Size | Owner-occupied | Renter-occupied |
| 1-Person Household | 351 (92.9%) | 27 (7.1%) |
| 2-Person Household | 459 (72.3%) | 176 (27.7%) |
| 3-Person Household | 245 (90.7%) | 25 (9.3%) |
| 4+ Person Household | 522 (97.0%) | 16 (3.0%) |
| Total Housing Units | 1,577 (86.6%) | 244 (13.4%) |
Occupancy by Educational Attainment in Oak Point
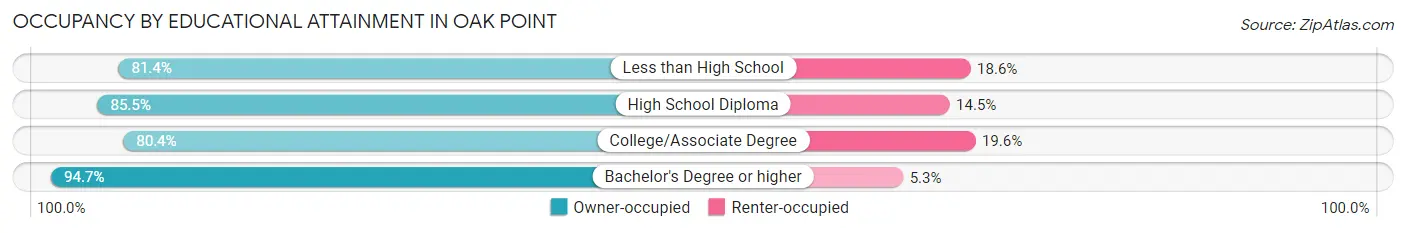
| Household Size | Owner-occupied | Renter-occupied |
| Less than High School | 83 (81.4%) | 19 (18.6%) |
| High School Diploma | 136 (85.5%) | 23 (14.5%) |
| College/Associate Degree | 673 (80.4%) | 164 (19.6%) |
| Bachelor's Degree or higher | 685 (94.7%) | 38 (5.3%) |
Occupancy by Age of Householder in Oak Point
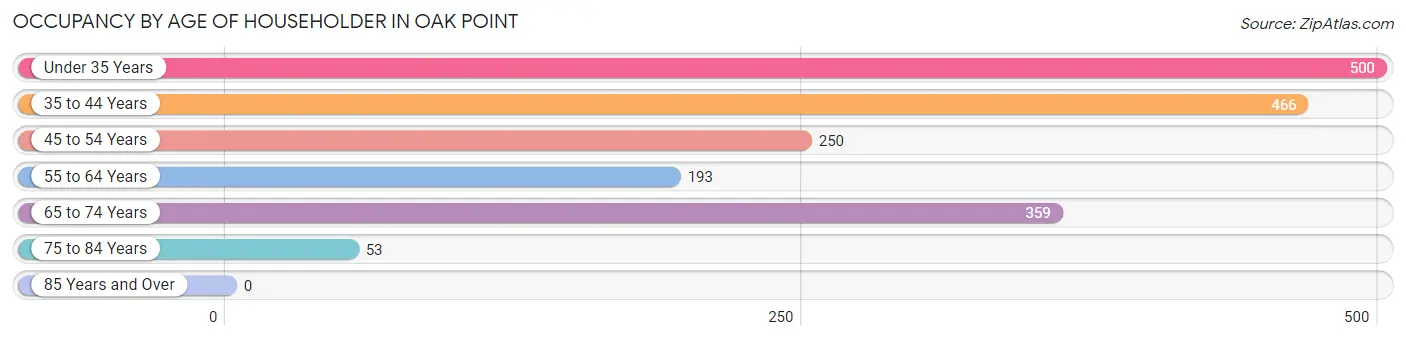
| Age Bracket | # Households | % Households |
| Under 35 Years | 500 | 27.5% |
| 35 to 44 Years | 466 | 25.6% |
| 45 to 54 Years | 250 | 13.7% |
| 55 to 64 Years | 193 | 10.6% |
| 65 to 74 Years | 359 | 19.7% |
| 75 to 84 Years | 53 | 2.9% |
| 85 Years and Over | 0 | 0.0% |
| Total | 1,821 | 100.0% |
Housing Finances in Oak Point
Median Income by Occupancy in Oak Point
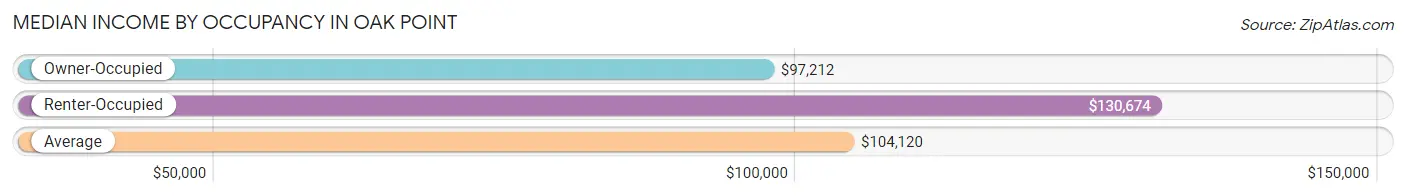
| Occupancy Type | # Households | Median Income |
| Owner-Occupied | 1,577 (86.6%) | $97,212 |
| Renter-Occupied | 244 (13.4%) | $130,674 |
| Average | 1,821 (100.0%) | $104,120 |
Occupancy by Householder Income Bracket in Oak Point
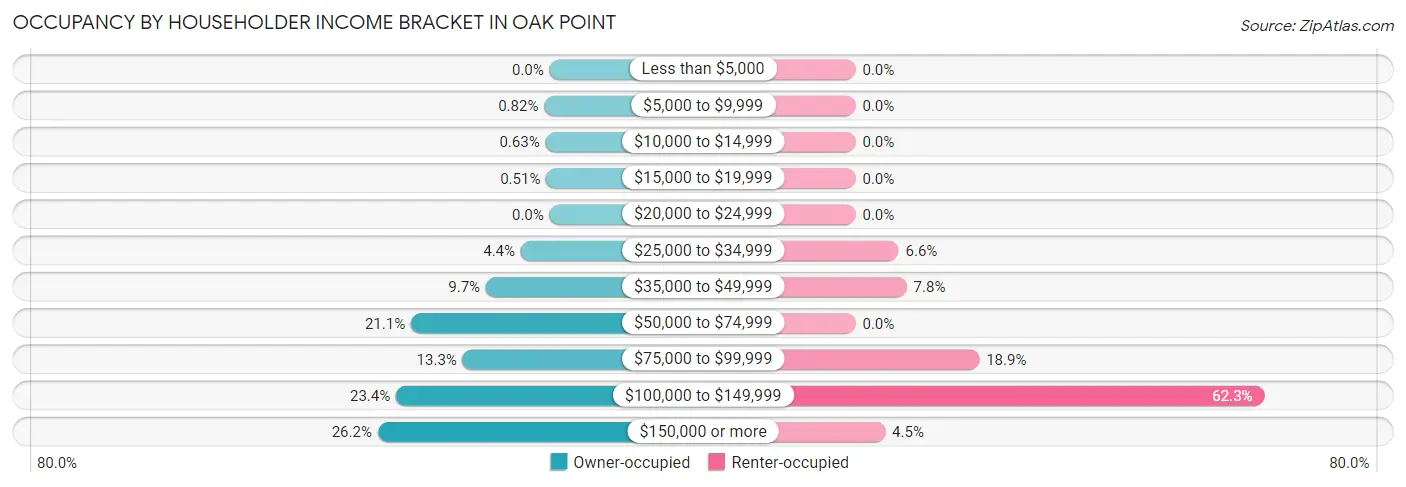
| Income Bracket | Owner-occupied | Renter-occupied |
| Less than $5,000 | 0 (0.0%) | 0 (0.0%) |
| $5,000 to $9,999 | 13 (0.8%) | 0 (0.0%) |
| $10,000 to $14,999 | 10 (0.6%) | 0 (0.0%) |
| $15,000 to $19,999 | 8 (0.5%) | 0 (0.0%) |
| $20,000 to $24,999 | 0 (0.0%) | 0 (0.0%) |
| $25,000 to $34,999 | 69 (4.4%) | 16 (6.6%) |
| $35,000 to $49,999 | 153 (9.7%) | 19 (7.8%) |
| $50,000 to $74,999 | 333 (21.1%) | 0 (0.0%) |
| $75,000 to $99,999 | 209 (13.3%) | 46 (18.9%) |
| $100,000 to $149,999 | 369 (23.4%) | 152 (62.3%) |
| $150,000 or more | 413 (26.2%) | 11 (4.5%) |
| Total | 1,577 (100.0%) | 244 (100.0%) |
Monthly Housing Cost Tiers in Oak Point
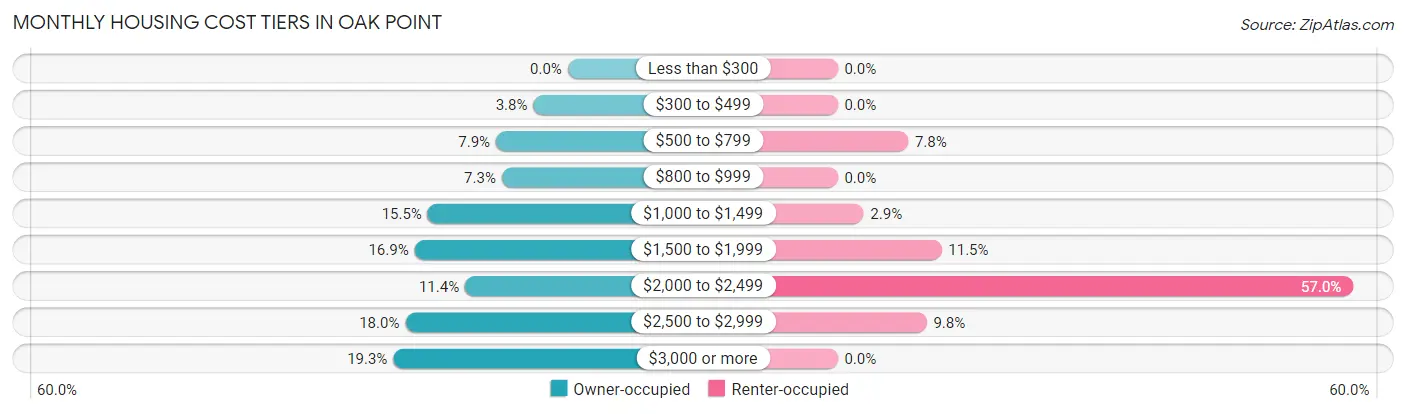
| Monthly Cost | Owner-occupied | Renter-occupied |
| Less than $300 | 0 (0.0%) | 0 (0.0%) |
| $300 to $499 | 60 (3.8%) | 0 (0.0%) |
| $500 to $799 | 125 (7.9%) | 19 (7.8%) |
| $800 to $999 | 115 (7.3%) | 0 (0.0%) |
| $1,000 to $1,499 | 244 (15.5%) | 7 (2.9%) |
| $1,500 to $1,999 | 267 (16.9%) | 28 (11.5%) |
| $2,000 to $2,499 | 179 (11.4%) | 139 (57.0%) |
| $2,500 to $2,999 | 283 (17.9%) | 24 (9.8%) |
| $3,000 or more | 304 (19.3%) | 0 (0.0%) |
| Total | 1,577 (100.0%) | 244 (100.0%) |
Physical Housing Characteristics in Oak Point
Housing Structures in Oak Point
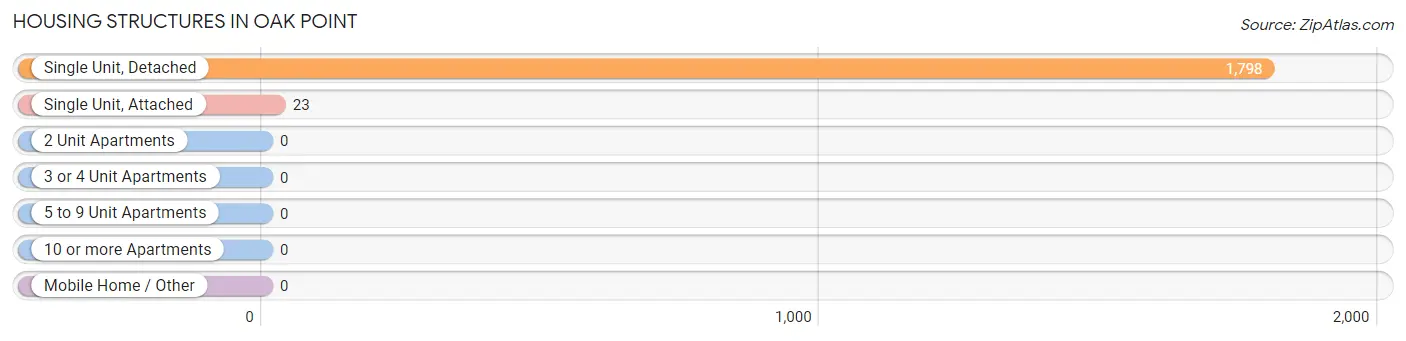
| Structure Type | # Housing Units | % Housing Units |
| Single Unit, Detached | 1,798 | 98.7% |
| Single Unit, Attached | 23 | 1.3% |
| 2 Unit Apartments | 0 | 0.0% |
| 3 or 4 Unit Apartments | 0 | 0.0% |
| 5 to 9 Unit Apartments | 0 | 0.0% |
| 10 or more Apartments | 0 | 0.0% |
| Mobile Home / Other | 0 | 0.0% |
| Total | 1,821 | 100.0% |
Housing Structures by Occupancy in Oak Point
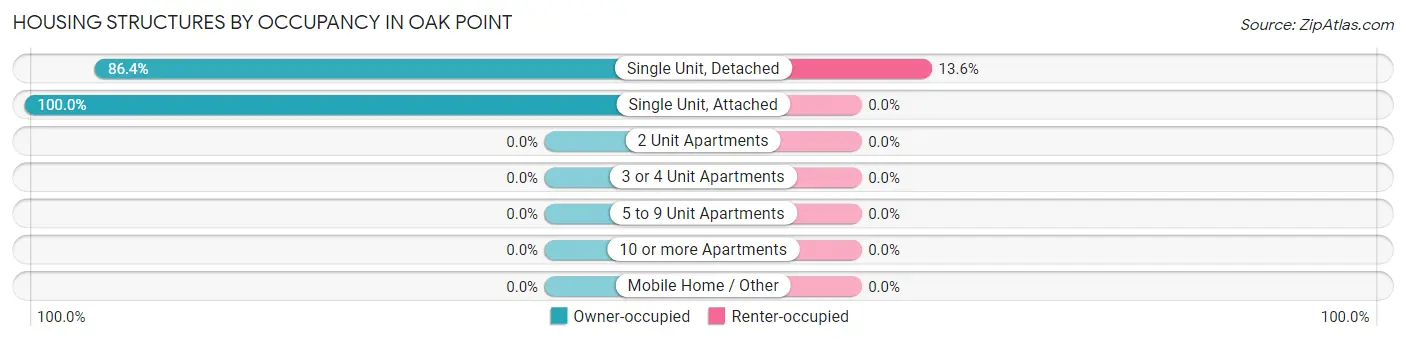
| Structure Type | Owner-occupied | Renter-occupied |
| Single Unit, Detached | 1,554 (86.4%) | 244 (13.6%) |
| Single Unit, Attached | 23 (100.0%) | 0 (0.0%) |
| 2 Unit Apartments | 0 (0.0%) | 0 (0.0%) |
| 3 or 4 Unit Apartments | 0 (0.0%) | 0 (0.0%) |
| 5 to 9 Unit Apartments | 0 (0.0%) | 0 (0.0%) |
| 10 or more Apartments | 0 (0.0%) | 0 (0.0%) |
| Mobile Home / Other | 0 (0.0%) | 0 (0.0%) |
| Total | 1,577 (86.6%) | 244 (13.4%) |
Housing Structures by Number of Rooms in Oak Point
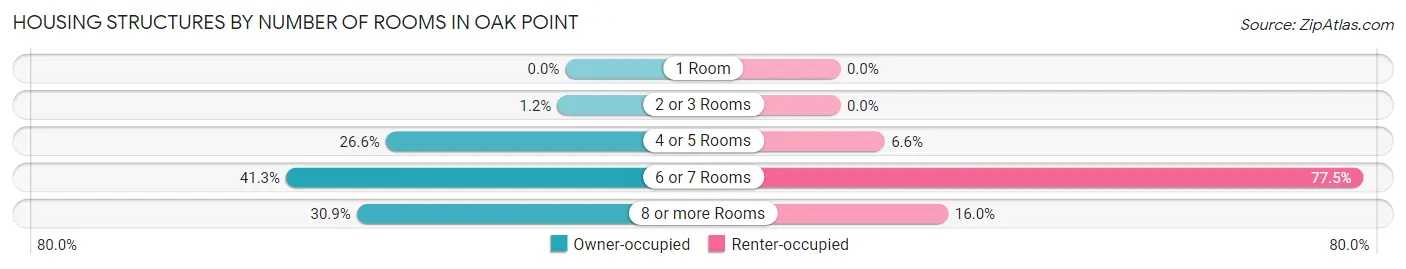
| Number of Rooms | Owner-occupied | Renter-occupied |
| 1 Room | 0 (0.0%) | 0 (0.0%) |
| 2 or 3 Rooms | 19 (1.2%) | 0 (0.0%) |
| 4 or 5 Rooms | 419 (26.6%) | 16 (6.6%) |
| 6 or 7 Rooms | 652 (41.3%) | 189 (77.5%) |
| 8 or more Rooms | 487 (30.9%) | 39 (16.0%) |
| Total | 1,577 (100.0%) | 244 (100.0%) |
Housing Structure by Heating Type in Oak Point
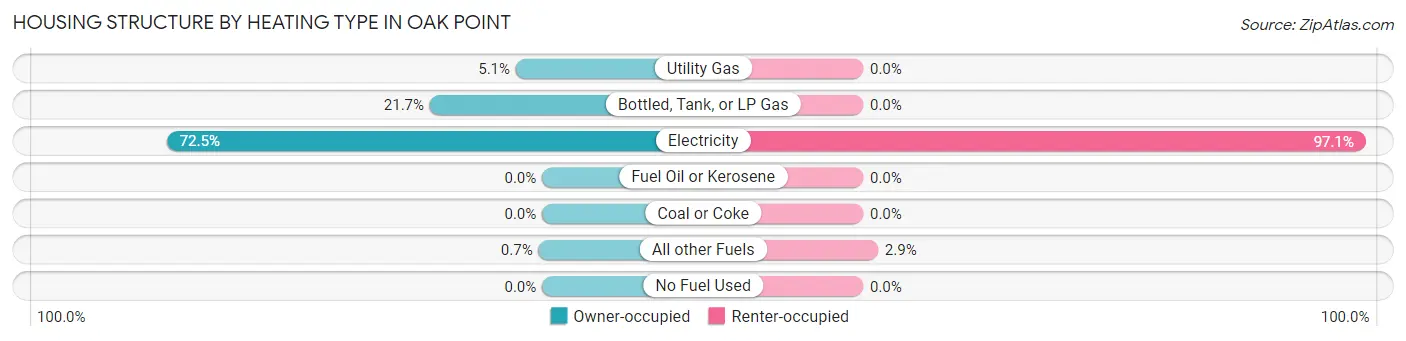
| Heating Type | Owner-occupied | Renter-occupied |
| Utility Gas | 80 (5.1%) | 0 (0.0%) |
| Bottled, Tank, or LP Gas | 342 (21.7%) | 0 (0.0%) |
| Electricity | 1,144 (72.5%) | 237 (97.1%) |
| Fuel Oil or Kerosene | 0 (0.0%) | 0 (0.0%) |
| Coal or Coke | 0 (0.0%) | 0 (0.0%) |
| All other Fuels | 11 (0.7%) | 7 (2.9%) |
| No Fuel Used | 0 (0.0%) | 0 (0.0%) |
| Total | 1,577 (100.0%) | 244 (100.0%) |
Household Vehicle Usage in Oak Point
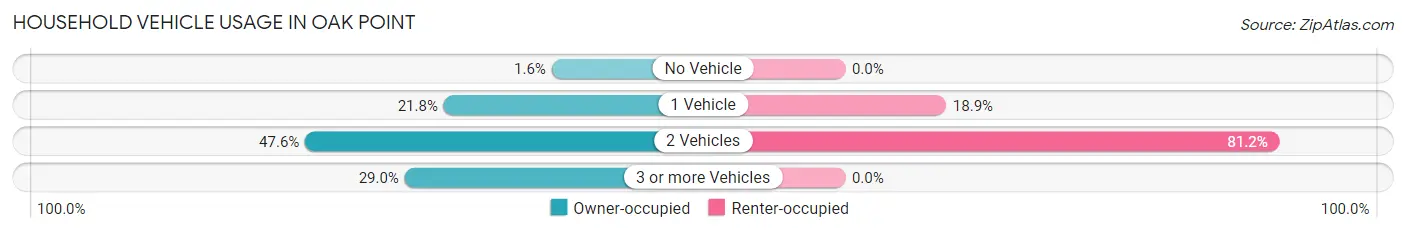
| Vehicles per Household | Owner-occupied | Renter-occupied |
| No Vehicle | 25 (1.6%) | 0 (0.0%) |
| 1 Vehicle | 343 (21.7%) | 46 (18.9%) |
| 2 Vehicles | 751 (47.6%) | 198 (81.1%) |
| 3 or more Vehicles | 458 (29.0%) | 0 (0.0%) |
| Total | 1,577 (100.0%) | 244 (100.0%) |
Real Estate & Mortgages in Oak Point
Real Estate and Mortgage Overview in Oak Point
| Characteristic | Without Mortgage | With Mortgage |
| Housing Units | 516 | 1,061 |
| Median Property Value | $364,100 | $354,700 |
| Median Household Income | $53,983 | $292 |
| Monthly Housing Costs | $940 | $304 |
| Real Estate Taxes | $4,795 | $33 |
Property Value by Mortgage Status in Oak Point
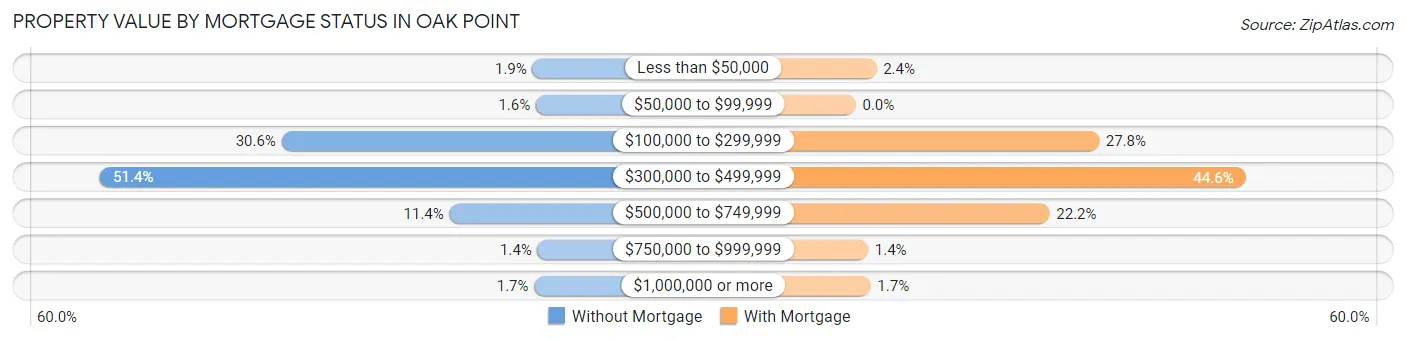
| Property Value | Without Mortgage | With Mortgage |
| Less than $50,000 | 10 (1.9%) | 25 (2.4%) |
| $50,000 to $99,999 | 8 (1.5%) | 0 (0.0%) |
| $100,000 to $299,999 | 158 (30.6%) | 295 (27.8%) |
| $300,000 to $499,999 | 265 (51.4%) | 473 (44.6%) |
| $500,000 to $749,999 | 59 (11.4%) | 235 (22.2%) |
| $750,000 to $999,999 | 7 (1.4%) | 15 (1.4%) |
| $1,000,000 or more | 9 (1.7%) | 18 (1.7%) |
| Total | 516 (100.0%) | 1,061 (100.0%) |
Household Income by Mortgage Status in Oak Point
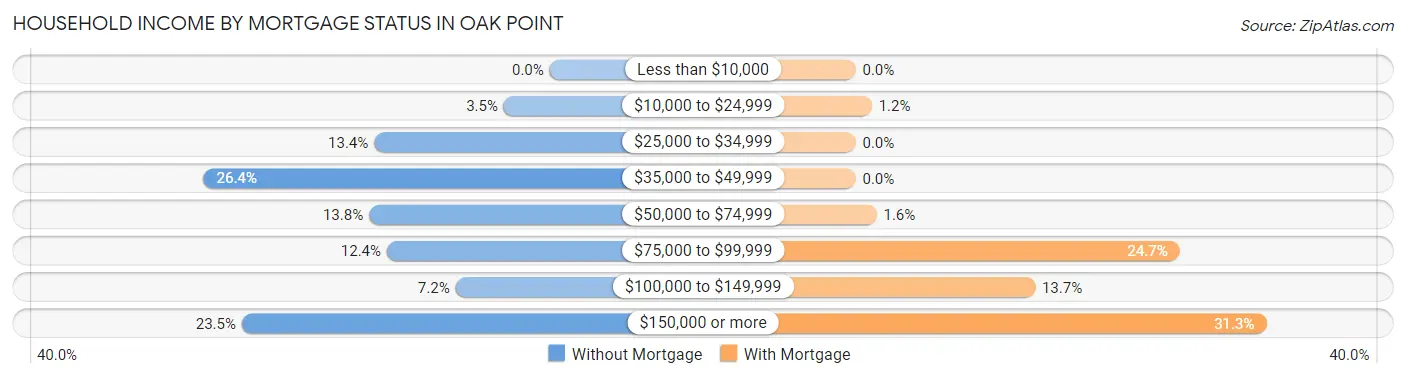
| Household Income | Without Mortgage | With Mortgage |
| Less than $10,000 | 0 (0.0%) | 0 (0.0%) |
| $10,000 to $24,999 | 18 (3.5%) | 13 (1.2%) |
| $25,000 to $34,999 | 69 (13.4%) | 0 (0.0%) |
| $35,000 to $49,999 | 136 (26.4%) | 0 (0.0%) |
| $50,000 to $74,999 | 71 (13.8%) | 17 (1.6%) |
| $75,000 to $99,999 | 64 (12.4%) | 262 (24.7%) |
| $100,000 to $149,999 | 37 (7.2%) | 145 (13.7%) |
| $150,000 or more | 121 (23.4%) | 332 (31.3%) |
| Total | 516 (100.0%) | 1,061 (100.0%) |
Property Value to Household Income Ratio in Oak Point
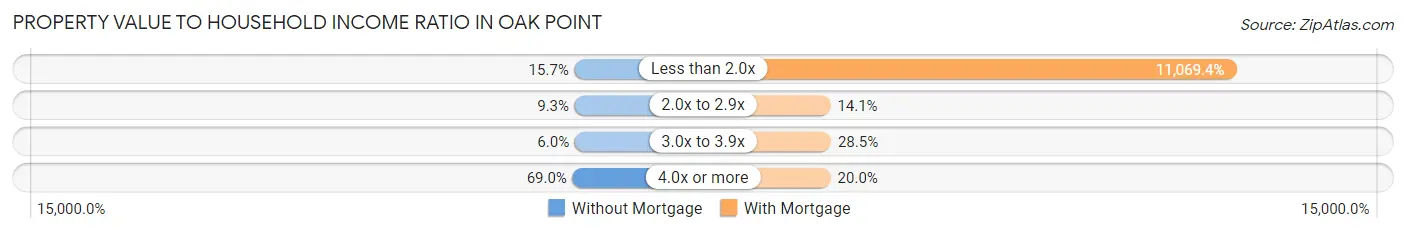
| Value-to-Income Ratio | Without Mortgage | With Mortgage |
| Less than 2.0x | 81 (15.7%) | 117,446 (11,069.4%) |
| 2.0x to 2.9x | 48 (9.3%) | 150 (14.1%) |
| 3.0x to 3.9x | 31 (6.0%) | 302 (28.5%) |
| 4.0x or more | 356 (69.0%) | 212 (20.0%) |
| Total | 516 (100.0%) | 1,061 (100.0%) |
Real Estate Taxes by Mortgage Status in Oak Point
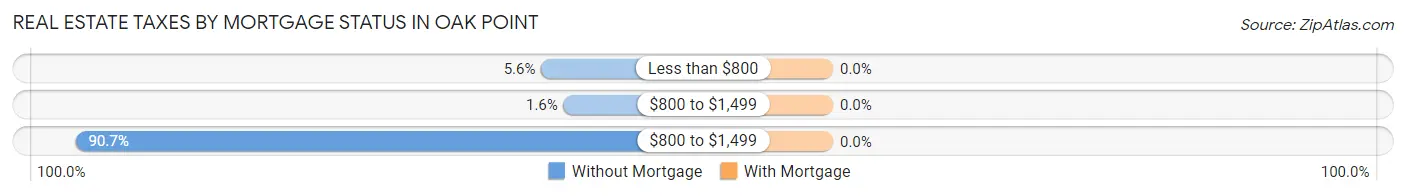
| Property Taxes | Without Mortgage | With Mortgage |
| Less than $800 | 29 (5.6%) | 0 (0.0%) |
| $800 to $1,499 | 8 (1.5%) | 0 (0.0%) |
| $800 to $1,499 | 468 (90.7%) | 0 (0.0%) |
| Total | 516 (100.0%) | 1,061 (100.0%) |
Health & Disability in Oak Point
Health Insurance Coverage by Age in Oak Point
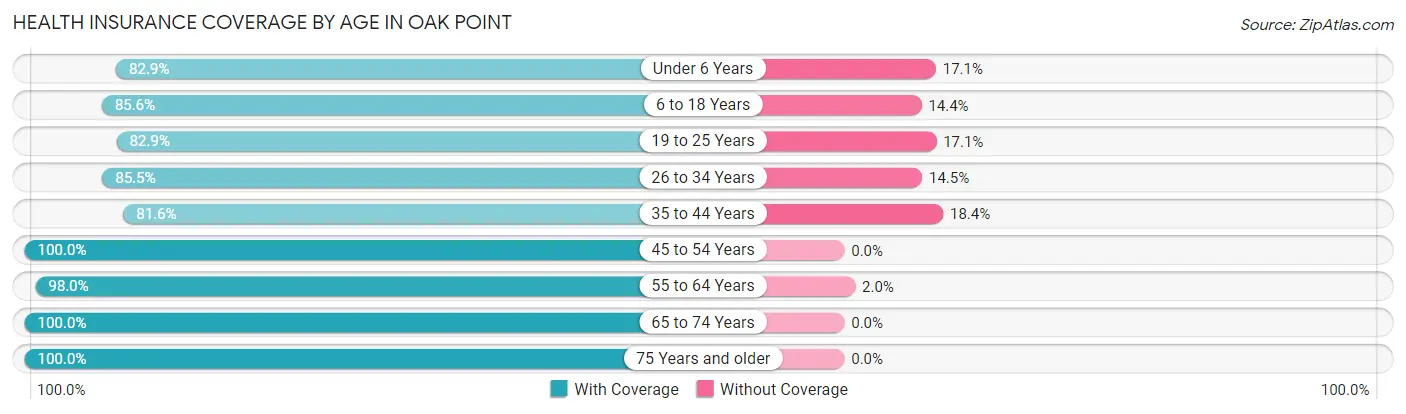
| Age Bracket | With Coverage | Without Coverage |
| Under 6 Years | 481 (82.9%) | 99 (17.1%) |
| 6 to 18 Years | 714 (85.6%) | 120 (14.4%) |
| 19 to 25 Years | 203 (82.9%) | 42 (17.1%) |
| 26 to 34 Years | 961 (85.5%) | 163 (14.5%) |
| 35 to 44 Years | 607 (81.6%) | 137 (18.4%) |
| 45 to 54 Years | 365 (100.0%) | 0 (0.0%) |
| 55 to 64 Years | 438 (98.0%) | 9 (2.0%) |
| 65 to 74 Years | 529 (100.0%) | 0 (0.0%) |
| 75 Years and older | 89 (100.0%) | 0 (0.0%) |
| Total | 4,387 (88.5%) | 570 (11.5%) |
Health Insurance Coverage by Citizenship Status in Oak Point
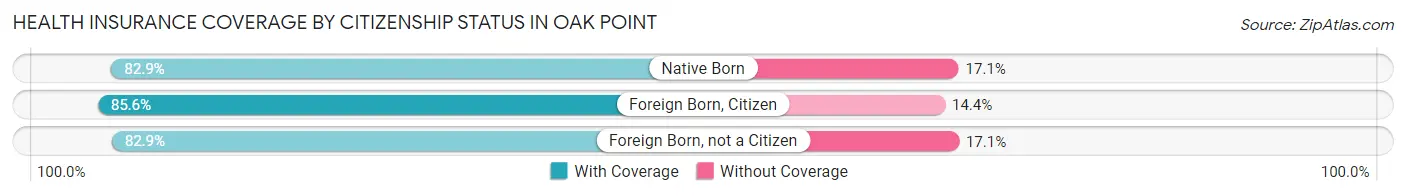
| Citizenship Status | With Coverage | Without Coverage |
| Native Born | 481 (82.9%) | 99 (17.1%) |
| Foreign Born, Citizen | 714 (85.6%) | 120 (14.4%) |
| Foreign Born, not a Citizen | 203 (82.9%) | 42 (17.1%) |
Health Insurance Coverage by Household Income in Oak Point
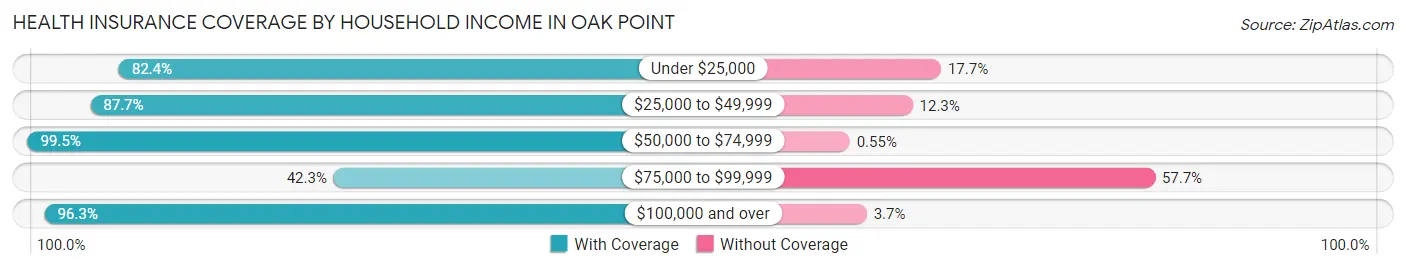
| Household Income | With Coverage | Without Coverage |
| Under $25,000 | 42 (82.4%) | 9 (17.6%) |
| $25,000 to $49,999 | 455 (87.7%) | 64 (12.3%) |
| $50,000 to $74,999 | 724 (99.5%) | 4 (0.5%) |
| $75,000 to $99,999 | 279 (42.3%) | 381 (57.7%) |
| $100,000 and over | 2,887 (96.3%) | 112 (3.7%) |
Public vs Private Health Insurance Coverage by Age in Oak Point
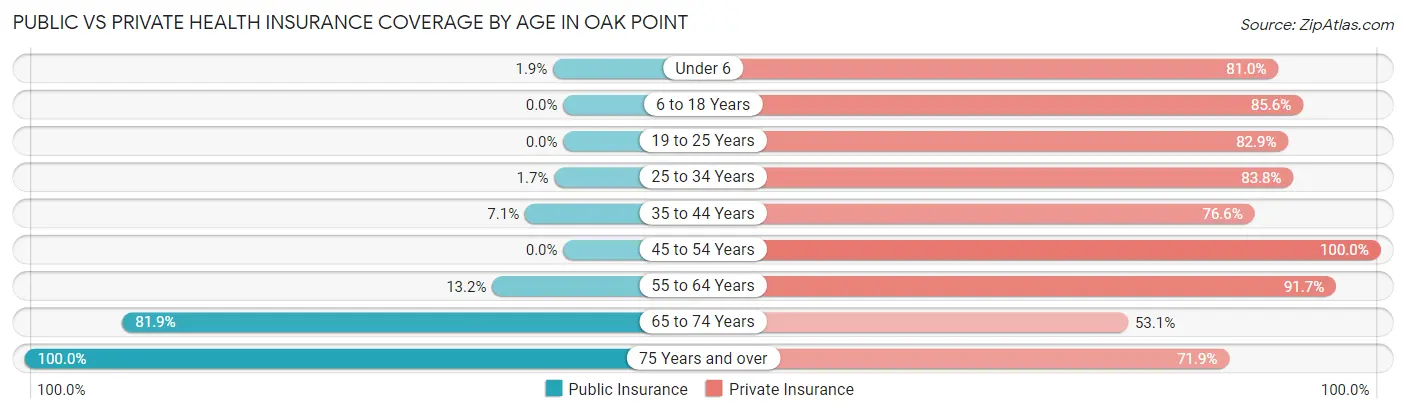
| Age Bracket | Public Insurance | Private Insurance |
| Under 6 | 11 (1.9%) | 470 (81.0%) |
| 6 to 18 Years | 0 (0.0%) | 714 (85.6%) |
| 19 to 25 Years | 0 (0.0%) | 203 (82.9%) |
| 25 to 34 Years | 19 (1.7%) | 942 (83.8%) |
| 35 to 44 Years | 53 (7.1%) | 570 (76.6%) |
| 45 to 54 Years | 0 (0.0%) | 365 (100.0%) |
| 55 to 64 Years | 59 (13.2%) | 410 (91.7%) |
| 65 to 74 Years | 433 (81.9%) | 281 (53.1%) |
| 75 Years and over | 89 (100.0%) | 64 (71.9%) |
| Total | 664 (13.4%) | 4,019 (81.1%) |
Disability Status by Sex by Age in Oak Point
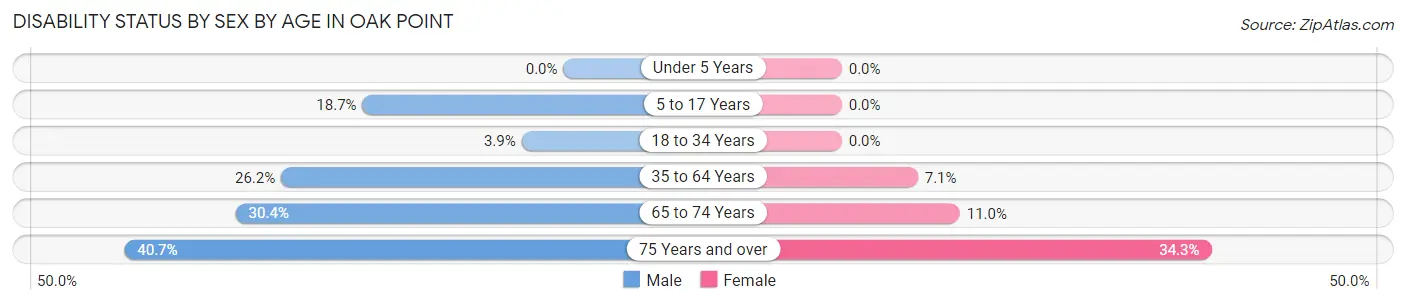
| Age Bracket | Male | Female |
| Under 5 Years | 0 (0.0%) | 0 (0.0%) |
| 5 to 17 Years | 102 (18.6%) | 0 (0.0%) |
| 18 to 34 Years | 19 (3.9%) | 0 (0.0%) |
| 35 to 64 Years | 196 (26.2%) | 57 (7.0%) |
| 65 to 74 Years | 97 (30.4%) | 23 (11.0%) |
| 75 Years and over | 22 (40.7%) | 12 (34.3%) |
Disability Class by Sex by Age in Oak Point
Disability Class: Hearing Difficulty
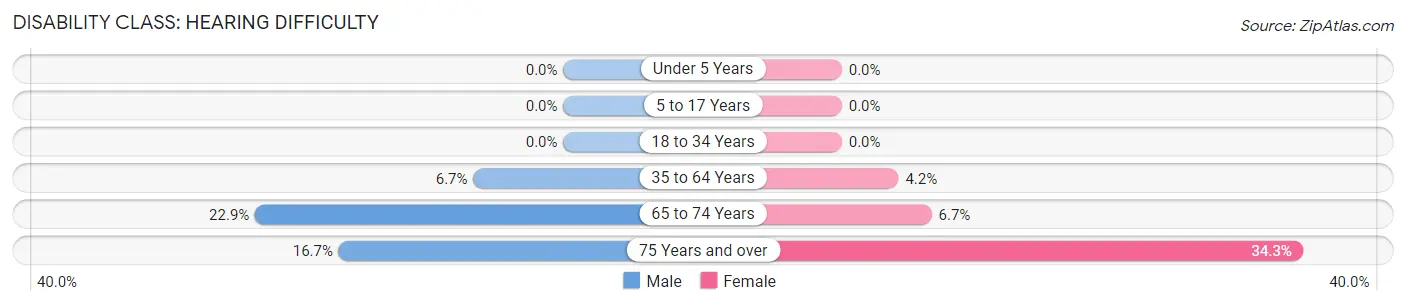
| Age Bracket | Male | Female |
| Under 5 Years | 0 (0.0%) | 0 (0.0%) |
| 5 to 17 Years | 0 (0.0%) | 0 (0.0%) |
| 18 to 34 Years | 0 (0.0%) | 0 (0.0%) |
| 35 to 64 Years | 50 (6.7%) | 34 (4.2%) |
| 65 to 74 Years | 73 (22.9%) | 14 (6.7%) |
| 75 Years and over | 9 (16.7%) | 12 (34.3%) |
Disability Class: Vision Difficulty
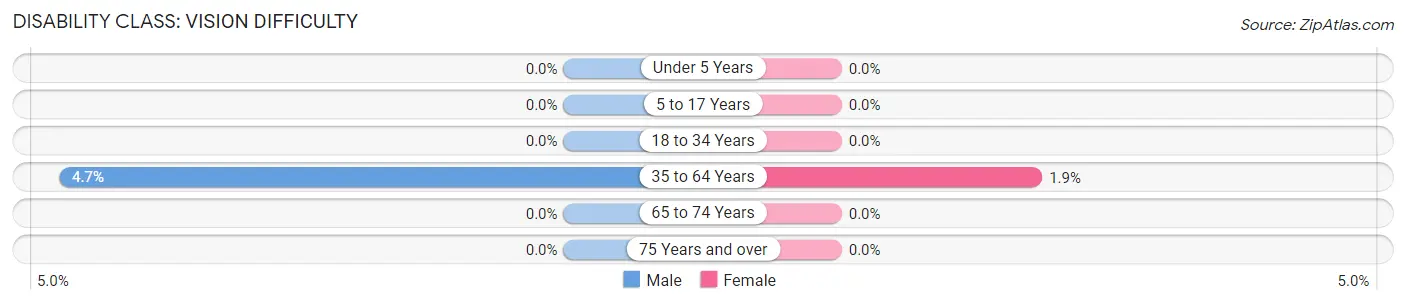
| Age Bracket | Male | Female |
| Under 5 Years | 0 (0.0%) | 0 (0.0%) |
| 5 to 17 Years | 0 (0.0%) | 0 (0.0%) |
| 18 to 34 Years | 0 (0.0%) | 0 (0.0%) |
| 35 to 64 Years | 35 (4.7%) | 15 (1.9%) |
| 65 to 74 Years | 0 (0.0%) | 0 (0.0%) |
| 75 Years and over | 0 (0.0%) | 0 (0.0%) |
Disability Class: Cognitive Difficulty
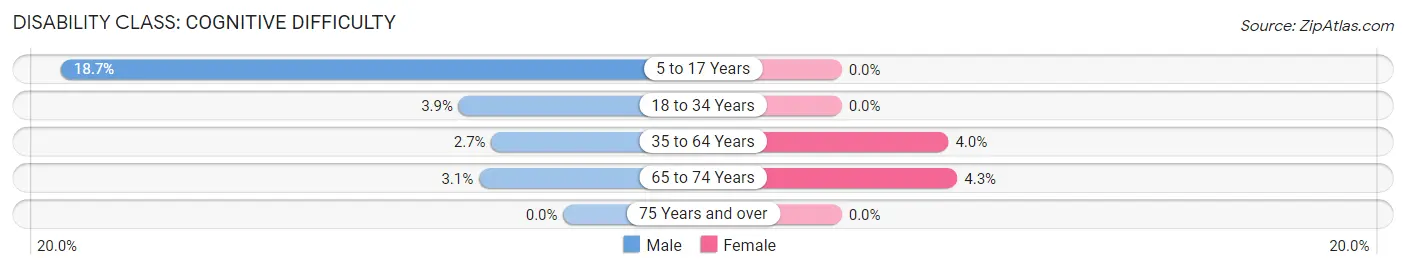
| Age Bracket | Male | Female |
| 5 to 17 Years | 102 (18.6%) | 0 (0.0%) |
| 18 to 34 Years | 19 (3.9%) | 0 (0.0%) |
| 35 to 64 Years | 20 (2.7%) | 32 (4.0%) |
| 65 to 74 Years | 10 (3.1%) | 9 (4.3%) |
| 75 Years and over | 0 (0.0%) | 0 (0.0%) |
Disability Class: Ambulatory Difficulty
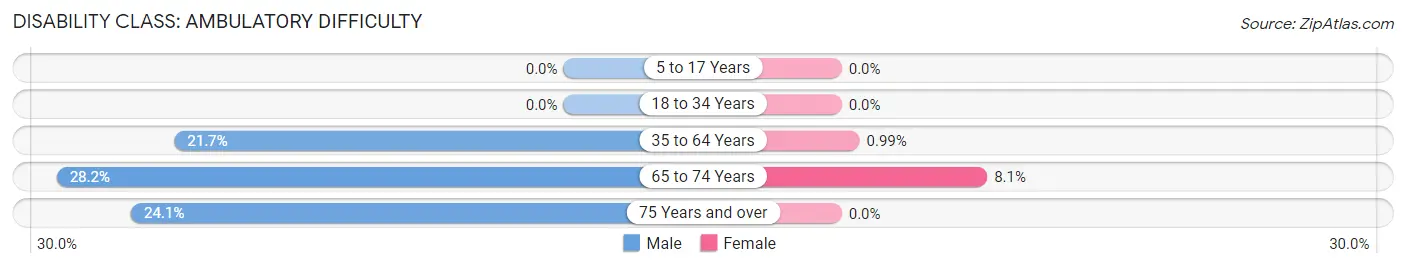
| Age Bracket | Male | Female |
| 5 to 17 Years | 0 (0.0%) | 0 (0.0%) |
| 18 to 34 Years | 0 (0.0%) | 0 (0.0%) |
| 35 to 64 Years | 162 (21.7%) | 8 (1.0%) |
| 65 to 74 Years | 90 (28.2%) | 17 (8.1%) |
| 75 Years and over | 13 (24.1%) | 0 (0.0%) |
Disability Class: Self-Care Difficulty
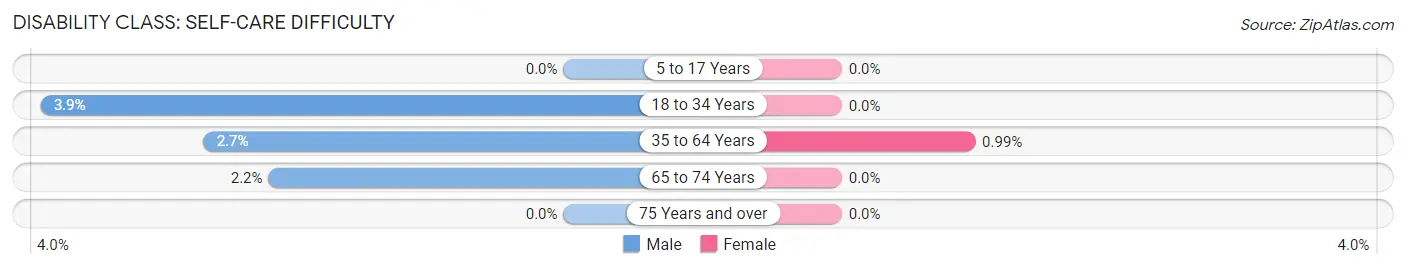
| Age Bracket | Male | Female |
| 5 to 17 Years | 0 (0.0%) | 0 (0.0%) |
| 18 to 34 Years | 19 (3.9%) | 0 (0.0%) |
| 35 to 64 Years | 20 (2.7%) | 8 (1.0%) |
| 65 to 74 Years | 7 (2.2%) | 0 (0.0%) |
| 75 Years and over | 0 (0.0%) | 0 (0.0%) |
Technology Access in Oak Point
Computing Device Access in Oak Point
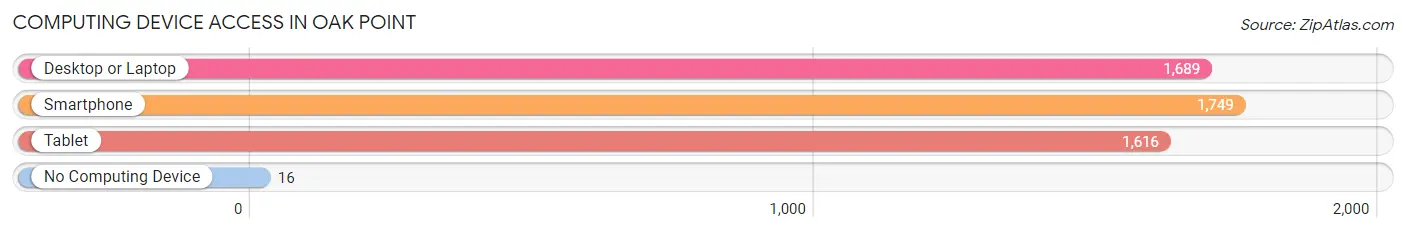
| Device Type | # Households | % Households |
| Desktop or Laptop | 1,689 | 92.7% |
| Smartphone | 1,749 | 96.1% |
| Tablet | 1,616 | 88.7% |
| No Computing Device | 16 | 0.9% |
| Total | 1,821 | 100.0% |
Internet Access in Oak Point
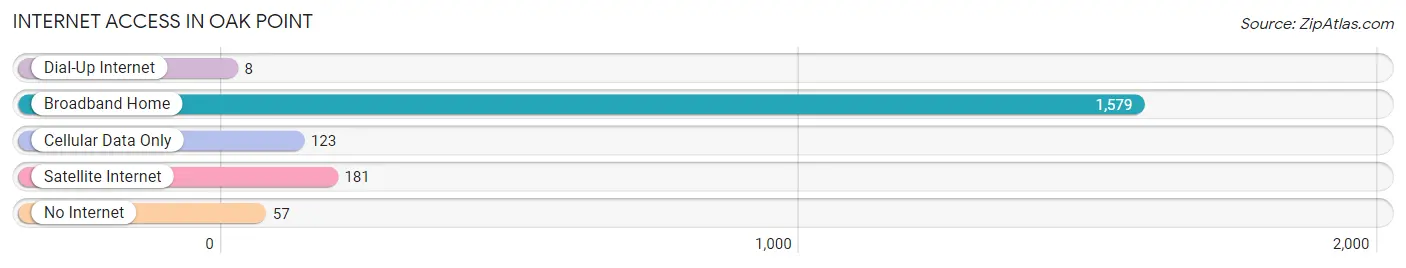
| Internet Type | # Households | % Households |
| Dial-Up Internet | 8 | 0.4% |
| Broadband Home | 1,579 | 86.7% |
| Cellular Data Only | 123 | 6.8% |
| Satellite Internet | 181 | 9.9% |
| No Internet | 57 | 3.1% |
| Total | 1,821 | 100.0% |
Oak Point Summary
History
The small town of Oak Point, Texas is located in Denton County, about 30 miles north of Dallas. The town was founded in 1881 by a group of settlers from Kentucky, led by William and Mary Ann Oakley. The Oakleys named the town after their family, and it has been known as Oak Point ever since.
The town was originally a farming community, and the Oakleys were among the first to grow cotton in the area. The town grew slowly, but steadily, and by the early 1900s, it had become a thriving community with a population of around 500 people.
In the 1920s, the town began to experience a period of growth and prosperity. The population increased to over 1,000 people, and the town was home to several businesses, including a cotton gin, a general store, a blacksmith shop, and a hotel.
In the 1950s, the town experienced a period of decline as many of its residents moved away in search of better opportunities. By the 1970s, the population had dropped to just over 500 people.
In the 1980s, the town began to experience a resurgence. The population increased to over 1,000 people, and the town was home to several businesses, including a grocery store, a hardware store, and a restaurant.
Today, Oak Point is a small, but vibrant community with a population of around 2,000 people. The town is home to several businesses, including a gas station, a bank, a post office, and a library. The town also has several parks and recreational facilities, including a swimming pool, a tennis court, and a baseball field.
Geography
Oak Point is located in Denton County, Texas, about 30 miles north of Dallas. The town is situated on the banks of Lake Lewisville, a large reservoir created by the damming of the Elm Fork of the Trinity River. The town is surrounded by rolling hills and wooded areas, and is home to several parks and recreational facilities.
The climate in Oak Point is generally mild, with temperatures ranging from the mid-50s in the winter to the mid-90s in the summer. The town receives an average of 37 inches of rain per year, and is located in a humid subtropical climate zone.
Economy
Oak Point is a small, but vibrant community with a diverse economy. The town is home to several businesses, including a gas station, a bank, a post office, and a library. The town also has several parks and recreational facilities, including a swimming pool, a tennis court, and a baseball field.
The town is also home to several manufacturing companies, including a plastics manufacturer, a metal fabrication company, and a printing company. The town is also home to several small businesses, including a restaurant, a grocery store, and a hardware store.
Demographics
As of the 2010 census, the population of Oak Point was 2,037. The racial makeup of the town was 87.3% White, 5.2% African American, 0.7% Native American, 0.7% Asian, 0.1% Pacific Islander, 4.2% from other races, and 2.0% from two or more races. Hispanic or Latino of any race were 8.3% of the population.
The median income for a household in the town was $50,938, and the median income for a family was $60,938. The per capita income for the town was $25,938. About 6.2% of families and 8.3% of the population were below the poverty line, including 10.2% of those under age 18 and 6.2% of those age 65 or over.
Common Questions
What is Per Capita Income in Oak Point?
Per Capita income in Oak Point is $46,527.
What is the Median Family Income in Oak Point?
Median Family Income in Oak Point is $119,250.
What is the Median Household income in Oak Point?
Median Household Income in Oak Point is $104,120.
What is Income or Wage Gap in Oak Point?
Income or Wage Gap in Oak Point is 23.2%.
Women in Oak Point earn 76.8 cents for every dollar earned by a man.
What is Inequality or Gini Index in Oak Point?
Inequality or Gini Index in Oak Point is 0.37.
What is the Total Population of Oak Point?
Total Population of Oak Point is 4,957.
What is the Total Male Population of Oak Point?
Total Male Population of Oak Point is 2,460.
What is the Total Female Population of Oak Point?
Total Female Population of Oak Point is 2,497.
What is the Ratio of Males per 100 Females in Oak Point?
There are 98.52 Males per 100 Females in Oak Point.
What is the Ratio of Females per 100 Males in Oak Point?
There are 101.50 Females per 100 Males in Oak Point.
What is the Median Population Age in Oak Point?
Median Population Age in Oak Point is 34.2 Years.
What is the Average Family Size in Oak Point
Average Family Size in Oak Point is 3.3 People.
What is the Average Household Size in Oak Point
Average Household Size in Oak Point is 2.7 People.
How Large is the Labor Force in Oak Point?
There are 2,561 People in the Labor Forcein in Oak Point.
What is the Percentage of People in the Labor Force in Oak Point?
69.8% of People are in the Labor Force in Oak Point.
What is the Unemployment Rate in Oak Point?
Unemployment Rate in Oak Point is 1.5%.