East Burke, VT Map & Demographics
East Burke Map
East Burke Overview
$55,167
PER CAPITA INCOME
$146,750
AVG FAMILY INCOME
$80,298
AVG HOUSEHOLD INCOME
26.9%
WAGE / INCOME GAP [ % ]
73.1¢/ $1
WAGE / INCOME GAP [ $ ]
0.36
INEQUALITY / GINI INDEX
110
TOTAL POPULATION
65
MALE POPULATION
45
FEMALE POPULATION
144.44
MALES / 100 FEMALES
69.23
FEMALES / 100 MALES
30.9
MEDIAN AGE
2.5
AVG FAMILY SIZE
1.6
AVG HOUSEHOLD SIZE
83
LABOR FORCE [ PEOPLE ]
79.0%
PERCENT IN LABOR FORCE
East Burke Zip Codes
East Burke Area Codes
Income in East Burke
Income Overview in East Burke
Per Capita Income in East Burke is $55,167, while median incomes of families and households are $146,750 and $80,298 respectively.
| Characteristic | Number | Measure |
| Per Capita Income | 110 | $55,167 |
| Median Family Income | 19 | $146,750 |
| Mean Family Income | 19 | $169,168 |
| Median Household Income | 69 | $80,298 |
| Mean Household Income | 69 | $91,404 |
| Income Deficit | 19 | $0 |
| Wage / Income Gap (%) | 110 | 26.94% |
| Wage / Income Gap ($) | 110 | 73.06¢ per $1 |
| Gini / Inequality Index | 110 | 0.36 |
Earnings by Sex in East Burke
Average Earnings in East Burke are $42,750, $45,417 for men and $33,182 for women, a difference of 26.9%.
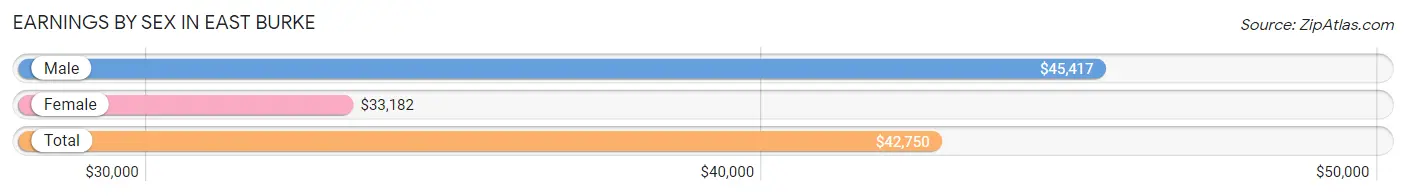
| Sex | Number | Average Earnings |
| Male | 59 (64.8%) | $45,417 |
| Female | 32 (35.2%) | $33,182 |
| Total | 91 (100.0%) | $42,750 |
Earnings by Sex by Income Bracket in East Burke
The most common earnings brackets in East Burke are $45,000 to $49,999 for men (21 | 35.6%) and $30,000 to $34,999 for women (11 | 34.4%).
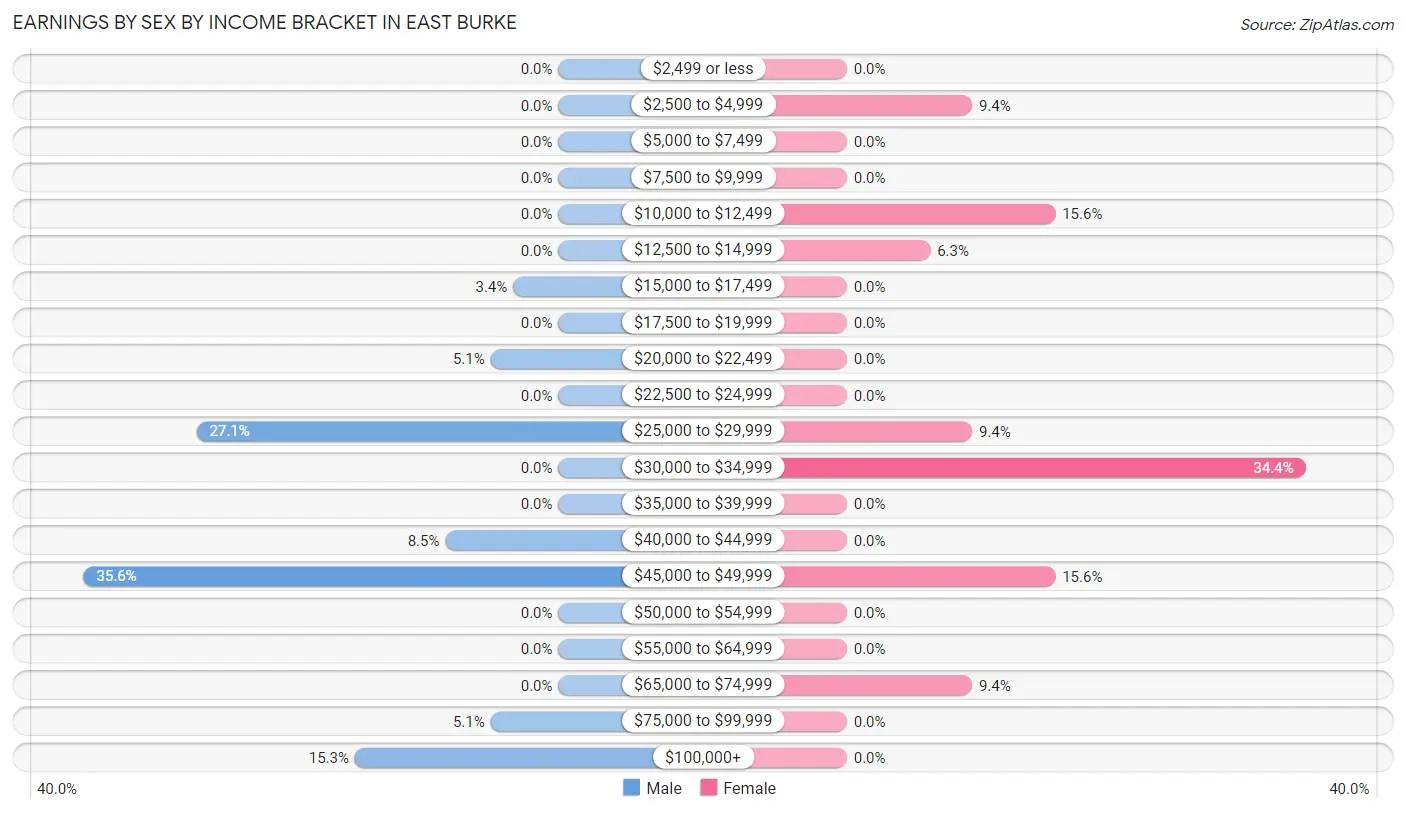
| Income | Male | Female |
| $2,499 or less | 0 (0.0%) | 0 (0.0%) |
| $2,500 to $4,999 | 0 (0.0%) | 3 (9.4%) |
| $5,000 to $7,499 | 0 (0.0%) | 0 (0.0%) |
| $7,500 to $9,999 | 0 (0.0%) | 0 (0.0%) |
| $10,000 to $12,499 | 0 (0.0%) | 5 (15.6%) |
| $12,500 to $14,999 | 0 (0.0%) | 2 (6.2%) |
| $15,000 to $17,499 | 2 (3.4%) | 0 (0.0%) |
| $17,500 to $19,999 | 0 (0.0%) | 0 (0.0%) |
| $20,000 to $22,499 | 3 (5.1%) | 0 (0.0%) |
| $22,500 to $24,999 | 0 (0.0%) | 0 (0.0%) |
| $25,000 to $29,999 | 16 (27.1%) | 3 (9.4%) |
| $30,000 to $34,999 | 0 (0.0%) | 11 (34.4%) |
| $35,000 to $39,999 | 0 (0.0%) | 0 (0.0%) |
| $40,000 to $44,999 | 5 (8.5%) | 0 (0.0%) |
| $45,000 to $49,999 | 21 (35.6%) | 5 (15.6%) |
| $50,000 to $54,999 | 0 (0.0%) | 0 (0.0%) |
| $55,000 to $64,999 | 0 (0.0%) | 0 (0.0%) |
| $65,000 to $74,999 | 0 (0.0%) | 3 (9.4%) |
| $75,000 to $99,999 | 3 (5.1%) | 0 (0.0%) |
| $100,000+ | 9 (15.2%) | 0 (0.0%) |
| Total | 59 (100.0%) | 32 (100.0%) |
Earnings by Sex by Educational Attainment in East Burke
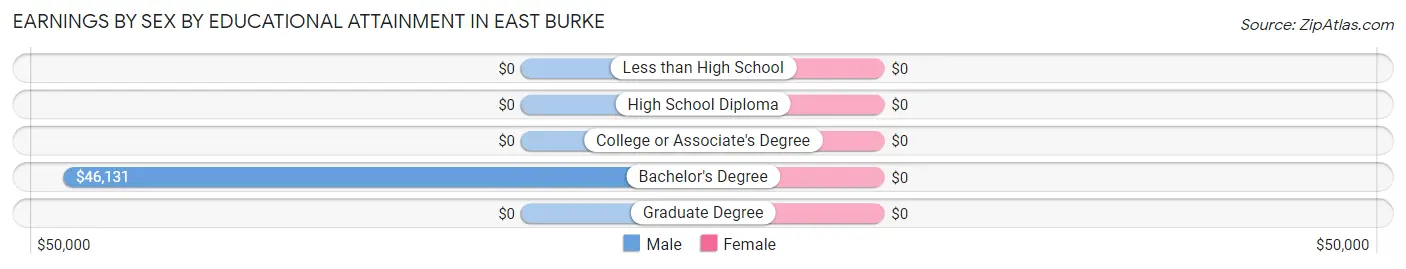
| Educational Attainment | Male Income | Female Income |
| Less than High School | - | - |
| High School Diploma | - | - |
| College or Associate's Degree | - | - |
| Bachelor's Degree | $46,131 | $0 |
| Graduate Degree | - | - |
| Total | $45,595 | $0 |
Family Income in East Burke
Family Income Brackets in East Burke
According to the East Burke family income data, there are 8 families falling into the $100,000 to $149,999 income range, which is the most common income bracket and makes up 42.1% of all families.
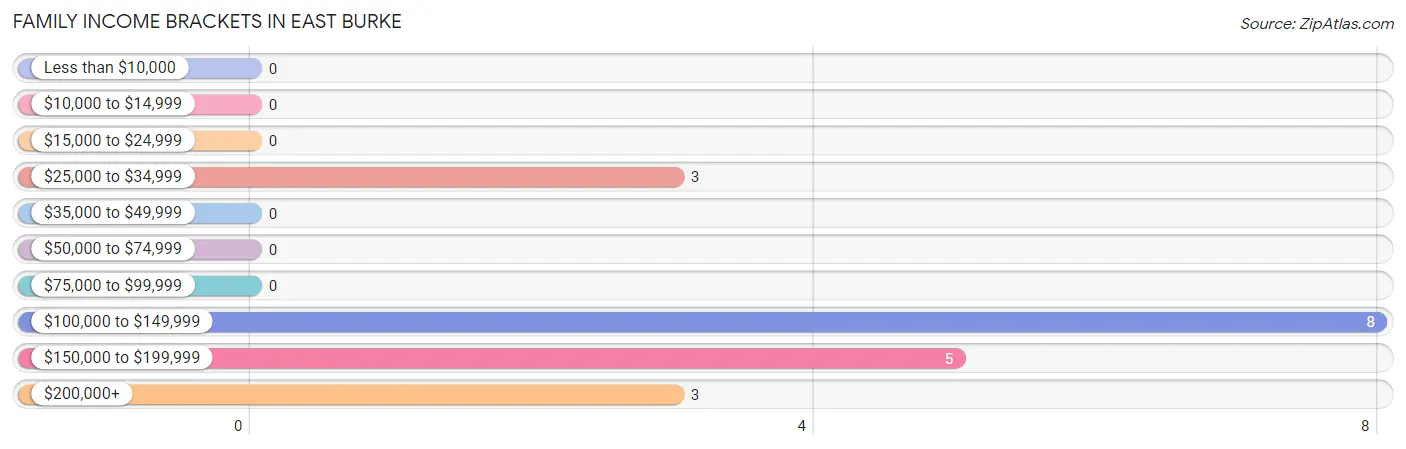
| Income Bracket | # Families | % Families |
| Less than $10,000 | 0 | 0.0% |
| $10,000 to $14,999 | 0 | 0.0% |
| $15,000 to $24,999 | 0 | 0.0% |
| $25,000 to $34,999 | 3 | 15.8% |
| $35,000 to $49,999 | 0 | 0.0% |
| $50,000 to $74,999 | 0 | 0.0% |
| $75,000 to $99,999 | 0 | 0.0% |
| $100,000 to $149,999 | 8 | 42.1% |
| $150,000 to $199,999 | 5 | 26.3% |
| $200,000+ | 3 | 15.8% |
Family Income by Famaliy Size in East Burke
2-person families (13 | 68.4%) account for the highest median family income in East Burke with $146,750 per family, while 2-person families (13 | 68.4%) have the highest median income of $73,375 per family member.
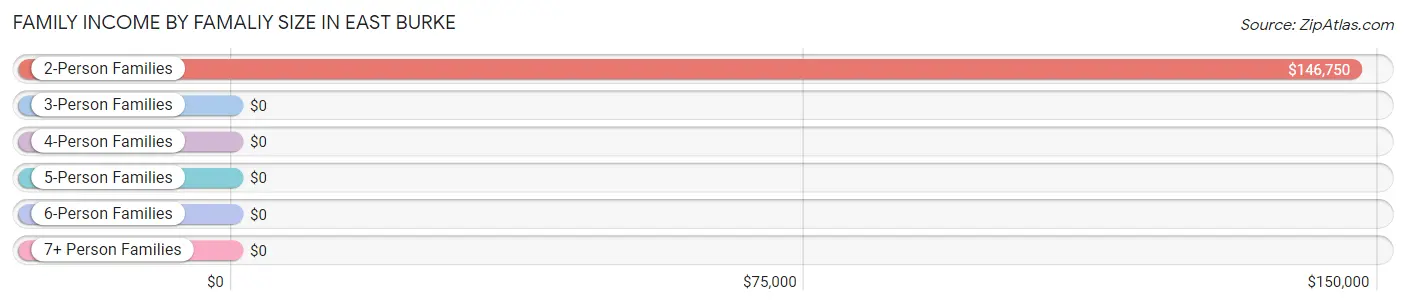
| Income Bracket | # Families | Median Income |
| 2-Person Families | 13 (68.4%) | $146,750 |
| 3-Person Families | 3 (15.8%) | $0 |
| 4-Person Families | 3 (15.8%) | $0 |
| 5-Person Families | 0 (0.0%) | $0 |
| 6-Person Families | 0 (0.0%) | $0 |
| 7+ Person Families | 0 (0.0%) | $0 |
| Total | 19 (100.0%) | $146,750 |
Family Income by Number of Earners in East Burke
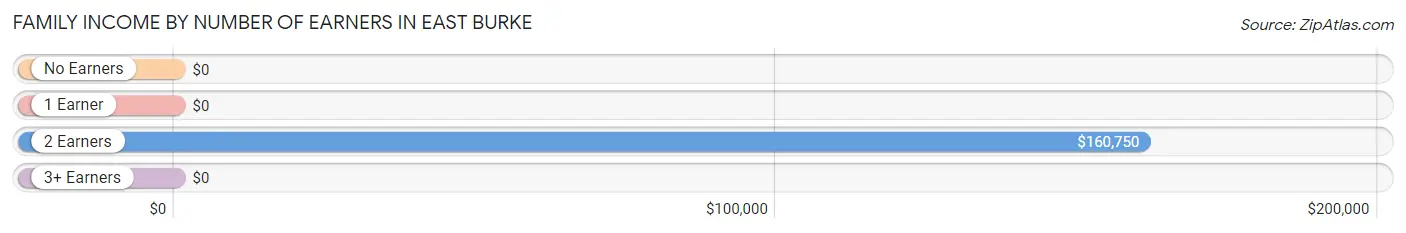
| Number of Earners | # Families | Median Income |
| No Earners | 0 (0.0%) | $0 |
| 1 Earner | 3 (15.8%) | $0 |
| 2 Earners | 13 (68.4%) | $160,750 |
| 3+ Earners | 3 (15.8%) | $0 |
| Total | 19 (100.0%) | $146,750 |
Household Income in East Burke
Household Income Brackets in East Burke
With 21 households falling in the category, the $75,000 to $99,999 income range is the most frequent in East Burke, accounting for 30.4% of all households.
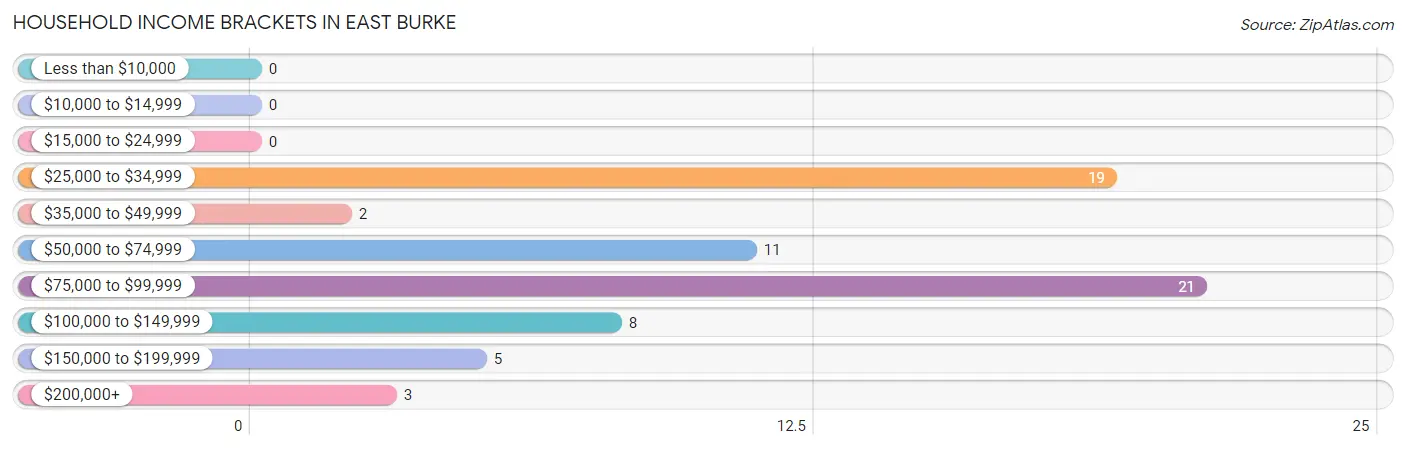
| Income Bracket | # Households | % Households |
| Less than $10,000 | 0 | 0.0% |
| $10,000 to $14,999 | 0 | 0.0% |
| $15,000 to $24,999 | 0 | 0.0% |
| $25,000 to $34,999 | 19 | 27.5% |
| $35,000 to $49,999 | 2 | 2.9% |
| $50,000 to $74,999 | 11 | 15.9% |
| $75,000 to $99,999 | 21 | 30.4% |
| $100,000 to $149,999 | 8 | 11.6% |
| $150,000 to $199,999 | 5 | 7.2% |
| $200,000+ | 3 | 4.3% |
Household Income by Householder Age in East Burke
The median household income in East Burke is $80,298, with the highest median household income of $145,500 found in the 45 to 64 years age bracket for the primary householder. A total of 24 households (34.8%) fall into this category.
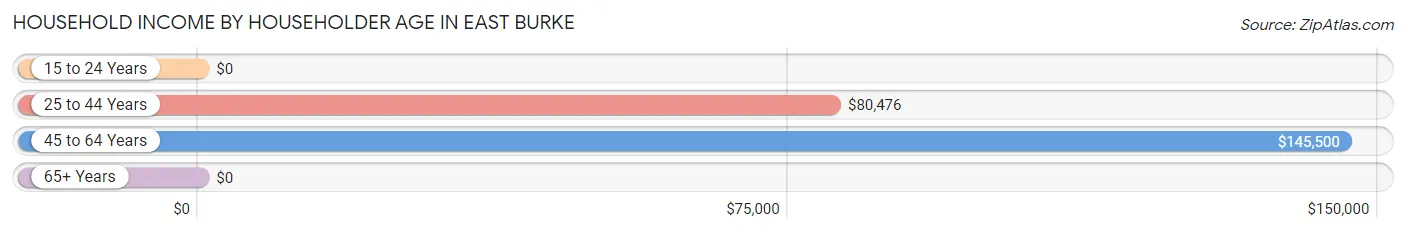
| Income Bracket | # Households | Median Income |
| 15 to 24 Years | 0 (0.0%) | $0 |
| 25 to 44 Years | 40 (58.0%) | $80,476 |
| 45 to 64 Years | 24 (34.8%) | $145,500 |
| 65+ Years | 5 (7.2%) | $0 |
| Total | 69 (100.0%) | $80,298 |
Poverty in East Burke
Income Below Poverty by Sex and Age in East Burke
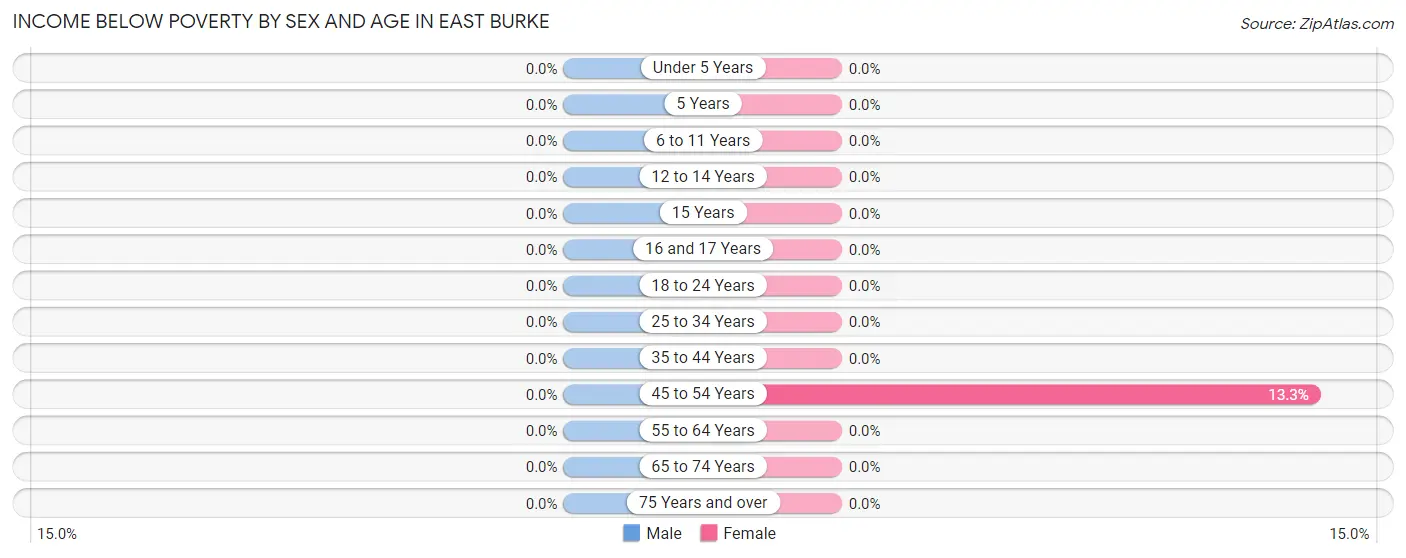
| Age Bracket | Male | Female |
| Under 5 Years | 0 (0.0%) | 0 (0.0%) |
| 5 Years | 0 (0.0%) | 0 (0.0%) |
| 6 to 11 Years | 0 (0.0%) | 0 (0.0%) |
| 12 to 14 Years | 0 (0.0%) | 0 (0.0%) |
| 15 Years | 0 (0.0%) | 0 (0.0%) |
| 16 and 17 Years | 0 (0.0%) | 0 (0.0%) |
| 18 to 24 Years | 0 (0.0%) | 0 (0.0%) |
| 25 to 34 Years | 0 (0.0%) | 0 (0.0%) |
| 35 to 44 Years | 0 (0.0%) | 0 (0.0%) |
| 45 to 54 Years | 0 (0.0%) | 2 (13.3%) |
| 55 to 64 Years | 0 (0.0%) | 0 (0.0%) |
| 65 to 74 Years | 0 (0.0%) | 0 (0.0%) |
| 75 Years and over | 0 (0.0%) | 0 (0.0%) |
| Total | 0 (0.0%) | 2 (4.4%) |
Income Above Poverty by Sex and Age in East Burke
According to the poverty statistics in East Burke, males aged 6 to 11 years and females aged 6 to 11 years are the age groups that are most secure financially, with 100.0% of males and 100.0% of females in these age groups living above the poverty line.
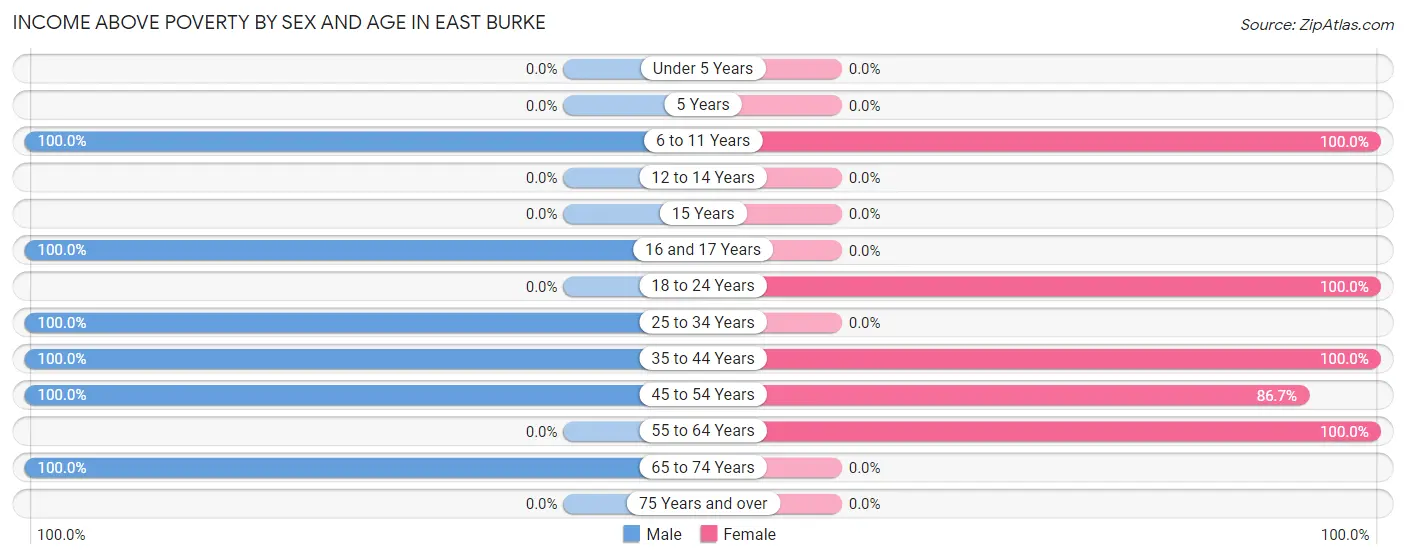
| Age Bracket | Male | Female |
| Under 5 Years | 0 (0.0%) | 0 (0.0%) |
| 5 Years | 0 (0.0%) | 0 (0.0%) |
| 6 to 11 Years | 3 (100.0%) | 2 (100.0%) |
| 12 to 14 Years | 0 (0.0%) | 0 (0.0%) |
| 15 Years | 0 (0.0%) | 0 (0.0%) |
| 16 and 17 Years | 3 (100.0%) | 0 (0.0%) |
| 18 to 24 Years | 0 (0.0%) | 11 (100.0%) |
| 25 to 34 Years | 37 (100.0%) | 0 (0.0%) |
| 35 to 44 Years | 3 (100.0%) | 3 (100.0%) |
| 45 to 54 Years | 14 (100.0%) | 13 (86.7%) |
| 55 to 64 Years | 0 (0.0%) | 14 (100.0%) |
| 65 to 74 Years | 5 (100.0%) | 0 (0.0%) |
| 75 Years and over | 0 (0.0%) | 0 (0.0%) |
| Total | 65 (100.0%) | 43 (95.6%) |
Income Below Poverty Among Married-Couple Families in East Burke
| Children | Above Poverty | Below Poverty |
| No Children | 13 (100.0%) | 0 (0.0%) |
| 1 or 2 Children | 6 (100.0%) | 0 (0.0%) |
| 3 or 4 Children | 0 (0.0%) | 0 (0.0%) |
| 5 or more Children | 0 (0.0%) | 0 (0.0%) |
| Total | 19 (100.0%) | 0 (0.0%) |
Income Below Poverty Among Single-Parent Households in East Burke
| Children | Single Father | Single Mother |
| No Children | 0 (0.0%) | 0 (0.0%) |
| 1 or 2 Children | 0 (0.0%) | 0 (0.0%) |
| 3 or 4 Children | 0 (0.0%) | 0 (0.0%) |
| 5 or more Children | 0 (0.0%) | 0 (0.0%) |
| Total | 0 (0.0%) | 0 (0.0%) |
Income Below Poverty Among Married-Couple vs Single-Parent Households in East Burke
| Children | Married-Couple Families | Single-Parent Households |
| No Children | 0 (0.0%) | 0 (0.0%) |
| 1 or 2 Children | 0 (0.0%) | 0 (0.0%) |
| 3 or 4 Children | 0 (0.0%) | 0 (0.0%) |
| 5 or more Children | 0 (0.0%) | 0 (0.0%) |
| Total | 0 (0.0%) | 0 (0.0%) |
Race in East Burke
The most populous races in East Burke are White / Caucasian (107 | 97.3%), and Two or more Races (3 | 2.7%).
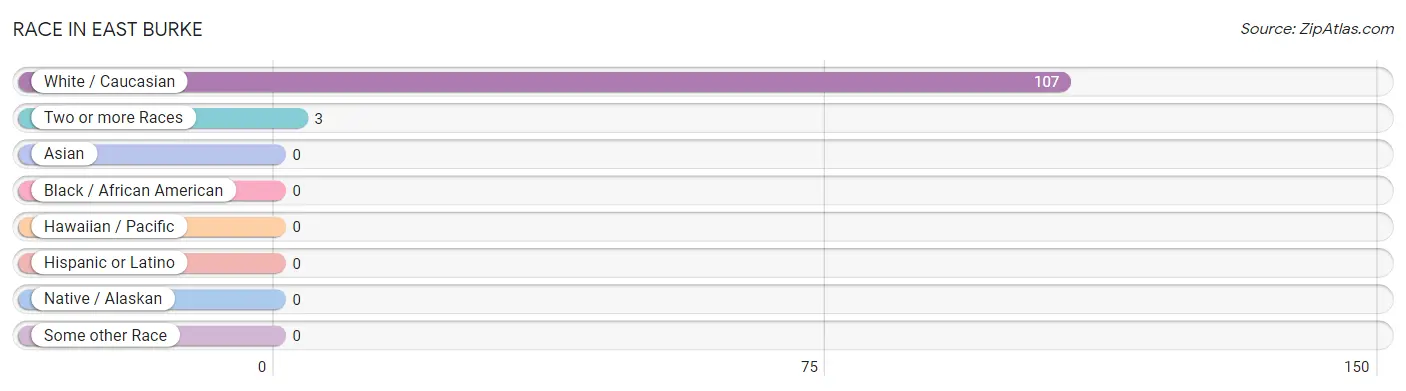
| Race | # Population | % Population |
| Asian | 0 | 0.0% |
| Black / African American | 0 | 0.0% |
| Hawaiian / Pacific | 0 | 0.0% |
| Hispanic or Latino | 0 | 0.0% |
| Native / Alaskan | 0 | 0.0% |
| White / Caucasian | 107 | 97.3% |
| Two or more Races | 3 | 2.7% |
| Some other Race | 0 | 0.0% |
| Total | 110 | 100.0% |
Ancestry in East Burke
The most populous ancestries reported in East Burke are Scandinavian (16 | 14.5%), English (13 | 11.8%), Lithuanian (11 | 10.0%), French (7 | 6.4%), and Italian (6 | 5.4%), together accounting for 48.2% of all East Burke residents.
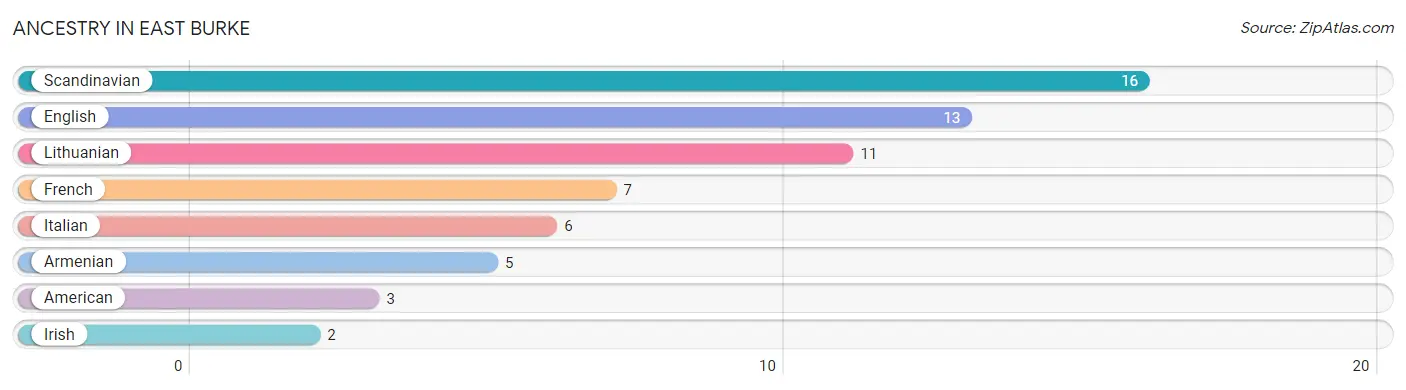
| Ancestry | # Population | % Population |
| American | 3 | 2.7% |
| Armenian | 5 | 4.5% |
| English | 13 | 11.8% |
| French | 7 | 6.4% |
| Irish | 2 | 1.8% |
| Italian | 6 | 5.4% |
| Lithuanian | 11 | 10.0% |
| Scandinavian | 16 | 14.5% | View All 8 Rows |
Immigrants in East Burke
The most numerous immigrant groups reported in East Burke came from Brazil (3 | 2.7%), Latin America (3 | 2.7%), and South America (3 | 2.7%), together accounting for 8.2% of all East Burke residents.
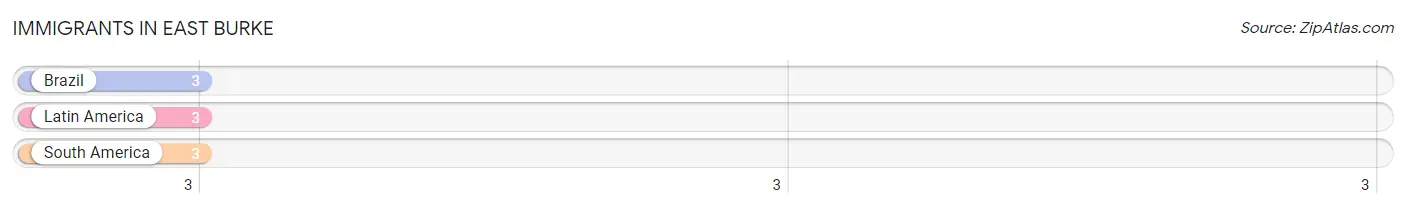
| Immigration Origin | # Population | % Population |
| Brazil | 3 | 2.7% |
| Latin America | 3 | 2.7% |
| South America | 3 | 2.7% | View All 3 Rows |
Sex and Age in East Burke
Sex and Age in East Burke
The most populous age groups in East Burke are 25 to 29 Years (21 | 32.3%) for men and 60 to 64 Years (14 | 31.1%) for women.
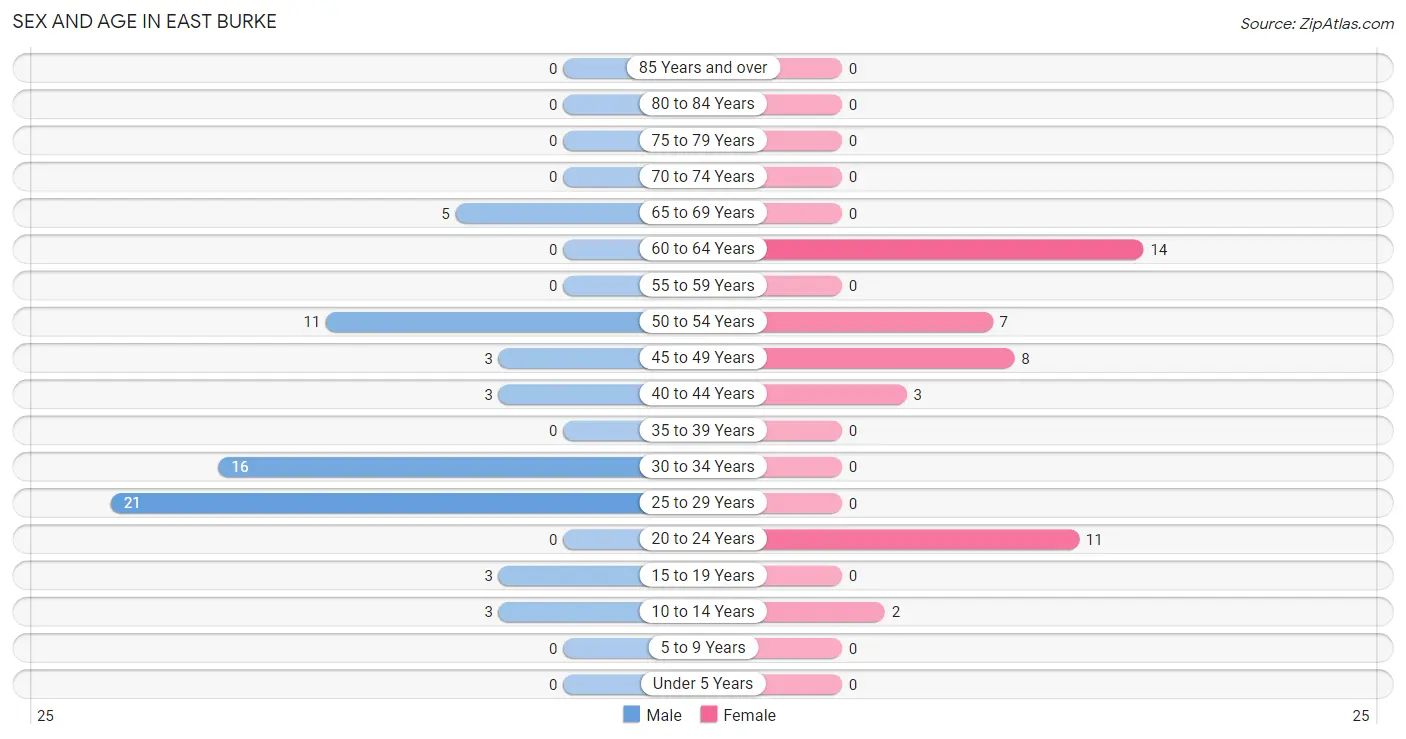
| Age Bracket | Male | Female |
| Under 5 Years | 0 (0.0%) | 0 (0.0%) |
| 5 to 9 Years | 0 (0.0%) | 0 (0.0%) |
| 10 to 14 Years | 3 (4.6%) | 2 (4.4%) |
| 15 to 19 Years | 3 (4.6%) | 0 (0.0%) |
| 20 to 24 Years | 0 (0.0%) | 11 (24.4%) |
| 25 to 29 Years | 21 (32.3%) | 0 (0.0%) |
| 30 to 34 Years | 16 (24.6%) | 0 (0.0%) |
| 35 to 39 Years | 0 (0.0%) | 0 (0.0%) |
| 40 to 44 Years | 3 (4.6%) | 3 (6.7%) |
| 45 to 49 Years | 3 (4.6%) | 8 (17.8%) |
| 50 to 54 Years | 11 (16.9%) | 7 (15.6%) |
| 55 to 59 Years | 0 (0.0%) | 0 (0.0%) |
| 60 to 64 Years | 0 (0.0%) | 14 (31.1%) |
| 65 to 69 Years | 5 (7.7%) | 0 (0.0%) |
| 70 to 74 Years | 0 (0.0%) | 0 (0.0%) |
| 75 to 79 Years | 0 (0.0%) | 0 (0.0%) |
| 80 to 84 Years | 0 (0.0%) | 0 (0.0%) |
| 85 Years and over | 0 (0.0%) | 0 (0.0%) |
| Total | 65 (100.0%) | 45 (100.0%) |
Families and Households in East Burke
Median Family Size in East Burke
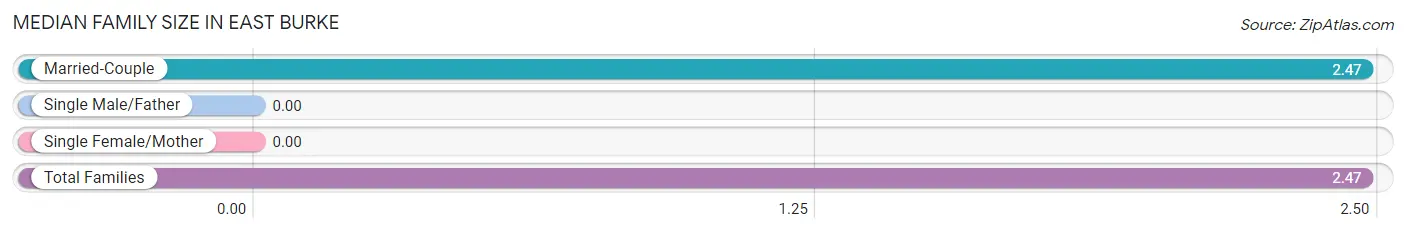
| Family Type | # Families | Family Size |
| Married-Couple | 19 (100.0%) | 2.47 |
| Single Male/Father | 0 (0.0%) | - |
| Single Female/Mother | 0 (0.0%) | - |
| Total Families | 19 (100.0%) | 2.47 |
Median Household Size in East Burke
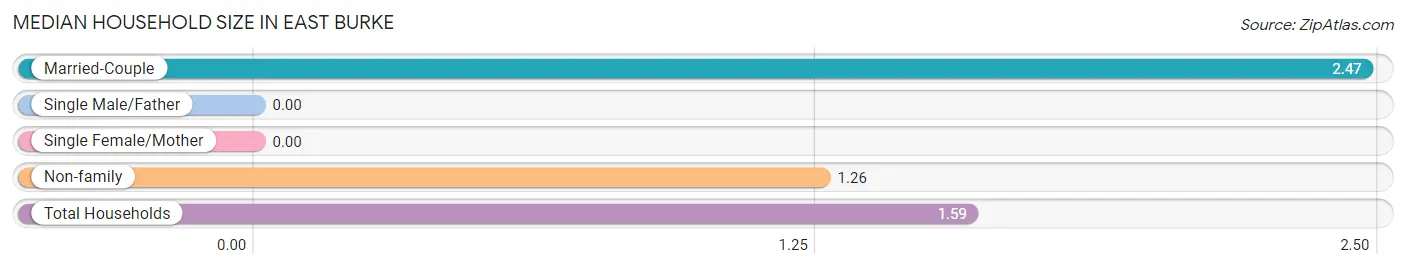
| Household Type | # Households | Household Size |
| Married-Couple | 19 (27.5%) | 2.47 |
| Single Male/Father | 0 (0.0%) | - |
| Single Female/Mother | 0 (0.0%) | - |
| Non-family | 50 (72.5%) | 1.26 |
| Total Households | 69 (100.0%) | 1.59 |
Household Size by Marriage Status in East Burke
Out of a total of 69 households in East Burke, 19 (27.5%) are family households, while 50 (72.5%) are nonfamily households. The most numerous type of family households are 2-person households, comprising 13, and the most common type of nonfamily households are 1-person households, comprising 27.
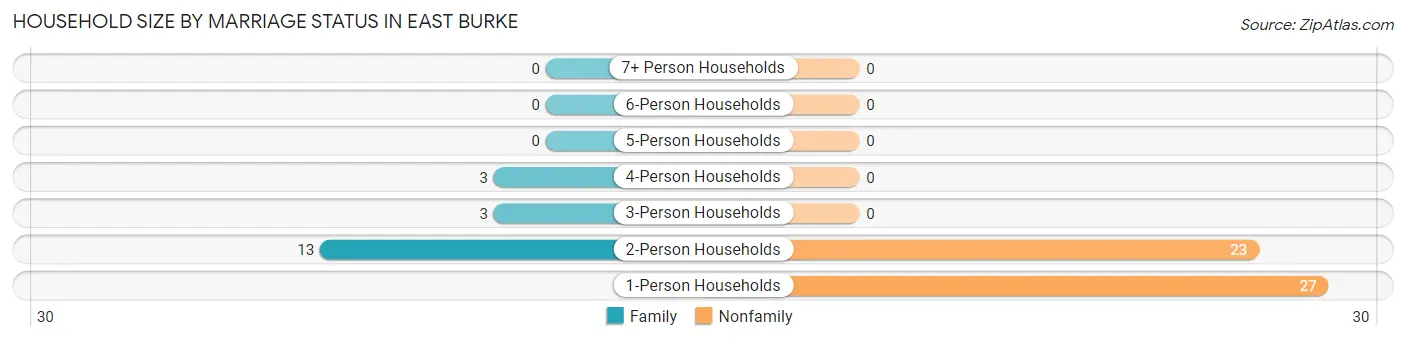
| Household Size | Family Households | Nonfamily Households |
| 1-Person Households | - | 27 (39.1%) |
| 2-Person Households | 13 (18.8%) | 23 (33.3%) |
| 3-Person Households | 3 (4.3%) | 0 (0.0%) |
| 4-Person Households | 3 (4.3%) | 0 (0.0%) |
| 5-Person Households | 0 (0.0%) | 0 (0.0%) |
| 6-Person Households | 0 (0.0%) | 0 (0.0%) |
| 7+ Person Households | 0 (0.0%) | 0 (0.0%) |
| Total | 19 (27.5%) | 50 (72.5%) |
Female Fertility in East Burke
Fertility by Age in East Burke
| Age Bracket | Women with Births | Births / 1,000 Women |
| 15 to 19 years | 0 (0.0%) | 0.0 |
| 20 to 34 years | 0 (0.0%) | 0.0 |
| 35 to 50 years | 0 (0.0%) | 0.0 |
| Total | 0 (0.0%) | 0.0 |
Fertility by Age by Marriage Status in East Burke
| Age Bracket | Married | Unmarried |
| 15 to 19 years | 0 (0.0%) | 0 (0.0%) |
| 20 to 34 years | 0 (0.0%) | 0 (0.0%) |
| 35 to 50 years | 0 (0.0%) | 0 (0.0%) |
| Total | 0 (0.0%) | 0 (0.0%) |
Fertility by Education in East Burke
| Educational Attainment | Women with Births | Births / 1,000 Women |
| Less than High School | 0 (0.0%) | 0.0 |
| High School Diploma | 0 (0.0%) | 0.0 |
| College or Associate's Degree | 0 (0.0%) | 0.0 |
| Bachelor's Degree | 0 (0.0%) | 0.0 |
| Graduate Degree | 0 (0.0%) | 0.0 |
| Total | 0 (0.0%) | 0.0 |
Fertility by Education by Marriage Status in East Burke
| Educational Attainment | Married | Unmarried |
| Less than High School | 0 (0.0%) | 0 (0.0%) |
| High School Diploma | 0 (0.0%) | 0 (0.0%) |
| College or Associate's Degree | 0 (0.0%) | 0 (0.0%) |
| Bachelor's Degree | 0 (0.0%) | 0 (0.0%) |
| Graduate Degree | 0 (0.0%) | 0 (0.0%) |
| Total | 0 (0.0%) | 0 (0.0%) |
Employment Characteristics in East Burke
Employment by Class of Employer in East Burke
Among the 83 employed individuals in East Burke, local government employees (27 | 32.5%), private company employees (22 | 26.5%), and self-employed (not incorporated) (14 | 16.9%) make up the most common classes of employment.
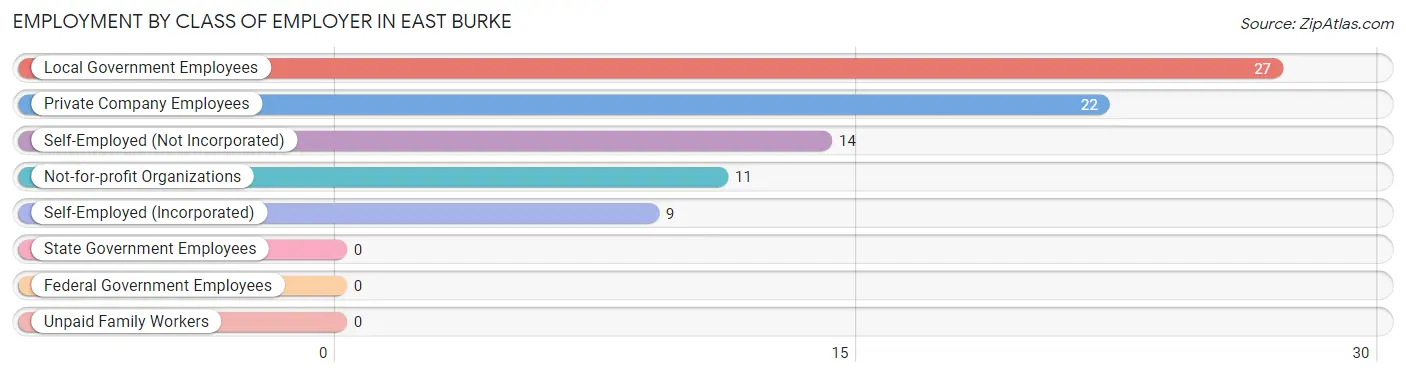
| Employer Class | # Employees | % Employees |
| Private Company Employees | 22 | 26.5% |
| Self-Employed (Incorporated) | 9 | 10.8% |
| Self-Employed (Not Incorporated) | 14 | 16.9% |
| Not-for-profit Organizations | 11 | 13.3% |
| Local Government Employees | 27 | 32.5% |
| State Government Employees | 0 | 0.0% |
| Federal Government Employees | 0 | 0.0% |
| Unpaid Family Workers | 0 | 0.0% |
| Total | 83 | 100.0% |
Employment Status by Age in East Burke
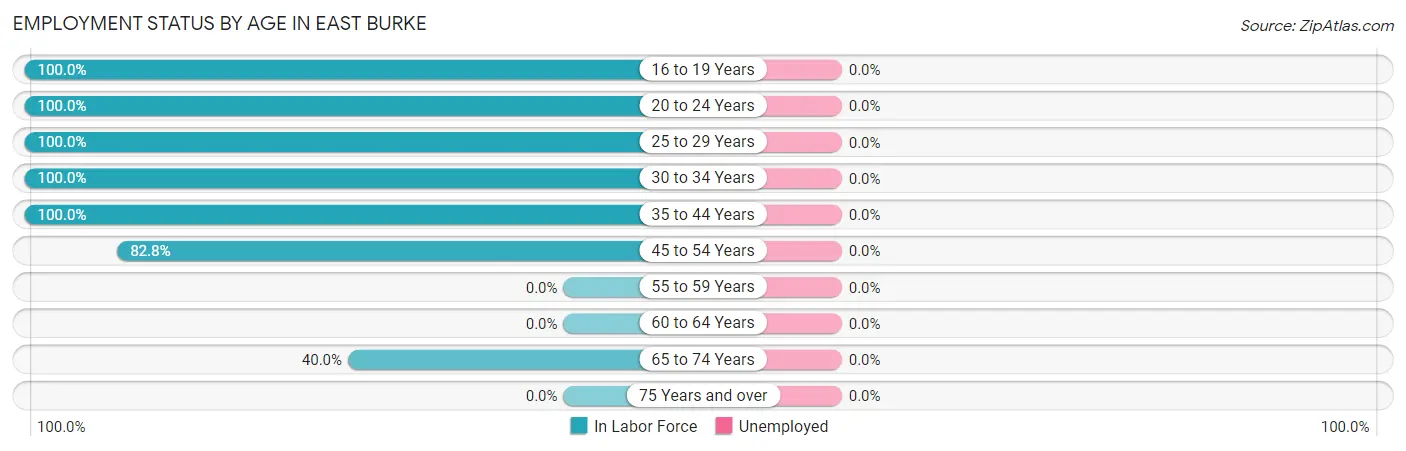
| Age Bracket | In Labor Force | Unemployed |
| 16 to 19 Years | 3 (100.0%) | 0 (0.0%) |
| 20 to 24 Years | 11 (100.0%) | 0 (0.0%) |
| 25 to 29 Years | 21 (100.0%) | 0 (0.0%) |
| 30 to 34 Years | 16 (100.0%) | 0 (0.0%) |
| 35 to 44 Years | 6 (100.0%) | 0 (0.0%) |
| 45 to 54 Years | 24 (82.8%) | 0 (0.0%) |
| 55 to 59 Years | 0 (0.0%) | 0 (0.0%) |
| 60 to 64 Years | 0 (0.0%) | 0 (0.0%) |
| 65 to 74 Years | 2 (40.0%) | 0 (0.0%) |
| 75 Years and over | 0 (0.0%) | 0 (0.0%) |
| Total | 83 (79.0%) | 0 (0.0%) |
Employment Status by Educational Attainment in East Burke
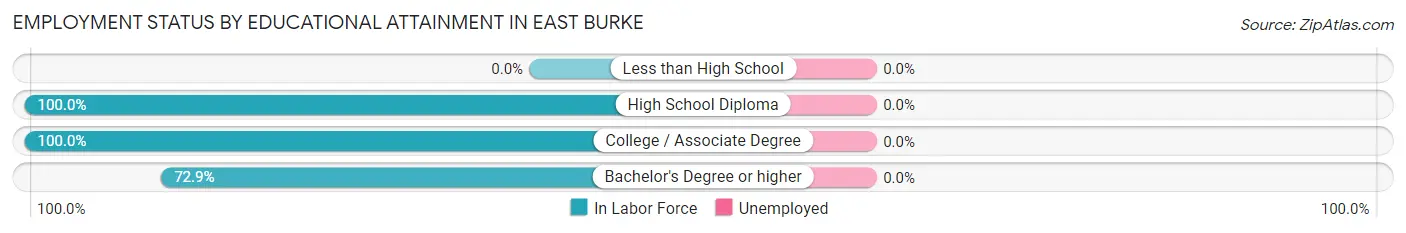
| Educational Attainment | In Labor Force | Unemployed |
| Less than High School | 0 (0.0%) | 0 (0.0%) |
| High School Diploma | 8 (100.0%) | 0 (0.0%) |
| College / Associate Degree | 16 (100.0%) | 0 (0.0%) |
| Bachelor's Degree or higher | 43 (72.9%) | 0 (0.0%) |
| Total | 67 (77.9%) | 0 (0.0%) |
Employment Occupations by Sex in East Burke
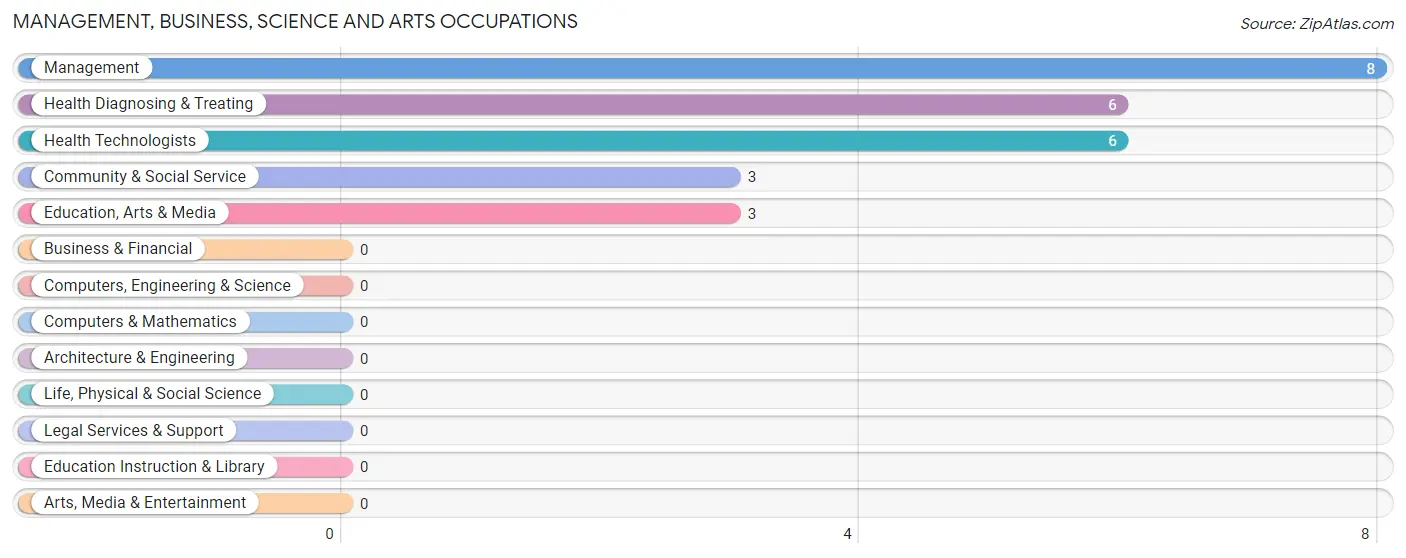
Management, Business, Science and Arts Occupations
The most common Management, Business, Science and Arts occupations in East Burke are Management (8 | 9.6%), Health Diagnosing & Treating (6 | 7.2%), Health Technologists (6 | 7.2%), Community & Social Service (3 | 3.6%), and Education, Arts & Media (3 | 3.6%).
Management, Business, Science and Arts Occupations by Sex
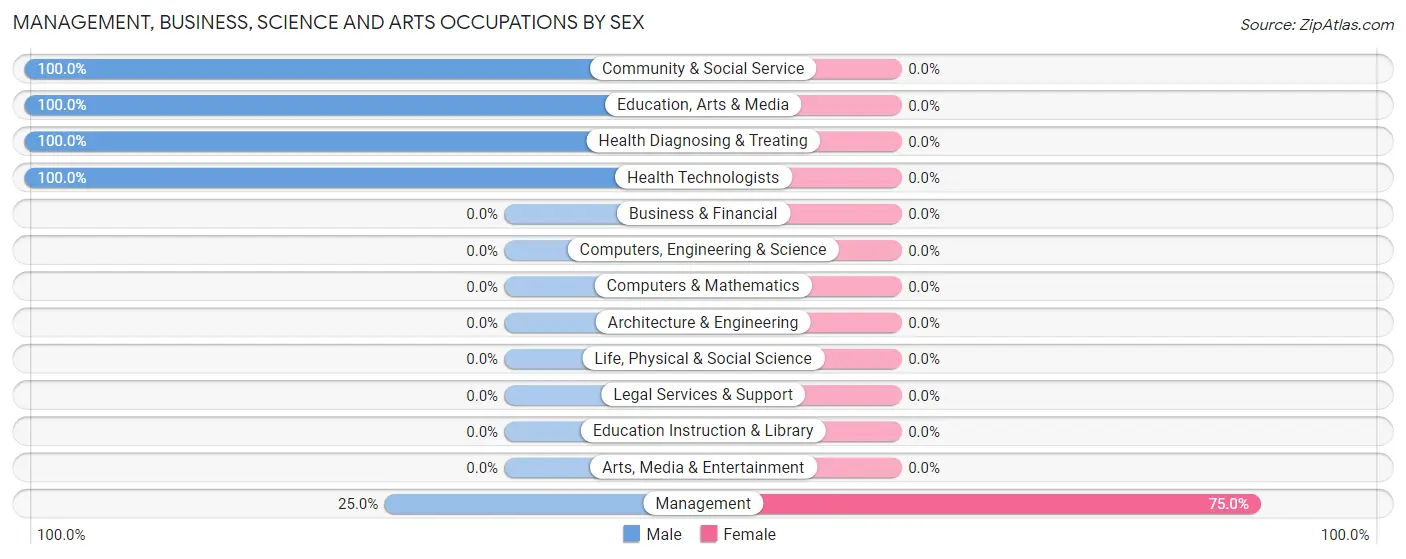
| Occupation | Male | Female |
| Management | 2 (25.0%) | 6 (75.0%) |
| Business & Financial | 0 (0.0%) | 0 (0.0%) |
| Computers, Engineering & Science | 0 (0.0%) | 0 (0.0%) |
| Computers & Mathematics | 0 (0.0%) | 0 (0.0%) |
| Architecture & Engineering | 0 (0.0%) | 0 (0.0%) |
| Life, Physical & Social Science | 0 (0.0%) | 0 (0.0%) |
| Community & Social Service | 3 (100.0%) | 0 (0.0%) |
| Education, Arts & Media | 3 (100.0%) | 0 (0.0%) |
| Legal Services & Support | 0 (0.0%) | 0 (0.0%) |
| Education Instruction & Library | 0 (0.0%) | 0 (0.0%) |
| Arts, Media & Entertainment | 0 (0.0%) | 0 (0.0%) |
| Health Diagnosing & Treating | 6 (100.0%) | 0 (0.0%) |
| Health Technologists | 6 (100.0%) | 0 (0.0%) |
| Total (Category) | 11 (64.7%) | 6 (35.3%) |
| Total (Overall) | 59 (71.1%) | 24 (28.9%) |
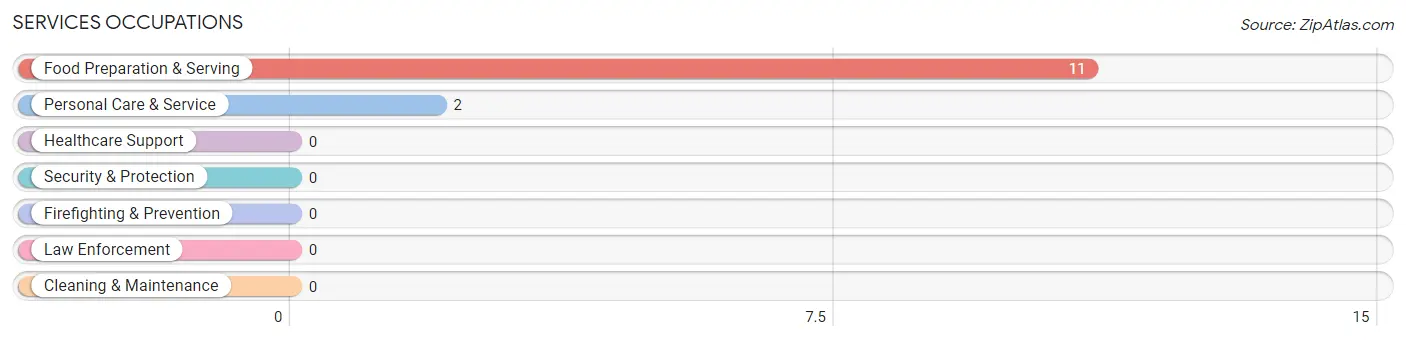
Services Occupations
The most common Services occupations in East Burke are Food Preparation & Serving (11 | 13.3%), and Personal Care & Service (2 | 2.4%).
Services Occupations by Sex
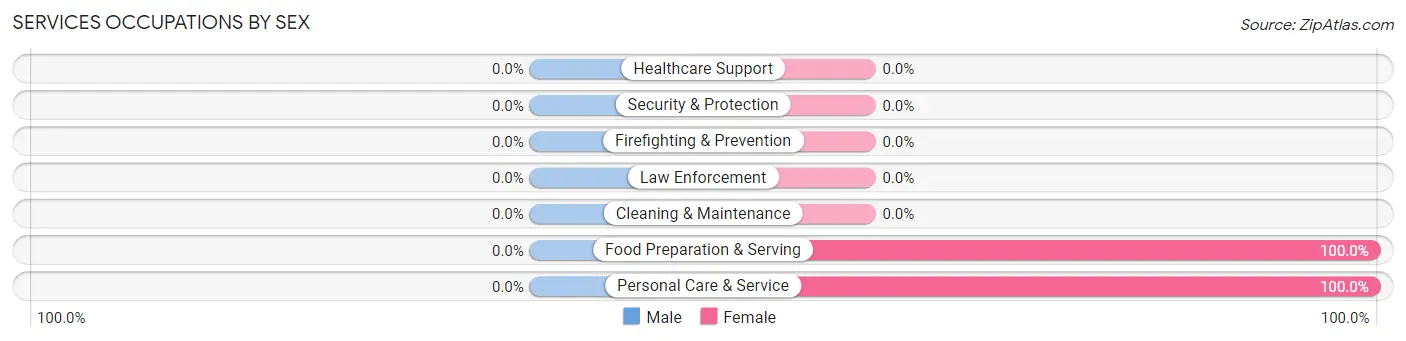
| Occupation | Male | Female |
| Healthcare Support | 0 (0.0%) | 0 (0.0%) |
| Security & Protection | 0 (0.0%) | 0 (0.0%) |
| Firefighting & Prevention | 0 (0.0%) | 0 (0.0%) |
| Law Enforcement | 0 (0.0%) | 0 (0.0%) |
| Food Preparation & Serving | 0 (0.0%) | 11 (100.0%) |
| Cleaning & Maintenance | 0 (0.0%) | 0 (0.0%) |
| Personal Care & Service | 0 (0.0%) | 2 (100.0%) |
| Total (Category) | 0 (0.0%) | 13 (100.0%) |
| Total (Overall) | 59 (71.1%) | 24 (28.9%) |
Sales and Office Occupations
The most common Sales and Office occupations in East Burke are , and Sales & Related (8 | 9.6%).
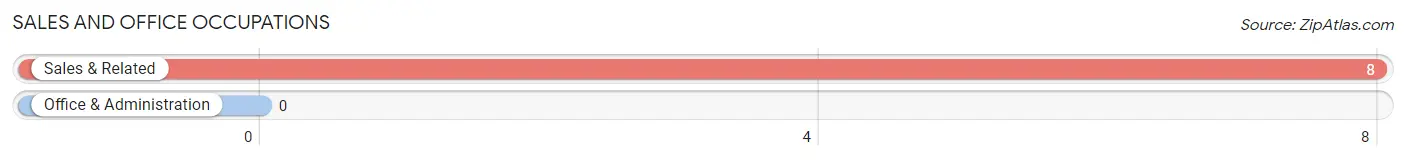
Sales and Office Occupations by Sex
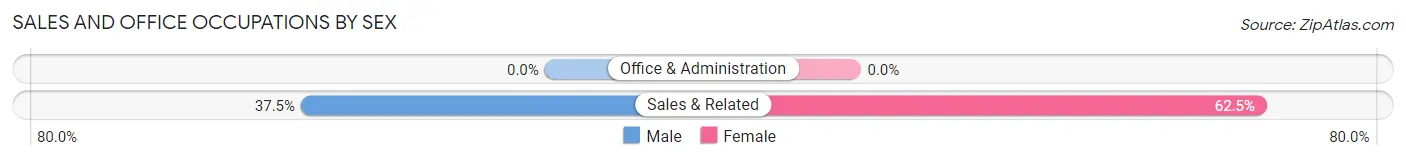
| Occupation | Male | Female |
| Sales & Related | 3 (37.5%) | 5 (62.5%) |
| Office & Administration | 0 (0.0%) | 0 (0.0%) |
| Total (Category) | 3 (37.5%) | 5 (62.5%) |
| Total (Overall) | 59 (71.1%) | 24 (28.9%) |
Natural Resources, Construction and Maintenance Occupations
The most common Natural Resources, Construction and Maintenance occupations in East Burke are , and Farming, Fishing & Forestry (3 | 3.6%).
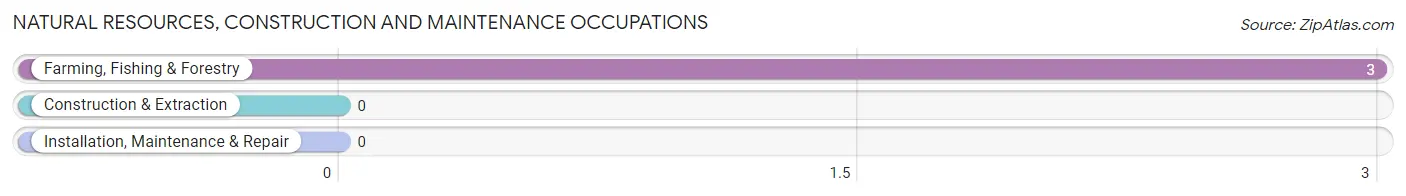
Natural Resources, Construction and Maintenance Occupations by Sex
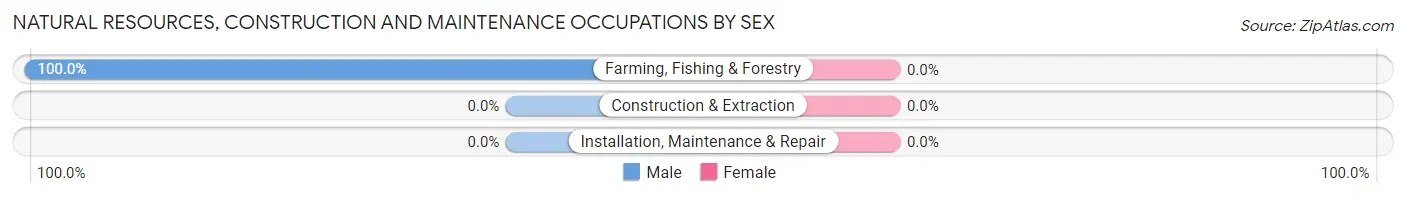
| Occupation | Male | Female |
| Farming, Fishing & Forestry | 3 (100.0%) | 0 (0.0%) |
| Construction & Extraction | 0 (0.0%) | 0 (0.0%) |
| Installation, Maintenance & Repair | 0 (0.0%) | 0 (0.0%) |
| Total (Category) | 3 (100.0%) | 0 (0.0%) |
| Total (Overall) | 59 (71.1%) | 24 (28.9%) |
Production, Transportation and Moving Occupations
The most common Production, Transportation and Moving occupations in East Burke are , and Production (42 | 50.6%).
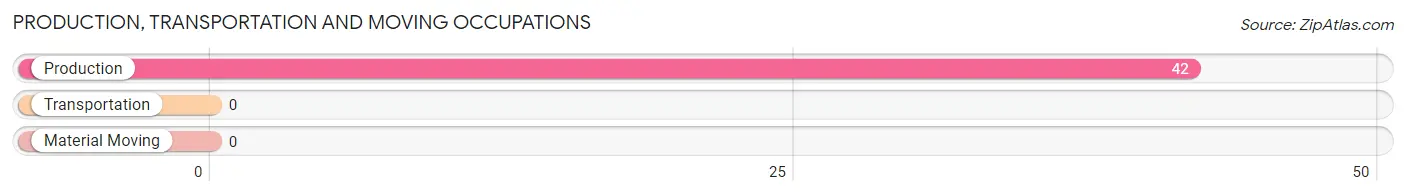
Production, Transportation and Moving Occupations by Sex
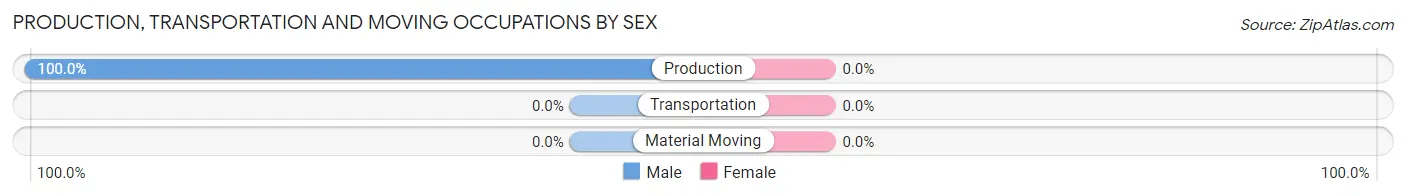
| Occupation | Male | Female |
| Production | 42 (100.0%) | 0 (0.0%) |
| Transportation | 0 (0.0%) | 0 (0.0%) |
| Material Moving | 0 (0.0%) | 0 (0.0%) |
| Total (Category) | 42 (100.0%) | 0 (0.0%) |
| Total (Overall) | 59 (71.1%) | 24 (28.9%) |
Employment Industries by Sex in East Burke
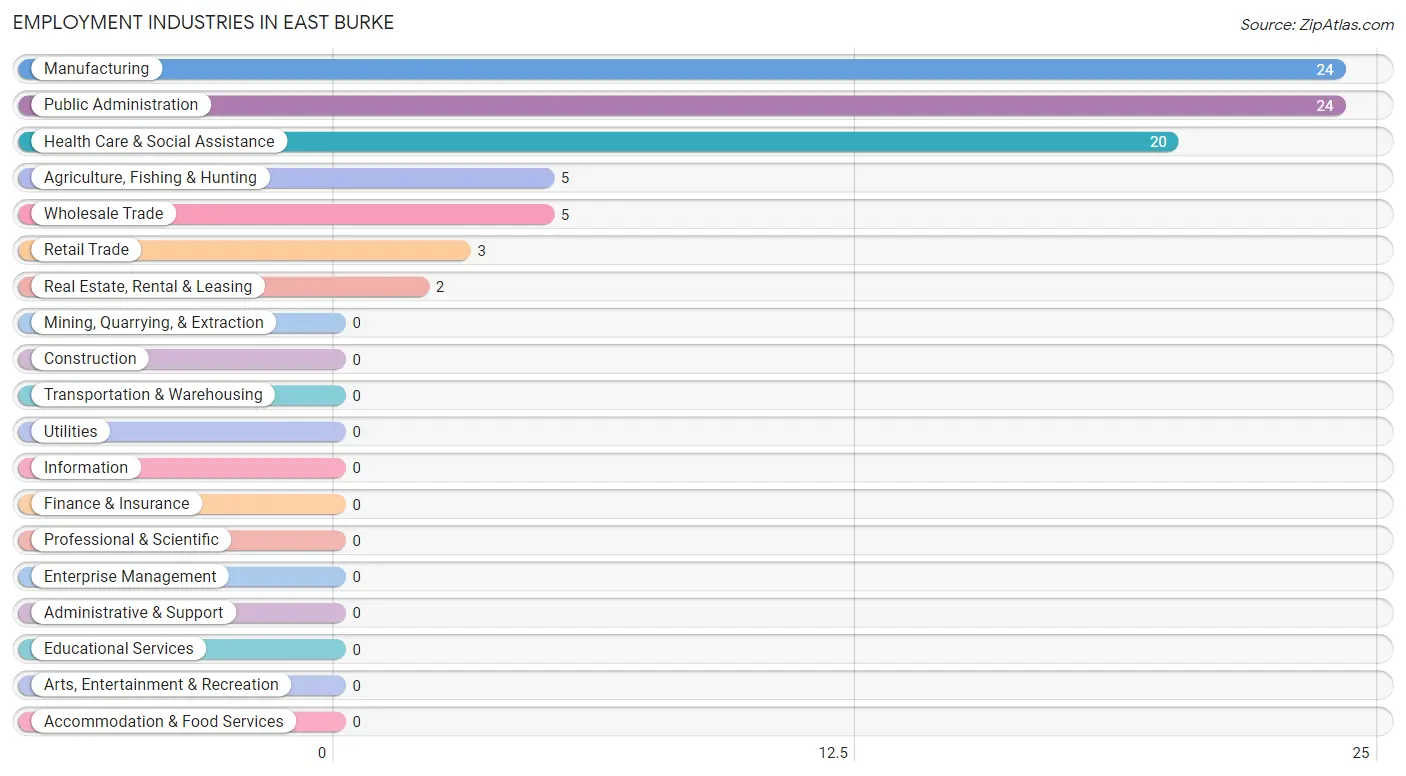
Employment Industries in East Burke
The major employment industries in East Burke include Manufacturing (24 | 28.9%), Public Administration (24 | 28.9%), Health Care & Social Assistance (20 | 24.1%), Agriculture, Fishing & Hunting (5 | 6.0%), and Wholesale Trade (5 | 6.0%).
Employment Industries by Sex in East Burke
The East Burke industries that see more men than women are Retail Trade (100.0%), Real Estate, Rental & Leasing (100.0%), and Manufacturing (87.5%), whereas the industries that tend to have a higher number of women are Wholesale Trade (100.0%), Health Care & Social Assistance (55.0%), and Agriculture, Fishing & Hunting (40.0%).
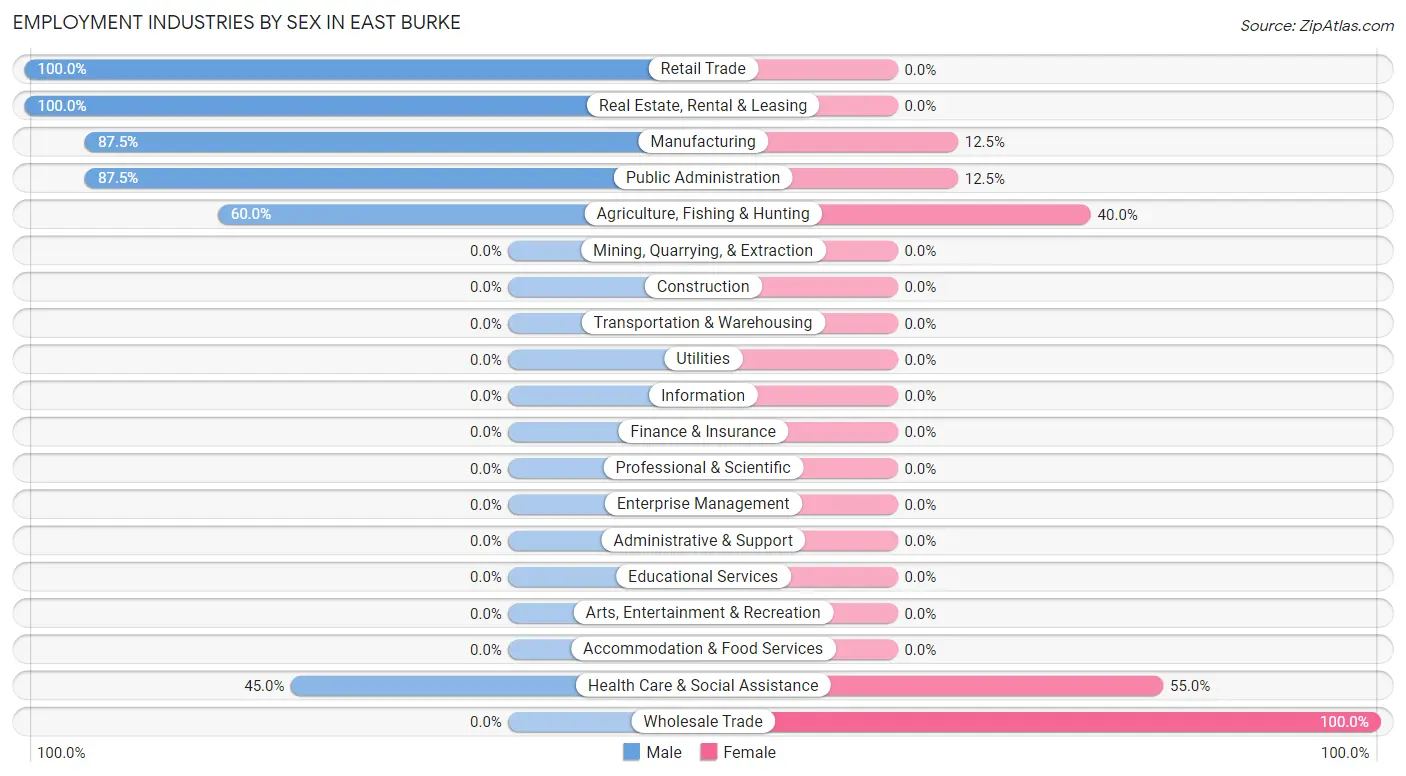
| Industry | Male | Female |
| Agriculture, Fishing & Hunting | 3 (60.0%) | 2 (40.0%) |
| Mining, Quarrying, & Extraction | 0 (0.0%) | 0 (0.0%) |
| Construction | 0 (0.0%) | 0 (0.0%) |
| Manufacturing | 21 (87.5%) | 3 (12.5%) |
| Wholesale Trade | 0 (0.0%) | 5 (100.0%) |
| Retail Trade | 3 (100.0%) | 0 (0.0%) |
| Transportation & Warehousing | 0 (0.0%) | 0 (0.0%) |
| Utilities | 0 (0.0%) | 0 (0.0%) |
| Information | 0 (0.0%) | 0 (0.0%) |
| Finance & Insurance | 0 (0.0%) | 0 (0.0%) |
| Real Estate, Rental & Leasing | 2 (100.0%) | 0 (0.0%) |
| Professional & Scientific | 0 (0.0%) | 0 (0.0%) |
| Enterprise Management | 0 (0.0%) | 0 (0.0%) |
| Administrative & Support | 0 (0.0%) | 0 (0.0%) |
| Educational Services | 0 (0.0%) | 0 (0.0%) |
| Health Care & Social Assistance | 9 (45.0%) | 11 (55.0%) |
| Arts, Entertainment & Recreation | 0 (0.0%) | 0 (0.0%) |
| Accommodation & Food Services | 0 (0.0%) | 0 (0.0%) |
| Public Administration | 21 (87.5%) | 3 (12.5%) |
| Total | 59 (71.1%) | 24 (28.9%) |
Education in East Burke
School Enrollment in East Burke
The most common levels of schooling among the 8 students in East Burke are middle school (3 | 37.5%), high school (3 | 37.5%), and elementary school (2 | 25.0%).
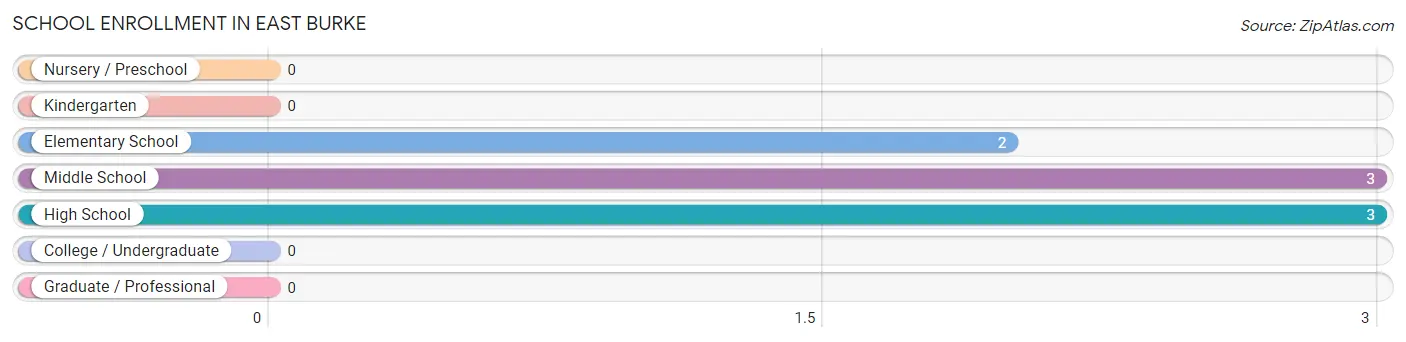
| School Level | # Students | % Students |
| Nursery / Preschool | 0 | 0.0% |
| Kindergarten | 0 | 0.0% |
| Elementary School | 2 | 25.0% |
| Middle School | 3 | 37.5% |
| High School | 3 | 37.5% |
| College / Undergraduate | 0 | 0.0% |
| Graduate / Professional | 0 | 0.0% |
| Total | 8 | 100.0% |
School Enrollment by Age by Funding Source in East Burke
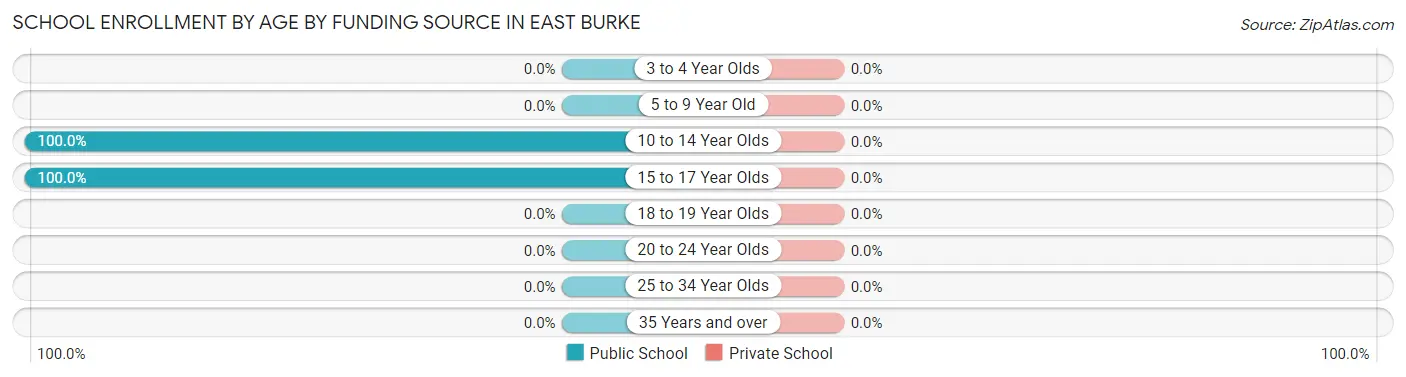
| Age Bracket | Public School | Private School |
| 3 to 4 Year Olds | 0 (0.0%) | 0 (0.0%) |
| 5 to 9 Year Old | 0 (0.0%) | 0 (0.0%) |
| 10 to 14 Year Olds | 5 (100.0%) | 0 (0.0%) |
| 15 to 17 Year Olds | 3 (100.0%) | 0 (0.0%) |
| 18 to 19 Year Olds | 0 (0.0%) | 0 (0.0%) |
| 20 to 24 Year Olds | 0 (0.0%) | 0 (0.0%) |
| 25 to 34 Year Olds | 0 (0.0%) | 0 (0.0%) |
| 35 Years and over | 0 (0.0%) | 0 (0.0%) |
| Total | 8 (100.0%) | 0 (0.0%) |
Educational Attainment by Field of Study in East Burke
Arts & humanities (21 | 28.8%), liberal arts & history (14 | 19.2%), social sciences (10 | 13.7%), communications (8 | 11.0%), and bio, nature & agricultural (6 | 8.2%) are the most common fields of study among 73 individuals in East Burke who have obtained a bachelor's degree or higher.
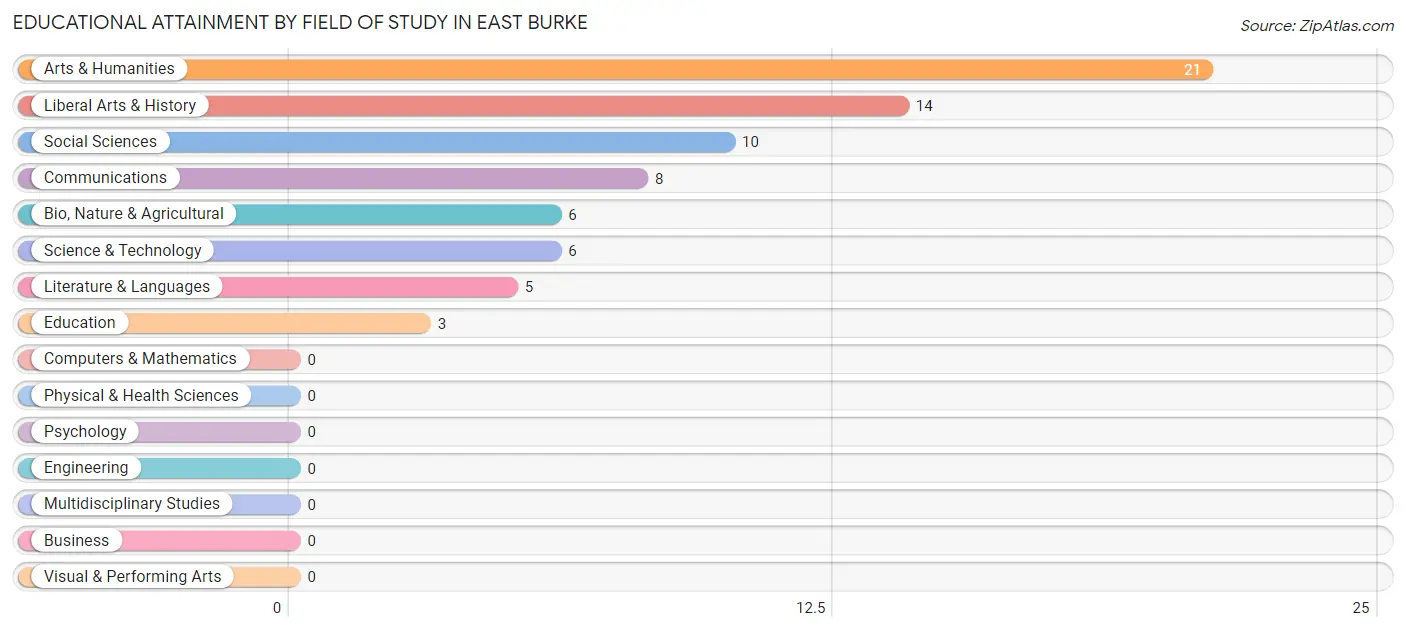
| Field of Study | # Graduates | % Graduates |
| Computers & Mathematics | 0 | 0.0% |
| Bio, Nature & Agricultural | 6 | 8.2% |
| Physical & Health Sciences | 0 | 0.0% |
| Psychology | 0 | 0.0% |
| Social Sciences | 10 | 13.7% |
| Engineering | 0 | 0.0% |
| Multidisciplinary Studies | 0 | 0.0% |
| Science & Technology | 6 | 8.2% |
| Business | 0 | 0.0% |
| Education | 3 | 4.1% |
| Literature & Languages | 5 | 6.9% |
| Liberal Arts & History | 14 | 19.2% |
| Visual & Performing Arts | 0 | 0.0% |
| Communications | 8 | 11.0% |
| Arts & Humanities | 21 | 28.8% |
| Total | 73 | 100.0% |
Transportation & Commute in East Burke
Vehicle Availability by Sex in East Burke
The most prevalent vehicle ownership categories in East Burke are males with 1 vehicle (37, accounting for 62.7%) and females with 1 vehicle (11, making up 154.2%).
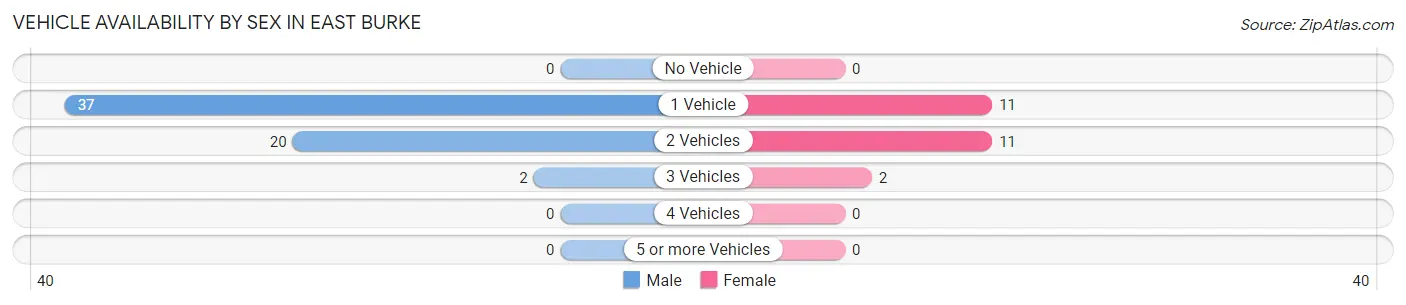
| Vehicles Available | Male | Female |
| No Vehicle | 0 (0.0%) | 0 (0.0%) |
| 1 Vehicle | 37 (62.7%) | 11 (45.8%) |
| 2 Vehicles | 20 (33.9%) | 11 (45.8%) |
| 3 Vehicles | 2 (3.4%) | 2 (8.3%) |
| 4 Vehicles | 0 (0.0%) | 0 (0.0%) |
| 5 or more Vehicles | 0 (0.0%) | 0 (0.0%) |
| Total | 59 (100.0%) | 24 (100.0%) |
Commute Time in East Burke
The most frequently occuring commute durations in East Burke are 10 to 14 minutes (26 commuters, 36.1%), 40 to 44 minutes (16 commuters, 22.2%), and 20 to 24 minutes (14 commuters, 19.4%).
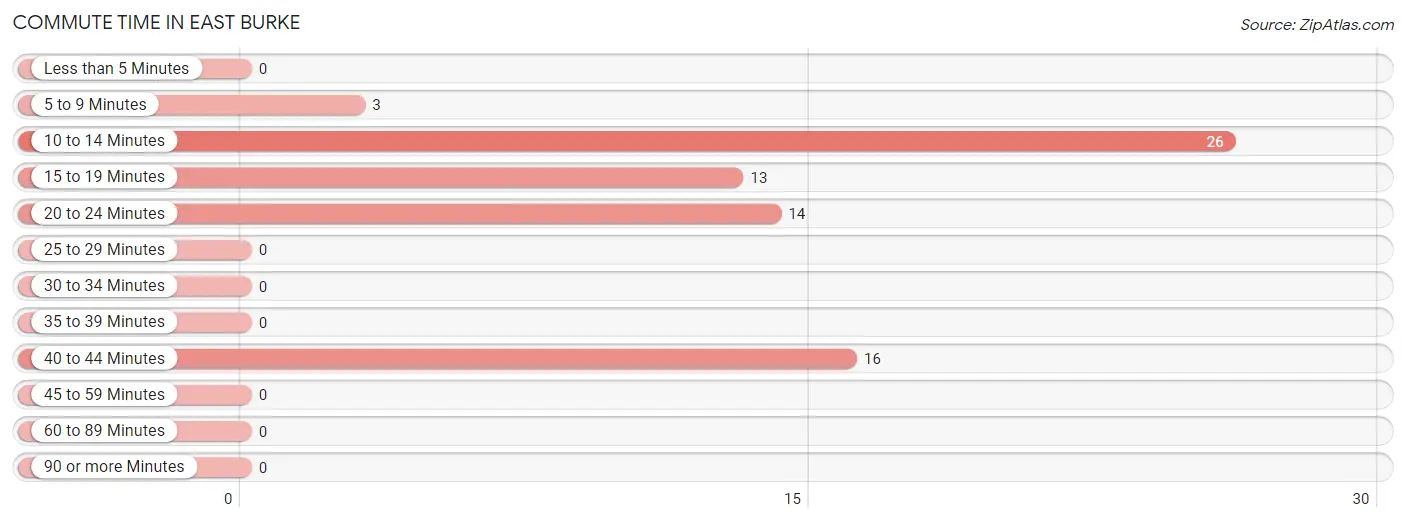
| Commute Time | # Commuters | % Commuters |
| Less than 5 Minutes | 0 | 0.0% |
| 5 to 9 Minutes | 3 | 4.2% |
| 10 to 14 Minutes | 26 | 36.1% |
| 15 to 19 Minutes | 13 | 18.1% |
| 20 to 24 Minutes | 14 | 19.4% |
| 25 to 29 Minutes | 0 | 0.0% |
| 30 to 34 Minutes | 0 | 0.0% |
| 35 to 39 Minutes | 0 | 0.0% |
| 40 to 44 Minutes | 16 | 22.2% |
| 45 to 59 Minutes | 0 | 0.0% |
| 60 to 89 Minutes | 0 | 0.0% |
| 90 or more Minutes | 0 | 0.0% |
Commute Time by Sex in East Burke
The most common commute times in East Burke are 10 to 14 minutes (24 commuters, 47.1%) for males and 20 to 24 minutes (14 commuters, 66.7%) for females.
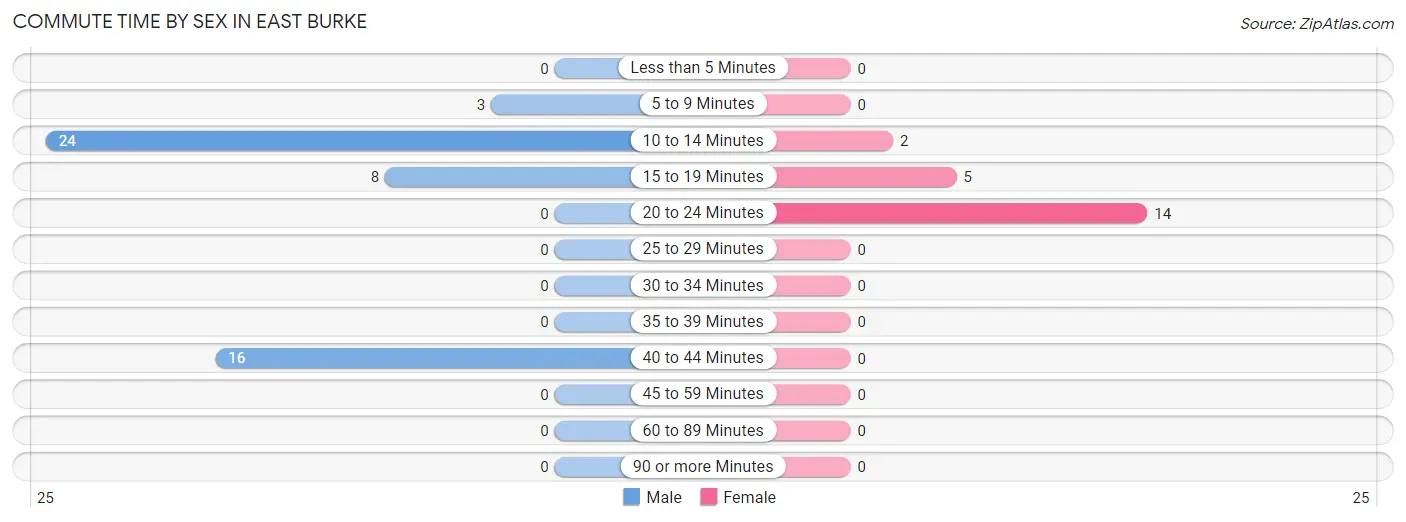
| Commute Time | Male | Female |
| Less than 5 Minutes | 0 (0.0%) | 0 (0.0%) |
| 5 to 9 Minutes | 3 (5.9%) | 0 (0.0%) |
| 10 to 14 Minutes | 24 (47.1%) | 2 (9.5%) |
| 15 to 19 Minutes | 8 (15.7%) | 5 (23.8%) |
| 20 to 24 Minutes | 0 (0.0%) | 14 (66.7%) |
| 25 to 29 Minutes | 0 (0.0%) | 0 (0.0%) |
| 30 to 34 Minutes | 0 (0.0%) | 0 (0.0%) |
| 35 to 39 Minutes | 0 (0.0%) | 0 (0.0%) |
| 40 to 44 Minutes | 16 (31.4%) | 0 (0.0%) |
| 45 to 59 Minutes | 0 (0.0%) | 0 (0.0%) |
| 60 to 89 Minutes | 0 (0.0%) | 0 (0.0%) |
| 90 or more Minutes | 0 (0.0%) | 0 (0.0%) |
Time of Departure to Work by Sex in East Burke
The most frequent times of departure to work in East Burke are 6:30 AM to 6:59 AM (30, 58.8%) for males and 10:00 AM to 10:59 AM (14, 66.7%) for females.
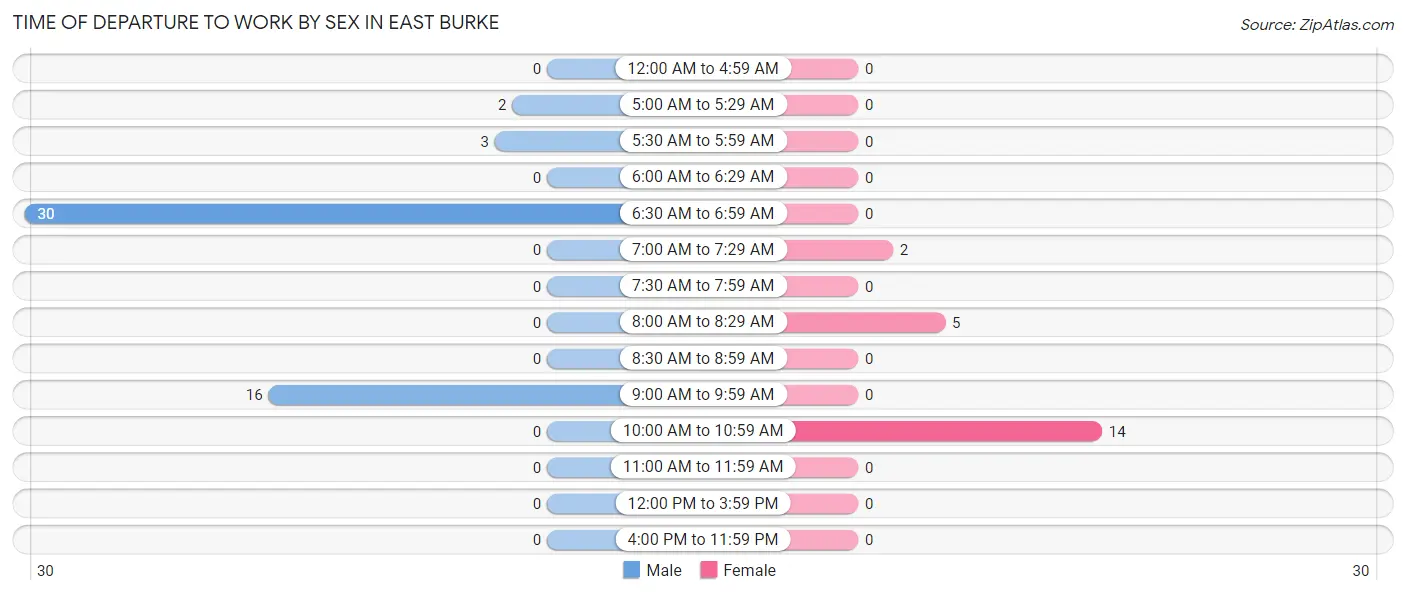
| Time of Departure | Male | Female |
| 12:00 AM to 4:59 AM | 0 (0.0%) | 0 (0.0%) |
| 5:00 AM to 5:29 AM | 2 (3.9%) | 0 (0.0%) |
| 5:30 AM to 5:59 AM | 3 (5.9%) | 0 (0.0%) |
| 6:00 AM to 6:29 AM | 0 (0.0%) | 0 (0.0%) |
| 6:30 AM to 6:59 AM | 30 (58.8%) | 0 (0.0%) |
| 7:00 AM to 7:29 AM | 0 (0.0%) | 2 (9.5%) |
| 7:30 AM to 7:59 AM | 0 (0.0%) | 0 (0.0%) |
| 8:00 AM to 8:29 AM | 0 (0.0%) | 5 (23.8%) |
| 8:30 AM to 8:59 AM | 0 (0.0%) | 0 (0.0%) |
| 9:00 AM to 9:59 AM | 16 (31.4%) | 0 (0.0%) |
| 10:00 AM to 10:59 AM | 0 (0.0%) | 14 (66.7%) |
| 11:00 AM to 11:59 AM | 0 (0.0%) | 0 (0.0%) |
| 12:00 PM to 3:59 PM | 0 (0.0%) | 0 (0.0%) |
| 4:00 PM to 11:59 PM | 0 (0.0%) | 0 (0.0%) |
| Total | 51 (100.0%) | 21 (100.0%) |
Housing Occupancy in East Burke
Occupancy by Ownership in East Burke
Of the total 69 dwellings in East Burke, owner-occupied units account for 50 (72.5%), while renter-occupied units make up 19 (27.5%).
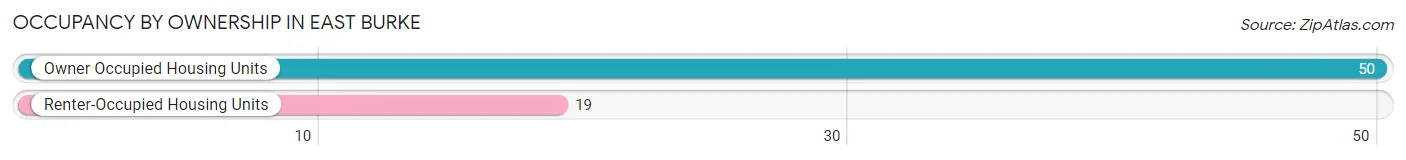
| Occupancy | # Housing Units | % Housing Units |
| Owner Occupied Housing Units | 50 | 72.5% |
| Renter-Occupied Housing Units | 19 | 27.5% |
| Total Occupied Housing Units | 69 | 100.0% |
Occupancy by Household Size in East Burke
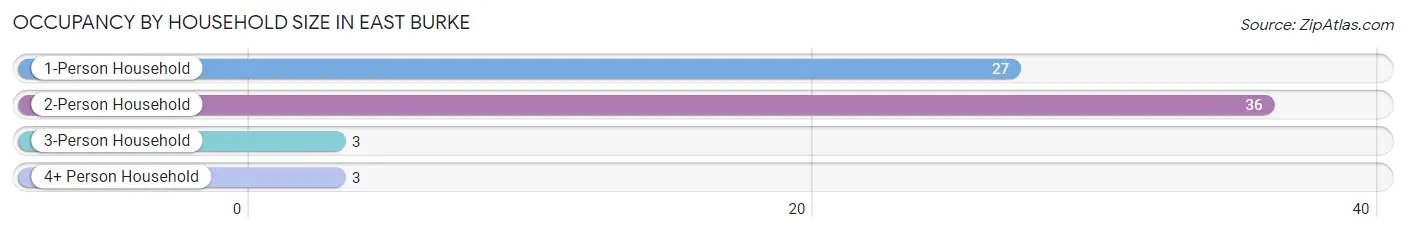
| Household Size | # Housing Units | % Housing Units |
| 1-Person Household | 27 | 39.1% |
| 2-Person Household | 36 | 52.2% |
| 3-Person Household | 3 | 4.3% |
| 4+ Person Household | 3 | 4.3% |
| Total Housing Units | 69 | 100.0% |
Occupancy by Ownership by Household Size in East Burke
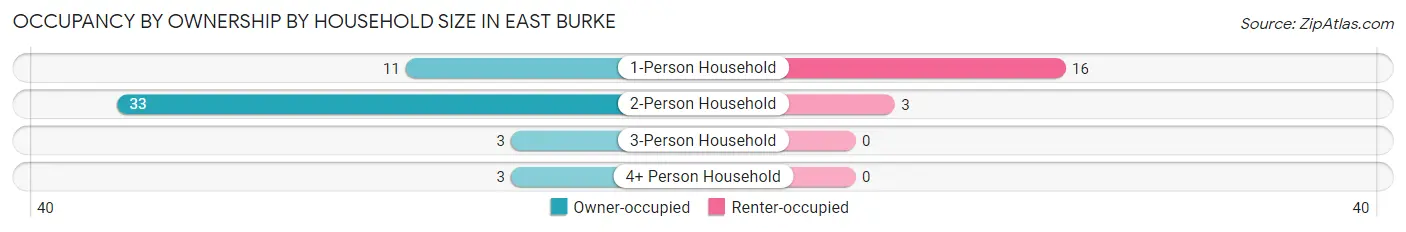
| Household Size | Owner-occupied | Renter-occupied |
| 1-Person Household | 11 (40.7%) | 16 (59.3%) |
| 2-Person Household | 33 (91.7%) | 3 (8.3%) |
| 3-Person Household | 3 (100.0%) | 0 (0.0%) |
| 4+ Person Household | 3 (100.0%) | 0 (0.0%) |
| Total Housing Units | 50 (72.5%) | 19 (27.5%) |
Occupancy by Educational Attainment in East Burke
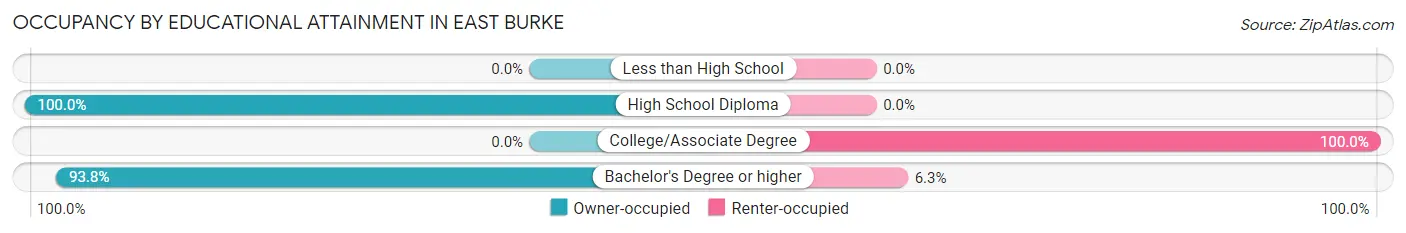
| Household Size | Owner-occupied | Renter-occupied |
| Less than High School | 0 (0.0%) | 0 (0.0%) |
| High School Diploma | 5 (100.0%) | 0 (0.0%) |
| College/Associate Degree | 0 (0.0%) | 16 (100.0%) |
| Bachelor's Degree or higher | 45 (93.8%) | 3 (6.2%) |
Occupancy by Age of Householder in East Burke
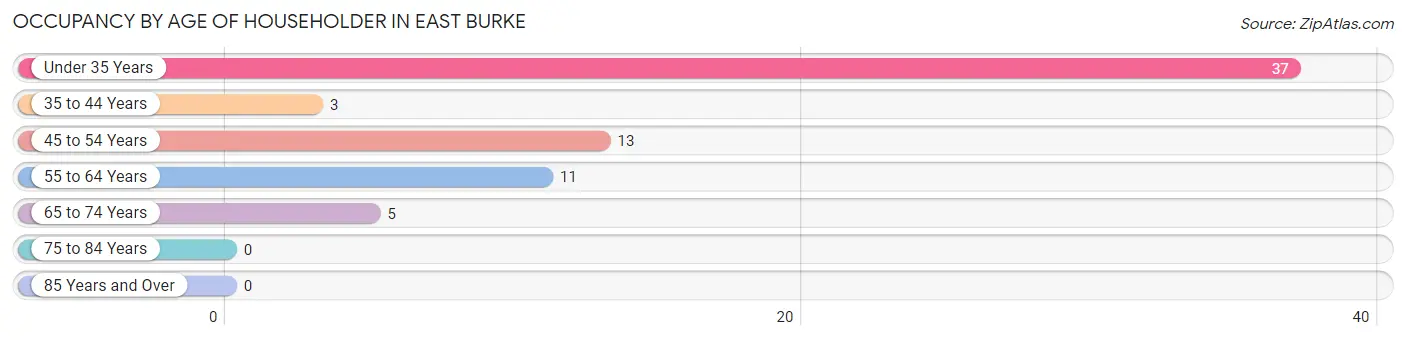
| Age Bracket | # Households | % Households |
| Under 35 Years | 37 | 53.6% |
| 35 to 44 Years | 3 | 4.3% |
| 45 to 54 Years | 13 | 18.8% |
| 55 to 64 Years | 11 | 15.9% |
| 65 to 74 Years | 5 | 7.2% |
| 75 to 84 Years | 0 | 0.0% |
| 85 Years and Over | 0 | 0.0% |
| Total | 69 | 100.0% |
Housing Finances in East Burke
Median Income by Occupancy in East Burke
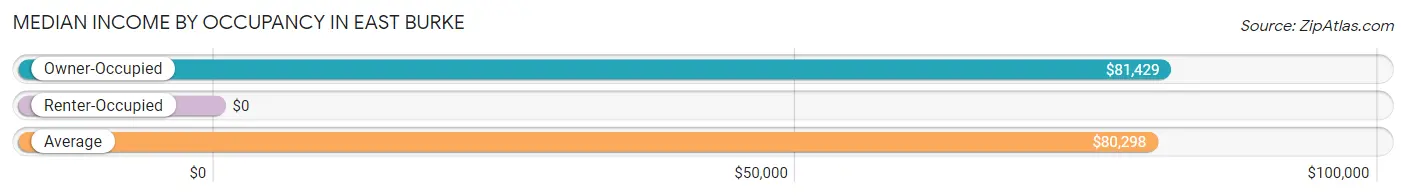
| Occupancy Type | # Households | Median Income |
| Owner-Occupied | 50 (72.5%) | $81,429 |
| Renter-Occupied | 19 (27.5%) | $0 |
| Average | 69 (100.0%) | $80,298 |
Occupancy by Householder Income Bracket in East Burke
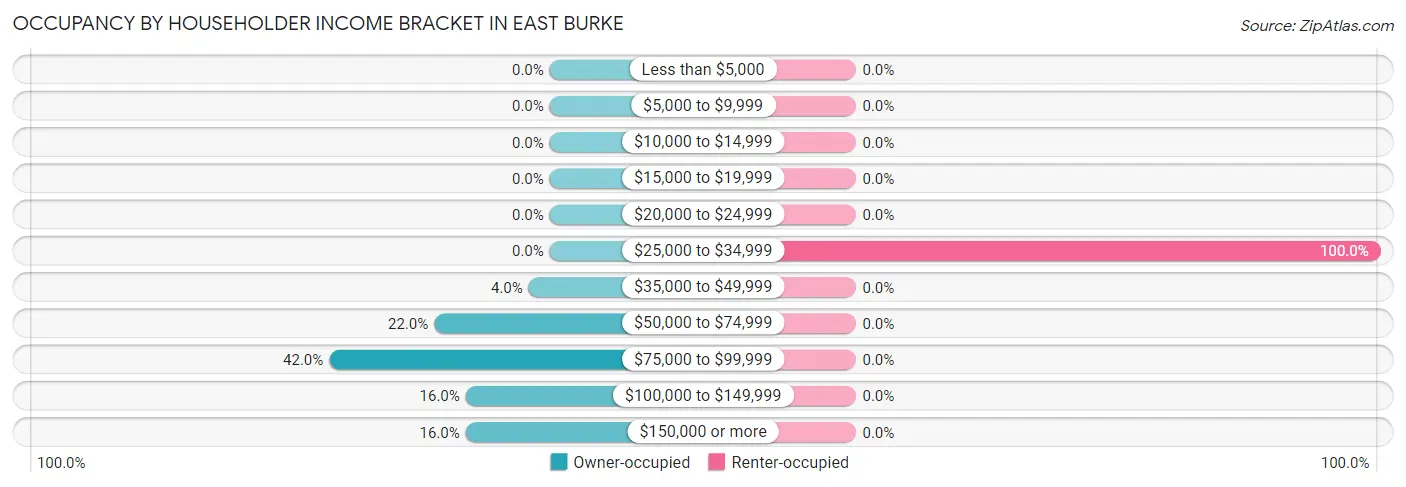
| Income Bracket | Owner-occupied | Renter-occupied |
| Less than $5,000 | 0 (0.0%) | 0 (0.0%) |
| $5,000 to $9,999 | 0 (0.0%) | 0 (0.0%) |
| $10,000 to $14,999 | 0 (0.0%) | 0 (0.0%) |
| $15,000 to $19,999 | 0 (0.0%) | 0 (0.0%) |
| $20,000 to $24,999 | 0 (0.0%) | 0 (0.0%) |
| $25,000 to $34,999 | 0 (0.0%) | 19 (100.0%) |
| $35,000 to $49,999 | 2 (4.0%) | 0 (0.0%) |
| $50,000 to $74,999 | 11 (22.0%) | 0 (0.0%) |
| $75,000 to $99,999 | 21 (42.0%) | 0 (0.0%) |
| $100,000 to $149,999 | 8 (16.0%) | 0 (0.0%) |
| $150,000 or more | 8 (16.0%) | 0 (0.0%) |
| Total | 50 (100.0%) | 19 (100.0%) |
Monthly Housing Cost Tiers in East Burke
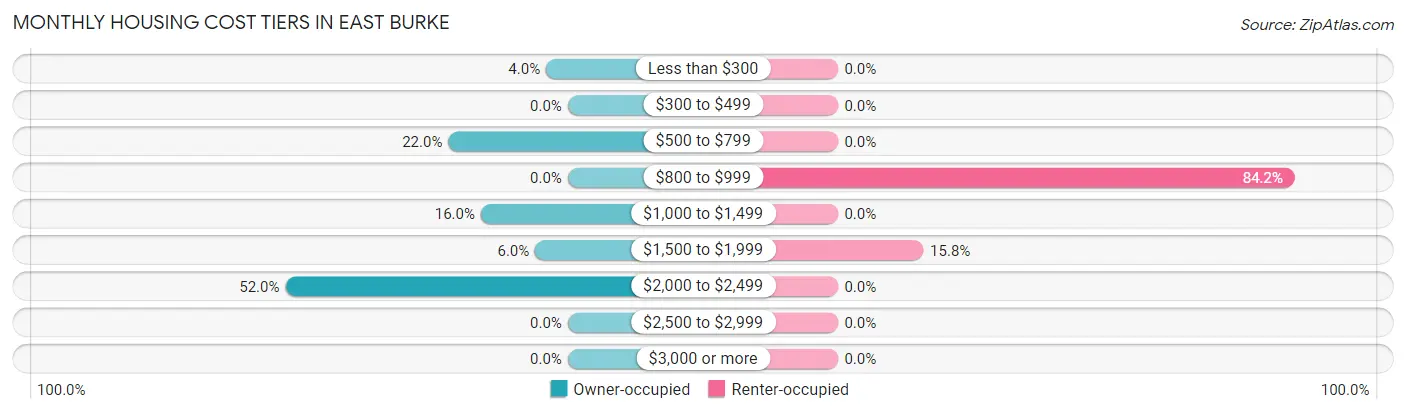
| Monthly Cost | Owner-occupied | Renter-occupied |
| Less than $300 | 2 (4.0%) | 0 (0.0%) |
| $300 to $499 | 0 (0.0%) | 0 (0.0%) |
| $500 to $799 | 11 (22.0%) | 0 (0.0%) |
| $800 to $999 | 0 (0.0%) | 16 (84.2%) |
| $1,000 to $1,499 | 8 (16.0%) | 0 (0.0%) |
| $1,500 to $1,999 | 3 (6.0%) | 3 (15.8%) |
| $2,000 to $2,499 | 26 (52.0%) | 0 (0.0%) |
| $2,500 to $2,999 | 0 (0.0%) | 0 (0.0%) |
| $3,000 or more | 0 (0.0%) | 0 (0.0%) |
| Total | 50 (100.0%) | 19 (100.0%) |
Physical Housing Characteristics in East Burke
Housing Structures in East Burke
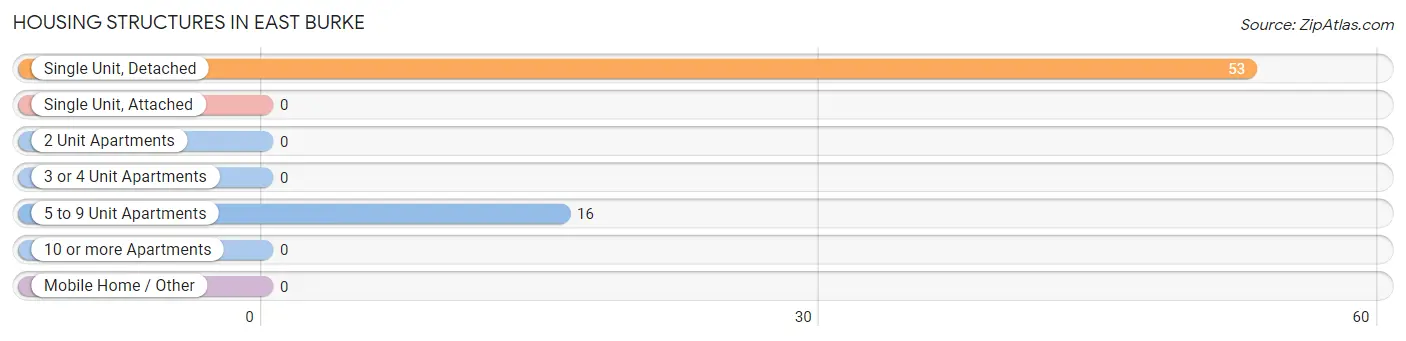
| Structure Type | # Housing Units | % Housing Units |
| Single Unit, Detached | 53 | 76.8% |
| Single Unit, Attached | 0 | 0.0% |
| 2 Unit Apartments | 0 | 0.0% |
| 3 or 4 Unit Apartments | 0 | 0.0% |
| 5 to 9 Unit Apartments | 16 | 23.2% |
| 10 or more Apartments | 0 | 0.0% |
| Mobile Home / Other | 0 | 0.0% |
| Total | 69 | 100.0% |
Housing Structures by Occupancy in East Burke
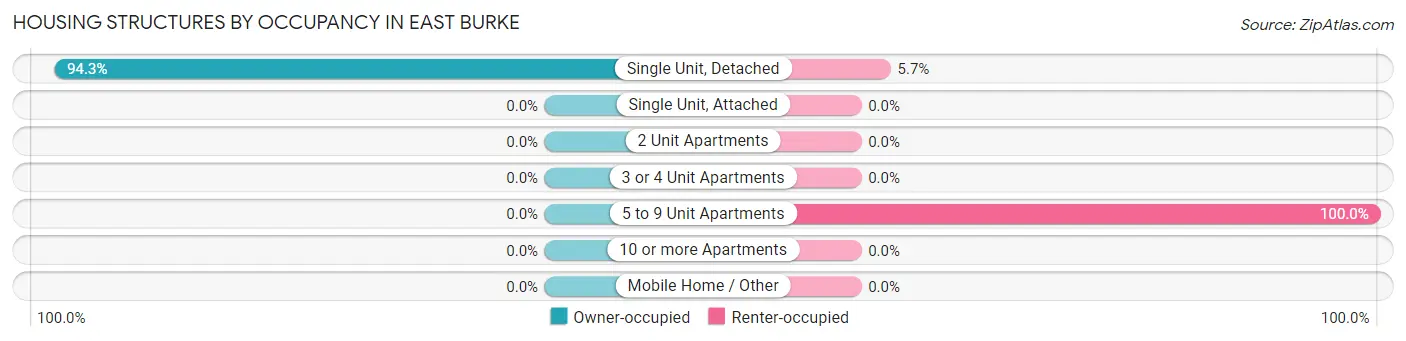
| Structure Type | Owner-occupied | Renter-occupied |
| Single Unit, Detached | 50 (94.3%) | 3 (5.7%) |
| Single Unit, Attached | 0 (0.0%) | 0 (0.0%) |
| 2 Unit Apartments | 0 (0.0%) | 0 (0.0%) |
| 3 or 4 Unit Apartments | 0 (0.0%) | 0 (0.0%) |
| 5 to 9 Unit Apartments | 0 (0.0%) | 16 (100.0%) |
| 10 or more Apartments | 0 (0.0%) | 0 (0.0%) |
| Mobile Home / Other | 0 (0.0%) | 0 (0.0%) |
| Total | 50 (72.5%) | 19 (27.5%) |
Housing Structures by Number of Rooms in East Burke
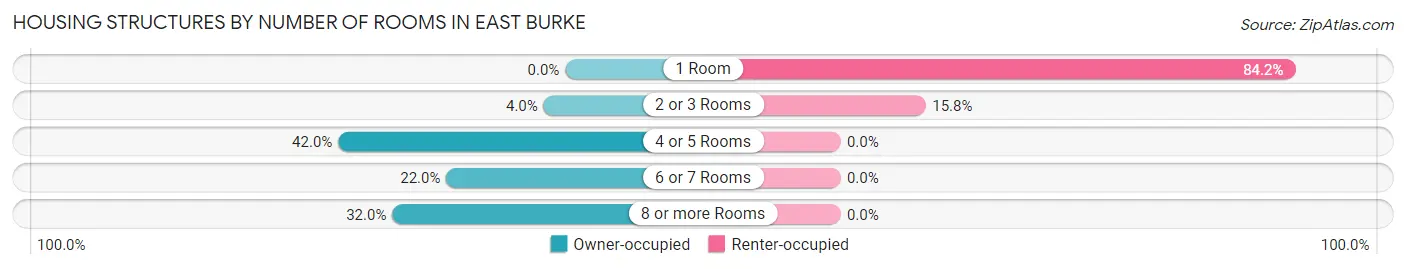
| Number of Rooms | Owner-occupied | Renter-occupied |
| 1 Room | 0 (0.0%) | 16 (84.2%) |
| 2 or 3 Rooms | 2 (4.0%) | 3 (15.8%) |
| 4 or 5 Rooms | 21 (42.0%) | 0 (0.0%) |
| 6 or 7 Rooms | 11 (22.0%) | 0 (0.0%) |
| 8 or more Rooms | 16 (32.0%) | 0 (0.0%) |
| Total | 50 (100.0%) | 19 (100.0%) |
Housing Structure by Heating Type in East Burke
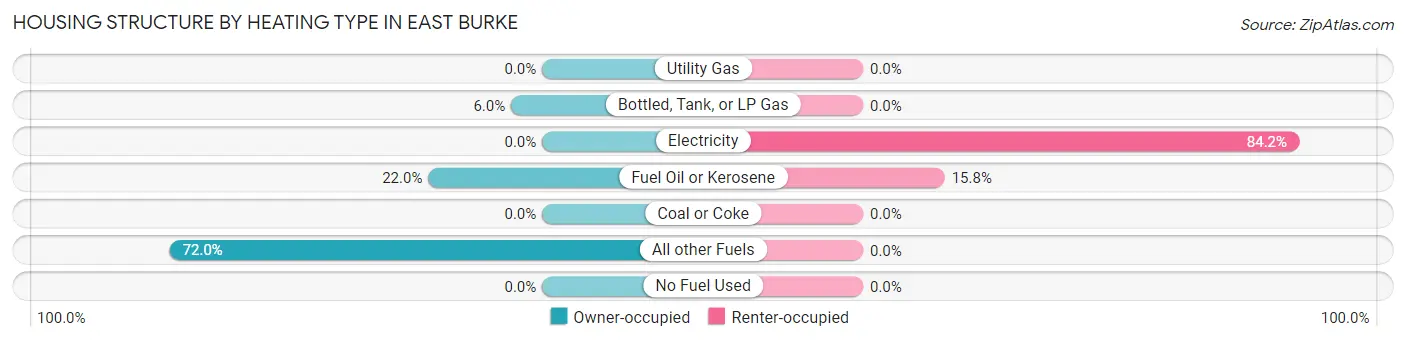
| Heating Type | Owner-occupied | Renter-occupied |
| Utility Gas | 0 (0.0%) | 0 (0.0%) |
| Bottled, Tank, or LP Gas | 3 (6.0%) | 0 (0.0%) |
| Electricity | 0 (0.0%) | 16 (84.2%) |
| Fuel Oil or Kerosene | 11 (22.0%) | 3 (15.8%) |
| Coal or Coke | 0 (0.0%) | 0 (0.0%) |
| All other Fuels | 36 (72.0%) | 0 (0.0%) |
| No Fuel Used | 0 (0.0%) | 0 (0.0%) |
| Total | 50 (100.0%) | 19 (100.0%) |
Household Vehicle Usage in East Burke
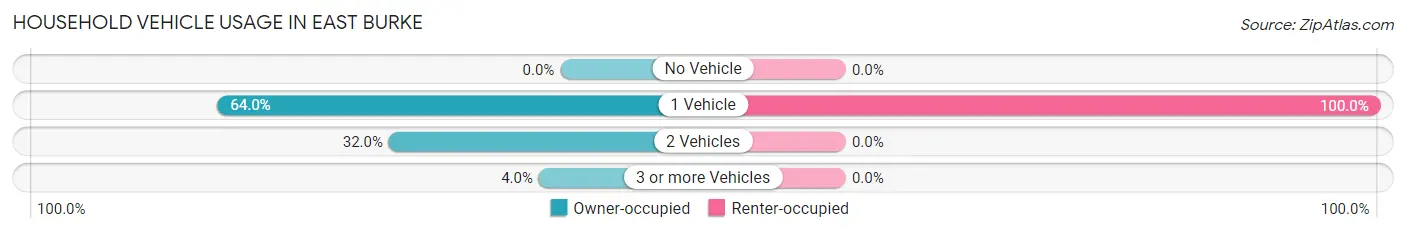
| Vehicles per Household | Owner-occupied | Renter-occupied |
| No Vehicle | 0 (0.0%) | 0 (0.0%) |
| 1 Vehicle | 32 (64.0%) | 19 (100.0%) |
| 2 Vehicles | 16 (32.0%) | 0 (0.0%) |
| 3 or more Vehicles | 2 (4.0%) | 0 (0.0%) |
| Total | 50 (100.0%) | 19 (100.0%) |
Real Estate & Mortgages in East Burke
Real Estate and Mortgage Overview in East Burke
| Characteristic | Without Mortgage | With Mortgage |
| Housing Units | 21 | 29 |
| Median Property Value | - | - |
| Median Household Income | - | - |
| Monthly Housing Costs | $677 | $0 |
| Real Estate Taxes | - | - |
Property Value by Mortgage Status in East Burke
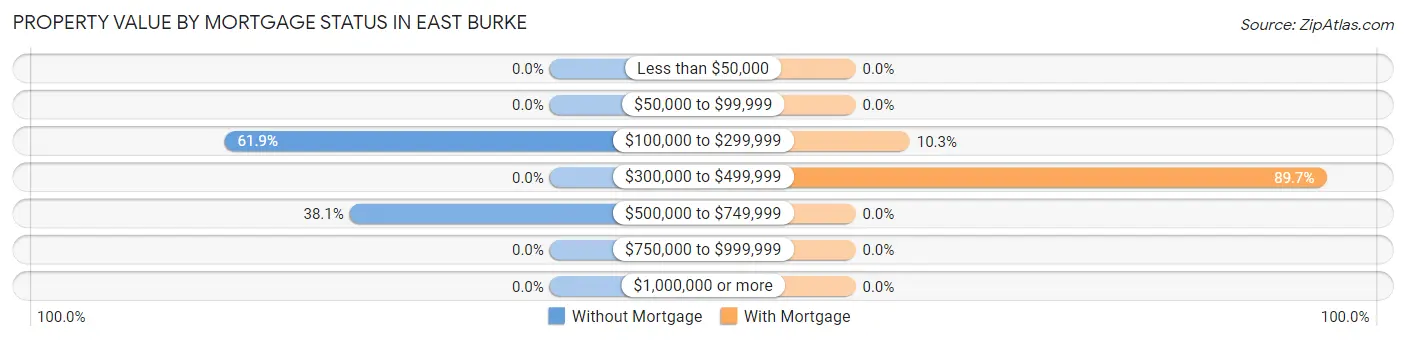
| Property Value | Without Mortgage | With Mortgage |
| Less than $50,000 | 0 (0.0%) | 0 (0.0%) |
| $50,000 to $99,999 | 0 (0.0%) | 0 (0.0%) |
| $100,000 to $299,999 | 13 (61.9%) | 3 (10.3%) |
| $300,000 to $499,999 | 0 (0.0%) | 26 (89.7%) |
| $500,000 to $749,999 | 8 (38.1%) | 0 (0.0%) |
| $750,000 to $999,999 | 0 (0.0%) | 0 (0.0%) |
| $1,000,000 or more | 0 (0.0%) | 0 (0.0%) |
| Total | 21 (100.0%) | 29 (100.0%) |
Household Income by Mortgage Status in East Burke
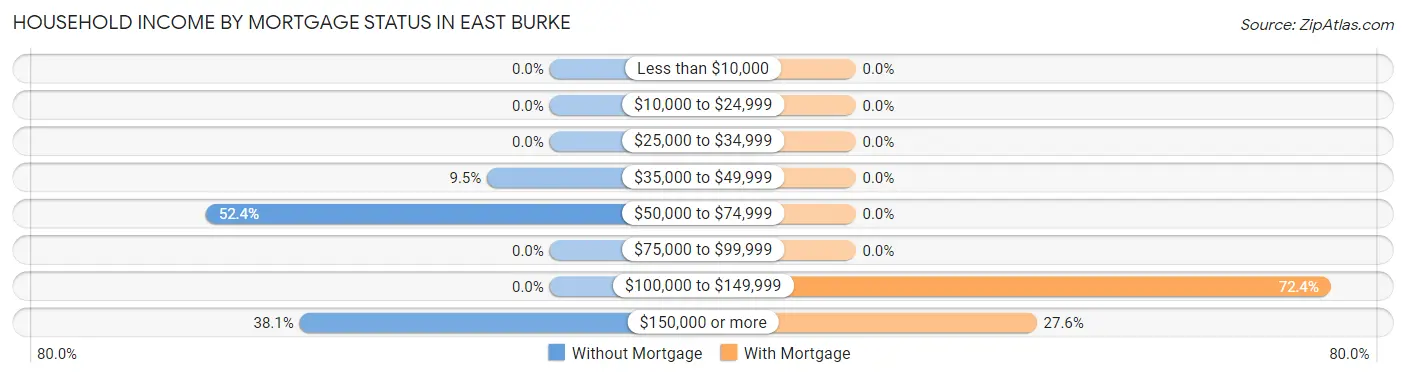
| Household Income | Without Mortgage | With Mortgage |
| Less than $10,000 | 0 (0.0%) | 0 (0.0%) |
| $10,000 to $24,999 | 0 (0.0%) | 0 (0.0%) |
| $25,000 to $34,999 | 0 (0.0%) | 0 (0.0%) |
| $35,000 to $49,999 | 2 (9.5%) | 0 (0.0%) |
| $50,000 to $74,999 | 11 (52.4%) | 0 (0.0%) |
| $75,000 to $99,999 | 0 (0.0%) | 0 (0.0%) |
| $100,000 to $149,999 | 0 (0.0%) | 21 (72.4%) |
| $150,000 or more | 8 (38.1%) | 8 (27.6%) |
| Total | 21 (100.0%) | 29 (100.0%) |
Property Value to Household Income Ratio in East Burke
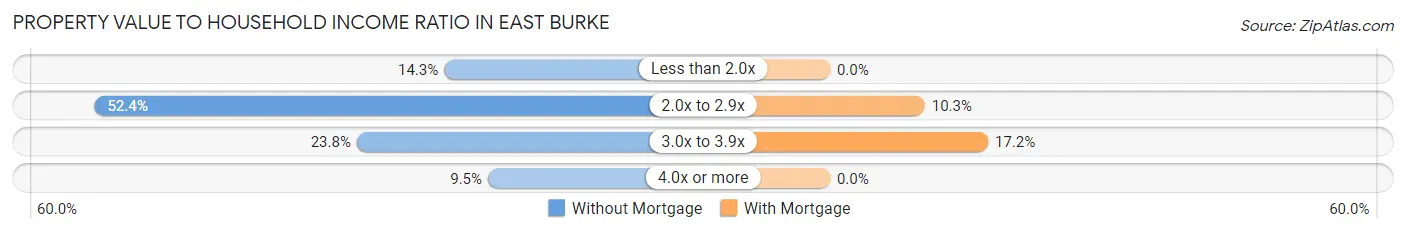
| Value-to-Income Ratio | Without Mortgage | With Mortgage |
| Less than 2.0x | 3 (14.3%) | 0 (0.0%) |
| 2.0x to 2.9x | 11 (52.4%) | 3 (10.3%) |
| 3.0x to 3.9x | 5 (23.8%) | 5 (17.2%) |
| 4.0x or more | 2 (9.5%) | 0 (0.0%) |
| Total | 21 (100.0%) | 29 (100.0%) |
Real Estate Taxes by Mortgage Status in East Burke
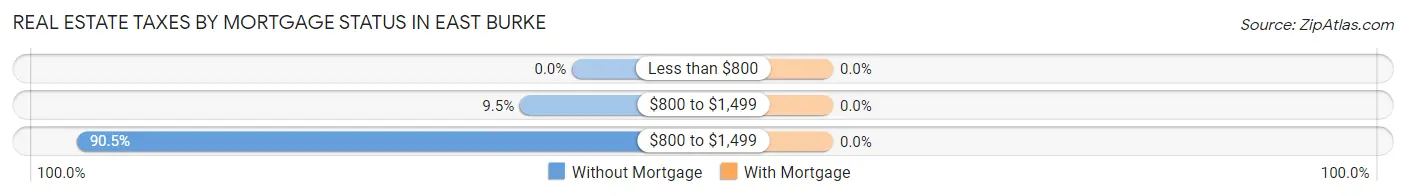
| Property Taxes | Without Mortgage | With Mortgage |
| Less than $800 | 0 (0.0%) | 0 (0.0%) |
| $800 to $1,499 | 2 (9.5%) | 0 (0.0%) |
| $800 to $1,499 | 19 (90.5%) | 0 (0.0%) |
| Total | 21 (100.0%) | 29 (100.0%) |
Health & Disability in East Burke
Health Insurance Coverage by Age in East Burke
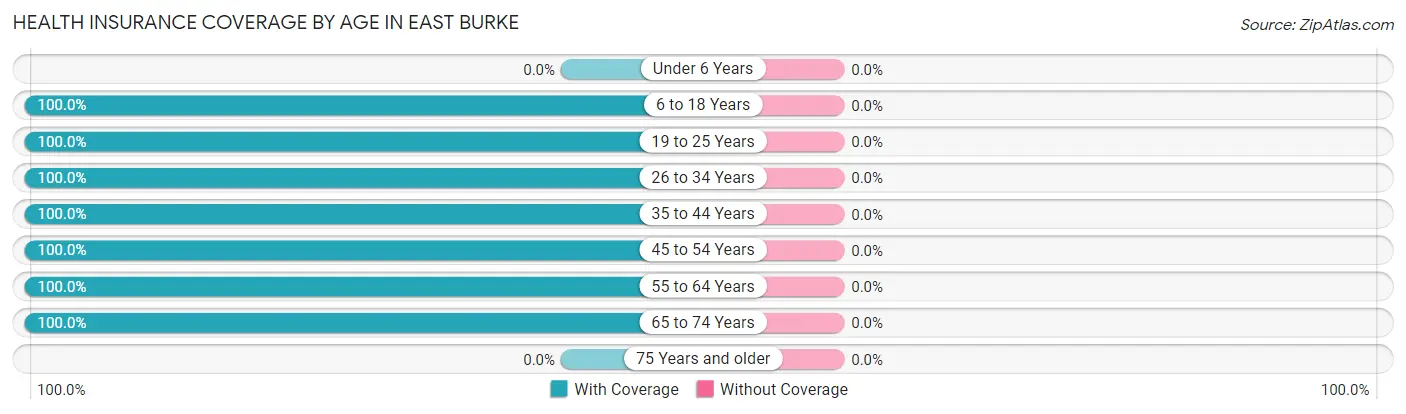
| Age Bracket | With Coverage | Without Coverage |
| Under 6 Years | 0 (0.0%) | 0 (0.0%) |
| 6 to 18 Years | 8 (100.0%) | 0 (0.0%) |
| 19 to 25 Years | 11 (100.0%) | 0 (0.0%) |
| 26 to 34 Years | 37 (100.0%) | 0 (0.0%) |
| 35 to 44 Years | 6 (100.0%) | 0 (0.0%) |
| 45 to 54 Years | 29 (100.0%) | 0 (0.0%) |
| 55 to 64 Years | 14 (100.0%) | 0 (0.0%) |
| 65 to 74 Years | 5 (100.0%) | 0 (0.0%) |
| 75 Years and older | 0 (0.0%) | 0 (0.0%) |
| Total | 110 (100.0%) | 0 (0.0%) |
Health Insurance Coverage by Citizenship Status in East Burke
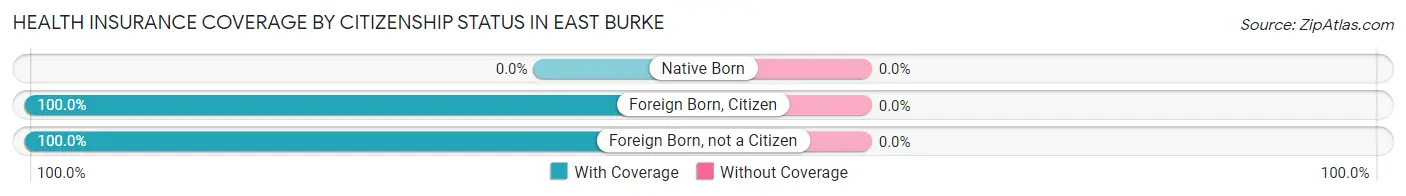
| Citizenship Status | With Coverage | Without Coverage |
| Native Born | 0 (0.0%) | 0 (0.0%) |
| Foreign Born, Citizen | 8 (100.0%) | 0 (0.0%) |
| Foreign Born, not a Citizen | 11 (100.0%) | 0 (0.0%) |
Health Insurance Coverage by Household Income in East Burke
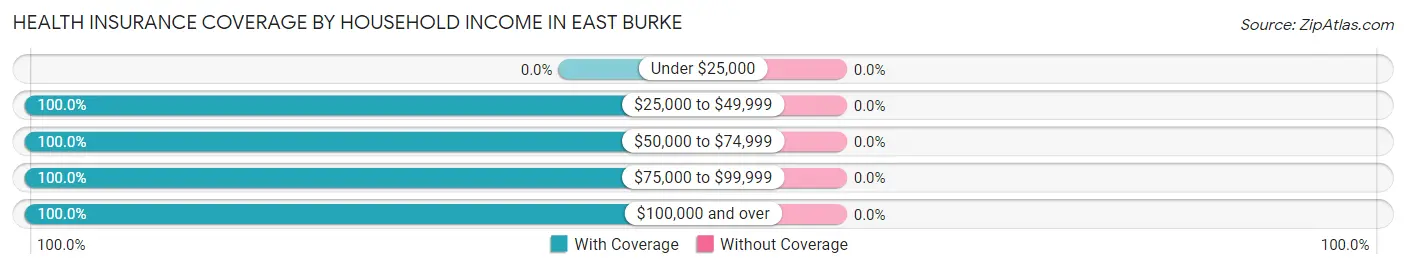
| Household Income | With Coverage | Without Coverage |
| Under $25,000 | 0 (0.0%) | 0 (0.0%) |
| $25,000 to $49,999 | 26 (100.0%) | 0 (0.0%) |
| $50,000 to $74,999 | 11 (100.0%) | 0 (0.0%) |
| $75,000 to $99,999 | 32 (100.0%) | 0 (0.0%) |
| $100,000 and over | 41 (100.0%) | 0 (0.0%) |
Public vs Private Health Insurance Coverage by Age in East Burke
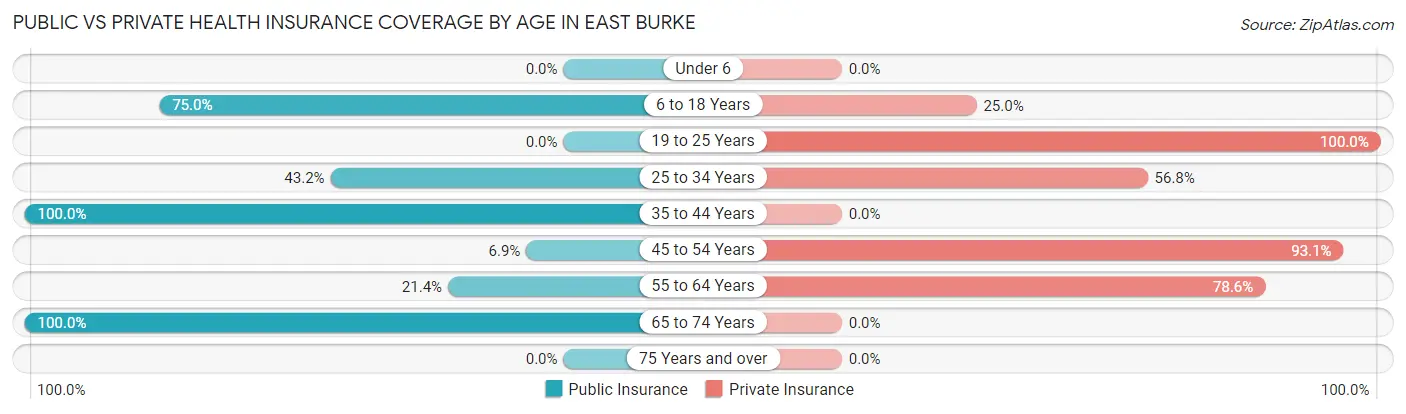
| Age Bracket | Public Insurance | Private Insurance |
| Under 6 | 0 (0.0%) | 0 (0.0%) |
| 6 to 18 Years | 6 (75.0%) | 2 (25.0%) |
| 19 to 25 Years | 0 (0.0%) | 11 (100.0%) |
| 25 to 34 Years | 16 (43.2%) | 21 (56.8%) |
| 35 to 44 Years | 6 (100.0%) | 0 (0.0%) |
| 45 to 54 Years | 2 (6.9%) | 27 (93.1%) |
| 55 to 64 Years | 3 (21.4%) | 11 (78.6%) |
| 65 to 74 Years | 5 (100.0%) | 0 (0.0%) |
| 75 Years and over | 0 (0.0%) | 0 (0.0%) |
| Total | 38 (34.5%) | 72 (65.4%) |
Disability Status by Sex by Age in East Burke
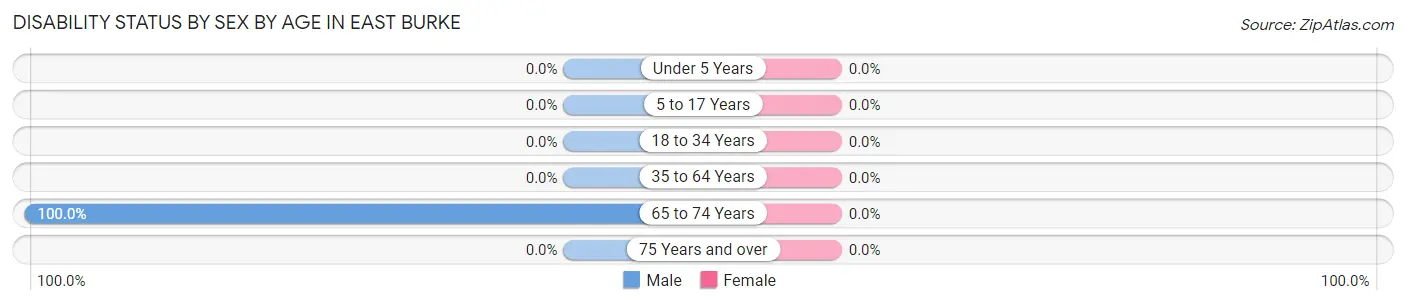
| Age Bracket | Male | Female |
| Under 5 Years | 0 (0.0%) | 0 (0.0%) |
| 5 to 17 Years | 0 (0.0%) | 0 (0.0%) |
| 18 to 34 Years | 0 (0.0%) | 0 (0.0%) |
| 35 to 64 Years | 0 (0.0%) | 0 (0.0%) |
| 65 to 74 Years | 5 (100.0%) | 0 (0.0%) |
| 75 Years and over | 0 (0.0%) | 0 (0.0%) |
Disability Class by Sex by Age in East Burke
Disability Class: Hearing Difficulty
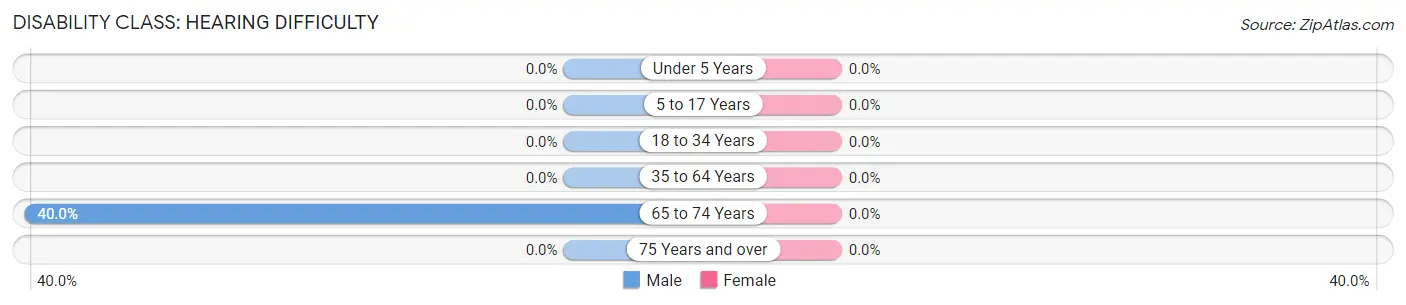
| Age Bracket | Male | Female |
| Under 5 Years | 0 (0.0%) | 0 (0.0%) |
| 5 to 17 Years | 0 (0.0%) | 0 (0.0%) |
| 18 to 34 Years | 0 (0.0%) | 0 (0.0%) |
| 35 to 64 Years | 0 (0.0%) | 0 (0.0%) |
| 65 to 74 Years | 2 (40.0%) | 0 (0.0%) |
| 75 Years and over | 0 (0.0%) | 0 (0.0%) |
Disability Class: Vision Difficulty
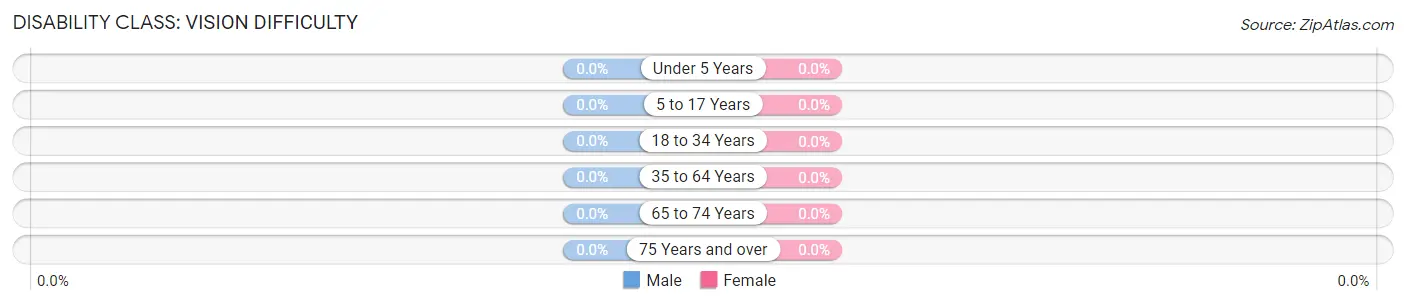
| Age Bracket | Male | Female |
| Under 5 Years | 0 (0.0%) | 0 (0.0%) |
| 5 to 17 Years | 0 (0.0%) | 0 (0.0%) |
| 18 to 34 Years | 0 (0.0%) | 0 (0.0%) |
| 35 to 64 Years | 0 (0.0%) | 0 (0.0%) |
| 65 to 74 Years | 0 (0.0%) | 0 (0.0%) |
| 75 Years and over | 0 (0.0%) | 0 (0.0%) |
Disability Class: Cognitive Difficulty
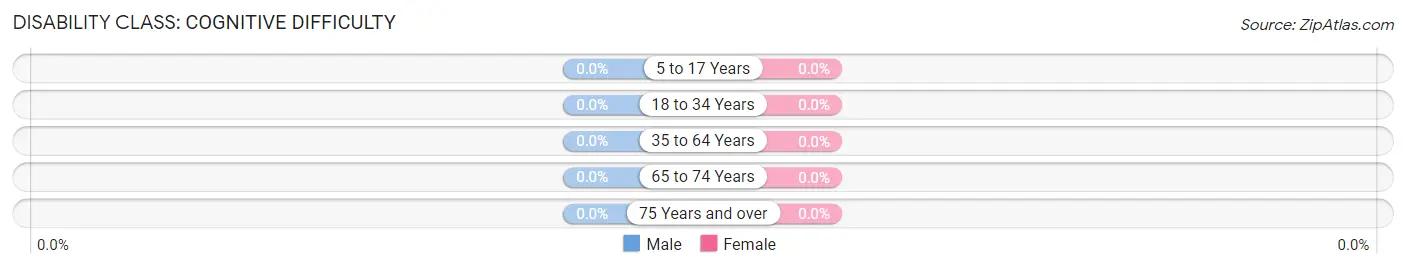
| Age Bracket | Male | Female |
| 5 to 17 Years | 0 (0.0%) | 0 (0.0%) |
| 18 to 34 Years | 0 (0.0%) | 0 (0.0%) |
| 35 to 64 Years | 0 (0.0%) | 0 (0.0%) |
| 65 to 74 Years | 0 (0.0%) | 0 (0.0%) |
| 75 Years and over | 0 (0.0%) | 0 (0.0%) |
Disability Class: Ambulatory Difficulty
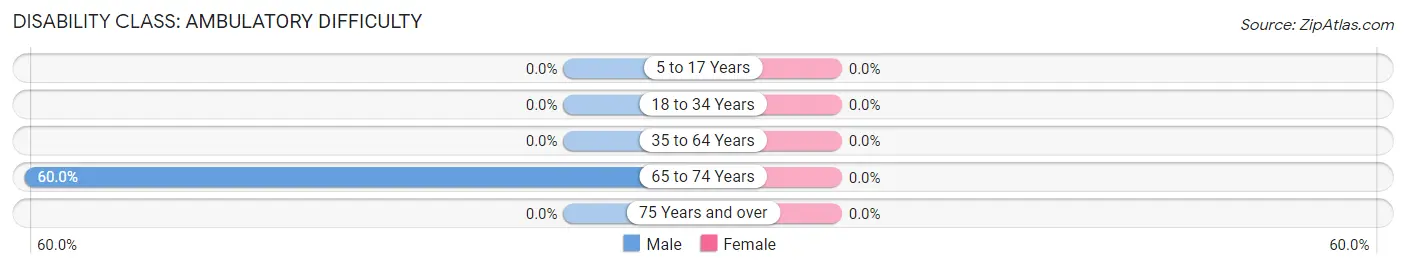
| Age Bracket | Male | Female |
| 5 to 17 Years | 0 (0.0%) | 0 (0.0%) |
| 18 to 34 Years | 0 (0.0%) | 0 (0.0%) |
| 35 to 64 Years | 0 (0.0%) | 0 (0.0%) |
| 65 to 74 Years | 3 (60.0%) | 0 (0.0%) |
| 75 Years and over | 0 (0.0%) | 0 (0.0%) |
Disability Class: Self-Care Difficulty
| Age Bracket | Male | Female |
| 5 to 17 Years | 0 (0.0%) | 0 (0.0%) |
| 18 to 34 Years | 0 (0.0%) | 0 (0.0%) |
| 35 to 64 Years | 0 (0.0%) | 0 (0.0%) |
| 65 to 74 Years | 0 (0.0%) | 0 (0.0%) |
| 75 Years and over | 0 (0.0%) | 0 (0.0%) |
Technology Access in East Burke
Computing Device Access in East Burke
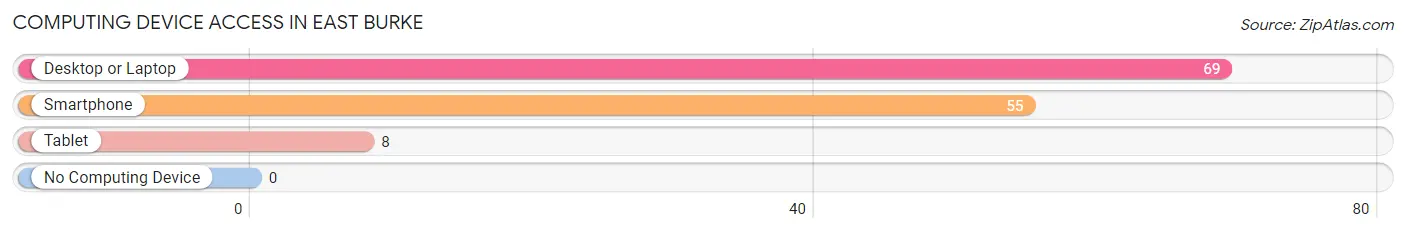
| Device Type | # Households | % Households |
| Desktop or Laptop | 69 | 100.0% |
| Smartphone | 55 | 79.7% |
| Tablet | 8 | 11.6% |
| No Computing Device | 0 | 0.0% |
| Total | 69 | 100.0% |
Internet Access in East Burke
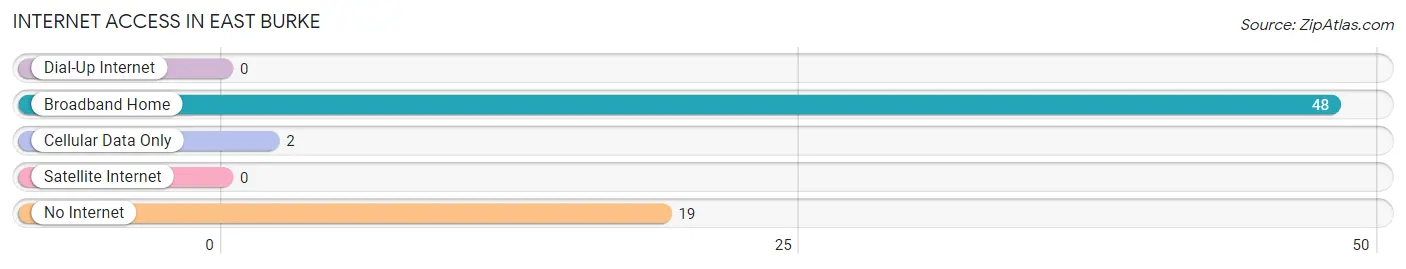
| Internet Type | # Households | % Households |
| Dial-Up Internet | 0 | 0.0% |
| Broadband Home | 48 | 69.6% |
| Cellular Data Only | 2 | 2.9% |
| Satellite Internet | 0 | 0.0% |
| No Internet | 19 | 27.5% |
| Total | 69 | 100.0% |
East Burke Summary
Burke, Vermont is a small town located in the northeastern corner of the state, in Caledonia County. It is situated in the heart of the Northeast Kingdom, a region of Vermont known for its rural beauty and outdoor recreation opportunities. Burke is home to a population of approximately 1,000 people, and is the largest town in the county.
History
The town of Burke was first settled in 1790 by a group of settlers from Massachusetts. The town was named after the Burke family, who were among the first settlers. The town was originally part of the town of Lyndon, but was incorporated as its own town in 1854.
The town of Burke was an important center of industry in the 19th century. It was home to several sawmills, gristmills, and a tannery. The town also had a thriving lumber industry, and was home to several large lumber companies.
Geography
Burke is located in the northeastern corner of Vermont, in Caledonia County. It is situated in the heart of the Northeast Kingdom, a region of Vermont known for its rural beauty and outdoor recreation opportunities. The town is bordered by the towns of Lyndon to the north, Sutton to the east, and Westmore to the south.
The town of Burke is located in the Green Mountains, and is surrounded by several mountain peaks, including Burke Mountain, which is the highest peak in the town. The town is also home to several lakes and ponds, including Lake Willoughby, which is a popular destination for swimming, fishing, and boating.
Economy
The economy of Burke is largely based on tourism and outdoor recreation. The town is home to several ski resorts, including Burke Mountain Ski Resort, which is one of the most popular ski resorts in the state. The town is also home to several hiking trails, mountain biking trails, and other outdoor recreation opportunities.
The town is also home to several small businesses, including restaurants, shops, and lodging. The town is also home to several small manufacturing companies, including a furniture manufacturer and a woodworking company.
Demographics
As of the 2010 census, the town of Burke had a population of 1,053 people. The racial makeup of the town was 97.3% White, 0.3% African American, 0.2% Native American, 0.3% Asian, 0.1% Pacific Islander, 0.3% from other races, and 1.4% from two or more races. Hispanic or Latino of any race were 1.2% of the population.
The median income for a household in the town was $41,250, and the median income for a family was $50,000. The per capita income for the town was $20,945. About 8.3% of families and 11.2% of the population were below the poverty line, including 16.2% of those under age 18 and 8.3% of those age 65 or over.
Common Questions
What is Per Capita Income in East Burke?
Per Capita income in East Burke is $55,167.
What is the Median Family Income in East Burke?
Median Family Income in East Burke is $146,750.
What is the Median Household income in East Burke?
Median Household Income in East Burke is $80,298.
What is Income or Wage Gap in East Burke?
Income or Wage Gap in East Burke is 26.9%.
Women in East Burke earn 73.1 cents for every dollar earned by a man.
What is Inequality or Gini Index in East Burke?
Inequality or Gini Index in East Burke is 0.36.
What is the Total Population of East Burke?
Total Population of East Burke is 110.
What is the Total Male Population of East Burke?
Total Male Population of East Burke is 65.
What is the Total Female Population of East Burke?
Total Female Population of East Burke is 45.
What is the Ratio of Males per 100 Females in East Burke?
There are 144.44 Males per 100 Females in East Burke.
What is the Ratio of Females per 100 Males in East Burke?
There are 69.23 Females per 100 Males in East Burke.
What is the Median Population Age in East Burke?
Median Population Age in East Burke is 30.9 Years.
What is the Average Family Size in East Burke
Average Family Size in East Burke is 2.5 People.
What is the Average Household Size in East Burke
Average Household Size in East Burke is 1.6 People.
How Large is the Labor Force in East Burke?
There are 83 People in the Labor Forcein in East Burke.
What is the Percentage of People in the Labor Force in East Burke?
79.0% of People are in the Labor Force in East Burke.