Java, SD Map & Demographics
Java Map
Java Overview
$30,705
PER CAPITA INCOME
$75,441
AVG FAMILY INCOME
$50,500
AVG HOUSEHOLD INCOME
44.4%
WAGE / INCOME GAP [ % ]
55.6¢/ $1
WAGE / INCOME GAP [ $ ]
0.36
INEQUALITY / GINI INDEX
147
TOTAL POPULATION
58
MALE POPULATION
89
FEMALE POPULATION
65.17
MALES / 100 FEMALES
153.45
FEMALES / 100 MALES
30.9
MEDIAN AGE
2.5
AVG FAMILY SIZE
2.0
AVG HOUSEHOLD SIZE
92
LABOR FORCE [ PEOPLE ]
69.7%
PERCENT IN LABOR FORCE
8.7%
UNEMPLOYMENT RATE
Java Zip Codes
Java Area Codes
Income in Java
Income Overview in Java
Per Capita Income in Java is $30,705, while median incomes of families and households are $75,441 and $50,500 respectively.
| Characteristic | Number | Measure |
| Per Capita Income | 147 | $30,705 |
| Median Family Income | 48 | $75,441 |
| Mean Family Income | 48 | $65,508 |
| Median Household Income | 72 | $50,500 |
| Mean Household Income | 72 | $55,428 |
| Income Deficit | 48 | $0 |
| Wage / Income Gap (%) | 147 | 44.40% |
| Wage / Income Gap ($) | 147 | 55.60¢ per $1 |
| Gini / Inequality Index | 147 | 0.36 |
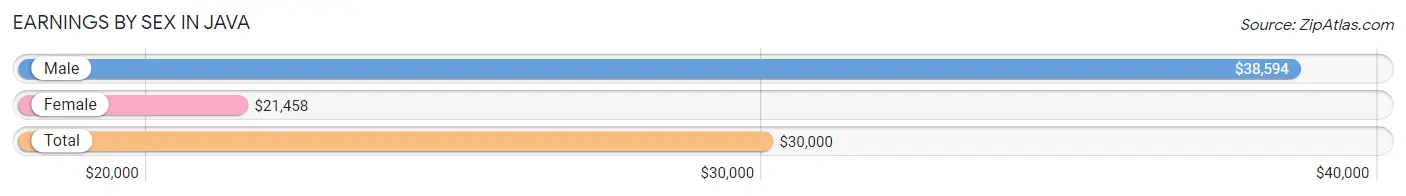
Earnings by Sex in Java
Average Earnings in Java are $30,000, $38,594 for men and $21,458 for women, a difference of 44.4%.
| Sex | Number | Average Earnings |
| Male | 39 (41.5%) | $38,594 |
| Female | 55 (58.5%) | $21,458 |
| Total | 94 (100.0%) | $30,000 |
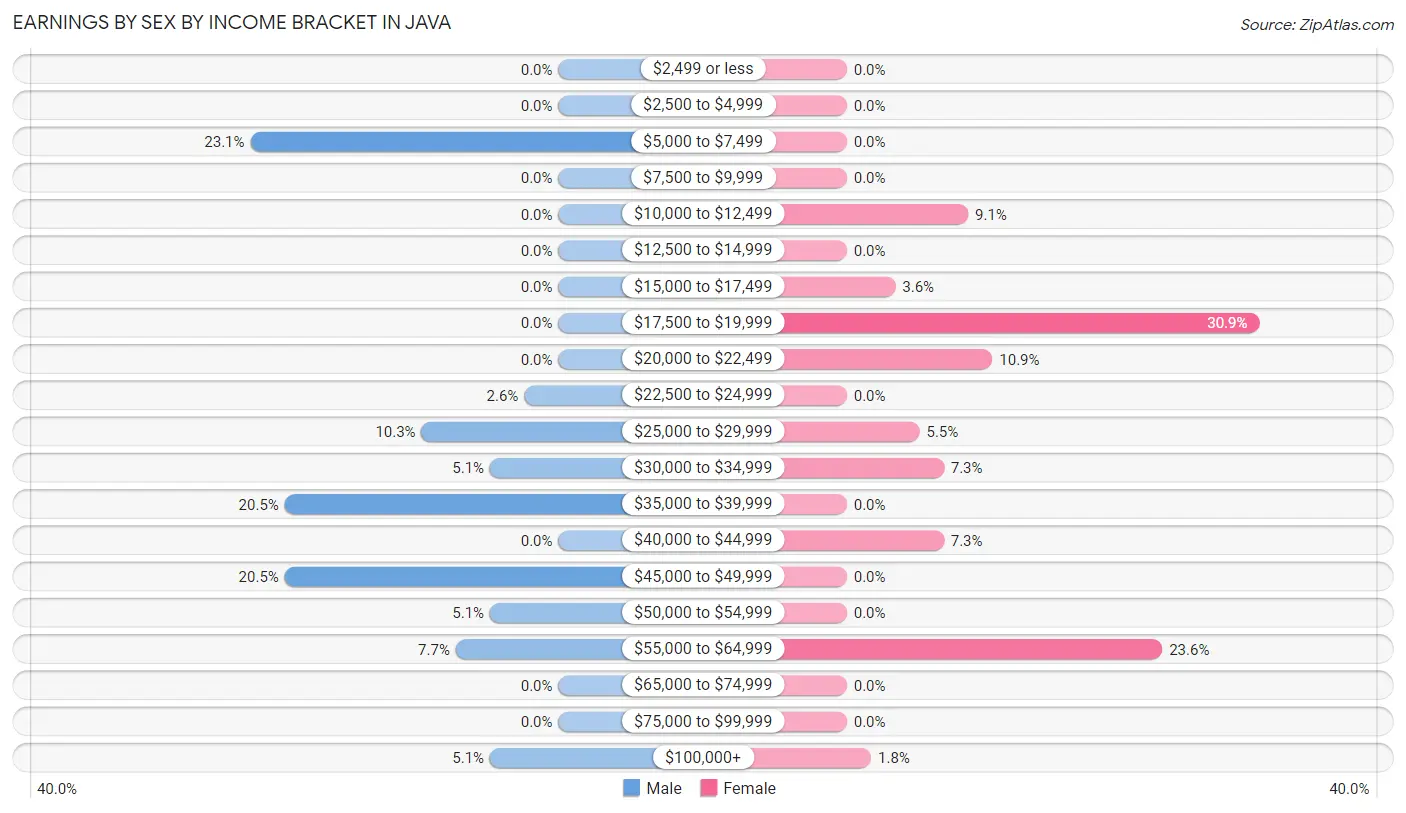
Earnings by Sex by Income Bracket in Java
The most common earnings brackets in Java are $5,000 to $7,499 for men (9 | 23.1%) and $17,500 to $19,999 for women (17 | 30.9%).
| Income | Male | Female |
| $2,499 or less | 0 (0.0%) | 0 (0.0%) |
| $2,500 to $4,999 | 0 (0.0%) | 0 (0.0%) |
| $5,000 to $7,499 | 9 (23.1%) | 0 (0.0%) |
| $7,500 to $9,999 | 0 (0.0%) | 0 (0.0%) |
| $10,000 to $12,499 | 0 (0.0%) | 5 (9.1%) |
| $12,500 to $14,999 | 0 (0.0%) | 0 (0.0%) |
| $15,000 to $17,499 | 0 (0.0%) | 2 (3.6%) |
| $17,500 to $19,999 | 0 (0.0%) | 17 (30.9%) |
| $20,000 to $22,499 | 0 (0.0%) | 6 (10.9%) |
| $22,500 to $24,999 | 1 (2.6%) | 0 (0.0%) |
| $25,000 to $29,999 | 4 (10.3%) | 3 (5.4%) |
| $30,000 to $34,999 | 2 (5.1%) | 4 (7.3%) |
| $35,000 to $39,999 | 8 (20.5%) | 0 (0.0%) |
| $40,000 to $44,999 | 0 (0.0%) | 4 (7.3%) |
| $45,000 to $49,999 | 8 (20.5%) | 0 (0.0%) |
| $50,000 to $54,999 | 2 (5.1%) | 0 (0.0%) |
| $55,000 to $64,999 | 3 (7.7%) | 13 (23.6%) |
| $65,000 to $74,999 | 0 (0.0%) | 0 (0.0%) |
| $75,000 to $99,999 | 0 (0.0%) | 0 (0.0%) |
| $100,000+ | 2 (5.1%) | 1 (1.8%) |
| Total | 39 (100.0%) | 55 (100.0%) |
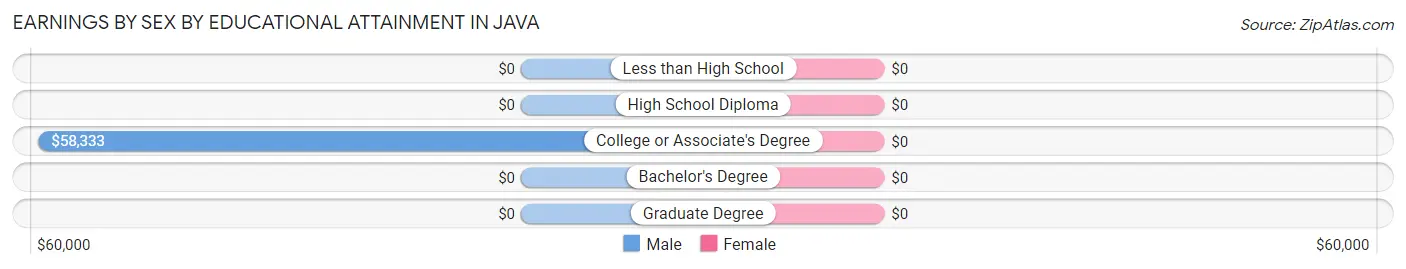
Earnings by Sex by Educational Attainment in Java
| Educational Attainment | Male Income | Female Income |
| Less than High School | - | - |
| High School Diploma | - | - |
| College or Associate's Degree | $58,333 | $0 |
| Bachelor's Degree | - | - |
| Graduate Degree | - | - |
| Total | $38,906 | $19,926 |
Family Income in Java
Family Income Brackets in Java
According to the Java family income data, there are 20 families falling into the $75,000 to $99,999 income range, which is the most common income bracket and makes up 41.7% of all families.
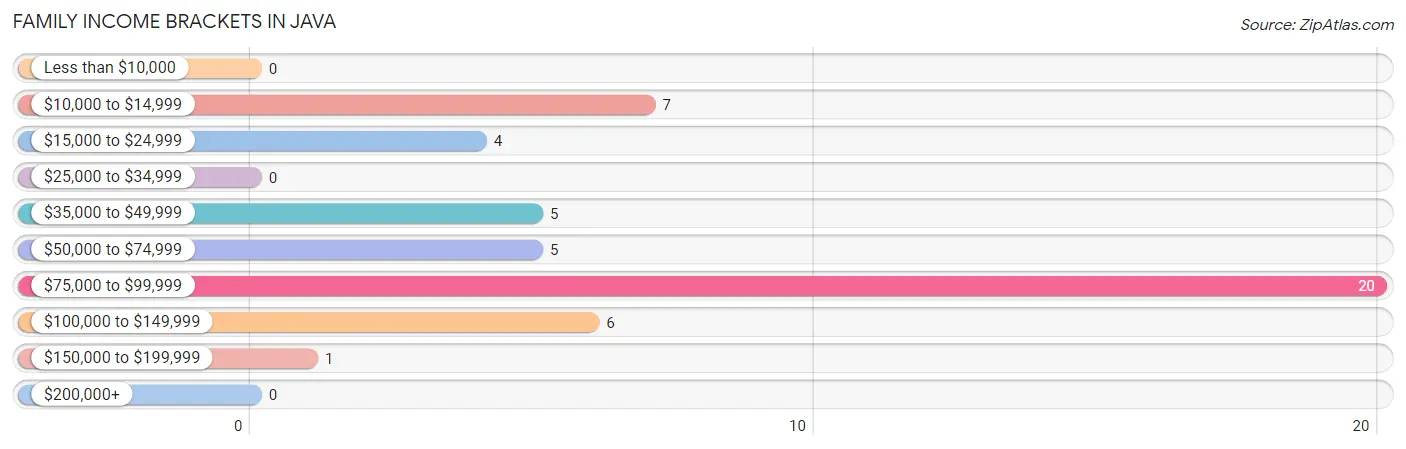
| Income Bracket | # Families | % Families |
| Less than $10,000 | 0 | 0.0% |
| $10,000 to $14,999 | 7 | 14.6% |
| $15,000 to $24,999 | 4 | 8.3% |
| $25,000 to $34,999 | 0 | 0.0% |
| $35,000 to $49,999 | 5 | 10.4% |
| $50,000 to $74,999 | 5 | 10.4% |
| $75,000 to $99,999 | 20 | 41.7% |
| $100,000 to $149,999 | 6 | 12.5% |
| $150,000 to $199,999 | 1 | 2.1% |
| $200,000+ | 0 | 0.0% |
Family Income by Famaliy Size in Java
2-person families (29 | 60.4%) account for the highest median family income in Java with $39,688 per family, while 2-person families (29 | 60.4%) have the highest median income of $19,844 per family member.
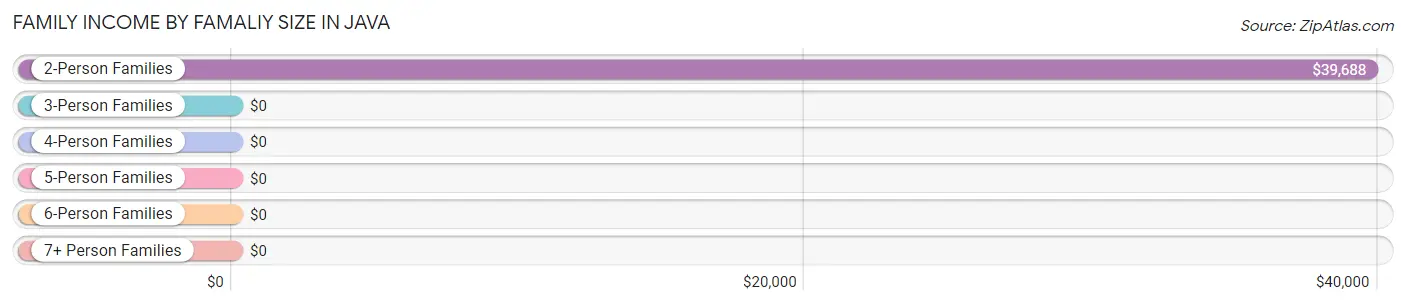
| Income Bracket | # Families | Median Income |
| 2-Person Families | 29 (60.4%) | $39,688 |
| 3-Person Families | 0 (0.0%) | $0 |
| 4-Person Families | 19 (39.6%) | $0 |
| 5-Person Families | 0 (0.0%) | $0 |
| 6-Person Families | 0 (0.0%) | $0 |
| 7+ Person Families | 0 (0.0%) | $0 |
| Total | 48 (100.0%) | $75,441 |
Family Income by Number of Earners in Java
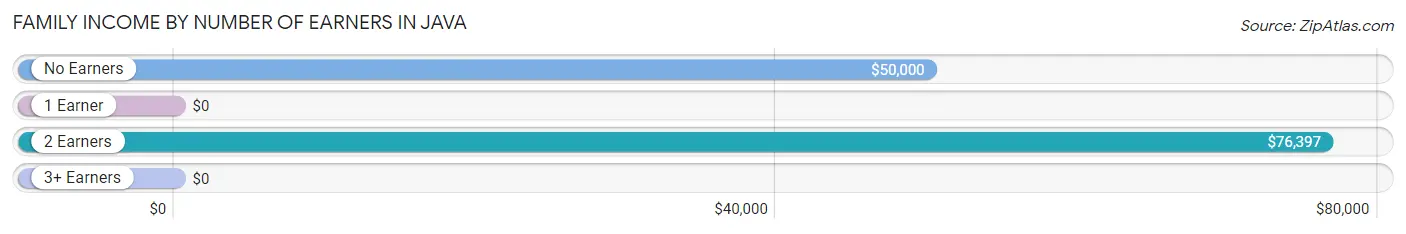
| Number of Earners | # Families | Median Income |
| No Earners | 10 (20.8%) | $50,000 |
| 1 Earner | 9 (18.8%) | $0 |
| 2 Earners | 27 (56.2%) | $76,397 |
| 3+ Earners | 2 (4.2%) | $0 |
| Total | 48 (100.0%) | $75,441 |
Household Income in Java
Household Income Brackets in Java
With 25 households falling in the category, the $75,000 to $99,999 income range is the most frequent in Java, accounting for 34.7% of all households.
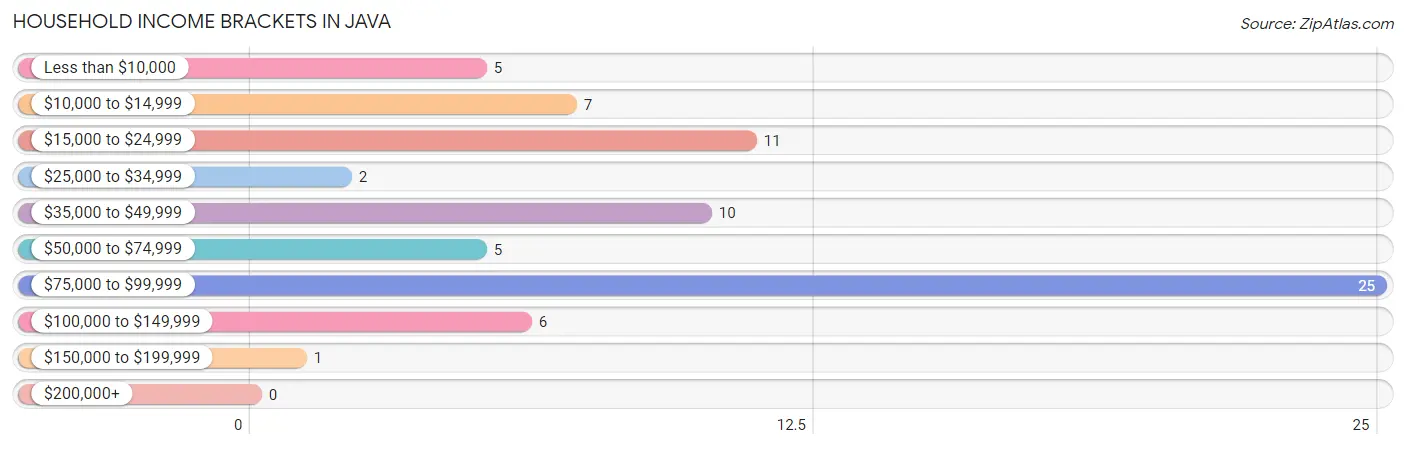
| Income Bracket | # Households | % Households |
| Less than $10,000 | 5 | 6.9% |
| $10,000 to $14,999 | 7 | 9.7% |
| $15,000 to $24,999 | 11 | 15.3% |
| $25,000 to $34,999 | 2 | 2.8% |
| $35,000 to $49,999 | 10 | 13.9% |
| $50,000 to $74,999 | 5 | 6.9% |
| $75,000 to $99,999 | 25 | 34.7% |
| $100,000 to $149,999 | 6 | 8.3% |
| $150,000 to $199,999 | 1 | 1.4% |
| $200,000+ | 0 | 0.0% |
Household Income by Householder Age in Java
The median household income in Java is $50,500, with the highest median household income of $75,956 found in the 25 to 44 years age bracket for the primary householder. A total of 27 households (37.5%) fall into this category. Meanwhile, the 15 to 24 years age bracket for the primary householder has the lowest median household income of $0, with 7 households (9.7%) in this group.
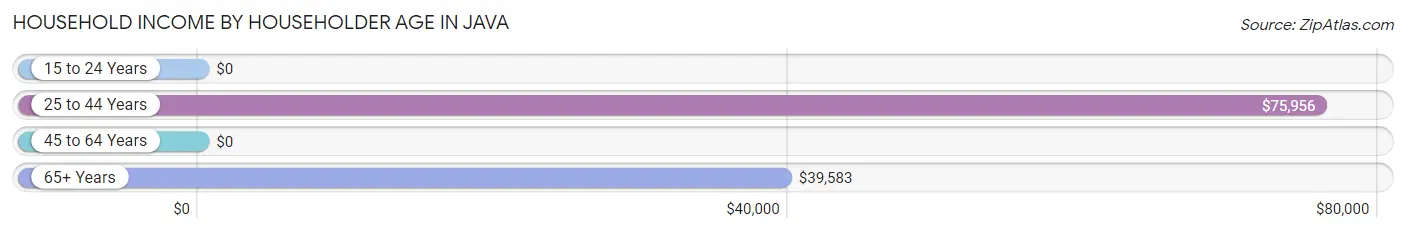
| Income Bracket | # Households | Median Income |
| 15 to 24 Years | 7 (9.7%) | $0 |
| 25 to 44 Years | 27 (37.5%) | $75,956 |
| 45 to 64 Years | 23 (31.9%) | $0 |
| 65+ Years | 15 (20.8%) | $39,583 |
| Total | 72 (100.0%) | $50,500 |
Poverty in Java
Income Below Poverty by Sex and Age in Java
With 13.8% poverty level for males and 13.5% for females among the residents of Java, 35 to 44 year old males and 45 to 54 year old females are the most vulnerable to poverty, with 8 males (100.0%) and 5 females (100.0%) in their respective age groups living below the poverty level.
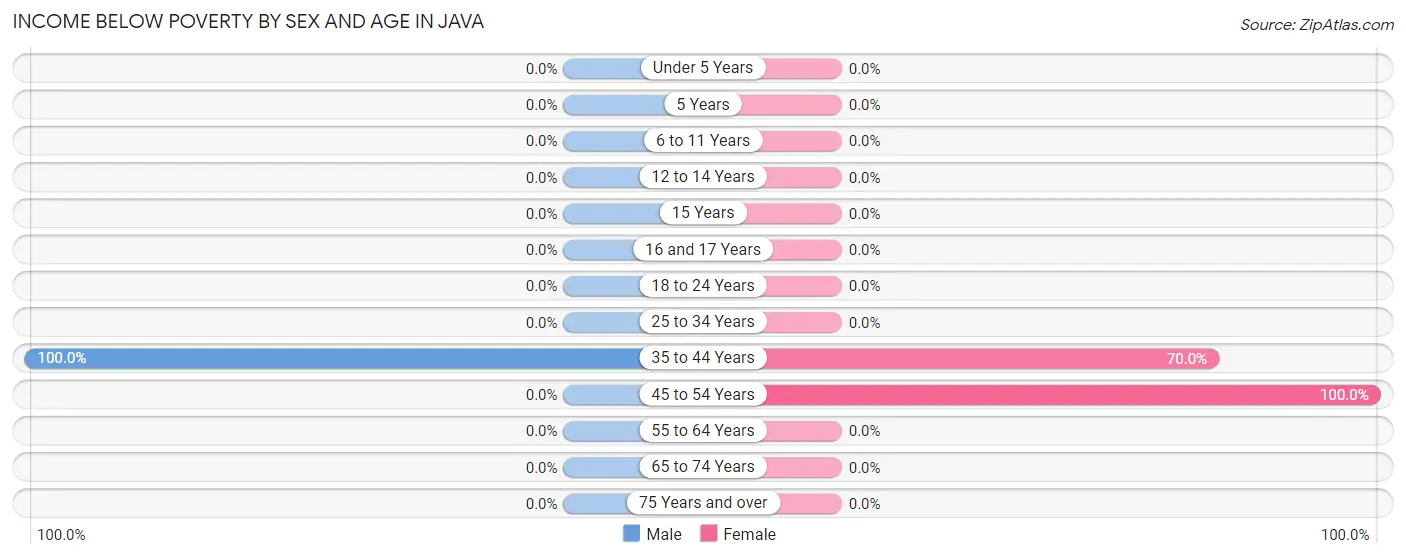
| Age Bracket | Male | Female |
| Under 5 Years | 0 (0.0%) | 0 (0.0%) |
| 5 Years | 0 (0.0%) | 0 (0.0%) |
| 6 to 11 Years | 0 (0.0%) | 0 (0.0%) |
| 12 to 14 Years | 0 (0.0%) | 0 (0.0%) |
| 15 Years | 0 (0.0%) | 0 (0.0%) |
| 16 and 17 Years | 0 (0.0%) | 0 (0.0%) |
| 18 to 24 Years | 0 (0.0%) | 0 (0.0%) |
| 25 to 34 Years | 0 (0.0%) | 0 (0.0%) |
| 35 to 44 Years | 8 (100.0%) | 7 (70.0%) |
| 45 to 54 Years | 0 (0.0%) | 5 (100.0%) |
| 55 to 64 Years | 0 (0.0%) | 0 (0.0%) |
| 65 to 74 Years | 0 (0.0%) | 0 (0.0%) |
| 75 Years and over | 0 (0.0%) | 0 (0.0%) |
| Total | 8 (13.8%) | 12 (13.5%) |
Income Above Poverty by Sex and Age in Java
According to the poverty statistics in Java, males aged under 5 years and females aged under 5 years are the age groups that are most secure financially, with 100.0% of males and 100.0% of females in these age groups living above the poverty line.
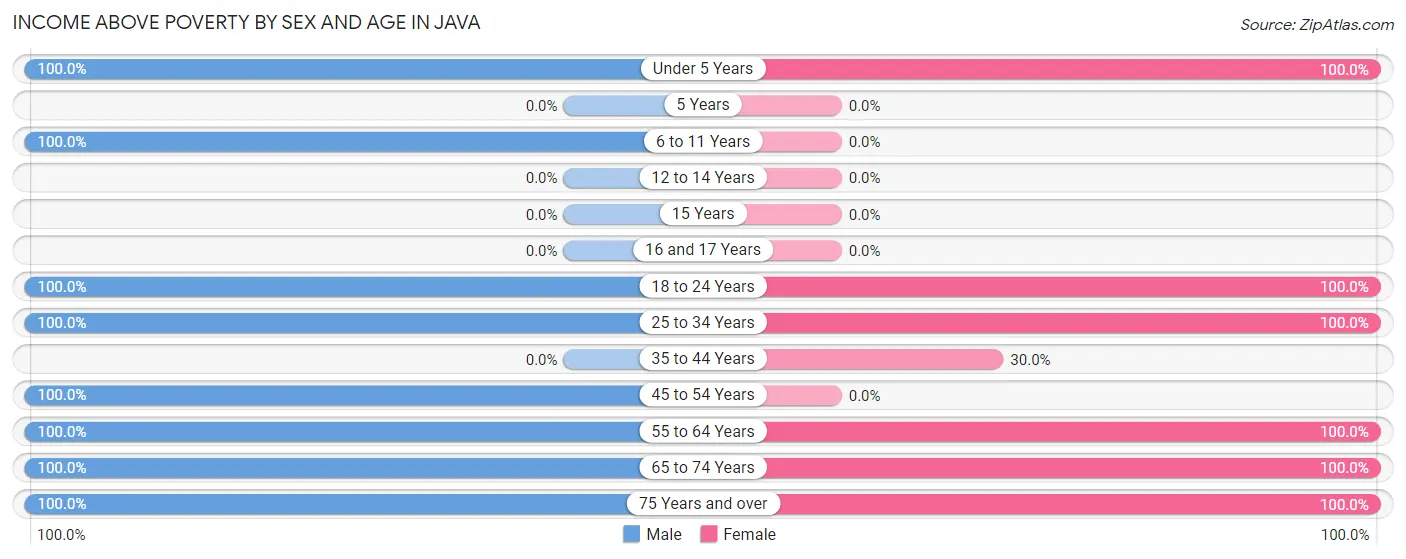
| Age Bracket | Male | Female |
| Under 5 Years | 1 (100.0%) | 8 (100.0%) |
| 5 Years | 0 (0.0%) | 0 (0.0%) |
| 6 to 11 Years | 6 (100.0%) | 0 (0.0%) |
| 12 to 14 Years | 0 (0.0%) | 0 (0.0%) |
| 15 Years | 0 (0.0%) | 0 (0.0%) |
| 16 and 17 Years | 0 (0.0%) | 0 (0.0%) |
| 18 to 24 Years | 9 (100.0%) | 18 (100.0%) |
| 25 to 34 Years | 11 (100.0%) | 21 (100.0%) |
| 35 to 44 Years | 0 (0.0%) | 3 (30.0%) |
| 45 to 54 Years | 4 (100.0%) | 0 (0.0%) |
| 55 to 64 Years | 8 (100.0%) | 17 (100.0%) |
| 65 to 74 Years | 7 (100.0%) | 6 (100.0%) |
| 75 Years and over | 4 (100.0%) | 4 (100.0%) |
| Total | 50 (86.2%) | 77 (86.5%) |
Income Below Poverty Among Married-Couple Families in Java
The poverty statistics for married-couple families in Java show that 15.2% or 7 of the total 46 families live below the poverty line. Families with no children have the highest poverty rate of 24.1%, comprising of 7 families. On the other hand, families with 1 or 2 children have the lowest poverty rate of 0.0%, which includes 0 families.
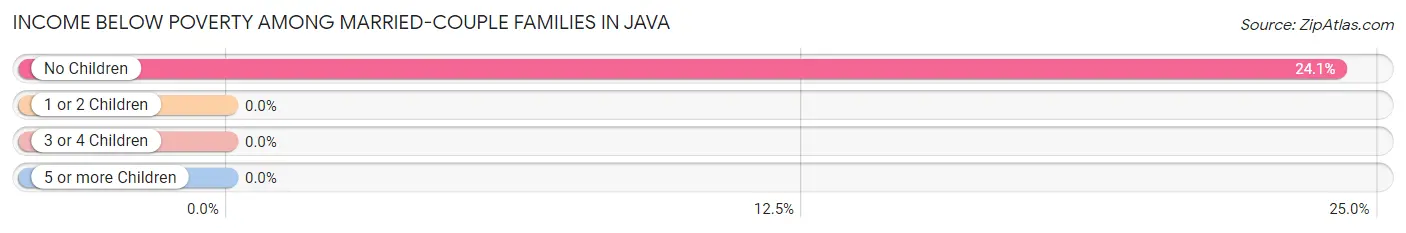
| Children | Above Poverty | Below Poverty |
| No Children | 22 (75.9%) | 7 (24.1%) |
| 1 or 2 Children | 17 (100.0%) | 0 (0.0%) |
| 3 or 4 Children | 0 (0.0%) | 0 (0.0%) |
| 5 or more Children | 0 (0.0%) | 0 (0.0%) |
| Total | 39 (84.8%) | 7 (15.2%) |
Income Below Poverty Among Single-Parent Households in Java
| Children | Single Father | Single Mother |
| No Children | 0 (0.0%) | 0 (0.0%) |
| 1 or 2 Children | 0 (0.0%) | 0 (0.0%) |
| 3 or 4 Children | 0 (0.0%) | 0 (0.0%) |
| 5 or more Children | 0 (0.0%) | 0 (0.0%) |
| Total | 0 (0.0%) | 0 (0.0%) |
Income Below Poverty Among Married-Couple vs Single-Parent Households in Java
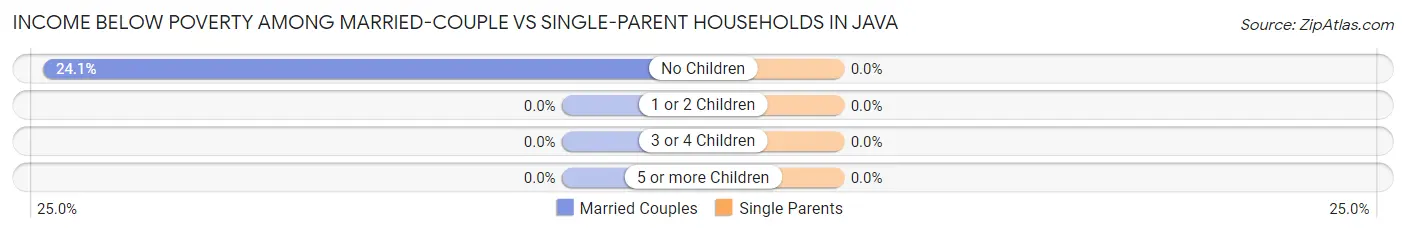
| Children | Married-Couple Families | Single-Parent Households |
| No Children | 7 (24.1%) | 0 (0.0%) |
| 1 or 2 Children | 0 (0.0%) | 0 (0.0%) |
| 3 or 4 Children | 0 (0.0%) | 0 (0.0%) |
| 5 or more Children | 0 (0.0%) | 0 (0.0%) |
| Total | 7 (15.2%) | 0 (0.0%) |
Race in Java
The most populous races in Java are White / Caucasian (144 | 98.0%), Hispanic or Latino (7 | 4.8%), and Two or more Races (3 | 2.0%).
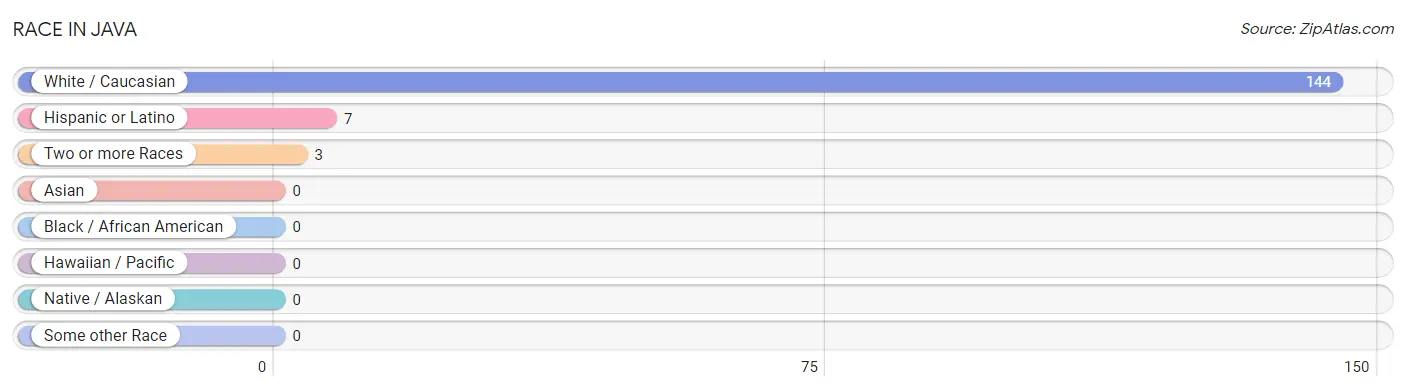
| Race | # Population | % Population |
| Asian | 0 | 0.0% |
| Black / African American | 0 | 0.0% |
| Hawaiian / Pacific | 0 | 0.0% |
| Hispanic or Latino | 7 | 4.8% |
| Native / Alaskan | 0 | 0.0% |
| White / Caucasian | 144 | 98.0% |
| Two or more Races | 3 | 2.0% |
| Some other Race | 0 | 0.0% |
| Total | 147 | 100.0% |
Ancestry in Java
The most populous ancestries reported in Java are German (56 | 38.1%), Irish (19 | 12.9%), Norwegian (16 | 10.9%), French (6 | 4.1%), and Armenian (4 | 2.7%), together accounting for 68.7% of all Java residents.
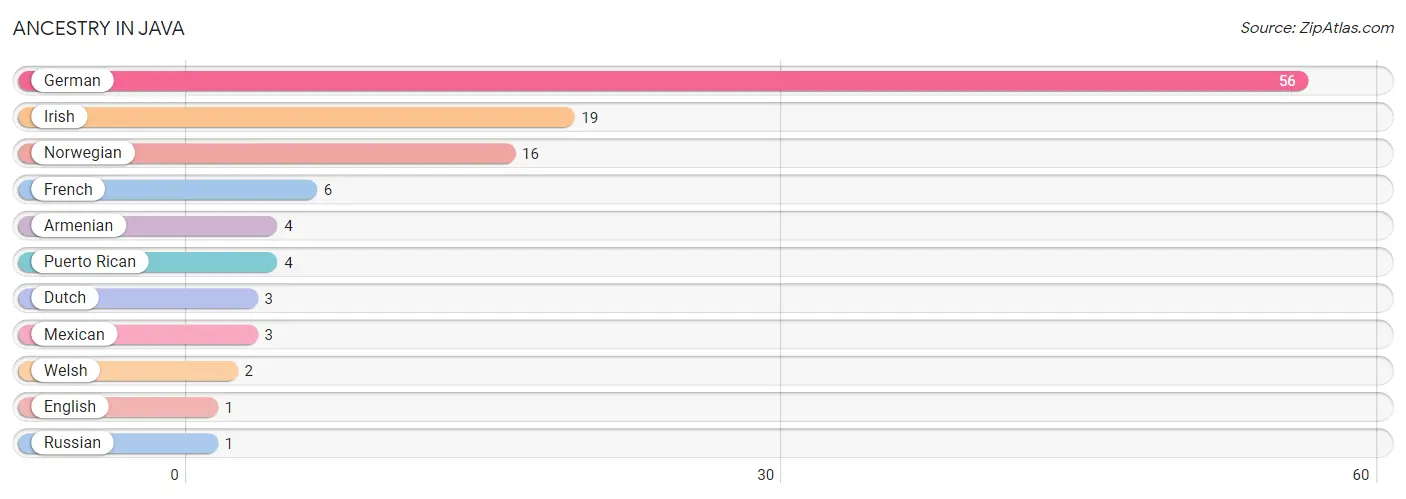
| Ancestry | # Population | % Population |
| Armenian | 4 | 2.7% |
| Dutch | 3 | 2.0% |
| English | 1 | 0.7% |
| French | 6 | 4.1% |
| German | 56 | 38.1% |
| Irish | 19 | 12.9% |
| Mexican | 3 | 2.0% |
| Norwegian | 16 | 10.9% |
| Puerto Rican | 4 | 2.7% |
| Russian | 1 | 0.7% |
| Welsh | 2 | 1.4% | View All 11 Rows |
Immigrants in Java

| Immigration Origin | # Population | % Population | View All 0 Rows |
Sex and Age in Java
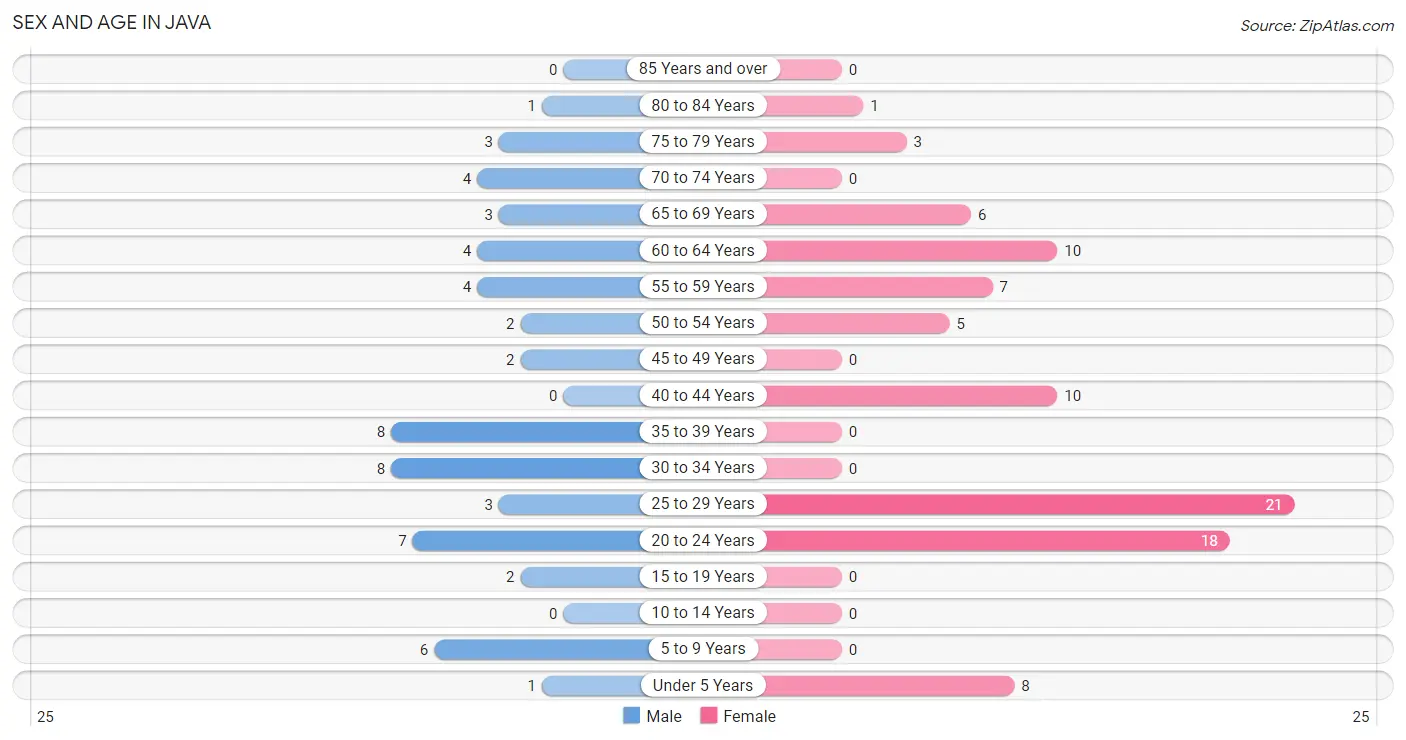
Sex and Age in Java
The most populous age groups in Java are 30 to 34 Years (8 | 13.8%) for men and 25 to 29 Years (21 | 23.6%) for women.
| Age Bracket | Male | Female |
| Under 5 Years | 1 (1.7%) | 8 (9.0%) |
| 5 to 9 Years | 6 (10.3%) | 0 (0.0%) |
| 10 to 14 Years | 0 (0.0%) | 0 (0.0%) |
| 15 to 19 Years | 2 (3.5%) | 0 (0.0%) |
| 20 to 24 Years | 7 (12.1%) | 18 (20.2%) |
| 25 to 29 Years | 3 (5.2%) | 21 (23.6%) |
| 30 to 34 Years | 8 (13.8%) | 0 (0.0%) |
| 35 to 39 Years | 8 (13.8%) | 0 (0.0%) |
| 40 to 44 Years | 0 (0.0%) | 10 (11.2%) |
| 45 to 49 Years | 2 (3.5%) | 0 (0.0%) |
| 50 to 54 Years | 2 (3.5%) | 5 (5.6%) |
| 55 to 59 Years | 4 (6.9%) | 7 (7.9%) |
| 60 to 64 Years | 4 (6.9%) | 10 (11.2%) |
| 65 to 69 Years | 3 (5.2%) | 6 (6.7%) |
| 70 to 74 Years | 4 (6.9%) | 0 (0.0%) |
| 75 to 79 Years | 3 (5.2%) | 3 (3.4%) |
| 80 to 84 Years | 1 (1.7%) | 1 (1.1%) |
| 85 Years and over | 0 (0.0%) | 0 (0.0%) |
| Total | 58 (100.0%) | 89 (100.0%) |
Families and Households in Java
Median Family Size in Java
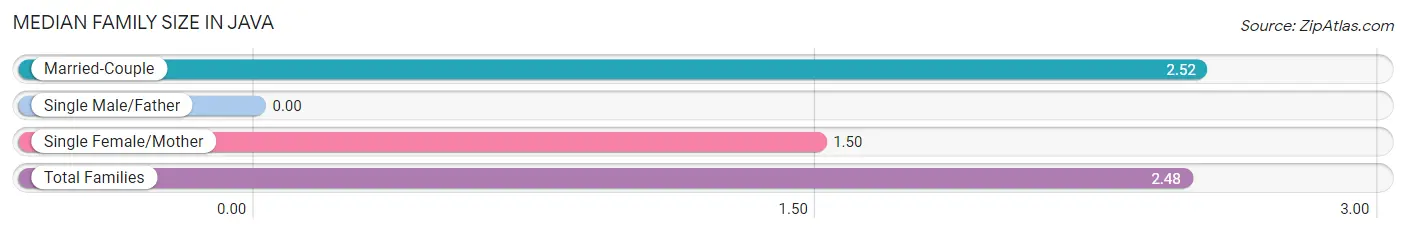
| Family Type | # Families | Family Size |
| Married-Couple | 46 (95.8%) | 2.52 |
| Single Male/Father | 0 (0.0%) | - |
| Single Female/Mother | 2 (4.2%) | 1.50 |
| Total Families | 48 (100.0%) | 2.48 |
Median Household Size in Java
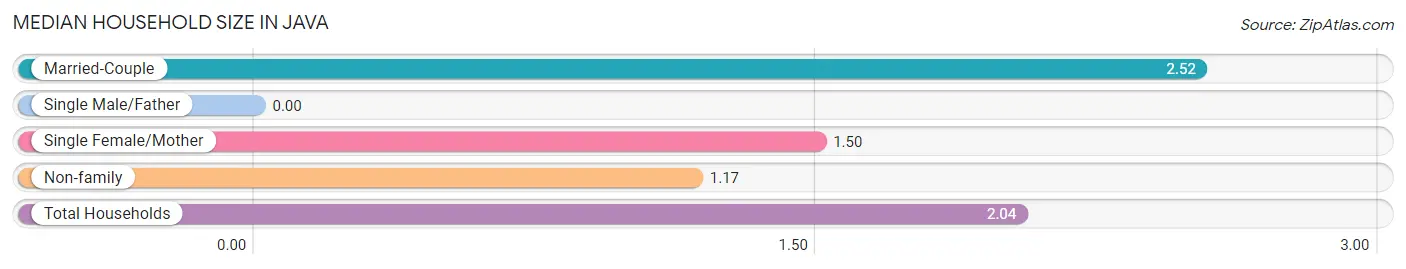
| Household Type | # Households | Household Size |
| Married-Couple | 46 (63.9%) | 2.52 |
| Single Male/Father | 0 (0.0%) | - |
| Single Female/Mother | 2 (2.8%) | 1.50 |
| Non-family | 24 (33.3%) | 1.17 |
| Total Households | 72 (100.0%) | 2.04 |
Household Size by Marriage Status in Java
Out of a total of 72 households in Java, 48 (66.7%) are family households, while 24 (33.3%) are nonfamily households. The most numerous type of family households are 2-person households, comprising 29, and the most common type of nonfamily households are 1-person households, comprising 21.
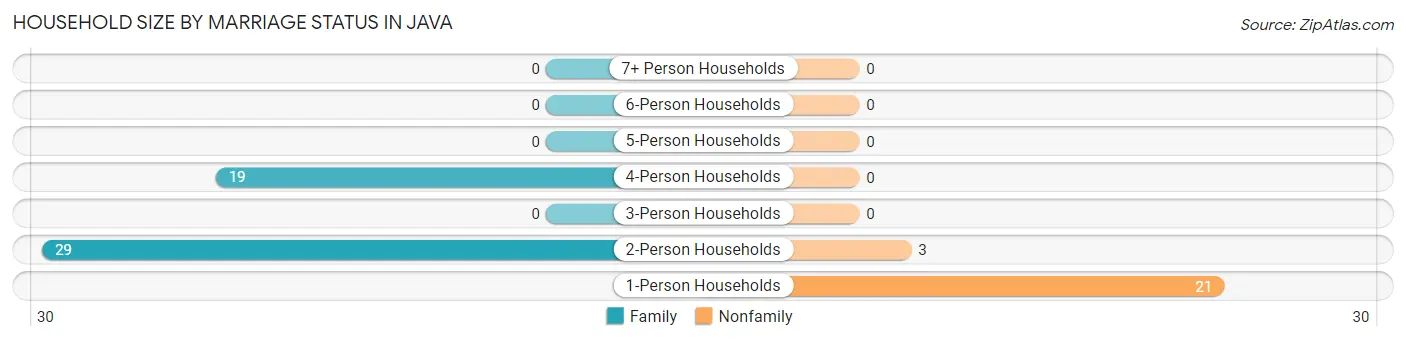
| Household Size | Family Households | Nonfamily Households |
| 1-Person Households | - | 21 (29.2%) |
| 2-Person Households | 29 (40.3%) | 3 (4.2%) |
| 3-Person Households | 0 (0.0%) | 0 (0.0%) |
| 4-Person Households | 19 (26.4%) | 0 (0.0%) |
| 5-Person Households | 0 (0.0%) | 0 (0.0%) |
| 6-Person Households | 0 (0.0%) | 0 (0.0%) |
| 7+ Person Households | 0 (0.0%) | 0 (0.0%) |
| Total | 48 (66.7%) | 24 (33.3%) |
Female Fertility in Java
Fertility by Age in Java
| Age Bracket | Women with Births | Births / 1,000 Women |
| 15 to 19 years | 0 (0.0%) | 0.0 |
| 20 to 34 years | 0 (0.0%) | 0.0 |
| 35 to 50 years | 0 (0.0%) | 0.0 |
| Total | 0 (0.0%) | 0.0 |
Fertility by Age by Marriage Status in Java
| Age Bracket | Married | Unmarried |
| 15 to 19 years | 0 (0.0%) | 0 (0.0%) |
| 20 to 34 years | 0 (0.0%) | 0 (0.0%) |
| 35 to 50 years | 0 (0.0%) | 0 (0.0%) |
| Total | 0 (0.0%) | 0 (0.0%) |
Fertility by Education in Java
| Educational Attainment | Women with Births | Births / 1,000 Women |
| Less than High School | 0 (0.0%) | 0.0 |
| High School Diploma | 0 (0.0%) | 0.0 |
| College or Associate's Degree | 0 (0.0%) | 0.0 |
| Bachelor's Degree | 0 (0.0%) | 0.0 |
| Graduate Degree | 0 (0.0%) | 0.0 |
| Total | 0 (0.0%) | 0.0 |
Fertility by Education by Marriage Status in Java
| Educational Attainment | Married | Unmarried |
| Less than High School | 0 (0.0%) | 0 (0.0%) |
| High School Diploma | 0 (0.0%) | 0 (0.0%) |
| College or Associate's Degree | 0 (0.0%) | 0 (0.0%) |
| Bachelor's Degree | 0 (0.0%) | 0 (0.0%) |
| Graduate Degree | 0 (0.0%) | 0 (0.0%) |
| Total | 0 (0.0%) | 0 (0.0%) |
Employment Characteristics in Java
Employment by Class of Employer in Java
Among the 84 employed individuals in Java, private company employees (60 | 71.4%), local government employees (16 | 19.1%), and not-for-profit organizations (6 | 7.1%) make up the most common classes of employment.
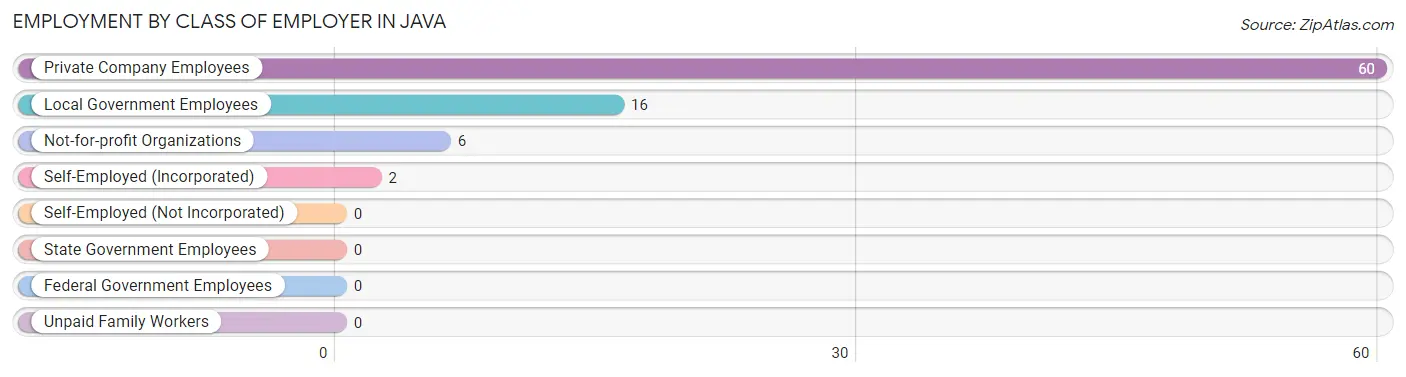
| Employer Class | # Employees | % Employees |
| Private Company Employees | 60 | 71.4% |
| Self-Employed (Incorporated) | 2 | 2.4% |
| Self-Employed (Not Incorporated) | 0 | 0.0% |
| Not-for-profit Organizations | 6 | 7.1% |
| Local Government Employees | 16 | 19.1% |
| State Government Employees | 0 | 0.0% |
| Federal Government Employees | 0 | 0.0% |
| Unpaid Family Workers | 0 | 0.0% |
| Total | 84 | 100.0% |
Employment Status by Age in Java
According to the labor force statistics for Java, out of the total population over 16 years of age (132), 69.7% or 92 individuals are in the labor force, with 8.7% or 8 of them unemployed. The age group with the highest labor force participation rate is 20 to 24 years, with 100.0% or 25 individuals in the labor force. Within the labor force, the 35 to 44 years age range has the highest percentage of unemployed individuals, with 72.7% or 8 of them being unemployed.
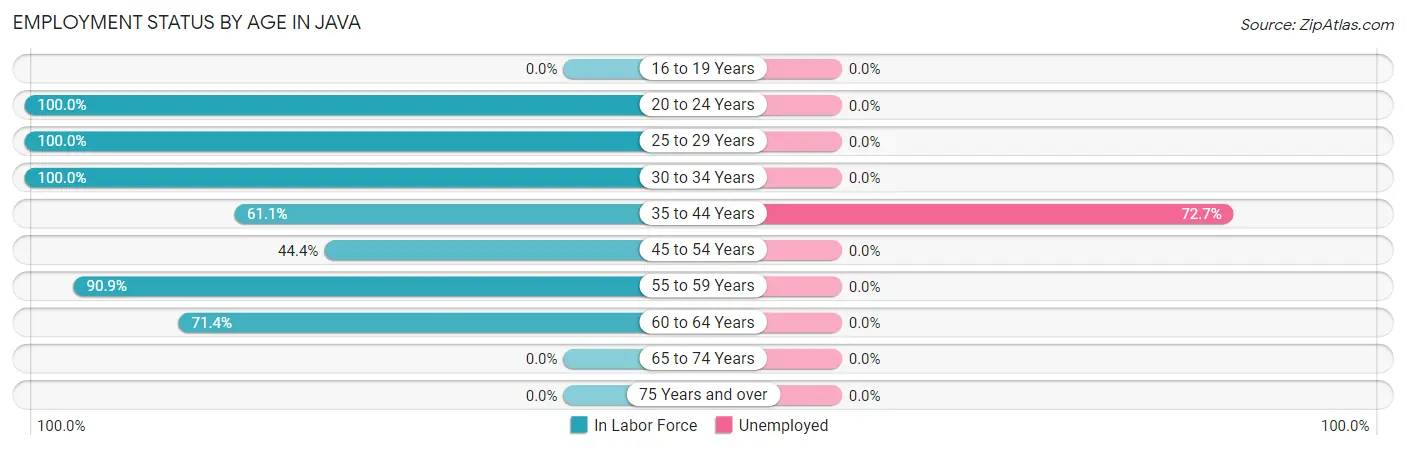
| Age Bracket | In Labor Force | Unemployed |
| 16 to 19 Years | 0 (0.0%) | 0 (0.0%) |
| 20 to 24 Years | 25 (100.0%) | 0 (0.0%) |
| 25 to 29 Years | 24 (100.0%) | 0 (0.0%) |
| 30 to 34 Years | 8 (100.0%) | 0 (0.0%) |
| 35 to 44 Years | 11 (61.1%) | 8 (72.7%) |
| 45 to 54 Years | 4 (44.4%) | 0 (0.0%) |
| 55 to 59 Years | 10 (90.9%) | 0 (0.0%) |
| 60 to 64 Years | 10 (71.4%) | 0 (0.0%) |
| 65 to 74 Years | 0 (0.0%) | 0 (0.0%) |
| 75 Years and over | 0 (0.0%) | 0 (0.0%) |
| Total | 92 (69.7%) | 8 (8.7%) |
Employment Status by Educational Attainment in Java
According to labor force statistics for Java, 79.8% of individuals (67) out of the total population between 25 and 64 years of age (84) are in the labor force, with 11.9% or 8 of them being unemployed. The group with the highest labor force participation rate are those with the educational attainment of high school diploma, with 85.2% or 46 individuals in the labor force. Within the labor force, individuals with high school diploma education have the highest percentage of unemployment, with 17.4% or 8 of them being unemployed.
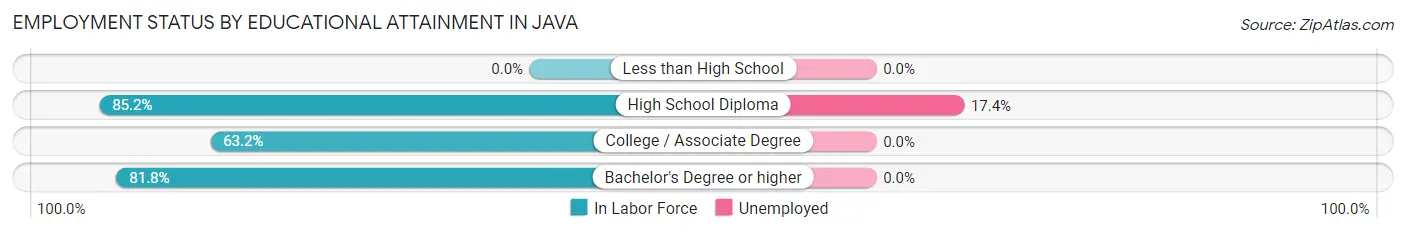
| Educational Attainment | In Labor Force | Unemployed |
| Less than High School | 0 (0.0%) | 0 (0.0%) |
| High School Diploma | 46 (85.2%) | 9 (17.4%) |
| College / Associate Degree | 12 (63.2%) | 0 (0.0%) |
| Bachelor's Degree or higher | 9 (81.8%) | 0 (0.0%) |
| Total | 67 (79.8%) | 10 (11.9%) |
Employment Occupations by Sex in Java
Management, Business, Science and Arts Occupations
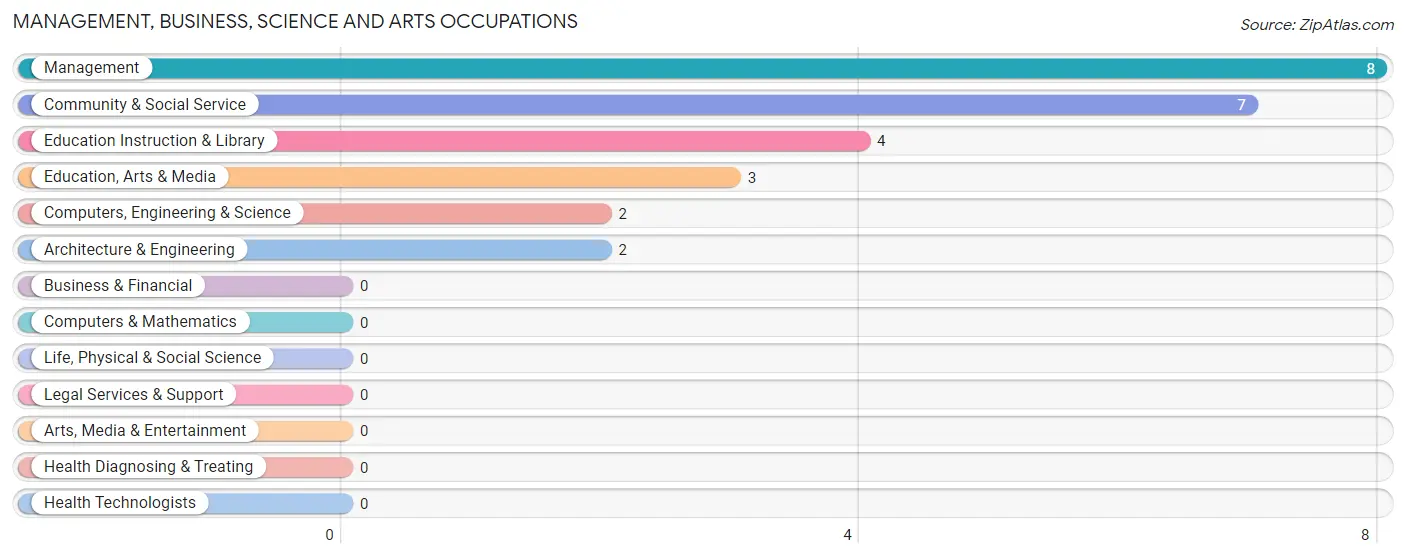
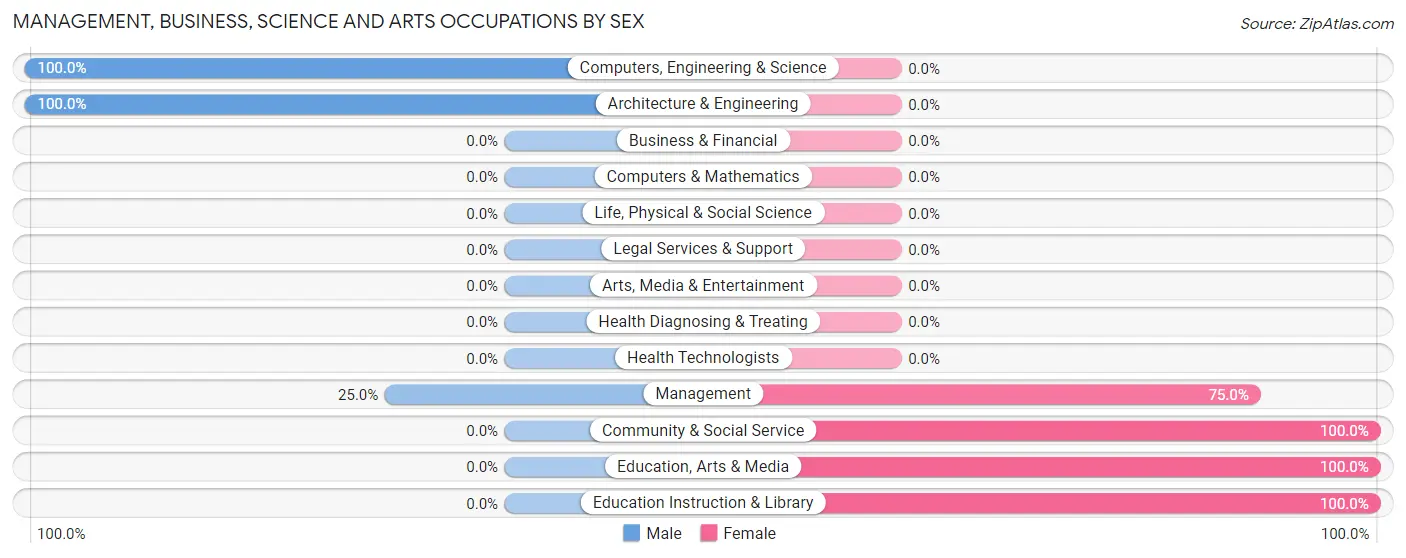
The most common Management, Business, Science and Arts occupations in Java are Management (8 | 9.5%), Community & Social Service (7 | 8.3%), Education Instruction & Library (4 | 4.8%), Education, Arts & Media (3 | 3.6%), and Computers, Engineering & Science (2 | 2.4%).
Management, Business, Science and Arts Occupations by Sex
Within the Management, Business, Science and Arts occupations in Java, the most male-oriented occupations are Computers, Engineering & Science (100.0%), Architecture & Engineering (100.0%), and Management (25.0%), while the most female-oriented occupations are Community & Social Service (100.0%), Education, Arts & Media (100.0%), and Education Instruction & Library (100.0%).
| Occupation | Male | Female |
| Management | 2 (25.0%) | 6 (75.0%) |
| Business & Financial | 0 (0.0%) | 0 (0.0%) |
| Computers, Engineering & Science | 2 (100.0%) | 0 (0.0%) |
| Computers & Mathematics | 0 (0.0%) | 0 (0.0%) |
| Architecture & Engineering | 2 (100.0%) | 0 (0.0%) |
| Life, Physical & Social Science | 0 (0.0%) | 0 (0.0%) |
| Community & Social Service | 0 (0.0%) | 7 (100.0%) |
| Education, Arts & Media | 0 (0.0%) | 3 (100.0%) |
| Legal Services & Support | 0 (0.0%) | 0 (0.0%) |
| Education Instruction & Library | 0 (0.0%) | 4 (100.0%) |
| Arts, Media & Entertainment | 0 (0.0%) | 0 (0.0%) |
| Health Diagnosing & Treating | 0 (0.0%) | 0 (0.0%) |
| Health Technologists | 0 (0.0%) | 0 (0.0%) |
| Total (Category) | 4 (23.5%) | 13 (76.5%) |
| Total (Overall) | 30 (35.7%) | 54 (64.3%) |
Services Occupations
The most common Services occupations in Java are Food Preparation & Serving (17 | 20.2%), Personal Care & Service (13 | 15.5%), Cleaning & Maintenance (6 | 7.1%), and Healthcare Support (4 | 4.8%).
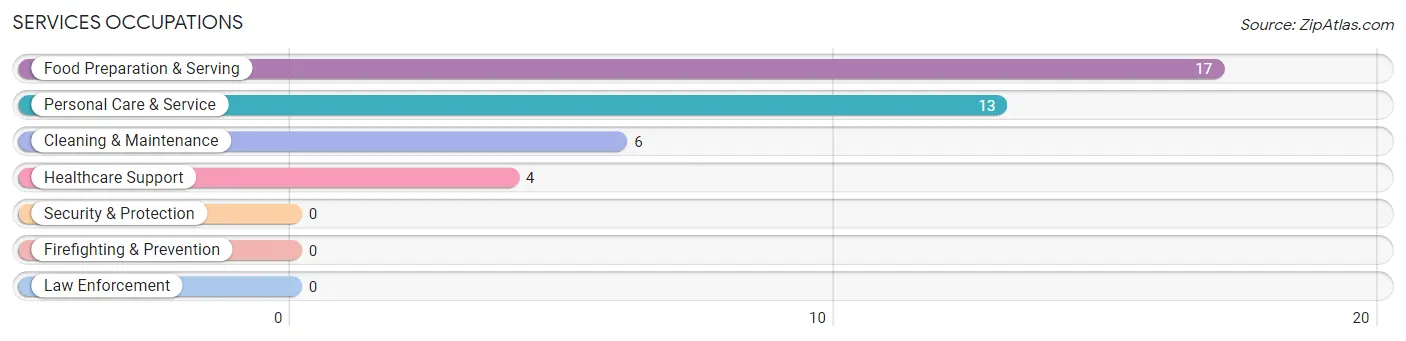
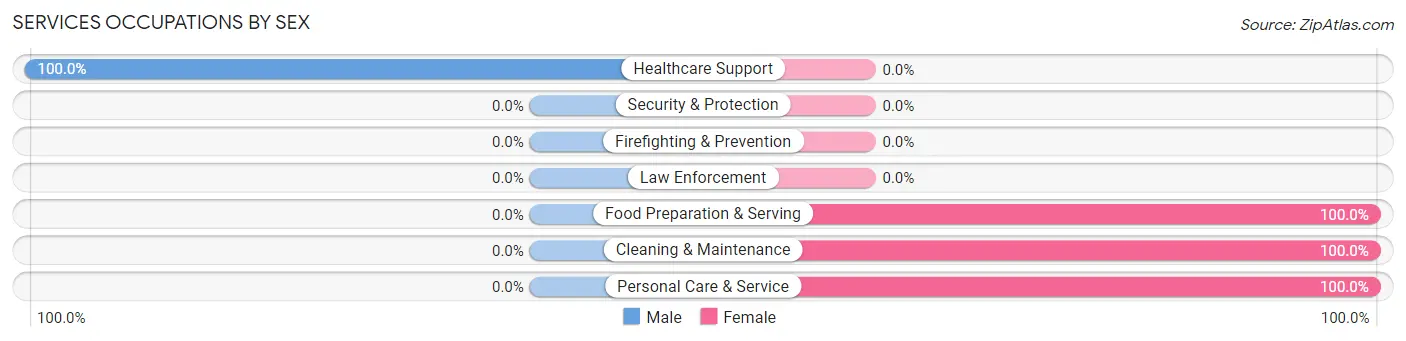
Services Occupations by Sex
| Occupation | Male | Female |
| Healthcare Support | 4 (100.0%) | 0 (0.0%) |
| Security & Protection | 0 (0.0%) | 0 (0.0%) |
| Firefighting & Prevention | 0 (0.0%) | 0 (0.0%) |
| Law Enforcement | 0 (0.0%) | 0 (0.0%) |
| Food Preparation & Serving | 0 (0.0%) | 17 (100.0%) |
| Cleaning & Maintenance | 0 (0.0%) | 6 (100.0%) |
| Personal Care & Service | 0 (0.0%) | 13 (100.0%) |
| Total (Category) | 4 (10.0%) | 36 (90.0%) |
| Total (Overall) | 30 (35.7%) | 54 (64.3%) |
Sales and Office Occupations
The most common Sales and Office occupations in Java are Office & Administration (5 | 5.9%), and Sales & Related (1 | 1.2%).
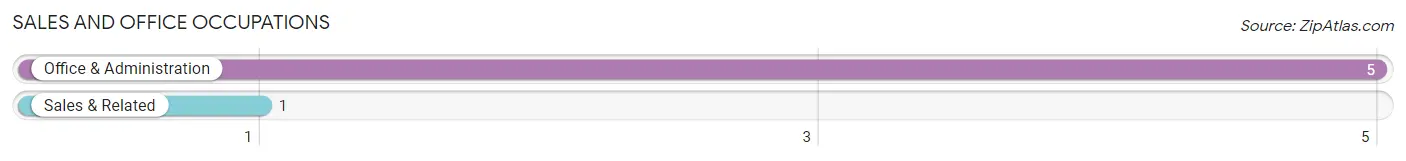
Sales and Office Occupations by Sex
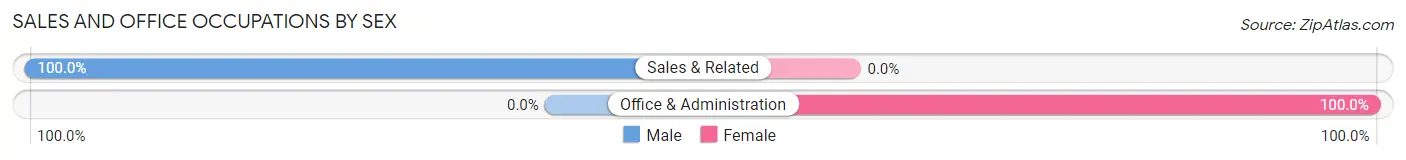
| Occupation | Male | Female |
| Sales & Related | 1 (100.0%) | 0 (0.0%) |
| Office & Administration | 0 (0.0%) | 5 (100.0%) |
| Total (Category) | 1 (16.7%) | 5 (83.3%) |
| Total (Overall) | 30 (35.7%) | 54 (64.3%) |
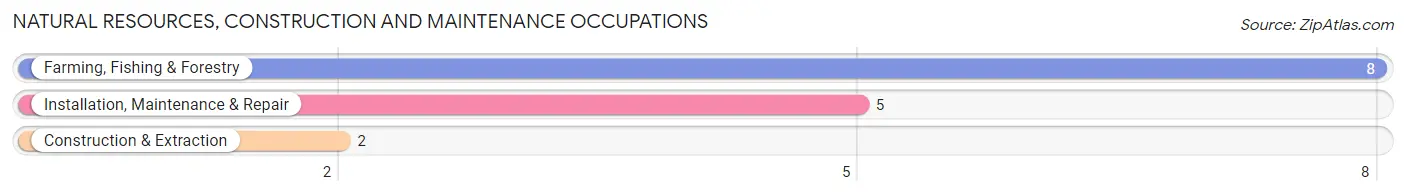
Natural Resources, Construction and Maintenance Occupations
The most common Natural Resources, Construction and Maintenance occupations in Java are Farming, Fishing & Forestry (8 | 9.5%), Installation, Maintenance & Repair (5 | 5.9%), and Construction & Extraction (2 | 2.4%).
Natural Resources, Construction and Maintenance Occupations by Sex
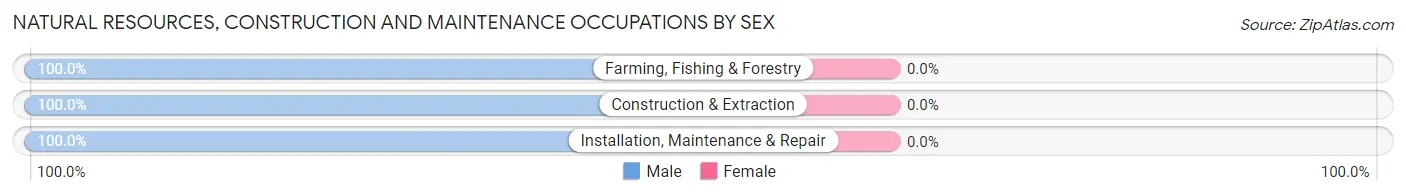
| Occupation | Male | Female |
| Farming, Fishing & Forestry | 8 (100.0%) | 0 (0.0%) |
| Construction & Extraction | 2 (100.0%) | 0 (0.0%) |
| Installation, Maintenance & Repair | 5 (100.0%) | 0 (0.0%) |
| Total (Category) | 15 (100.0%) | 0 (0.0%) |
| Total (Overall) | 30 (35.7%) | 54 (64.3%) |
Production, Transportation and Moving Occupations
The most common Production, Transportation and Moving occupations in Java are Production (3 | 3.6%), and Transportation (3 | 3.6%).
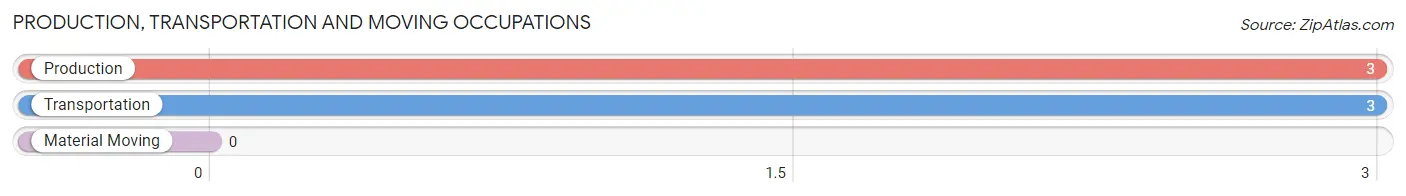
Production, Transportation and Moving Occupations by Sex
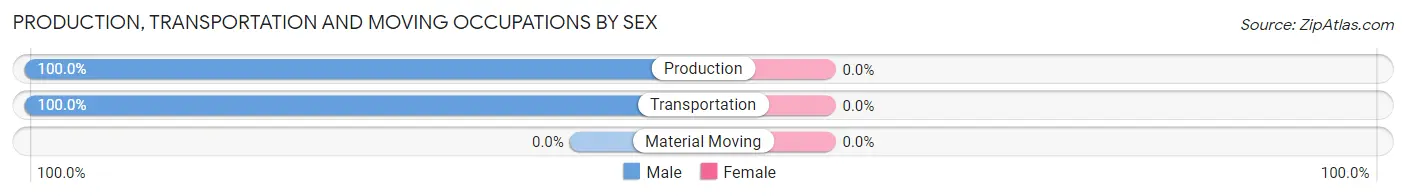
| Occupation | Male | Female |
| Production | 3 (100.0%) | 0 (0.0%) |
| Transportation | 3 (100.0%) | 0 (0.0%) |
| Material Moving | 0 (0.0%) | 0 (0.0%) |
| Total (Category) | 6 (100.0%) | 0 (0.0%) |
| Total (Overall) | 30 (35.7%) | 54 (64.3%) |
Employment Industries by Sex in Java
Employment Industries in Java
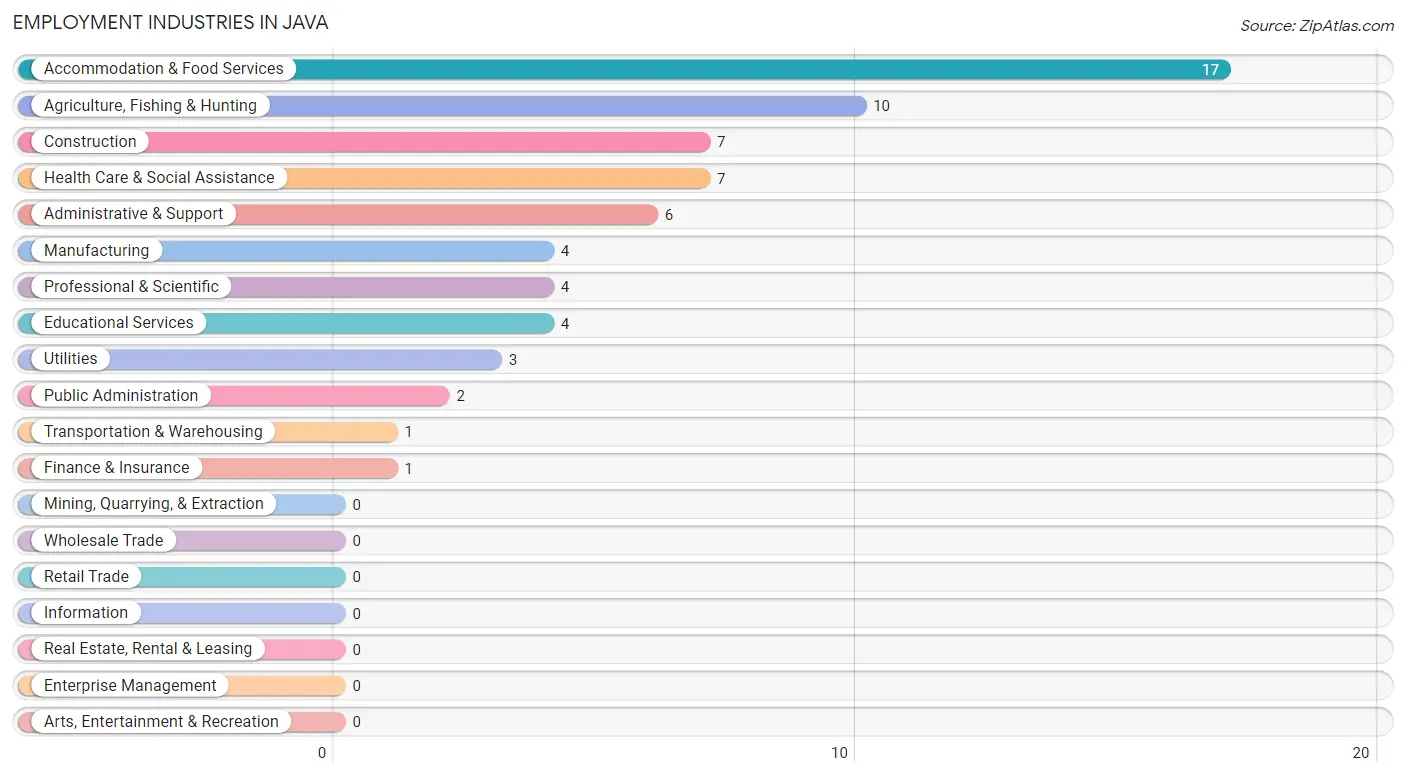
The major employment industries in Java include Accommodation & Food Services (17 | 20.2%), Agriculture, Fishing & Hunting (10 | 11.9%), Construction (7 | 8.3%), Health Care & Social Assistance (7 | 8.3%), and Administrative & Support (6 | 7.1%).
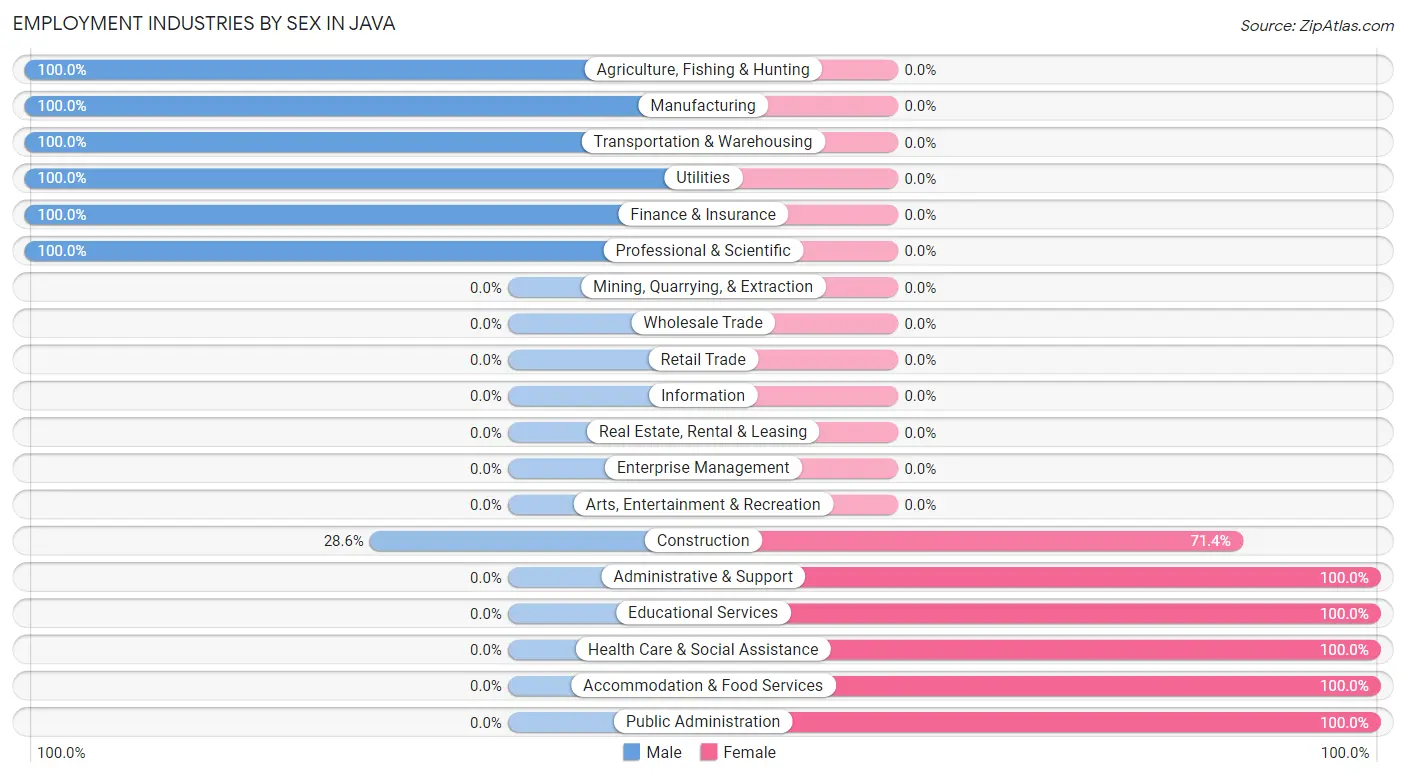
Employment Industries by Sex in Java
The Java industries that see more men than women are Agriculture, Fishing & Hunting (100.0%), Manufacturing (100.0%), and Transportation & Warehousing (100.0%), whereas the industries that tend to have a higher number of women are Administrative & Support (100.0%), Educational Services (100.0%), and Health Care & Social Assistance (100.0%).
| Industry | Male | Female |
| Agriculture, Fishing & Hunting | 10 (100.0%) | 0 (0.0%) |
| Mining, Quarrying, & Extraction | 0 (0.0%) | 0 (0.0%) |
| Construction | 2 (28.6%) | 5 (71.4%) |
| Manufacturing | 4 (100.0%) | 0 (0.0%) |
| Wholesale Trade | 0 (0.0%) | 0 (0.0%) |
| Retail Trade | 0 (0.0%) | 0 (0.0%) |
| Transportation & Warehousing | 1 (100.0%) | 0 (0.0%) |
| Utilities | 3 (100.0%) | 0 (0.0%) |
| Information | 0 (0.0%) | 0 (0.0%) |
| Finance & Insurance | 1 (100.0%) | 0 (0.0%) |
| Real Estate, Rental & Leasing | 0 (0.0%) | 0 (0.0%) |
| Professional & Scientific | 4 (100.0%) | 0 (0.0%) |
| Enterprise Management | 0 (0.0%) | 0 (0.0%) |
| Administrative & Support | 0 (0.0%) | 6 (100.0%) |
| Educational Services | 0 (0.0%) | 4 (100.0%) |
| Health Care & Social Assistance | 0 (0.0%) | 7 (100.0%) |
| Arts, Entertainment & Recreation | 0 (0.0%) | 0 (0.0%) |
| Accommodation & Food Services | 0 (0.0%) | 17 (100.0%) |
| Public Administration | 0 (0.0%) | 2 (100.0%) |
| Total | 30 (35.7%) | 54 (64.3%) |
Education in Java
School Enrollment in Java
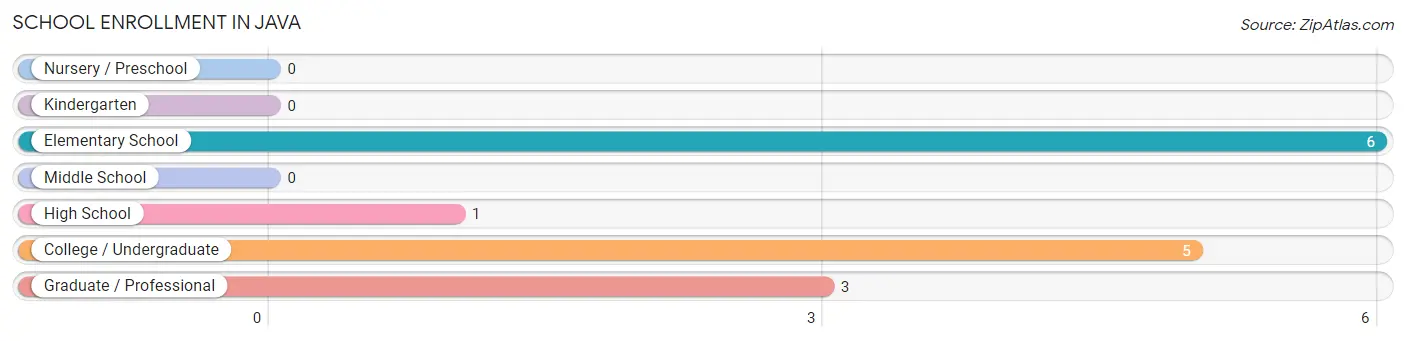
The most common levels of schooling among the 15 students in Java are elementary school (6 | 40.0%), college / undergraduate (5 | 33.3%), and graduate / professional (3 | 20.0%).
| School Level | # Students | % Students |
| Nursery / Preschool | 0 | 0.0% |
| Kindergarten | 0 | 0.0% |
| Elementary School | 6 | 40.0% |
| Middle School | 0 | 0.0% |
| High School | 1 | 6.7% |
| College / Undergraduate | 5 | 33.3% |
| Graduate / Professional | 3 | 20.0% |
| Total | 15 | 100.0% |
School Enrollment by Age by Funding Source in Java
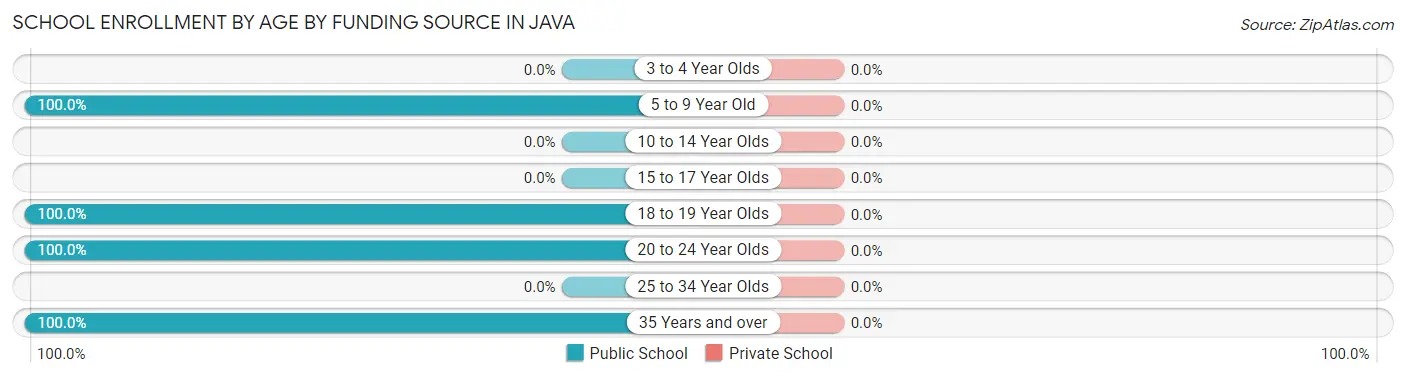
| Age Bracket | Public School | Private School |
| 3 to 4 Year Olds | 0 (0.0%) | 0 (0.0%) |
| 5 to 9 Year Old | 6 (100.0%) | 0 (0.0%) |
| 10 to 14 Year Olds | 0 (0.0%) | 0 (0.0%) |
| 15 to 17 Year Olds | 0 (0.0%) | 0 (0.0%) |
| 18 to 19 Year Olds | 1 (100.0%) | 0 (0.0%) |
| 20 to 24 Year Olds | 5 (100.0%) | 0 (0.0%) |
| 25 to 34 Year Olds | 0 (0.0%) | 0 (0.0%) |
| 35 Years and over | 3 (100.0%) | 0 (0.0%) |
| Total | 15 (100.0%) | 0 (0.0%) |
Educational Attainment by Field of Study in Java
Education (9 | 52.9%), bio, nature & agricultural (4 | 23.5%), science & technology (2 | 11.8%), and business (2 | 11.8%) are the most common fields of study among 17 individuals in Java who have obtained a bachelor's degree or higher.
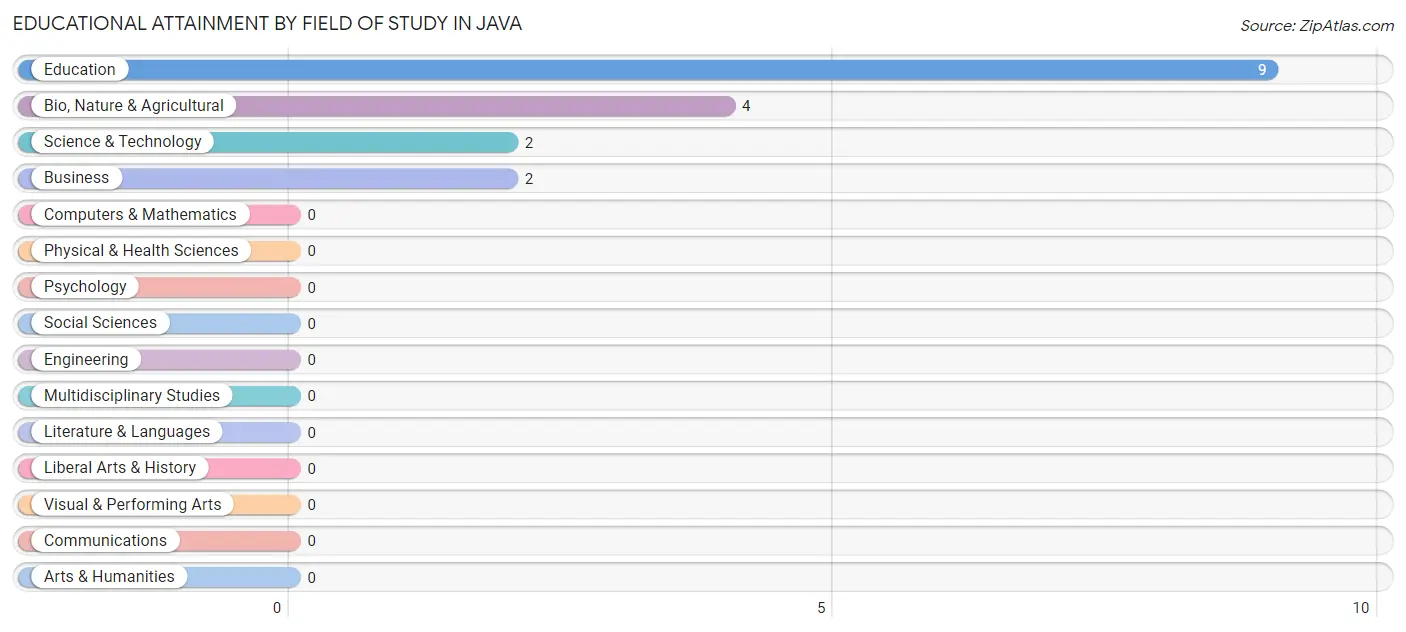
| Field of Study | # Graduates | % Graduates |
| Computers & Mathematics | 0 | 0.0% |
| Bio, Nature & Agricultural | 4 | 23.5% |
| Physical & Health Sciences | 0 | 0.0% |
| Psychology | 0 | 0.0% |
| Social Sciences | 0 | 0.0% |
| Engineering | 0 | 0.0% |
| Multidisciplinary Studies | 0 | 0.0% |
| Science & Technology | 2 | 11.8% |
| Business | 2 | 11.8% |
| Education | 9 | 52.9% |
| Literature & Languages | 0 | 0.0% |
| Liberal Arts & History | 0 | 0.0% |
| Visual & Performing Arts | 0 | 0.0% |
| Communications | 0 | 0.0% |
| Arts & Humanities | 0 | 0.0% |
| Total | 17 | 100.0% |
Transportation & Commute in Java
Vehicle Availability by Sex in Java
The most prevalent vehicle ownership categories in Java are males with 4 vehicles (16, accounting for 53.3%) and females with 4 vehicles (34, making up 29.6%).
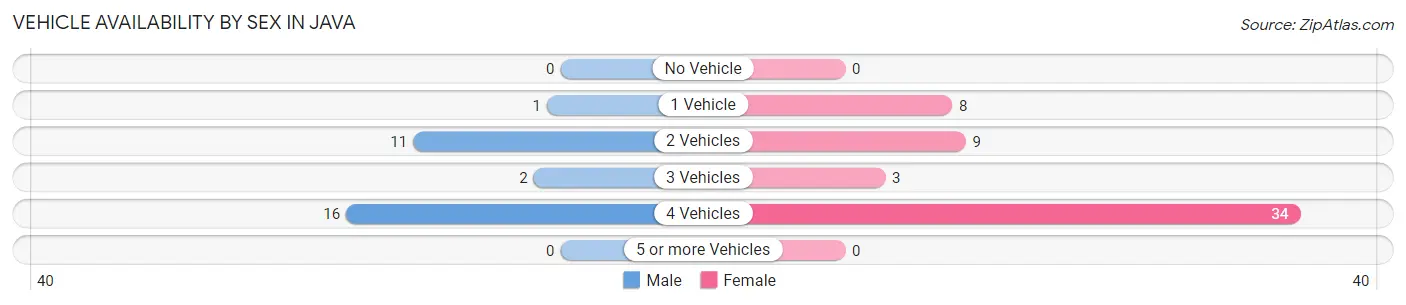
| Vehicles Available | Male | Female |
| No Vehicle | 0 (0.0%) | 0 (0.0%) |
| 1 Vehicle | 1 (3.3%) | 8 (14.8%) |
| 2 Vehicles | 11 (36.7%) | 9 (16.7%) |
| 3 Vehicles | 2 (6.7%) | 3 (5.6%) |
| 4 Vehicles | 16 (53.3%) | 34 (63.0%) |
| 5 or more Vehicles | 0 (0.0%) | 0 (0.0%) |
| Total | 30 (100.0%) | 54 (100.0%) |
Commute Time in Java
The most frequently occuring commute durations in Java are 10 to 14 minutes (38 commuters, 45.2%), 30 to 34 minutes (26 commuters, 30.9%), and 5 to 9 minutes (11 commuters, 13.1%).
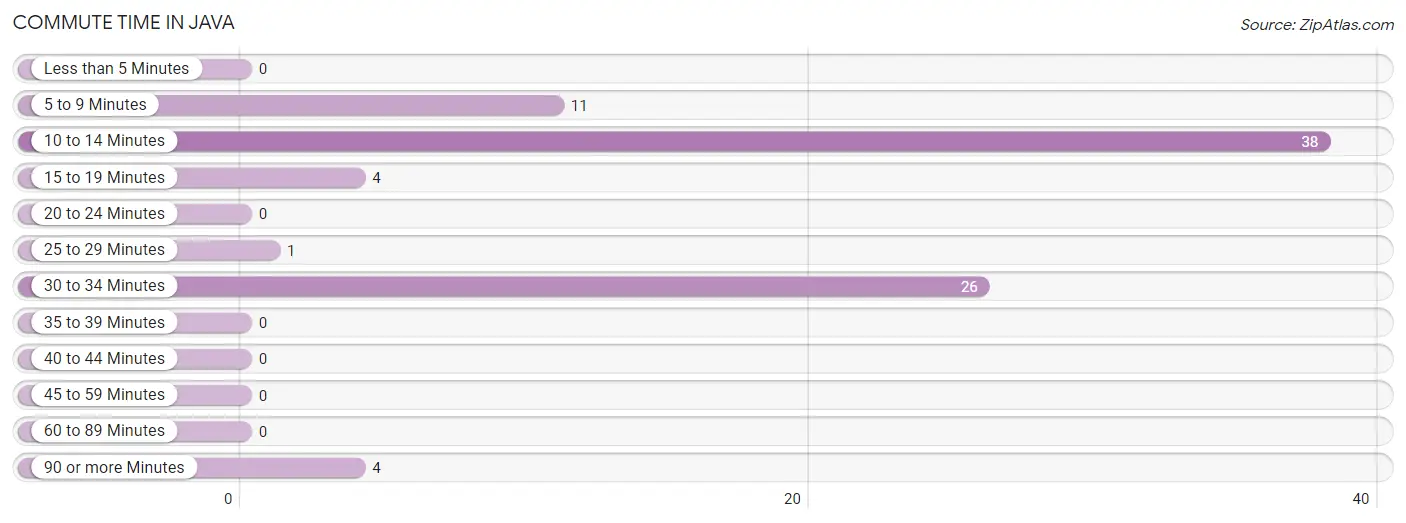
| Commute Time | # Commuters | % Commuters |
| Less than 5 Minutes | 0 | 0.0% |
| 5 to 9 Minutes | 11 | 13.1% |
| 10 to 14 Minutes | 38 | 45.2% |
| 15 to 19 Minutes | 4 | 4.8% |
| 20 to 24 Minutes | 0 | 0.0% |
| 25 to 29 Minutes | 1 | 1.2% |
| 30 to 34 Minutes | 26 | 30.9% |
| 35 to 39 Minutes | 0 | 0.0% |
| 40 to 44 Minutes | 0 | 0.0% |
| 45 to 59 Minutes | 0 | 0.0% |
| 60 to 89 Minutes | 0 | 0.0% |
| 90 or more Minutes | 4 | 4.8% |
Commute Time by Sex in Java
The most common commute times in Java are 10 to 14 minutes (12 commuters, 40.0%) for males and 10 to 14 minutes (26 commuters, 48.1%) for females.
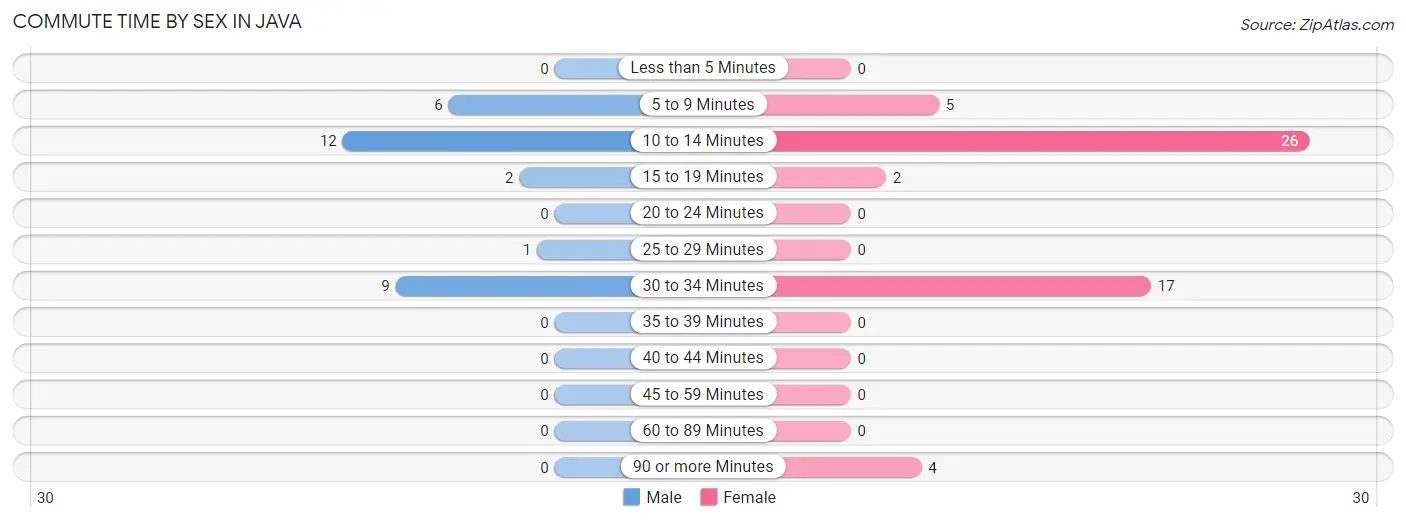
| Commute Time | Male | Female |
| Less than 5 Minutes | 0 (0.0%) | 0 (0.0%) |
| 5 to 9 Minutes | 6 (20.0%) | 5 (9.3%) |
| 10 to 14 Minutes | 12 (40.0%) | 26 (48.1%) |
| 15 to 19 Minutes | 2 (6.7%) | 2 (3.7%) |
| 20 to 24 Minutes | 0 (0.0%) | 0 (0.0%) |
| 25 to 29 Minutes | 1 (3.3%) | 0 (0.0%) |
| 30 to 34 Minutes | 9 (30.0%) | 17 (31.5%) |
| 35 to 39 Minutes | 0 (0.0%) | 0 (0.0%) |
| 40 to 44 Minutes | 0 (0.0%) | 0 (0.0%) |
| 45 to 59 Minutes | 0 (0.0%) | 0 (0.0%) |
| 60 to 89 Minutes | 0 (0.0%) | 0 (0.0%) |
| 90 or more Minutes | 0 (0.0%) | 4 (7.4%) |
Time of Departure to Work by Sex in Java
The most frequent times of departure to work in Java are 7:30 AM to 7:59 AM (16, 53.3%) for males and 7:30 AM to 7:59 AM (34, 63.0%) for females.
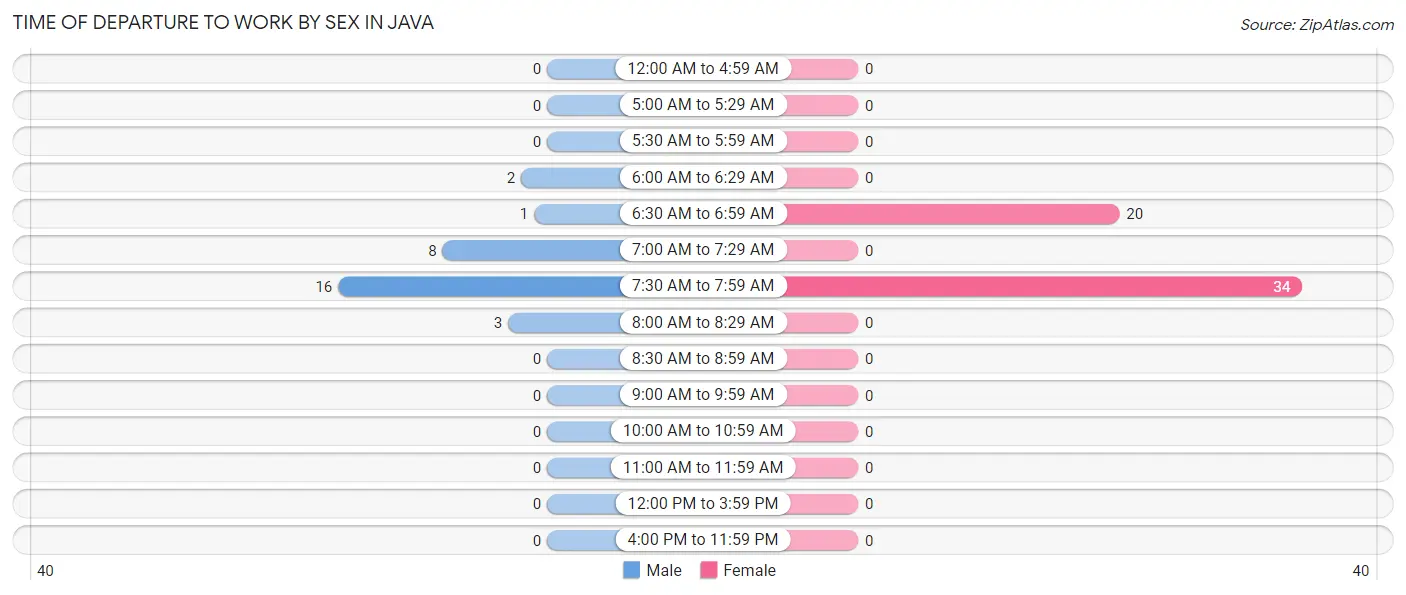
| Time of Departure | Male | Female |
| 12:00 AM to 4:59 AM | 0 (0.0%) | 0 (0.0%) |
| 5:00 AM to 5:29 AM | 0 (0.0%) | 0 (0.0%) |
| 5:30 AM to 5:59 AM | 0 (0.0%) | 0 (0.0%) |
| 6:00 AM to 6:29 AM | 2 (6.7%) | 0 (0.0%) |
| 6:30 AM to 6:59 AM | 1 (3.3%) | 20 (37.0%) |
| 7:00 AM to 7:29 AM | 8 (26.7%) | 0 (0.0%) |
| 7:30 AM to 7:59 AM | 16 (53.3%) | 34 (63.0%) |
| 8:00 AM to 8:29 AM | 3 (10.0%) | 0 (0.0%) |
| 8:30 AM to 8:59 AM | 0 (0.0%) | 0 (0.0%) |
| 9:00 AM to 9:59 AM | 0 (0.0%) | 0 (0.0%) |
| 10:00 AM to 10:59 AM | 0 (0.0%) | 0 (0.0%) |
| 11:00 AM to 11:59 AM | 0 (0.0%) | 0 (0.0%) |
| 12:00 PM to 3:59 PM | 0 (0.0%) | 0 (0.0%) |
| 4:00 PM to 11:59 PM | 0 (0.0%) | 0 (0.0%) |
| Total | 30 (100.0%) | 54 (100.0%) |
Housing Occupancy in Java
Occupancy by Ownership in Java
Of the total 72 dwellings in Java, owner-occupied units account for 60 (83.3%), while renter-occupied units make up 12 (16.7%).
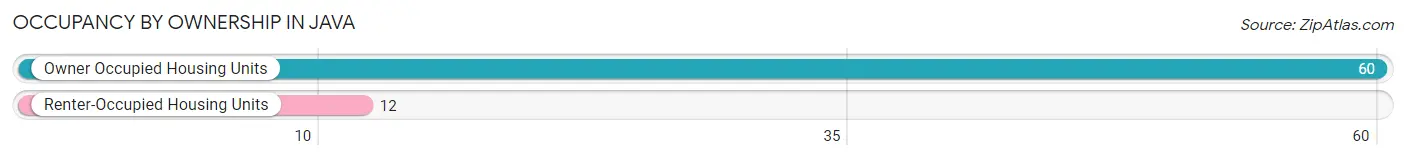
| Occupancy | # Housing Units | % Housing Units |
| Owner Occupied Housing Units | 60 | 83.3% |
| Renter-Occupied Housing Units | 12 | 16.7% |
| Total Occupied Housing Units | 72 | 100.0% |
Occupancy by Household Size in Java
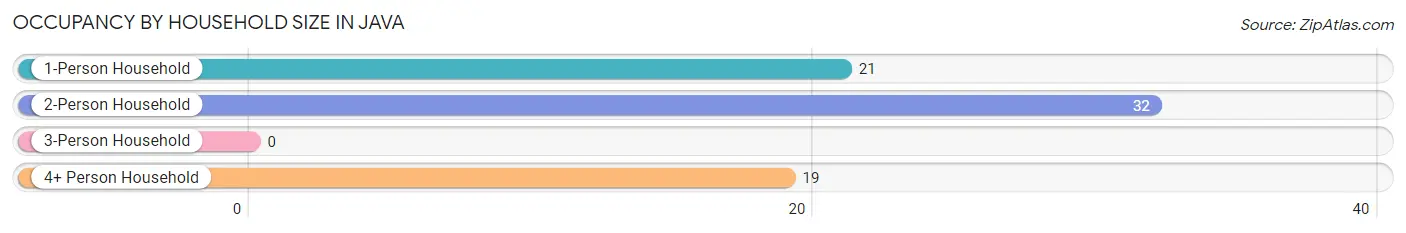
| Household Size | # Housing Units | % Housing Units |
| 1-Person Household | 21 | 29.2% |
| 2-Person Household | 32 | 44.4% |
| 3-Person Household | 0 | 0.0% |
| 4+ Person Household | 19 | 26.4% |
| Total Housing Units | 72 | 100.0% |
Occupancy by Ownership by Household Size in Java
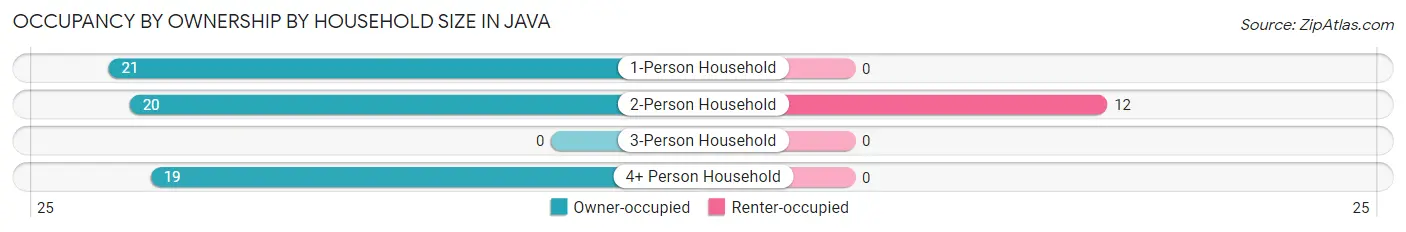
| Household Size | Owner-occupied | Renter-occupied |
| 1-Person Household | 21 (100.0%) | 0 (0.0%) |
| 2-Person Household | 20 (62.5%) | 12 (37.5%) |
| 3-Person Household | 0 (0.0%) | 0 (0.0%) |
| 4+ Person Household | 19 (100.0%) | 0 (0.0%) |
| Total Housing Units | 60 (83.3%) | 12 (16.7%) |
Occupancy by Educational Attainment in Java
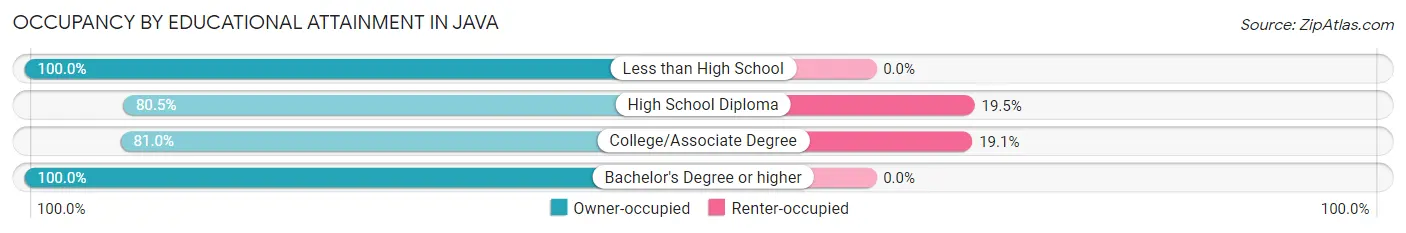
| Household Size | Owner-occupied | Renter-occupied |
| Less than High School | 1 (100.0%) | 0 (0.0%) |
| High School Diploma | 33 (80.5%) | 8 (19.5%) |
| College/Associate Degree | 17 (80.9%) | 4 (19.1%) |
| Bachelor's Degree or higher | 9 (100.0%) | 0 (0.0%) |
Occupancy by Age of Householder in Java
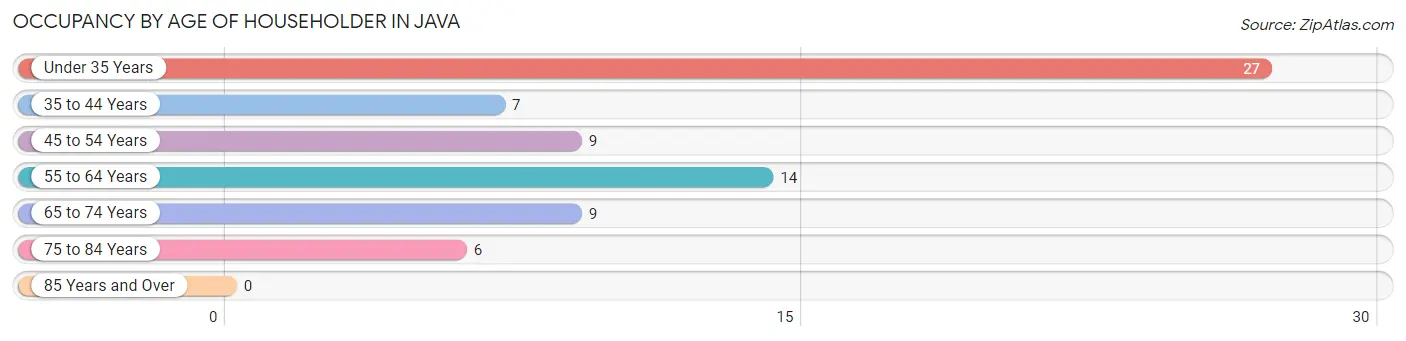
| Age Bracket | # Households | % Households |
| Under 35 Years | 27 | 37.5% |
| 35 to 44 Years | 7 | 9.7% |
| 45 to 54 Years | 9 | 12.5% |
| 55 to 64 Years | 14 | 19.4% |
| 65 to 74 Years | 9 | 12.5% |
| 75 to 84 Years | 6 | 8.3% |
| 85 Years and Over | 0 | 0.0% |
| Total | 72 | 100.0% |
Housing Finances in Java
Median Income by Occupancy in Java
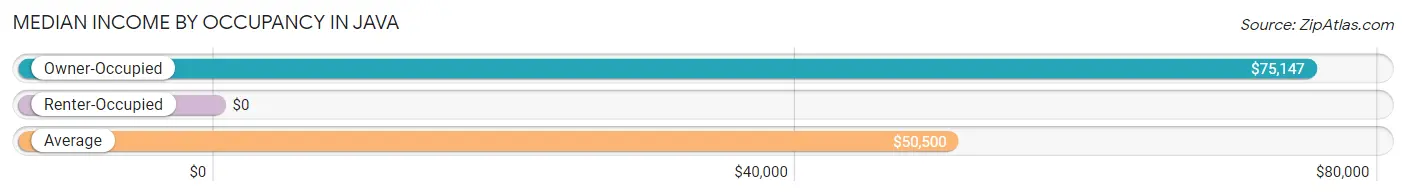
| Occupancy Type | # Households | Median Income |
| Owner-Occupied | 60 (83.3%) | $75,147 |
| Renter-Occupied | 12 (16.7%) | $0 |
| Average | 72 (100.0%) | $50,500 |
Occupancy by Householder Income Bracket in Java
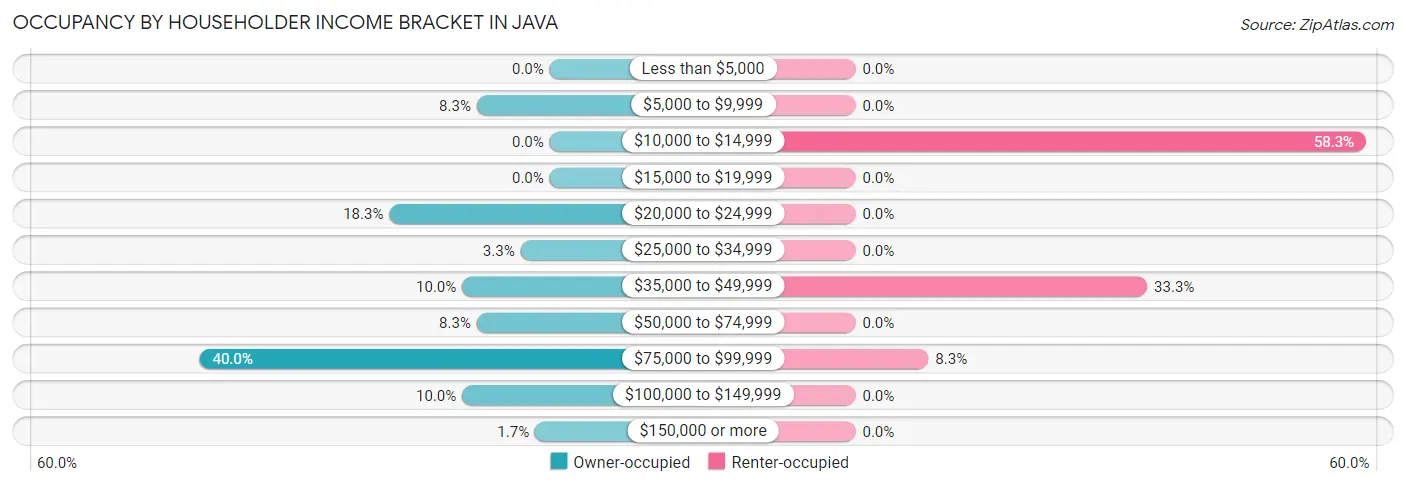
| Income Bracket | Owner-occupied | Renter-occupied |
| Less than $5,000 | 0 (0.0%) | 0 (0.0%) |
| $5,000 to $9,999 | 5 (8.3%) | 0 (0.0%) |
| $10,000 to $14,999 | 0 (0.0%) | 7 (58.3%) |
| $15,000 to $19,999 | 0 (0.0%) | 0 (0.0%) |
| $20,000 to $24,999 | 11 (18.3%) | 0 (0.0%) |
| $25,000 to $34,999 | 2 (3.3%) | 0 (0.0%) |
| $35,000 to $49,999 | 6 (10.0%) | 4 (33.3%) |
| $50,000 to $74,999 | 5 (8.3%) | 0 (0.0%) |
| $75,000 to $99,999 | 24 (40.0%) | 1 (8.3%) |
| $100,000 to $149,999 | 6 (10.0%) | 0 (0.0%) |
| $150,000 or more | 1 (1.7%) | 0 (0.0%) |
| Total | 60 (100.0%) | 12 (100.0%) |
Monthly Housing Cost Tiers in Java
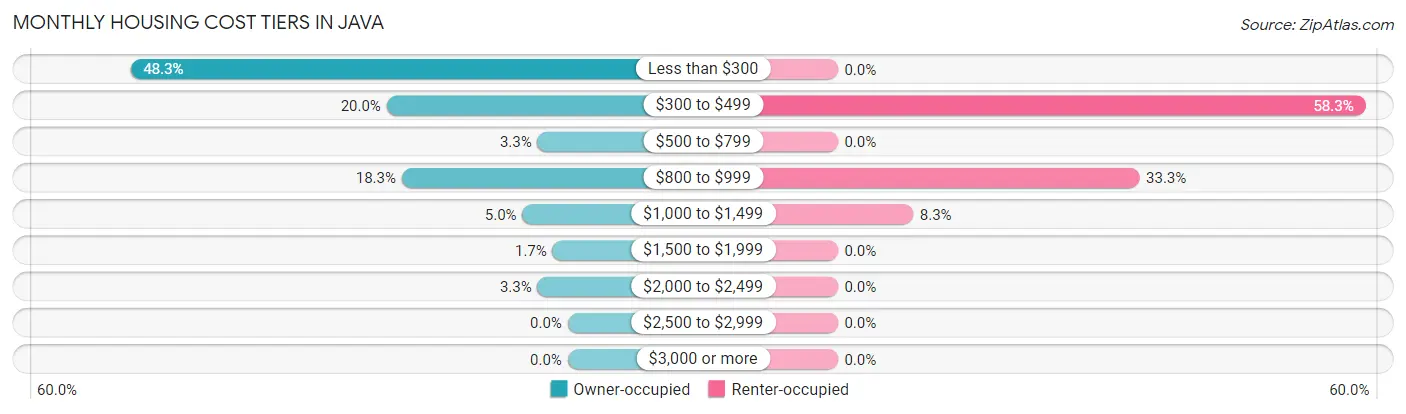
| Monthly Cost | Owner-occupied | Renter-occupied |
| Less than $300 | 29 (48.3%) | 0 (0.0%) |
| $300 to $499 | 12 (20.0%) | 7 (58.3%) |
| $500 to $799 | 2 (3.3%) | 0 (0.0%) |
| $800 to $999 | 11 (18.3%) | 4 (33.3%) |
| $1,000 to $1,499 | 3 (5.0%) | 1 (8.3%) |
| $1,500 to $1,999 | 1 (1.7%) | 0 (0.0%) |
| $2,000 to $2,499 | 2 (3.3%) | 0 (0.0%) |
| $2,500 to $2,999 | 0 (0.0%) | 0 (0.0%) |
| $3,000 or more | 0 (0.0%) | 0 (0.0%) |
| Total | 60 (100.0%) | 12 (100.0%) |
Physical Housing Characteristics in Java
Housing Structures in Java
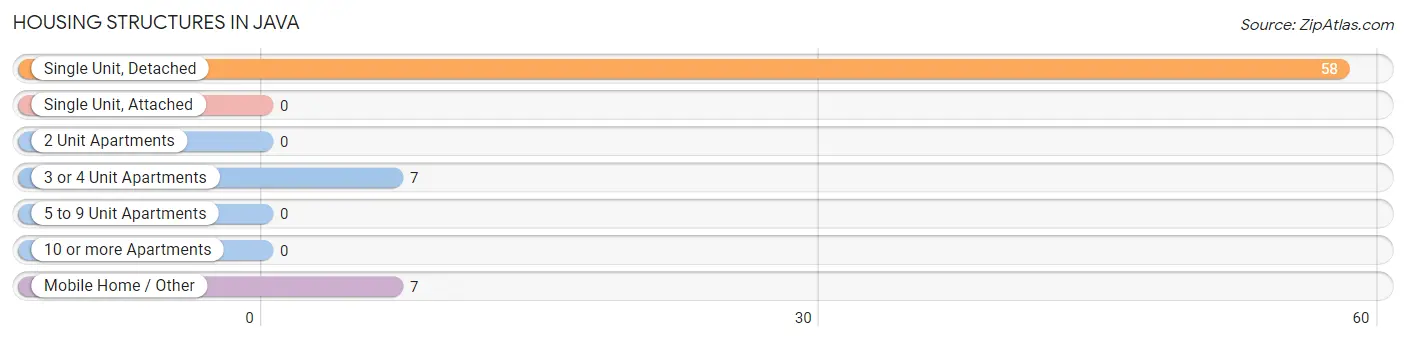
| Structure Type | # Housing Units | % Housing Units |
| Single Unit, Detached | 58 | 80.6% |
| Single Unit, Attached | 0 | 0.0% |
| 2 Unit Apartments | 0 | 0.0% |
| 3 or 4 Unit Apartments | 7 | 9.7% |
| 5 to 9 Unit Apartments | 0 | 0.0% |
| 10 or more Apartments | 0 | 0.0% |
| Mobile Home / Other | 7 | 9.7% |
| Total | 72 | 100.0% |
Housing Structures by Occupancy in Java
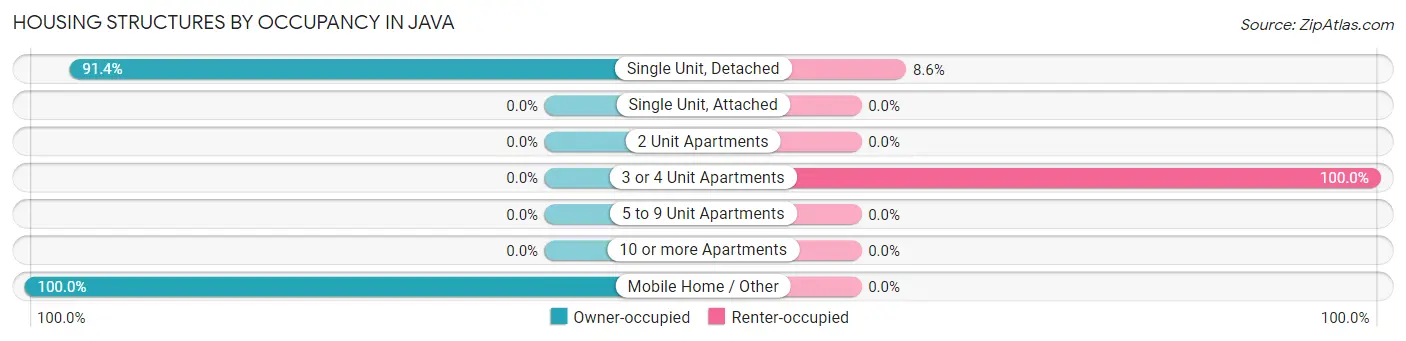
| Structure Type | Owner-occupied | Renter-occupied |
| Single Unit, Detached | 53 (91.4%) | 5 (8.6%) |
| Single Unit, Attached | 0 (0.0%) | 0 (0.0%) |
| 2 Unit Apartments | 0 (0.0%) | 0 (0.0%) |
| 3 or 4 Unit Apartments | 0 (0.0%) | 7 (100.0%) |
| 5 to 9 Unit Apartments | 0 (0.0%) | 0 (0.0%) |
| 10 or more Apartments | 0 (0.0%) | 0 (0.0%) |
| Mobile Home / Other | 7 (100.0%) | 0 (0.0%) |
| Total | 60 (83.3%) | 12 (16.7%) |
Housing Structures by Number of Rooms in Java
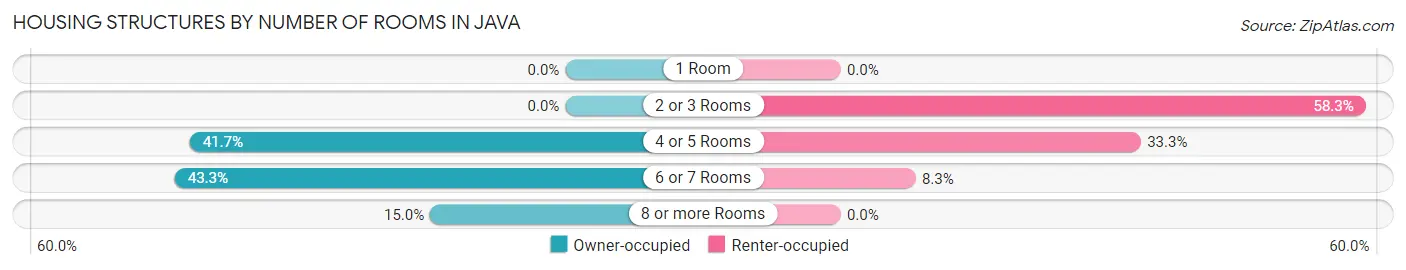
| Number of Rooms | Owner-occupied | Renter-occupied |
| 1 Room | 0 (0.0%) | 0 (0.0%) |
| 2 or 3 Rooms | 0 (0.0%) | 7 (58.3%) |
| 4 or 5 Rooms | 25 (41.7%) | 4 (33.3%) |
| 6 or 7 Rooms | 26 (43.3%) | 1 (8.3%) |
| 8 or more Rooms | 9 (15.0%) | 0 (0.0%) |
| Total | 60 (100.0%) | 12 (100.0%) |
Housing Structure by Heating Type in Java
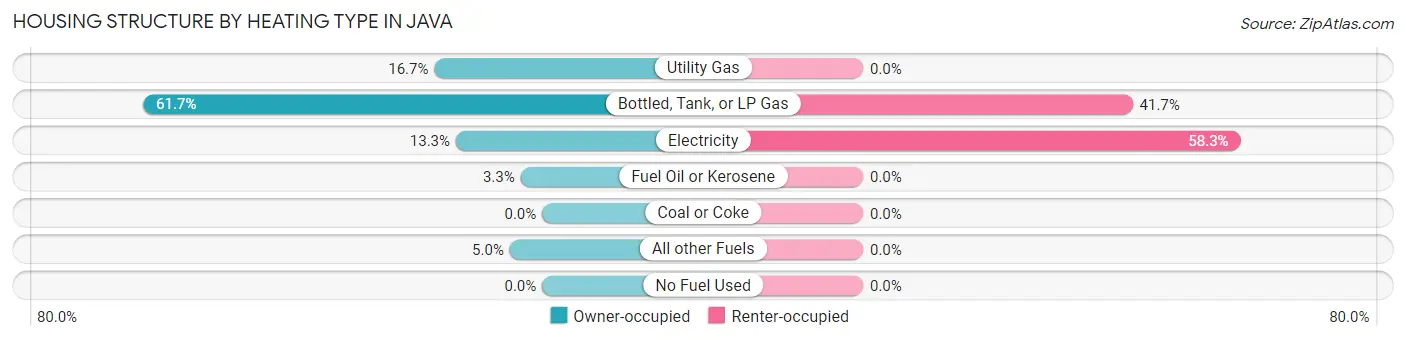
| Heating Type | Owner-occupied | Renter-occupied |
| Utility Gas | 10 (16.7%) | 0 (0.0%) |
| Bottled, Tank, or LP Gas | 37 (61.7%) | 5 (41.7%) |
| Electricity | 8 (13.3%) | 7 (58.3%) |
| Fuel Oil or Kerosene | 2 (3.3%) | 0 (0.0%) |
| Coal or Coke | 0 (0.0%) | 0 (0.0%) |
| All other Fuels | 3 (5.0%) | 0 (0.0%) |
| No Fuel Used | 0 (0.0%) | 0 (0.0%) |
| Total | 60 (100.0%) | 12 (100.0%) |
Household Vehicle Usage in Java
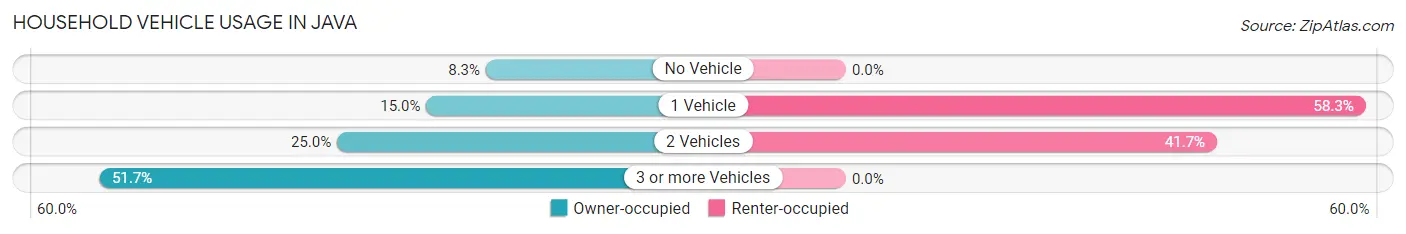
| Vehicles per Household | Owner-occupied | Renter-occupied |
| No Vehicle | 5 (8.3%) | 0 (0.0%) |
| 1 Vehicle | 9 (15.0%) | 7 (58.3%) |
| 2 Vehicles | 15 (25.0%) | 5 (41.7%) |
| 3 or more Vehicles | 31 (51.7%) | 0 (0.0%) |
| Total | 60 (100.0%) | 12 (100.0%) |
Real Estate & Mortgages in Java
Real Estate and Mortgage Overview in Java
| Characteristic | Without Mortgage | With Mortgage |
| Housing Units | 45 | 15 |
| Median Property Value | $14,200 | $62,500 |
| Median Household Income | $75,368 | $1 |
| Monthly Housing Costs | - | - |
| Real Estate Taxes | $379 | $0 |
Property Value by Mortgage Status in Java
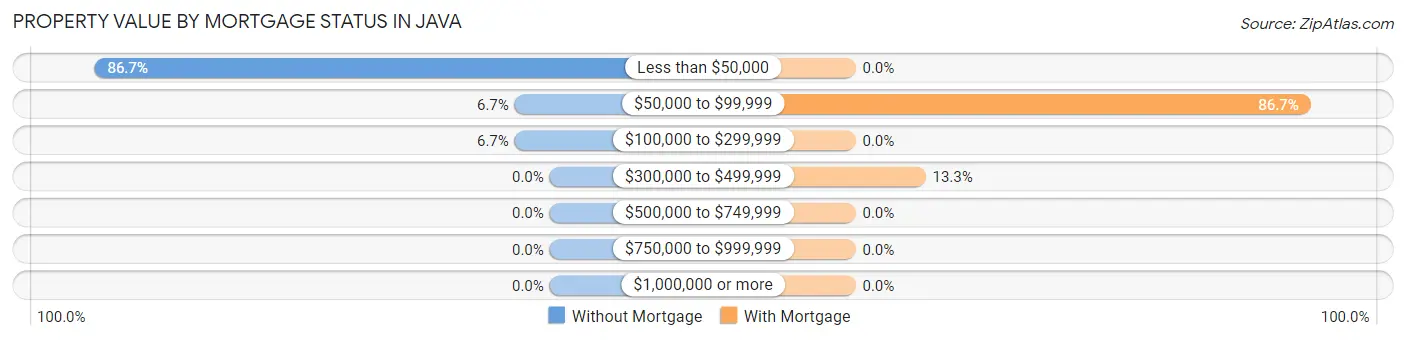
| Property Value | Without Mortgage | With Mortgage |
| Less than $50,000 | 39 (86.7%) | 0 (0.0%) |
| $50,000 to $99,999 | 3 (6.7%) | 13 (86.7%) |
| $100,000 to $299,999 | 3 (6.7%) | 0 (0.0%) |
| $300,000 to $499,999 | 0 (0.0%) | 2 (13.3%) |
| $500,000 to $749,999 | 0 (0.0%) | 0 (0.0%) |
| $750,000 to $999,999 | 0 (0.0%) | 0 (0.0%) |
| $1,000,000 or more | 0 (0.0%) | 0 (0.0%) |
| Total | 45 (100.0%) | 15 (100.0%) |
Household Income by Mortgage Status in Java
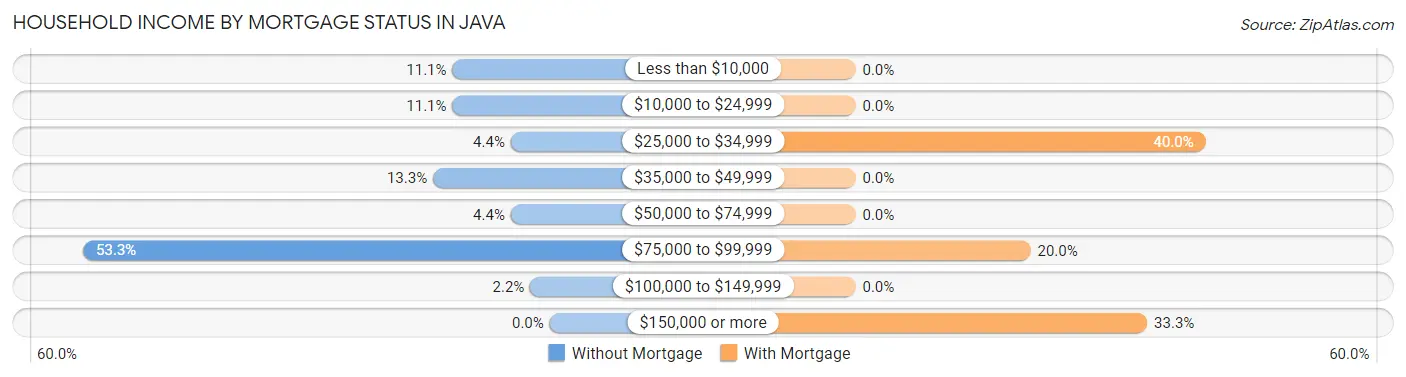
| Household Income | Without Mortgage | With Mortgage |
| Less than $10,000 | 5 (11.1%) | 0 (0.0%) |
| $10,000 to $24,999 | 5 (11.1%) | 0 (0.0%) |
| $25,000 to $34,999 | 2 (4.4%) | 6 (40.0%) |
| $35,000 to $49,999 | 6 (13.3%) | 0 (0.0%) |
| $50,000 to $74,999 | 2 (4.4%) | 0 (0.0%) |
| $75,000 to $99,999 | 24 (53.3%) | 3 (20.0%) |
| $100,000 to $149,999 | 1 (2.2%) | 0 (0.0%) |
| $150,000 or more | 0 (0.0%) | 5 (33.3%) |
| Total | 45 (100.0%) | 15 (100.0%) |
Property Value to Household Income Ratio in Java
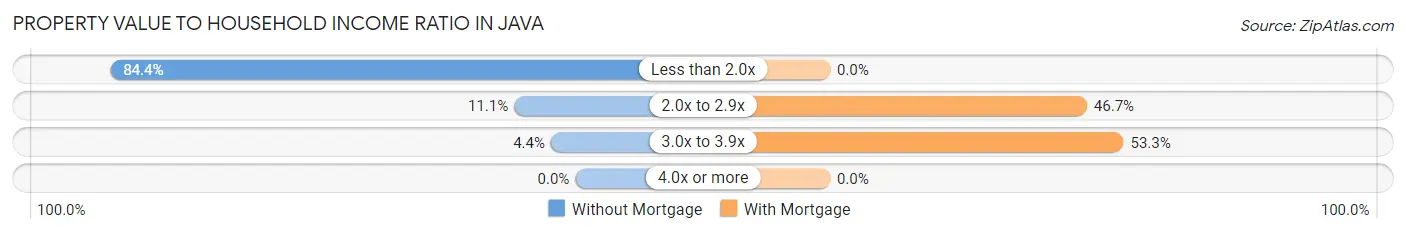
| Value-to-Income Ratio | Without Mortgage | With Mortgage |
| Less than 2.0x | 38 (84.4%) | 0 (0.0%) |
| 2.0x to 2.9x | 5 (11.1%) | 7 (46.7%) |
| 3.0x to 3.9x | 2 (4.4%) | 8 (53.3%) |
| 4.0x or more | 0 (0.0%) | 0 (0.0%) |
| Total | 45 (100.0%) | 15 (100.0%) |
Real Estate Taxes by Mortgage Status in Java
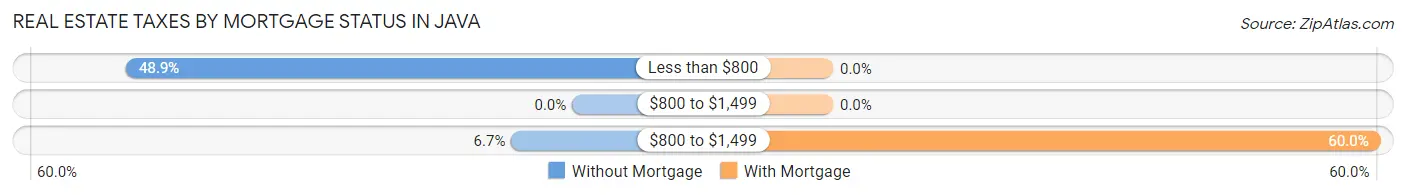
| Property Taxes | Without Mortgage | With Mortgage |
| Less than $800 | 22 (48.9%) | 0 (0.0%) |
| $800 to $1,499 | 0 (0.0%) | 0 (0.0%) |
| $800 to $1,499 | 3 (6.7%) | 9 (60.0%) |
| Total | 45 (100.0%) | 15 (100.0%) |
Health & Disability in Java
Health Insurance Coverage by Age in Java
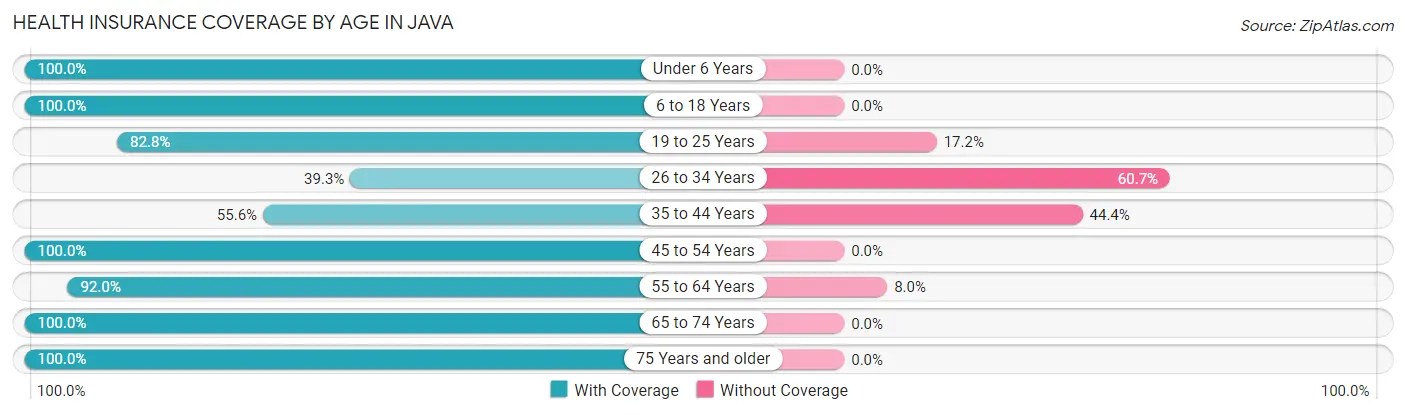
| Age Bracket | With Coverage | Without Coverage |
| Under 6 Years | 9 (100.0%) | 0 (0.0%) |
| 6 to 18 Years | 8 (100.0%) | 0 (0.0%) |
| 19 to 25 Years | 24 (82.8%) | 5 (17.2%) |
| 26 to 34 Years | 11 (39.3%) | 17 (60.7%) |
| 35 to 44 Years | 10 (55.6%) | 8 (44.4%) |
| 45 to 54 Years | 9 (100.0%) | 0 (0.0%) |
| 55 to 64 Years | 23 (92.0%) | 2 (8.0%) |
| 65 to 74 Years | 13 (100.0%) | 0 (0.0%) |
| 75 Years and older | 8 (100.0%) | 0 (0.0%) |
| Total | 115 (78.2%) | 32 (21.8%) |
Health Insurance Coverage by Citizenship Status in Java
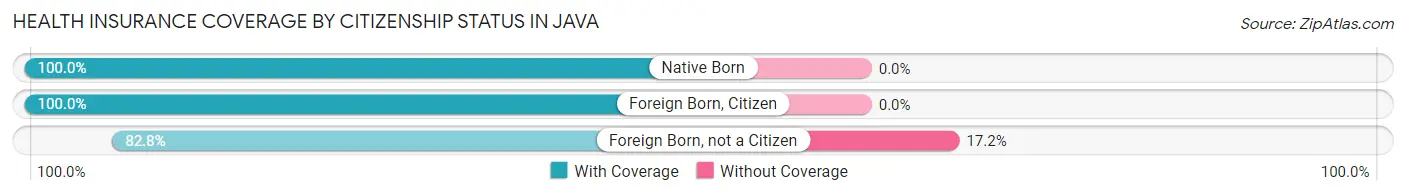
| Citizenship Status | With Coverage | Without Coverage |
| Native Born | 9 (100.0%) | 0 (0.0%) |
| Foreign Born, Citizen | 8 (100.0%) | 0 (0.0%) |
| Foreign Born, not a Citizen | 24 (82.8%) | 5 (17.2%) |
Health Insurance Coverage by Household Income in Java
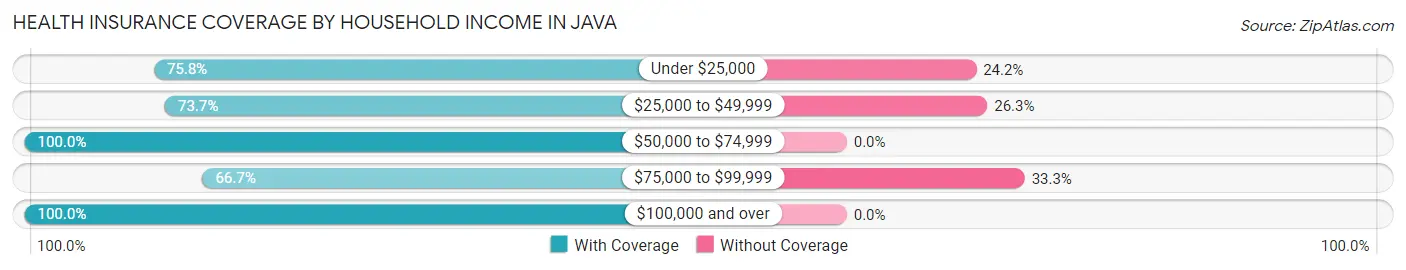
| Household Income | With Coverage | Without Coverage |
| Under $25,000 | 25 (75.8%) | 8 (24.2%) |
| $25,000 to $49,999 | 14 (73.7%) | 5 (26.3%) |
| $50,000 to $74,999 | 10 (100.0%) | 0 (0.0%) |
| $75,000 to $99,999 | 38 (66.7%) | 19 (33.3%) |
| $100,000 and over | 28 (100.0%) | 0 (0.0%) |
Public vs Private Health Insurance Coverage by Age in Java
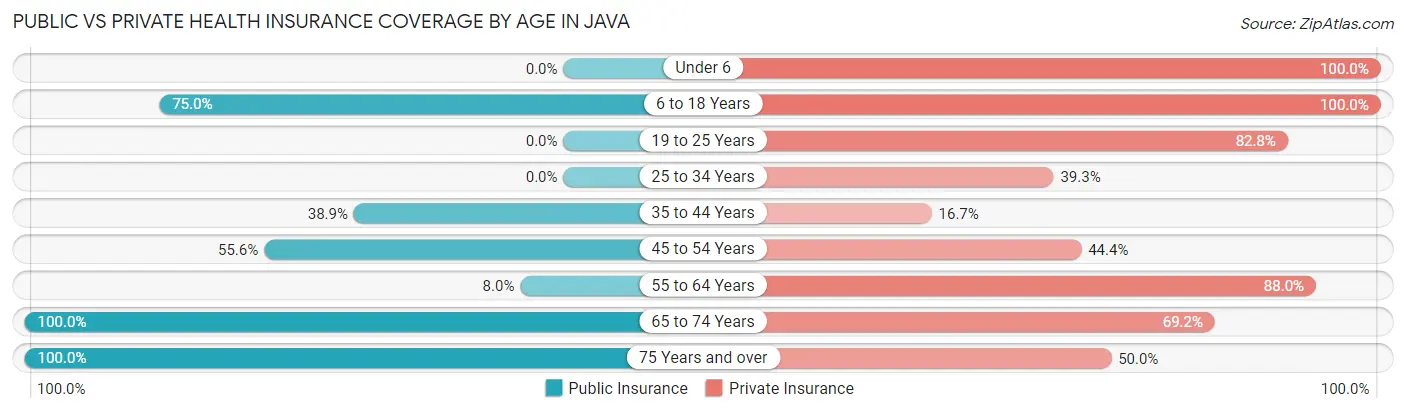
| Age Bracket | Public Insurance | Private Insurance |
| Under 6 | 0 (0.0%) | 9 (100.0%) |
| 6 to 18 Years | 6 (75.0%) | 8 (100.0%) |
| 19 to 25 Years | 0 (0.0%) | 24 (82.8%) |
| 25 to 34 Years | 0 (0.0%) | 11 (39.3%) |
| 35 to 44 Years | 7 (38.9%) | 3 (16.7%) |
| 45 to 54 Years | 5 (55.6%) | 4 (44.4%) |
| 55 to 64 Years | 2 (8.0%) | 22 (88.0%) |
| 65 to 74 Years | 13 (100.0%) | 9 (69.2%) |
| 75 Years and over | 8 (100.0%) | 4 (50.0%) |
| Total | 41 (27.9%) | 94 (63.9%) |
Disability Status by Sex by Age in Java
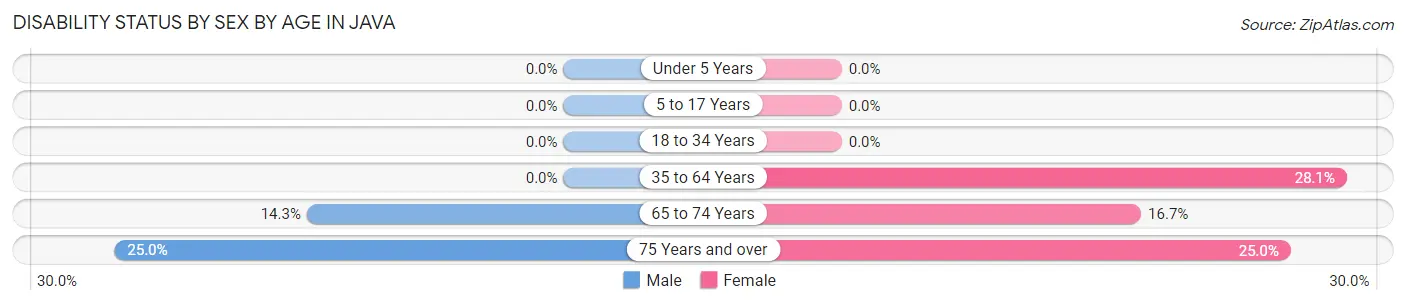
| Age Bracket | Male | Female |
| Under 5 Years | 0 (0.0%) | 0 (0.0%) |
| 5 to 17 Years | 0 (0.0%) | 0 (0.0%) |
| 18 to 34 Years | 0 (0.0%) | 0 (0.0%) |
| 35 to 64 Years | 0 (0.0%) | 9 (28.1%) |
| 65 to 74 Years | 1 (14.3%) | 1 (16.7%) |
| 75 Years and over | 1 (25.0%) | 1 (25.0%) |
Disability Class by Sex by Age in Java
Disability Class: Hearing Difficulty
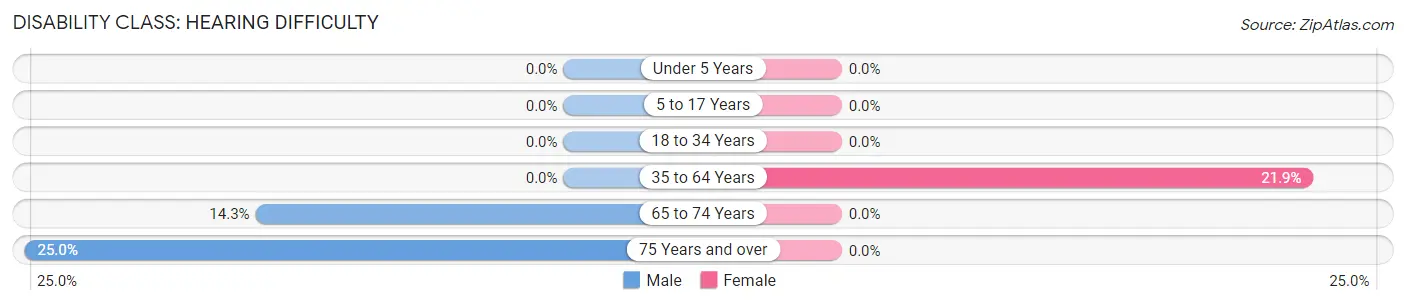
| Age Bracket | Male | Female |
| Under 5 Years | 0 (0.0%) | 0 (0.0%) |
| 5 to 17 Years | 0 (0.0%) | 0 (0.0%) |
| 18 to 34 Years | 0 (0.0%) | 0 (0.0%) |
| 35 to 64 Years | 0 (0.0%) | 7 (21.9%) |
| 65 to 74 Years | 1 (14.3%) | 0 (0.0%) |
| 75 Years and over | 1 (25.0%) | 0 (0.0%) |
Disability Class: Vision Difficulty
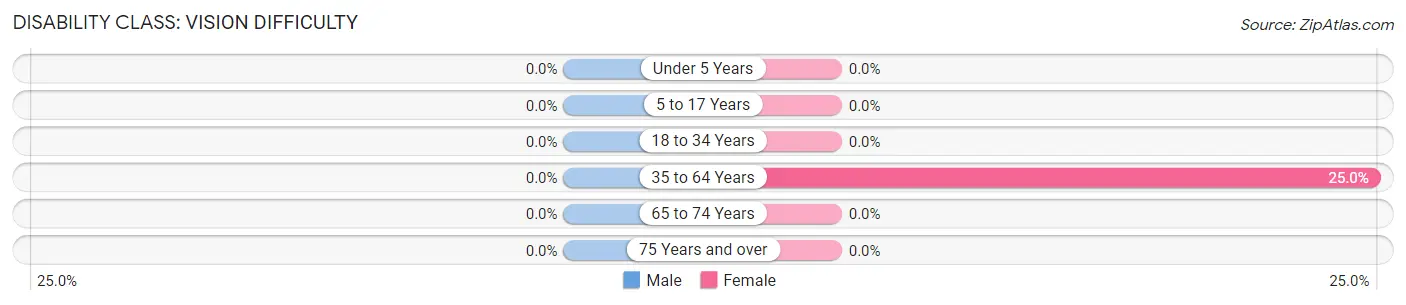
| Age Bracket | Male | Female |
| Under 5 Years | 0 (0.0%) | 0 (0.0%) |
| 5 to 17 Years | 0 (0.0%) | 0 (0.0%) |
| 18 to 34 Years | 0 (0.0%) | 0 (0.0%) |
| 35 to 64 Years | 0 (0.0%) | 8 (25.0%) |
| 65 to 74 Years | 0 (0.0%) | 0 (0.0%) |
| 75 Years and over | 0 (0.0%) | 0 (0.0%) |
Disability Class: Cognitive Difficulty
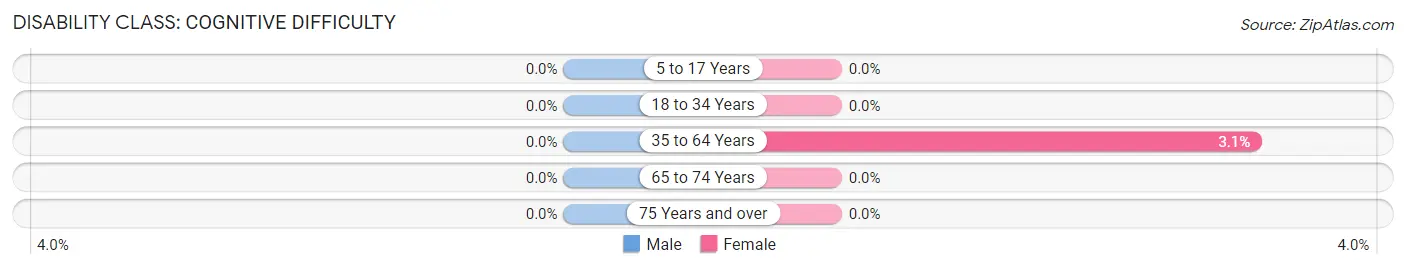
| Age Bracket | Male | Female |
| 5 to 17 Years | 0 (0.0%) | 0 (0.0%) |
| 18 to 34 Years | 0 (0.0%) | 0 (0.0%) |
| 35 to 64 Years | 0 (0.0%) | 1 (3.1%) |
| 65 to 74 Years | 0 (0.0%) | 0 (0.0%) |
| 75 Years and over | 0 (0.0%) | 0 (0.0%) |
Disability Class: Ambulatory Difficulty
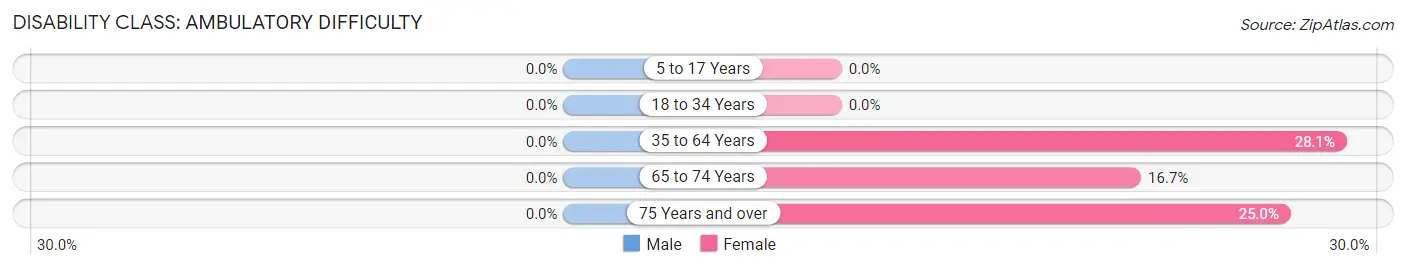
| Age Bracket | Male | Female |
| 5 to 17 Years | 0 (0.0%) | 0 (0.0%) |
| 18 to 34 Years | 0 (0.0%) | 0 (0.0%) |
| 35 to 64 Years | 0 (0.0%) | 9 (28.1%) |
| 65 to 74 Years | 0 (0.0%) | 1 (16.7%) |
| 75 Years and over | 0 (0.0%) | 1 (25.0%) |
Disability Class: Self-Care Difficulty
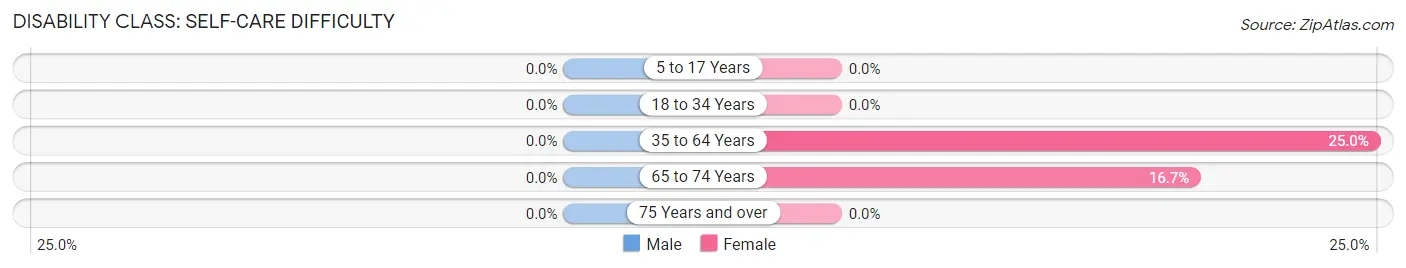
| Age Bracket | Male | Female |
| 5 to 17 Years | 0 (0.0%) | 0 (0.0%) |
| 18 to 34 Years | 0 (0.0%) | 0 (0.0%) |
| 35 to 64 Years | 0 (0.0%) | 8 (25.0%) |
| 65 to 74 Years | 0 (0.0%) | 1 (16.7%) |
| 75 Years and over | 0 (0.0%) | 0 (0.0%) |
Technology Access in Java
Computing Device Access in Java
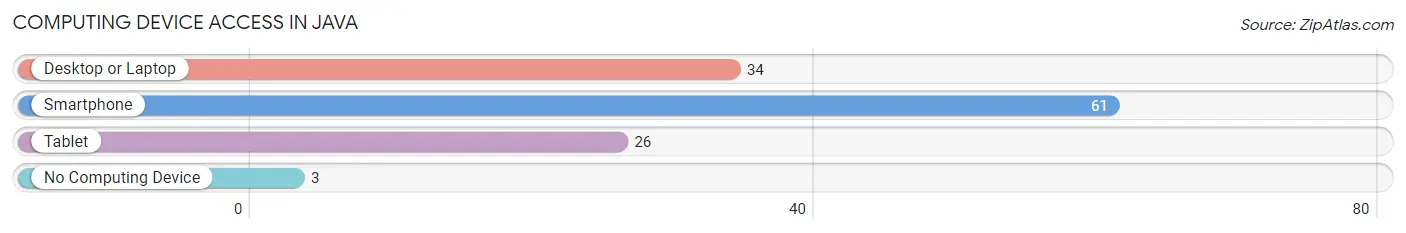
| Device Type | # Households | % Households |
| Desktop or Laptop | 34 | 47.2% |
| Smartphone | 61 | 84.7% |
| Tablet | 26 | 36.1% |
| No Computing Device | 3 | 4.2% |
| Total | 72 | 100.0% |
Internet Access in Java
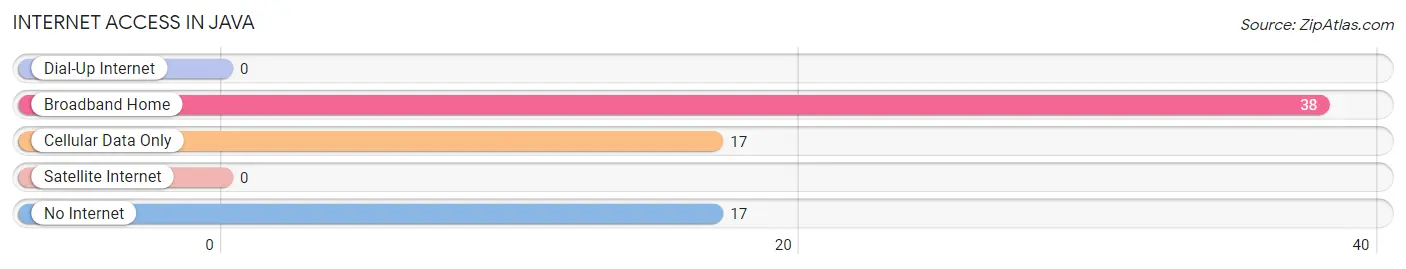
| Internet Type | # Households | % Households |
| Dial-Up Internet | 0 | 0.0% |
| Broadband Home | 38 | 52.8% |
| Cellular Data Only | 17 | 23.6% |
| Satellite Internet | 0 | 0.0% |
| No Internet | 17 | 23.6% |
| Total | 72 | 100.0% |
Java Summary
Java is an Indonesian island located in the western part of the country, between Sumatra and Bali. It is the most populous island in Indonesia and the 13th largest island in the world. Java is home to more than half of Indonesia’s population, making it the most populous island in the world.
History
The history of Java dates back to the 4th century BC, when it was inhabited by the Austronesian people. The first known kingdom on the island was the Tarumanagara, which was established in 358 AD. The kingdom was followed by the Hindu-Buddhist kingdom of Mataram, which was established in the 8th century. In the 16th century, the island was colonized by the Dutch, who established the Dutch East India Company. The Dutch East India Company ruled Java until the early 19th century, when the island was taken over by the British. The British ruled Java until 1945, when Indonesia declared its independence.
Geography
Java is located between Sumatra and Bali, and is the most populous island in Indonesia. It is approximately 1,000 km long and 140 km wide, and has an area of 132,000 km2. The island is divided into four provinces: West Java, Central Java, East Java, and Banten. The highest point on the island is Mount Semeru, which is 3,676 m high. The island is surrounded by the Java Sea to the north, the Indian Ocean to the south, and the Bali Sea to the east.
Economy
Java is the economic and industrial center of Indonesia. The island is home to the majority of the country’s manufacturing and industrial activities, and is the largest contributor to Indonesia’s GDP. The main industries on the island are manufacturing, agriculture, and tourism. The main agricultural products are rice, tea, coffee, and tobacco. The main manufacturing industries are textiles, electronics, and automotive. The main tourist destinations are Jakarta, Yogyakarta, and Bali.
Demographics
As of 2020, Java has a population of over 140 million people, making it the most populous island in the world. The majority of the population is Javanese, followed by Sundanese, Madurese, and Betawi. The majority of the population is Muslim, followed by Hindu, Christian, and Buddhist. The official language is Indonesian, although Javanese and Sundanese are also widely spoken. The literacy rate is around 95%.
Common Questions
What is Per Capita Income in Java?
Per Capita income in Java is $30,705.
What is the Median Family Income in Java?
Median Family Income in Java is $75,441.
What is the Median Household income in Java?
Median Household Income in Java is $50,500.
What is Income or Wage Gap in Java?
Income or Wage Gap in Java is 44.4%.
Women in Java earn 55.6 cents for every dollar earned by a man.
What is Inequality or Gini Index in Java?
Inequality or Gini Index in Java is 0.36.
What is the Total Population of Java?
Total Population of Java is 147.
What is the Total Male Population of Java?
Total Male Population of Java is 58.
What is the Total Female Population of Java?
Total Female Population of Java is 89.
What is the Ratio of Males per 100 Females in Java?
There are 65.17 Males per 100 Females in Java.
What is the Ratio of Females per 100 Males in Java?
There are 153.45 Females per 100 Males in Java.
What is the Median Population Age in Java?
Median Population Age in Java is 30.9 Years.
What is the Average Family Size in Java
Average Family Size in Java is 2.5 People.
What is the Average Household Size in Java
Average Household Size in Java is 2.0 People.
How Large is the Labor Force in Java?
There are 92 People in the Labor Forcein in Java.
What is the Percentage of People in the Labor Force in Java?
69.7% of People are in the Labor Force in Java.
What is the Unemployment Rate in Java?
Unemployment Rate in Java is 8.7%.