Stafford, OR Map & Demographics
Stafford Map
Stafford Overview
$86,206
PER CAPITA INCOME
$228,043
AVG FAMILY INCOME
$180,967
AVG HOUSEHOLD INCOME
0.42
INEQUALITY / GINI INDEX
1,567
TOTAL POPULATION
763
MALE POPULATION
804
FEMALE POPULATION
94.90
MALES / 100 FEMALES
105.37
FEMALES / 100 MALES
46.6
MEDIAN AGE
3.1
AVG FAMILY SIZE
2.5
AVG HOUSEHOLD SIZE
567
LABOR FORCE [ PEOPLE ]
48.8%
PERCENT IN LABOR FORCE
Income in Stafford
Income Overview in Stafford
Per Capita Income in Stafford is $86,206, while median incomes of families and households are $228,043 and $180,967 respectively.
| Characteristic | Number | Measure |
| Per Capita Income | 1,567 | $86,206 |
| Median Family Income | 442 | $228,043 |
| Mean Family Income | 442 | $264,727 |
| Median Household Income | 631 | $180,967 |
| Mean Household Income | 631 | $215,246 |
| Income Deficit | 442 | $0 |
| Wage / Income Gap (%) | 1,567 | 0.00% |
| Wage / Income Gap ($) | 1,567 | 100.00¢ per $1 |
| Gini / Inequality Index | 1,567 | 0.42 |
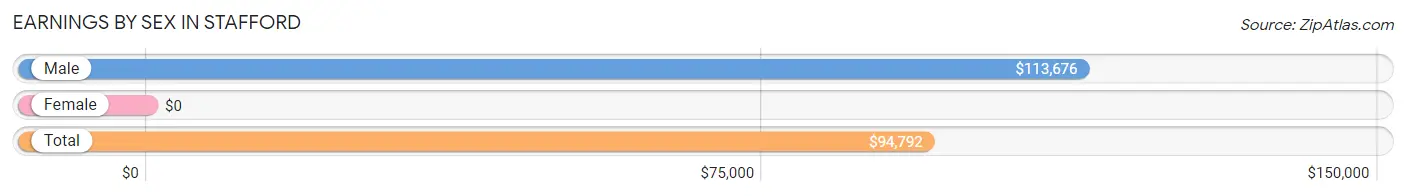
Earnings by Sex in Stafford
| Sex | Number | Average Earnings |
| Male | 392 (56.0%) | $113,676 |
| Female | 308 (44.0%) | $0 |
| Total | 700 (100.0%) | $94,792 |
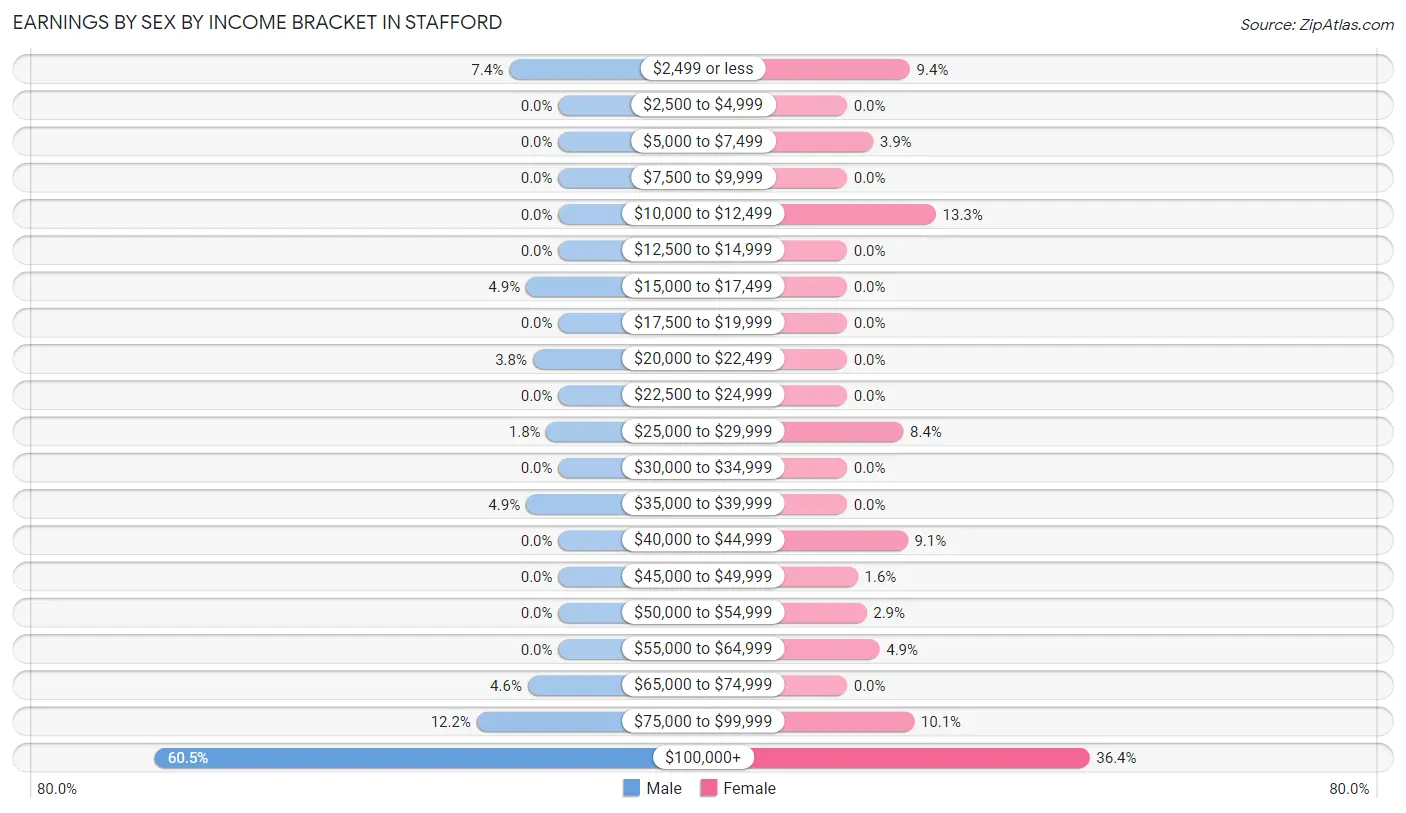
Earnings by Sex by Income Bracket in Stafford
The most common earnings brackets in Stafford are $100,000+ for men (237 | 60.5%) and $100,000+ for women (112 | 36.4%).
| Income | Male | Female |
| $2,499 or less | 29 (7.4%) | 29 (9.4%) |
| $2,500 to $4,999 | 0 (0.0%) | 0 (0.0%) |
| $5,000 to $7,499 | 0 (0.0%) | 12 (3.9%) |
| $7,500 to $9,999 | 0 (0.0%) | 0 (0.0%) |
| $10,000 to $12,499 | 0 (0.0%) | 41 (13.3%) |
| $12,500 to $14,999 | 0 (0.0%) | 0 (0.0%) |
| $15,000 to $17,499 | 19 (4.9%) | 0 (0.0%) |
| $17,500 to $19,999 | 0 (0.0%) | 0 (0.0%) |
| $20,000 to $22,499 | 15 (3.8%) | 0 (0.0%) |
| $22,500 to $24,999 | 0 (0.0%) | 0 (0.0%) |
| $25,000 to $29,999 | 7 (1.8%) | 26 (8.4%) |
| $30,000 to $34,999 | 0 (0.0%) | 0 (0.0%) |
| $35,000 to $39,999 | 19 (4.9%) | 0 (0.0%) |
| $40,000 to $44,999 | 0 (0.0%) | 28 (9.1%) |
| $45,000 to $49,999 | 0 (0.0%) | 5 (1.6%) |
| $50,000 to $54,999 | 0 (0.0%) | 9 (2.9%) |
| $55,000 to $64,999 | 0 (0.0%) | 15 (4.9%) |
| $65,000 to $74,999 | 18 (4.6%) | 0 (0.0%) |
| $75,000 to $99,999 | 48 (12.2%) | 31 (10.1%) |
| $100,000+ | 237 (60.5%) | 112 (36.4%) |
| Total | 392 (100.0%) | 308 (100.0%) |
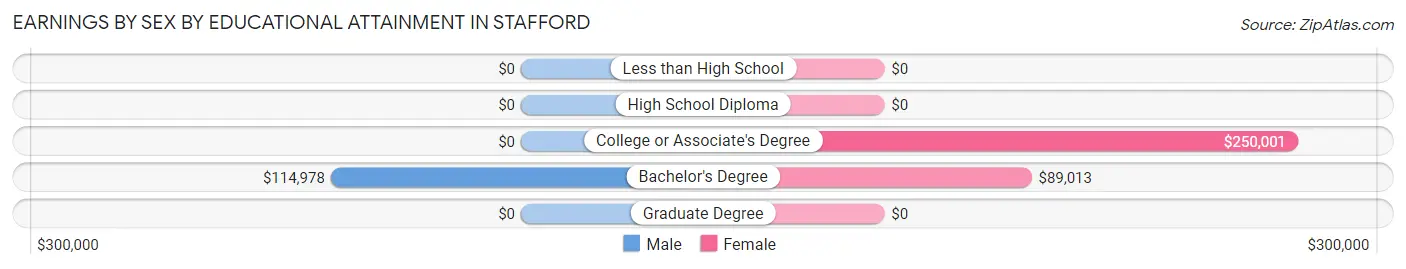
Earnings by Sex by Educational Attainment in Stafford
Average earnings in Stafford are $114,210 for men and $88,421 for women, a difference of 22.6%. Men with an educational attainment of bachelor's degree enjoy the highest average annual earnings of $114,978, while those with bachelor's degree education earn the least with $114,978. Women with an educational attainment of college or associate's degree earn the most with the average annual earnings of $250,001, while those with bachelor's degree education have the smallest earnings of $89,013.
| Educational Attainment | Male Income | Female Income |
| Less than High School | - | - |
| High School Diploma | - | - |
| College or Associate's Degree | - | - |
| Bachelor's Degree | $114,978 | $89,013 |
| Graduate Degree | - | - |
| Total | $114,210 | $88,421 |
Family Income in Stafford
Family Income Brackets in Stafford
According to the Stafford family income data, there are 264 families falling into the $200,000+ income range, which is the most common income bracket and makes up 59.7% of all families.
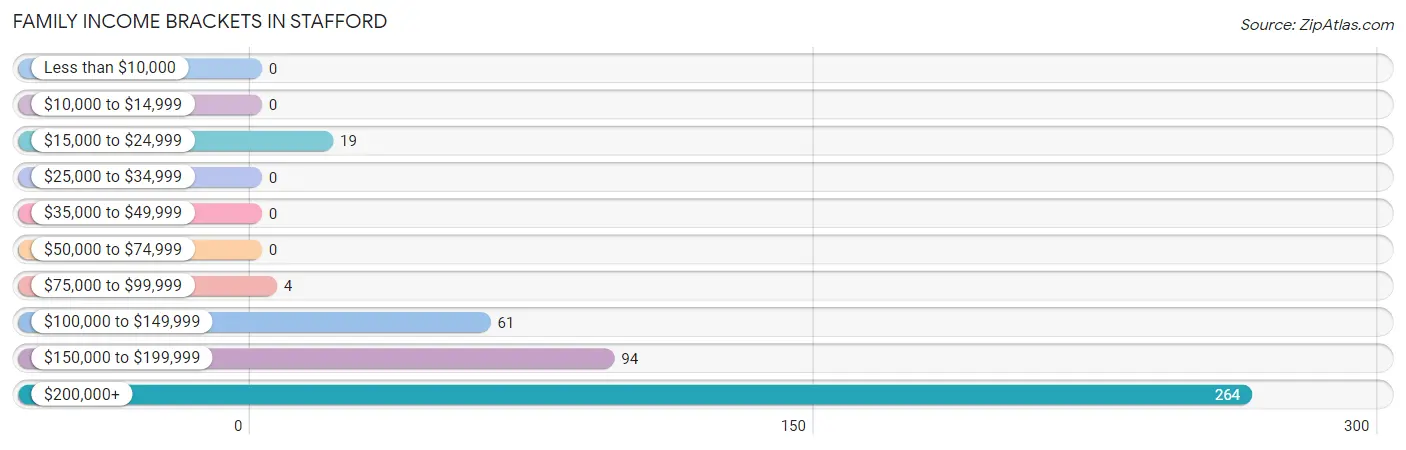
| Income Bracket | # Families | % Families |
| Less than $10,000 | 0 | 0.0% |
| $10,000 to $14,999 | 0 | 0.0% |
| $15,000 to $24,999 | 19 | 4.3% |
| $25,000 to $34,999 | 0 | 0.0% |
| $35,000 to $49,999 | 0 | 0.0% |
| $50,000 to $74,999 | 0 | 0.0% |
| $75,000 to $99,999 | 4 | 0.9% |
| $100,000 to $149,999 | 61 | 13.8% |
| $150,000 to $199,999 | 94 | 21.3% |
| $200,000+ | 264 | 59.7% |
Family Income by Famaliy Size in Stafford
3-person families (35 | 7.9%) account for the highest median family income in Stafford with $250,001 per family, while 2-person families (237 | 53.6%) have the highest median income of $102,688 per family member.
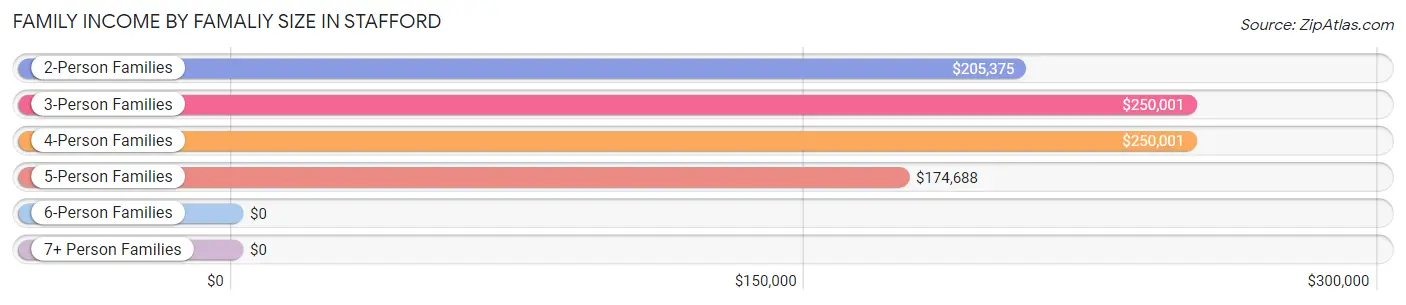
| Income Bracket | # Families | Median Income |
| 2-Person Families | 237 (53.6%) | $205,375 |
| 3-Person Families | 35 (7.9%) | $250,001 |
| 4-Person Families | 81 (18.3%) | $250,001 |
| 5-Person Families | 56 (12.7%) | $174,688 |
| 6-Person Families | 26 (5.9%) | $0 |
| 7+ Person Families | 7 (1.6%) | $0 |
| Total | 442 (100.0%) | $228,043 |
Family Income by Number of Earners in Stafford
The median family income in Stafford is $228,043, with families comprising 3+ earners (40) having the highest median family income of $250,001, while families with no earners (53) have the lowest median family income of $181,406, accounting for 9.0% and 12.0% of families, respectively.
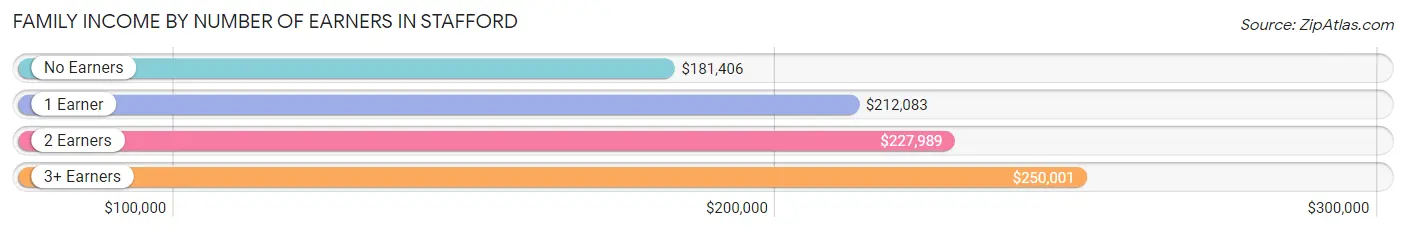
| Number of Earners | # Families | Median Income |
| No Earners | 53 (12.0%) | $181,406 |
| 1 Earner | 230 (52.0%) | $212,083 |
| 2 Earners | 119 (26.9%) | $227,989 |
| 3+ Earners | 40 (9.0%) | $250,001 |
| Total | 442 (100.0%) | $228,043 |
Household Income in Stafford
Household Income Brackets in Stafford
With 283 households falling in the category, the $200,000+ income range is the most frequent in Stafford, accounting for 44.9% of all households.
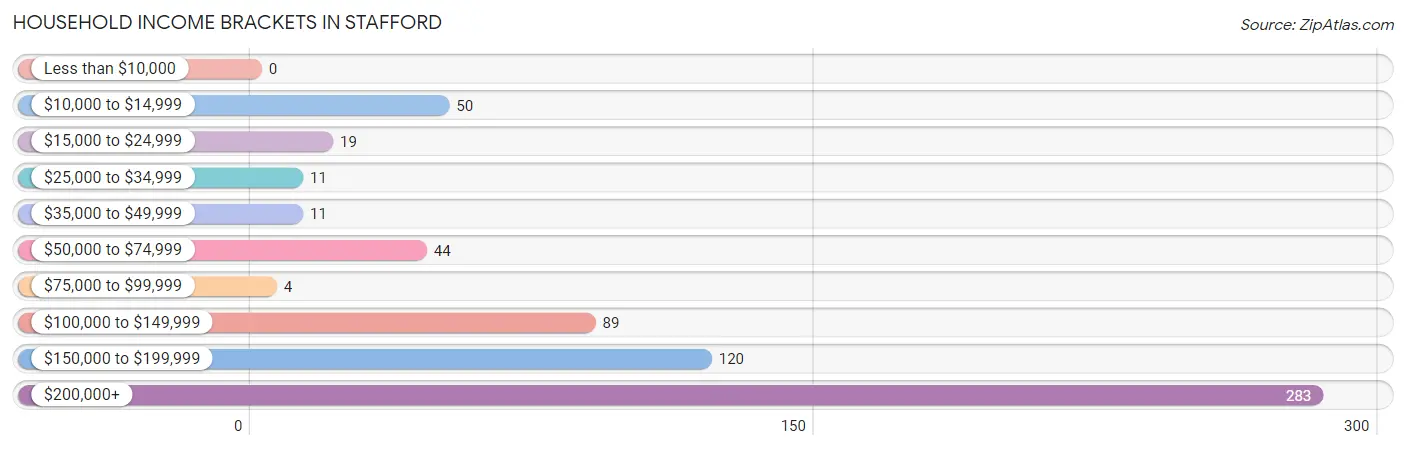
| Income Bracket | # Households | % Households |
| Less than $10,000 | 0 | 0.0% |
| $10,000 to $14,999 | 50 | 7.9% |
| $15,000 to $24,999 | 19 | 3.0% |
| $25,000 to $34,999 | 11 | 1.7% |
| $35,000 to $49,999 | 11 | 1.7% |
| $50,000 to $74,999 | 44 | 7.0% |
| $75,000 to $99,999 | 4 | 0.6% |
| $100,000 to $149,999 | 89 | 14.1% |
| $150,000 to $199,999 | 120 | 19.0% |
| $200,000+ | 283 | 44.8% |
Household Income by Householder Age in Stafford
The median household income in Stafford is $180,967, with the highest median household income of $250,001 found in the 25 to 44 years age bracket for the primary householder. A total of 96 households (15.2%) fall into this category.
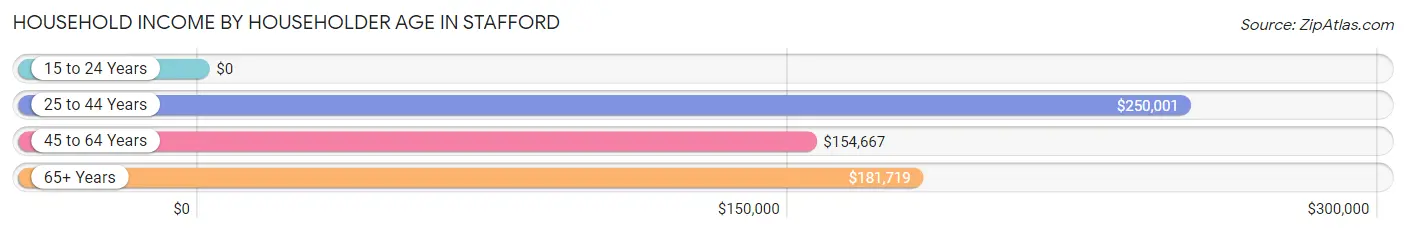
| Income Bracket | # Households | Median Income |
| 15 to 24 Years | 0 (0.0%) | $0 |
| 25 to 44 Years | 96 (15.2%) | $250,001 |
| 45 to 64 Years | 344 (54.5%) | $154,667 |
| 65+ Years | 191 (30.3%) | $181,719 |
| Total | 631 (100.0%) | $180,967 |
Poverty in Stafford
Income Below Poverty by Sex and Age in Stafford
With 7.2% poverty level for males and 3.6% for females among the residents of Stafford, 55 to 64 year old males and 55 to 64 year old females are the most vulnerable to poverty, with 55 males (32.0%) and 15 females (16.0%) in their respective age groups living below the poverty level.
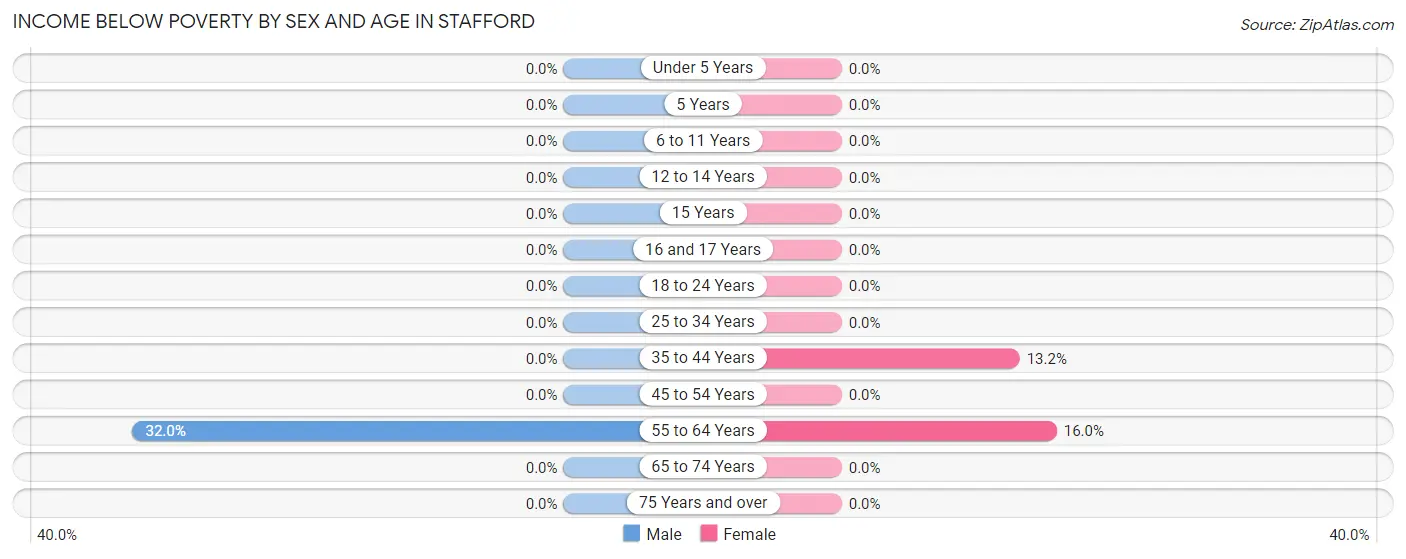
| Age Bracket | Male | Female |
| Under 5 Years | 0 (0.0%) | 0 (0.0%) |
| 5 Years | 0 (0.0%) | 0 (0.0%) |
| 6 to 11 Years | 0 (0.0%) | 0 (0.0%) |
| 12 to 14 Years | 0 (0.0%) | 0 (0.0%) |
| 15 Years | 0 (0.0%) | 0 (0.0%) |
| 16 and 17 Years | 0 (0.0%) | 0 (0.0%) |
| 18 to 24 Years | 0 (0.0%) | 0 (0.0%) |
| 25 to 34 Years | 0 (0.0%) | 0 (0.0%) |
| 35 to 44 Years | 0 (0.0%) | 14 (13.2%) |
| 45 to 54 Years | 0 (0.0%) | 0 (0.0%) |
| 55 to 64 Years | 55 (32.0%) | 15 (16.0%) |
| 65 to 74 Years | 0 (0.0%) | 0 (0.0%) |
| 75 Years and over | 0 (0.0%) | 0 (0.0%) |
| Total | 55 (7.2%) | 29 (3.6%) |
Income Above Poverty by Sex and Age in Stafford
According to the poverty statistics in Stafford, males aged under 5 years and females aged under 5 years are the age groups that are most secure financially, with 100.0% of males and 100.0% of females in these age groups living above the poverty line.
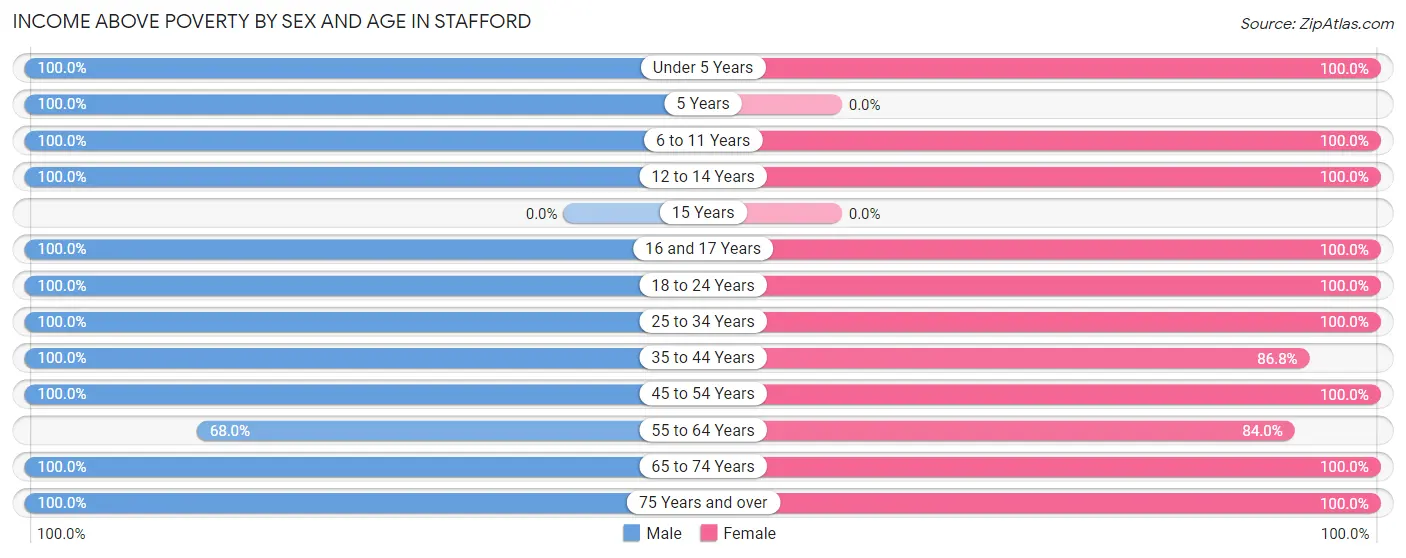
| Age Bracket | Male | Female |
| Under 5 Years | 26 (100.0%) | 12 (100.0%) |
| 5 Years | 42 (100.0%) | 0 (0.0%) |
| 6 to 11 Years | 140 (100.0%) | 65 (100.0%) |
| 12 to 14 Years | 14 (100.0%) | 107 (100.0%) |
| 15 Years | 0 (0.0%) | 0 (0.0%) |
| 16 and 17 Years | 16 (100.0%) | 41 (100.0%) |
| 18 to 24 Years | 13 (100.0%) | 26 (100.0%) |
| 25 to 34 Years | 14 (100.0%) | 23 (100.0%) |
| 35 to 44 Years | 49 (100.0%) | 92 (86.8%) |
| 45 to 54 Years | 140 (100.0%) | 123 (100.0%) |
| 55 to 64 Years | 117 (68.0%) | 79 (84.0%) |
| 65 to 74 Years | 62 (100.0%) | 114 (100.0%) |
| 75 Years and over | 75 (100.0%) | 93 (100.0%) |
| Total | 708 (92.8%) | 775 (96.4%) |
Income Below Poverty Among Married-Couple Families in Stafford
The poverty statistics for married-couple families in Stafford show that 4.4% or 19 of the total 430 families live below the poverty line. Families with no children have the highest poverty rate of 7.6%, comprising of 19 families. On the other hand, families with 1 or 2 children have the lowest poverty rate of 0.0%, which includes 0 families.
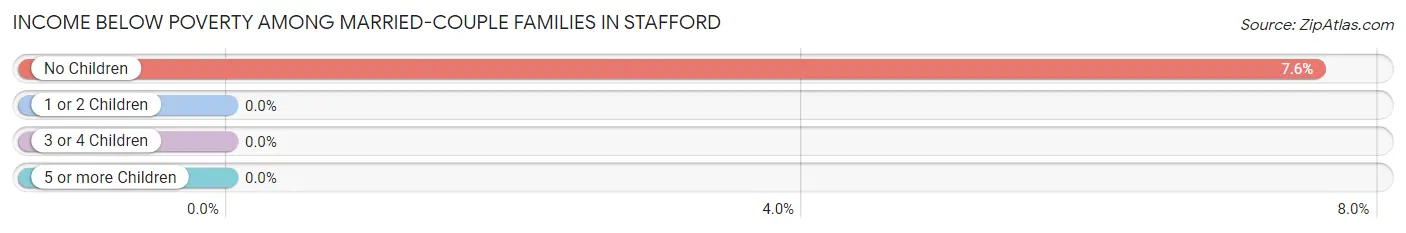
| Children | Above Poverty | Below Poverty |
| No Children | 232 (92.4%) | 19 (7.6%) |
| 1 or 2 Children | 90 (100.0%) | 0 (0.0%) |
| 3 or 4 Children | 89 (100.0%) | 0 (0.0%) |
| 5 or more Children | 0 (0.0%) | 0 (0.0%) |
| Total | 411 (95.6%) | 19 (4.4%) |
Income Below Poverty Among Single-Parent Households in Stafford
| Children | Single Father | Single Mother |
| No Children | 0 (0.0%) | 0 (0.0%) |
| 1 or 2 Children | 0 (0.0%) | 0 (0.0%) |
| 3 or 4 Children | 0 (0.0%) | 0 (0.0%) |
| 5 or more Children | 0 (0.0%) | 0 (0.0%) |
| Total | 0 (0.0%) | 0 (0.0%) |
Income Below Poverty Among Married-Couple vs Single-Parent Households in Stafford
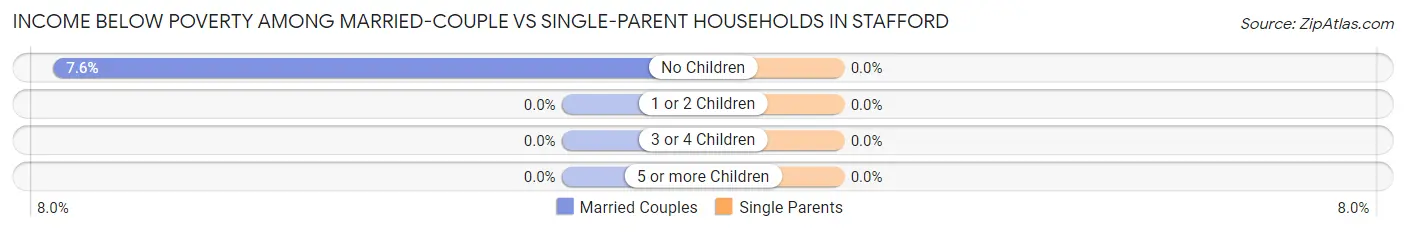
| Children | Married-Couple Families | Single-Parent Households |
| No Children | 19 (7.6%) | 0 (0.0%) |
| 1 or 2 Children | 0 (0.0%) | 0 (0.0%) |
| 3 or 4 Children | 0 (0.0%) | 0 (0.0%) |
| 5 or more Children | 0 (0.0%) | 0 (0.0%) |
| Total | 19 (4.4%) | 0 (0.0%) |
Race in Stafford
The most populous races in Stafford are White / Caucasian (1,448 | 92.4%), Two or more Races (115 | 7.3%), and Hispanic or Latino (19 | 1.2%).
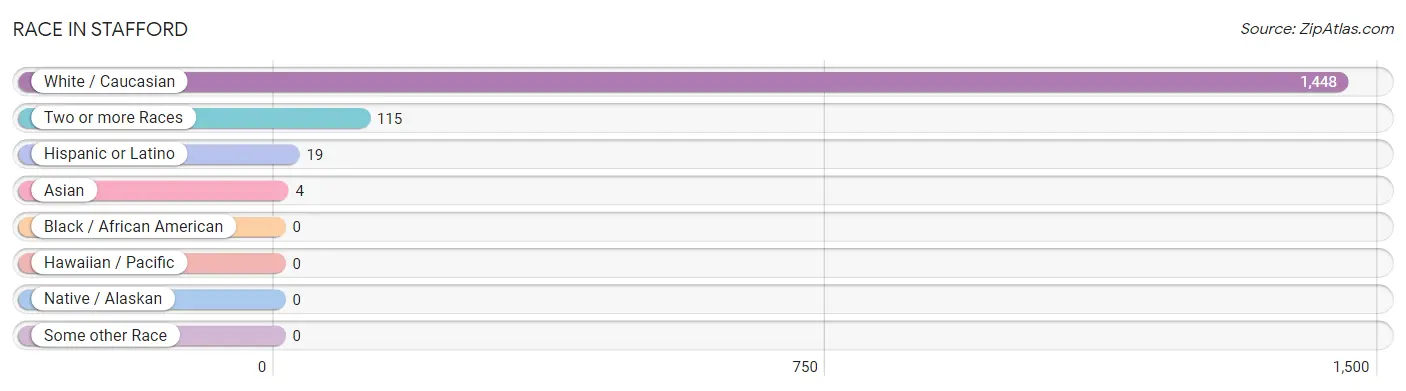
| Race | # Population | % Population |
| Asian | 4 | 0.3% |
| Black / African American | 0 | 0.0% |
| Hawaiian / Pacific | 0 | 0.0% |
| Hispanic or Latino | 19 | 1.2% |
| Native / Alaskan | 0 | 0.0% |
| White / Caucasian | 1,448 | 92.4% |
| Two or more Races | 115 | 7.3% |
| Some other Race | 0 | 0.0% |
| Total | 1,567 | 100.0% |
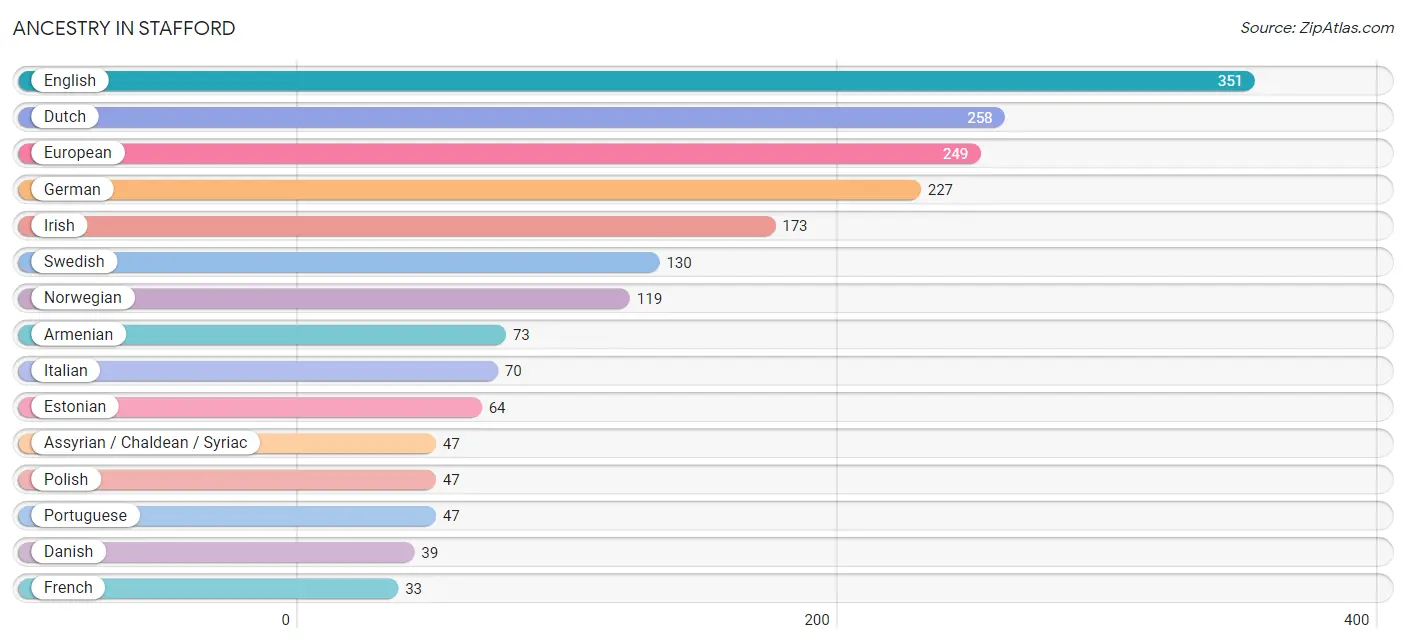
Ancestry in Stafford
The most populous ancestries reported in Stafford are English (351 | 22.4%), Dutch (258 | 16.5%), European (249 | 15.9%), German (227 | 14.5%), and Irish (173 | 11.0%), together accounting for 80.3% of all Stafford residents.
| Ancestry | # Population | % Population |
| African | 7 | 0.4% |
| American | 20 | 1.3% |
| Armenian | 73 | 4.7% |
| Assyrian / Chaldean / Syriac | 47 | 3.0% |
| Czechoslovakian | 30 | 1.9% |
| Danish | 39 | 2.5% |
| Dutch | 258 | 16.5% |
| Eastern European | 15 | 1.0% |
| English | 351 | 22.4% |
| Estonian | 64 | 4.1% |
| European | 249 | 15.9% |
| French | 33 | 2.1% |
| German | 227 | 14.5% |
| Irish | 173 | 11.0% |
| Italian | 70 | 4.5% |
| Korean | 4 | 0.3% |
| Lithuanian | 30 | 1.9% |
| Norwegian | 119 | 7.6% |
| Polish | 47 | 3.0% |
| Portuguese | 47 | 3.0% |
| Russian | 14 | 0.9% |
| Spanish | 19 | 1.2% |
| Subsaharan African | 7 | 0.4% |
| Swedish | 130 | 8.3% |
| Swiss | 6 | 0.4% |
| Ukrainian | 30 | 1.9% | View All 26 Rows |
Immigrants in Stafford

| Immigration Origin | # Population | % Population | View All 0 Rows |
Sex and Age in Stafford
Sex and Age in Stafford
The most populous age groups in Stafford are 60 to 64 Years (147 | 19.3%) for men and 10 to 14 Years (154 | 19.2%) for women.
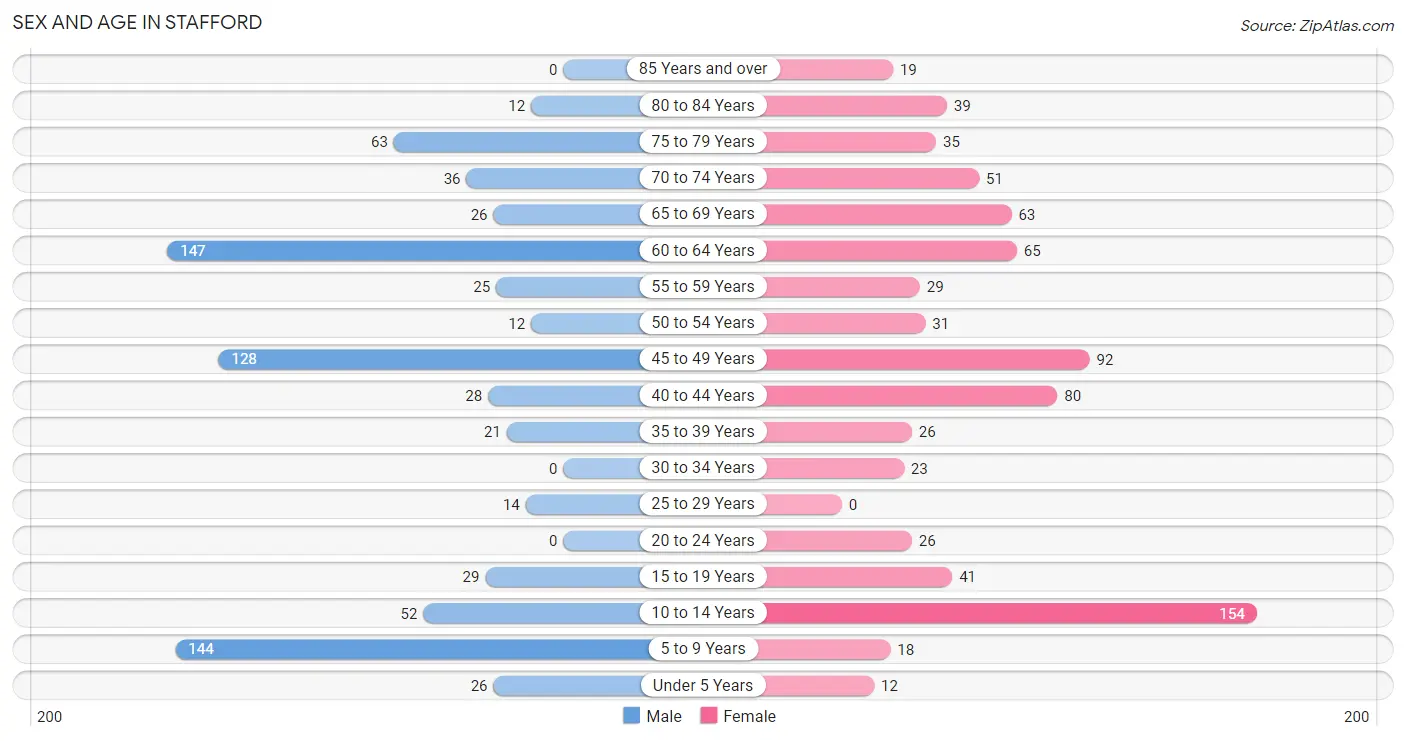
| Age Bracket | Male | Female |
| Under 5 Years | 26 (3.4%) | 12 (1.5%) |
| 5 to 9 Years | 144 (18.9%) | 18 (2.2%) |
| 10 to 14 Years | 52 (6.8%) | 154 (19.2%) |
| 15 to 19 Years | 29 (3.8%) | 41 (5.1%) |
| 20 to 24 Years | 0 (0.0%) | 26 (3.2%) |
| 25 to 29 Years | 14 (1.8%) | 0 (0.0%) |
| 30 to 34 Years | 0 (0.0%) | 23 (2.9%) |
| 35 to 39 Years | 21 (2.8%) | 26 (3.2%) |
| 40 to 44 Years | 28 (3.7%) | 80 (10.0%) |
| 45 to 49 Years | 128 (16.8%) | 92 (11.4%) |
| 50 to 54 Years | 12 (1.6%) | 31 (3.9%) |
| 55 to 59 Years | 25 (3.3%) | 29 (3.6%) |
| 60 to 64 Years | 147 (19.3%) | 65 (8.1%) |
| 65 to 69 Years | 26 (3.4%) | 63 (7.8%) |
| 70 to 74 Years | 36 (4.7%) | 51 (6.3%) |
| 75 to 79 Years | 63 (8.3%) | 35 (4.3%) |
| 80 to 84 Years | 12 (1.6%) | 39 (4.9%) |
| 85 Years and over | 0 (0.0%) | 19 (2.4%) |
| Total | 763 (100.0%) | 804 (100.0%) |
Families and Households in Stafford
Median Family Size in Stafford
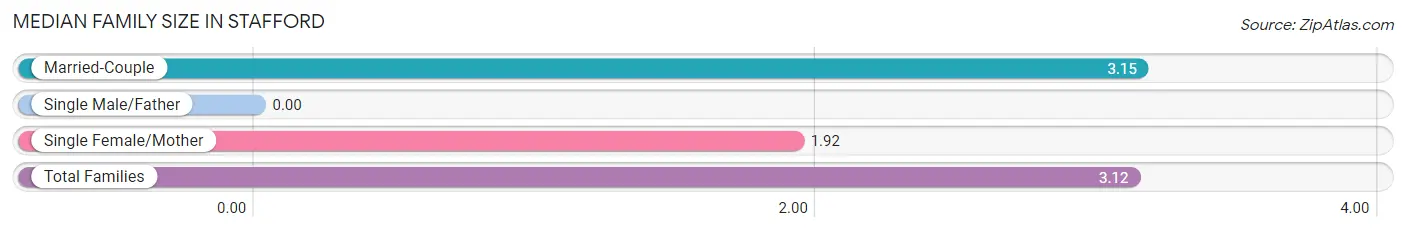
| Family Type | # Families | Family Size |
| Married-Couple | 430 (97.3%) | 3.15 |
| Single Male/Father | 0 (0.0%) | - |
| Single Female/Mother | 12 (2.7%) | 1.92 |
| Total Families | 442 (100.0%) | 3.12 |
Median Household Size in Stafford
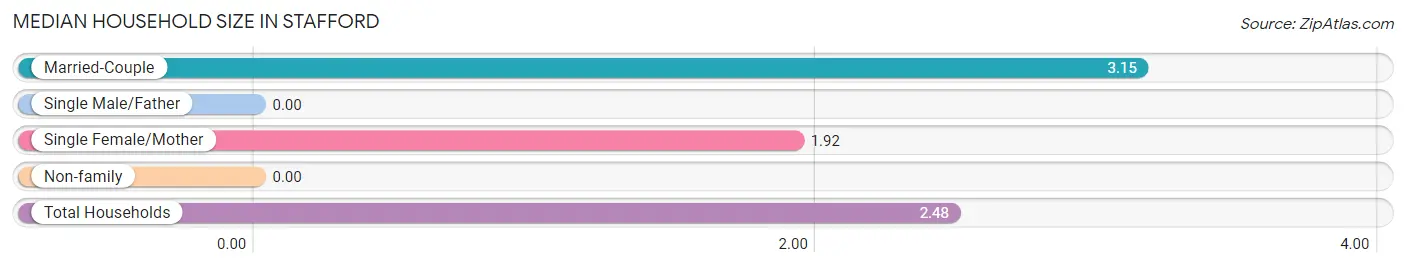
| Household Type | # Households | Household Size |
| Married-Couple | 430 (68.1%) | 3.15 |
| Single Male/Father | 0 (0.0%) | - |
| Single Female/Mother | 12 (1.9%) | 1.92 |
| Non-family | 189 (29.9%) | - |
| Total Households | 631 (100.0%) | 2.48 |
Household Size by Marriage Status in Stafford
Out of a total of 631 households in Stafford, 442 (70.1%) are family households, while 189 (29.9%) are nonfamily households. The most numerous type of family households are 2-person households, comprising 237, and the most common type of nonfamily households are 1-person households, comprising 189.
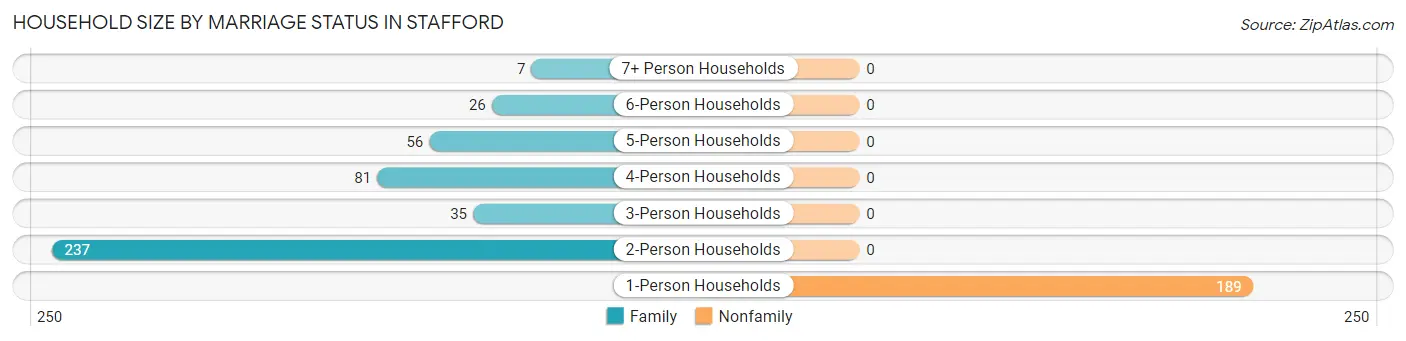
| Household Size | Family Households | Nonfamily Households |
| 1-Person Households | - | 189 (29.9%) |
| 2-Person Households | 237 (37.6%) | 0 (0.0%) |
| 3-Person Households | 35 (5.6%) | 0 (0.0%) |
| 4-Person Households | 81 (12.8%) | 0 (0.0%) |
| 5-Person Households | 56 (8.9%) | 0 (0.0%) |
| 6-Person Households | 26 (4.1%) | 0 (0.0%) |
| 7+ Person Households | 7 (1.1%) | 0 (0.0%) |
| Total | 442 (70.1%) | 189 (29.9%) |
Female Fertility in Stafford
Fertility by Age in Stafford
Average fertility rate in Stafford is 77.0 births per 1,000 women. Women in the age bracket of 20 to 34 years have the highest fertility rate with 469.0 births per 1,000 women. Women in the age bracket of 20 to 34 years acount for 100.0% of all women with births.
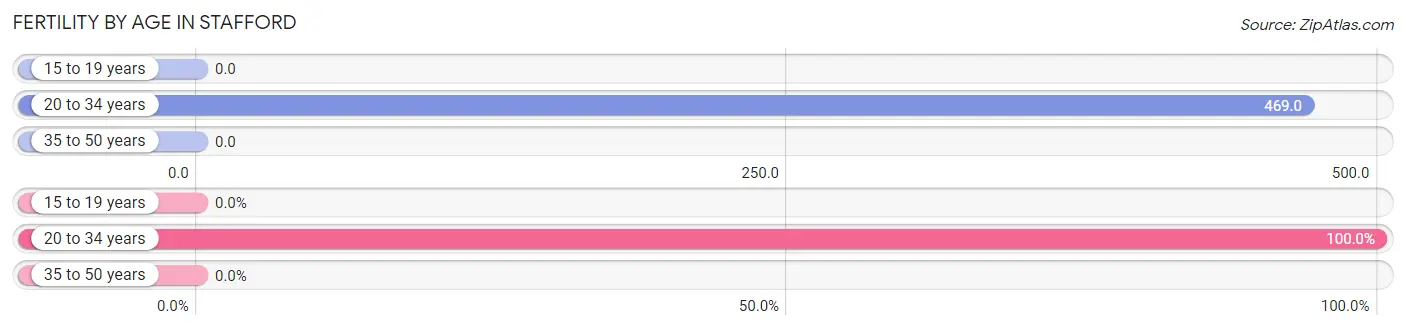
| Age Bracket | Women with Births | Births / 1,000 Women |
| 15 to 19 years | 0 (0.0%) | 0.0 |
| 20 to 34 years | 23 (100.0%) | 469.0 |
| 35 to 50 years | 0 (0.0%) | 0.0 |
| Total | 23 (100.0%) | 77.0 |
Fertility by Age by Marriage Status in Stafford
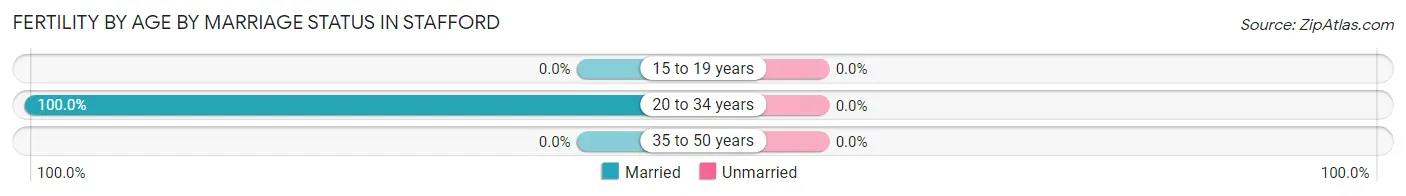
| Age Bracket | Married | Unmarried |
| 15 to 19 years | 0 (0.0%) | 0 (0.0%) |
| 20 to 34 years | 23 (100.0%) | 0 (0.0%) |
| 35 to 50 years | 0 (0.0%) | 0 (0.0%) |
| Total | 23 (100.0%) | 0 (0.0%) |
Fertility by Education in Stafford
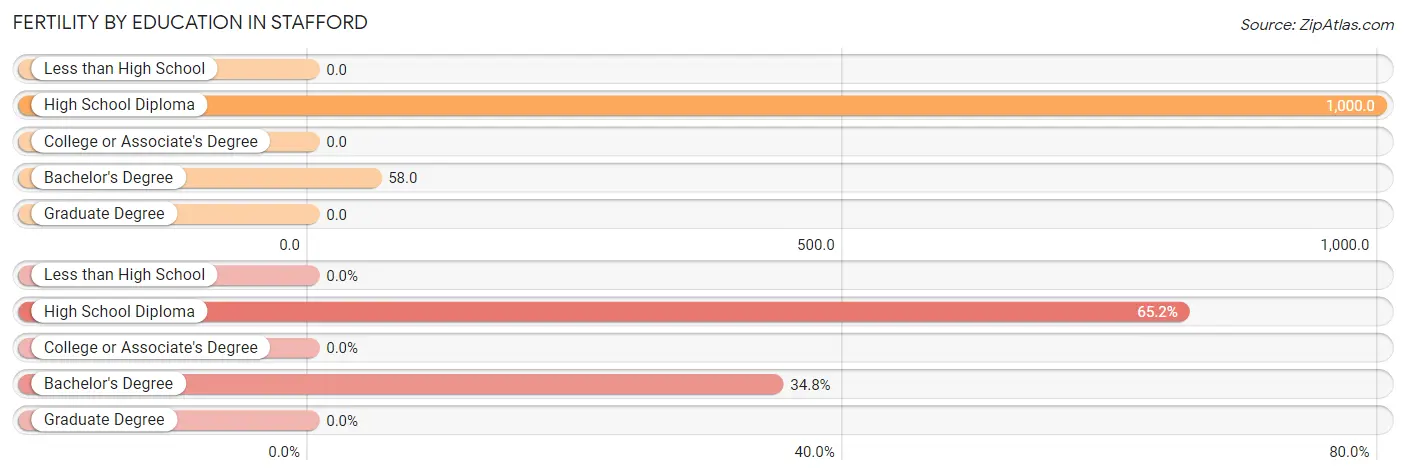
| Educational Attainment | Women with Births | Births / 1,000 Women |
| Less than High School | 0 (0.0%) | 0.0 |
| High School Diploma | 15 (65.2%) | 1,000.0 |
| College or Associate's Degree | 0 (0.0%) | 0.0 |
| Bachelor's Degree | 8 (34.8%) | 58.0 |
| Graduate Degree | 0 (0.0%) | 0.0 |
| Total | 23 (100.0%) | 77.0 |
Fertility by Education by Marriage Status in Stafford
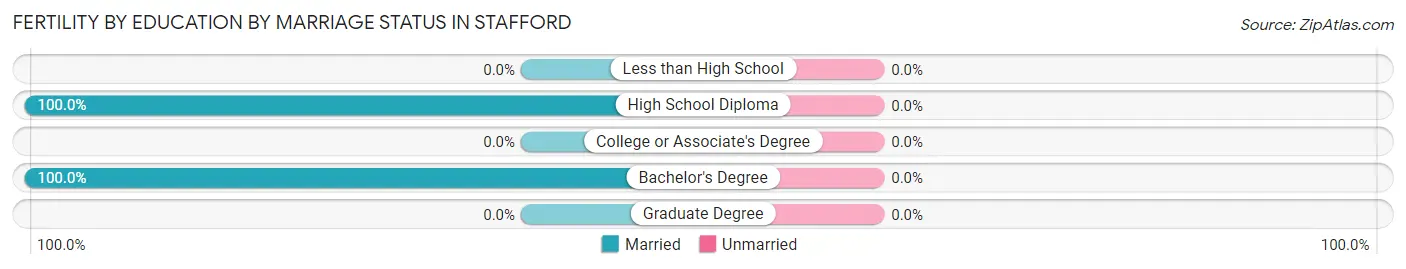
| Educational Attainment | Married | Unmarried |
| Less than High School | 0 (0.0%) | 0 (0.0%) |
| High School Diploma | 15 (100.0%) | 0 (0.0%) |
| College or Associate's Degree | 0 (0.0%) | 0 (0.0%) |
| Bachelor's Degree | 8 (100.0%) | 0 (0.0%) |
| Graduate Degree | 0 (0.0%) | 0 (0.0%) |
| Total | 23 (100.0%) | 0 (0.0%) |
Employment Characteristics in Stafford
Employment by Class of Employer in Stafford
Among the 555 employed individuals in Stafford, private company employees (280 | 50.4%), self-employed (incorporated) (96 | 17.3%), and local government employees (75 | 13.5%) make up the most common classes of employment.
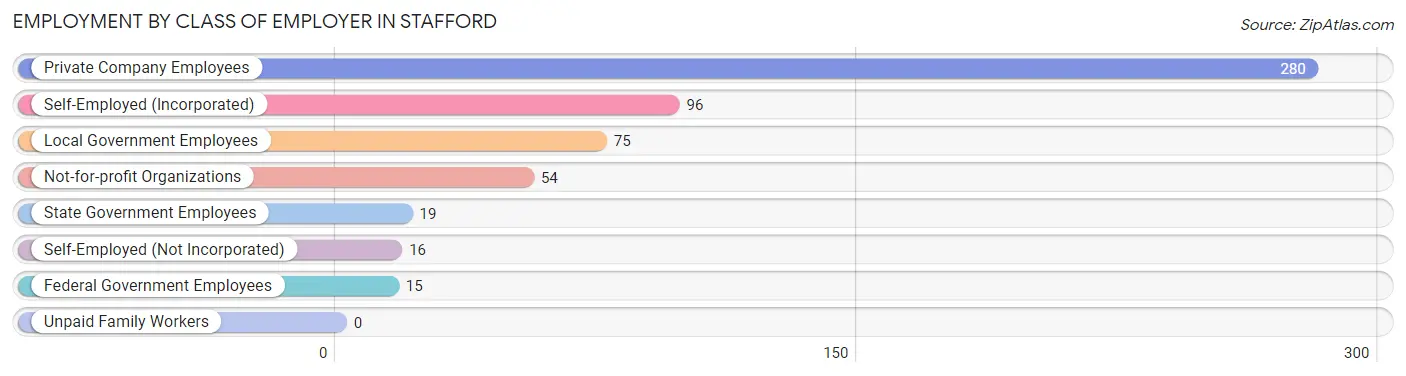
| Employer Class | # Employees | % Employees |
| Private Company Employees | 280 | 50.4% |
| Self-Employed (Incorporated) | 96 | 17.3% |
| Self-Employed (Not Incorporated) | 16 | 2.9% |
| Not-for-profit Organizations | 54 | 9.7% |
| Local Government Employees | 75 | 13.5% |
| State Government Employees | 19 | 3.4% |
| Federal Government Employees | 15 | 2.7% |
| Unpaid Family Workers | 0 | 0.0% |
| Total | 555 | 100.0% |
Employment Status by Age in Stafford
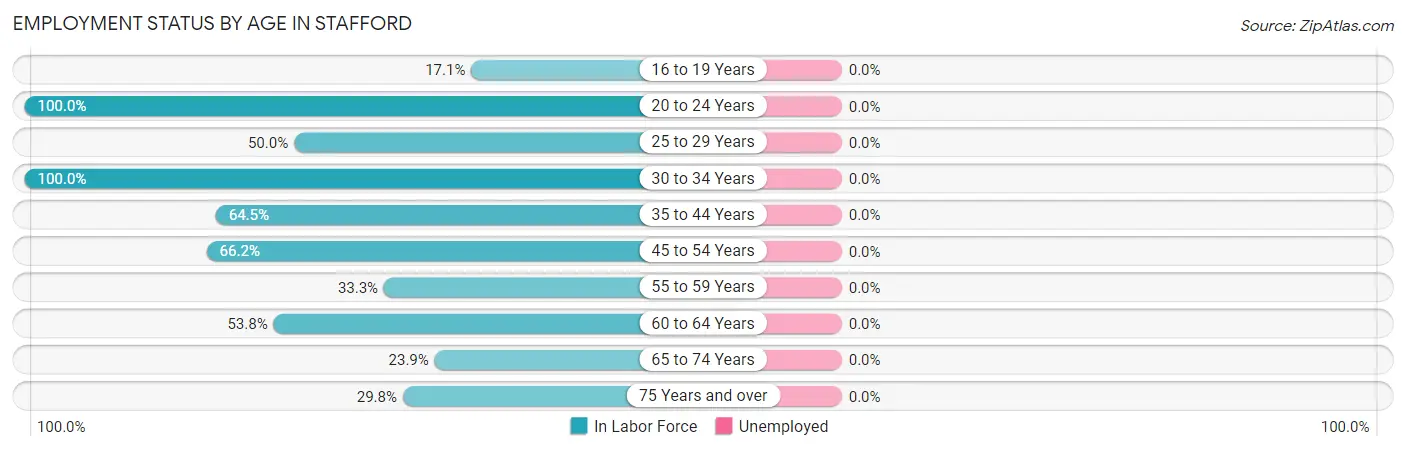
| Age Bracket | In Labor Force | Unemployed |
| 16 to 19 Years | 12 (17.1%) | 0 (0.0%) |
| 20 to 24 Years | 26 (100.0%) | 0 (0.0%) |
| 25 to 29 Years | 7 (50.0%) | 0 (0.0%) |
| 30 to 34 Years | 23 (100.0%) | 0 (0.0%) |
| 35 to 44 Years | 100 (64.5%) | 0 (0.0%) |
| 45 to 54 Years | 174 (66.2%) | 0 (0.0%) |
| 55 to 59 Years | 18 (33.3%) | 0 (0.0%) |
| 60 to 64 Years | 114 (53.8%) | 0 (0.0%) |
| 65 to 74 Years | 42 (23.9%) | 0 (0.0%) |
| 75 Years and over | 50 (29.8%) | 0 (0.0%) |
| Total | 567 (48.8%) | 0 (0.0%) |
Employment Status by Educational Attainment in Stafford
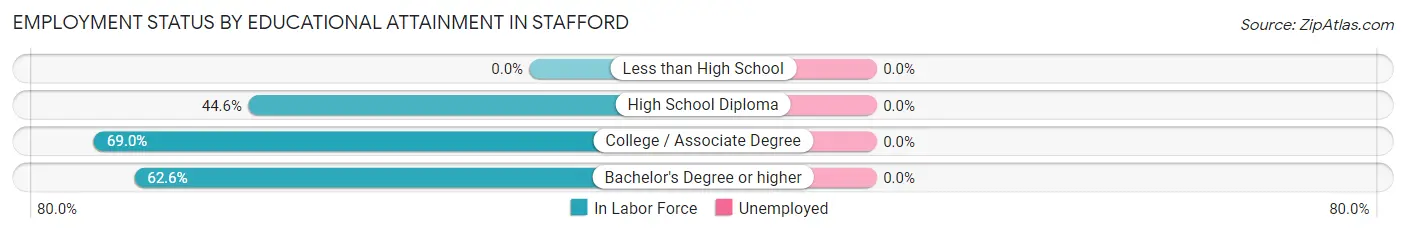
| Educational Attainment | In Labor Force | Unemployed |
| Less than High School | 0 (0.0%) | 0 (0.0%) |
| High School Diploma | 41 (44.6%) | 0 (0.0%) |
| College / Associate Degree | 58 (69.0%) | 0 (0.0%) |
| Bachelor's Degree or higher | 337 (62.6%) | 0 (0.0%) |
| Total | 436 (60.5%) | 0 (0.0%) |
Employment Occupations by Sex in Stafford
Management, Business, Science and Arts Occupations
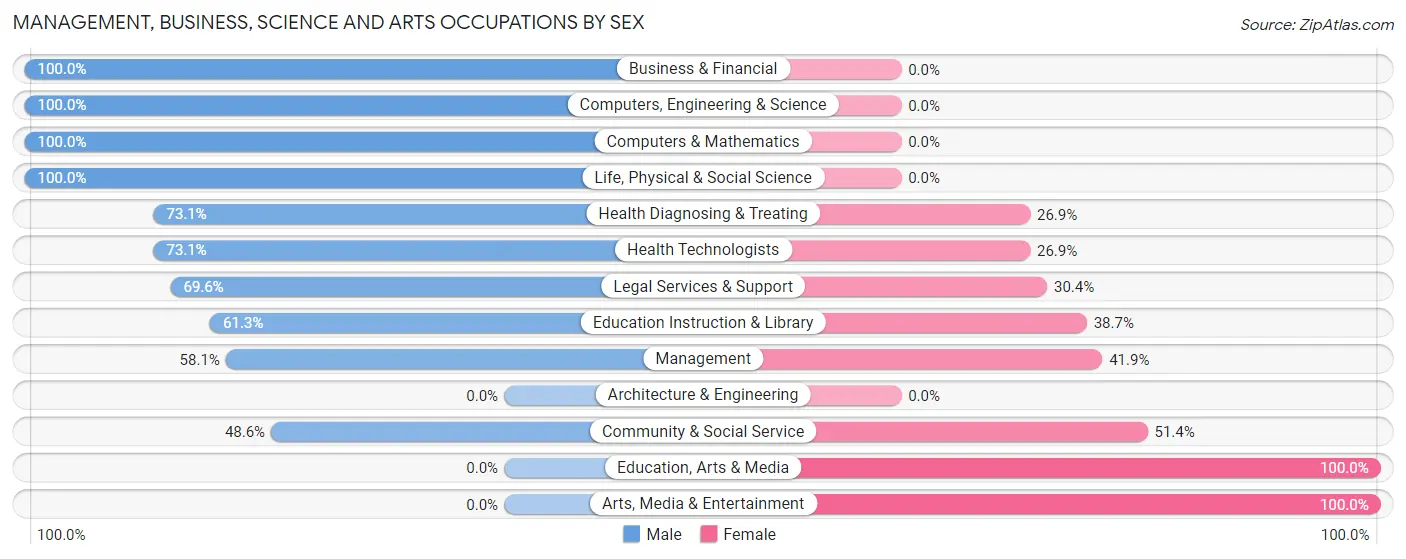
The most common Management, Business, Science and Arts occupations in Stafford are Management (186 | 32.9%), Health Diagnosing & Treating (93 | 16.4%), Health Technologists (93 | 16.4%), Community & Social Service (72 | 12.7%), and Education Instruction & Library (31 | 5.5%).
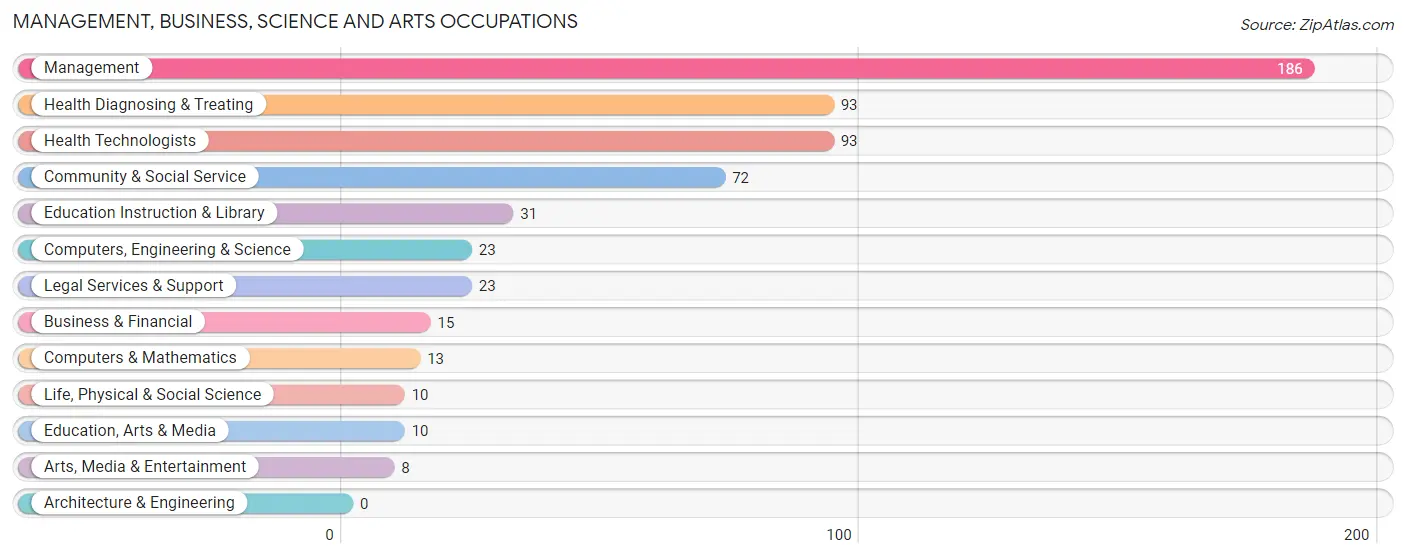
Management, Business, Science and Arts Occupations by Sex
Within the Management, Business, Science and Arts occupations in Stafford, the most male-oriented occupations are Business & Financial (100.0%), Computers, Engineering & Science (100.0%), and Computers & Mathematics (100.0%), while the most female-oriented occupations are Education, Arts & Media (100.0%), Arts, Media & Entertainment (100.0%), and Community & Social Service (51.4%).
| Occupation | Male | Female |
| Management | 108 (58.1%) | 78 (41.9%) |
| Business & Financial | 15 (100.0%) | 0 (0.0%) |
| Computers, Engineering & Science | 23 (100.0%) | 0 (0.0%) |
| Computers & Mathematics | 13 (100.0%) | 0 (0.0%) |
| Architecture & Engineering | 0 (0.0%) | 0 (0.0%) |
| Life, Physical & Social Science | 10 (100.0%) | 0 (0.0%) |
| Community & Social Service | 35 (48.6%) | 37 (51.4%) |
| Education, Arts & Media | 0 (0.0%) | 10 (100.0%) |
| Legal Services & Support | 16 (69.6%) | 7 (30.4%) |
| Education Instruction & Library | 19 (61.3%) | 12 (38.7%) |
| Arts, Media & Entertainment | 0 (0.0%) | 8 (100.0%) |
| Health Diagnosing & Treating | 68 (73.1%) | 25 (26.9%) |
| Health Technologists | 68 (73.1%) | 25 (26.9%) |
| Total (Category) | 249 (64.0%) | 140 (36.0%) |
| Total (Overall) | 336 (59.4%) | 230 (40.6%) |
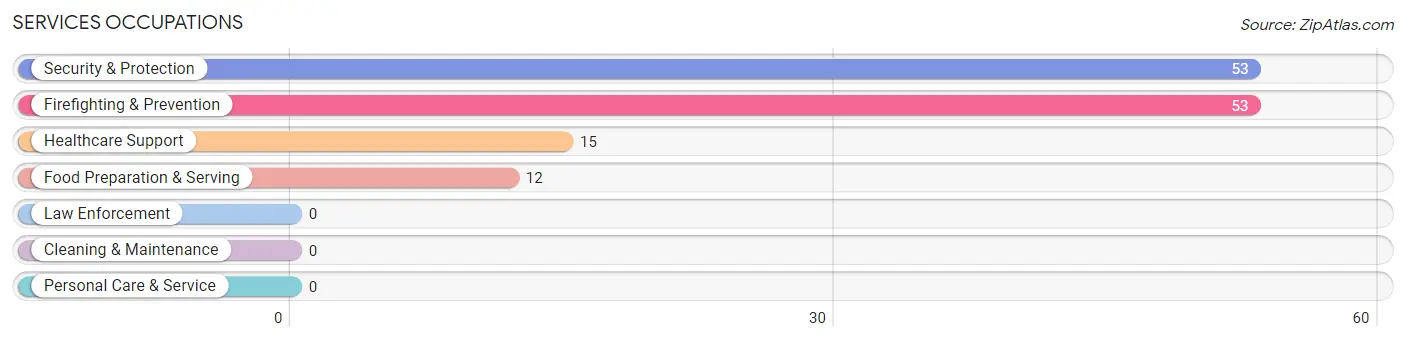
Services Occupations
The most common Services occupations in Stafford are Security & Protection (53 | 9.4%), Firefighting & Prevention (53 | 9.4%), Healthcare Support (15 | 2.6%), and Food Preparation & Serving (12 | 2.1%).
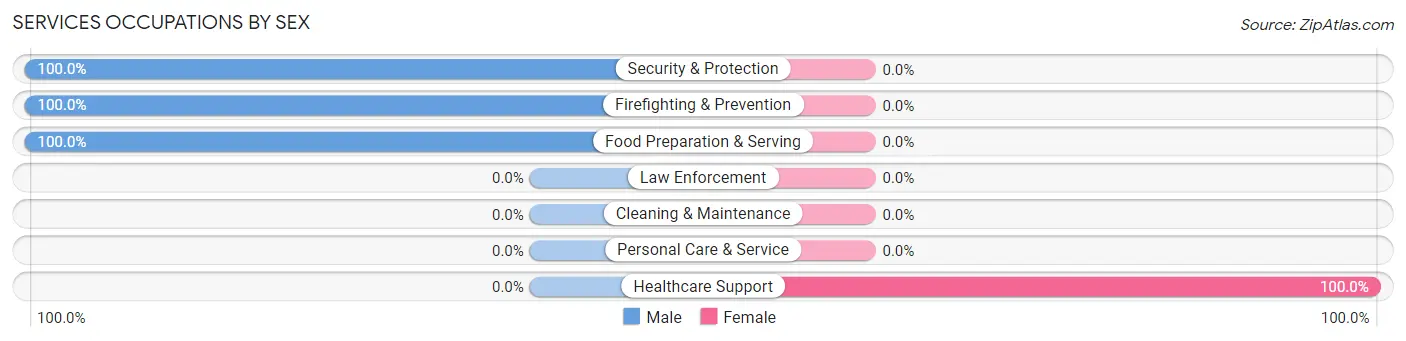
Services Occupations by Sex
| Occupation | Male | Female |
| Healthcare Support | 0 (0.0%) | 15 (100.0%) |
| Security & Protection | 53 (100.0%) | 0 (0.0%) |
| Firefighting & Prevention | 53 (100.0%) | 0 (0.0%) |
| Law Enforcement | 0 (0.0%) | 0 (0.0%) |
| Food Preparation & Serving | 12 (100.0%) | 0 (0.0%) |
| Cleaning & Maintenance | 0 (0.0%) | 0 (0.0%) |
| Personal Care & Service | 0 (0.0%) | 0 (0.0%) |
| Total (Category) | 65 (81.2%) | 15 (18.8%) |
| Total (Overall) | 336 (59.4%) | 230 (40.6%) |
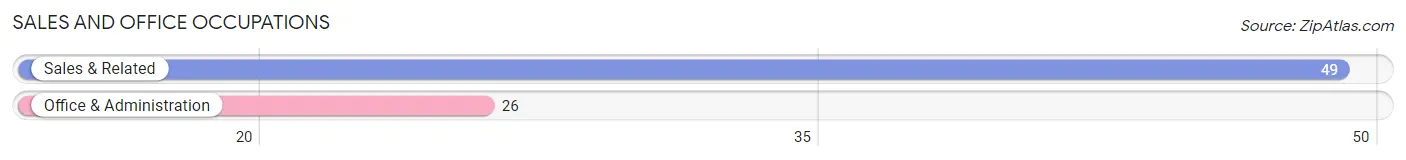
Sales and Office Occupations
The most common Sales and Office occupations in Stafford are Sales & Related (49 | 8.7%), and Office & Administration (26 | 4.6%).
Sales and Office Occupations by Sex
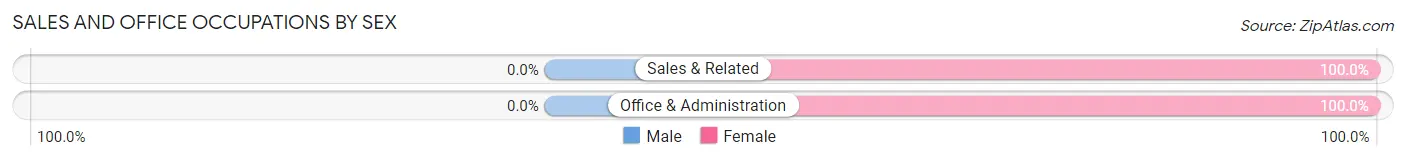
| Occupation | Male | Female |
| Sales & Related | 0 (0.0%) | 49 (100.0%) |
| Office & Administration | 0 (0.0%) | 26 (100.0%) |
| Total (Category) | 0 (0.0%) | 75 (100.0%) |
| Total (Overall) | 336 (59.4%) | 230 (40.6%) |
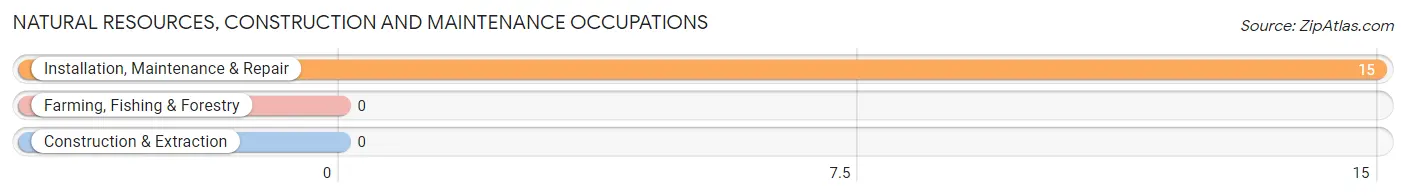
Natural Resources, Construction and Maintenance Occupations
The most common Natural Resources, Construction and Maintenance occupations in Stafford are , and Installation, Maintenance & Repair (15 | 2.6%).
Natural Resources, Construction and Maintenance Occupations by Sex
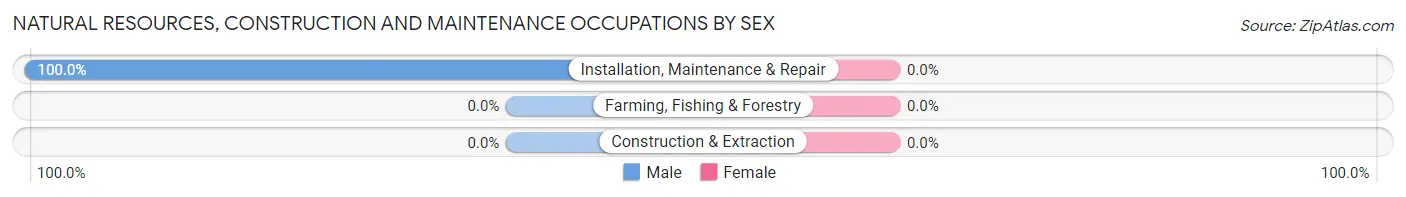
| Occupation | Male | Female |
| Farming, Fishing & Forestry | 0 (0.0%) | 0 (0.0%) |
| Construction & Extraction | 0 (0.0%) | 0 (0.0%) |
| Installation, Maintenance & Repair | 15 (100.0%) | 0 (0.0%) |
| Total (Category) | 15 (100.0%) | 0 (0.0%) |
| Total (Overall) | 336 (59.4%) | 230 (40.6%) |
Production, Transportation and Moving Occupations
The most common Production, Transportation and Moving occupations in Stafford are , and Material Moving (7 | 1.2%).
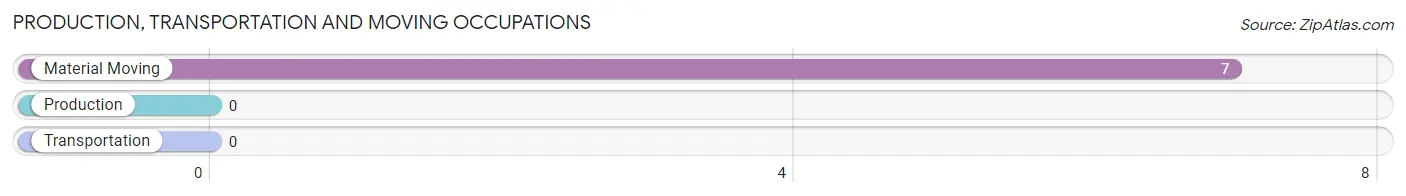
Production, Transportation and Moving Occupations by Sex
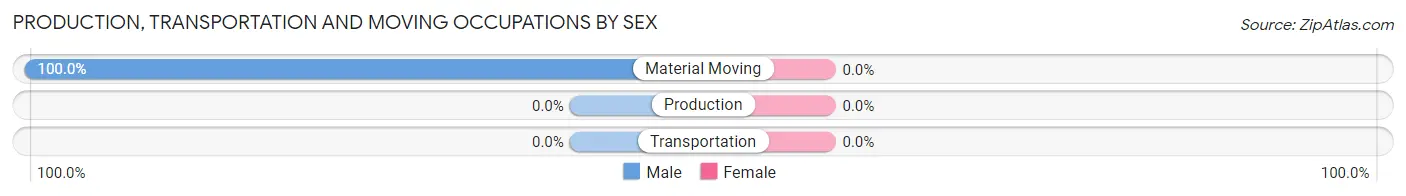
| Occupation | Male | Female |
| Production | 0 (0.0%) | 0 (0.0%) |
| Transportation | 0 (0.0%) | 0 (0.0%) |
| Material Moving | 7 (100.0%) | 0 (0.0%) |
| Total (Category) | 7 (100.0%) | 0 (0.0%) |
| Total (Overall) | 336 (59.4%) | 230 (40.6%) |
Employment Industries by Sex in Stafford
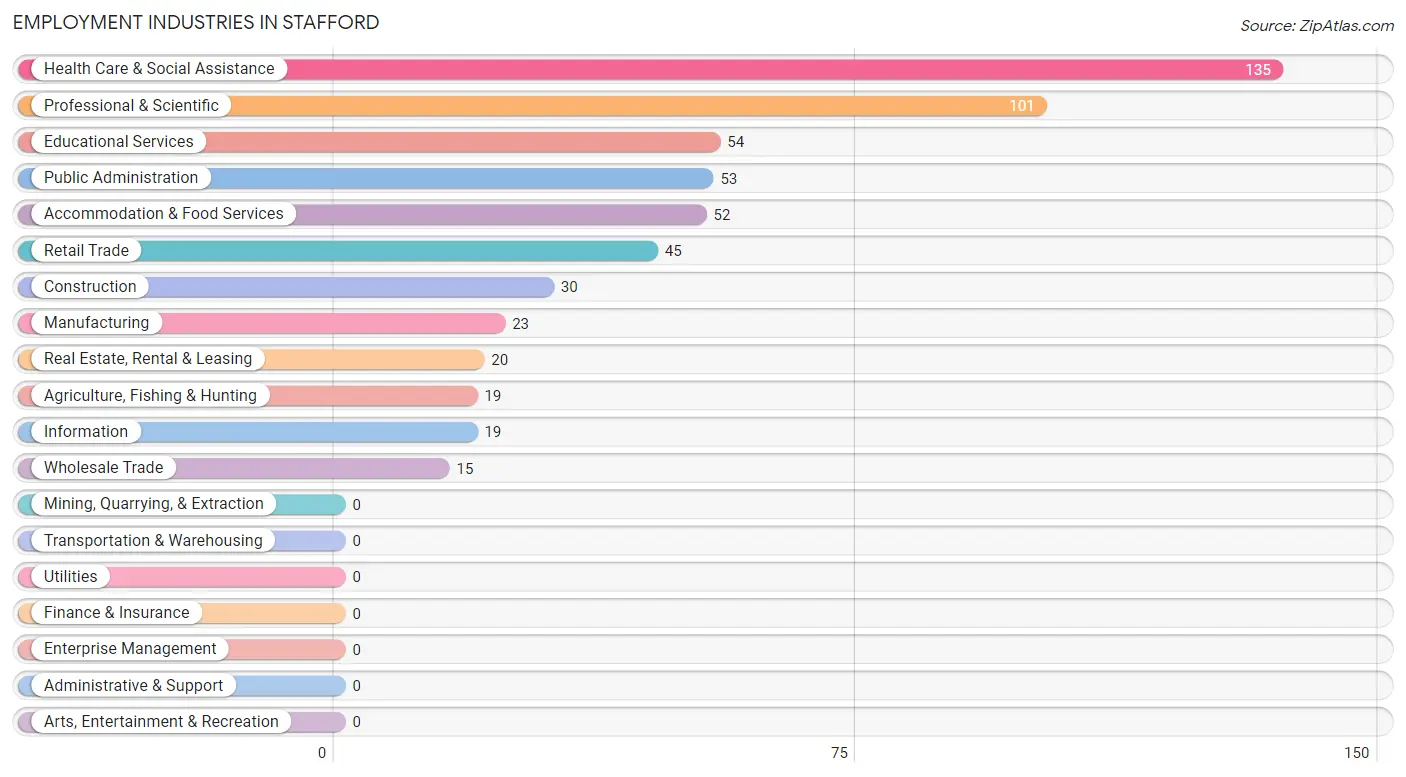
Employment Industries in Stafford
The major employment industries in Stafford include Health Care & Social Assistance (135 | 23.8%), Professional & Scientific (101 | 17.8%), Educational Services (54 | 9.5%), Public Administration (53 | 9.4%), and Accommodation & Food Services (52 | 9.2%).
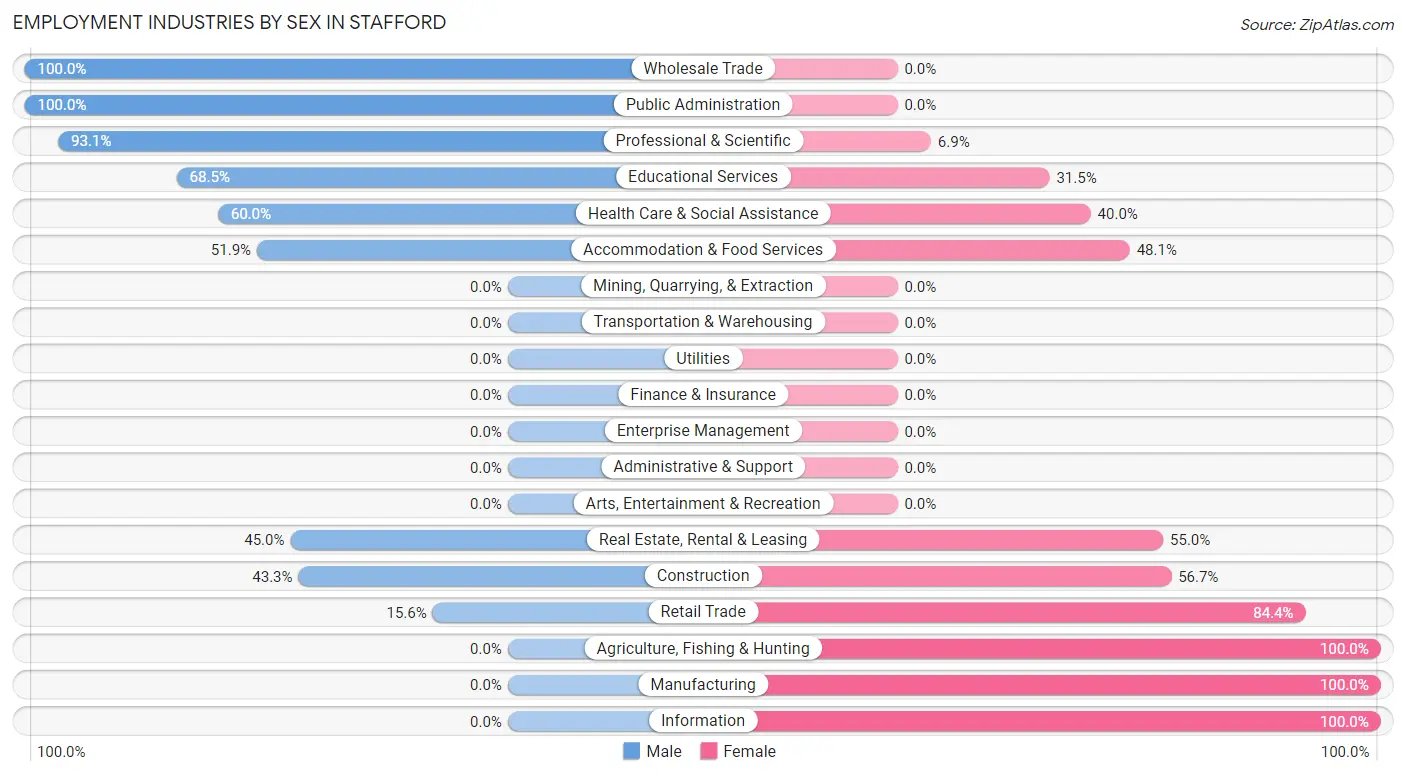
Employment Industries by Sex in Stafford
The Stafford industries that see more men than women are Wholesale Trade (100.0%), Public Administration (100.0%), and Professional & Scientific (93.1%), whereas the industries that tend to have a higher number of women are Agriculture, Fishing & Hunting (100.0%), Manufacturing (100.0%), and Information (100.0%).
| Industry | Male | Female |
| Agriculture, Fishing & Hunting | 0 (0.0%) | 19 (100.0%) |
| Mining, Quarrying, & Extraction | 0 (0.0%) | 0 (0.0%) |
| Construction | 13 (43.3%) | 17 (56.7%) |
| Manufacturing | 0 (0.0%) | 23 (100.0%) |
| Wholesale Trade | 15 (100.0%) | 0 (0.0%) |
| Retail Trade | 7 (15.6%) | 38 (84.4%) |
| Transportation & Warehousing | 0 (0.0%) | 0 (0.0%) |
| Utilities | 0 (0.0%) | 0 (0.0%) |
| Information | 0 (0.0%) | 19 (100.0%) |
| Finance & Insurance | 0 (0.0%) | 0 (0.0%) |
| Real Estate, Rental & Leasing | 9 (45.0%) | 11 (55.0%) |
| Professional & Scientific | 94 (93.1%) | 7 (6.9%) |
| Enterprise Management | 0 (0.0%) | 0 (0.0%) |
| Administrative & Support | 0 (0.0%) | 0 (0.0%) |
| Educational Services | 37 (68.5%) | 17 (31.5%) |
| Health Care & Social Assistance | 81 (60.0%) | 54 (40.0%) |
| Arts, Entertainment & Recreation | 0 (0.0%) | 0 (0.0%) |
| Accommodation & Food Services | 27 (51.9%) | 25 (48.1%) |
| Public Administration | 53 (100.0%) | 0 (0.0%) |
| Total | 336 (59.4%) | 230 (40.6%) |
Education in Stafford
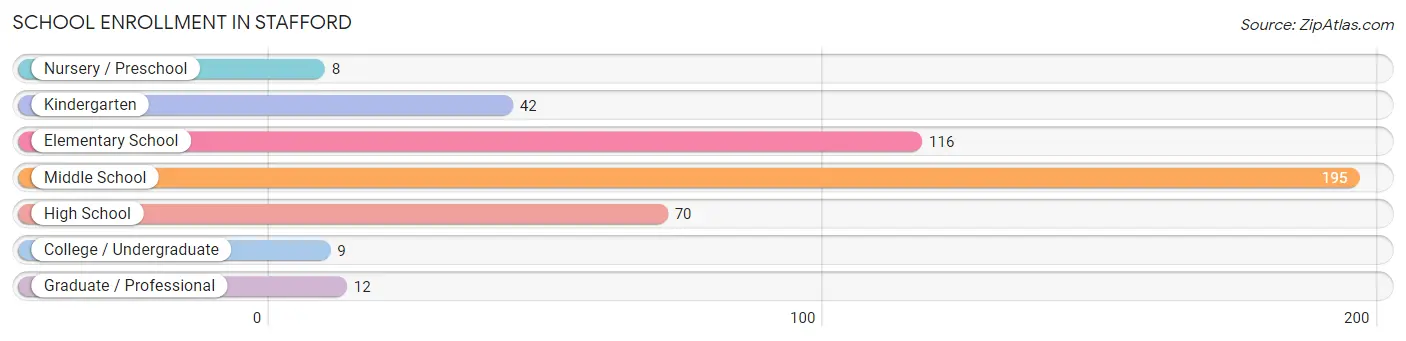
School Enrollment in Stafford
The most common levels of schooling among the 452 students in Stafford are middle school (195 | 43.1%), elementary school (116 | 25.7%), and high school (70 | 15.5%).
| School Level | # Students | % Students |
| Nursery / Preschool | 8 | 1.8% |
| Kindergarten | 42 | 9.3% |
| Elementary School | 116 | 25.7% |
| Middle School | 195 | 43.1% |
| High School | 70 | 15.5% |
| College / Undergraduate | 9 | 2.0% |
| Graduate / Professional | 12 | 2.6% |
| Total | 452 | 100.0% |
School Enrollment by Age by Funding Source in Stafford
Out of a total of 452 students who are enrolled in schools in Stafford, 12 (2.7%) attend a private institution, while the remaining 440 (97.3%) are enrolled in public schools. The age group of 35 years and over has the highest likelihood of being enrolled in private schools, with 12 (57.1% in the age bracket) enrolled. Conversely, the age group of 3 to 4 year olds has the lowest likelihood of being enrolled in a private school, with 8 (100.0% in the age bracket) attending a public institution.
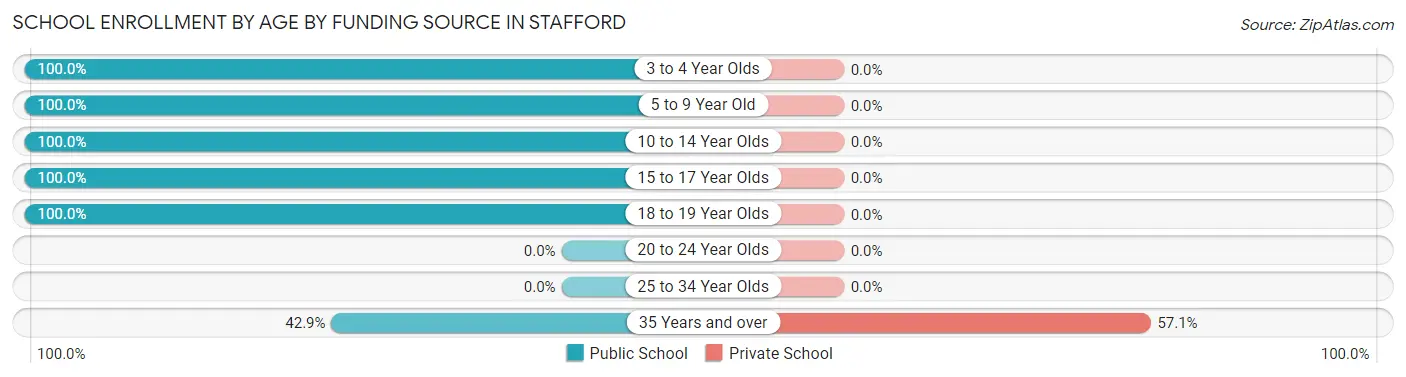
| Age Bracket | Public School | Private School |
| 3 to 4 Year Olds | 8 (100.0%) | 0 (0.0%) |
| 5 to 9 Year Old | 158 (100.0%) | 0 (0.0%) |
| 10 to 14 Year Olds | 195 (100.0%) | 0 (0.0%) |
| 15 to 17 Year Olds | 57 (100.0%) | 0 (0.0%) |
| 18 to 19 Year Olds | 13 (100.0%) | 0 (0.0%) |
| 20 to 24 Year Olds | 0 (0.0%) | 0 (0.0%) |
| 25 to 34 Year Olds | 0 (0.0%) | 0 (0.0%) |
| 35 Years and over | 9 (42.9%) | 12 (57.1%) |
| Total | 440 (97.3%) | 12 (2.7%) |
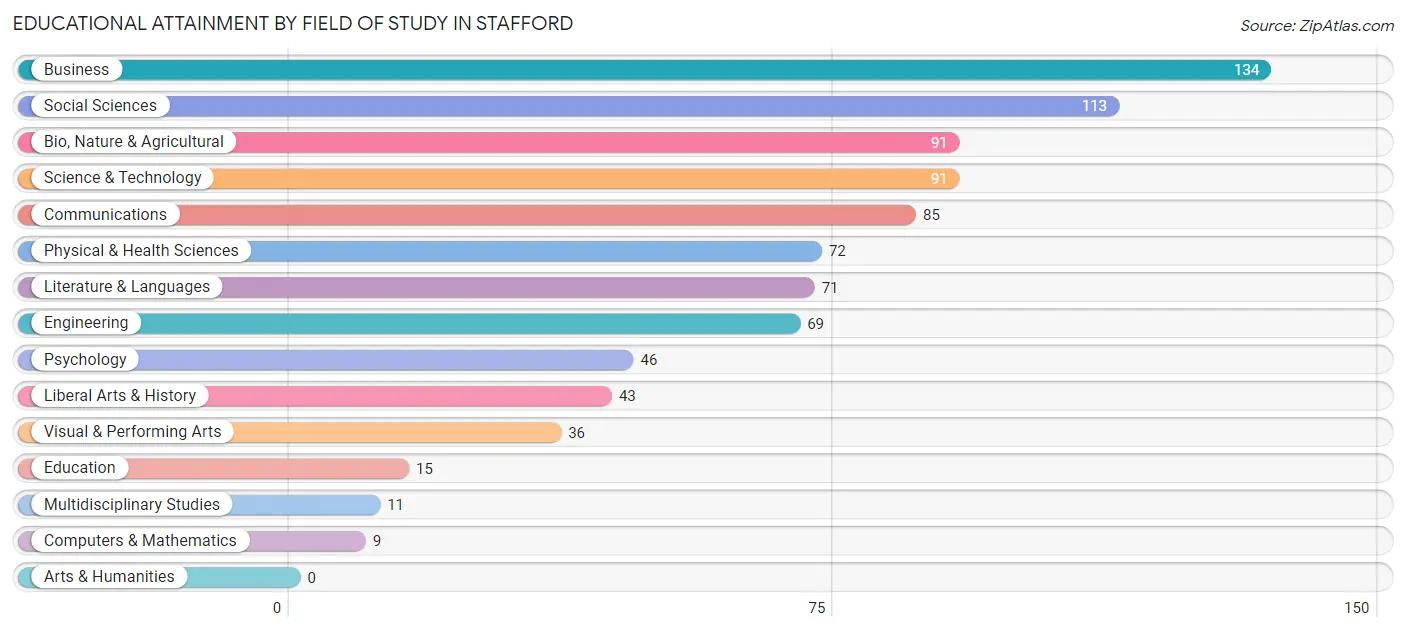
Educational Attainment by Field of Study in Stafford
Business (134 | 15.1%), social sciences (113 | 12.8%), bio, nature & agricultural (91 | 10.3%), science & technology (91 | 10.3%), and communications (85 | 9.6%) are the most common fields of study among 886 individuals in Stafford who have obtained a bachelor's degree or higher.
| Field of Study | # Graduates | % Graduates |
| Computers & Mathematics | 9 | 1.0% |
| Bio, Nature & Agricultural | 91 | 10.3% |
| Physical & Health Sciences | 72 | 8.1% |
| Psychology | 46 | 5.2% |
| Social Sciences | 113 | 12.8% |
| Engineering | 69 | 7.8% |
| Multidisciplinary Studies | 11 | 1.2% |
| Science & Technology | 91 | 10.3% |
| Business | 134 | 15.1% |
| Education | 15 | 1.7% |
| Literature & Languages | 71 | 8.0% |
| Liberal Arts & History | 43 | 4.9% |
| Visual & Performing Arts | 36 | 4.1% |
| Communications | 85 | 9.6% |
| Arts & Humanities | 0 | 0.0% |
| Total | 886 | 100.0% |
Transportation & Commute in Stafford
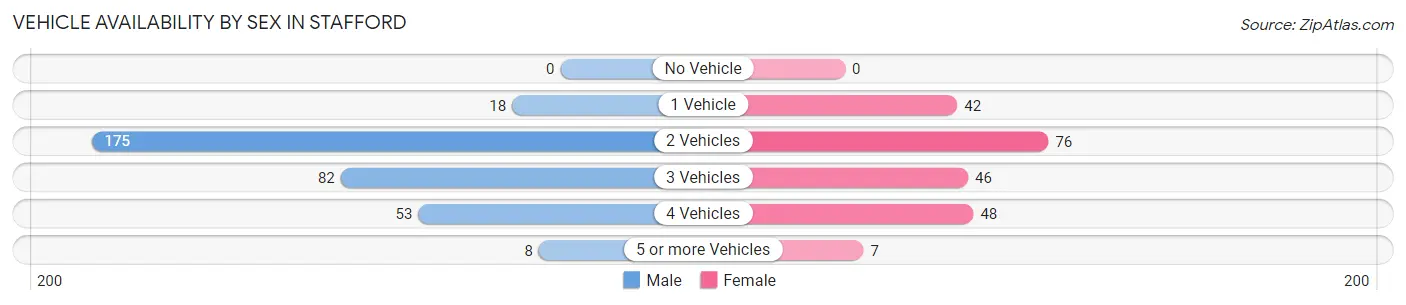
Vehicle Availability by Sex in Stafford
The most prevalent vehicle ownership categories in Stafford are males with 2 vehicles (175, accounting for 52.1%) and females with 2 vehicles (76, making up 79.9%).
| Vehicles Available | Male | Female |
| No Vehicle | 0 (0.0%) | 0 (0.0%) |
| 1 Vehicle | 18 (5.4%) | 42 (19.2%) |
| 2 Vehicles | 175 (52.1%) | 76 (34.7%) |
| 3 Vehicles | 82 (24.4%) | 46 (21.0%) |
| 4 Vehicles | 53 (15.8%) | 48 (21.9%) |
| 5 or more Vehicles | 8 (2.4%) | 7 (3.2%) |
| Total | 336 (100.0%) | 219 (100.0%) |
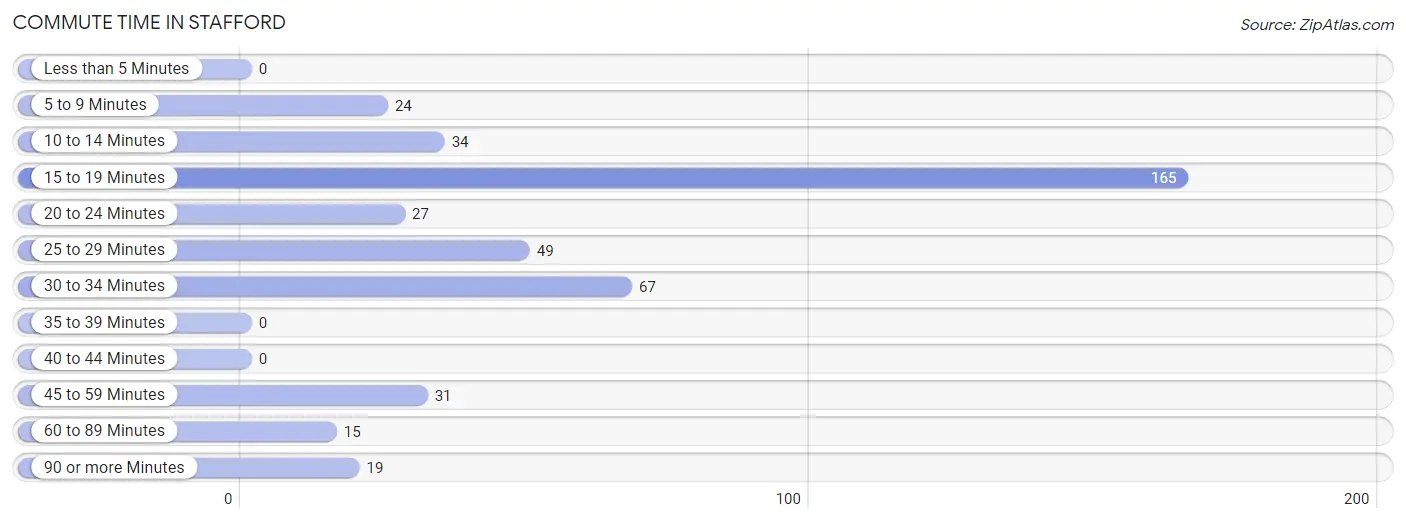
Commute Time in Stafford
The most frequently occuring commute durations in Stafford are 15 to 19 minutes (165 commuters, 38.3%), 30 to 34 minutes (67 commuters, 15.5%), and 25 to 29 minutes (49 commuters, 11.4%).
| Commute Time | # Commuters | % Commuters |
| Less than 5 Minutes | 0 | 0.0% |
| 5 to 9 Minutes | 24 | 5.6% |
| 10 to 14 Minutes | 34 | 7.9% |
| 15 to 19 Minutes | 165 | 38.3% |
| 20 to 24 Minutes | 27 | 6.3% |
| 25 to 29 Minutes | 49 | 11.4% |
| 30 to 34 Minutes | 67 | 15.5% |
| 35 to 39 Minutes | 0 | 0.0% |
| 40 to 44 Minutes | 0 | 0.0% |
| 45 to 59 Minutes | 31 | 7.2% |
| 60 to 89 Minutes | 15 | 3.5% |
| 90 or more Minutes | 19 | 4.4% |
Commute Time by Sex in Stafford
The most common commute times in Stafford are 15 to 19 minutes (111 commuters, 37.4%) for males and 15 to 19 minutes (54 commuters, 40.3%) for females.
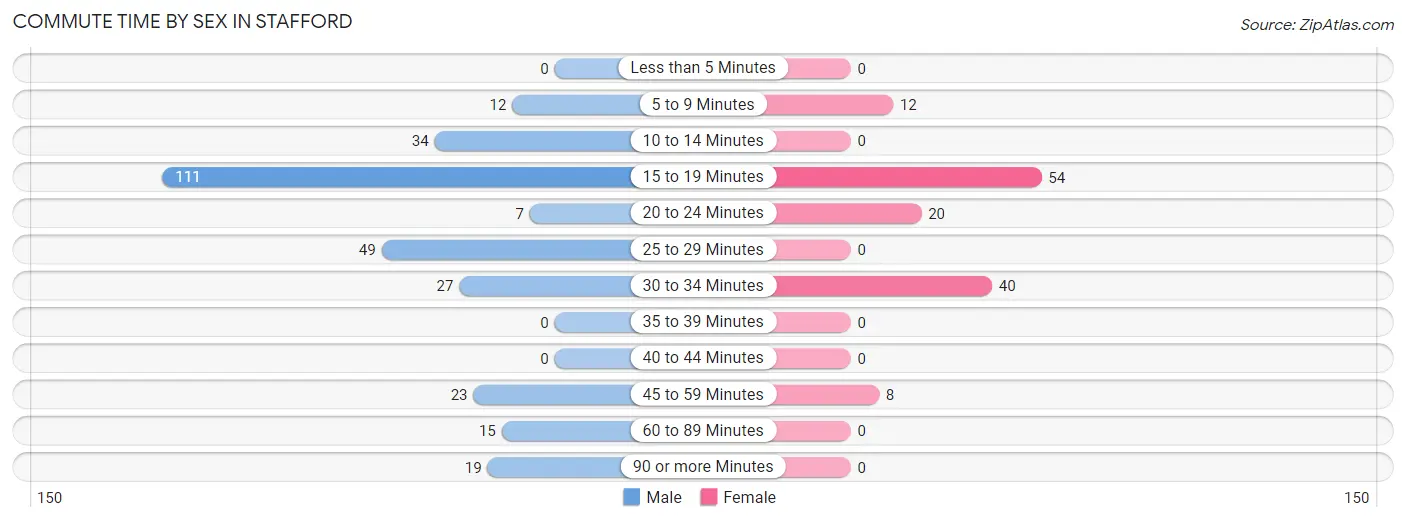
| Commute Time | Male | Female |
| Less than 5 Minutes | 0 (0.0%) | 0 (0.0%) |
| 5 to 9 Minutes | 12 (4.0%) | 12 (9.0%) |
| 10 to 14 Minutes | 34 (11.5%) | 0 (0.0%) |
| 15 to 19 Minutes | 111 (37.4%) | 54 (40.3%) |
| 20 to 24 Minutes | 7 (2.4%) | 20 (14.9%) |
| 25 to 29 Minutes | 49 (16.5%) | 0 (0.0%) |
| 30 to 34 Minutes | 27 (9.1%) | 40 (29.8%) |
| 35 to 39 Minutes | 0 (0.0%) | 0 (0.0%) |
| 40 to 44 Minutes | 0 (0.0%) | 0 (0.0%) |
| 45 to 59 Minutes | 23 (7.7%) | 8 (6.0%) |
| 60 to 89 Minutes | 15 (5.1%) | 0 (0.0%) |
| 90 or more Minutes | 19 (6.4%) | 0 (0.0%) |
Time of Departure to Work by Sex in Stafford
The most frequent times of departure to work in Stafford are 6:30 AM to 6:59 AM (101, 34.0%) for males and 6:00 AM to 6:29 AM (65, 48.5%) for females.
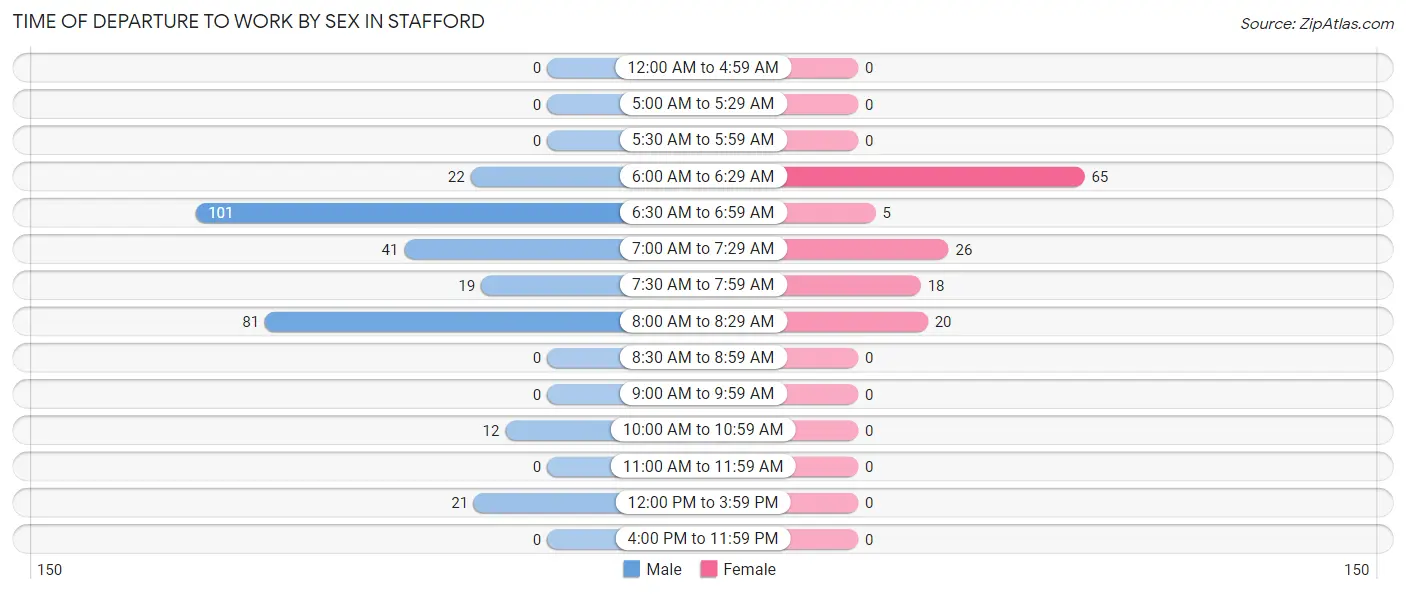
| Time of Departure | Male | Female |
| 12:00 AM to 4:59 AM | 0 (0.0%) | 0 (0.0%) |
| 5:00 AM to 5:29 AM | 0 (0.0%) | 0 (0.0%) |
| 5:30 AM to 5:59 AM | 0 (0.0%) | 0 (0.0%) |
| 6:00 AM to 6:29 AM | 22 (7.4%) | 65 (48.5%) |
| 6:30 AM to 6:59 AM | 101 (34.0%) | 5 (3.7%) |
| 7:00 AM to 7:29 AM | 41 (13.8%) | 26 (19.4%) |
| 7:30 AM to 7:59 AM | 19 (6.4%) | 18 (13.4%) |
| 8:00 AM to 8:29 AM | 81 (27.3%) | 20 (14.9%) |
| 8:30 AM to 8:59 AM | 0 (0.0%) | 0 (0.0%) |
| 9:00 AM to 9:59 AM | 0 (0.0%) | 0 (0.0%) |
| 10:00 AM to 10:59 AM | 12 (4.0%) | 0 (0.0%) |
| 11:00 AM to 11:59 AM | 0 (0.0%) | 0 (0.0%) |
| 12:00 PM to 3:59 PM | 21 (7.1%) | 0 (0.0%) |
| 4:00 PM to 11:59 PM | 0 (0.0%) | 0 (0.0%) |
| Total | 297 (100.0%) | 134 (100.0%) |
Housing Occupancy in Stafford
Occupancy by Ownership in Stafford
Of the total 631 dwellings in Stafford, owner-occupied units account for 553 (87.6%), while renter-occupied units make up 78 (12.4%).
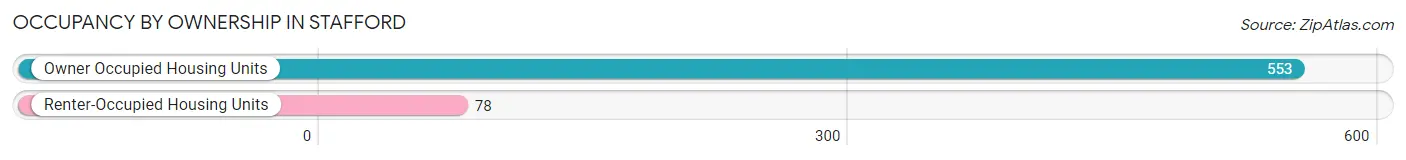
| Occupancy | # Housing Units | % Housing Units |
| Owner Occupied Housing Units | 553 | 87.6% |
| Renter-Occupied Housing Units | 78 | 12.4% |
| Total Occupied Housing Units | 631 | 100.0% |
Occupancy by Household Size in Stafford
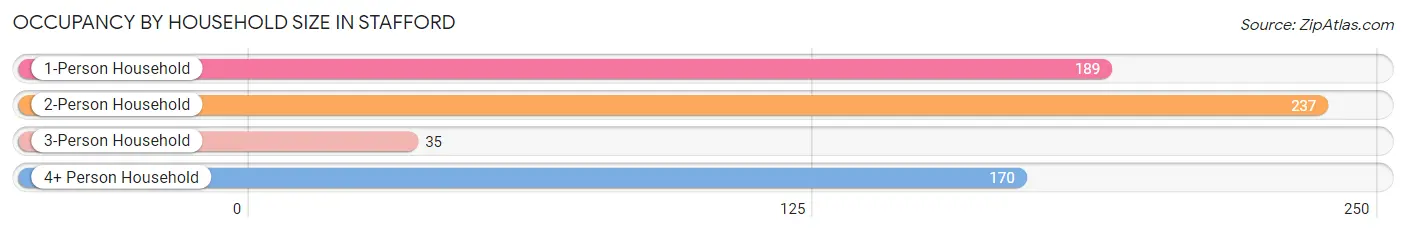
| Household Size | # Housing Units | % Housing Units |
| 1-Person Household | 189 | 29.9% |
| 2-Person Household | 237 | 37.6% |
| 3-Person Household | 35 | 5.6% |
| 4+ Person Household | 170 | 26.9% |
| Total Housing Units | 631 | 100.0% |
Occupancy by Ownership by Household Size in Stafford
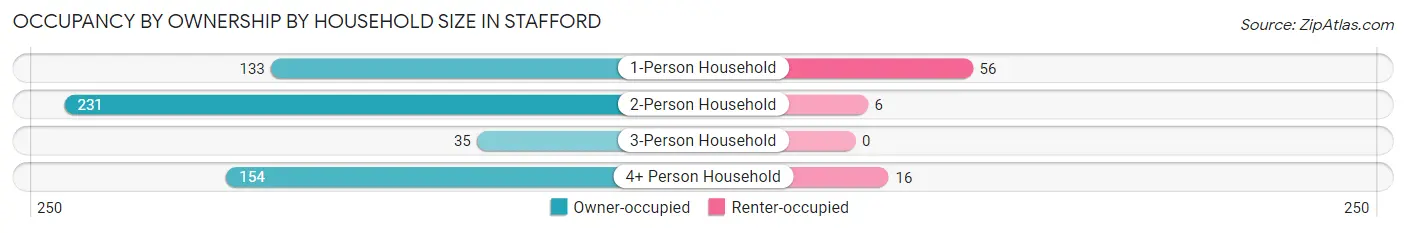
| Household Size | Owner-occupied | Renter-occupied |
| 1-Person Household | 133 (70.4%) | 56 (29.6%) |
| 2-Person Household | 231 (97.5%) | 6 (2.5%) |
| 3-Person Household | 35 (100.0%) | 0 (0.0%) |
| 4+ Person Household | 154 (90.6%) | 16 (9.4%) |
| Total Housing Units | 553 (87.6%) | 78 (12.4%) |
Occupancy by Educational Attainment in Stafford
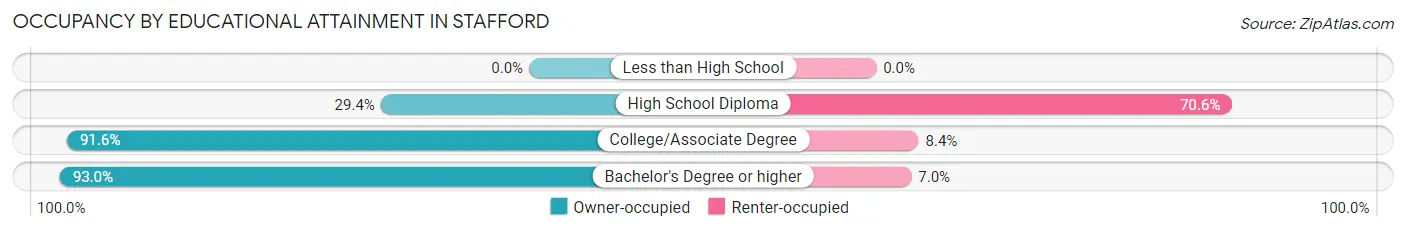
| Household Size | Owner-occupied | Renter-occupied |
| Less than High School | 0 (0.0%) | 0 (0.0%) |
| High School Diploma | 15 (29.4%) | 36 (70.6%) |
| College/Associate Degree | 98 (91.6%) | 9 (8.4%) |
| Bachelor's Degree or higher | 440 (93.0%) | 33 (7.0%) |
Occupancy by Age of Householder in Stafford
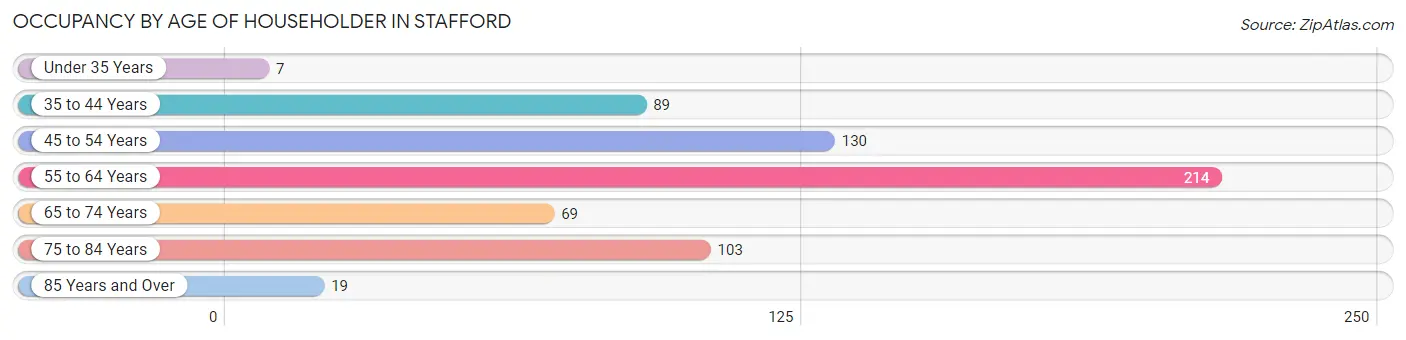
| Age Bracket | # Households | % Households |
| Under 35 Years | 7 | 1.1% |
| 35 to 44 Years | 89 | 14.1% |
| 45 to 54 Years | 130 | 20.6% |
| 55 to 64 Years | 214 | 33.9% |
| 65 to 74 Years | 69 | 10.9% |
| 75 to 84 Years | 103 | 16.3% |
| 85 Years and Over | 19 | 3.0% |
| Total | 631 | 100.0% |
Housing Finances in Stafford
Median Income by Occupancy in Stafford
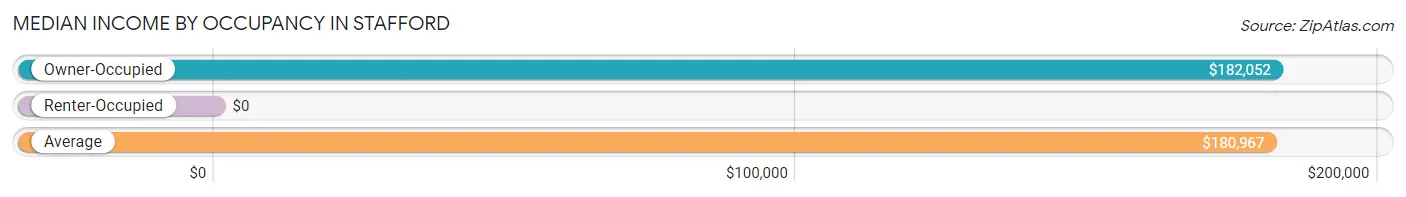
| Occupancy Type | # Households | Median Income |
| Owner-Occupied | 553 (87.6%) | $182,052 |
| Renter-Occupied | 78 (12.4%) | $0 |
| Average | 631 (100.0%) | $180,967 |
Occupancy by Householder Income Bracket in Stafford
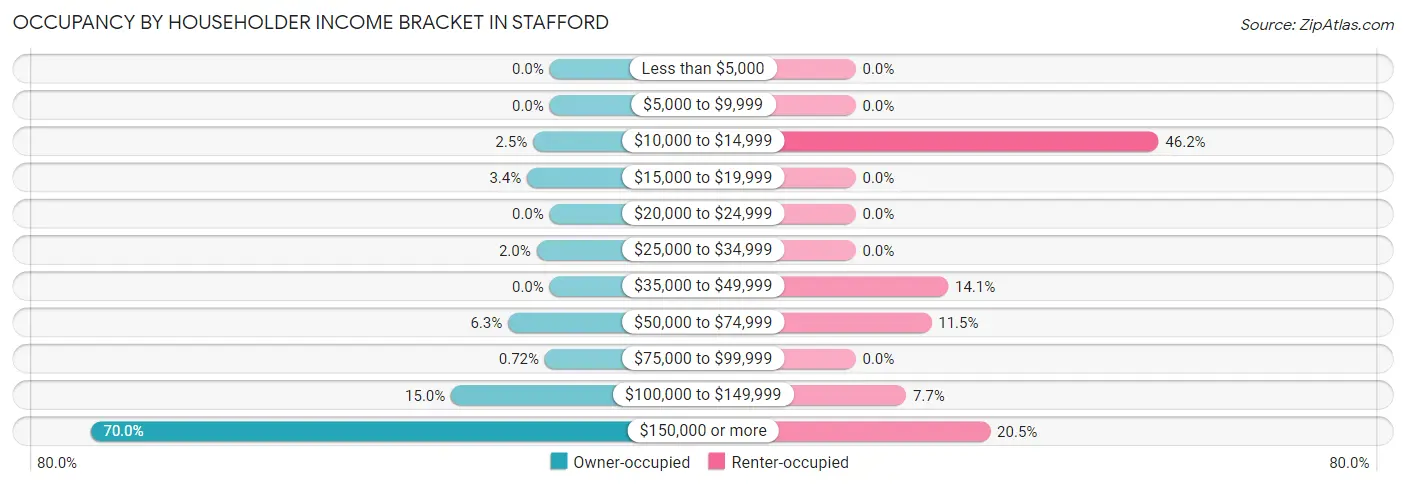
| Income Bracket | Owner-occupied | Renter-occupied |
| Less than $5,000 | 0 (0.0%) | 0 (0.0%) |
| $5,000 to $9,999 | 0 (0.0%) | 0 (0.0%) |
| $10,000 to $14,999 | 14 (2.5%) | 36 (46.2%) |
| $15,000 to $19,999 | 19 (3.4%) | 0 (0.0%) |
| $20,000 to $24,999 | 0 (0.0%) | 0 (0.0%) |
| $25,000 to $34,999 | 11 (2.0%) | 0 (0.0%) |
| $35,000 to $49,999 | 0 (0.0%) | 11 (14.1%) |
| $50,000 to $74,999 | 35 (6.3%) | 9 (11.5%) |
| $75,000 to $99,999 | 4 (0.7%) | 0 (0.0%) |
| $100,000 to $149,999 | 83 (15.0%) | 6 (7.7%) |
| $150,000 or more | 387 (70.0%) | 16 (20.5%) |
| Total | 553 (100.0%) | 78 (100.0%) |
Monthly Housing Cost Tiers in Stafford
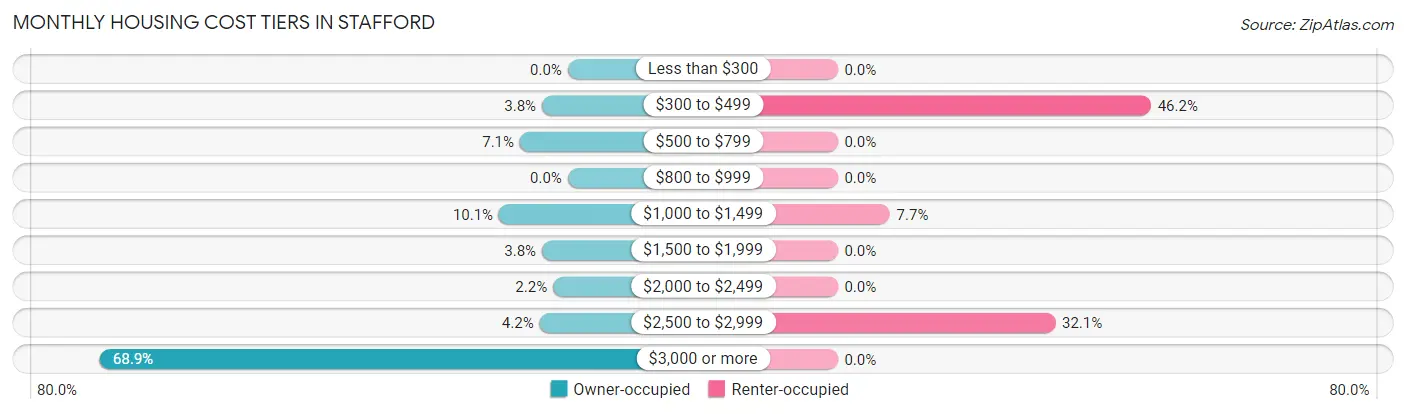
| Monthly Cost | Owner-occupied | Renter-occupied |
| Less than $300 | 0 (0.0%) | 0 (0.0%) |
| $300 to $499 | 21 (3.8%) | 36 (46.2%) |
| $500 to $799 | 39 (7.0%) | 0 (0.0%) |
| $800 to $999 | 0 (0.0%) | 0 (0.0%) |
| $1,000 to $1,499 | 56 (10.1%) | 6 (7.7%) |
| $1,500 to $1,999 | 21 (3.8%) | 0 (0.0%) |
| $2,000 to $2,499 | 12 (2.2%) | 0 (0.0%) |
| $2,500 to $2,999 | 23 (4.2%) | 25 (32.1%) |
| $3,000 or more | 381 (68.9%) | 0 (0.0%) |
| Total | 553 (100.0%) | 78 (100.0%) |
Physical Housing Characteristics in Stafford
Housing Structures in Stafford
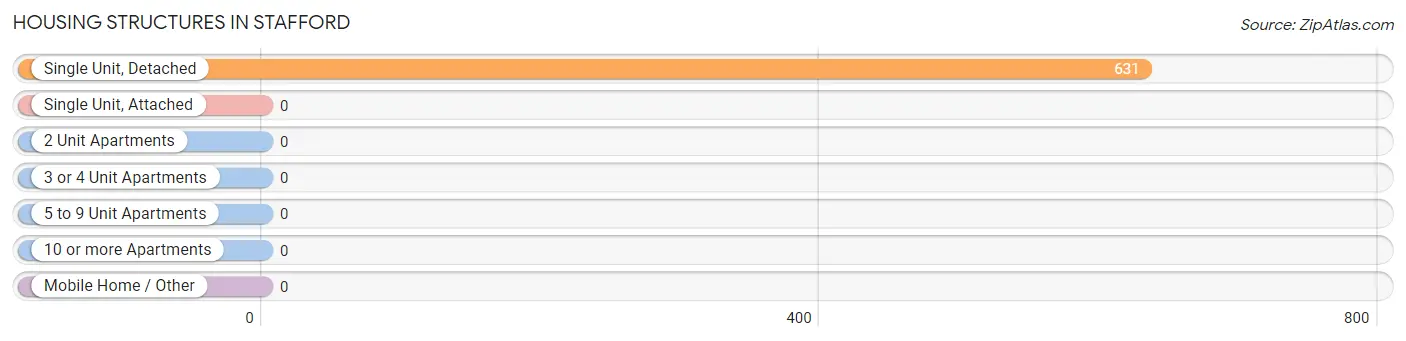
| Structure Type | # Housing Units | % Housing Units |
| Single Unit, Detached | 631 | 100.0% |
| Single Unit, Attached | 0 | 0.0% |
| 2 Unit Apartments | 0 | 0.0% |
| 3 or 4 Unit Apartments | 0 | 0.0% |
| 5 to 9 Unit Apartments | 0 | 0.0% |
| 10 or more Apartments | 0 | 0.0% |
| Mobile Home / Other | 0 | 0.0% |
| Total | 631 | 100.0% |
Housing Structures by Occupancy in Stafford
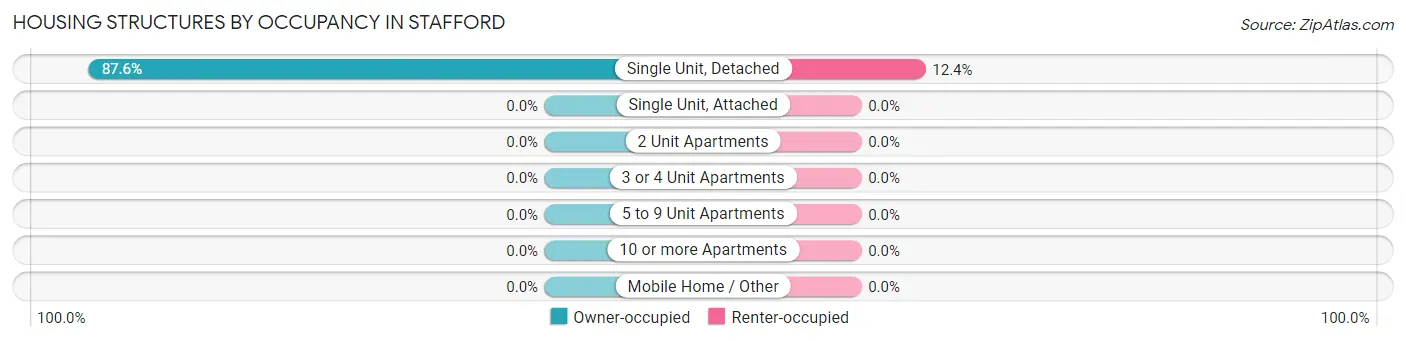
| Structure Type | Owner-occupied | Renter-occupied |
| Single Unit, Detached | 553 (87.6%) | 78 (12.4%) |
| Single Unit, Attached | 0 (0.0%) | 0 (0.0%) |
| 2 Unit Apartments | 0 (0.0%) | 0 (0.0%) |
| 3 or 4 Unit Apartments | 0 (0.0%) | 0 (0.0%) |
| 5 to 9 Unit Apartments | 0 (0.0%) | 0 (0.0%) |
| 10 or more Apartments | 0 (0.0%) | 0 (0.0%) |
| Mobile Home / Other | 0 (0.0%) | 0 (0.0%) |
| Total | 553 (87.6%) | 78 (12.4%) |
Housing Structures by Number of Rooms in Stafford
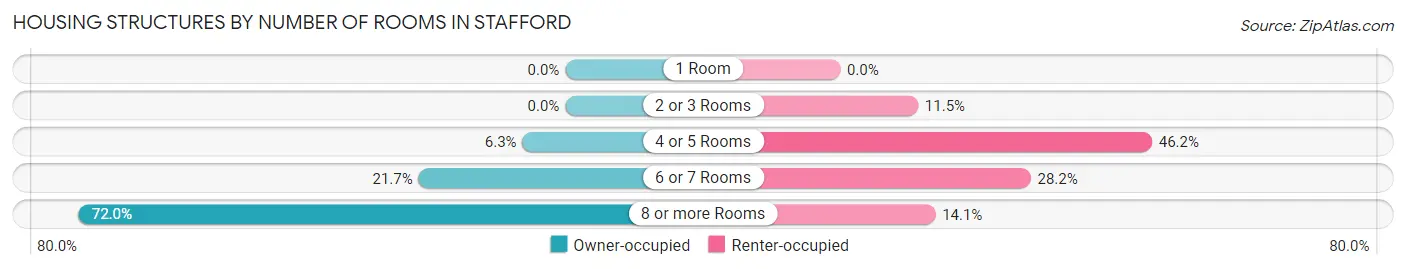
| Number of Rooms | Owner-occupied | Renter-occupied |
| 1 Room | 0 (0.0%) | 0 (0.0%) |
| 2 or 3 Rooms | 0 (0.0%) | 9 (11.5%) |
| 4 or 5 Rooms | 35 (6.3%) | 36 (46.2%) |
| 6 or 7 Rooms | 120 (21.7%) | 22 (28.2%) |
| 8 or more Rooms | 398 (72.0%) | 11 (14.1%) |
| Total | 553 (100.0%) | 78 (100.0%) |
Housing Structure by Heating Type in Stafford
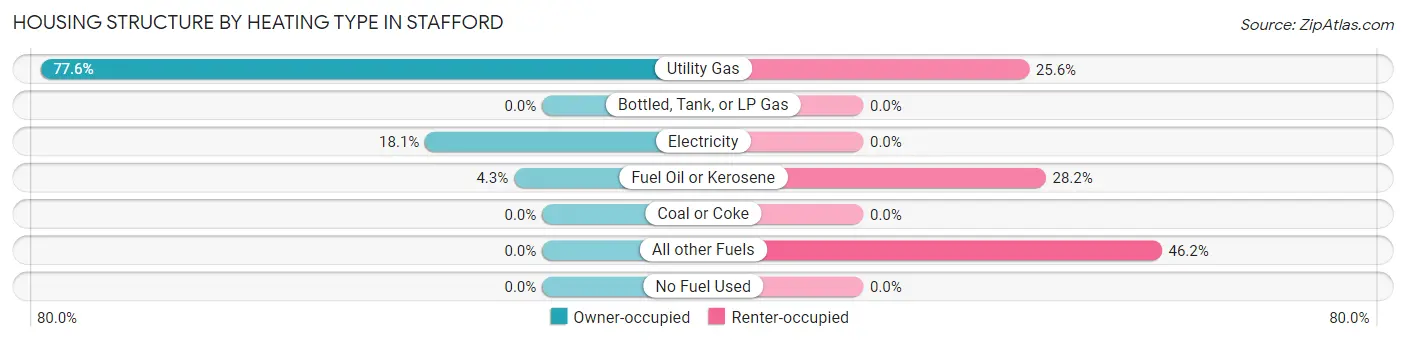
| Heating Type | Owner-occupied | Renter-occupied |
| Utility Gas | 429 (77.6%) | 20 (25.6%) |
| Bottled, Tank, or LP Gas | 0 (0.0%) | 0 (0.0%) |
| Electricity | 100 (18.1%) | 0 (0.0%) |
| Fuel Oil or Kerosene | 24 (4.3%) | 22 (28.2%) |
| Coal or Coke | 0 (0.0%) | 0 (0.0%) |
| All other Fuels | 0 (0.0%) | 36 (46.2%) |
| No Fuel Used | 0 (0.0%) | 0 (0.0%) |
| Total | 553 (100.0%) | 78 (100.0%) |
Household Vehicle Usage in Stafford
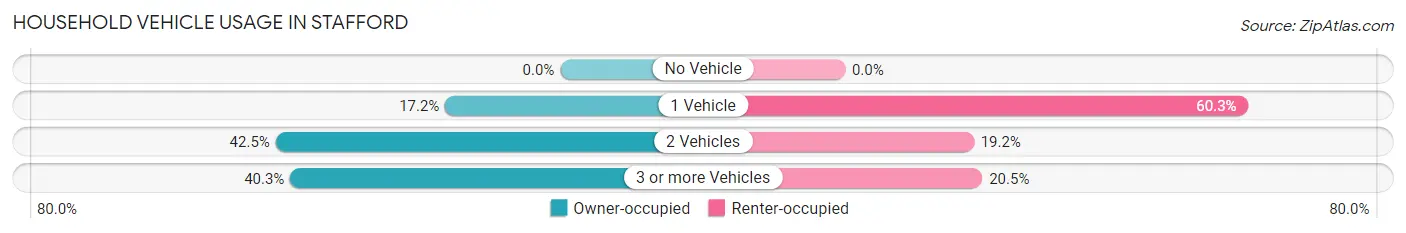
| Vehicles per Household | Owner-occupied | Renter-occupied |
| No Vehicle | 0 (0.0%) | 0 (0.0%) |
| 1 Vehicle | 95 (17.2%) | 47 (60.3%) |
| 2 Vehicles | 235 (42.5%) | 15 (19.2%) |
| 3 or more Vehicles | 223 (40.3%) | 16 (20.5%) |
| Total | 553 (100.0%) | 78 (100.0%) |
Real Estate & Mortgages in Stafford
Real Estate and Mortgage Overview in Stafford
| Characteristic | Without Mortgage | With Mortgage |
| Housing Units | 105 | 448 |
| Median Property Value | $701,900 | $1,182,200 |
| Median Household Income | $205,625 | $321 |
| Monthly Housing Costs | $764 | $381 |
| Real Estate Taxes | - | - |
Property Value by Mortgage Status in Stafford
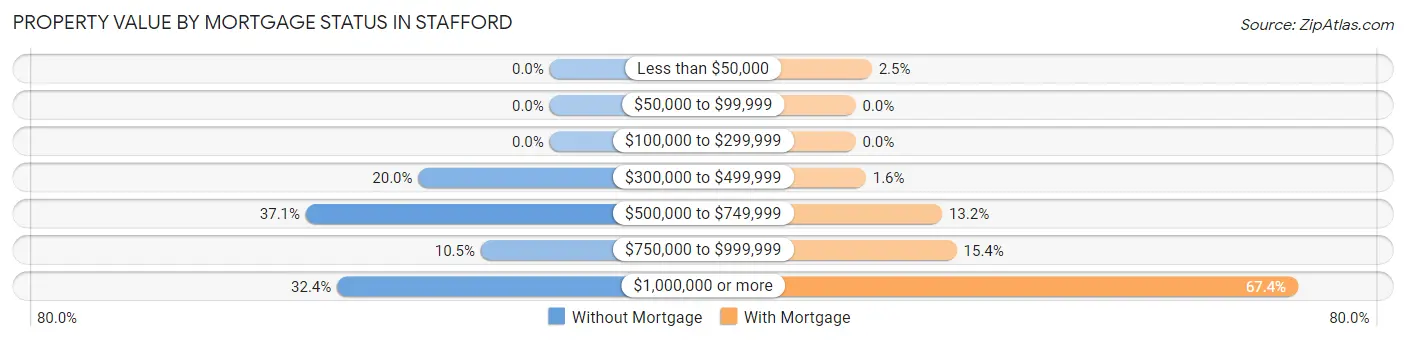
| Property Value | Without Mortgage | With Mortgage |
| Less than $50,000 | 0 (0.0%) | 11 (2.5%) |
| $50,000 to $99,999 | 0 (0.0%) | 0 (0.0%) |
| $100,000 to $299,999 | 0 (0.0%) | 0 (0.0%) |
| $300,000 to $499,999 | 21 (20.0%) | 7 (1.6%) |
| $500,000 to $749,999 | 39 (37.1%) | 59 (13.2%) |
| $750,000 to $999,999 | 11 (10.5%) | 69 (15.4%) |
| $1,000,000 or more | 34 (32.4%) | 302 (67.4%) |
| Total | 105 (100.0%) | 448 (100.0%) |
Household Income by Mortgage Status in Stafford
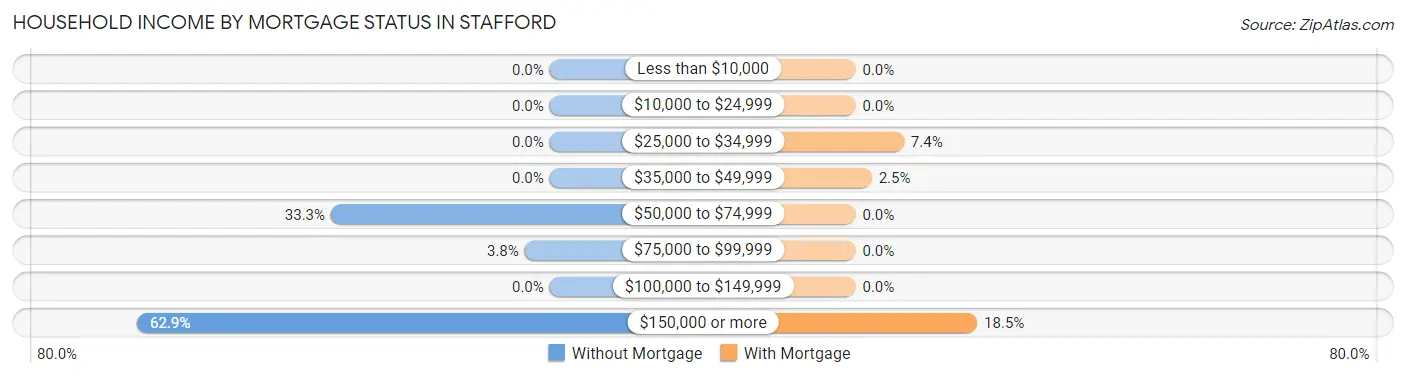
| Household Income | Without Mortgage | With Mortgage |
| Less than $10,000 | 0 (0.0%) | 0 (0.0%) |
| $10,000 to $24,999 | 0 (0.0%) | 0 (0.0%) |
| $25,000 to $34,999 | 0 (0.0%) | 33 (7.4%) |
| $35,000 to $49,999 | 0 (0.0%) | 11 (2.5%) |
| $50,000 to $74,999 | 35 (33.3%) | 0 (0.0%) |
| $75,000 to $99,999 | 4 (3.8%) | 0 (0.0%) |
| $100,000 to $149,999 | 0 (0.0%) | 0 (0.0%) |
| $150,000 or more | 66 (62.9%) | 83 (18.5%) |
| Total | 105 (100.0%) | 448 (100.0%) |
Property Value to Household Income Ratio in Stafford
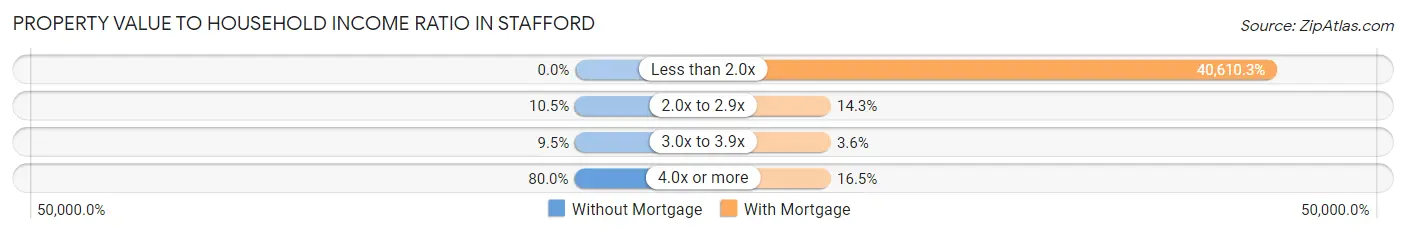
| Value-to-Income Ratio | Without Mortgage | With Mortgage |
| Less than 2.0x | 0 (0.0%) | 181,934 (40,610.3%) |
| 2.0x to 2.9x | 11 (10.5%) | 64 (14.3%) |
| 3.0x to 3.9x | 10 (9.5%) | 16 (3.6%) |
| 4.0x or more | 84 (80.0%) | 74 (16.5%) |
| Total | 105 (100.0%) | 448 (100.0%) |
Real Estate Taxes by Mortgage Status in Stafford
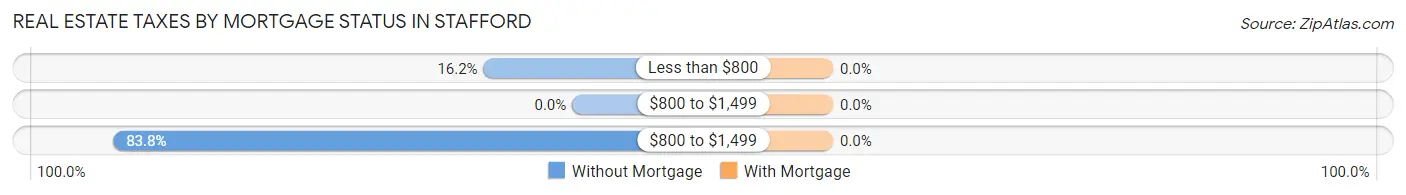
| Property Taxes | Without Mortgage | With Mortgage |
| Less than $800 | 17 (16.2%) | 0 (0.0%) |
| $800 to $1,499 | 0 (0.0%) | 0 (0.0%) |
| $800 to $1,499 | 88 (83.8%) | 0 (0.0%) |
| Total | 105 (100.0%) | 448 (100.0%) |
Health & Disability in Stafford
Health Insurance Coverage by Age in Stafford
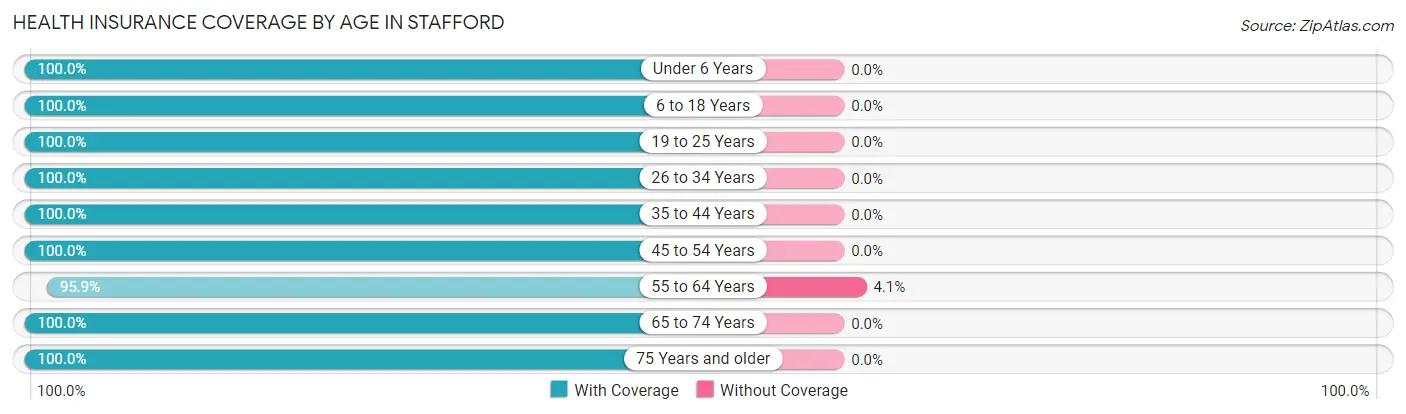
| Age Bracket | With Coverage | Without Coverage |
| Under 6 Years | 80 (100.0%) | 0 (0.0%) |
| 6 to 18 Years | 396 (100.0%) | 0 (0.0%) |
| 19 to 25 Years | 26 (100.0%) | 0 (0.0%) |
| 26 to 34 Years | 37 (100.0%) | 0 (0.0%) |
| 35 to 44 Years | 155 (100.0%) | 0 (0.0%) |
| 45 to 54 Years | 263 (100.0%) | 0 (0.0%) |
| 55 to 64 Years | 255 (95.9%) | 11 (4.1%) |
| 65 to 74 Years | 176 (100.0%) | 0 (0.0%) |
| 75 Years and older | 168 (100.0%) | 0 (0.0%) |
| Total | 1,556 (99.3%) | 11 (0.7%) |
Health Insurance Coverage by Citizenship Status in Stafford
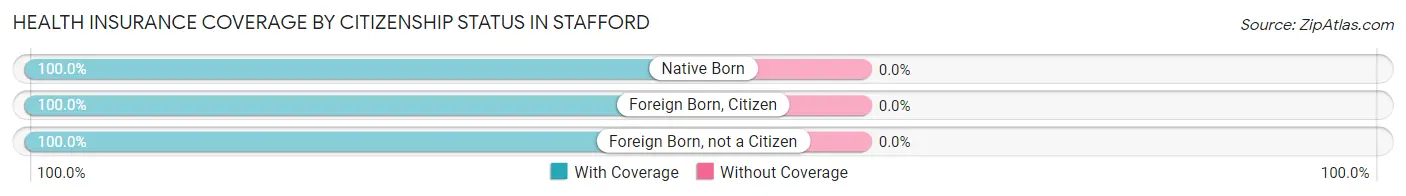
| Citizenship Status | With Coverage | Without Coverage |
| Native Born | 80 (100.0%) | 0 (0.0%) |
| Foreign Born, Citizen | 396 (100.0%) | 0 (0.0%) |
| Foreign Born, not a Citizen | 26 (100.0%) | 0 (0.0%) |
Health Insurance Coverage by Household Income in Stafford
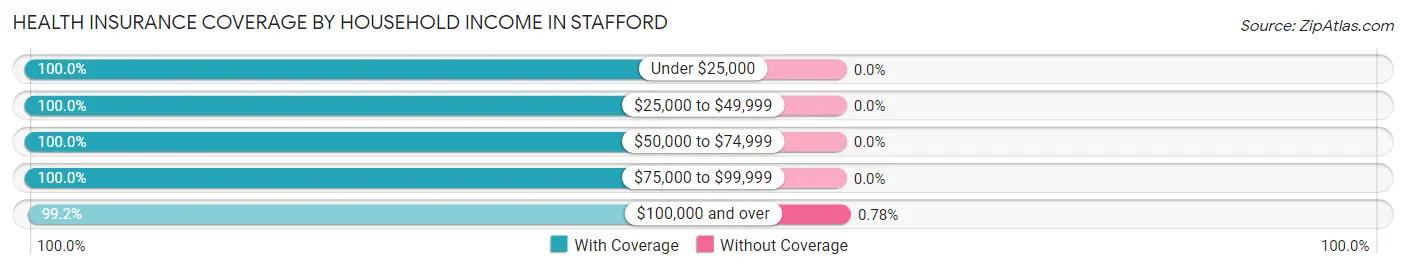
| Household Income | With Coverage | Without Coverage |
| Under $25,000 | 84 (100.0%) | 0 (0.0%) |
| $25,000 to $49,999 | 22 (100.0%) | 0 (0.0%) |
| $50,000 to $74,999 | 44 (100.0%) | 0 (0.0%) |
| $75,000 to $99,999 | 13 (100.0%) | 0 (0.0%) |
| $100,000 and over | 1,393 (99.2%) | 11 (0.8%) |
Public vs Private Health Insurance Coverage by Age in Stafford
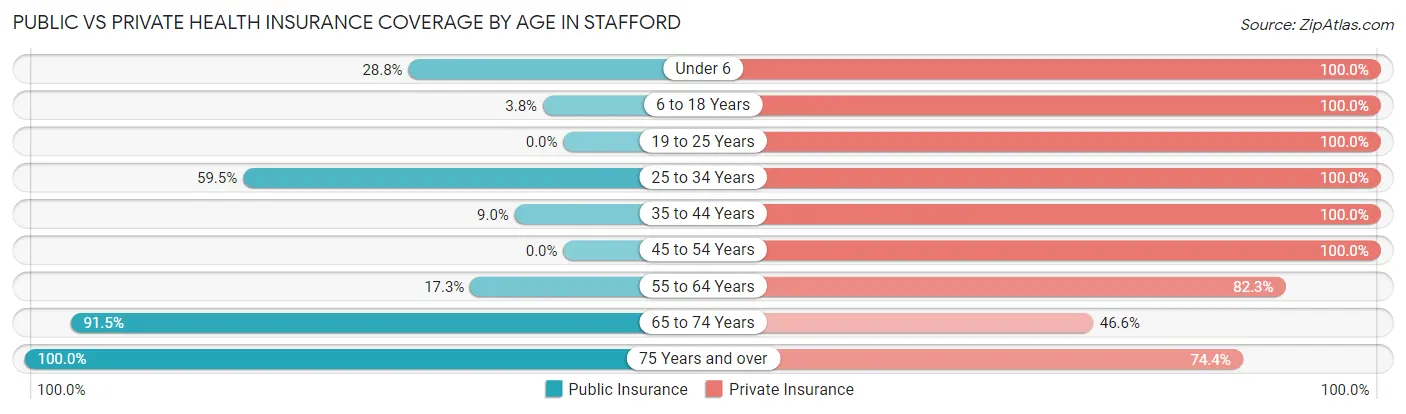
| Age Bracket | Public Insurance | Private Insurance |
| Under 6 | 23 (28.7%) | 80 (100.0%) |
| 6 to 18 Years | 15 (3.8%) | 396 (100.0%) |
| 19 to 25 Years | 0 (0.0%) | 26 (100.0%) |
| 25 to 34 Years | 22 (59.5%) | 37 (100.0%) |
| 35 to 44 Years | 14 (9.0%) | 155 (100.0%) |
| 45 to 54 Years | 0 (0.0%) | 263 (100.0%) |
| 55 to 64 Years | 46 (17.3%) | 219 (82.3%) |
| 65 to 74 Years | 161 (91.5%) | 82 (46.6%) |
| 75 Years and over | 168 (100.0%) | 125 (74.4%) |
| Total | 449 (28.6%) | 1,383 (88.3%) |
Disability Status by Sex by Age in Stafford
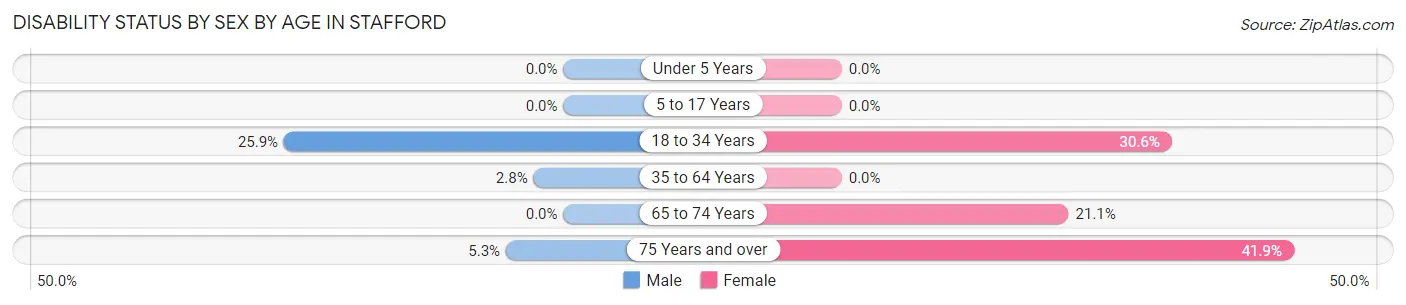
| Age Bracket | Male | Female |
| Under 5 Years | 0 (0.0%) | 0 (0.0%) |
| 5 to 17 Years | 0 (0.0%) | 0 (0.0%) |
| 18 to 34 Years | 7 (25.9%) | 15 (30.6%) |
| 35 to 64 Years | 10 (2.8%) | 0 (0.0%) |
| 65 to 74 Years | 0 (0.0%) | 24 (21.0%) |
| 75 Years and over | 4 (5.3%) | 39 (41.9%) |
Disability Class by Sex by Age in Stafford
Disability Class: Hearing Difficulty
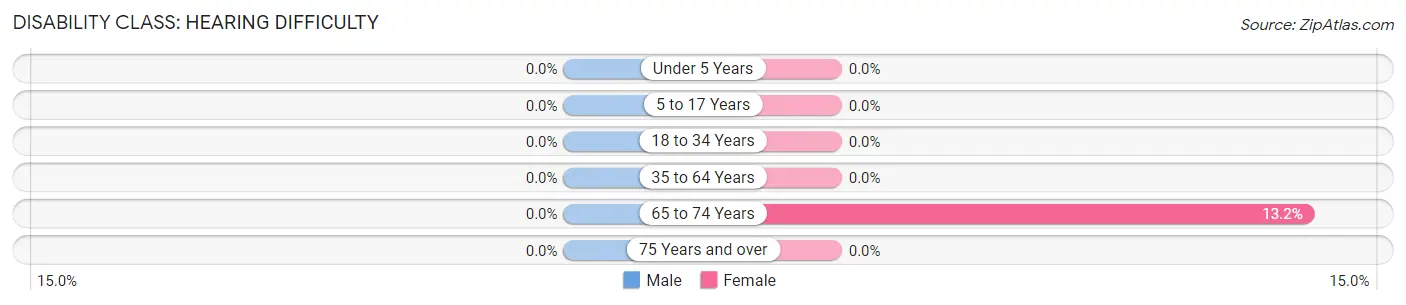
| Age Bracket | Male | Female |
| Under 5 Years | 0 (0.0%) | 0 (0.0%) |
| 5 to 17 Years | 0 (0.0%) | 0 (0.0%) |
| 18 to 34 Years | 0 (0.0%) | 0 (0.0%) |
| 35 to 64 Years | 0 (0.0%) | 0 (0.0%) |
| 65 to 74 Years | 0 (0.0%) | 15 (13.2%) |
| 75 Years and over | 0 (0.0%) | 0 (0.0%) |
Disability Class: Vision Difficulty
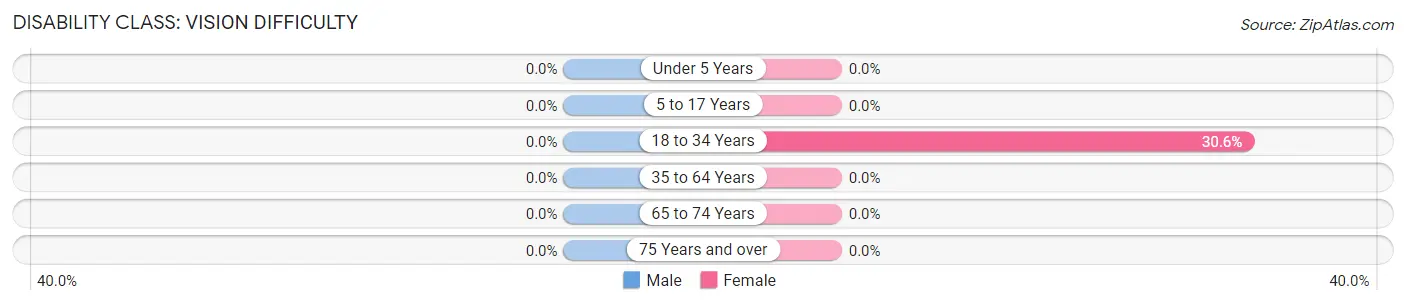
| Age Bracket | Male | Female |
| Under 5 Years | 0 (0.0%) | 0 (0.0%) |
| 5 to 17 Years | 0 (0.0%) | 0 (0.0%) |
| 18 to 34 Years | 0 (0.0%) | 15 (30.6%) |
| 35 to 64 Years | 0 (0.0%) | 0 (0.0%) |
| 65 to 74 Years | 0 (0.0%) | 0 (0.0%) |
| 75 Years and over | 0 (0.0%) | 0 (0.0%) |
Disability Class: Cognitive Difficulty
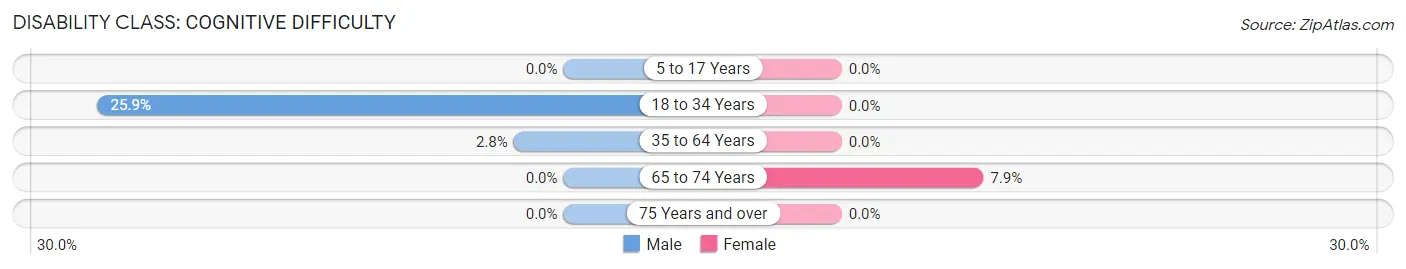
| Age Bracket | Male | Female |
| 5 to 17 Years | 0 (0.0%) | 0 (0.0%) |
| 18 to 34 Years | 7 (25.9%) | 0 (0.0%) |
| 35 to 64 Years | 10 (2.8%) | 0 (0.0%) |
| 65 to 74 Years | 0 (0.0%) | 9 (7.9%) |
| 75 Years and over | 0 (0.0%) | 0 (0.0%) |
Disability Class: Ambulatory Difficulty
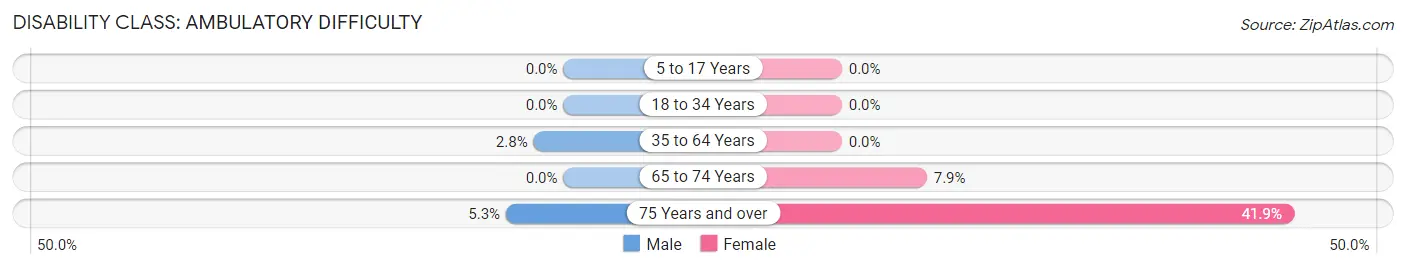
| Age Bracket | Male | Female |
| 5 to 17 Years | 0 (0.0%) | 0 (0.0%) |
| 18 to 34 Years | 0 (0.0%) | 0 (0.0%) |
| 35 to 64 Years | 10 (2.8%) | 0 (0.0%) |
| 65 to 74 Years | 0 (0.0%) | 9 (7.9%) |
| 75 Years and over | 4 (5.3%) | 39 (41.9%) |
Disability Class: Self-Care Difficulty
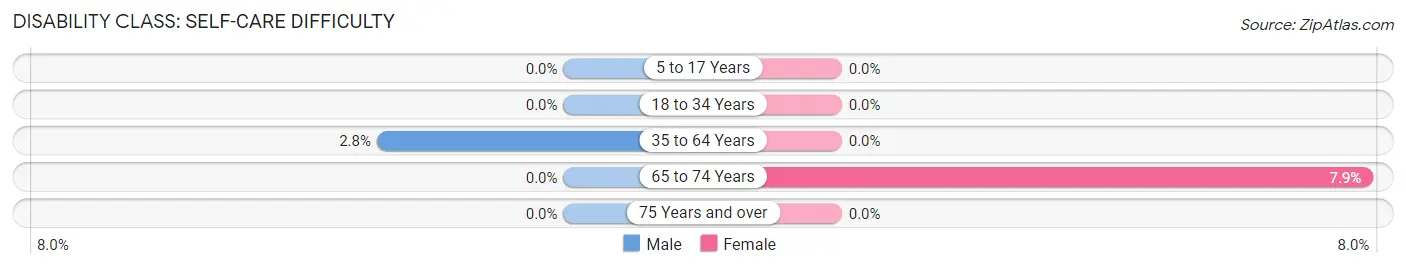
| Age Bracket | Male | Female |
| 5 to 17 Years | 0 (0.0%) | 0 (0.0%) |
| 18 to 34 Years | 0 (0.0%) | 0 (0.0%) |
| 35 to 64 Years | 10 (2.8%) | 0 (0.0%) |
| 65 to 74 Years | 0 (0.0%) | 9 (7.9%) |
| 75 Years and over | 0 (0.0%) | 0 (0.0%) |
Technology Access in Stafford
Computing Device Access in Stafford
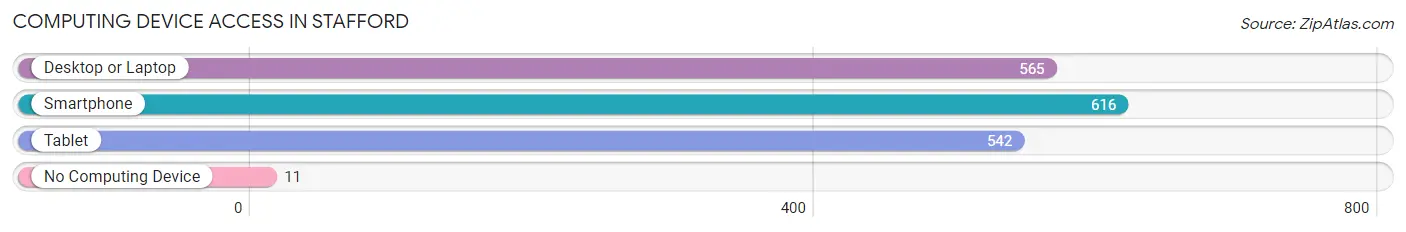
| Device Type | # Households | % Households |
| Desktop or Laptop | 565 | 89.5% |
| Smartphone | 616 | 97.6% |
| Tablet | 542 | 85.9% |
| No Computing Device | 11 | 1.7% |
| Total | 631 | 100.0% |
Internet Access in Stafford
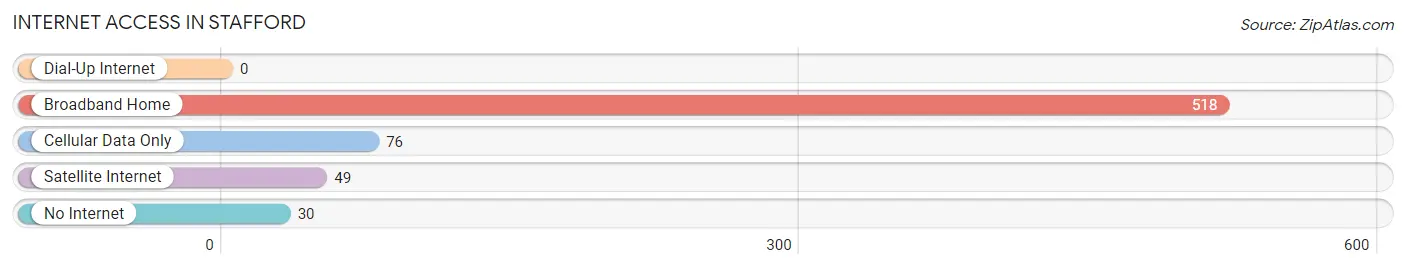
| Internet Type | # Households | % Households |
| Dial-Up Internet | 0 | 0.0% |
| Broadband Home | 518 | 82.1% |
| Cellular Data Only | 76 | 12.0% |
| Satellite Internet | 49 | 7.8% |
| No Internet | 30 | 4.8% |
| Total | 631 | 100.0% |
Stafford Summary
Stafford, Oregon is a small unincorporated community located in the Willamette Valley of Oregon. It is situated in the foothills of the Cascade Mountains, about 25 miles south of Portland. The population of Stafford is estimated to be around 1,000 people.
History
Stafford was first settled in the late 1800s by a group of German immigrants. The town was named after the Stafford family, who were among the first settlers. The town was originally a farming community, and the main crops grown were wheat, oats, and hay. In the early 1900s, the town began to grow and develop, and a post office was established in 1910.
In the 1920s, the town began to experience a period of growth and development. The first school was built in 1923, and the first church was built in 1925. The town also had a general store, a blacksmith shop, and a few other businesses.
In the 1940s, the town experienced a period of decline. The population decreased, and many of the businesses closed. In the 1950s, the town began to experience a period of revitalization. The population began to increase, and new businesses opened.
Geography
Stafford is located in the Willamette Valley of Oregon. It is situated in the foothills of the Cascade Mountains, about 25 miles south of Portland. The town is surrounded by rolling hills and farmland. The climate is mild and temperate, with warm summers and cool winters.
Economy
The economy of Stafford is largely based on agriculture. The main crops grown in the area are wheat, oats, and hay. There are also several small businesses in the town, including a general store, a blacksmith shop, and a few other businesses.
Demographics
The population of Stafford is estimated to be around 1,000 people. The town is predominantly white, with a small minority population. The median household income is around $50,000. The town has a low unemployment rate, and most of the residents are employed in the agricultural industry.
Conclusion
Stafford, Oregon is a small unincorporated community located in the Willamette Valley of Oregon. It is situated in the foothills of the Cascade Mountains, about 25 miles south of Portland. The population of Stafford is estimated to be around 1,000 people. The town is predominantly white, with a small minority population. The economy of Stafford is largely based on agriculture, and the main crops grown in the area are wheat, oats, and hay. There are also several small businesses in the town, including a general store, a blacksmith shop, and a few other businesses. The median household income is around $50,000, and the town has a low unemployment rate.
Common Questions
What is Per Capita Income in Stafford?
Per Capita income in Stafford is $86,206.
What is the Median Family Income in Stafford?
Median Family Income in Stafford is $228,043.
What is the Median Household income in Stafford?
Median Household Income in Stafford is $180,967.
What is Inequality or Gini Index in Stafford?
Inequality or Gini Index in Stafford is 0.42.
What is the Total Population of Stafford?
Total Population of Stafford is 1,567.
What is the Total Male Population of Stafford?
Total Male Population of Stafford is 763.
What is the Total Female Population of Stafford?
Total Female Population of Stafford is 804.
What is the Ratio of Males per 100 Females in Stafford?
There are 94.90 Males per 100 Females in Stafford.
What is the Ratio of Females per 100 Males in Stafford?
There are 105.37 Females per 100 Males in Stafford.
What is the Median Population Age in Stafford?
Median Population Age in Stafford is 46.6 Years.
What is the Average Family Size in Stafford
Average Family Size in Stafford is 3.1 People.
What is the Average Household Size in Stafford
Average Household Size in Stafford is 2.5 People.
How Large is the Labor Force in Stafford?
There are 567 People in the Labor Forcein in Stafford.
What is the Percentage of People in the Labor Force in Stafford?
48.8% of People are in the Labor Force in Stafford.