Ophir, CO Map & Demographics
Ophir Map
Ophir Overview
$53,064
PER CAPITA INCOME
$126,607
AVG FAMILY INCOME
$121,667
AVG HOUSEHOLD INCOME
42.9%
WAGE / INCOME GAP [ % ]
57.1¢/ $1
WAGE / INCOME GAP [ $ ]
0.26
INEQUALITY / GINI INDEX
180
TOTAL POPULATION
90
MALE POPULATION
90
FEMALE POPULATION
100.00
MALES / 100 FEMALES
100.00
FEMALES / 100 MALES
35.9
MEDIAN AGE
2.8
AVG FAMILY SIZE
2.7
AVG HOUSEHOLD SIZE
134
LABOR FORCE [ PEOPLE ]
95.0%
PERCENT IN LABOR FORCE
6.0%
UNEMPLOYMENT RATE
Ophir Zip Codes
Ophir Area Codes
Income in Ophir
Income Overview in Ophir
Per Capita Income in Ophir is $53,064, while median incomes of families and households are $126,607 and $121,667 respectively.
| Characteristic | Number | Measure |
| Per Capita Income | 180 | $53,064 |
| Median Family Income | 47 | $126,607 |
| Mean Family Income | 47 | $159,151 |
| Median Household Income | 66 | $121,667 |
| Mean Household Income | 66 | $137,273 |
| Income Deficit | 47 | $0 |
| Wage / Income Gap (%) | 180 | 42.90% |
| Wage / Income Gap ($) | 180 | 57.10¢ per $1 |
| Gini / Inequality Index | 180 | 0.26 |
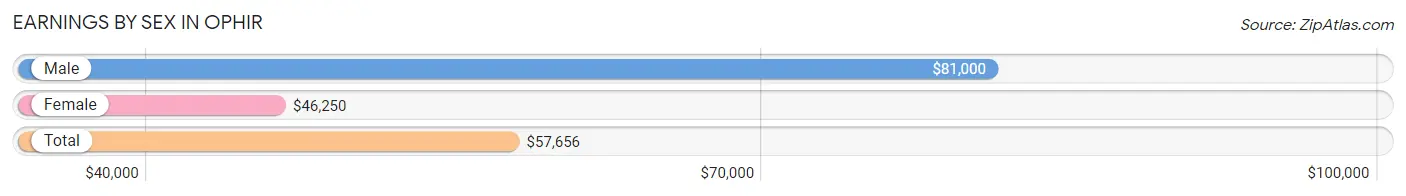
Earnings by Sex in Ophir
Average Earnings in Ophir are $57,656, $81,000 for men and $46,250 for women, a difference of 42.9%.
| Sex | Number | Average Earnings |
| Male | 74 (54.8%) | $81,000 |
| Female | 61 (45.2%) | $46,250 |
| Total | 135 (100.0%) | $57,656 |
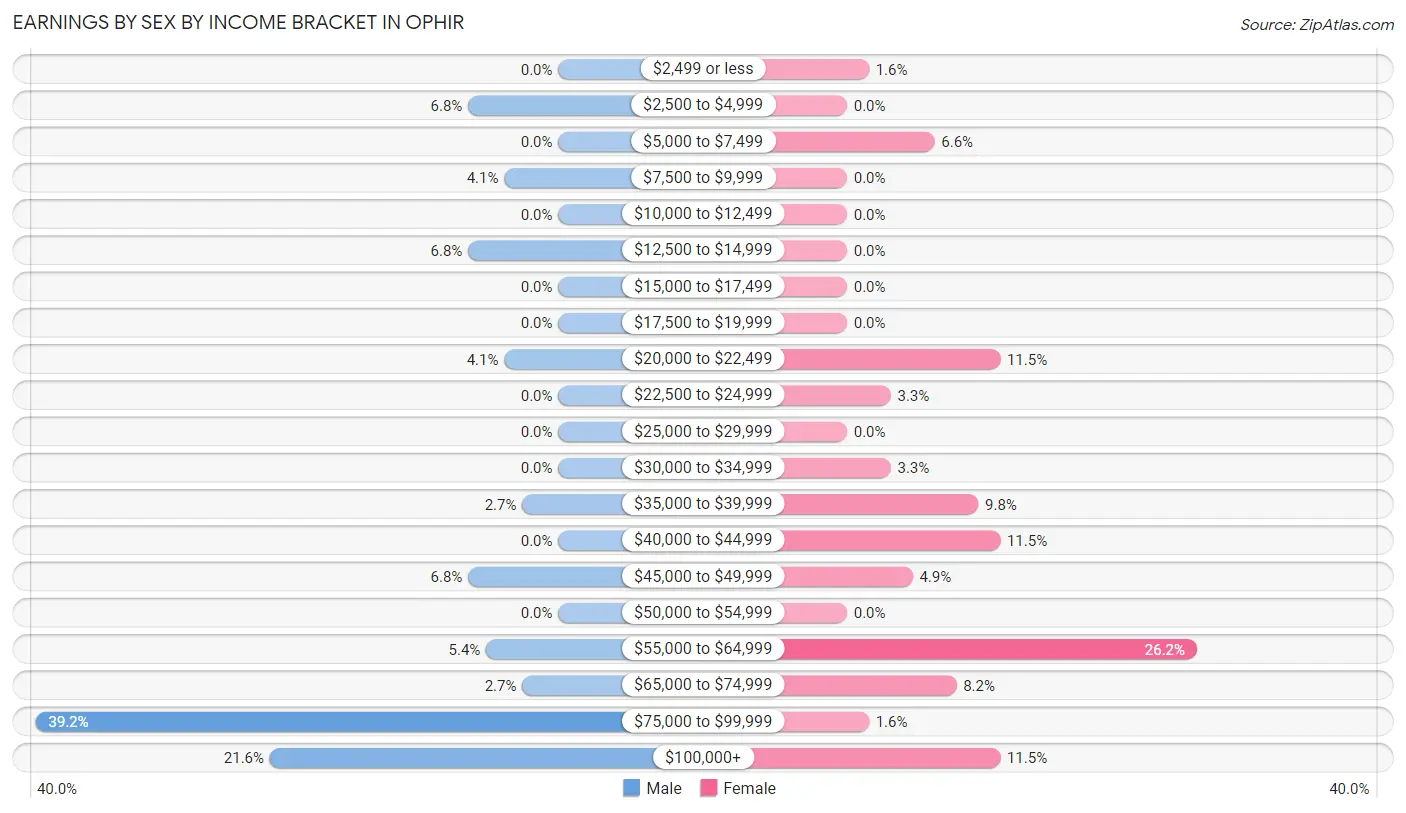
Earnings by Sex by Income Bracket in Ophir
The most common earnings brackets in Ophir are $75,000 to $99,999 for men (29 | 39.2%) and $55,000 to $64,999 for women (16 | 26.2%).
| Income | Male | Female |
| $2,499 or less | 0 (0.0%) | 1 (1.6%) |
| $2,500 to $4,999 | 5 (6.8%) | 0 (0.0%) |
| $5,000 to $7,499 | 0 (0.0%) | 4 (6.6%) |
| $7,500 to $9,999 | 3 (4.1%) | 0 (0.0%) |
| $10,000 to $12,499 | 0 (0.0%) | 0 (0.0%) |
| $12,500 to $14,999 | 5 (6.8%) | 0 (0.0%) |
| $15,000 to $17,499 | 0 (0.0%) | 0 (0.0%) |
| $17,500 to $19,999 | 0 (0.0%) | 0 (0.0%) |
| $20,000 to $22,499 | 3 (4.1%) | 7 (11.5%) |
| $22,500 to $24,999 | 0 (0.0%) | 2 (3.3%) |
| $25,000 to $29,999 | 0 (0.0%) | 0 (0.0%) |
| $30,000 to $34,999 | 0 (0.0%) | 2 (3.3%) |
| $35,000 to $39,999 | 2 (2.7%) | 6 (9.8%) |
| $40,000 to $44,999 | 0 (0.0%) | 7 (11.5%) |
| $45,000 to $49,999 | 5 (6.8%) | 3 (4.9%) |
| $50,000 to $54,999 | 0 (0.0%) | 0 (0.0%) |
| $55,000 to $64,999 | 4 (5.4%) | 16 (26.2%) |
| $65,000 to $74,999 | 2 (2.7%) | 5 (8.2%) |
| $75,000 to $99,999 | 29 (39.2%) | 1 (1.6%) |
| $100,000+ | 16 (21.6%) | 7 (11.5%) |
| Total | 74 (100.0%) | 61 (100.0%) |
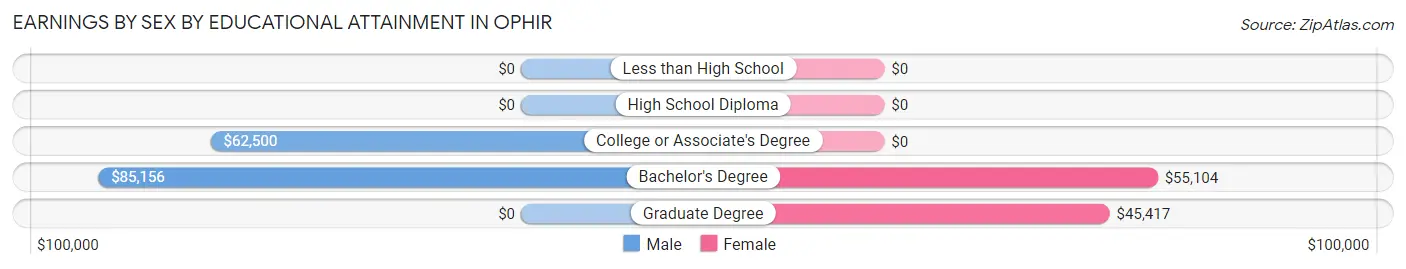
Earnings by Sex by Educational Attainment in Ophir
Average earnings in Ophir are $81,000 for men and $46,667 for women, a difference of 42.4%. Men with an educational attainment of bachelor's degree enjoy the highest average annual earnings of $85,156, while those with college or associate's degree education earn the least with $62,500. Women with an educational attainment of bachelor's degree earn the most with the average annual earnings of $55,104, while those with graduate degree education have the smallest earnings of $45,417.
| Educational Attainment | Male Income | Female Income |
| Less than High School | - | - |
| High School Diploma | - | - |
| College or Associate's Degree | $62,500 | $0 |
| Bachelor's Degree | $85,156 | $55,104 |
| Graduate Degree | - | - |
| Total | $81,000 | $46,667 |
Family Income in Ophir
Family Income Brackets in Ophir
According to the Ophir family income data, there are 34 families falling into the $100,000 to $149,999 income range, which is the most common income bracket and makes up 72.3% of all families.
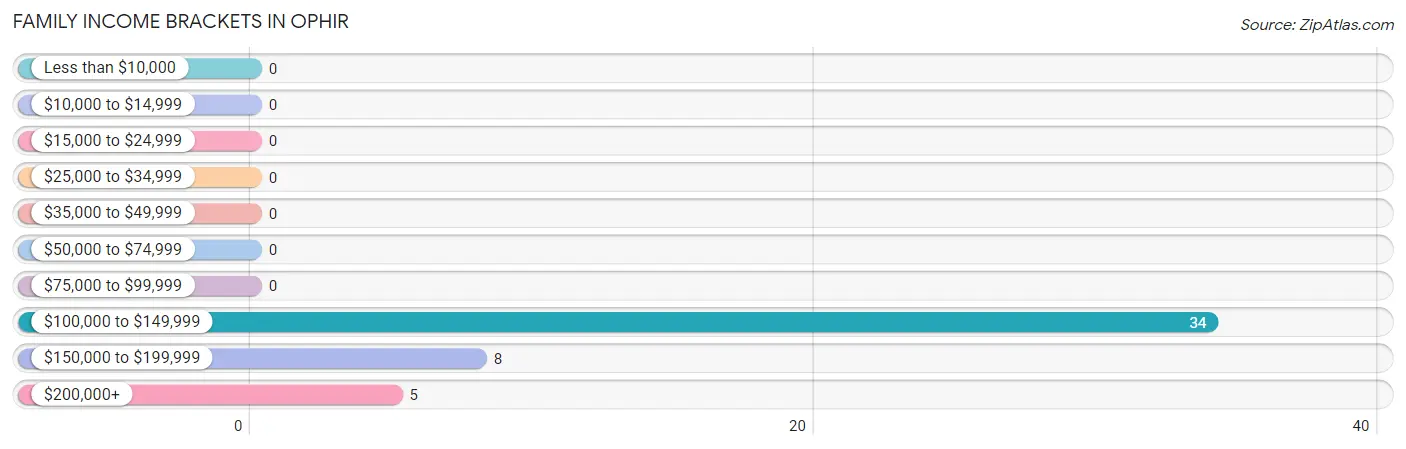
| Income Bracket | # Families | % Families |
| Less than $10,000 | 0 | 0.0% |
| $10,000 to $14,999 | 0 | 0.0% |
| $15,000 to $24,999 | 0 | 0.0% |
| $25,000 to $34,999 | 0 | 0.0% |
| $35,000 to $49,999 | 0 | 0.0% |
| $50,000 to $74,999 | 0 | 0.0% |
| $75,000 to $99,999 | 0 | 0.0% |
| $100,000 to $149,999 | 34 | 72.3% |
| $150,000 to $199,999 | 8 | 17.0% |
| $200,000+ | 5 | 10.6% |
Family Income by Famaliy Size in Ophir
2-person families (9 | 19.2%) account for the highest median family income in Ophir with $188,438 per family, while 2-person families (9 | 19.2%) have the highest median income of $94,219 per family member.
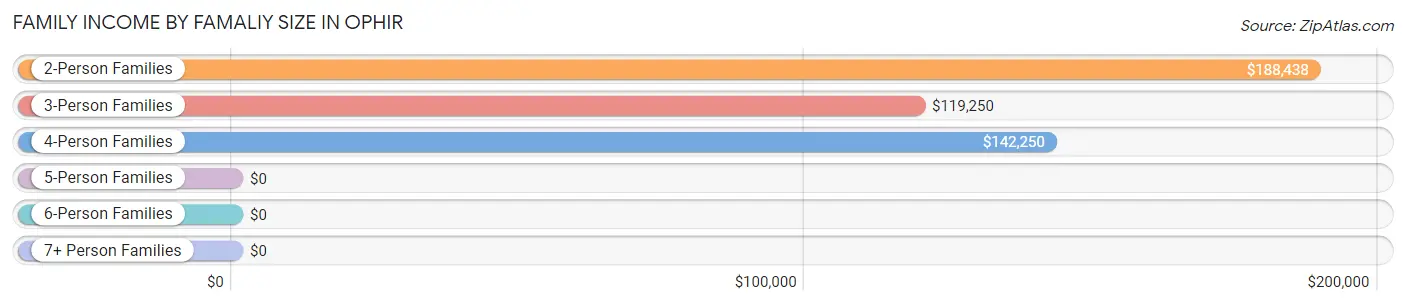
| Income Bracket | # Families | Median Income |
| 2-Person Families | 9 (19.2%) | $188,438 |
| 3-Person Families | 20 (42.5%) | $119,250 |
| 4-Person Families | 15 (31.9%) | $142,250 |
| 5-Person Families | 3 (6.4%) | $0 |
| 6-Person Families | 0 (0.0%) | $0 |
| 7+ Person Families | 0 (0.0%) | $0 |
| Total | 47 (100.0%) | $126,607 |
Family Income by Number of Earners in Ophir
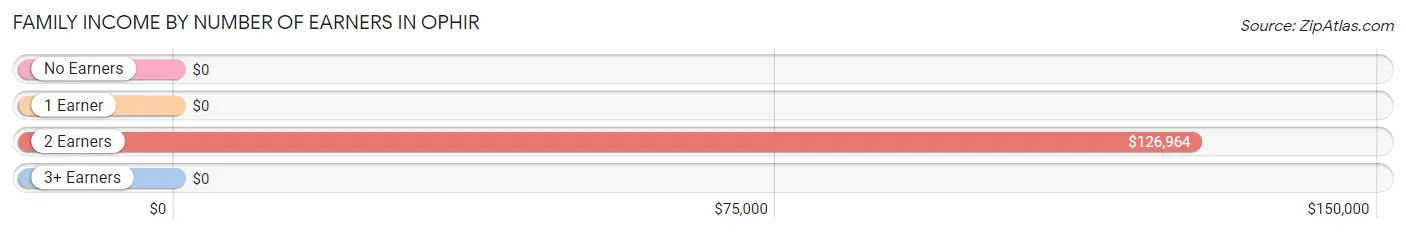
| Number of Earners | # Families | Median Income |
| No Earners | 0 (0.0%) | $0 |
| 1 Earner | 5 (10.6%) | $0 |
| 2 Earners | 39 (83.0%) | $126,964 |
| 3+ Earners | 3 (6.4%) | $0 |
| Total | 47 (100.0%) | $126,607 |
Household Income in Ophir
Household Income Brackets in Ophir
With 34 households falling in the category, the $100,000 to $149,999 income range is the most frequent in Ophir, accounting for 51.5% of all households.
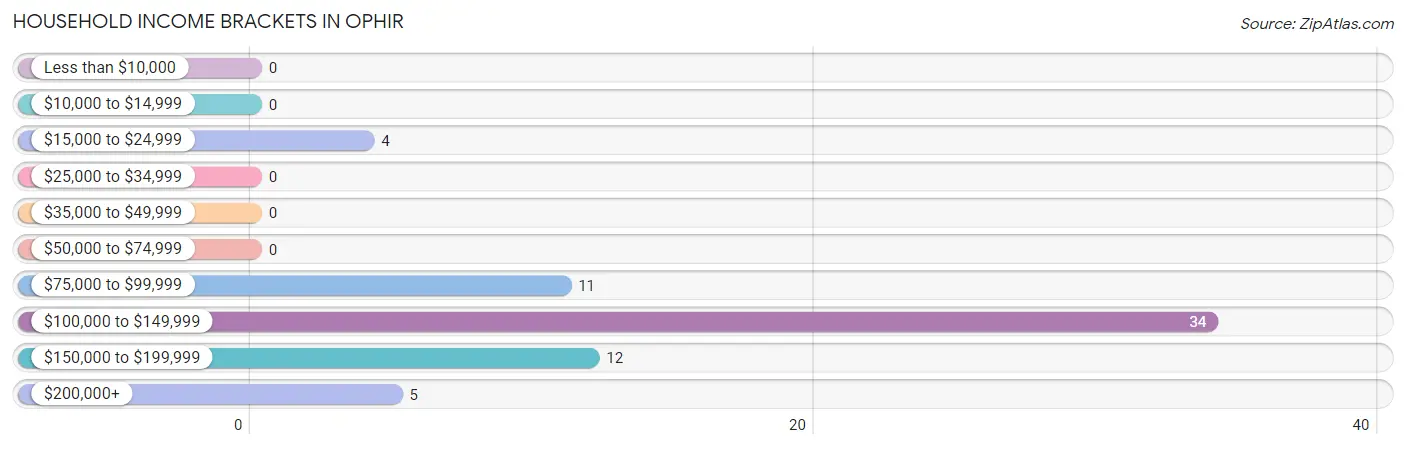
| Income Bracket | # Households | % Households |
| Less than $10,000 | 0 | 0.0% |
| $10,000 to $14,999 | 0 | 0.0% |
| $15,000 to $24,999 | 4 | 6.1% |
| $25,000 to $34,999 | 0 | 0.0% |
| $35,000 to $49,999 | 0 | 0.0% |
| $50,000 to $74,999 | 0 | 0.0% |
| $75,000 to $99,999 | 11 | 16.7% |
| $100,000 to $149,999 | 34 | 51.5% |
| $150,000 to $199,999 | 12 | 18.2% |
| $200,000+ | 5 | 7.6% |
Household Income by Householder Age in Ophir
The median household income in Ophir is $121,667, with the highest median household income of $140,250 found in the 45 to 64 years age bracket for the primary householder. A total of 37 households (56.1%) fall into this category.
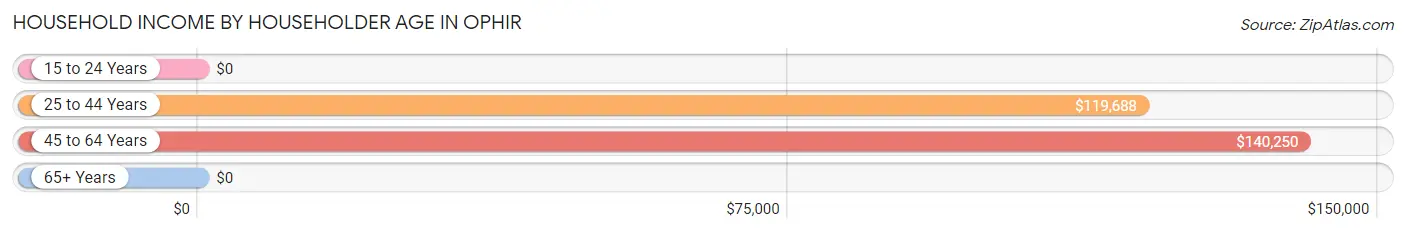
| Income Bracket | # Households | Median Income |
| 15 to 24 Years | 0 (0.0%) | $0 |
| 25 to 44 Years | 27 (40.9%) | $119,688 |
| 45 to 64 Years | 37 (56.1%) | $140,250 |
| 65+ Years | 2 (3.0%) | $0 |
| Total | 66 (100.0%) | $121,667 |
Poverty in Ophir
Income Below Poverty by Sex and Age in Ophir
With 14.4% poverty level for males and 4.4% for females among the residents of Ophir, 25 to 34 year old males and 25 to 34 year old females are the most vulnerable to poverty, with 13 males (61.9%) and 4 females (21.0%) in their respective age groups living below the poverty level.
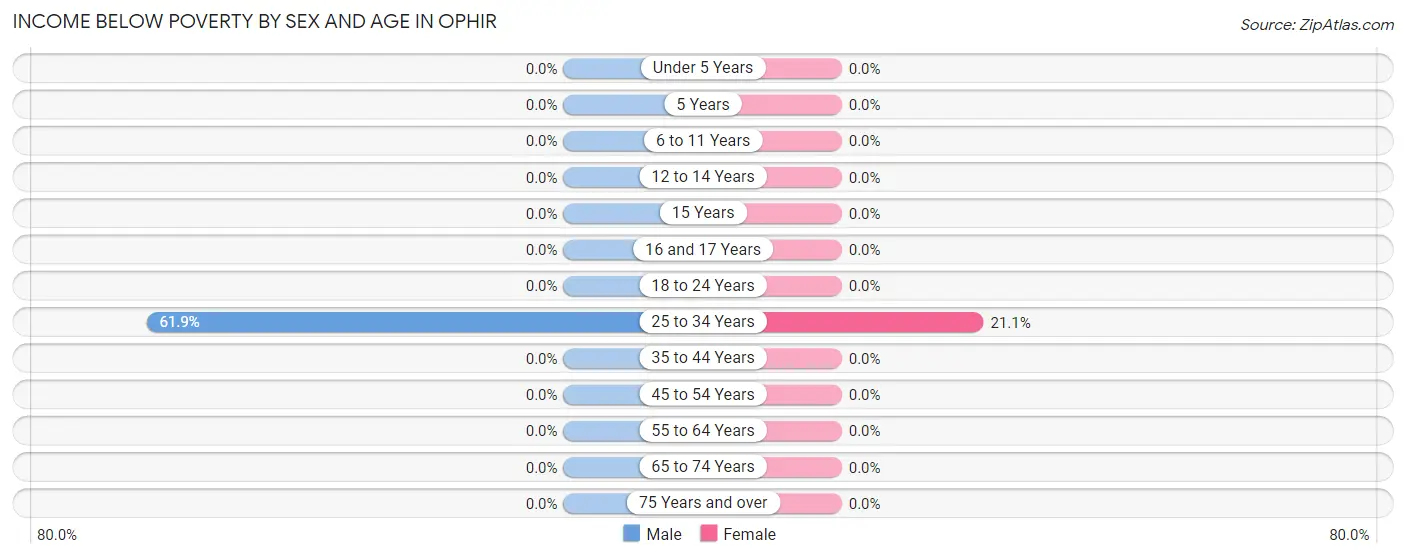
| Age Bracket | Male | Female |
| Under 5 Years | 0 (0.0%) | 0 (0.0%) |
| 5 Years | 0 (0.0%) | 0 (0.0%) |
| 6 to 11 Years | 0 (0.0%) | 0 (0.0%) |
| 12 to 14 Years | 0 (0.0%) | 0 (0.0%) |
| 15 Years | 0 (0.0%) | 0 (0.0%) |
| 16 and 17 Years | 0 (0.0%) | 0 (0.0%) |
| 18 to 24 Years | 0 (0.0%) | 0 (0.0%) |
| 25 to 34 Years | 13 (61.9%) | 4 (21.0%) |
| 35 to 44 Years | 0 (0.0%) | 0 (0.0%) |
| 45 to 54 Years | 0 (0.0%) | 0 (0.0%) |
| 55 to 64 Years | 0 (0.0%) | 0 (0.0%) |
| 65 to 74 Years | 0 (0.0%) | 0 (0.0%) |
| 75 Years and over | 0 (0.0%) | 0 (0.0%) |
| Total | 13 (14.4%) | 4 (4.4%) |
Income Above Poverty by Sex and Age in Ophir
According to the poverty statistics in Ophir, males aged under 5 years and females aged under 5 years are the age groups that are most secure financially, with 100.0% of males and 100.0% of females in these age groups living above the poverty line.
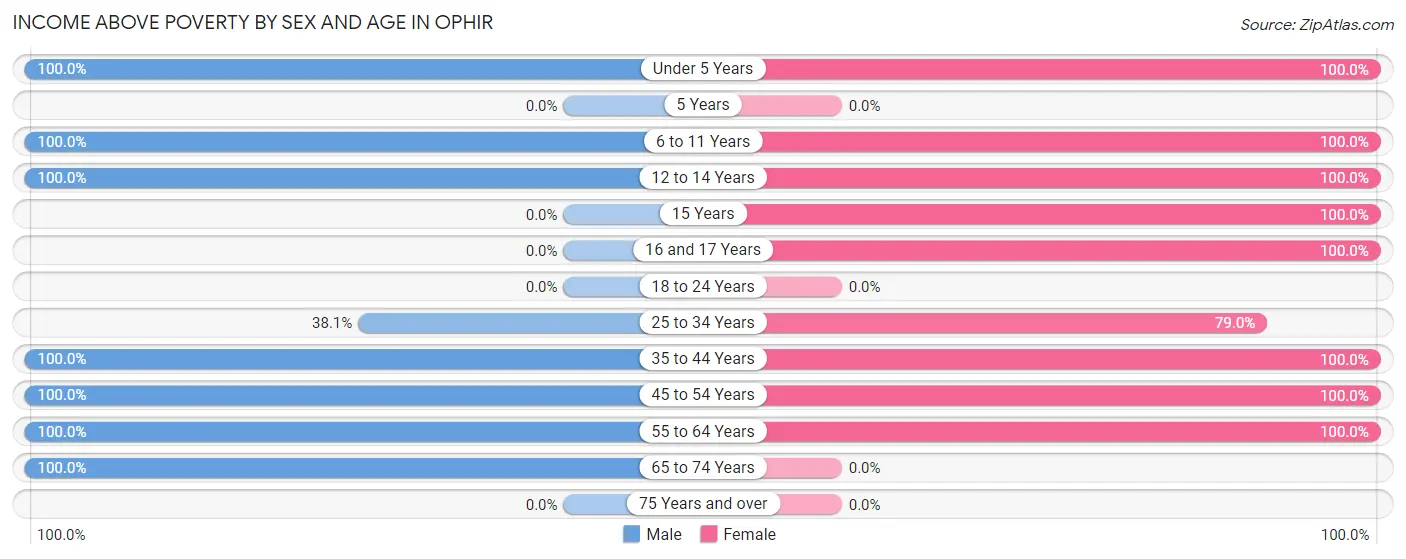
| Age Bracket | Male | Female |
| Under 5 Years | 3 (100.0%) | 13 (100.0%) |
| 5 Years | 0 (0.0%) | 0 (0.0%) |
| 6 to 11 Years | 3 (100.0%) | 5 (100.0%) |
| 12 to 14 Years | 8 (100.0%) | 5 (100.0%) |
| 15 Years | 0 (0.0%) | 2 (100.0%) |
| 16 and 17 Years | 0 (0.0%) | 5 (100.0%) |
| 18 to 24 Years | 0 (0.0%) | 0 (0.0%) |
| 25 to 34 Years | 8 (38.1%) | 15 (78.9%) |
| 35 to 44 Years | 12 (100.0%) | 15 (100.0%) |
| 45 to 54 Years | 32 (100.0%) | 24 (100.0%) |
| 55 to 64 Years | 9 (100.0%) | 2 (100.0%) |
| 65 to 74 Years | 2 (100.0%) | 0 (0.0%) |
| 75 Years and over | 0 (0.0%) | 0 (0.0%) |
| Total | 77 (85.6%) | 86 (95.6%) |
Income Below Poverty Among Married-Couple Families in Ophir
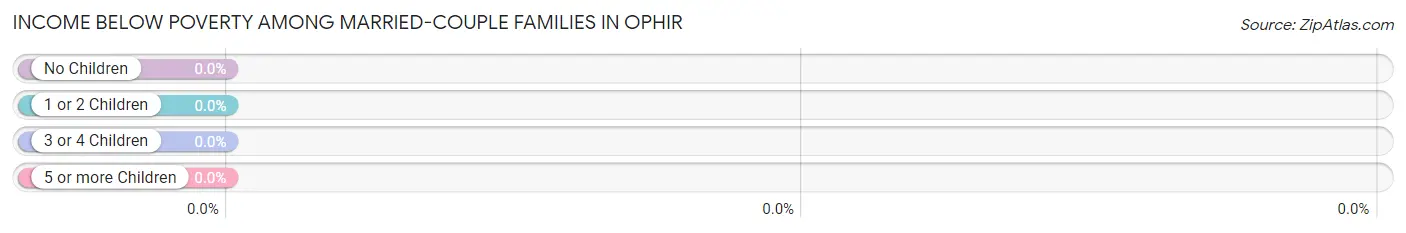
| Children | Above Poverty | Below Poverty |
| No Children | 6 (100.0%) | 0 (0.0%) |
| 1 or 2 Children | 35 (100.0%) | 0 (0.0%) |
| 3 or 4 Children | 3 (100.0%) | 0 (0.0%) |
| 5 or more Children | 0 (0.0%) | 0 (0.0%) |
| Total | 44 (100.0%) | 0 (0.0%) |
Income Below Poverty Among Single-Parent Households in Ophir
| Children | Single Father | Single Mother |
| No Children | 0 (0.0%) | 0 (0.0%) |
| 1 or 2 Children | 0 (0.0%) | 0 (0.0%) |
| 3 or 4 Children | 0 (0.0%) | 0 (0.0%) |
| 5 or more Children | 0 (0.0%) | 0 (0.0%) |
| Total | 0 (0.0%) | 0 (0.0%) |
Income Below Poverty Among Married-Couple vs Single-Parent Households in Ophir
| Children | Married-Couple Families | Single-Parent Households |
| No Children | 0 (0.0%) | 0 (0.0%) |
| 1 or 2 Children | 0 (0.0%) | 0 (0.0%) |
| 3 or 4 Children | 0 (0.0%) | 0 (0.0%) |
| 5 or more Children | 0 (0.0%) | 0 (0.0%) |
| Total | 0 (0.0%) | 0 (0.0%) |
Race in Ophir
The most populous races in Ophir are White / Caucasian (180 | 100.0%), and Hispanic or Latino (1 | 0.6%).
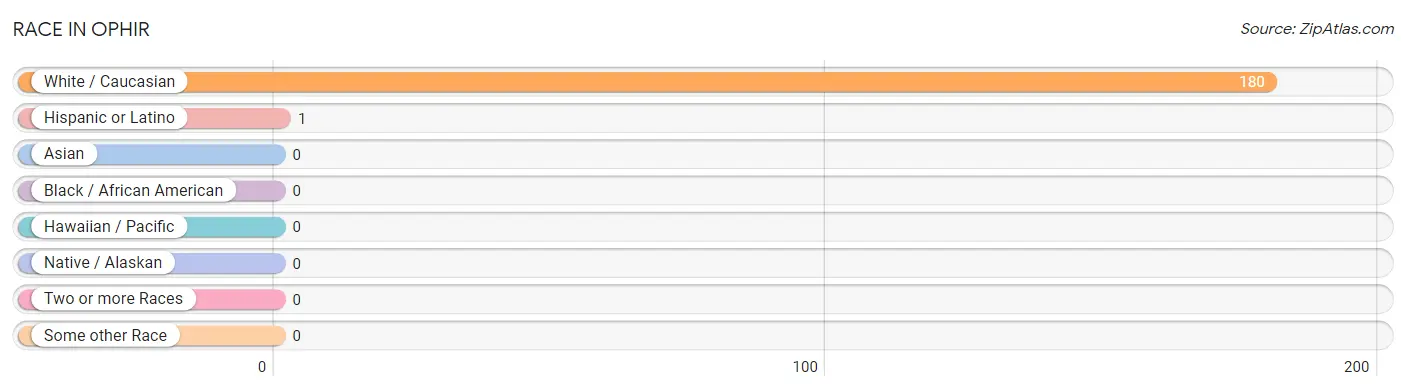
| Race | # Population | % Population |
| Asian | 0 | 0.0% |
| Black / African American | 0 | 0.0% |
| Hawaiian / Pacific | 0 | 0.0% |
| Hispanic or Latino | 1 | 0.6% |
| Native / Alaskan | 0 | 0.0% |
| White / Caucasian | 180 | 100.0% |
| Two or more Races | 0 | 0.0% |
| Some other Race | 0 | 0.0% |
| Total | 180 | 100.0% |
Ancestry in Ophir
The most populous ancestries reported in Ophir are German (39 | 21.7%), Irish (30 | 16.7%), European (23 | 12.8%), English (20 | 11.1%), and Scottish (14 | 7.8%), together accounting for 70.0% of all Ophir residents.
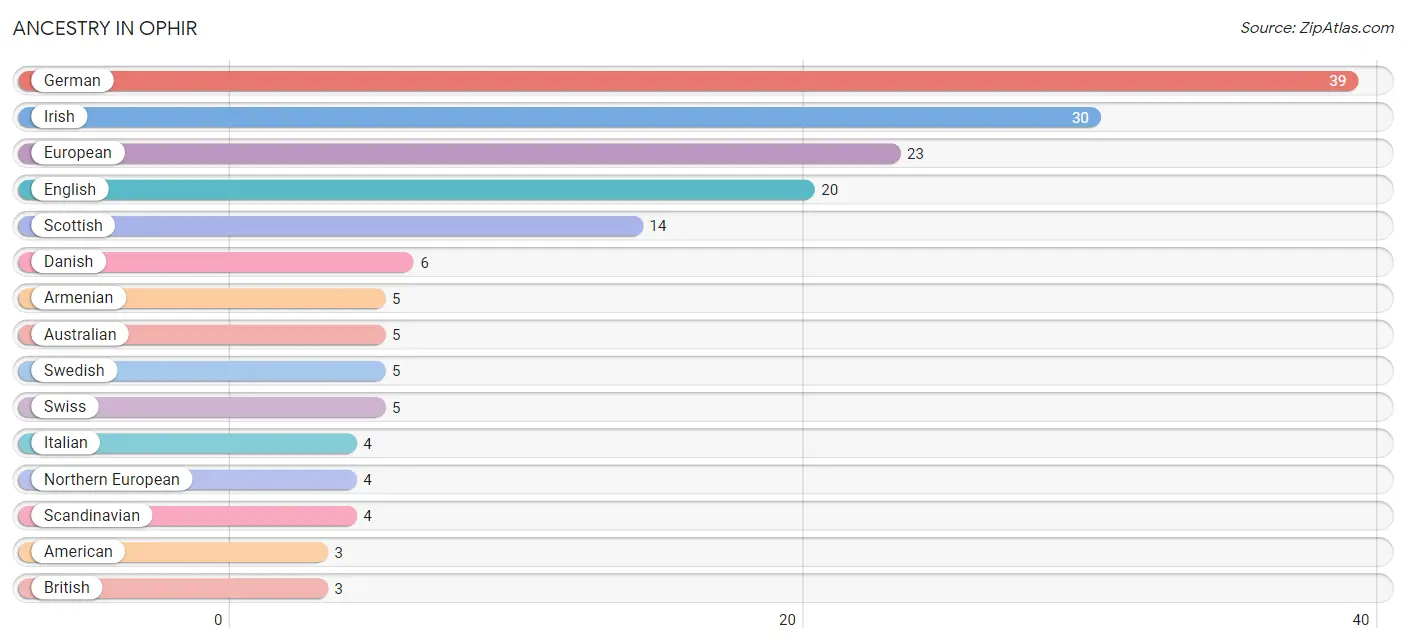
| Ancestry | # Population | % Population |
| American | 3 | 1.7% |
| Armenian | 5 | 2.8% |
| Australian | 5 | 2.8% |
| British | 3 | 1.7% |
| Czech | 2 | 1.1% |
| Danish | 6 | 3.3% |
| Dutch | 3 | 1.7% |
| Eastern European | 2 | 1.1% |
| English | 20 | 11.1% |
| European | 23 | 12.8% |
| French | 3 | 1.7% |
| German | 39 | 21.7% |
| Irish | 30 | 16.7% |
| Italian | 4 | 2.2% |
| Northern European | 4 | 2.2% |
| Polish | 1 | 0.6% |
| Scandinavian | 4 | 2.2% |
| Scotch-Irish | 1 | 0.6% |
| Scottish | 14 | 7.8% |
| Spaniard | 1 | 0.6% |
| Swedish | 5 | 2.8% |
| Swiss | 5 | 2.8% |
| Ukrainian | 1 | 0.6% |
| Welsh | 2 | 1.1% | View All 24 Rows |
Immigrants in Ophir
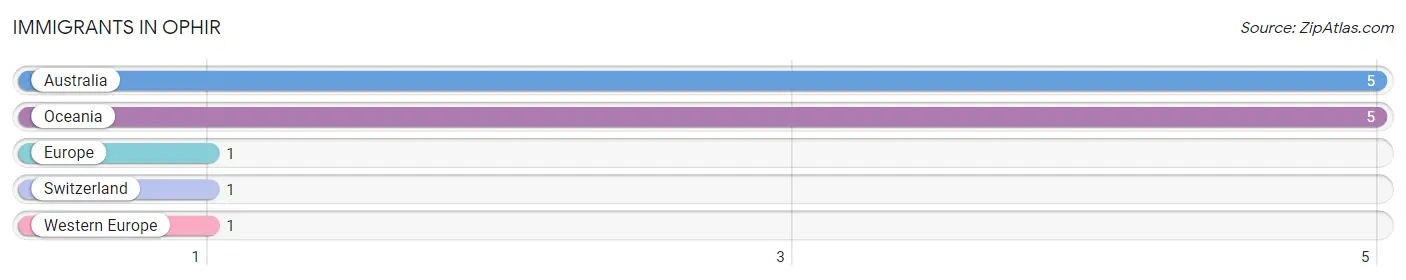
The most numerous immigrant groups reported in Ophir came from Australia (5 | 2.8%), Oceania (5 | 2.8%), Europe (1 | 0.6%), Switzerland (1 | 0.6%), and Western Europe (1 | 0.6%), together accounting for 7.2% of all Ophir residents.
| Immigration Origin | # Population | % Population |
| Australia | 5 | 2.8% |
| Europe | 1 | 0.6% |
| Oceania | 5 | 2.8% |
| Switzerland | 1 | 0.6% |
| Western Europe | 1 | 0.6% | View All 5 Rows |
Sex and Age in Ophir
Sex and Age in Ophir
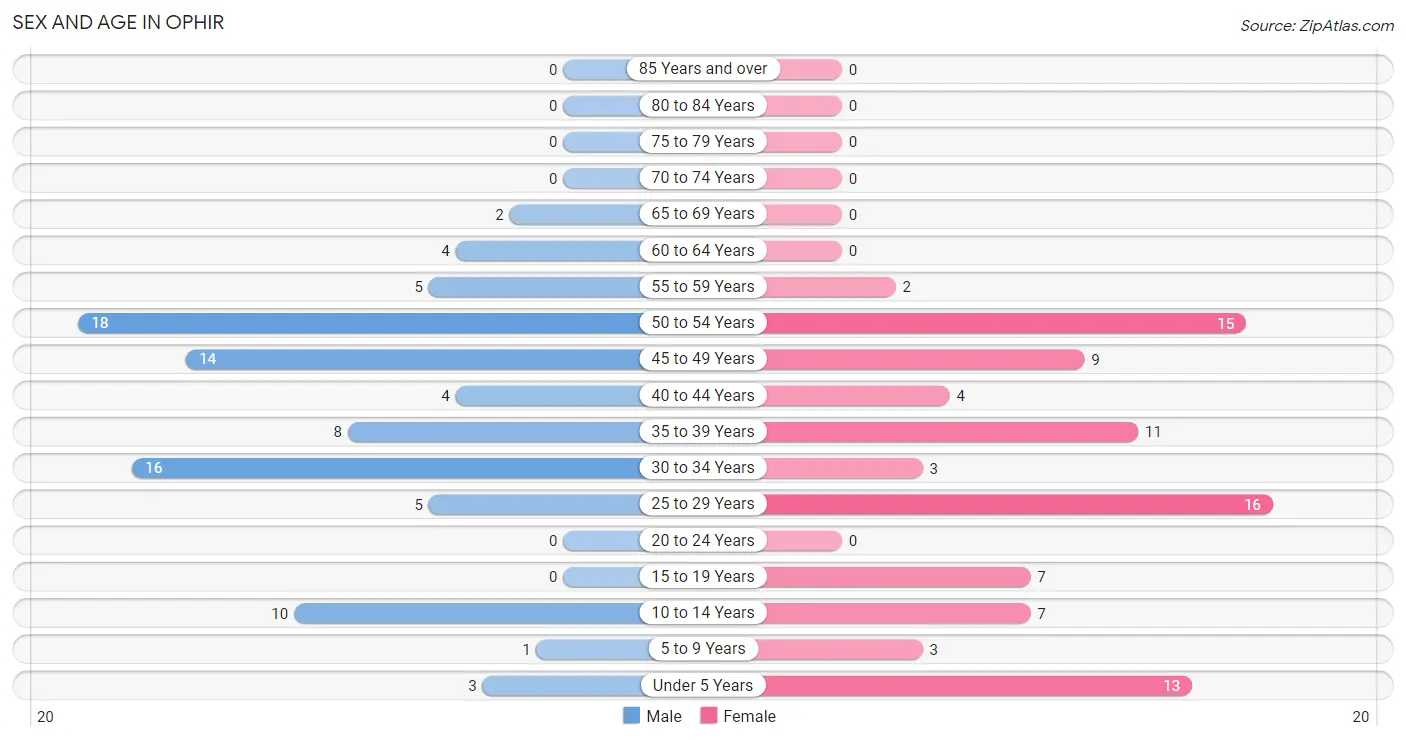
The most populous age groups in Ophir are 50 to 54 Years (18 | 20.0%) for men and 25 to 29 Years (16 | 17.8%) for women.
| Age Bracket | Male | Female |
| Under 5 Years | 3 (3.3%) | 13 (14.4%) |
| 5 to 9 Years | 1 (1.1%) | 3 (3.3%) |
| 10 to 14 Years | 10 (11.1%) | 7 (7.8%) |
| 15 to 19 Years | 0 (0.0%) | 7 (7.8%) |
| 20 to 24 Years | 0 (0.0%) | 0 (0.0%) |
| 25 to 29 Years | 5 (5.6%) | 16 (17.8%) |
| 30 to 34 Years | 16 (17.8%) | 3 (3.3%) |
| 35 to 39 Years | 8 (8.9%) | 11 (12.2%) |
| 40 to 44 Years | 4 (4.4%) | 4 (4.4%) |
| 45 to 49 Years | 14 (15.6%) | 9 (10.0%) |
| 50 to 54 Years | 18 (20.0%) | 15 (16.7%) |
| 55 to 59 Years | 5 (5.6%) | 2 (2.2%) |
| 60 to 64 Years | 4 (4.4%) | 0 (0.0%) |
| 65 to 69 Years | 2 (2.2%) | 0 (0.0%) |
| 70 to 74 Years | 0 (0.0%) | 0 (0.0%) |
| 75 to 79 Years | 0 (0.0%) | 0 (0.0%) |
| 80 to 84 Years | 0 (0.0%) | 0 (0.0%) |
| 85 Years and over | 0 (0.0%) | 0 (0.0%) |
| Total | 90 (100.0%) | 90 (100.0%) |
Families and Households in Ophir
Median Family Size in Ophir
| Family Type | # Families | Family Size |
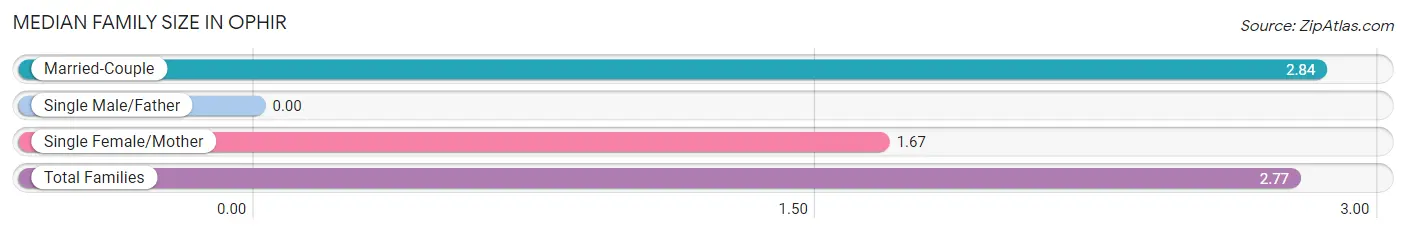
| Married-Couple | 44 (93.6%) | 2.84 |
| Single Male/Father | 0 (0.0%) | - |
| Single Female/Mother | 3 (6.4%) | 1.67 |
| Total Families | 47 (100.0%) | 2.77 |
Median Household Size in Ophir
| Household Type | # Households | Household Size |
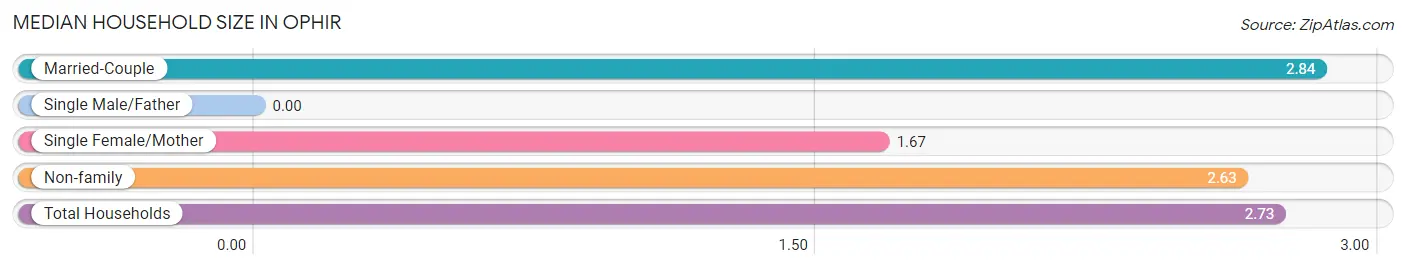
| Married-Couple | 44 (66.7%) | 2.84 |
| Single Male/Father | 0 (0.0%) | - |
| Single Female/Mother | 3 (4.5%) | 1.67 |
| Non-family | 19 (28.8%) | 2.63 |
| Total Households | 66 (100.0%) | 2.73 |
Household Size by Marriage Status in Ophir
Out of a total of 66 households in Ophir, 47 (71.2%) are family households, while 19 (28.8%) are nonfamily households. The most numerous type of family households are 3-person households, comprising 20, and the most common type of nonfamily households are 1-person households, comprising 8.
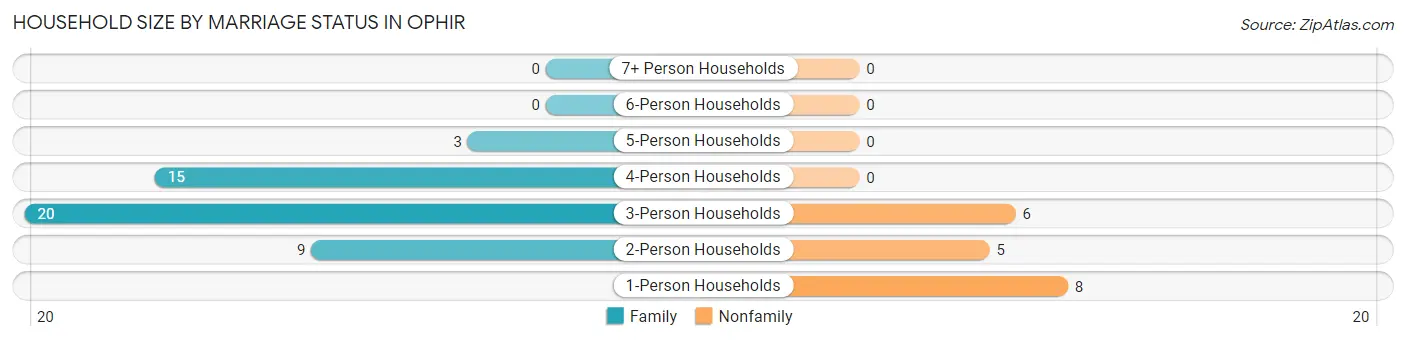
| Household Size | Family Households | Nonfamily Households |
| 1-Person Households | - | 8 (12.1%) |
| 2-Person Households | 9 (13.6%) | 5 (7.6%) |
| 3-Person Households | 20 (30.3%) | 6 (9.1%) |
| 4-Person Households | 15 (22.7%) | 0 (0.0%) |
| 5-Person Households | 3 (4.5%) | 0 (0.0%) |
| 6-Person Households | 0 (0.0%) | 0 (0.0%) |
| 7+ Person Households | 0 (0.0%) | 0 (0.0%) |
| Total | 47 (71.2%) | 19 (28.8%) |
Female Fertility in Ophir
Fertility by Age in Ophir
| Age Bracket | Women with Births | Births / 1,000 Women |
| 15 to 19 years | 0 (0.0%) | 0.0 |
| 20 to 34 years | 0 (0.0%) | 0.0 |
| 35 to 50 years | 0 (0.0%) | 0.0 |
| Total | 0 (0.0%) | 0.0 |
Fertility by Age by Marriage Status in Ophir
| Age Bracket | Married | Unmarried |
| 15 to 19 years | 0 (0.0%) | 0 (0.0%) |
| 20 to 34 years | 0 (0.0%) | 0 (0.0%) |
| 35 to 50 years | 0 (0.0%) | 0 (0.0%) |
| Total | 0 (0.0%) | 0 (0.0%) |
Fertility by Education in Ophir
| Educational Attainment | Women with Births | Births / 1,000 Women |
| Less than High School | 0 (0.0%) | 0.0 |
| High School Diploma | 0 (0.0%) | 0.0 |
| College or Associate's Degree | 0 (0.0%) | 0.0 |
| Bachelor's Degree | 0 (0.0%) | 0.0 |
| Graduate Degree | 0 (0.0%) | 0.0 |
| Total | 0 (0.0%) | 0.0 |
Fertility by Education by Marriage Status in Ophir
| Educational Attainment | Married | Unmarried |
| Less than High School | 0 (0.0%) | 0 (0.0%) |
| High School Diploma | 0 (0.0%) | 0 (0.0%) |
| College or Associate's Degree | 0 (0.0%) | 0 (0.0%) |
| Bachelor's Degree | 0 (0.0%) | 0 (0.0%) |
| Graduate Degree | 0 (0.0%) | 0 (0.0%) |
| Total | 0 (0.0%) | 0 (0.0%) |
Employment Characteristics in Ophir
Employment by Class of Employer in Ophir
Among the 119 employed individuals in Ophir, private company employees (66 | 55.5%), local government employees (18 | 15.1%), and not-for-profit organizations (16 | 13.5%) make up the most common classes of employment.
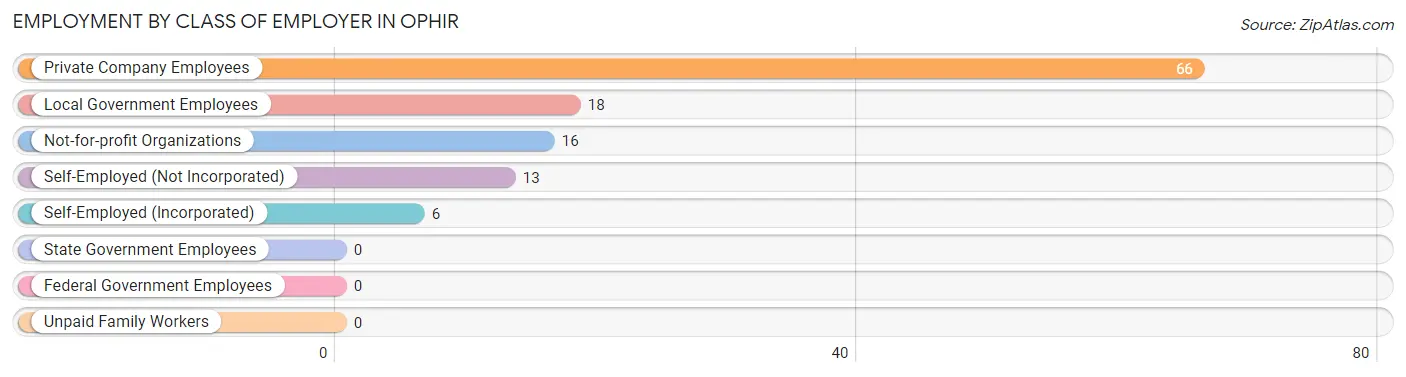
| Employer Class | # Employees | % Employees |
| Private Company Employees | 66 | 55.5% |
| Self-Employed (Incorporated) | 6 | 5.0% |
| Self-Employed (Not Incorporated) | 13 | 10.9% |
| Not-for-profit Organizations | 16 | 13.5% |
| Local Government Employees | 18 | 15.1% |
| State Government Employees | 0 | 0.0% |
| Federal Government Employees | 0 | 0.0% |
| Unpaid Family Workers | 0 | 0.0% |
| Total | 119 | 100.0% |
Employment Status by Age in Ophir
According to the labor force statistics for Ophir, out of the total population over 16 years of age (141), 95.0% or 134 individuals are in the labor force, with 6.0% or 8 of them unemployed. The age group with the highest labor force participation rate is 25 to 29 years, with 100.0% or 21 individuals in the labor force. Within the labor force, the 25 to 29 years age range has the highest percentage of unemployed individuals, with 23.8% or 5 of them being unemployed.
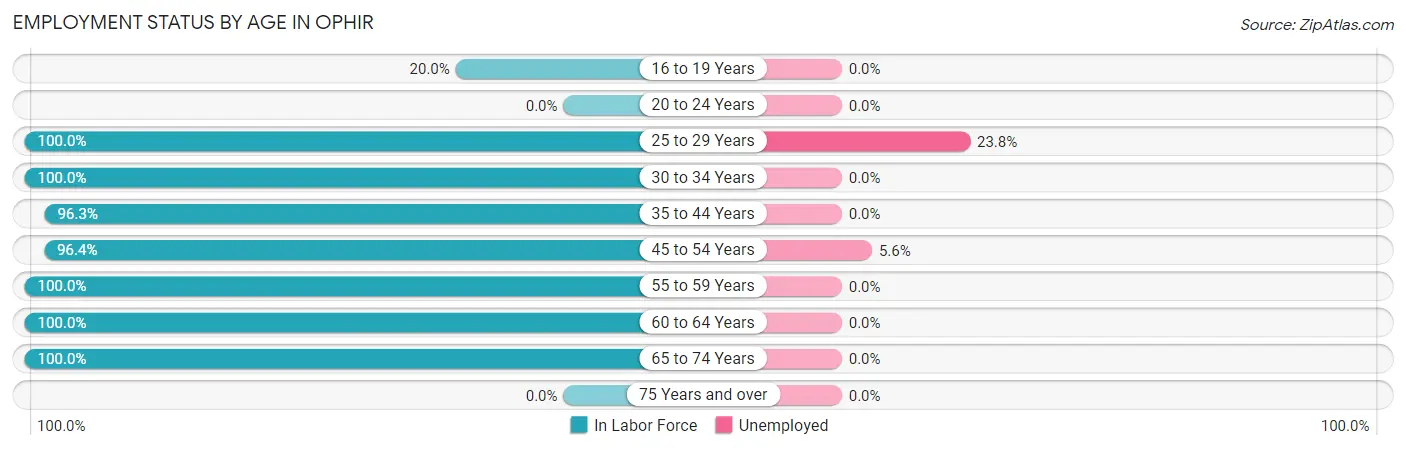
| Age Bracket | In Labor Force | Unemployed |
| 16 to 19 Years | 1 (20.0%) | 0 (0.0%) |
| 20 to 24 Years | 0 (0.0%) | 0 (0.0%) |
| 25 to 29 Years | 21 (100.0%) | 5 (23.8%) |
| 30 to 34 Years | 19 (100.0%) | 0 (0.0%) |
| 35 to 44 Years | 26 (96.3%) | 0 (0.0%) |
| 45 to 54 Years | 54 (96.4%) | 3 (5.6%) |
| 55 to 59 Years | 7 (100.0%) | 0 (0.0%) |
| 60 to 64 Years | 4 (100.0%) | 0 (0.0%) |
| 65 to 74 Years | 2 (100.0%) | 0 (0.0%) |
| 75 Years and over | 0 (0.0%) | 0 (0.0%) |
| Total | 134 (95.0%) | 8 (6.0%) |
Employment Status by Educational Attainment in Ophir
According to labor force statistics for Ophir, 97.8% of individuals (131) out of the total population between 25 and 64 years of age (134) are in the labor force, with 6.1% or 8 of them being unemployed. The group with the highest labor force participation rate are those with the educational attainment of high school diploma, with 100.0% or 3 individuals in the labor force. Within the labor force, individuals with college / associate degree education have the highest percentage of unemployment, with 9.4% or 3 of them being unemployed.
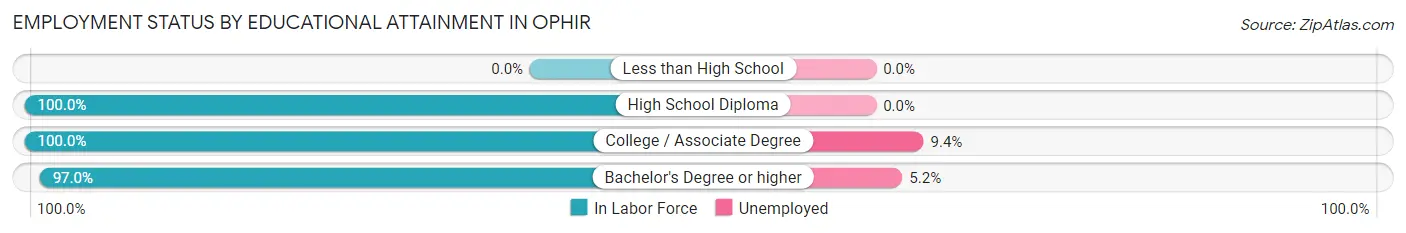
| Educational Attainment | In Labor Force | Unemployed |
| Less than High School | 0 (0.0%) | 0 (0.0%) |
| High School Diploma | 3 (100.0%) | 0 (0.0%) |
| College / Associate Degree | 32 (100.0%) | 3 (9.4%) |
| Bachelor's Degree or higher | 96 (97.0%) | 5 (5.2%) |
| Total | 131 (97.8%) | 8 (6.1%) |
Employment Occupations by Sex in Ophir
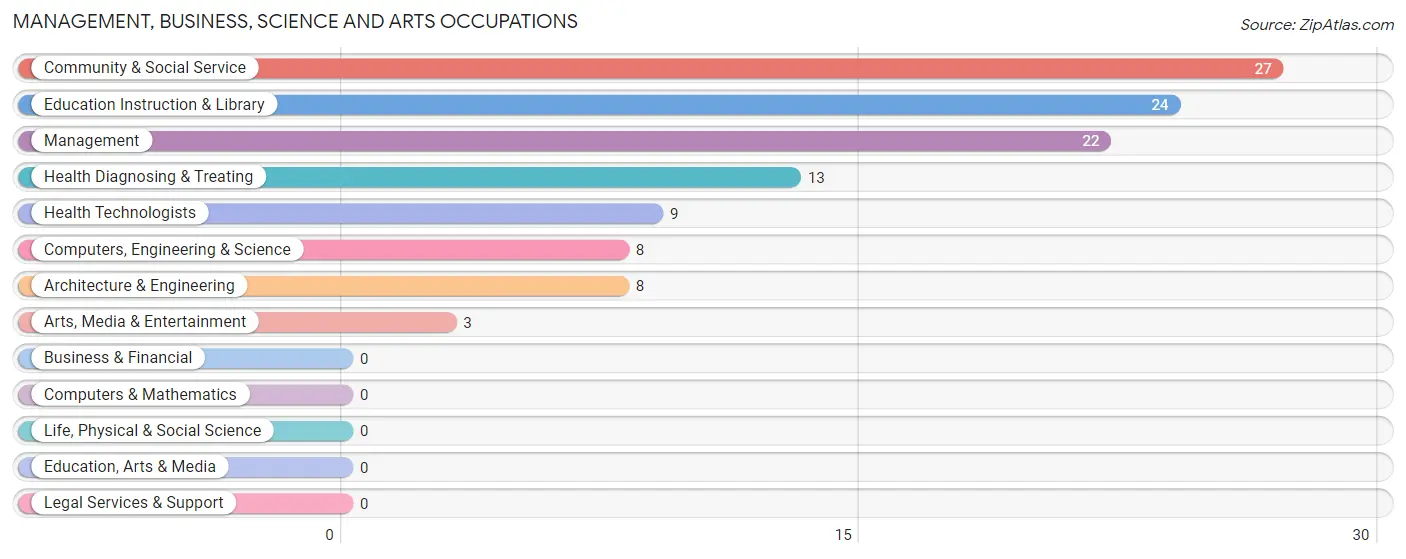
Management, Business, Science and Arts Occupations
The most common Management, Business, Science and Arts occupations in Ophir are Community & Social Service (27 | 21.4%), Education Instruction & Library (24 | 19.1%), Management (22 | 17.5%), Health Diagnosing & Treating (13 | 10.3%), and Health Technologists (9 | 7.1%).
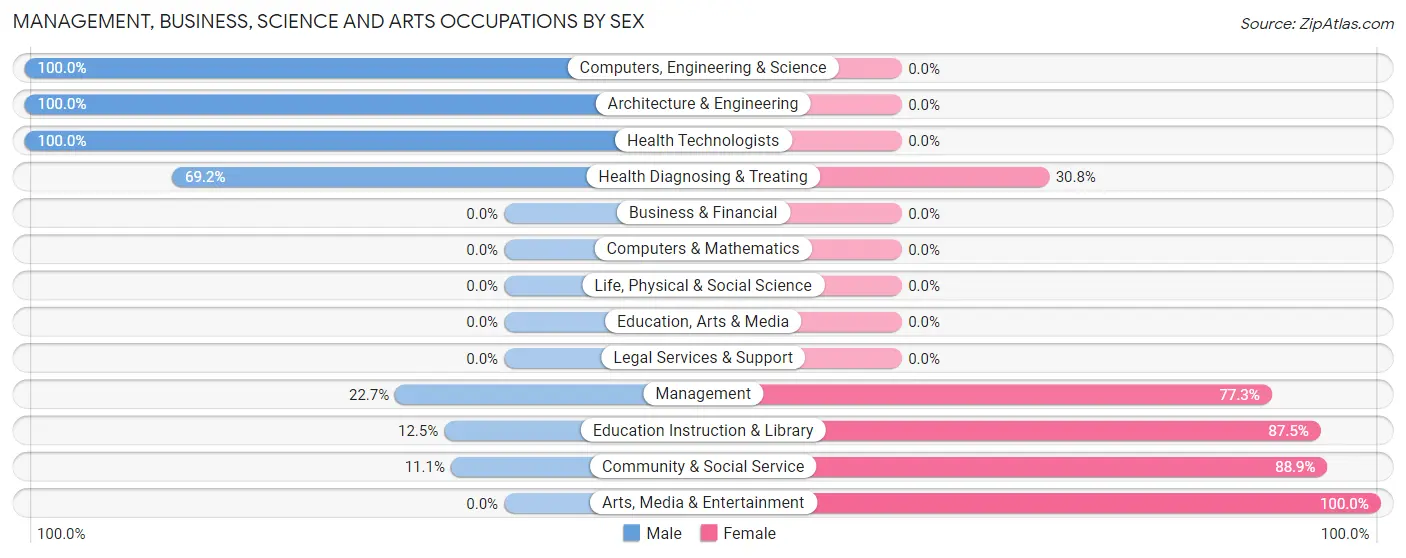
Management, Business, Science and Arts Occupations by Sex
Within the Management, Business, Science and Arts occupations in Ophir, the most male-oriented occupations are Computers, Engineering & Science (100.0%), Architecture & Engineering (100.0%), and Health Technologists (100.0%), while the most female-oriented occupations are Arts, Media & Entertainment (100.0%), Community & Social Service (88.9%), and Education Instruction & Library (87.5%).
| Occupation | Male | Female |
| Management | 5 (22.7%) | 17 (77.3%) |
| Business & Financial | 0 (0.0%) | 0 (0.0%) |
| Computers, Engineering & Science | 8 (100.0%) | 0 (0.0%) |
| Computers & Mathematics | 0 (0.0%) | 0 (0.0%) |
| Architecture & Engineering | 8 (100.0%) | 0 (0.0%) |
| Life, Physical & Social Science | 0 (0.0%) | 0 (0.0%) |
| Community & Social Service | 3 (11.1%) | 24 (88.9%) |
| Education, Arts & Media | 0 (0.0%) | 0 (0.0%) |
| Legal Services & Support | 0 (0.0%) | 0 (0.0%) |
| Education Instruction & Library | 3 (12.5%) | 21 (87.5%) |
| Arts, Media & Entertainment | 0 (0.0%) | 3 (100.0%) |
| Health Diagnosing & Treating | 9 (69.2%) | 4 (30.8%) |
| Health Technologists | 9 (100.0%) | 0 (0.0%) |
| Total (Category) | 25 (35.7%) | 45 (64.3%) |
| Total (Overall) | 66 (52.4%) | 60 (47.6%) |
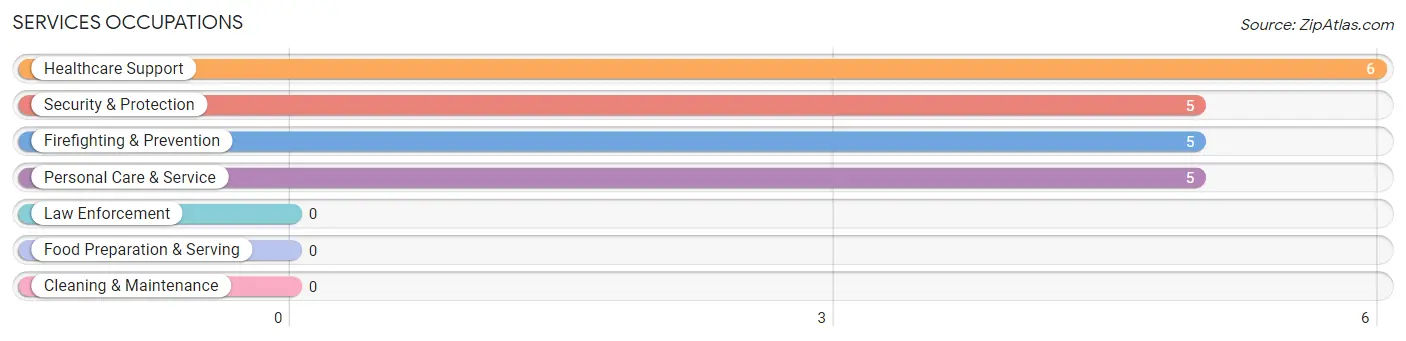
Services Occupations
The most common Services occupations in Ophir are Healthcare Support (6 | 4.8%), Security & Protection (5 | 4.0%), Firefighting & Prevention (5 | 4.0%), and Personal Care & Service (5 | 4.0%).
Services Occupations by Sex
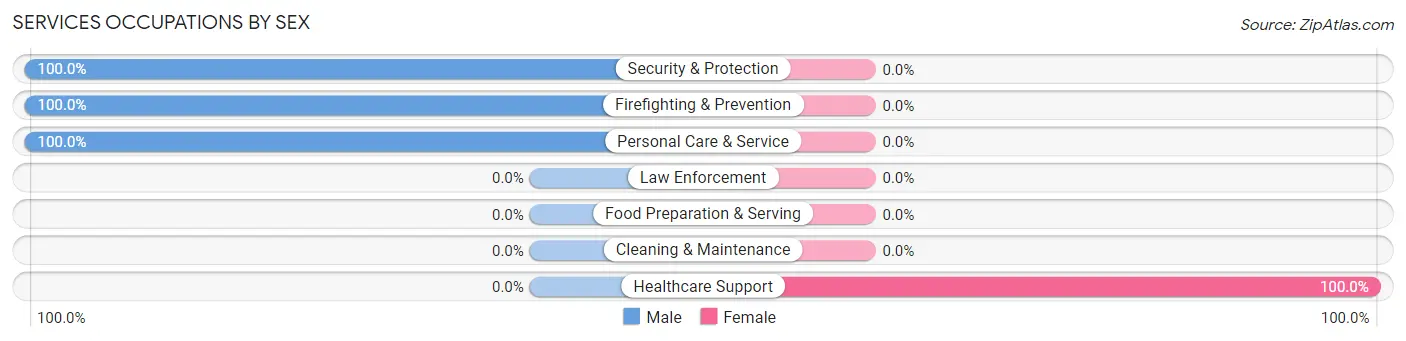
| Occupation | Male | Female |
| Healthcare Support | 0 (0.0%) | 6 (100.0%) |
| Security & Protection | 5 (100.0%) | 0 (0.0%) |
| Firefighting & Prevention | 5 (100.0%) | 0 (0.0%) |
| Law Enforcement | 0 (0.0%) | 0 (0.0%) |
| Food Preparation & Serving | 0 (0.0%) | 0 (0.0%) |
| Cleaning & Maintenance | 0 (0.0%) | 0 (0.0%) |
| Personal Care & Service | 5 (100.0%) | 0 (0.0%) |
| Total (Category) | 10 (62.5%) | 6 (37.5%) |
| Total (Overall) | 66 (52.4%) | 60 (47.6%) |
Sales and Office Occupations
The most common Sales and Office occupations in Ophir are , and Sales & Related (7 | 5.6%).

Sales and Office Occupations by Sex

| Occupation | Male | Female |
| Sales & Related | 1 (14.3%) | 6 (85.7%) |
| Office & Administration | 0 (0.0%) | 0 (0.0%) |
| Total (Category) | 1 (14.3%) | 6 (85.7%) |
| Total (Overall) | 66 (52.4%) | 60 (47.6%) |
Natural Resources, Construction and Maintenance Occupations
The most common Natural Resources, Construction and Maintenance occupations in Ophir are Installation, Maintenance & Repair (3 | 2.4%), and Construction & Extraction (2 | 1.6%).
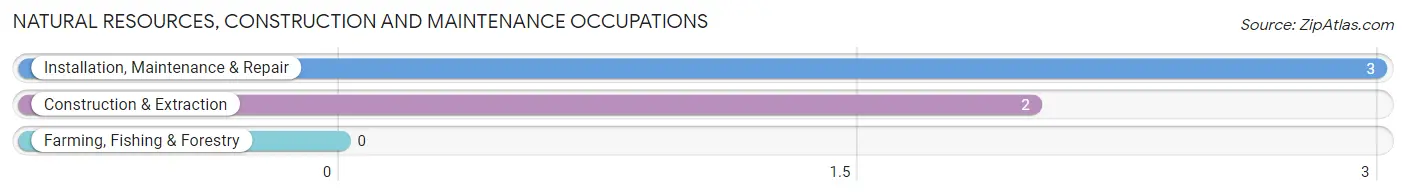
Natural Resources, Construction and Maintenance Occupations by Sex

| Occupation | Male | Female |
| Farming, Fishing & Forestry | 0 (0.0%) | 0 (0.0%) |
| Construction & Extraction | 2 (100.0%) | 0 (0.0%) |
| Installation, Maintenance & Repair | 3 (100.0%) | 0 (0.0%) |
| Total (Category) | 5 (100.0%) | 0 (0.0%) |
| Total (Overall) | 66 (52.4%) | 60 (47.6%) |
Production, Transportation and Moving Occupations
The most common Production, Transportation and Moving occupations in Ophir are Production (22 | 17.5%), and Transportation (6 | 4.8%).
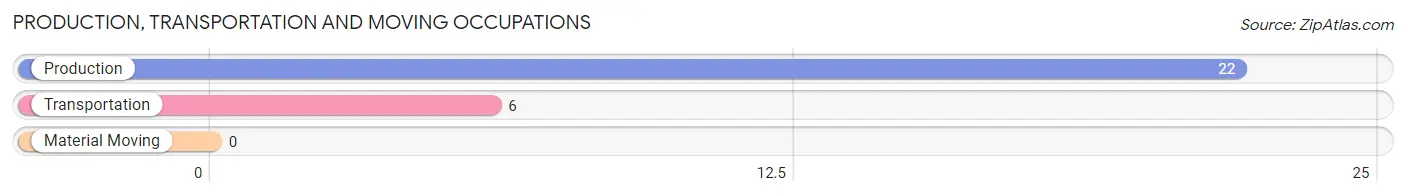
Production, Transportation and Moving Occupations by Sex
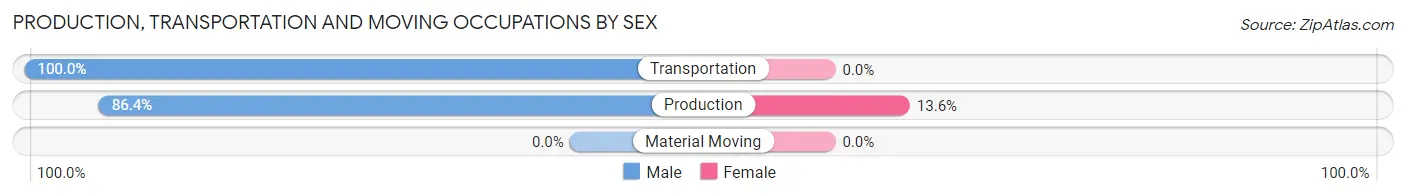
| Occupation | Male | Female |
| Production | 19 (86.4%) | 3 (13.6%) |
| Transportation | 6 (100.0%) | 0 (0.0%) |
| Material Moving | 0 (0.0%) | 0 (0.0%) |
| Total (Category) | 25 (89.3%) | 3 (10.7%) |
| Total (Overall) | 66 (52.4%) | 60 (47.6%) |
Employment Industries by Sex in Ophir
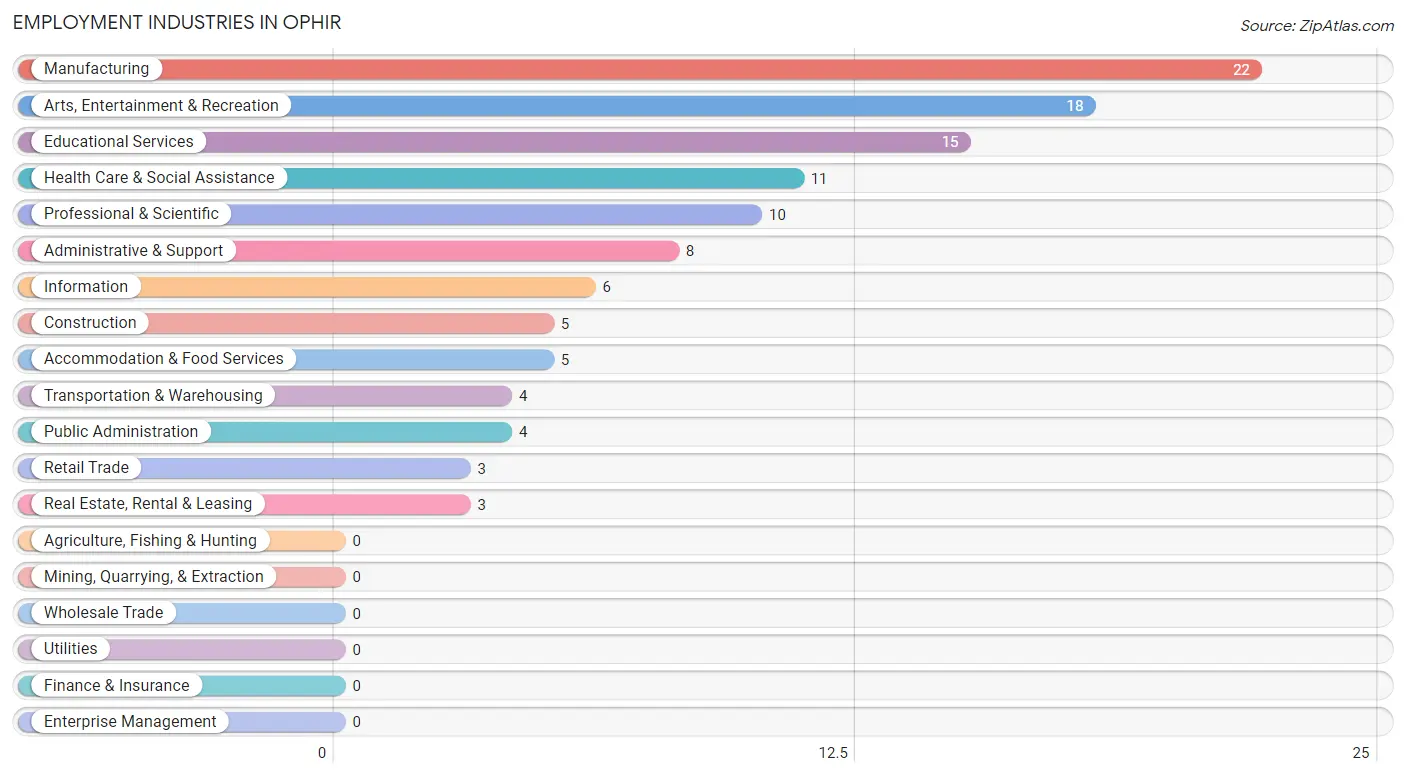
Employment Industries in Ophir
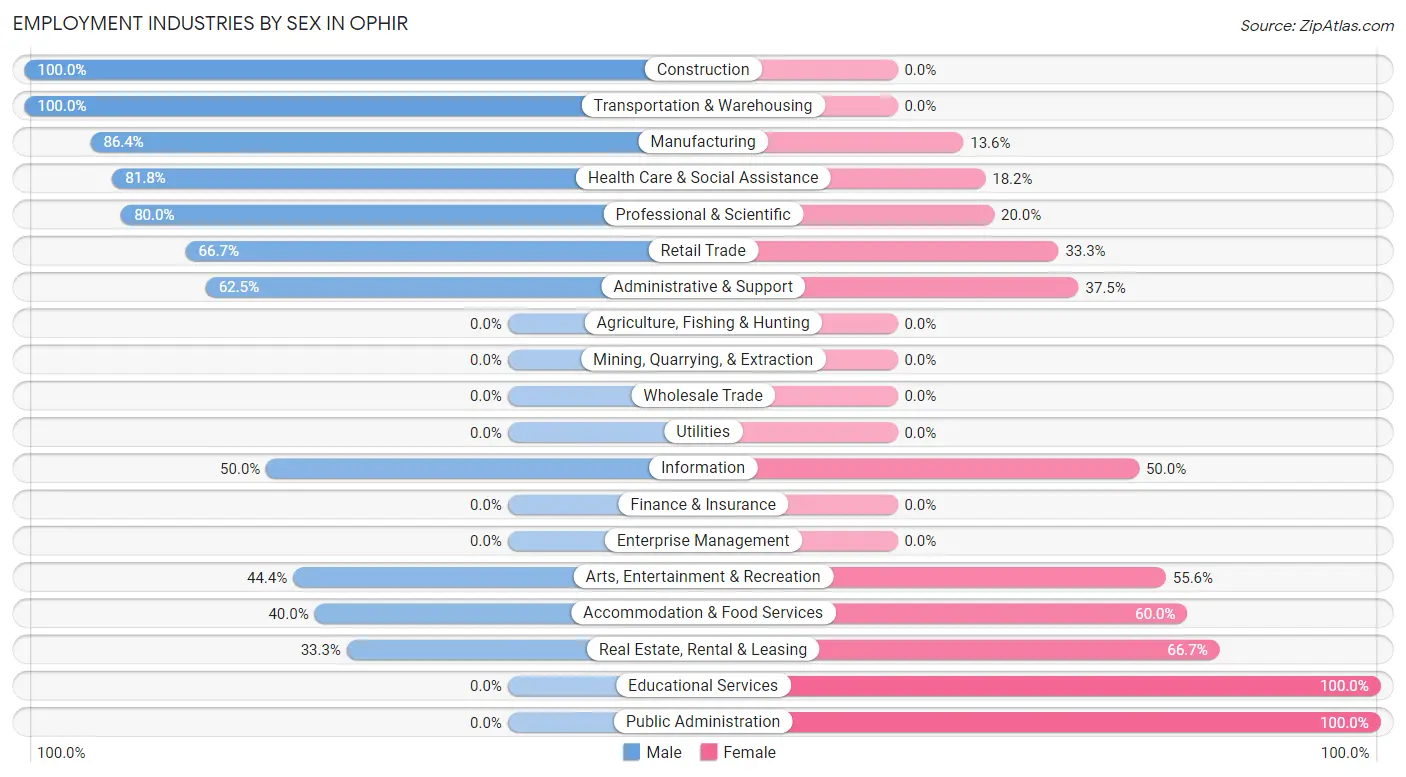
The major employment industries in Ophir include Manufacturing (22 | 17.5%), Arts, Entertainment & Recreation (18 | 14.3%), Educational Services (15 | 11.9%), Health Care & Social Assistance (11 | 8.7%), and Professional & Scientific (10 | 7.9%).
Employment Industries by Sex in Ophir
The Ophir industries that see more men than women are Construction (100.0%), Transportation & Warehousing (100.0%), and Manufacturing (86.4%), whereas the industries that tend to have a higher number of women are Educational Services (100.0%), Public Administration (100.0%), and Real Estate, Rental & Leasing (66.7%).
| Industry | Male | Female |
| Agriculture, Fishing & Hunting | 0 (0.0%) | 0 (0.0%) |
| Mining, Quarrying, & Extraction | 0 (0.0%) | 0 (0.0%) |
| Construction | 5 (100.0%) | 0 (0.0%) |
| Manufacturing | 19 (86.4%) | 3 (13.6%) |
| Wholesale Trade | 0 (0.0%) | 0 (0.0%) |
| Retail Trade | 2 (66.7%) | 1 (33.3%) |
| Transportation & Warehousing | 4 (100.0%) | 0 (0.0%) |
| Utilities | 0 (0.0%) | 0 (0.0%) |
| Information | 3 (50.0%) | 3 (50.0%) |
| Finance & Insurance | 0 (0.0%) | 0 (0.0%) |
| Real Estate, Rental & Leasing | 1 (33.3%) | 2 (66.7%) |
| Professional & Scientific | 8 (80.0%) | 2 (20.0%) |
| Enterprise Management | 0 (0.0%) | 0 (0.0%) |
| Administrative & Support | 5 (62.5%) | 3 (37.5%) |
| Educational Services | 0 (0.0%) | 15 (100.0%) |
| Health Care & Social Assistance | 9 (81.8%) | 2 (18.2%) |
| Arts, Entertainment & Recreation | 8 (44.4%) | 10 (55.6%) |
| Accommodation & Food Services | 2 (40.0%) | 3 (60.0%) |
| Public Administration | 0 (0.0%) | 4 (100.0%) |
| Total | 66 (52.4%) | 60 (47.6%) |
Education in Ophir
School Enrollment in Ophir
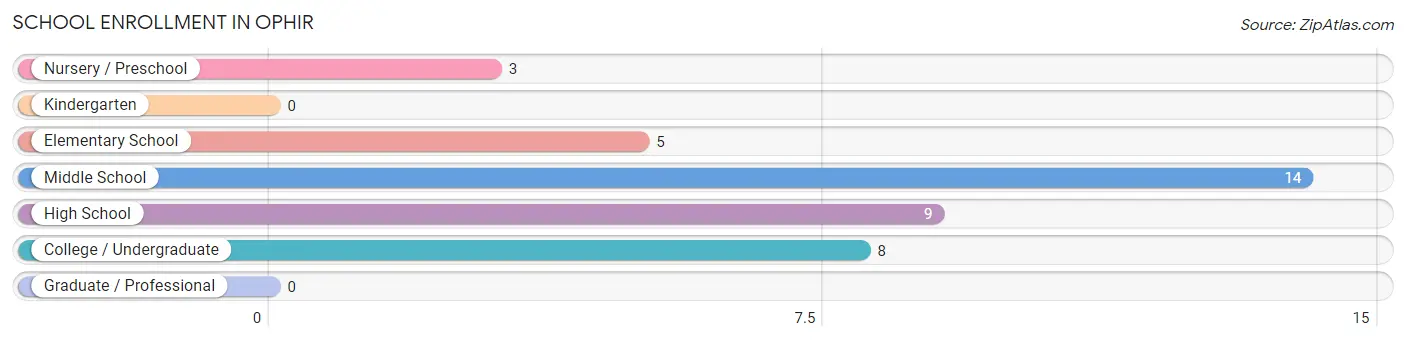
The most common levels of schooling among the 39 students in Ophir are middle school (14 | 35.9%), high school (9 | 23.1%), and college / undergraduate (8 | 20.5%).
| School Level | # Students | % Students |
| Nursery / Preschool | 3 | 7.7% |
| Kindergarten | 0 | 0.0% |
| Elementary School | 5 | 12.8% |
| Middle School | 14 | 35.9% |
| High School | 9 | 23.1% |
| College / Undergraduate | 8 | 20.5% |
| Graduate / Professional | 0 | 0.0% |
| Total | 39 | 100.0% |
School Enrollment by Age by Funding Source in Ophir
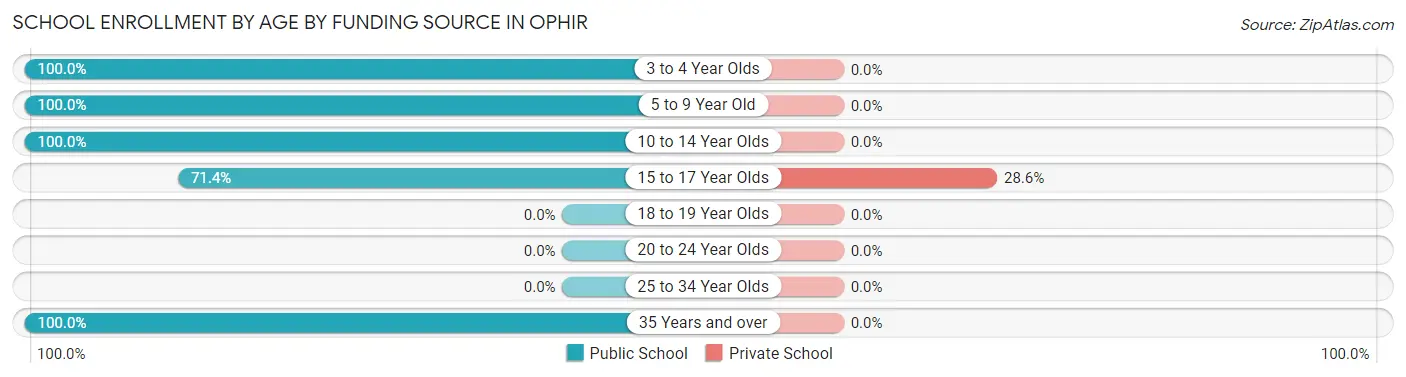
Out of a total of 39 students who are enrolled in schools in Ophir, 2 (5.1%) attend a private institution, while the remaining 37 (94.9%) are enrolled in public schools. The age group of 15 to 17 year olds has the highest likelihood of being enrolled in private schools, with 2 (28.6% in the age bracket) enrolled. Conversely, the age group of 3 to 4 year olds has the lowest likelihood of being enrolled in a private school, with 3 (100.0% in the age bracket) attending a public institution.
| Age Bracket | Public School | Private School |
| 3 to 4 Year Olds | 3 (100.0%) | 0 (0.0%) |
| 5 to 9 Year Old | 4 (100.0%) | 0 (0.0%) |
| 10 to 14 Year Olds | 17 (100.0%) | 0 (0.0%) |
| 15 to 17 Year Olds | 5 (71.4%) | 2 (28.6%) |
| 18 to 19 Year Olds | 0 (0.0%) | 0 (0.0%) |
| 20 to 24 Year Olds | 0 (0.0%) | 0 (0.0%) |
| 25 to 34 Year Olds | 0 (0.0%) | 0 (0.0%) |
| 35 Years and over | 8 (100.0%) | 0 (0.0%) |
| Total | 37 (94.9%) | 2 (5.1%) |
Educational Attainment by Field of Study in Ophir
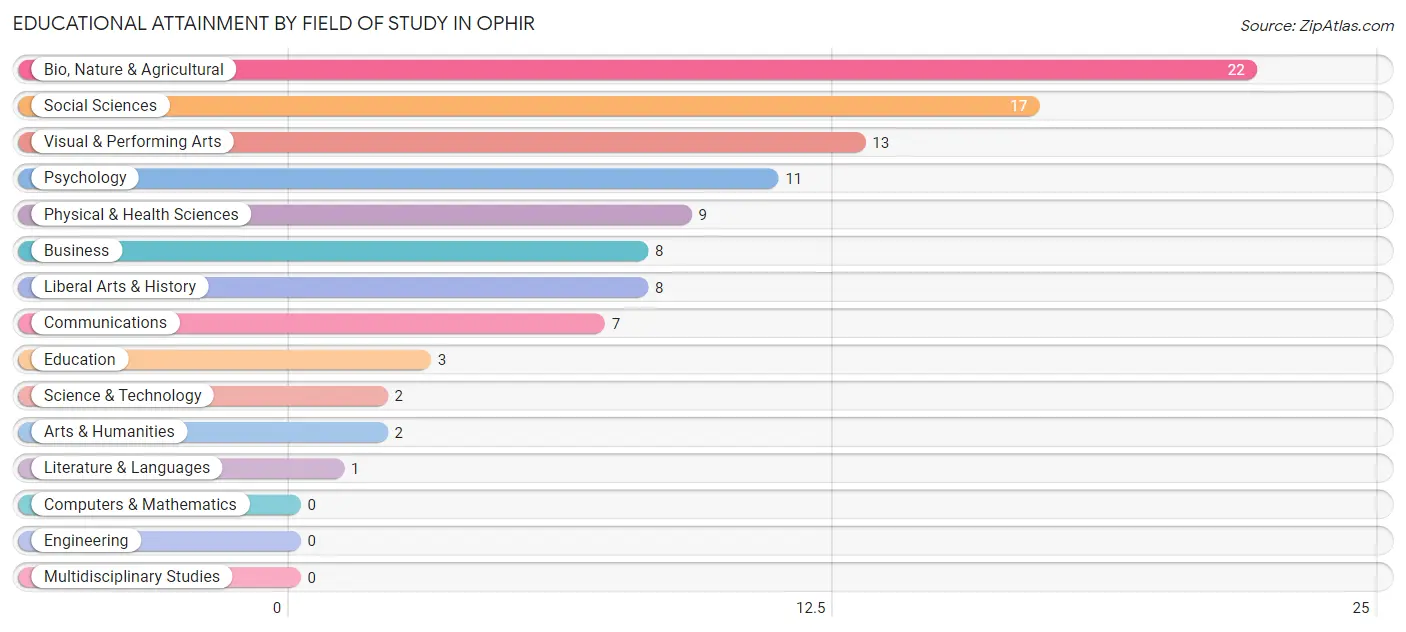
Bio, nature & agricultural (22 | 21.4%), social sciences (17 | 16.5%), visual & performing arts (13 | 12.6%), psychology (11 | 10.7%), and physical & health sciences (9 | 8.7%) are the most common fields of study among 103 individuals in Ophir who have obtained a bachelor's degree or higher.
| Field of Study | # Graduates | % Graduates |
| Computers & Mathematics | 0 | 0.0% |
| Bio, Nature & Agricultural | 22 | 21.4% |
| Physical & Health Sciences | 9 | 8.7% |
| Psychology | 11 | 10.7% |
| Social Sciences | 17 | 16.5% |
| Engineering | 0 | 0.0% |
| Multidisciplinary Studies | 0 | 0.0% |
| Science & Technology | 2 | 1.9% |
| Business | 8 | 7.8% |
| Education | 3 | 2.9% |
| Literature & Languages | 1 | 1.0% |
| Liberal Arts & History | 8 | 7.8% |
| Visual & Performing Arts | 13 | 12.6% |
| Communications | 7 | 6.8% |
| Arts & Humanities | 2 | 1.9% |
| Total | 103 | 100.0% |
Transportation & Commute in Ophir
Vehicle Availability by Sex in Ophir
The most prevalent vehicle ownership categories in Ophir are males with 2 vehicles (35, accounting for 53.0%) and females with 2 vehicles (27, making up 66.0%).
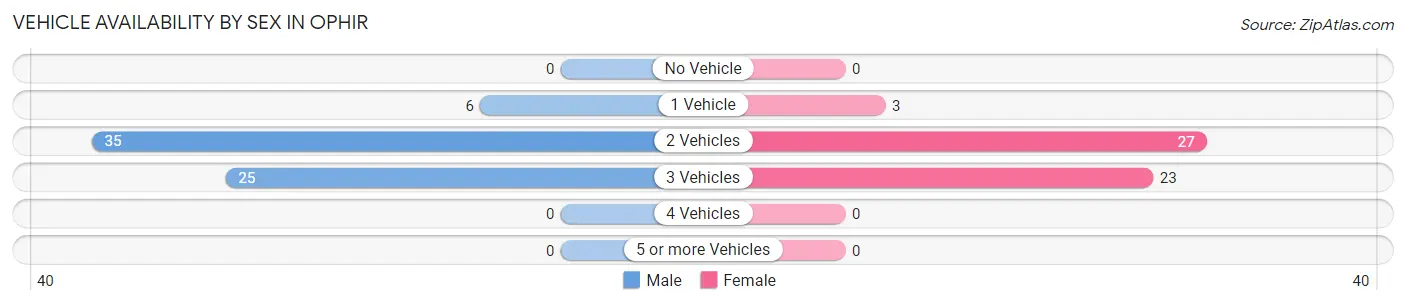
| Vehicles Available | Male | Female |
| No Vehicle | 0 (0.0%) | 0 (0.0%) |
| 1 Vehicle | 6 (9.1%) | 3 (5.7%) |
| 2 Vehicles | 35 (53.0%) | 27 (50.9%) |
| 3 Vehicles | 25 (37.9%) | 23 (43.4%) |
| 4 Vehicles | 0 (0.0%) | 0 (0.0%) |
| 5 or more Vehicles | 0 (0.0%) | 0 (0.0%) |
| Total | 66 (100.0%) | 53 (100.0%) |
Commute Time in Ophir
The most frequently occuring commute durations in Ophir are 20 to 24 minutes (45 commuters, 43.3%), 25 to 29 minutes (23 commuters, 22.1%), and 30 to 34 minutes (15 commuters, 14.4%).
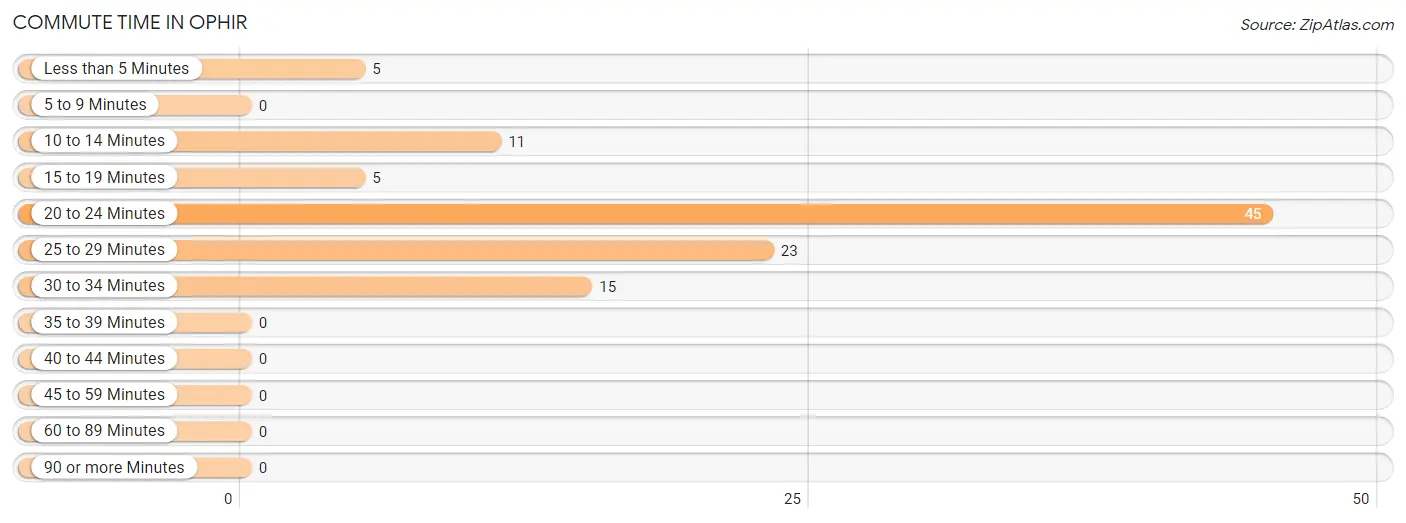
| Commute Time | # Commuters | % Commuters |
| Less than 5 Minutes | 5 | 4.8% |
| 5 to 9 Minutes | 0 | 0.0% |
| 10 to 14 Minutes | 11 | 10.6% |
| 15 to 19 Minutes | 5 | 4.8% |
| 20 to 24 Minutes | 45 | 43.3% |
| 25 to 29 Minutes | 23 | 22.1% |
| 30 to 34 Minutes | 15 | 14.4% |
| 35 to 39 Minutes | 0 | 0.0% |
| 40 to 44 Minutes | 0 | 0.0% |
| 45 to 59 Minutes | 0 | 0.0% |
| 60 to 89 Minutes | 0 | 0.0% |
| 90 or more Minutes | 0 | 0.0% |
Commute Time by Sex in Ophir
The most common commute times in Ophir are 20 to 24 minutes (16 commuters, 28.6%) for males and 20 to 24 minutes (29 commuters, 60.4%) for females.
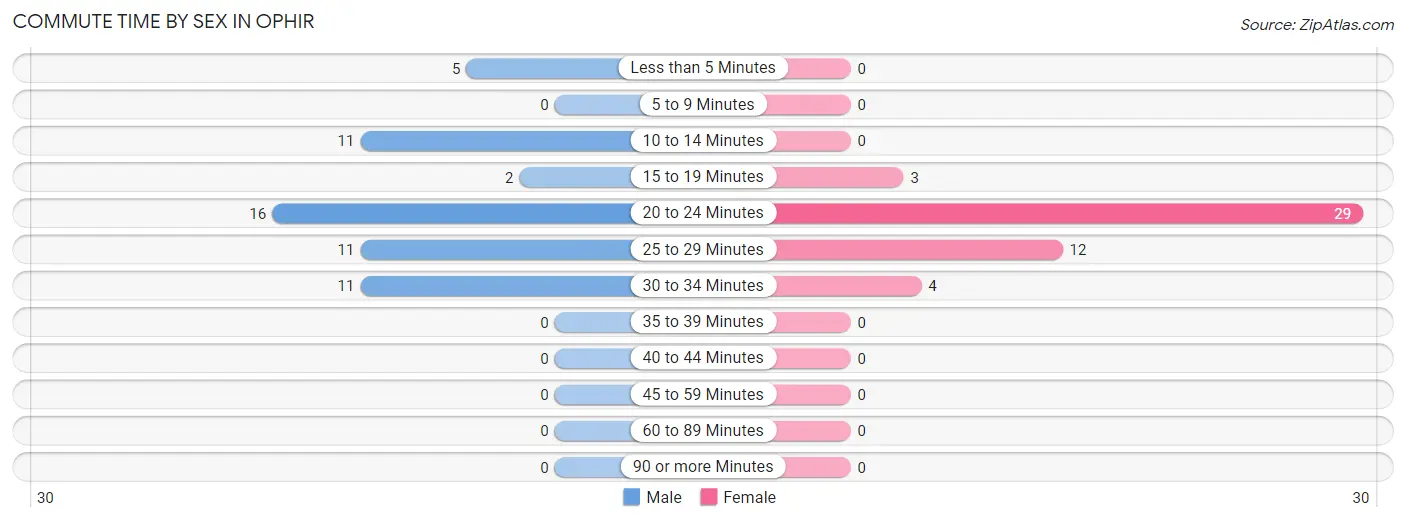
| Commute Time | Male | Female |
| Less than 5 Minutes | 5 (8.9%) | 0 (0.0%) |
| 5 to 9 Minutes | 0 (0.0%) | 0 (0.0%) |
| 10 to 14 Minutes | 11 (19.6%) | 0 (0.0%) |
| 15 to 19 Minutes | 2 (3.6%) | 3 (6.2%) |
| 20 to 24 Minutes | 16 (28.6%) | 29 (60.4%) |
| 25 to 29 Minutes | 11 (19.6%) | 12 (25.0%) |
| 30 to 34 Minutes | 11 (19.6%) | 4 (8.3%) |
| 35 to 39 Minutes | 0 (0.0%) | 0 (0.0%) |
| 40 to 44 Minutes | 0 (0.0%) | 0 (0.0%) |
| 45 to 59 Minutes | 0 (0.0%) | 0 (0.0%) |
| 60 to 89 Minutes | 0 (0.0%) | 0 (0.0%) |
| 90 or more Minutes | 0 (0.0%) | 0 (0.0%) |
Time of Departure to Work by Sex in Ophir
The most frequent times of departure to work in Ophir are 9:00 AM to 9:59 AM (20, 35.7%) for males and 7:30 AM to 7:59 AM (15, 31.2%) for females.
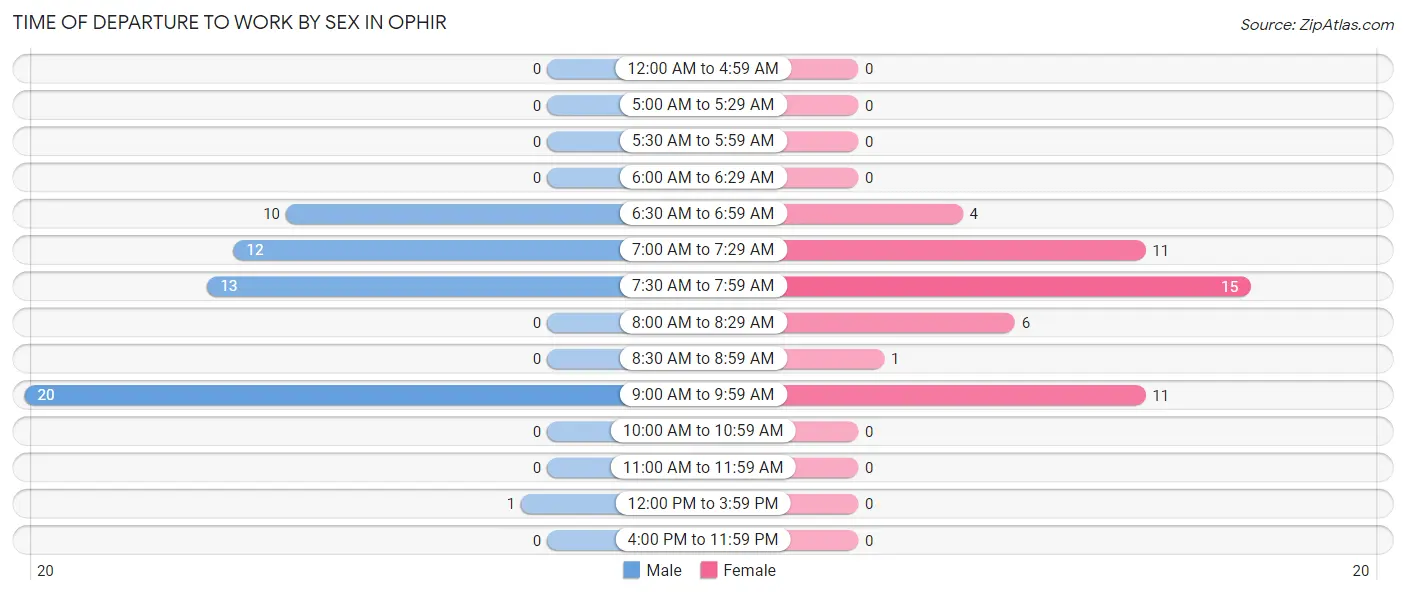
| Time of Departure | Male | Female |
| 12:00 AM to 4:59 AM | 0 (0.0%) | 0 (0.0%) |
| 5:00 AM to 5:29 AM | 0 (0.0%) | 0 (0.0%) |
| 5:30 AM to 5:59 AM | 0 (0.0%) | 0 (0.0%) |
| 6:00 AM to 6:29 AM | 0 (0.0%) | 0 (0.0%) |
| 6:30 AM to 6:59 AM | 10 (17.9%) | 4 (8.3%) |
| 7:00 AM to 7:29 AM | 12 (21.4%) | 11 (22.9%) |
| 7:30 AM to 7:59 AM | 13 (23.2%) | 15 (31.2%) |
| 8:00 AM to 8:29 AM | 0 (0.0%) | 6 (12.5%) |
| 8:30 AM to 8:59 AM | 0 (0.0%) | 1 (2.1%) |
| 9:00 AM to 9:59 AM | 20 (35.7%) | 11 (22.9%) |
| 10:00 AM to 10:59 AM | 0 (0.0%) | 0 (0.0%) |
| 11:00 AM to 11:59 AM | 0 (0.0%) | 0 (0.0%) |
| 12:00 PM to 3:59 PM | 1 (1.8%) | 0 (0.0%) |
| 4:00 PM to 11:59 PM | 0 (0.0%) | 0 (0.0%) |
| Total | 56 (100.0%) | 48 (100.0%) |
Housing Occupancy in Ophir
Occupancy by Ownership in Ophir
Of the total 66 dwellings in Ophir, owner-occupied units account for 53 (80.3%), while renter-occupied units make up 13 (19.7%).
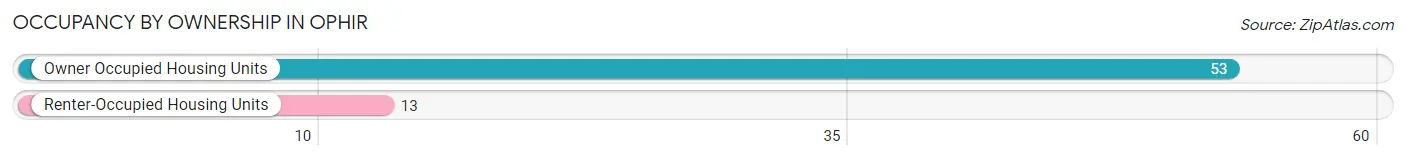
| Occupancy | # Housing Units | % Housing Units |
| Owner Occupied Housing Units | 53 | 80.3% |
| Renter-Occupied Housing Units | 13 | 19.7% |
| Total Occupied Housing Units | 66 | 100.0% |
Occupancy by Household Size in Ophir
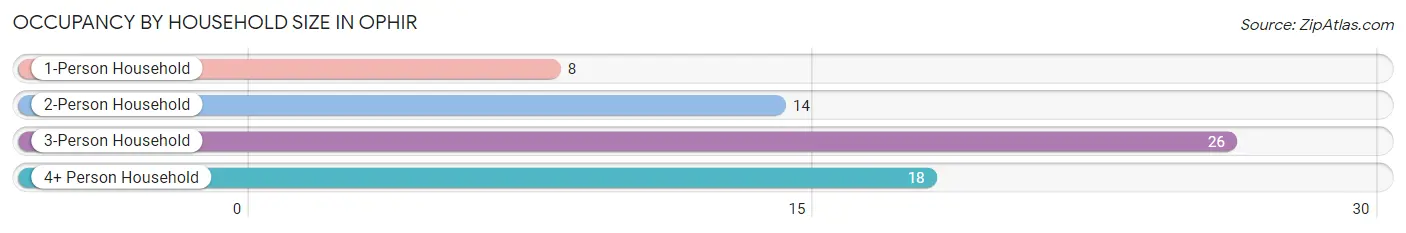
| Household Size | # Housing Units | % Housing Units |
| 1-Person Household | 8 | 12.1% |
| 2-Person Household | 14 | 21.2% |
| 3-Person Household | 26 | 39.4% |
| 4+ Person Household | 18 | 27.3% |
| Total Housing Units | 66 | 100.0% |
Occupancy by Ownership by Household Size in Ophir
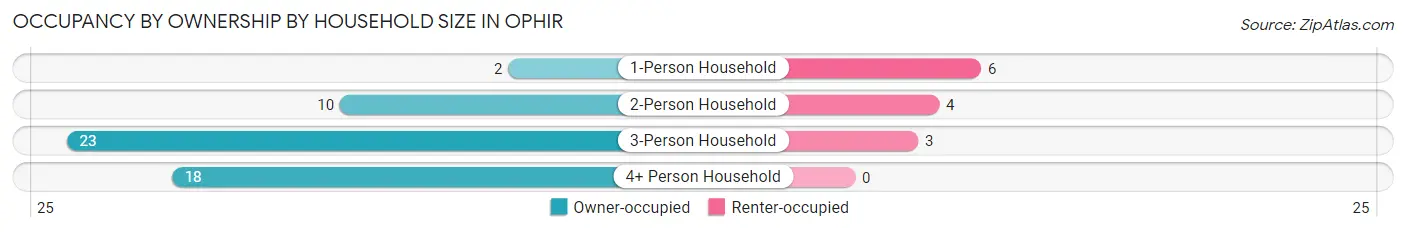
| Household Size | Owner-occupied | Renter-occupied |
| 1-Person Household | 2 (25.0%) | 6 (75.0%) |
| 2-Person Household | 10 (71.4%) | 4 (28.6%) |
| 3-Person Household | 23 (88.5%) | 3 (11.5%) |
| 4+ Person Household | 18 (100.0%) | 0 (0.0%) |
| Total Housing Units | 53 (80.3%) | 13 (19.7%) |
Occupancy by Educational Attainment in Ophir
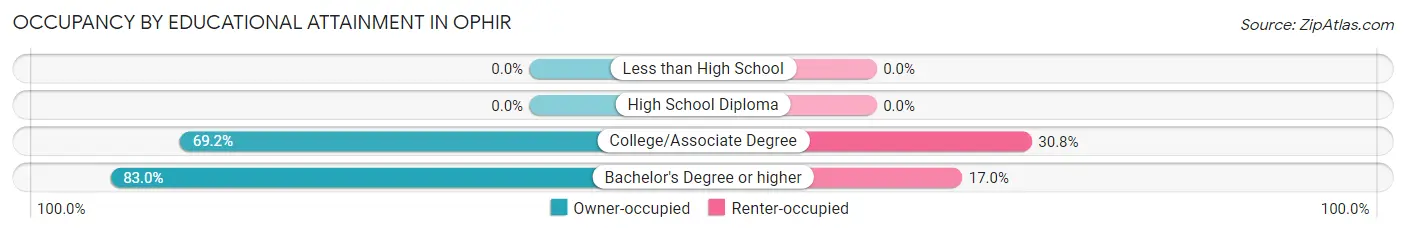
| Household Size | Owner-occupied | Renter-occupied |
| Less than High School | 0 (0.0%) | 0 (0.0%) |
| High School Diploma | 0 (0.0%) | 0 (0.0%) |
| College/Associate Degree | 9 (69.2%) | 4 (30.8%) |
| Bachelor's Degree or higher | 44 (83.0%) | 9 (17.0%) |
Occupancy by Age of Householder in Ophir
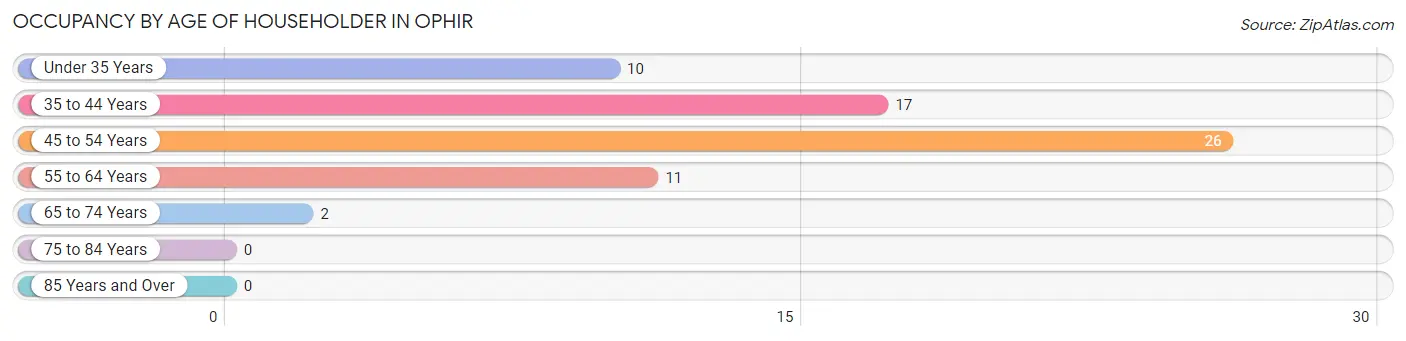
| Age Bracket | # Households | % Households |
| Under 35 Years | 10 | 15.1% |
| 35 to 44 Years | 17 | 25.8% |
| 45 to 54 Years | 26 | 39.4% |
| 55 to 64 Years | 11 | 16.7% |
| 65 to 74 Years | 2 | 3.0% |
| 75 to 84 Years | 0 | 0.0% |
| 85 Years and Over | 0 | 0.0% |
| Total | 66 | 100.0% |
Housing Finances in Ophir
Median Income by Occupancy in Ophir
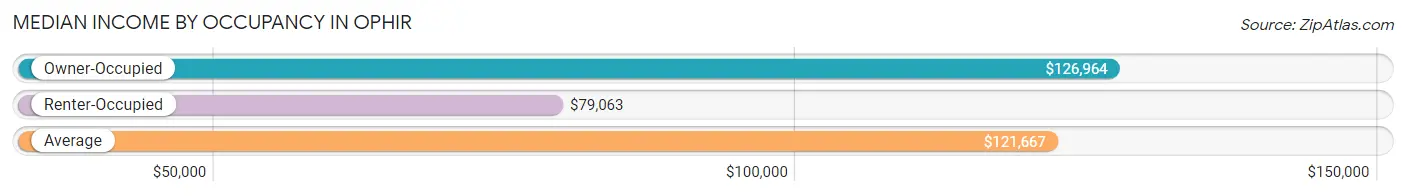
| Occupancy Type | # Households | Median Income |
| Owner-Occupied | 53 (80.3%) | $126,964 |
| Renter-Occupied | 13 (19.7%) | $79,063 |
| Average | 66 (100.0%) | $121,667 |
Occupancy by Householder Income Bracket in Ophir
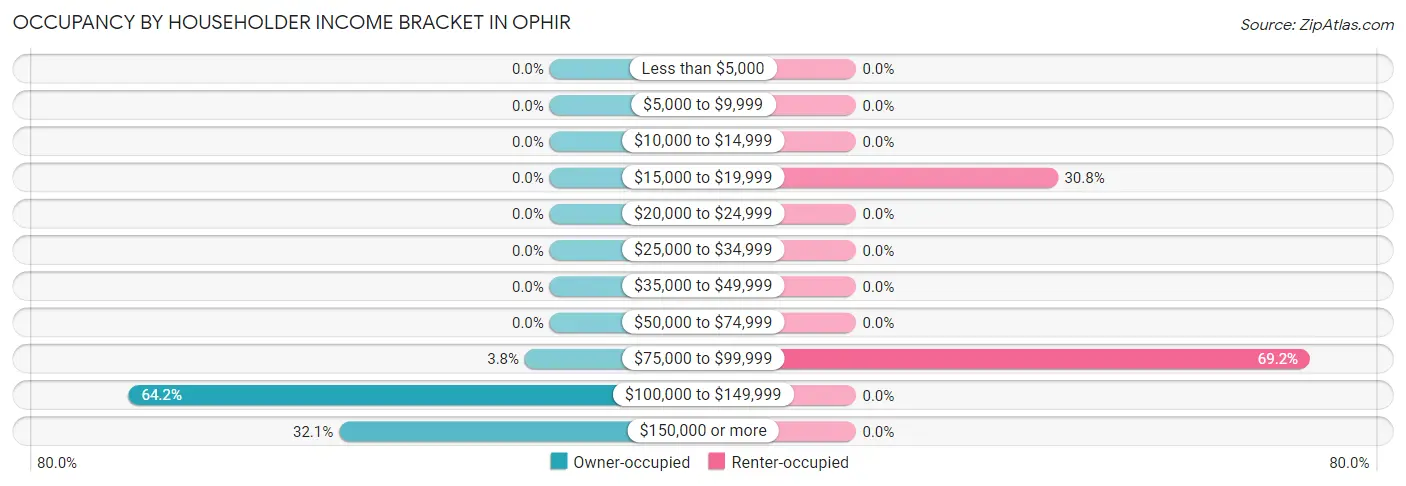
| Income Bracket | Owner-occupied | Renter-occupied |
| Less than $5,000 | 0 (0.0%) | 0 (0.0%) |
| $5,000 to $9,999 | 0 (0.0%) | 0 (0.0%) |
| $10,000 to $14,999 | 0 (0.0%) | 0 (0.0%) |
| $15,000 to $19,999 | 0 (0.0%) | 4 (30.8%) |
| $20,000 to $24,999 | 0 (0.0%) | 0 (0.0%) |
| $25,000 to $34,999 | 0 (0.0%) | 0 (0.0%) |
| $35,000 to $49,999 | 0 (0.0%) | 0 (0.0%) |
| $50,000 to $74,999 | 0 (0.0%) | 0 (0.0%) |
| $75,000 to $99,999 | 2 (3.8%) | 9 (69.2%) |
| $100,000 to $149,999 | 34 (64.1%) | 0 (0.0%) |
| $150,000 or more | 17 (32.1%) | 0 (0.0%) |
| Total | 53 (100.0%) | 13 (100.0%) |
Monthly Housing Cost Tiers in Ophir
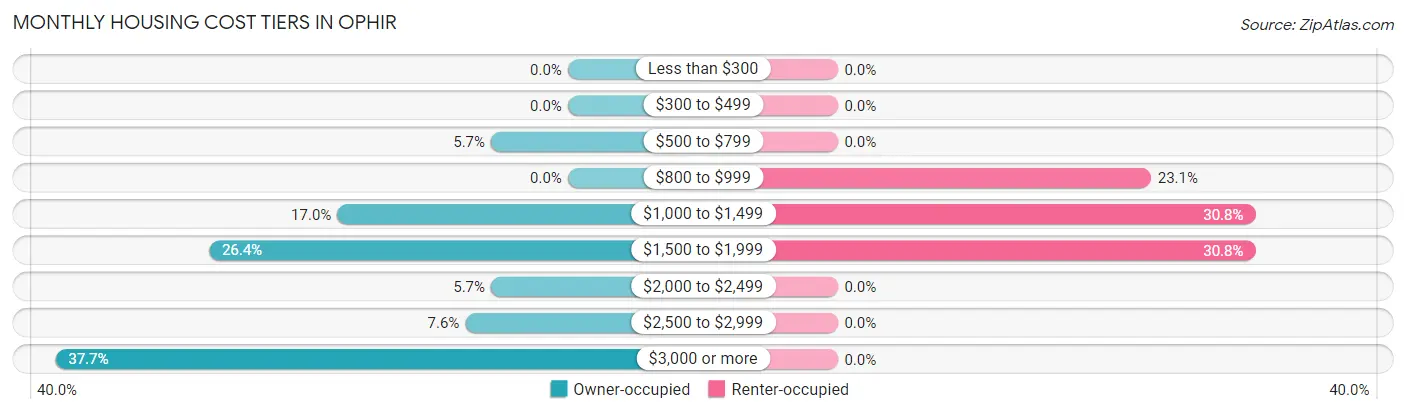
| Monthly Cost | Owner-occupied | Renter-occupied |
| Less than $300 | 0 (0.0%) | 0 (0.0%) |
| $300 to $499 | 0 (0.0%) | 0 (0.0%) |
| $500 to $799 | 3 (5.7%) | 0 (0.0%) |
| $800 to $999 | 0 (0.0%) | 3 (23.1%) |
| $1,000 to $1,499 | 9 (17.0%) | 4 (30.8%) |
| $1,500 to $1,999 | 14 (26.4%) | 4 (30.8%) |
| $2,000 to $2,499 | 3 (5.7%) | 0 (0.0%) |
| $2,500 to $2,999 | 4 (7.5%) | 0 (0.0%) |
| $3,000 or more | 20 (37.7%) | 0 (0.0%) |
| Total | 53 (100.0%) | 13 (100.0%) |
Physical Housing Characteristics in Ophir
Housing Structures in Ophir
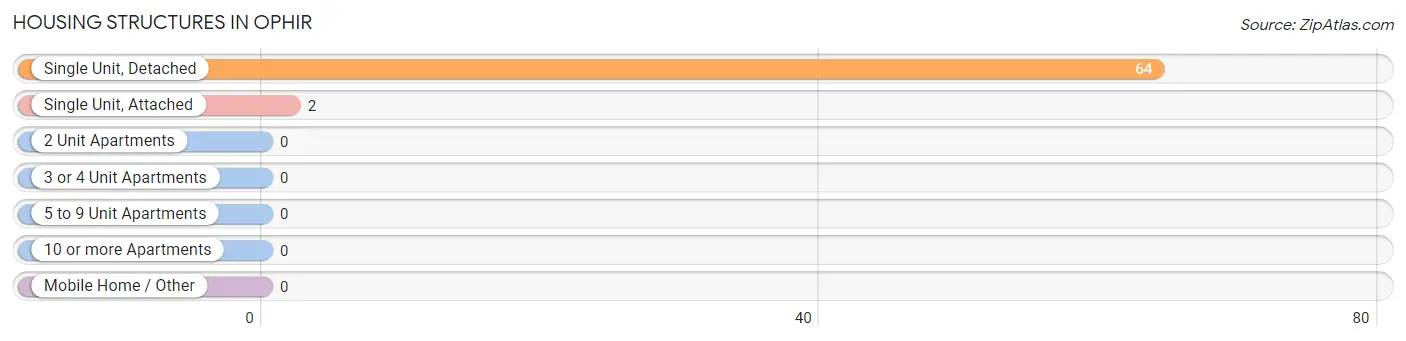
| Structure Type | # Housing Units | % Housing Units |
| Single Unit, Detached | 64 | 97.0% |
| Single Unit, Attached | 2 | 3.0% |
| 2 Unit Apartments | 0 | 0.0% |
| 3 or 4 Unit Apartments | 0 | 0.0% |
| 5 to 9 Unit Apartments | 0 | 0.0% |
| 10 or more Apartments | 0 | 0.0% |
| Mobile Home / Other | 0 | 0.0% |
| Total | 66 | 100.0% |
Housing Structures by Occupancy in Ophir
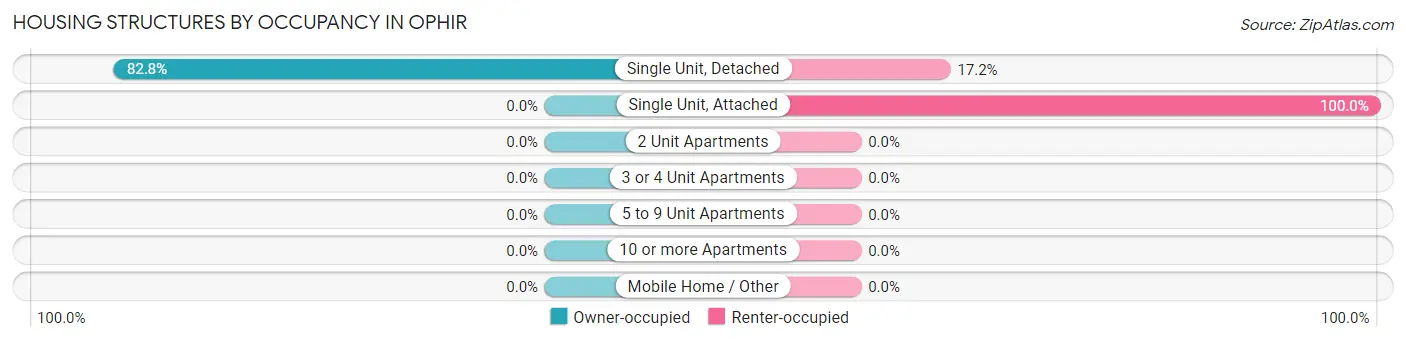
| Structure Type | Owner-occupied | Renter-occupied |
| Single Unit, Detached | 53 (82.8%) | 11 (17.2%) |
| Single Unit, Attached | 0 (0.0%) | 2 (100.0%) |
| 2 Unit Apartments | 0 (0.0%) | 0 (0.0%) |
| 3 or 4 Unit Apartments | 0 (0.0%) | 0 (0.0%) |
| 5 to 9 Unit Apartments | 0 (0.0%) | 0 (0.0%) |
| 10 or more Apartments | 0 (0.0%) | 0 (0.0%) |
| Mobile Home / Other | 0 (0.0%) | 0 (0.0%) |
| Total | 53 (80.3%) | 13 (19.7%) |
Housing Structures by Number of Rooms in Ophir
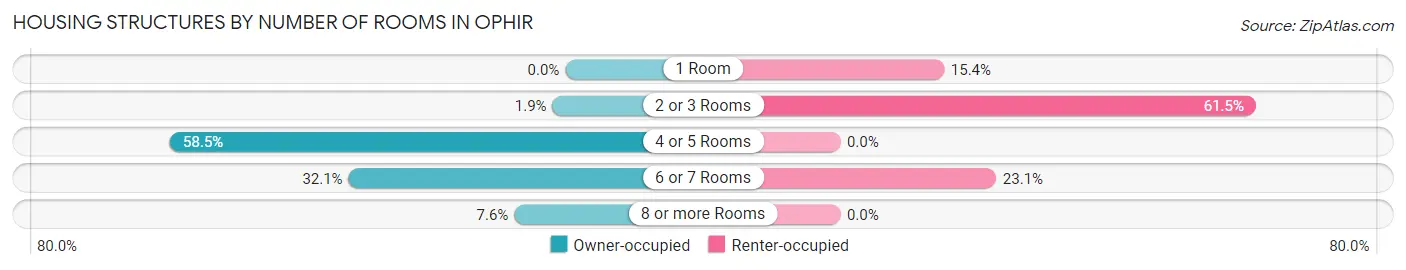
| Number of Rooms | Owner-occupied | Renter-occupied |
| 1 Room | 0 (0.0%) | 2 (15.4%) |
| 2 or 3 Rooms | 1 (1.9%) | 8 (61.5%) |
| 4 or 5 Rooms | 31 (58.5%) | 0 (0.0%) |
| 6 or 7 Rooms | 17 (32.1%) | 3 (23.1%) |
| 8 or more Rooms | 4 (7.5%) | 0 (0.0%) |
| Total | 53 (100.0%) | 13 (100.0%) |
Housing Structure by Heating Type in Ophir
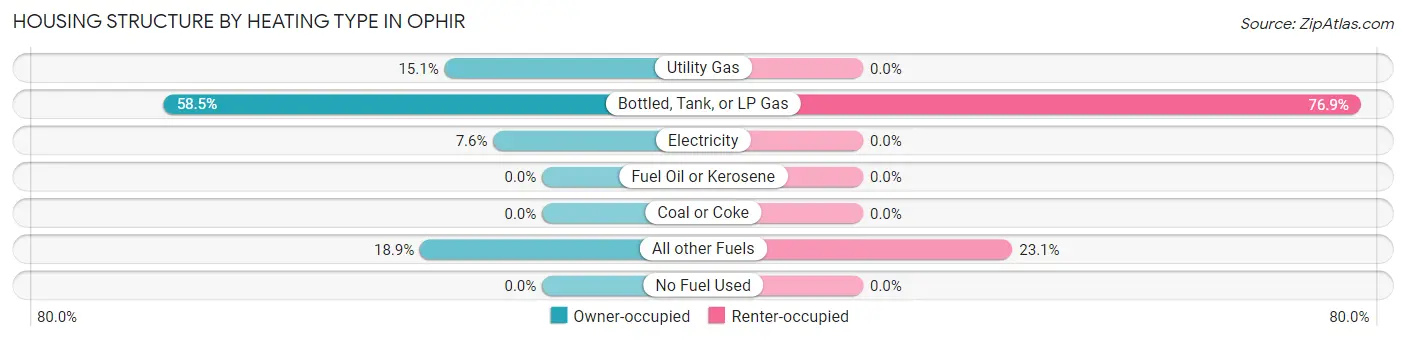
| Heating Type | Owner-occupied | Renter-occupied |
| Utility Gas | 8 (15.1%) | 0 (0.0%) |
| Bottled, Tank, or LP Gas | 31 (58.5%) | 10 (76.9%) |
| Electricity | 4 (7.5%) | 0 (0.0%) |
| Fuel Oil or Kerosene | 0 (0.0%) | 0 (0.0%) |
| Coal or Coke | 0 (0.0%) | 0 (0.0%) |
| All other Fuels | 10 (18.9%) | 3 (23.1%) |
| No Fuel Used | 0 (0.0%) | 0 (0.0%) |
| Total | 53 (100.0%) | 13 (100.0%) |
Household Vehicle Usage in Ophir
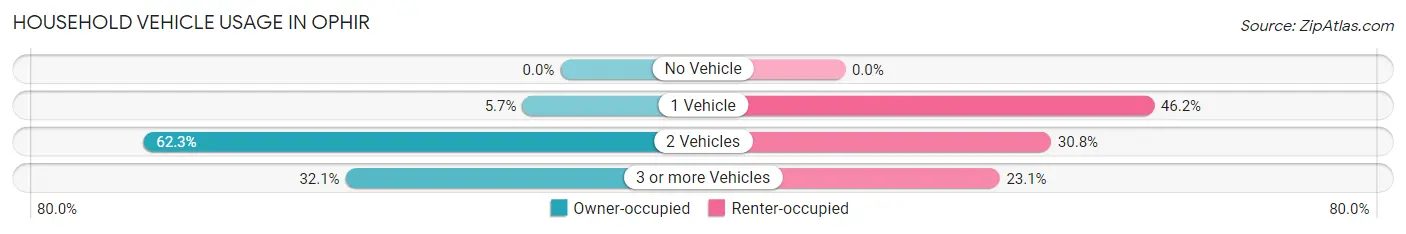
| Vehicles per Household | Owner-occupied | Renter-occupied |
| No Vehicle | 0 (0.0%) | 0 (0.0%) |
| 1 Vehicle | 3 (5.7%) | 6 (46.2%) |
| 2 Vehicles | 33 (62.3%) | 4 (30.8%) |
| 3 or more Vehicles | 17 (32.1%) | 3 (23.1%) |
| Total | 53 (100.0%) | 13 (100.0%) |
Real Estate & Mortgages in Ophir
Real Estate and Mortgage Overview in Ophir
| Characteristic | Without Mortgage | With Mortgage |
| Housing Units | 7 | 46 |
| Median Property Value | - | - |
| Median Household Income | - | - |
| Monthly Housing Costs | - | - |
| Real Estate Taxes | - | - |
Property Value by Mortgage Status in Ophir
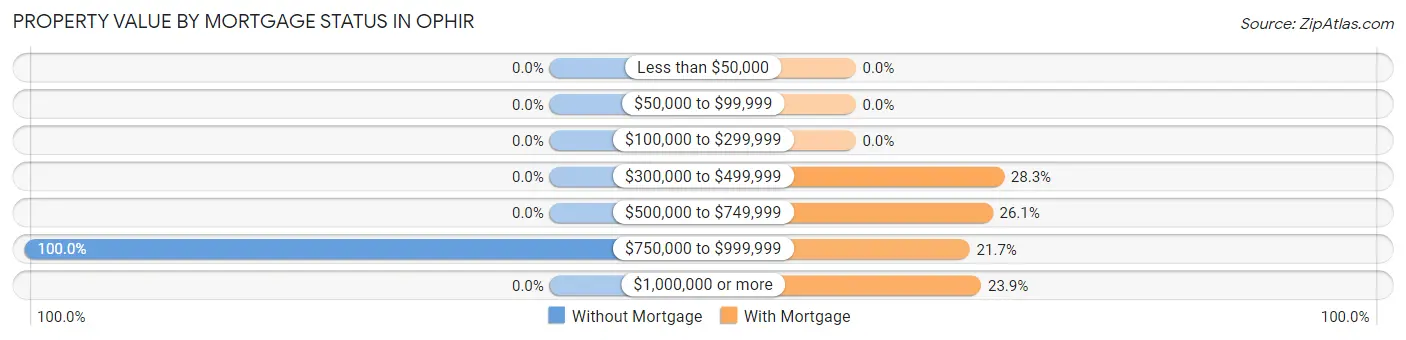
| Property Value | Without Mortgage | With Mortgage |
| Less than $50,000 | 0 (0.0%) | 0 (0.0%) |
| $50,000 to $99,999 | 0 (0.0%) | 0 (0.0%) |
| $100,000 to $299,999 | 0 (0.0%) | 0 (0.0%) |
| $300,000 to $499,999 | 0 (0.0%) | 13 (28.3%) |
| $500,000 to $749,999 | 0 (0.0%) | 12 (26.1%) |
| $750,000 to $999,999 | 7 (100.0%) | 10 (21.7%) |
| $1,000,000 or more | 0 (0.0%) | 11 (23.9%) |
| Total | 7 (100.0%) | 46 (100.0%) |
Household Income by Mortgage Status in Ophir
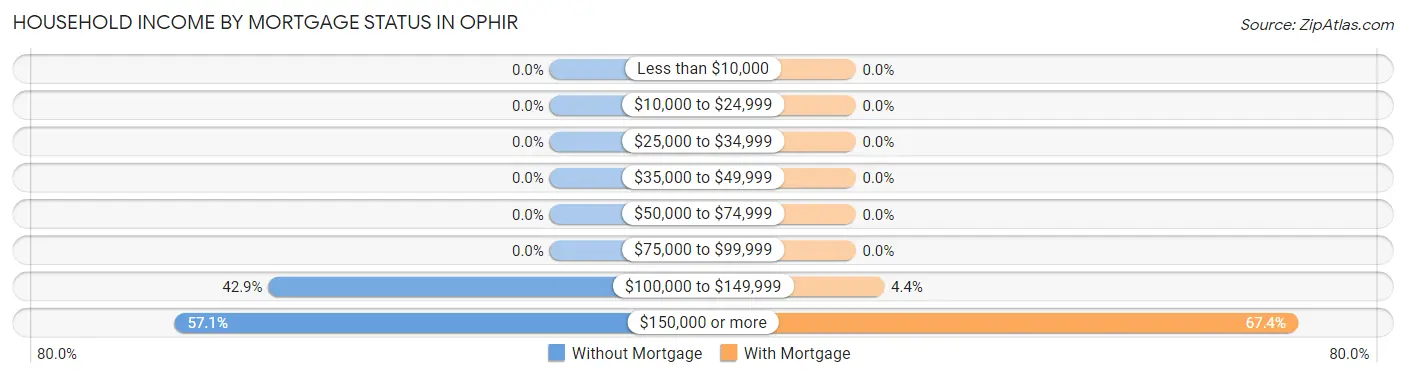
| Household Income | Without Mortgage | With Mortgage |
| Less than $10,000 | 0 (0.0%) | 0 (0.0%) |
| $10,000 to $24,999 | 0 (0.0%) | 0 (0.0%) |
| $25,000 to $34,999 | 0 (0.0%) | 0 (0.0%) |
| $35,000 to $49,999 | 0 (0.0%) | 0 (0.0%) |
| $50,000 to $74,999 | 0 (0.0%) | 0 (0.0%) |
| $75,000 to $99,999 | 0 (0.0%) | 0 (0.0%) |
| $100,000 to $149,999 | 3 (42.9%) | 2 (4.3%) |
| $150,000 or more | 4 (57.1%) | 31 (67.4%) |
| Total | 7 (100.0%) | 46 (100.0%) |
Property Value to Household Income Ratio in Ophir
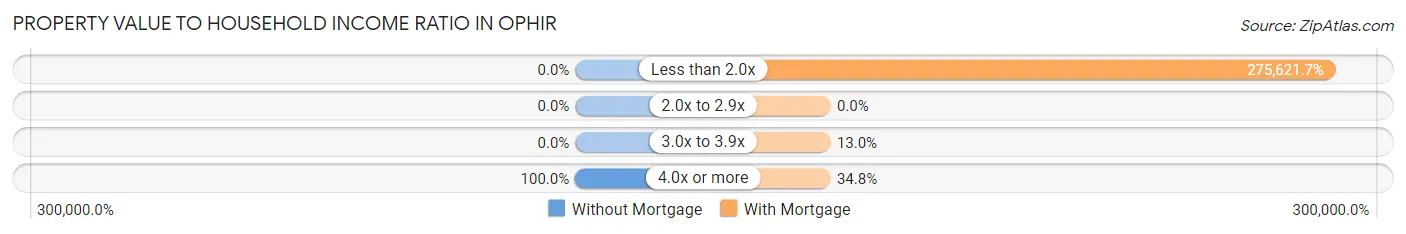
| Value-to-Income Ratio | Without Mortgage | With Mortgage |
| Less than 2.0x | 0 (0.0%) | 126,786 (275,621.7%) |
| 2.0x to 2.9x | 0 (0.0%) | 0 (0.0%) |
| 3.0x to 3.9x | 0 (0.0%) | 6 (13.0%) |
| 4.0x or more | 7 (100.0%) | 16 (34.8%) |
| Total | 7 (100.0%) | 46 (100.0%) |
Real Estate Taxes by Mortgage Status in Ophir
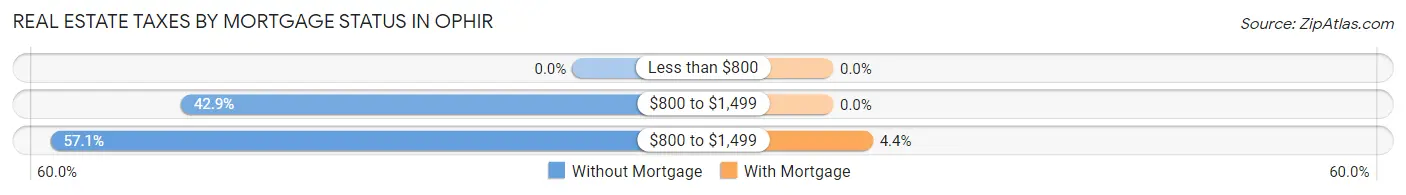
| Property Taxes | Without Mortgage | With Mortgage |
| Less than $800 | 0 (0.0%) | 0 (0.0%) |
| $800 to $1,499 | 3 (42.9%) | 0 (0.0%) |
| $800 to $1,499 | 4 (57.1%) | 2 (4.3%) |
| Total | 7 (100.0%) | 46 (100.0%) |
Health & Disability in Ophir
Health Insurance Coverage by Age in Ophir
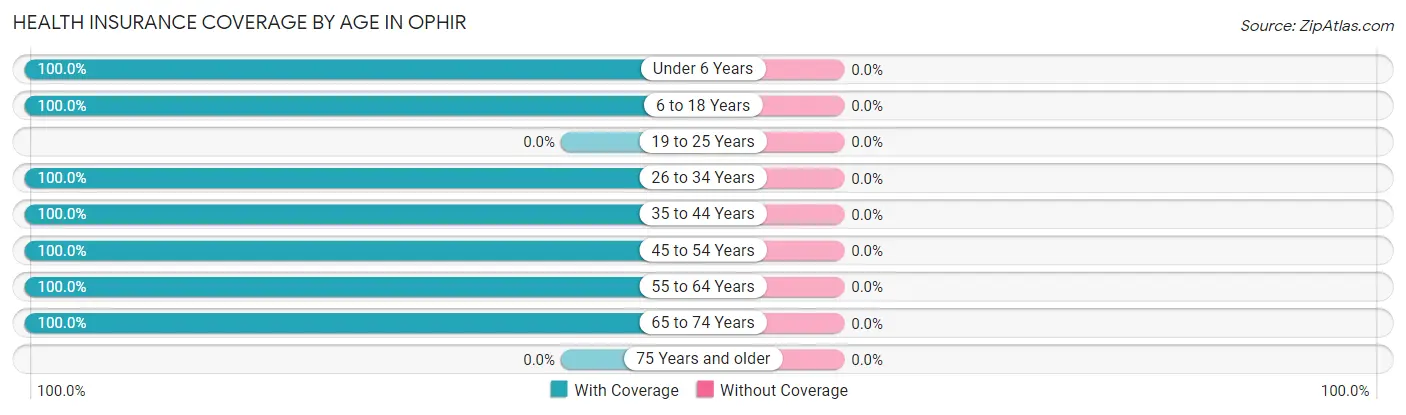
| Age Bracket | With Coverage | Without Coverage |
| Under 6 Years | 16 (100.0%) | 0 (0.0%) |
| 6 to 18 Years | 28 (100.0%) | 0 (0.0%) |
| 19 to 25 Years | 0 (0.0%) | 0 (0.0%) |
| 26 to 34 Years | 40 (100.0%) | 0 (0.0%) |
| 35 to 44 Years | 27 (100.0%) | 0 (0.0%) |
| 45 to 54 Years | 56 (100.0%) | 0 (0.0%) |
| 55 to 64 Years | 11 (100.0%) | 0 (0.0%) |
| 65 to 74 Years | 2 (100.0%) | 0 (0.0%) |
| 75 Years and older | 0 (0.0%) | 0 (0.0%) |
| Total | 180 (100.0%) | 0 (0.0%) |
Health Insurance Coverage by Citizenship Status in Ophir

| Citizenship Status | With Coverage | Without Coverage |
| Native Born | 16 (100.0%) | 0 (0.0%) |
| Foreign Born, Citizen | 28 (100.0%) | 0 (0.0%) |
| Foreign Born, not a Citizen | 0 (0.0%) | 0 (0.0%) |
Health Insurance Coverage by Household Income in Ophir
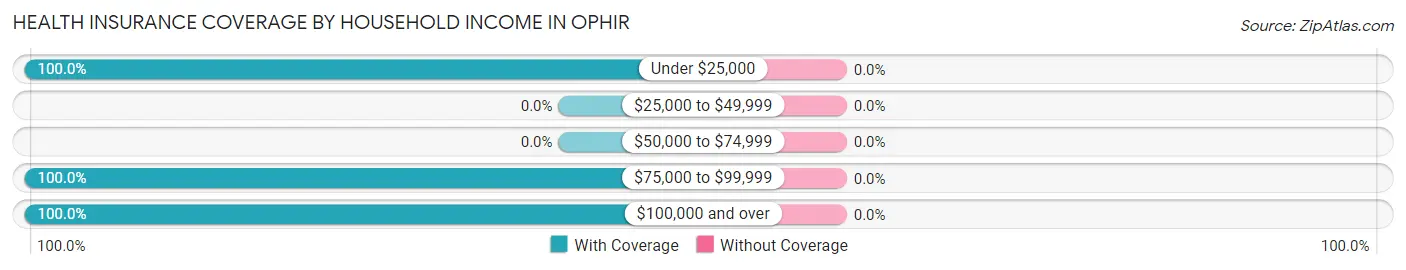
| Household Income | With Coverage | Without Coverage |
| Under $25,000 | 7 (100.0%) | 0 (0.0%) |
| $25,000 to $49,999 | 0 (0.0%) | 0 (0.0%) |
| $50,000 to $74,999 | 0 (0.0%) | 0 (0.0%) |
| $75,000 to $99,999 | 21 (100.0%) | 0 (0.0%) |
| $100,000 and over | 152 (100.0%) | 0 (0.0%) |
Public vs Private Health Insurance Coverage by Age in Ophir
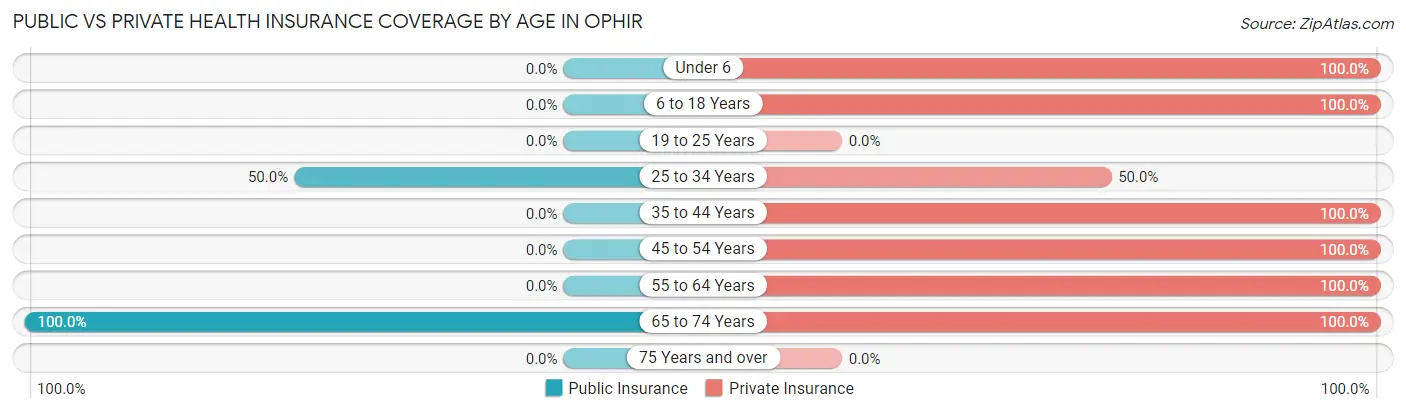
| Age Bracket | Public Insurance | Private Insurance |
| Under 6 | 0 (0.0%) | 16 (100.0%) |
| 6 to 18 Years | 0 (0.0%) | 28 (100.0%) |
| 19 to 25 Years | 0 (0.0%) | 0 (0.0%) |
| 25 to 34 Years | 20 (50.0%) | 20 (50.0%) |
| 35 to 44 Years | 0 (0.0%) | 27 (100.0%) |
| 45 to 54 Years | 0 (0.0%) | 56 (100.0%) |
| 55 to 64 Years | 0 (0.0%) | 11 (100.0%) |
| 65 to 74 Years | 2 (100.0%) | 2 (100.0%) |
| 75 Years and over | 0 (0.0%) | 0 (0.0%) |
| Total | 22 (12.2%) | 160 (88.9%) |
Disability Status by Sex by Age in Ophir
| Age Bracket | Male | Female |
| Under 5 Years | 0 (0.0%) | 0 (0.0%) |
| 5 to 17 Years | 0 (0.0%) | 0 (0.0%) |
| 18 to 34 Years | 0 (0.0%) | 0 (0.0%) |
| 35 to 64 Years | 0 (0.0%) | 0 (0.0%) |
| 65 to 74 Years | 0 (0.0%) | 0 (0.0%) |
| 75 Years and over | 0 (0.0%) | 0 (0.0%) |
Disability Class by Sex by Age in Ophir
Disability Class: Hearing Difficulty
| Age Bracket | Male | Female |
| Under 5 Years | 0 (0.0%) | 0 (0.0%) |
| 5 to 17 Years | 0 (0.0%) | 0 (0.0%) |
| 18 to 34 Years | 0 (0.0%) | 0 (0.0%) |
| 35 to 64 Years | 0 (0.0%) | 0 (0.0%) |
| 65 to 74 Years | 0 (0.0%) | 0 (0.0%) |
| 75 Years and over | 0 (0.0%) | 0 (0.0%) |
Disability Class: Vision Difficulty
| Age Bracket | Male | Female |
| Under 5 Years | 0 (0.0%) | 0 (0.0%) |
| 5 to 17 Years | 0 (0.0%) | 0 (0.0%) |
| 18 to 34 Years | 0 (0.0%) | 0 (0.0%) |
| 35 to 64 Years | 0 (0.0%) | 0 (0.0%) |
| 65 to 74 Years | 0 (0.0%) | 0 (0.0%) |
| 75 Years and over | 0 (0.0%) | 0 (0.0%) |
Disability Class: Cognitive Difficulty
| Age Bracket | Male | Female |
| 5 to 17 Years | 0 (0.0%) | 0 (0.0%) |
| 18 to 34 Years | 0 (0.0%) | 0 (0.0%) |
| 35 to 64 Years | 0 (0.0%) | 0 (0.0%) |
| 65 to 74 Years | 0 (0.0%) | 0 (0.0%) |
| 75 Years and over | 0 (0.0%) | 0 (0.0%) |
Disability Class: Ambulatory Difficulty
| Age Bracket | Male | Female |
| 5 to 17 Years | 0 (0.0%) | 0 (0.0%) |
| 18 to 34 Years | 0 (0.0%) | 0 (0.0%) |
| 35 to 64 Years | 0 (0.0%) | 0 (0.0%) |
| 65 to 74 Years | 0 (0.0%) | 0 (0.0%) |
| 75 Years and over | 0 (0.0%) | 0 (0.0%) |
Disability Class: Self-Care Difficulty
| Age Bracket | Male | Female |
| 5 to 17 Years | 0 (0.0%) | 0 (0.0%) |
| 18 to 34 Years | 0 (0.0%) | 0 (0.0%) |
| 35 to 64 Years | 0 (0.0%) | 0 (0.0%) |
| 65 to 74 Years | 0 (0.0%) | 0 (0.0%) |
| 75 Years and over | 0 (0.0%) | 0 (0.0%) |
Technology Access in Ophir
Computing Device Access in Ophir
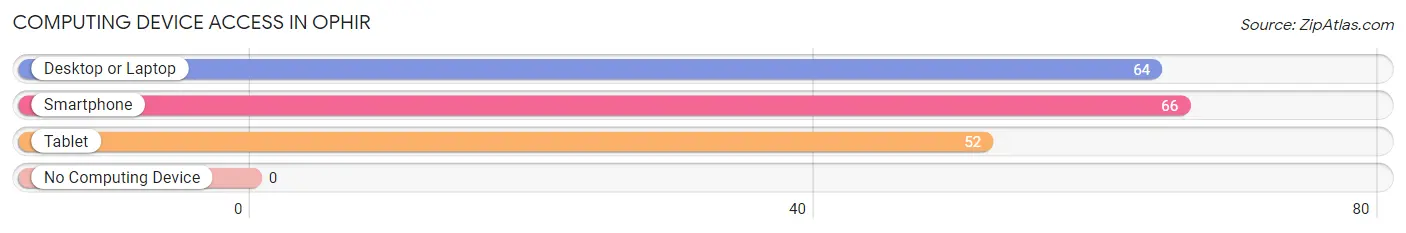
| Device Type | # Households | % Households |
| Desktop or Laptop | 64 | 97.0% |
| Smartphone | 66 | 100.0% |
| Tablet | 52 | 78.8% |
| No Computing Device | 0 | 0.0% |
| Total | 66 | 100.0% |
Internet Access in Ophir
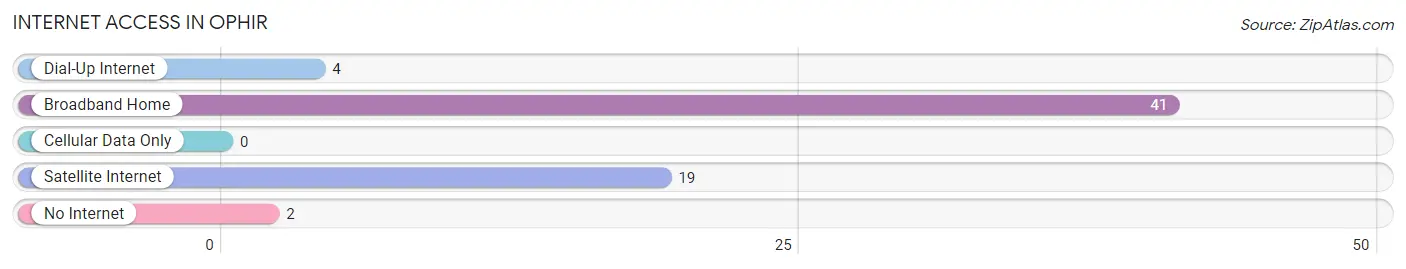
| Internet Type | # Households | % Households |
| Dial-Up Internet | 4 | 6.1% |
| Broadband Home | 41 | 62.1% |
| Cellular Data Only | 0 | 0.0% |
| Satellite Internet | 19 | 28.8% |
| No Internet | 2 | 3.0% |
| Total | 66 | 100.0% |
Ophir Summary
Ophir is a small unincorporated community located in San Miguel County, Colorado. It is situated in the San Juan Mountains, approximately 10 miles south of Telluride. The town is located at an elevation of 9,400 feet and has a population of approximately 200 people.
History
Ophir was founded in 1875 by prospectors who were searching for gold and silver in the area. The town was named after the biblical city of Ophir, which was known for its wealth of gold and silver. The town quickly grew and by 1880, it had a population of over 500 people.
The town was home to several mines, including the Ophir Mine, which was the largest and most successful. The mine produced over $2 million in gold and silver during its peak years. The town also had a post office, a school, a hotel, and several stores.
In the early 1900s, the town began to decline as the mines began to close. By the 1950s, the population had dropped to just over 100 people. The town has remained relatively small since then, with a population of around 200 people.
Geography
Ophir is located in the San Juan Mountains of southwestern Colorado. The town is situated at an elevation of 9,400 feet and is surrounded by mountains and forests. The town is located approximately 10 miles south of Telluride and is accessible by a dirt road.
The climate in Ophir is generally cool and dry, with temperatures ranging from the low 30s in the winter to the mid-70s in the summer. The town receives an average of over 200 inches of snow each year.
Economy
The economy of Ophir is largely based on tourism. The town is a popular destination for outdoor activities such as skiing, snowmobiling, and hiking. The town also has several restaurants, bars, and shops.
The town is also home to several small businesses, including a general store, a gas station, and a post office. The town is also home to several art galleries and studios.
Demographics
As of the 2010 census, the population of Ophir was 200 people. The racial makeup of the town was 97.5% White, 0.5% Native American, 0.5% Asian, and 1.5% from other races. The median household income was $45,000 and the median age was 44 years.
Conclusion
Ophir is a small unincorporated community located in San Miguel County, Colorado. It is situated in the San Juan Mountains, approximately 10 miles south of Telluride. The town is located at an elevation of 9,400 feet and has a population of approximately 200 people. The economy of Ophir is largely based on tourism and the town is a popular destination for outdoor activities. The town is also home to several small businesses, including a general store, a gas station, and a post office. As of the 2010 census, the population of Ophir was 200 people. The racial makeup of the town was 97.5% White, 0.5% Native American, 0.5% Asian, and 1.5% from other races. The median household income was $45,000 and the median age was 44 years.
Common Questions
What is Per Capita Income in Ophir?
Per Capita income in Ophir is $53,064.
What is the Median Family Income in Ophir?
Median Family Income in Ophir is $126,607.
What is the Median Household income in Ophir?
Median Household Income in Ophir is $121,667.
What is Income or Wage Gap in Ophir?
Income or Wage Gap in Ophir is 42.9%.
Women in Ophir earn 57.1 cents for every dollar earned by a man.
What is Inequality or Gini Index in Ophir?
Inequality or Gini Index in Ophir is 0.26.
What is the Total Population of Ophir?
Total Population of Ophir is 180.
What is the Total Male Population of Ophir?
Total Male Population of Ophir is 90.
What is the Total Female Population of Ophir?
Total Female Population of Ophir is 90.
What is the Ratio of Males per 100 Females in Ophir?
There are 100.00 Males per 100 Females in Ophir.
What is the Ratio of Females per 100 Males in Ophir?
There are 100.00 Females per 100 Males in Ophir.
What is the Median Population Age in Ophir?
Median Population Age in Ophir is 35.9 Years.
What is the Average Family Size in Ophir
Average Family Size in Ophir is 2.8 People.
What is the Average Household Size in Ophir
Average Household Size in Ophir is 2.7 People.
How Large is the Labor Force in Ophir?
There are 134 People in the Labor Forcein in Ophir.
What is the Percentage of People in the Labor Force in Ophir?
95.0% of People are in the Labor Force in Ophir.
What is the Unemployment Rate in Ophir?
Unemployment Rate in Ophir is 6.0%.