Bellows Falls, VT Map & Demographics
Bellows Falls Map
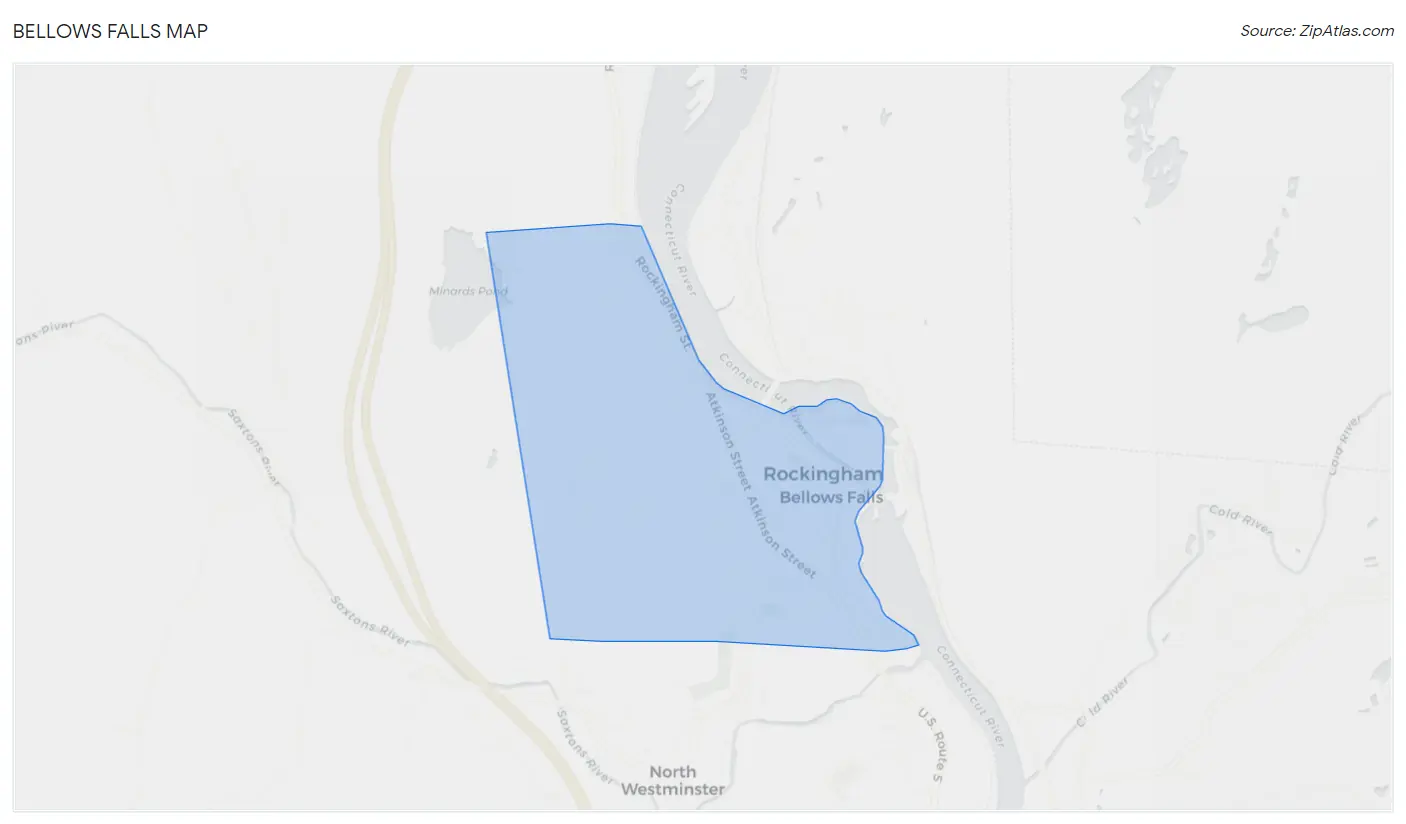
Bellows Falls Overview
$30,072
PER CAPITA INCOME
$76,250
AVG FAMILY INCOME
$52,813
AVG HOUSEHOLD INCOME
0.0%
WAGE / INCOME GAP [ % ]
100.0¢/ $1
WAGE / INCOME GAP [ $ ]
$15,558
FAMILY INCOME DEFICIT
0.38
INEQUALITY / GINI INDEX
2,824
TOTAL POPULATION
1,107
MALE POPULATION
1,717
FEMALE POPULATION
64.47
MALES / 100 FEMALES
155.10
FEMALES / 100 MALES
41.9
MEDIAN AGE
3.0
AVG FAMILY SIZE
2.1
AVG HOUSEHOLD SIZE
1,538
LABOR FORCE [ PEOPLE ]
67.5%
PERCENT IN LABOR FORCE
3.0%
UNEMPLOYMENT RATE
Bellows Falls Zip Codes
Bellows Falls Area Codes
Income in Bellows Falls
Income Overview in Bellows Falls
Per Capita Income in Bellows Falls is $30,072, while median incomes of families and households are $76,250 and $52,813 respectively.
| Characteristic | Number | Measure |
| Per Capita Income | 2,824 | $30,072 |
| Median Family Income | 548 | $76,250 |
| Mean Family Income | 548 | $78,903 |
| Median Household Income | 1,292 | $52,813 |
| Mean Household Income | 1,292 | $64,805 |
| Income Deficit | 548 | $15,558 |
| Wage / Income Gap (%) | 2,824 | 0.01% |
| Wage / Income Gap ($) | 2,824 | 99.99¢ per $1 |
| Gini / Inequality Index | 2,824 | 0.38 |
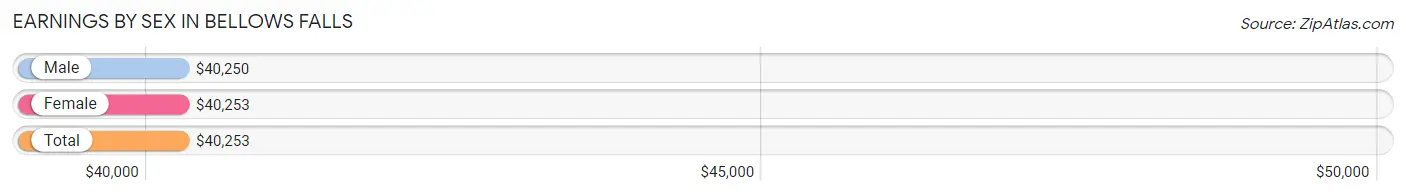
Earnings by Sex in Bellows Falls
Average Earnings in Bellows Falls are $40,253, $40,250 for men and $40,253 for women, a difference of 0.0%.
| Sex | Number | Average Earnings |
| Male | 643 (40.7%) | $40,250 |
| Female | 937 (59.3%) | $40,253 |
| Total | 1,580 (100.0%) | $40,253 |
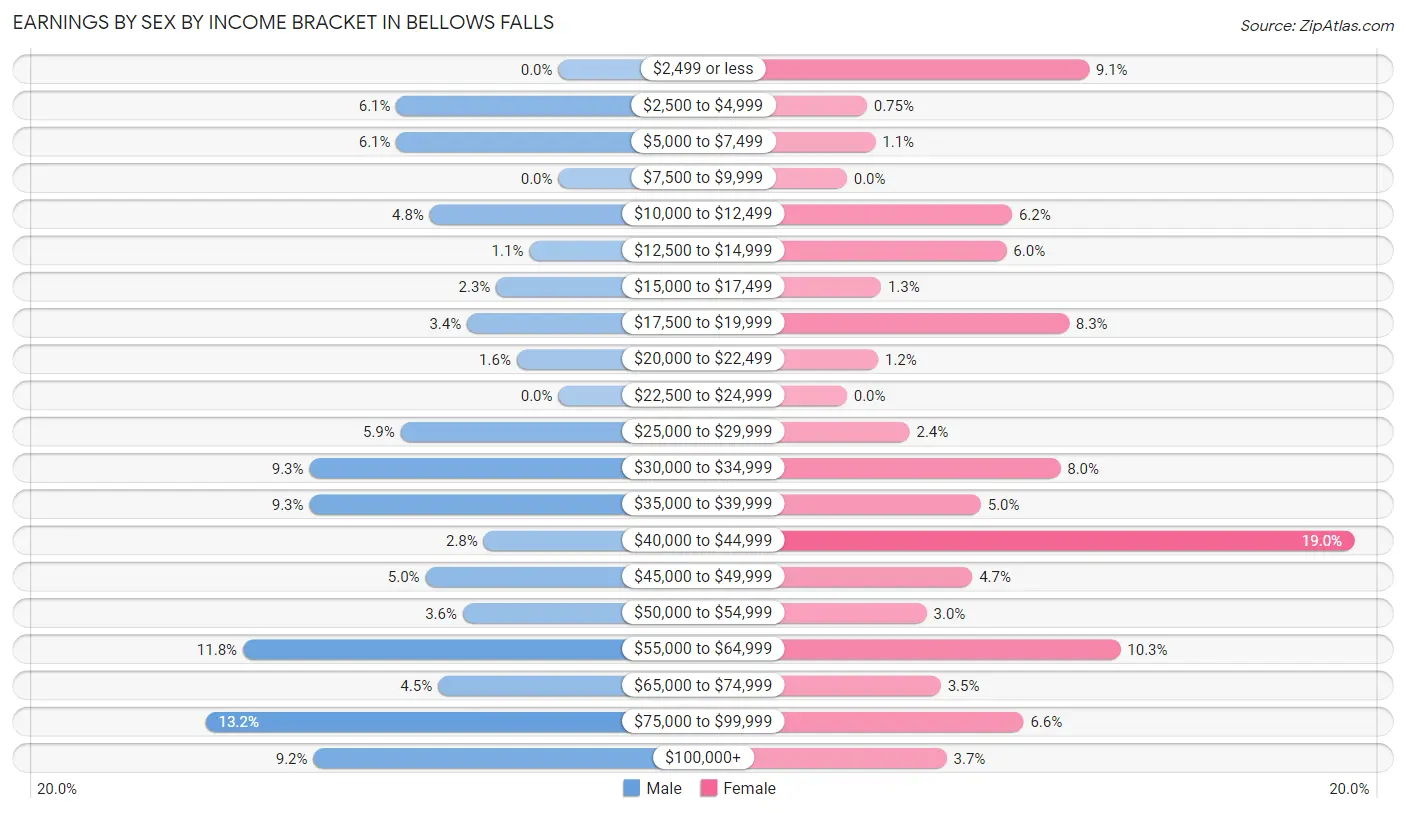
Earnings by Sex by Income Bracket in Bellows Falls
The most common earnings brackets in Bellows Falls are $75,000 to $99,999 for men (85 | 13.2%) and $40,000 to $44,999 for women (178 | 19.0%).
| Income | Male | Female |
| $2,499 or less | 0 (0.0%) | 85 (9.1%) |
| $2,500 to $4,999 | 39 (6.1%) | 7 (0.7%) |
| $5,000 to $7,499 | 39 (6.1%) | 10 (1.1%) |
| $7,500 to $9,999 | 0 (0.0%) | 0 (0.0%) |
| $10,000 to $12,499 | 31 (4.8%) | 58 (6.2%) |
| $12,500 to $14,999 | 7 (1.1%) | 56 (6.0%) |
| $15,000 to $17,499 | 15 (2.3%) | 12 (1.3%) |
| $17,500 to $19,999 | 22 (3.4%) | 78 (8.3%) |
| $20,000 to $22,499 | 10 (1.6%) | 11 (1.2%) |
| $22,500 to $24,999 | 0 (0.0%) | 0 (0.0%) |
| $25,000 to $29,999 | 38 (5.9%) | 22 (2.4%) |
| $30,000 to $34,999 | 60 (9.3%) | 75 (8.0%) |
| $35,000 to $39,999 | 60 (9.3%) | 47 (5.0%) |
| $40,000 to $44,999 | 18 (2.8%) | 178 (19.0%) |
| $45,000 to $49,999 | 32 (5.0%) | 44 (4.7%) |
| $50,000 to $54,999 | 23 (3.6%) | 28 (3.0%) |
| $55,000 to $64,999 | 76 (11.8%) | 96 (10.2%) |
| $65,000 to $74,999 | 29 (4.5%) | 33 (3.5%) |
| $75,000 to $99,999 | 85 (13.2%) | 62 (6.6%) |
| $100,000+ | 59 (9.2%) | 35 (3.7%) |
| Total | 643 (100.0%) | 937 (100.0%) |
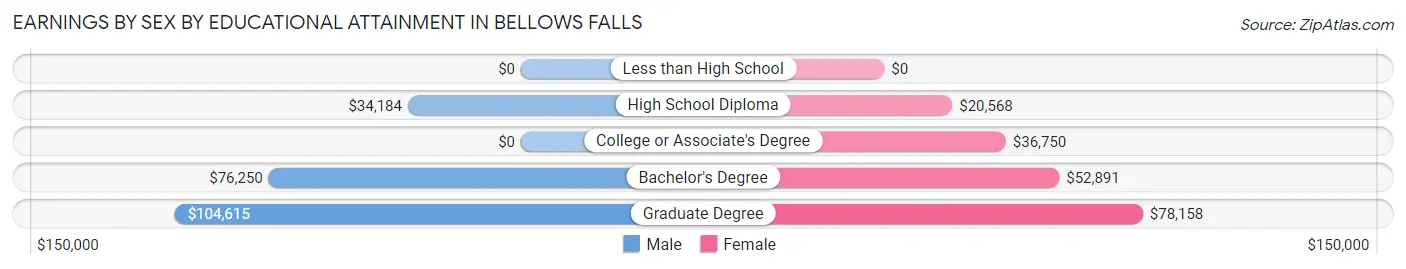
Earnings by Sex by Educational Attainment in Bellows Falls
Average earnings in Bellows Falls are $45,977 for men and $40,507 for women, a difference of 11.9%. Men with an educational attainment of graduate degree enjoy the highest average annual earnings of $104,615, while those with high school diploma education earn the least with $34,184. Women with an educational attainment of graduate degree earn the most with the average annual earnings of $78,158, while those with high school diploma education have the smallest earnings of $20,568.
| Educational Attainment | Male Income | Female Income |
| Less than High School | - | - |
| High School Diploma | $34,184 | $20,568 |
| College or Associate's Degree | - | - |
| Bachelor's Degree | $76,250 | $52,891 |
| Graduate Degree | $104,615 | $78,158 |
| Total | $45,977 | $40,507 |
Family Income in Bellows Falls
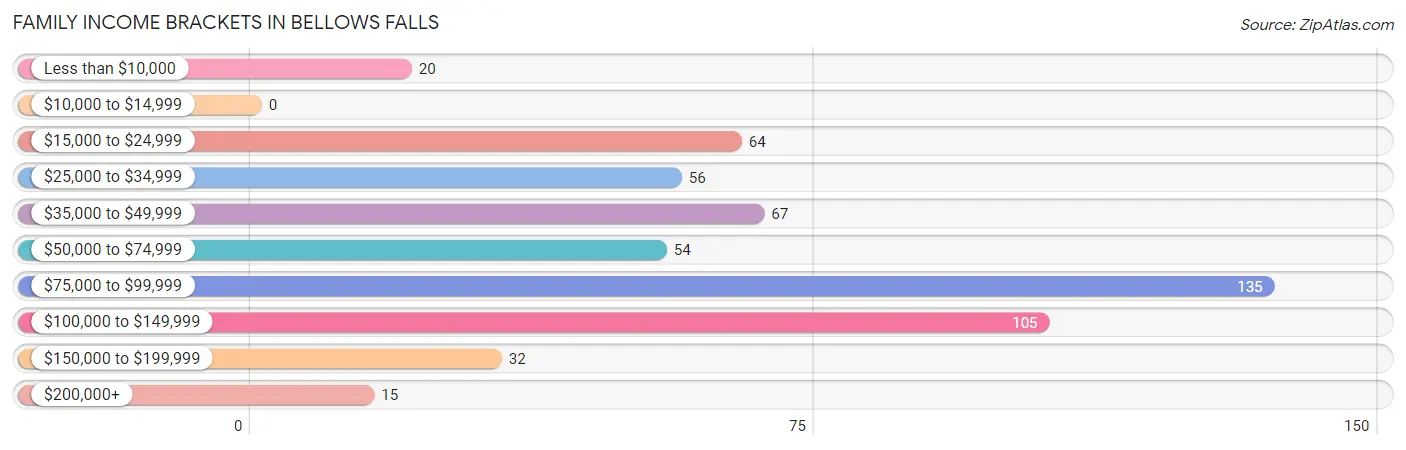
Family Income Brackets in Bellows Falls
According to the Bellows Falls family income data, there are 135 families falling into the $75,000 to $99,999 income range, which is the most common income bracket and makes up 24.6% of all families.
| Income Bracket | # Families | % Families |
| Less than $10,000 | 20 | 3.6% |
| $10,000 to $14,999 | 0 | 0.0% |
| $15,000 to $24,999 | 64 | 11.7% |
| $25,000 to $34,999 | 56 | 10.2% |
| $35,000 to $49,999 | 67 | 12.2% |
| $50,000 to $74,999 | 54 | 9.9% |
| $75,000 to $99,999 | 135 | 24.6% |
| $100,000 to $149,999 | 105 | 19.2% |
| $150,000 to $199,999 | 32 | 5.8% |
| $200,000+ | 15 | 2.7% |
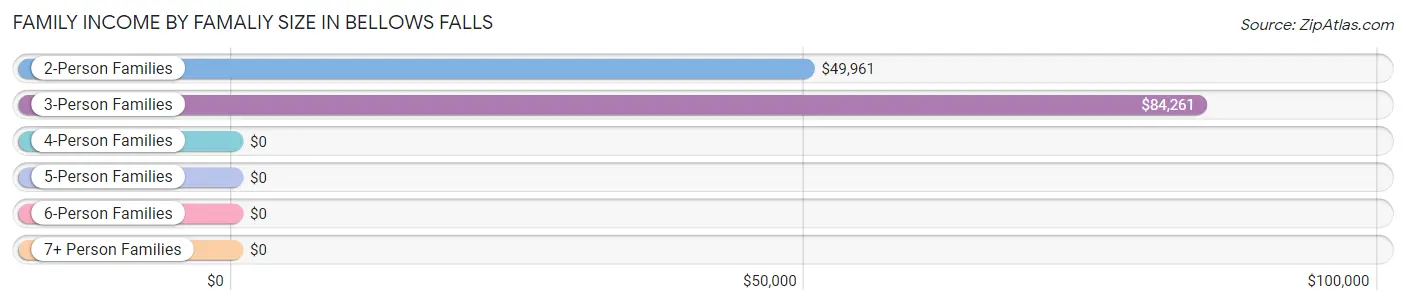
Family Income by Famaliy Size in Bellows Falls
3-person families (103 | 18.8%) account for the highest median family income in Bellows Falls with $84,261 per family, while 3-person families (103 | 18.8%) have the highest median income of $28,087 per family member.
| Income Bracket | # Families | Median Income |
| 2-Person Families | 283 (51.6%) | $49,961 |
| 3-Person Families | 103 (18.8%) | $84,261 |
| 4-Person Families | 119 (21.7%) | $0 |
| 5-Person Families | 43 (7.9%) | $0 |
| 6-Person Families | 0 (0.0%) | $0 |
| 7+ Person Families | 0 (0.0%) | $0 |
| Total | 548 (100.0%) | $76,250 |
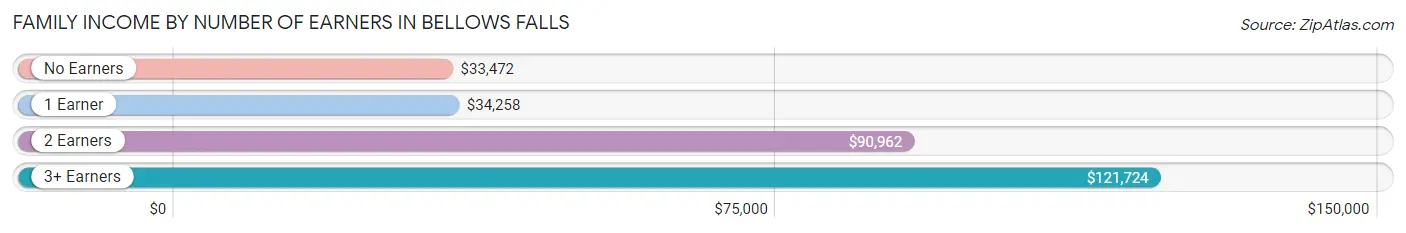
Family Income by Number of Earners in Bellows Falls
The median family income in Bellows Falls is $76,250, with families comprising 3+ earners (50) having the highest median family income of $121,724, while families with no earners (45) have the lowest median family income of $33,472, accounting for 9.1% and 8.2% of families, respectively.
| Number of Earners | # Families | Median Income |
| No Earners | 45 (8.2%) | $33,472 |
| 1 Earner | 205 (37.4%) | $34,258 |
| 2 Earners | 248 (45.3%) | $90,962 |
| 3+ Earners | 50 (9.1%) | $121,724 |
| Total | 548 (100.0%) | $76,250 |
Household Income in Bellows Falls
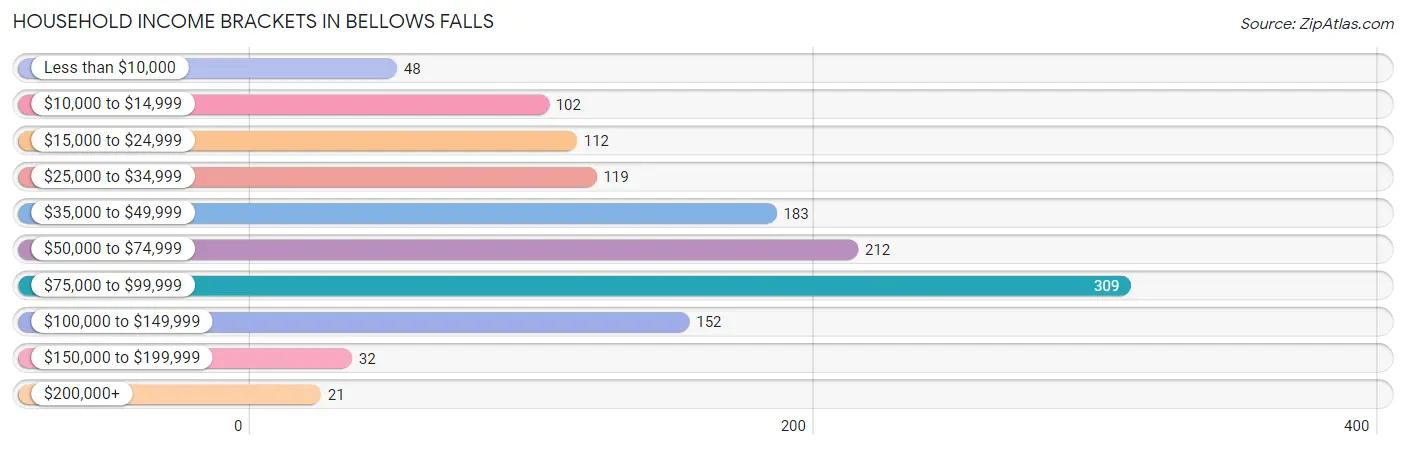
Household Income Brackets in Bellows Falls
With 309 households falling in the category, the $75,000 to $99,999 income range is the most frequent in Bellows Falls, accounting for 23.9% of all households. In contrast, only 21 households (1.6%) fall into the $200,000+ income bracket, making it the least populous group.
| Income Bracket | # Households | % Households |
| Less than $10,000 | 48 | 3.7% |
| $10,000 to $14,999 | 102 | 7.9% |
| $15,000 to $24,999 | 112 | 8.7% |
| $25,000 to $34,999 | 119 | 9.2% |
| $35,000 to $49,999 | 183 | 14.2% |
| $50,000 to $74,999 | 212 | 16.4% |
| $75,000 to $99,999 | 309 | 23.9% |
| $100,000 to $149,999 | 152 | 11.8% |
| $150,000 to $199,999 | 32 | 2.5% |
| $200,000+ | 21 | 1.6% |
Household Income by Householder Age in Bellows Falls
The median household income in Bellows Falls is $52,813, with the highest median household income of $87,624 found in the 15 to 24 years age bracket for the primary householder. A total of 173 households (13.4%) fall into this category. Meanwhile, the 65+ years age bracket for the primary householder has the lowest median household income of $32,669, with 335 households (25.9%) in this group.
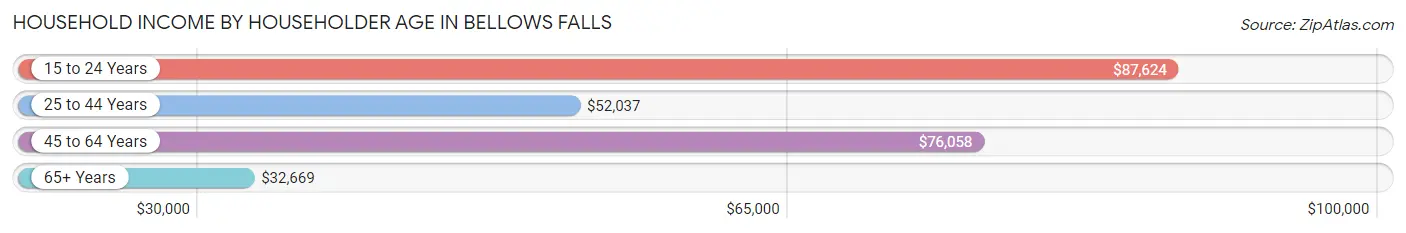
| Income Bracket | # Households | Median Income |
| 15 to 24 Years | 173 (13.4%) | $87,624 |
| 25 to 44 Years | 268 (20.7%) | $52,037 |
| 45 to 64 Years | 516 (39.9%) | $76,058 |
| 65+ Years | 335 (25.9%) | $32,669 |
| Total | 1,292 (100.0%) | $52,813 |
Poverty in Bellows Falls
Income Below Poverty by Sex and Age in Bellows Falls
With 29.2% poverty level for males and 13.7% for females among the residents of Bellows Falls, 12 to 14 year old males and under 5 year old females are the most vulnerable to poverty, with 25 males (100.0%) and 45 females (48.9%) in their respective age groups living below the poverty level.
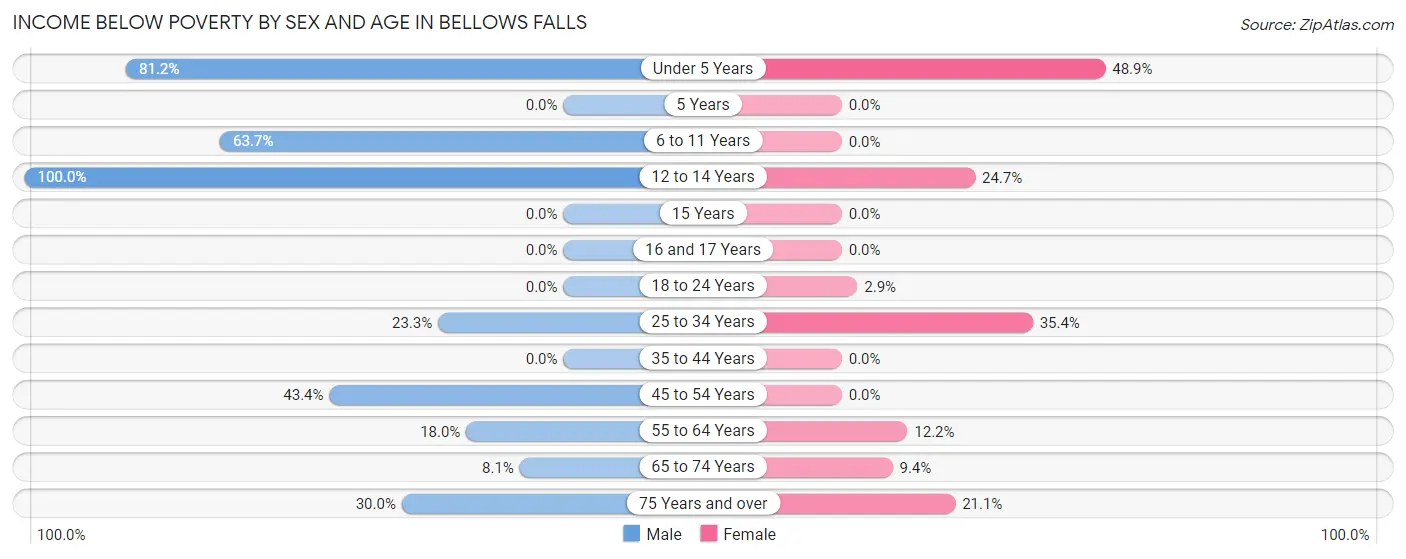
| Age Bracket | Male | Female |
| Under 5 Years | 56 (81.2%) | 45 (48.9%) |
| 5 Years | 0 (0.0%) | 0 (0.0%) |
| 6 to 11 Years | 79 (63.7%) | 0 (0.0%) |
| 12 to 14 Years | 25 (100.0%) | 23 (24.7%) |
| 15 Years | 0 (0.0%) | 0 (0.0%) |
| 16 and 17 Years | 0 (0.0%) | 0 (0.0%) |
| 18 to 24 Years | 0 (0.0%) | 7 (2.9%) |
| 25 to 34 Years | 30 (23.3%) | 62 (35.4%) |
| 35 to 44 Years | 0 (0.0%) | 0 (0.0%) |
| 45 to 54 Years | 76 (43.4%) | 0 (0.0%) |
| 55 to 64 Years | 33 (18.0%) | 37 (12.2%) |
| 65 to 74 Years | 9 (8.1%) | 18 (9.4%) |
| 75 Years and over | 9 (30.0%) | 40 (21.0%) |
| Total | 317 (29.2%) | 232 (13.7%) |
Income Above Poverty by Sex and Age in Bellows Falls
According to the poverty statistics in Bellows Falls, males aged 5 years and females aged 5 years are the age groups that are most secure financially, with 100.0% of males and 100.0% of females in these age groups living above the poverty line.
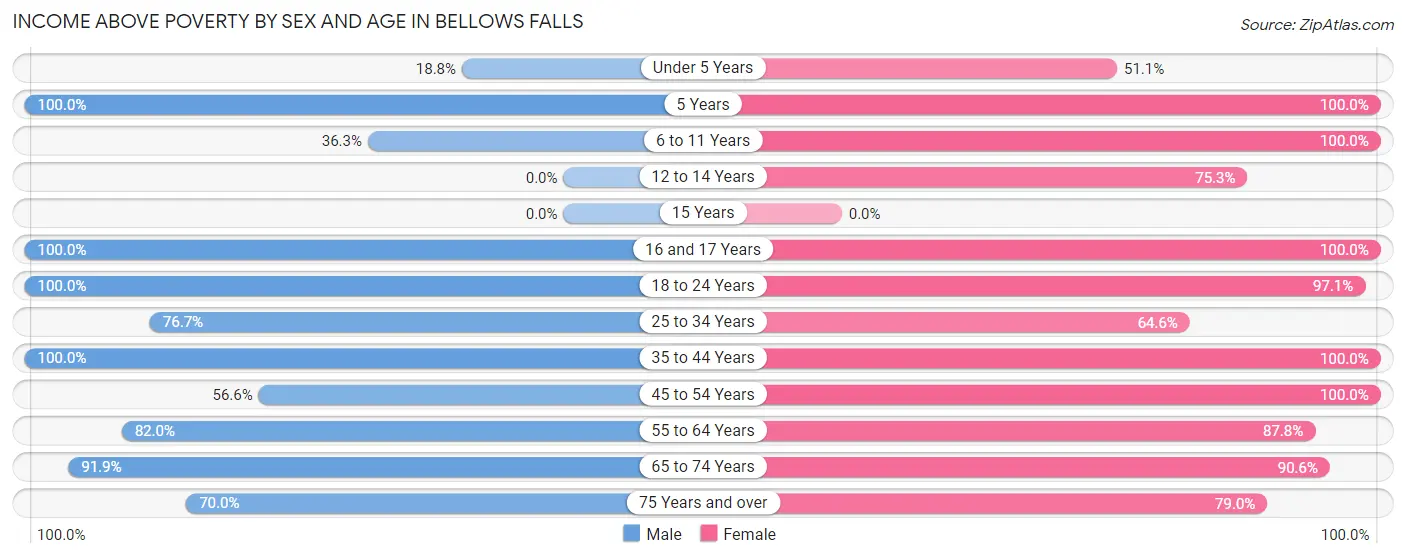
| Age Bracket | Male | Female |
| Under 5 Years | 13 (18.8%) | 47 (51.1%) |
| 5 Years | 15 (100.0%) | 15 (100.0%) |
| 6 to 11 Years | 45 (36.3%) | 96 (100.0%) |
| 12 to 14 Years | 0 (0.0%) | 70 (75.3%) |
| 15 Years | 0 (0.0%) | 0 (0.0%) |
| 16 and 17 Years | 29 (100.0%) | 39 (100.0%) |
| 18 to 24 Years | 57 (100.0%) | 236 (97.1%) |
| 25 to 34 Years | 99 (76.7%) | 113 (64.6%) |
| 35 to 44 Years | 139 (100.0%) | 150 (100.0%) |
| 45 to 54 Years | 99 (56.6%) | 109 (100.0%) |
| 55 to 64 Years | 150 (82.0%) | 267 (87.8%) |
| 65 to 74 Years | 102 (91.9%) | 173 (90.6%) |
| 75 Years and over | 21 (70.0%) | 150 (78.9%) |
| Total | 769 (70.8%) | 1,465 (86.3%) |
Income Below Poverty Among Married-Couple Families in Bellows Falls
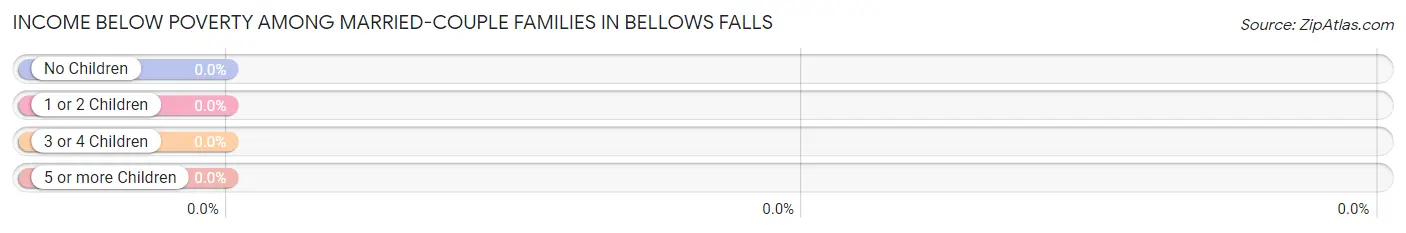
| Children | Above Poverty | Below Poverty |
| No Children | 194 (100.0%) | 0 (0.0%) |
| 1 or 2 Children | 133 (100.0%) | 0 (0.0%) |
| 3 or 4 Children | 14 (100.0%) | 0 (0.0%) |
| 5 or more Children | 0 (0.0%) | 0 (0.0%) |
| Total | 341 (100.0%) | 0 (0.0%) |
Income Below Poverty Among Single-Parent Households in Bellows Falls
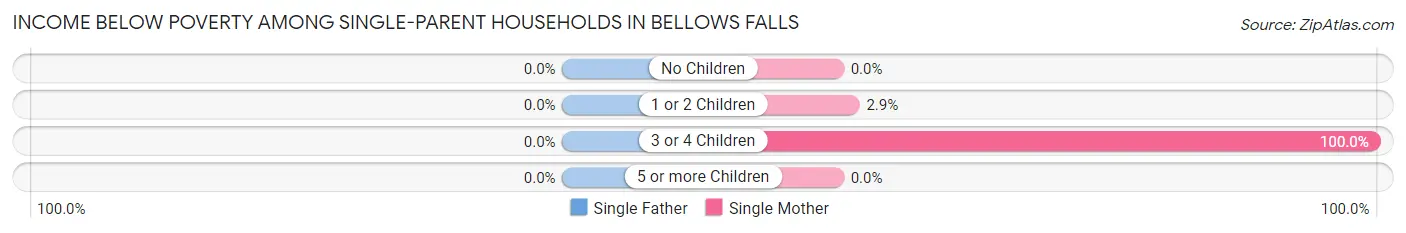
| Children | Single Father | Single Mother |
| No Children | 0 (0.0%) | 0 (0.0%) |
| 1 or 2 Children | 0 (0.0%) | 3 (2.9%) |
| 3 or 4 Children | 0 (0.0%) | 62 (100.0%) |
| 5 or more Children | 0 (0.0%) | 0 (0.0%) |
| Total | 0 (0.0%) | 65 (34.8%) |
Income Below Poverty Among Married-Couple vs Single-Parent Households in Bellows Falls
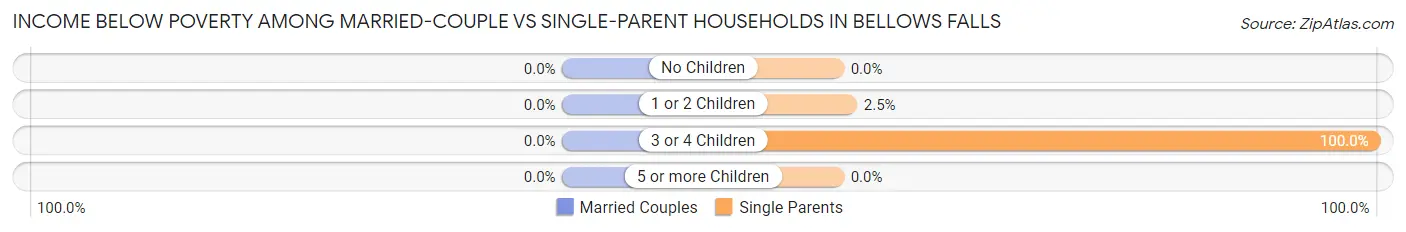
| Children | Married-Couple Families | Single-Parent Households |
| No Children | 0 (0.0%) | 0 (0.0%) |
| 1 or 2 Children | 0 (0.0%) | 3 (2.5%) |
| 3 or 4 Children | 0 (0.0%) | 62 (100.0%) |
| 5 or more Children | 0 (0.0%) | 0 (0.0%) |
| Total | 0 (0.0%) | 65 (31.4%) |
Race in Bellows Falls
The most populous races in Bellows Falls are White / Caucasian (2,448 | 86.7%), Two or more Races (193 | 6.8%), and Asian (95 | 3.4%).
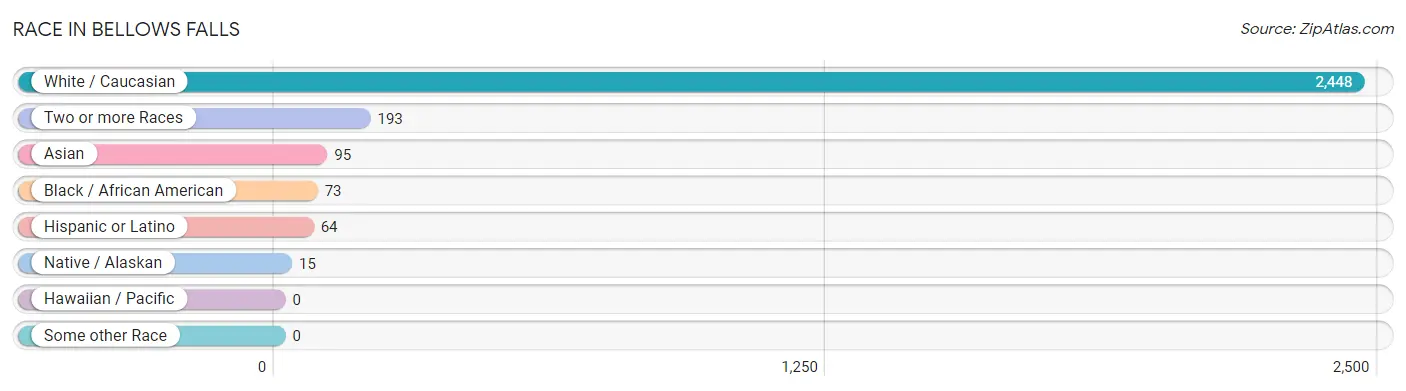
| Race | # Population | % Population |
| Asian | 95 | 3.4% |
| Black / African American | 73 | 2.6% |
| Hawaiian / Pacific | 0 | 0.0% |
| Hispanic or Latino | 64 | 2.3% |
| Native / Alaskan | 15 | 0.5% |
| White / Caucasian | 2,448 | 86.7% |
| Two or more Races | 193 | 6.8% |
| Some other Race | 0 | 0.0% |
| Total | 2,824 | 100.0% |
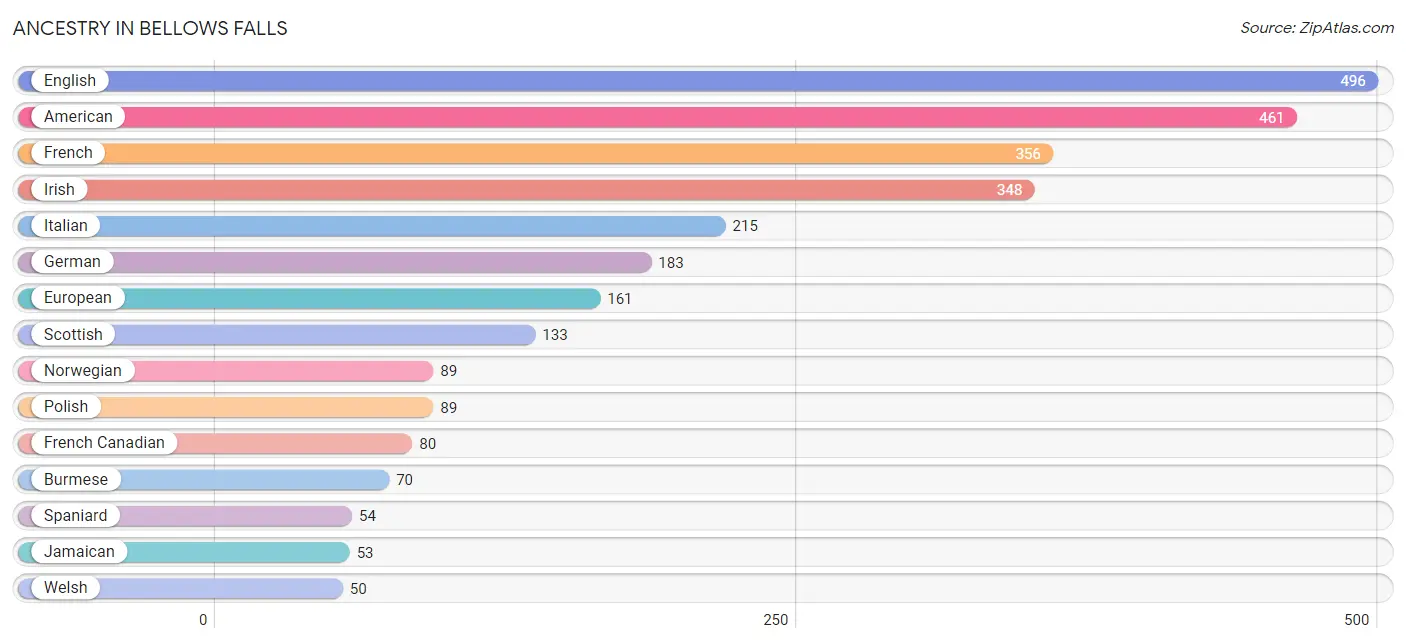
Ancestry in Bellows Falls
The most populous ancestries reported in Bellows Falls are English (496 | 17.6%), American (461 | 16.3%), French (356 | 12.6%), Irish (348 | 12.3%), and Italian (215 | 7.6%), together accounting for 66.4% of all Bellows Falls residents.
| Ancestry | # Population | % Population |
| American | 461 | 16.3% |
| Bhutanese | 18 | 0.6% |
| British | 35 | 1.2% |
| Burmese | 70 | 2.5% |
| Czech | 14 | 0.5% |
| Dutch | 14 | 0.5% |
| English | 496 | 17.6% |
| European | 161 | 5.7% |
| French | 356 | 12.6% |
| French American Indian | 15 | 0.5% |
| French Canadian | 80 | 2.8% |
| German | 183 | 6.5% |
| Greek | 10 | 0.4% |
| Haitian | 24 | 0.9% |
| Irish | 348 | 12.3% |
| Italian | 215 | 7.6% |
| Jamaican | 53 | 1.9% |
| Lithuanian | 10 | 0.4% |
| Northern European | 33 | 1.2% |
| Norwegian | 89 | 3.2% |
| Polish | 89 | 3.2% |
| Puerto Rican | 10 | 0.4% |
| Scottish | 133 | 4.7% |
| Spaniard | 54 | 1.9% |
| Sri Lankan | 7 | 0.3% |
| Swedish | 11 | 0.4% |
| Thai | 7 | 0.3% |
| Welsh | 50 | 1.8% | View All 28 Rows |
Immigrants in Bellows Falls
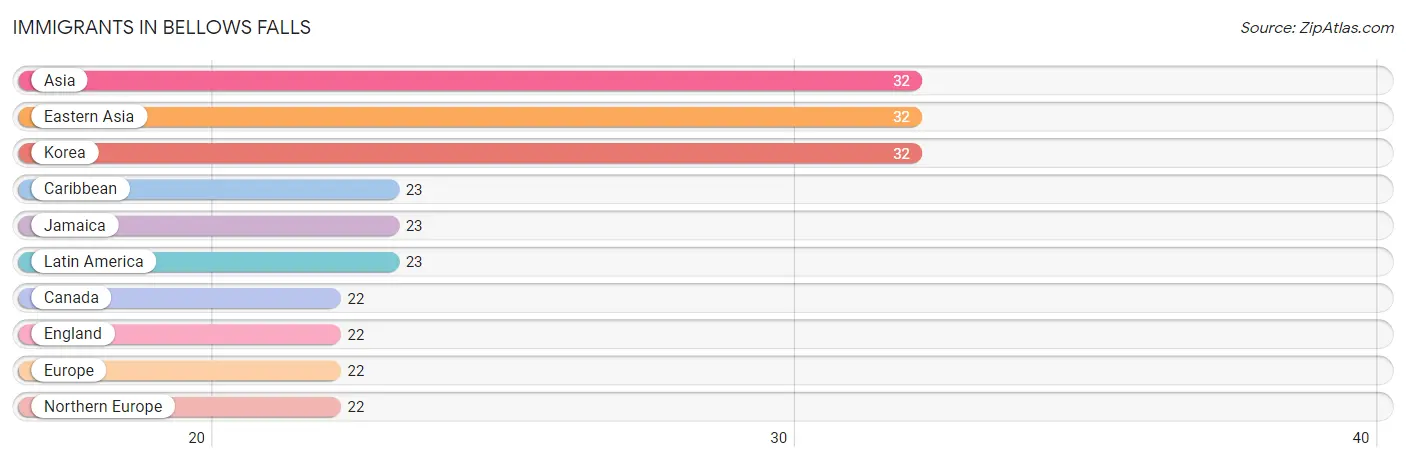
The most numerous immigrant groups reported in Bellows Falls came from Asia (32 | 1.1%), Eastern Asia (32 | 1.1%), Korea (32 | 1.1%), Caribbean (23 | 0.8%), and Jamaica (23 | 0.8%), together accounting for 5.0% of all Bellows Falls residents.
| Immigration Origin | # Population | % Population |
| Asia | 32 | 1.1% |
| Canada | 22 | 0.8% |
| Caribbean | 23 | 0.8% |
| Eastern Asia | 32 | 1.1% |
| England | 22 | 0.8% |
| Europe | 22 | 0.8% |
| Jamaica | 23 | 0.8% |
| Korea | 32 | 1.1% |
| Latin America | 23 | 0.8% |
| Northern Europe | 22 | 0.8% | View All 10 Rows |
Sex and Age in Bellows Falls
Sex and Age in Bellows Falls
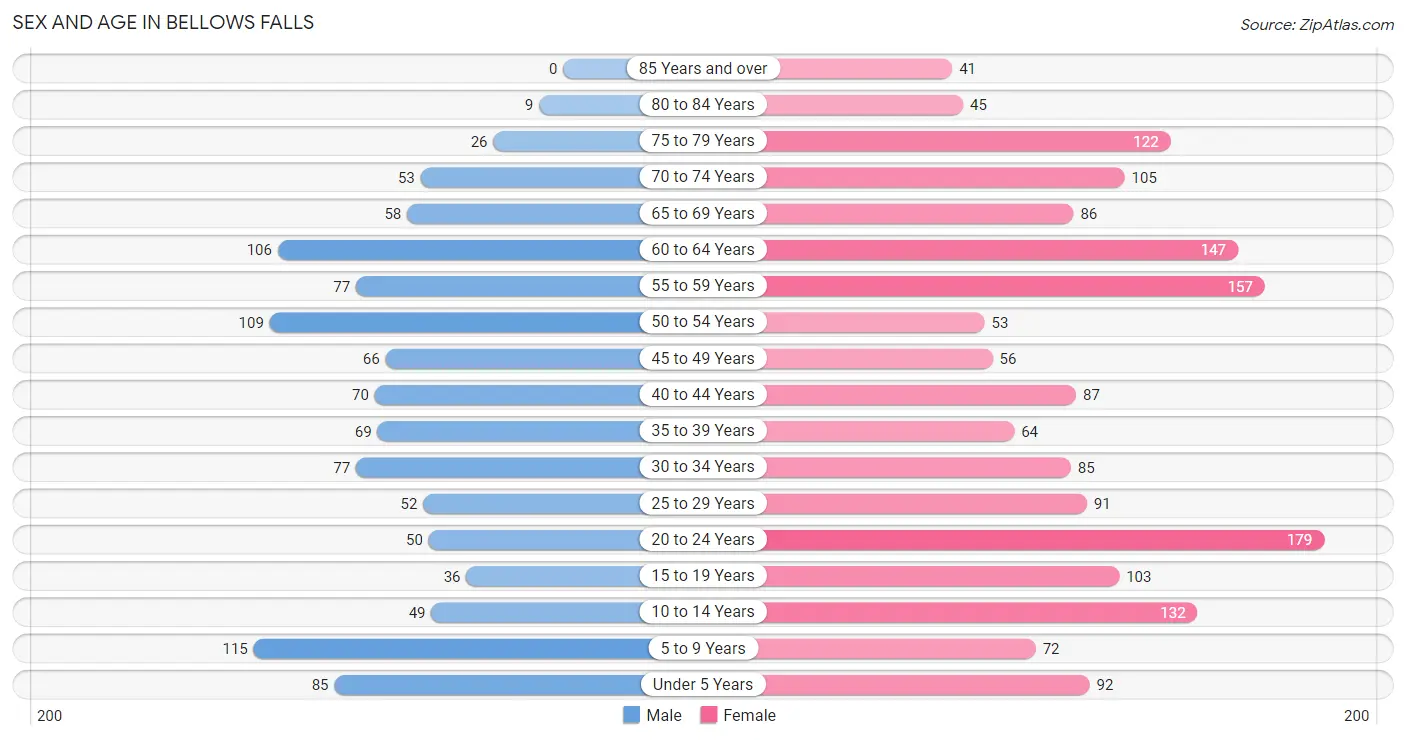
The most populous age groups in Bellows Falls are 5 to 9 Years (115 | 10.4%) for men and 20 to 24 Years (179 | 10.4%) for women.
| Age Bracket | Male | Female |
| Under 5 Years | 85 (7.7%) | 92 (5.4%) |
| 5 to 9 Years | 115 (10.4%) | 72 (4.2%) |
| 10 to 14 Years | 49 (4.4%) | 132 (7.7%) |
| 15 to 19 Years | 36 (3.3%) | 103 (6.0%) |
| 20 to 24 Years | 50 (4.5%) | 179 (10.4%) |
| 25 to 29 Years | 52 (4.7%) | 91 (5.3%) |
| 30 to 34 Years | 77 (7.0%) | 85 (5.0%) |
| 35 to 39 Years | 69 (6.2%) | 64 (3.7%) |
| 40 to 44 Years | 70 (6.3%) | 87 (5.1%) |
| 45 to 49 Years | 66 (6.0%) | 56 (3.3%) |
| 50 to 54 Years | 109 (9.9%) | 53 (3.1%) |
| 55 to 59 Years | 77 (7.0%) | 157 (9.1%) |
| 60 to 64 Years | 106 (9.6%) | 147 (8.6%) |
| 65 to 69 Years | 58 (5.2%) | 86 (5.0%) |
| 70 to 74 Years | 53 (4.8%) | 105 (6.1%) |
| 75 to 79 Years | 26 (2.4%) | 122 (7.1%) |
| 80 to 84 Years | 9 (0.8%) | 45 (2.6%) |
| 85 Years and over | 0 (0.0%) | 41 (2.4%) |
| Total | 1,107 (100.0%) | 1,717 (100.0%) |
Families and Households in Bellows Falls
Median Family Size in Bellows Falls
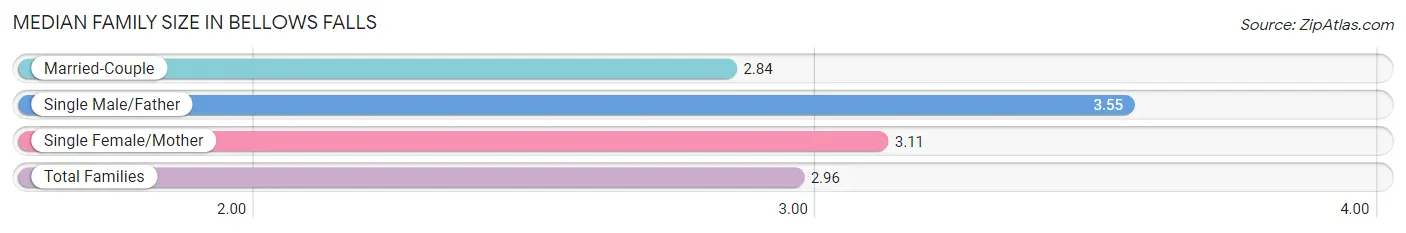
The median family size in Bellows Falls is 2.96 persons per family, with single male/father families (20 | 3.6%) accounting for the largest median family size of 3.55 persons per family. On the other hand, married-couple families (341 | 62.2%) represent the smallest median family size with 2.84 persons per family.
| Family Type | # Families | Family Size |
| Married-Couple | 341 (62.2%) | 2.84 |
| Single Male/Father | 20 (3.6%) | 3.55 |
| Single Female/Mother | 187 (34.1%) | 3.11 |
| Total Families | 548 (100.0%) | 2.96 |
Median Household Size in Bellows Falls
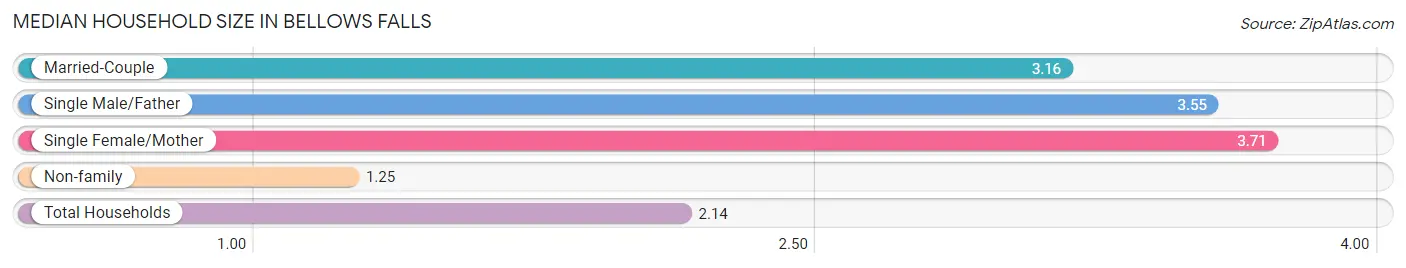
The median household size in Bellows Falls is 2.14 persons per household, with single female/mother households (187 | 14.5%) accounting for the largest median household size of 3.71 persons per household. non-family households (744 | 57.6%) represent the smallest median household size with 1.25 persons per household.
| Household Type | # Households | Household Size |
| Married-Couple | 341 (26.4%) | 3.16 |
| Single Male/Father | 20 (1.5%) | 3.55 |
| Single Female/Mother | 187 (14.5%) | 3.71 |
| Non-family | 744 (57.6%) | 1.25 |
| Total Households | 1,292 (100.0%) | 2.14 |
Household Size by Marriage Status in Bellows Falls
Out of a total of 1,292 households in Bellows Falls, 548 (42.4%) are family households, while 744 (57.6%) are nonfamily households. The most numerous type of family households are 2-person households, comprising 228, and the most common type of nonfamily households are 1-person households, comprising 540.
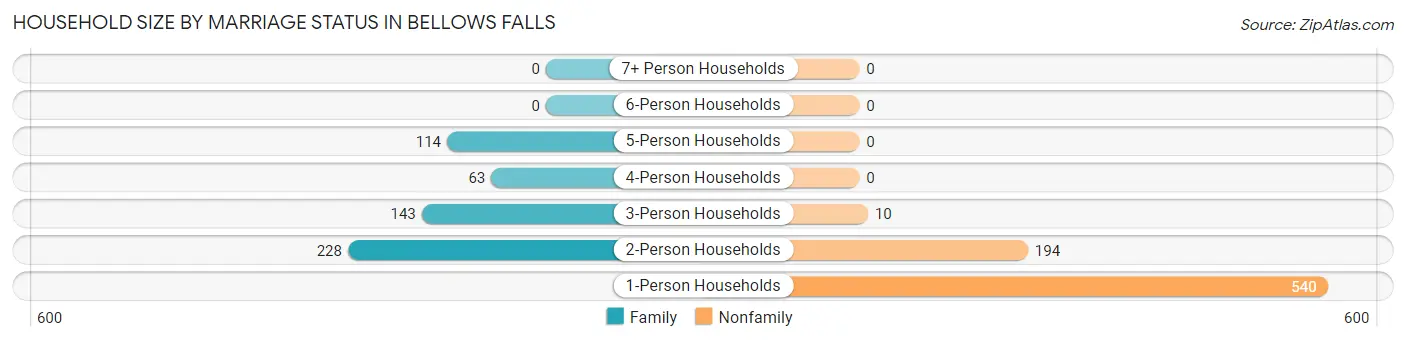
| Household Size | Family Households | Nonfamily Households |
| 1-Person Households | - | 540 (41.8%) |
| 2-Person Households | 228 (17.6%) | 194 (15.0%) |
| 3-Person Households | 143 (11.1%) | 10 (0.8%) |
| 4-Person Households | 63 (4.9%) | 0 (0.0%) |
| 5-Person Households | 114 (8.8%) | 0 (0.0%) |
| 6-Person Households | 0 (0.0%) | 0 (0.0%) |
| 7+ Person Households | 0 (0.0%) | 0 (0.0%) |
| Total | 548 (42.4%) | 744 (57.6%) |
Female Fertility in Bellows Falls
Fertility by Age in Bellows Falls
Average fertility rate in Bellows Falls is 74.0 births per 1,000 women. Women in the age bracket of 20 to 34 years have the highest fertility rate with 138.0 births per 1,000 women. Women in the age bracket of 20 to 34 years acount for 100.0% of all women with births.
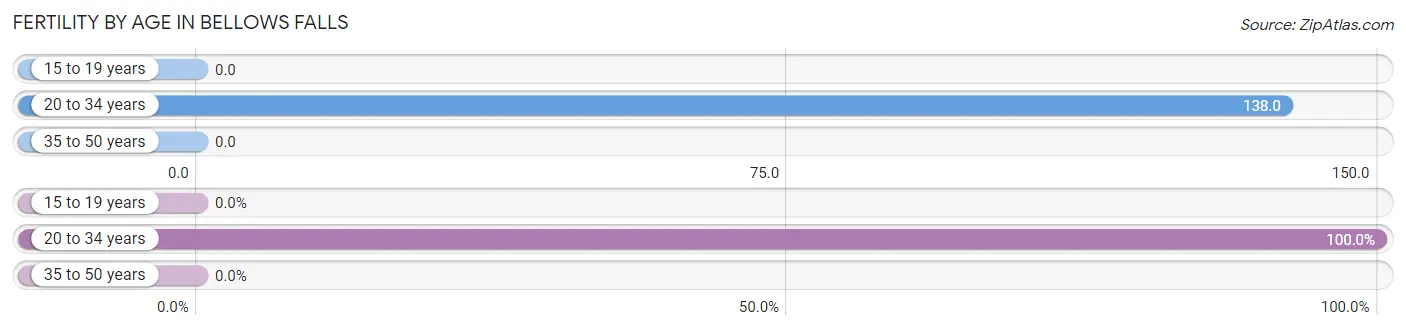
| Age Bracket | Women with Births | Births / 1,000 Women |
| 15 to 19 years | 0 (0.0%) | 0.0 |
| 20 to 34 years | 49 (100.0%) | 138.0 |
| 35 to 50 years | 0 (0.0%) | 0.0 |
| Total | 49 (100.0%) | 74.0 |
Fertility by Age by Marriage Status in Bellows Falls
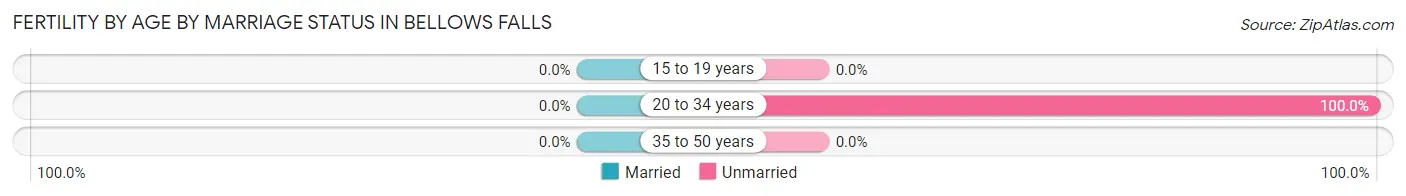
| Age Bracket | Married | Unmarried |
| 15 to 19 years | 0 (0.0%) | 0 (0.0%) |
| 20 to 34 years | 0 (0.0%) | 49 (100.0%) |
| 35 to 50 years | 0 (0.0%) | 0 (0.0%) |
| Total | 0 (0.0%) | 49 (100.0%) |
Fertility by Education in Bellows Falls
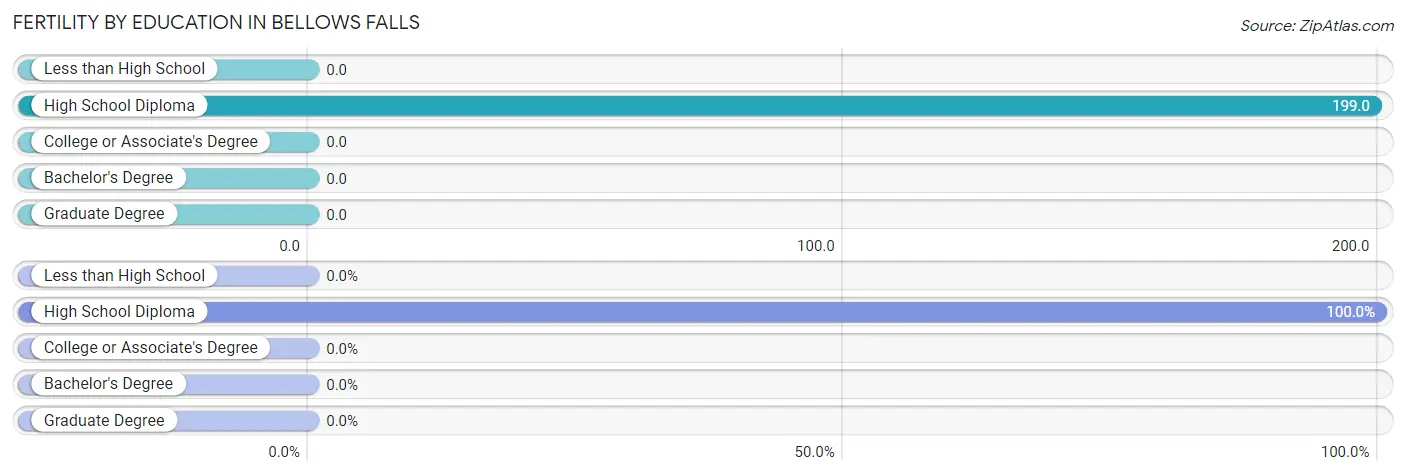
| Educational Attainment | Women with Births | Births / 1,000 Women |
| Less than High School | 0 (0.0%) | 0.0 |
| High School Diploma | 49 (100.0%) | 199.0 |
| College or Associate's Degree | 0 (0.0%) | 0.0 |
| Bachelor's Degree | 0 (0.0%) | 0.0 |
| Graduate Degree | 0 (0.0%) | 0.0 |
| Total | 49 (100.0%) | 74.0 |
Fertility by Education by Marriage Status in Bellows Falls
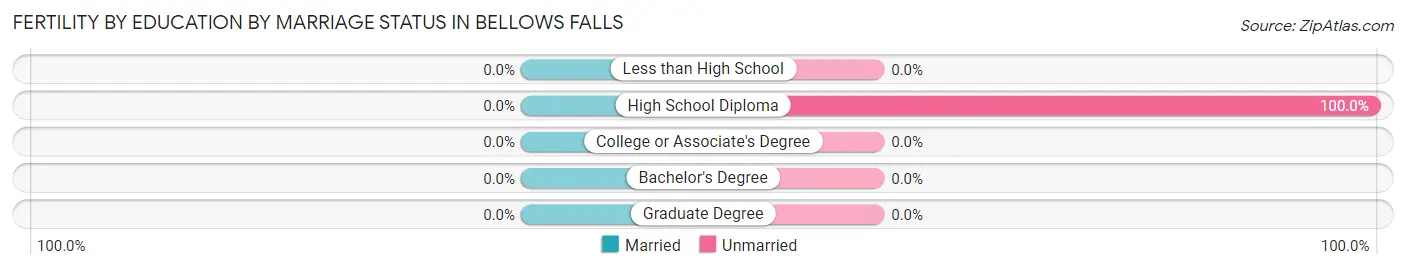
| Educational Attainment | Married | Unmarried |
| Less than High School | 0 (0.0%) | 0 (0.0%) |
| High School Diploma | 0 (0.0%) | 49 (100.0%) |
| College or Associate's Degree | 0 (0.0%) | 0 (0.0%) |
| Bachelor's Degree | 0 (0.0%) | 0 (0.0%) |
| Graduate Degree | 0 (0.0%) | 0 (0.0%) |
| Total | 0 (0.0%) | 49 (100.0%) |
Employment Characteristics in Bellows Falls
Employment by Class of Employer in Bellows Falls
Among the 1,470 employed individuals in Bellows Falls, private company employees (798 | 54.3%), not-for-profit organizations (227 | 15.4%), and local government employees (210 | 14.3%) make up the most common classes of employment.
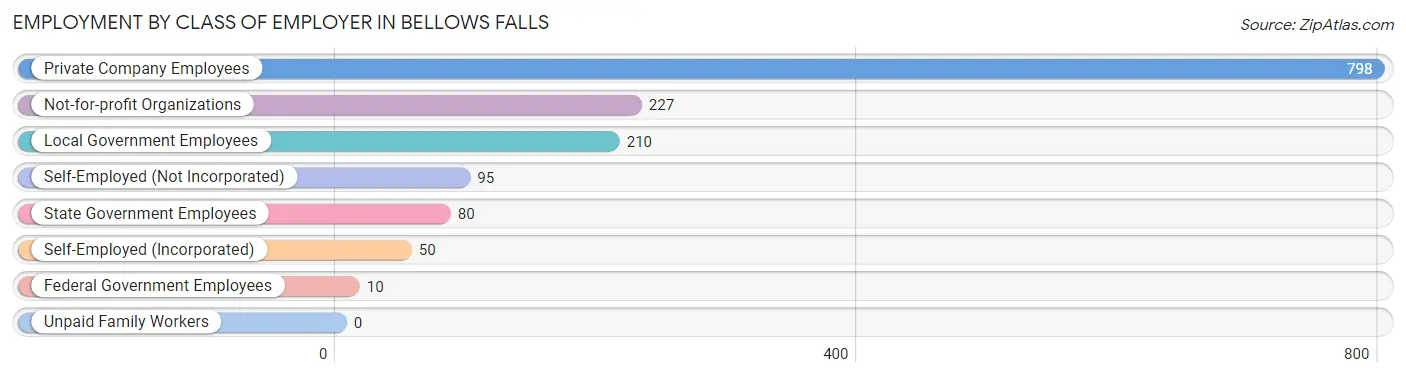
| Employer Class | # Employees | % Employees |
| Private Company Employees | 798 | 54.3% |
| Self-Employed (Incorporated) | 50 | 3.4% |
| Self-Employed (Not Incorporated) | 95 | 6.5% |
| Not-for-profit Organizations | 227 | 15.4% |
| Local Government Employees | 210 | 14.3% |
| State Government Employees | 80 | 5.4% |
| Federal Government Employees | 10 | 0.7% |
| Unpaid Family Workers | 0 | 0.0% |
| Total | 1,470 | 100.0% |
Employment Status by Age in Bellows Falls
According to the labor force statistics for Bellows Falls, out of the total population over 16 years of age (2,279), 67.5% or 1,538 individuals are in the labor force, with 3.0% or 46 of them unemployed. The age group with the highest labor force participation rate is 30 to 34 years, with 100.0% or 162 individuals in the labor force. Within the labor force, the 30 to 34 years age range has the highest percentage of unemployed individuals, with 12.3% or 20 of them being unemployed.
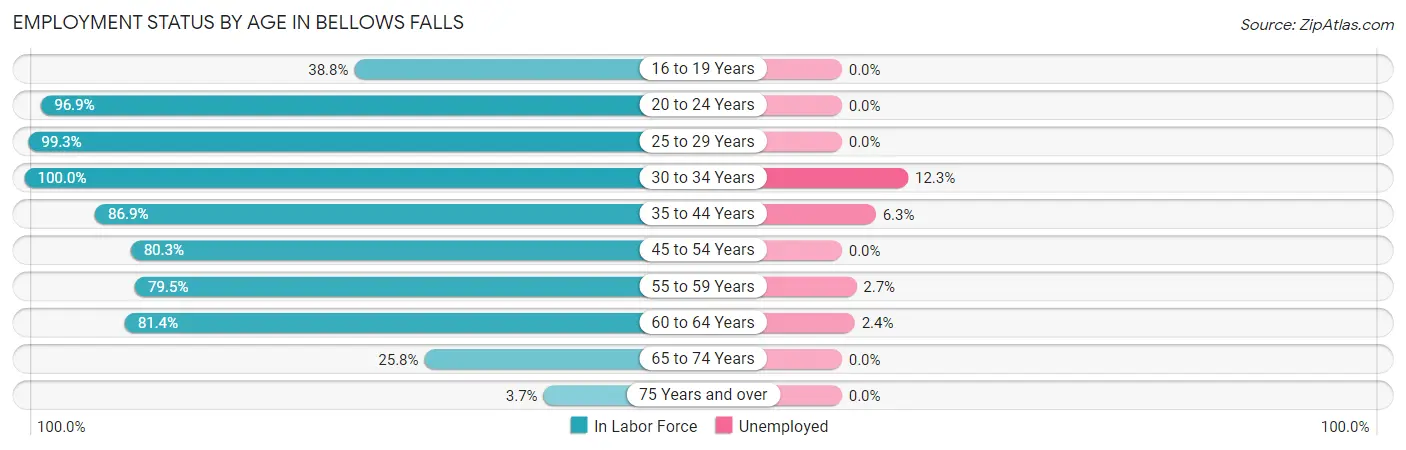
| Age Bracket | In Labor Force | Unemployed |
| 16 to 19 Years | 54 (38.8%) | 0 (0.0%) |
| 20 to 24 Years | 222 (96.9%) | 0 (0.0%) |
| 25 to 29 Years | 142 (99.3%) | 0 (0.0%) |
| 30 to 34 Years | 162 (100.0%) | 20 (12.3%) |
| 35 to 44 Years | 252 (86.9%) | 16 (6.3%) |
| 45 to 54 Years | 228 (80.3%) | 0 (0.0%) |
| 55 to 59 Years | 186 (79.5%) | 5 (2.7%) |
| 60 to 64 Years | 206 (81.4%) | 5 (2.4%) |
| 65 to 74 Years | 78 (25.8%) | 0 (0.0%) |
| 75 Years and over | 9 (3.7%) | 0 (0.0%) |
| Total | 1,538 (67.5%) | 46 (3.0%) |
Employment Status by Educational Attainment in Bellows Falls
According to labor force statistics for Bellows Falls, 86.1% of individuals (1,176) out of the total population between 25 and 64 years of age (1,366) are in the labor force, with 3.9% or 46 of them being unemployed. The group with the highest labor force participation rate are those with the educational attainment of bachelor's degree or higher, with 94.4% or 437 individuals in the labor force. Within the labor force, individuals with high school diploma education have the highest percentage of unemployment, with 10.0% or 41 of them being unemployed.
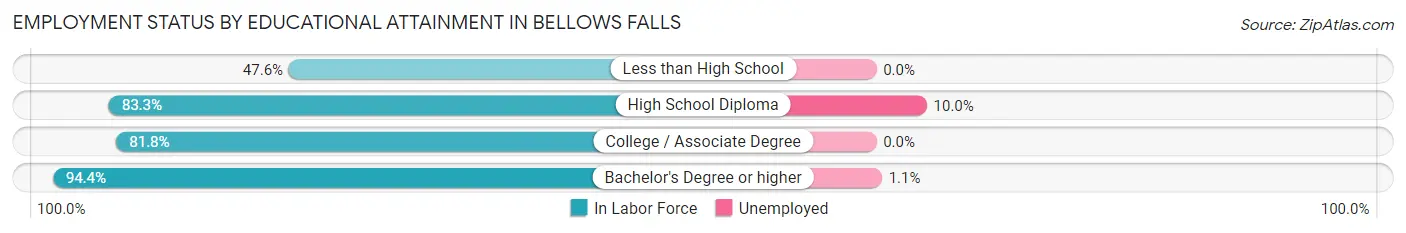
| Educational Attainment | In Labor Force | Unemployed |
| Less than High School | 10 (47.6%) | 0 (0.0%) |
| High School Diploma | 409 (83.3%) | 49 (10.0%) |
| College / Associate Degree | 320 (81.8%) | 0 (0.0%) |
| Bachelor's Degree or higher | 437 (94.4%) | 5 (1.1%) |
| Total | 1,176 (86.1%) | 53 (3.9%) |
Employment Occupations by Sex in Bellows Falls
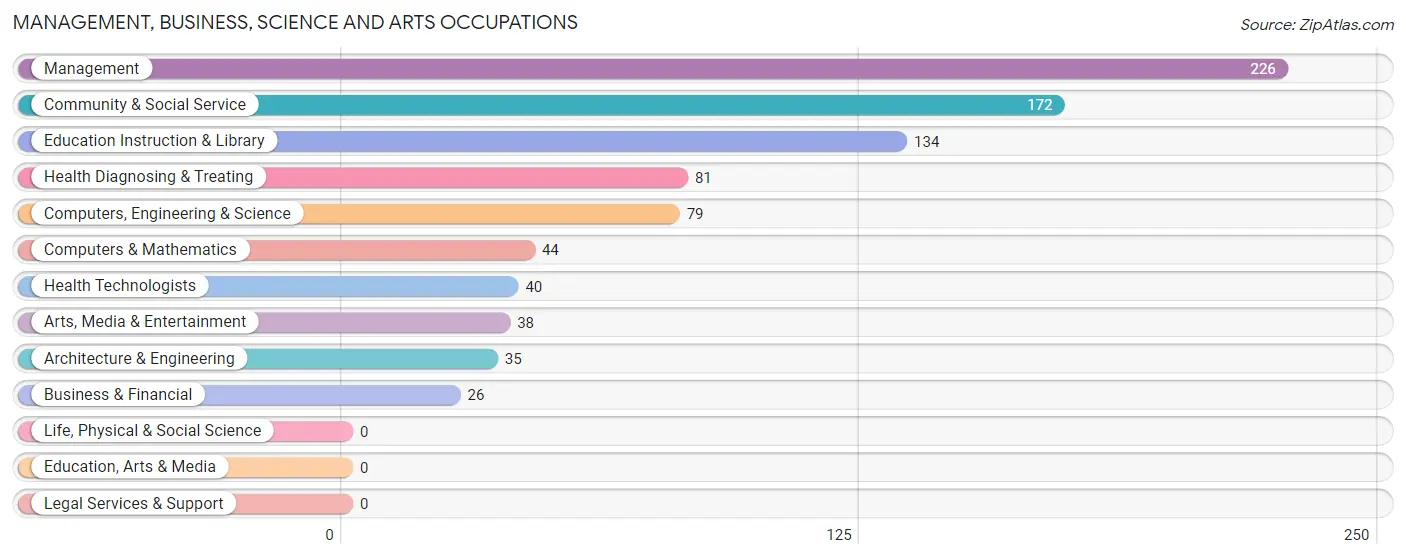
Management, Business, Science and Arts Occupations
The most common Management, Business, Science and Arts occupations in Bellows Falls are Management (226 | 15.1%), Community & Social Service (172 | 11.5%), Education Instruction & Library (134 | 9.0%), Health Diagnosing & Treating (81 | 5.4%), and Computers, Engineering & Science (79 | 5.3%).
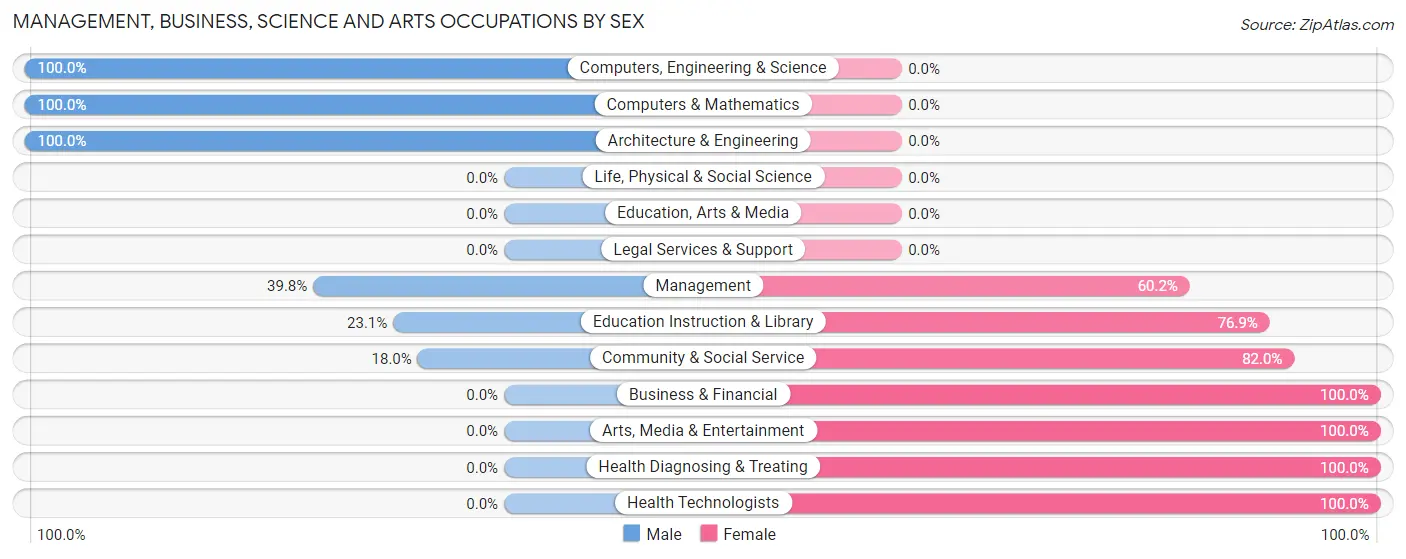
Management, Business, Science and Arts Occupations by Sex
Within the Management, Business, Science and Arts occupations in Bellows Falls, the most male-oriented occupations are Computers, Engineering & Science (100.0%), Computers & Mathematics (100.0%), and Architecture & Engineering (100.0%), while the most female-oriented occupations are Business & Financial (100.0%), Arts, Media & Entertainment (100.0%), and Health Diagnosing & Treating (100.0%).
| Occupation | Male | Female |
| Management | 90 (39.8%) | 136 (60.2%) |
| Business & Financial | 0 (0.0%) | 26 (100.0%) |
| Computers, Engineering & Science | 79 (100.0%) | 0 (0.0%) |
| Computers & Mathematics | 44 (100.0%) | 0 (0.0%) |
| Architecture & Engineering | 35 (100.0%) | 0 (0.0%) |
| Life, Physical & Social Science | 0 (0.0%) | 0 (0.0%) |
| Community & Social Service | 31 (18.0%) | 141 (82.0%) |
| Education, Arts & Media | 0 (0.0%) | 0 (0.0%) |
| Legal Services & Support | 0 (0.0%) | 0 (0.0%) |
| Education Instruction & Library | 31 (23.1%) | 103 (76.9%) |
| Arts, Media & Entertainment | 0 (0.0%) | 38 (100.0%) |
| Health Diagnosing & Treating | 0 (0.0%) | 81 (100.0%) |
| Health Technologists | 0 (0.0%) | 40 (100.0%) |
| Total (Category) | 200 (34.3%) | 384 (65.7%) |
| Total (Overall) | 591 (39.6%) | 902 (60.4%) |
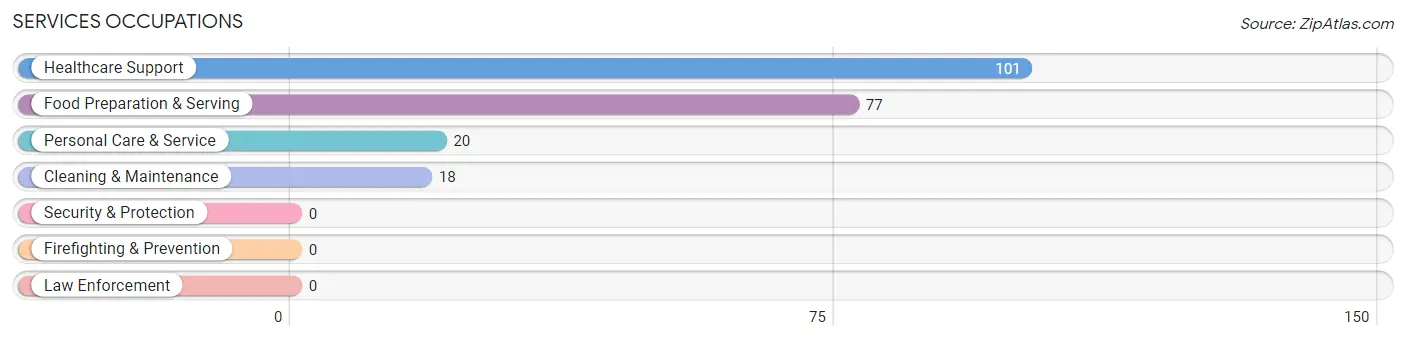
Services Occupations
The most common Services occupations in Bellows Falls are Healthcare Support (101 | 6.8%), Food Preparation & Serving (77 | 5.2%), Personal Care & Service (20 | 1.3%), and Cleaning & Maintenance (18 | 1.2%).
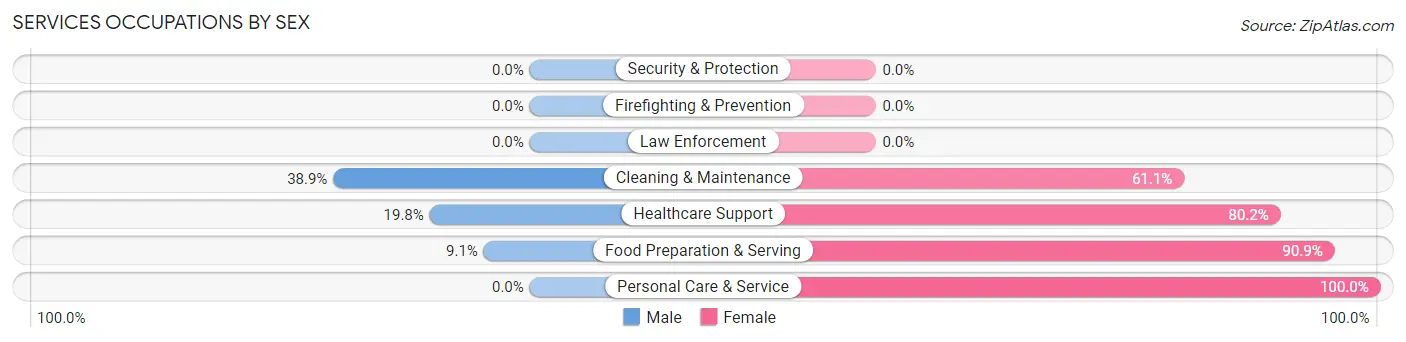
Services Occupations by Sex
Within the Services occupations in Bellows Falls, the most male-oriented occupations are Cleaning & Maintenance (38.9%), Healthcare Support (19.8%), and Food Preparation & Serving (9.1%), while the most female-oriented occupations are Personal Care & Service (100.0%), Food Preparation & Serving (90.9%), and Healthcare Support (80.2%).
| Occupation | Male | Female |
| Healthcare Support | 20 (19.8%) | 81 (80.2%) |
| Security & Protection | 0 (0.0%) | 0 (0.0%) |
| Firefighting & Prevention | 0 (0.0%) | 0 (0.0%) |
| Law Enforcement | 0 (0.0%) | 0 (0.0%) |
| Food Preparation & Serving | 7 (9.1%) | 70 (90.9%) |
| Cleaning & Maintenance | 7 (38.9%) | 11 (61.1%) |
| Personal Care & Service | 0 (0.0%) | 20 (100.0%) |
| Total (Category) | 34 (15.7%) | 182 (84.3%) |
| Total (Overall) | 591 (39.6%) | 902 (60.4%) |
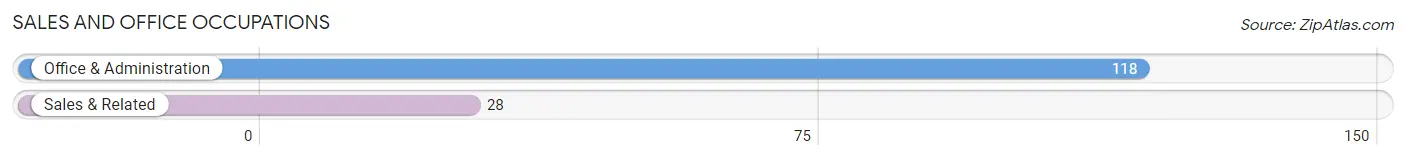
Sales and Office Occupations
The most common Sales and Office occupations in Bellows Falls are Office & Administration (118 | 7.9%), and Sales & Related (28 | 1.9%).
Sales and Office Occupations by Sex
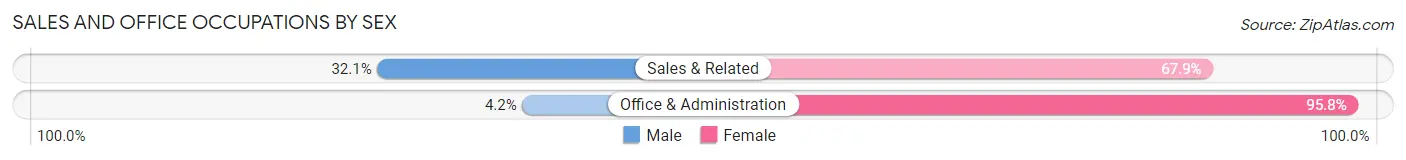
| Occupation | Male | Female |
| Sales & Related | 9 (32.1%) | 19 (67.9%) |
| Office & Administration | 5 (4.2%) | 113 (95.8%) |
| Total (Category) | 14 (9.6%) | 132 (90.4%) |
| Total (Overall) | 591 (39.6%) | 902 (60.4%) |
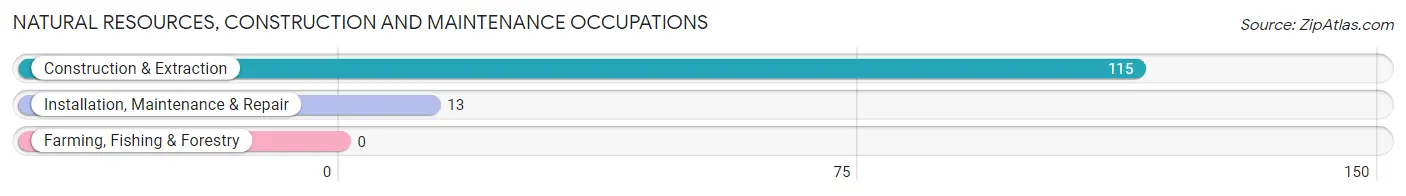
Natural Resources, Construction and Maintenance Occupations
The most common Natural Resources, Construction and Maintenance occupations in Bellows Falls are Construction & Extraction (115 | 7.7%), and Installation, Maintenance & Repair (13 | 0.9%).
Natural Resources, Construction and Maintenance Occupations by Sex
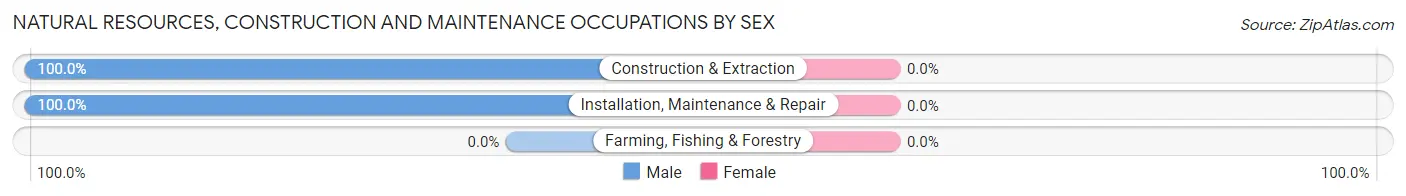
| Occupation | Male | Female |
| Farming, Fishing & Forestry | 0 (0.0%) | 0 (0.0%) |
| Construction & Extraction | 115 (100.0%) | 0 (0.0%) |
| Installation, Maintenance & Repair | 13 (100.0%) | 0 (0.0%) |
| Total (Category) | 128 (100.0%) | 0 (0.0%) |
| Total (Overall) | 591 (39.6%) | 902 (60.4%) |
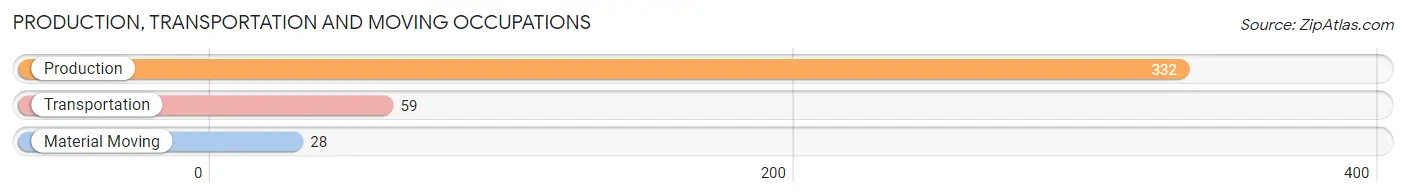
Production, Transportation and Moving Occupations
The most common Production, Transportation and Moving occupations in Bellows Falls are Production (332 | 22.2%), Transportation (59 | 4.0%), and Material Moving (28 | 1.9%).
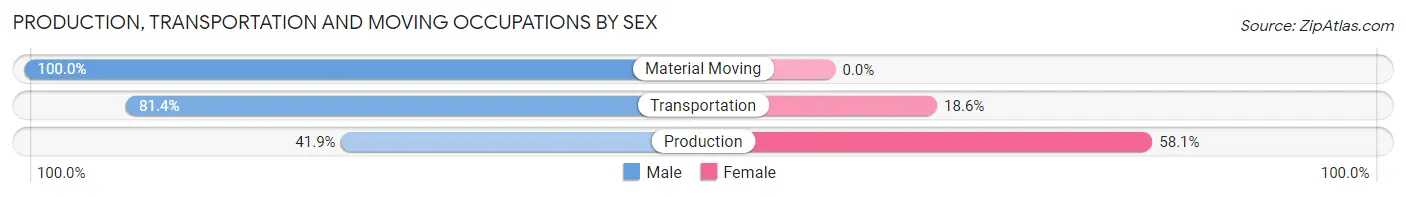
Production, Transportation and Moving Occupations by Sex
| Occupation | Male | Female |
| Production | 139 (41.9%) | 193 (58.1%) |
| Transportation | 48 (81.4%) | 11 (18.6%) |
| Material Moving | 28 (100.0%) | 0 (0.0%) |
| Total (Category) | 215 (51.3%) | 204 (48.7%) |
| Total (Overall) | 591 (39.6%) | 902 (60.4%) |
Employment Industries by Sex in Bellows Falls
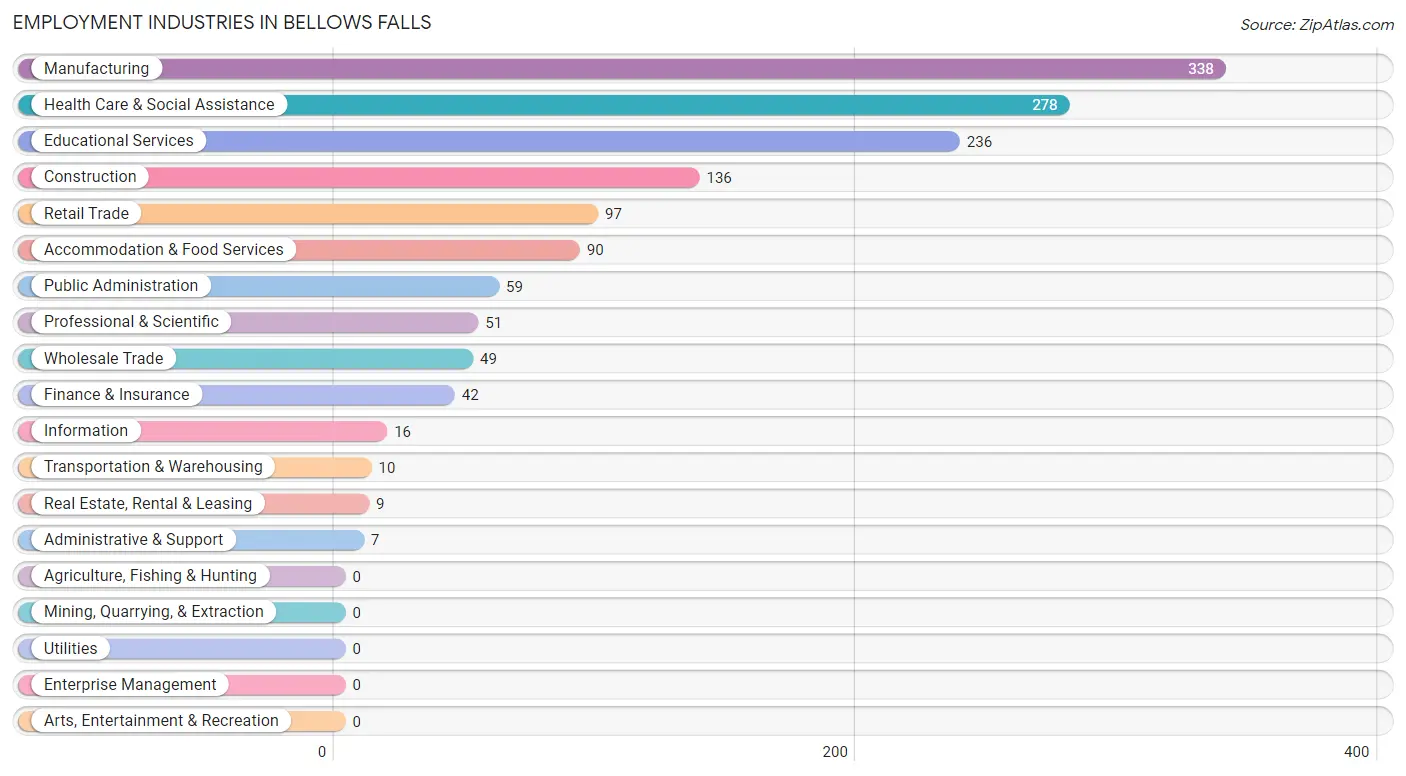
Employment Industries in Bellows Falls
The major employment industries in Bellows Falls include Manufacturing (338 | 22.6%), Health Care & Social Assistance (278 | 18.6%), Educational Services (236 | 15.8%), Construction (136 | 9.1%), and Retail Trade (97 | 6.5%).
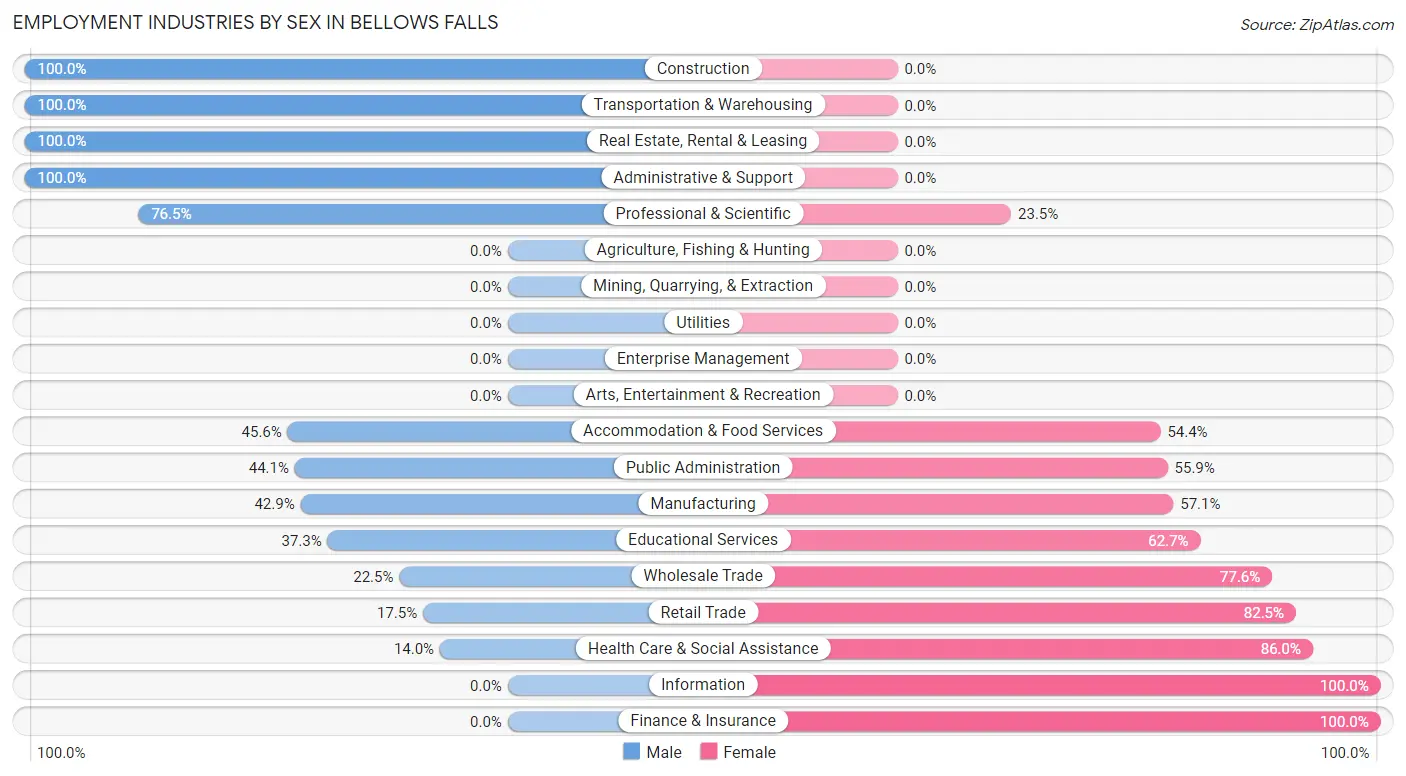
Employment Industries by Sex in Bellows Falls
The Bellows Falls industries that see more men than women are Construction (100.0%), Transportation & Warehousing (100.0%), and Real Estate, Rental & Leasing (100.0%), whereas the industries that tend to have a higher number of women are Information (100.0%), Finance & Insurance (100.0%), and Health Care & Social Assistance (86.0%).
| Industry | Male | Female |
| Agriculture, Fishing & Hunting | 0 (0.0%) | 0 (0.0%) |
| Mining, Quarrying, & Extraction | 0 (0.0%) | 0 (0.0%) |
| Construction | 136 (100.0%) | 0 (0.0%) |
| Manufacturing | 145 (42.9%) | 193 (57.1%) |
| Wholesale Trade | 11 (22.5%) | 38 (77.5%) |
| Retail Trade | 17 (17.5%) | 80 (82.5%) |
| Transportation & Warehousing | 10 (100.0%) | 0 (0.0%) |
| Utilities | 0 (0.0%) | 0 (0.0%) |
| Information | 0 (0.0%) | 16 (100.0%) |
| Finance & Insurance | 0 (0.0%) | 42 (100.0%) |
| Real Estate, Rental & Leasing | 9 (100.0%) | 0 (0.0%) |
| Professional & Scientific | 39 (76.5%) | 12 (23.5%) |
| Enterprise Management | 0 (0.0%) | 0 (0.0%) |
| Administrative & Support | 7 (100.0%) | 0 (0.0%) |
| Educational Services | 88 (37.3%) | 148 (62.7%) |
| Health Care & Social Assistance | 39 (14.0%) | 239 (86.0%) |
| Arts, Entertainment & Recreation | 0 (0.0%) | 0 (0.0%) |
| Accommodation & Food Services | 41 (45.6%) | 49 (54.4%) |
| Public Administration | 26 (44.1%) | 33 (55.9%) |
| Total | 591 (39.6%) | 902 (60.4%) |
Education in Bellows Falls
School Enrollment in Bellows Falls
The most common levels of schooling among the 561 students in Bellows Falls are middle school (178 | 31.7%), elementary school (160 | 28.5%), and high school (86 | 15.3%).
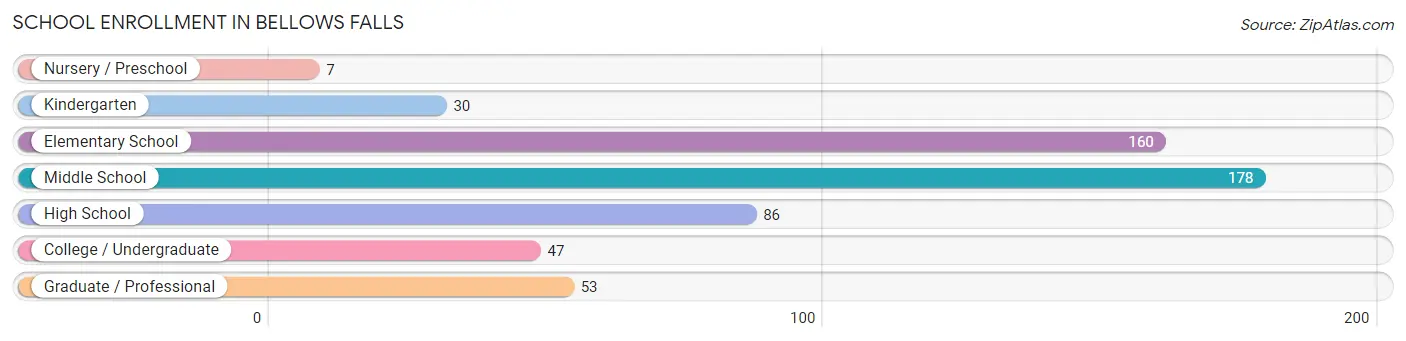
| School Level | # Students | % Students |
| Nursery / Preschool | 7 | 1.3% |
| Kindergarten | 30 | 5.3% |
| Elementary School | 160 | 28.5% |
| Middle School | 178 | 31.7% |
| High School | 86 | 15.3% |
| College / Undergraduate | 47 | 8.4% |
| Graduate / Professional | 53 | 9.5% |
| Total | 561 | 100.0% |
School Enrollment by Age by Funding Source in Bellows Falls
Out of a total of 561 students who are enrolled in schools in Bellows Falls, 44 (7.8%) attend a private institution, while the remaining 517 (92.2%) are enrolled in public schools. The age group of 25 to 34 year olds has the highest likelihood of being enrolled in private schools, with 30 (58.8% in the age bracket) enrolled. Conversely, the age group of 3 to 4 year olds has the lowest likelihood of being enrolled in a private school, with 7 (100.0% in the age bracket) attending a public institution.
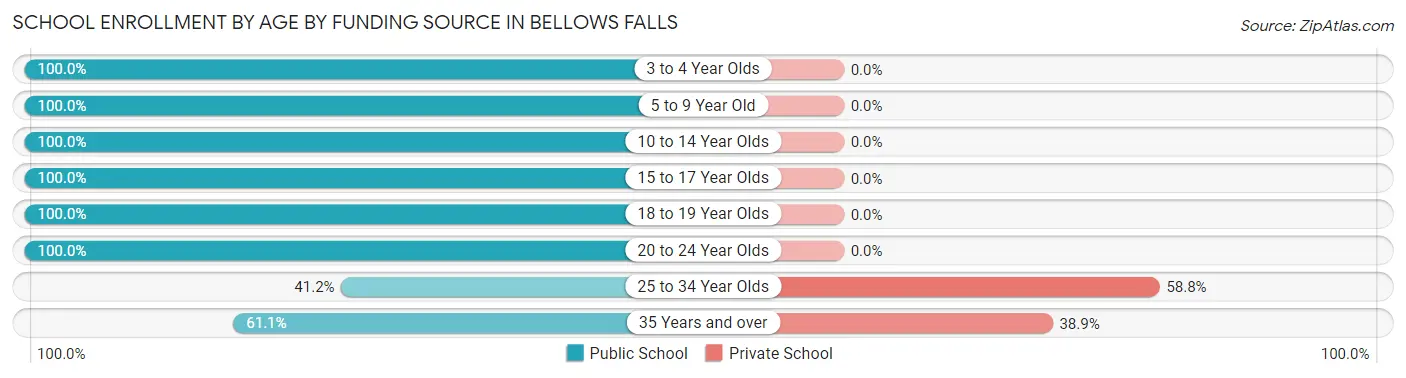
| Age Bracket | Public School | Private School |
| 3 to 4 Year Olds | 7 (100.0%) | 0 (0.0%) |
| 5 to 9 Year Old | 187 (100.0%) | 0 (0.0%) |
| 10 to 14 Year Olds | 181 (100.0%) | 0 (0.0%) |
| 15 to 17 Year Olds | 68 (100.0%) | 0 (0.0%) |
| 18 to 19 Year Olds | 18 (100.0%) | 0 (0.0%) |
| 20 to 24 Year Olds | 13 (100.0%) | 0 (0.0%) |
| 25 to 34 Year Olds | 21 (41.2%) | 30 (58.8%) |
| 35 Years and over | 22 (61.1%) | 14 (38.9%) |
| Total | 517 (92.2%) | 44 (7.8%) |
Educational Attainment by Field of Study in Bellows Falls
Liberal arts & history (88 | 14.4%), psychology (82 | 13.4%), education (82 | 13.4%), business (78 | 12.8%), and arts & humanities (69 | 11.3%) are the most common fields of study among 612 individuals in Bellows Falls who have obtained a bachelor's degree or higher.
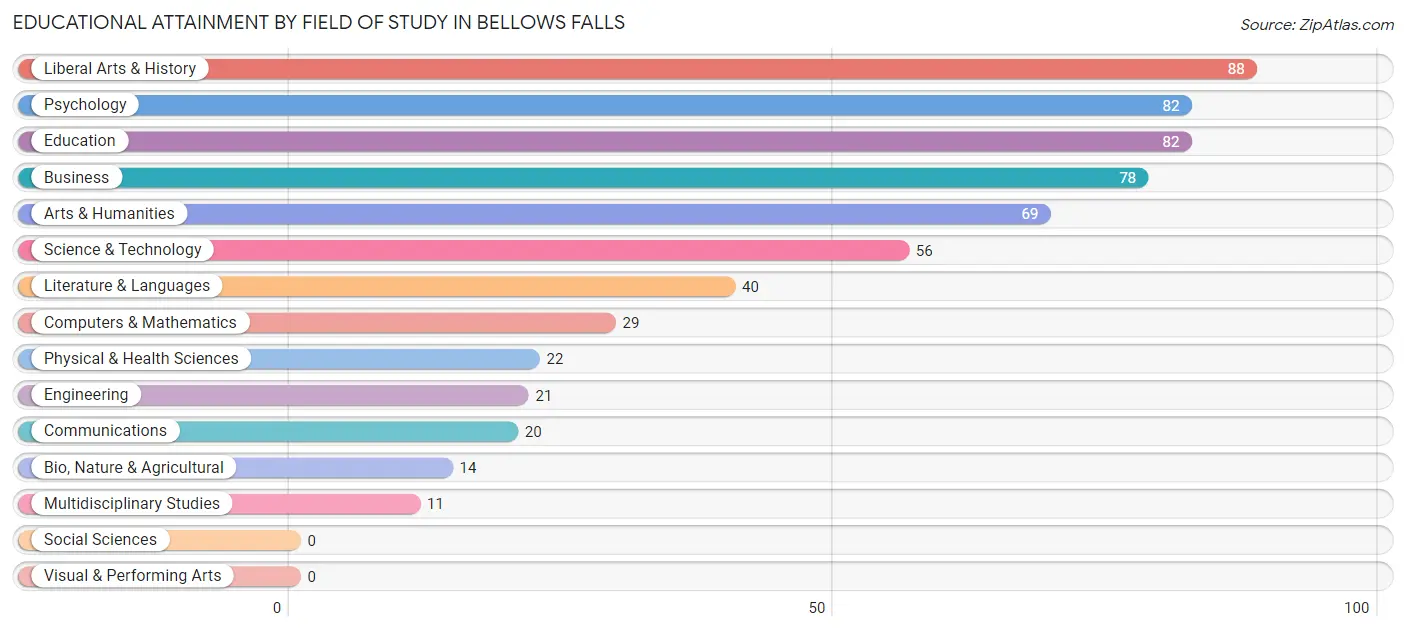
| Field of Study | # Graduates | % Graduates |
| Computers & Mathematics | 29 | 4.7% |
| Bio, Nature & Agricultural | 14 | 2.3% |
| Physical & Health Sciences | 22 | 3.6% |
| Psychology | 82 | 13.4% |
| Social Sciences | 0 | 0.0% |
| Engineering | 21 | 3.4% |
| Multidisciplinary Studies | 11 | 1.8% |
| Science & Technology | 56 | 9.1% |
| Business | 78 | 12.8% |
| Education | 82 | 13.4% |
| Literature & Languages | 40 | 6.5% |
| Liberal Arts & History | 88 | 14.4% |
| Visual & Performing Arts | 0 | 0.0% |
| Communications | 20 | 3.3% |
| Arts & Humanities | 69 | 11.3% |
| Total | 612 | 100.0% |
Transportation & Commute in Bellows Falls
Vehicle Availability by Sex in Bellows Falls
The most prevalent vehicle ownership categories in Bellows Falls are males with 2 vehicles (310, accounting for 54.6%) and females with 2 vehicles (387, making up 34.4%).
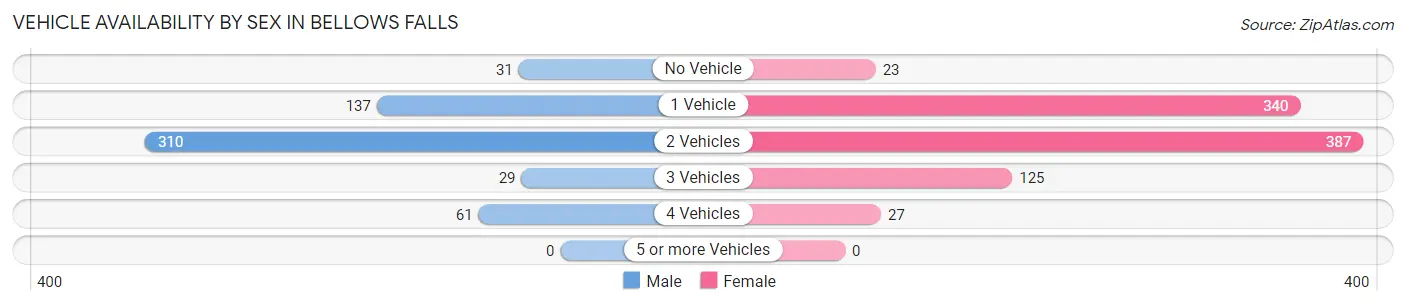
| Vehicles Available | Male | Female |
| No Vehicle | 31 (5.5%) | 23 (2.5%) |
| 1 Vehicle | 137 (24.1%) | 340 (37.7%) |
| 2 Vehicles | 310 (54.6%) | 387 (42.9%) |
| 3 Vehicles | 29 (5.1%) | 125 (13.9%) |
| 4 Vehicles | 61 (10.7%) | 27 (3.0%) |
| 5 or more Vehicles | 0 (0.0%) | 0 (0.0%) |
| Total | 568 (100.0%) | 902 (100.0%) |
Commute Time in Bellows Falls
The most frequently occuring commute durations in Bellows Falls are 30 to 34 minutes (328 commuters, 23.1%), less than 5 minutes (258 commuters, 18.1%), and 25 to 29 minutes (232 commuters, 16.3%).
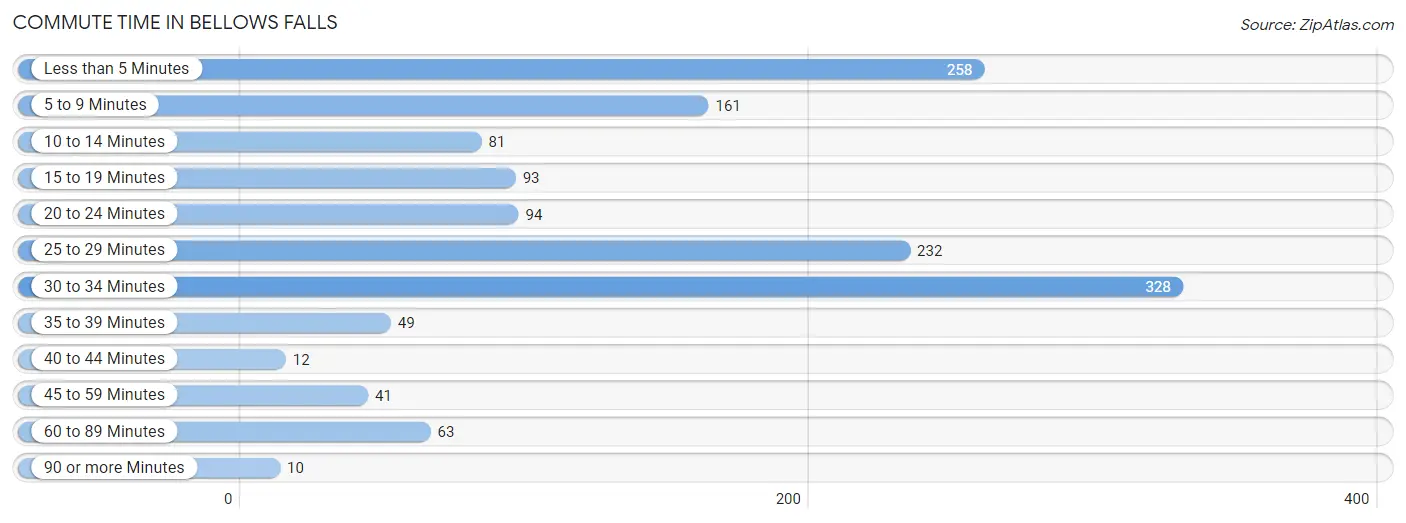
| Commute Time | # Commuters | % Commuters |
| Less than 5 Minutes | 258 | 18.1% |
| 5 to 9 Minutes | 161 | 11.3% |
| 10 to 14 Minutes | 81 | 5.7% |
| 15 to 19 Minutes | 93 | 6.5% |
| 20 to 24 Minutes | 94 | 6.6% |
| 25 to 29 Minutes | 232 | 16.3% |
| 30 to 34 Minutes | 328 | 23.1% |
| 35 to 39 Minutes | 49 | 3.5% |
| 40 to 44 Minutes | 12 | 0.8% |
| 45 to 59 Minutes | 41 | 2.9% |
| 60 to 89 Minutes | 63 | 4.4% |
| 90 or more Minutes | 10 | 0.7% |
Commute Time by Sex in Bellows Falls
The most common commute times in Bellows Falls are 30 to 34 minutes (118 commuters, 20.8%) for males and 30 to 34 minutes (210 commuters, 24.6%) for females.
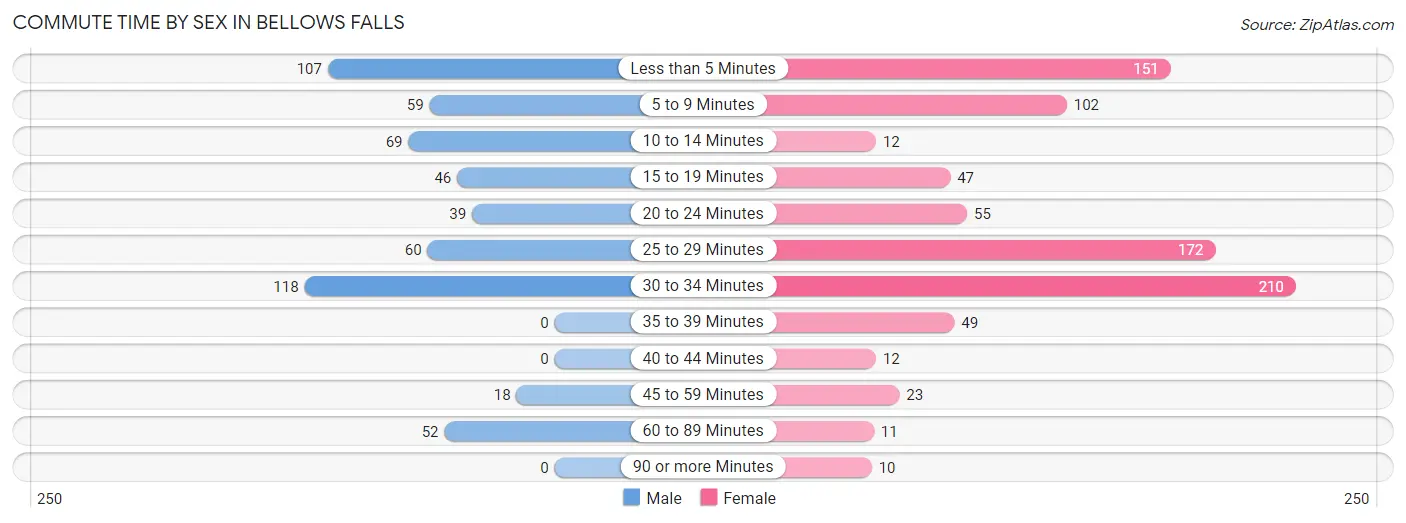
| Commute Time | Male | Female |
| Less than 5 Minutes | 107 (18.8%) | 151 (17.7%) |
| 5 to 9 Minutes | 59 (10.4%) | 102 (11.9%) |
| 10 to 14 Minutes | 69 (12.1%) | 12 (1.4%) |
| 15 to 19 Minutes | 46 (8.1%) | 47 (5.5%) |
| 20 to 24 Minutes | 39 (6.9%) | 55 (6.4%) |
| 25 to 29 Minutes | 60 (10.6%) | 172 (20.1%) |
| 30 to 34 Minutes | 118 (20.8%) | 210 (24.6%) |
| 35 to 39 Minutes | 0 (0.0%) | 49 (5.7%) |
| 40 to 44 Minutes | 0 (0.0%) | 12 (1.4%) |
| 45 to 59 Minutes | 18 (3.2%) | 23 (2.7%) |
| 60 to 89 Minutes | 52 (9.1%) | 11 (1.3%) |
| 90 or more Minutes | 0 (0.0%) | 10 (1.2%) |
Time of Departure to Work by Sex in Bellows Falls
The most frequent times of departure to work in Bellows Falls are 5:00 AM to 5:29 AM (93, 16.4%) for males and 7:00 AM to 7:29 AM (158, 18.5%) for females.
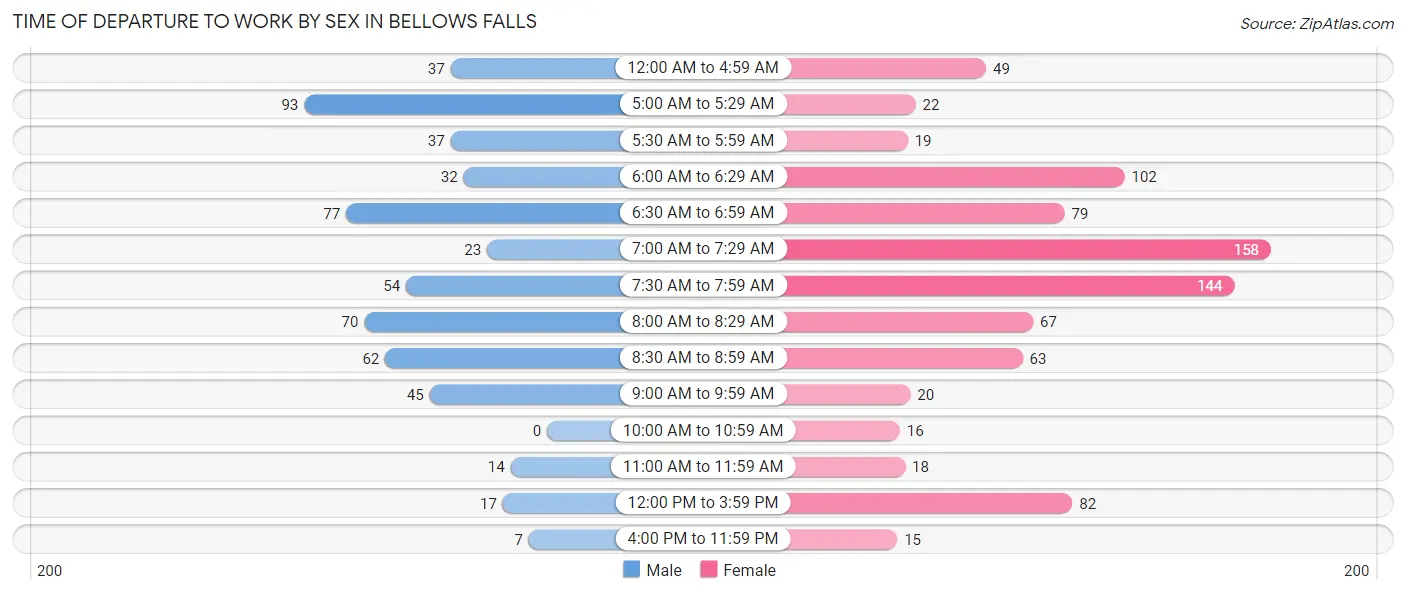
| Time of Departure | Male | Female |
| 12:00 AM to 4:59 AM | 37 (6.5%) | 49 (5.7%) |
| 5:00 AM to 5:29 AM | 93 (16.4%) | 22 (2.6%) |
| 5:30 AM to 5:59 AM | 37 (6.5%) | 19 (2.2%) |
| 6:00 AM to 6:29 AM | 32 (5.6%) | 102 (11.9%) |
| 6:30 AM to 6:59 AM | 77 (13.6%) | 79 (9.2%) |
| 7:00 AM to 7:29 AM | 23 (4.1%) | 158 (18.5%) |
| 7:30 AM to 7:59 AM | 54 (9.5%) | 144 (16.9%) |
| 8:00 AM to 8:29 AM | 70 (12.3%) | 67 (7.9%) |
| 8:30 AM to 8:59 AM | 62 (10.9%) | 63 (7.4%) |
| 9:00 AM to 9:59 AM | 45 (7.9%) | 20 (2.3%) |
| 10:00 AM to 10:59 AM | 0 (0.0%) | 16 (1.9%) |
| 11:00 AM to 11:59 AM | 14 (2.5%) | 18 (2.1%) |
| 12:00 PM to 3:59 PM | 17 (3.0%) | 82 (9.6%) |
| 4:00 PM to 11:59 PM | 7 (1.2%) | 15 (1.8%) |
| Total | 568 (100.0%) | 854 (100.0%) |
Housing Occupancy in Bellows Falls
Occupancy by Ownership in Bellows Falls
Of the total 1,292 dwellings in Bellows Falls, owner-occupied units account for 616 (47.7%), while renter-occupied units make up 676 (52.3%).
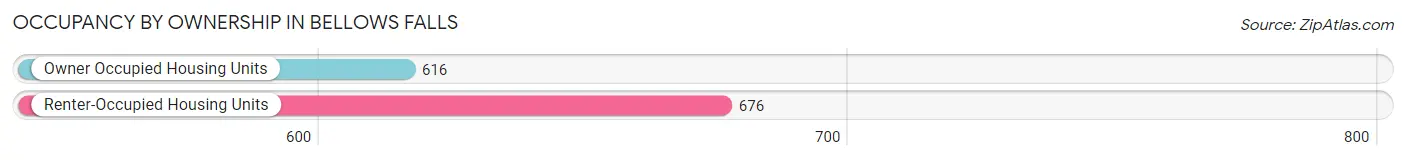
| Occupancy | # Housing Units | % Housing Units |
| Owner Occupied Housing Units | 616 | 47.7% |
| Renter-Occupied Housing Units | 676 | 52.3% |
| Total Occupied Housing Units | 1,292 | 100.0% |
Occupancy by Household Size in Bellows Falls
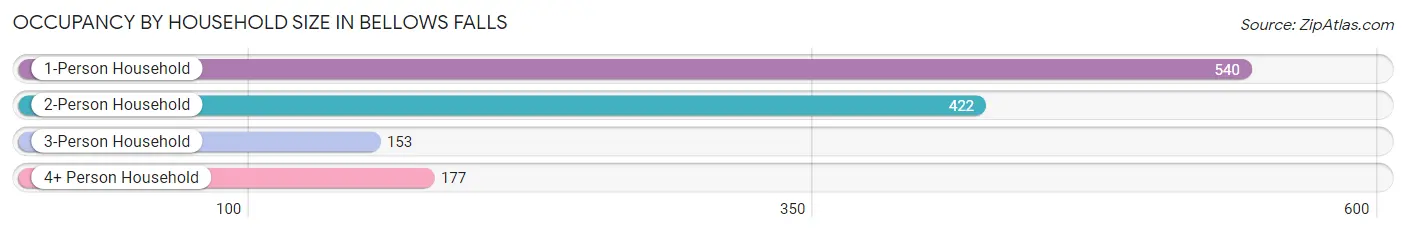
| Household Size | # Housing Units | % Housing Units |
| 1-Person Household | 540 | 41.8% |
| 2-Person Household | 422 | 32.7% |
| 3-Person Household | 153 | 11.8% |
| 4+ Person Household | 177 | 13.7% |
| Total Housing Units | 1,292 | 100.0% |
Occupancy by Ownership by Household Size in Bellows Falls
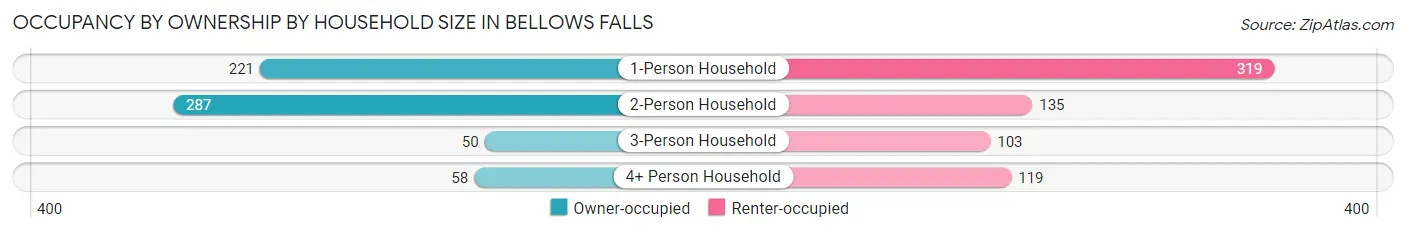
| Household Size | Owner-occupied | Renter-occupied |
| 1-Person Household | 221 (40.9%) | 319 (59.1%) |
| 2-Person Household | 287 (68.0%) | 135 (32.0%) |
| 3-Person Household | 50 (32.7%) | 103 (67.3%) |
| 4+ Person Household | 58 (32.8%) | 119 (67.2%) |
| Total Housing Units | 616 (47.7%) | 676 (52.3%) |
Occupancy by Educational Attainment in Bellows Falls
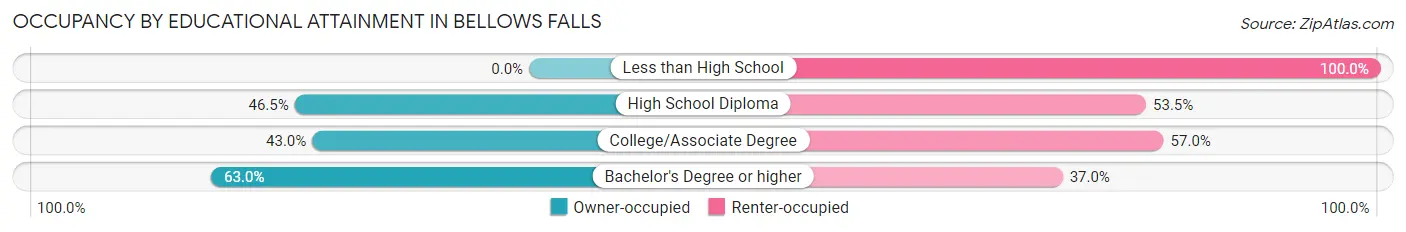
| Household Size | Owner-occupied | Renter-occupied |
| Less than High School | 0 (0.0%) | 67 (100.0%) |
| High School Diploma | 165 (46.5%) | 190 (53.5%) |
| College/Associate Degree | 209 (43.0%) | 277 (57.0%) |
| Bachelor's Degree or higher | 242 (63.0%) | 142 (37.0%) |
Occupancy by Age of Householder in Bellows Falls
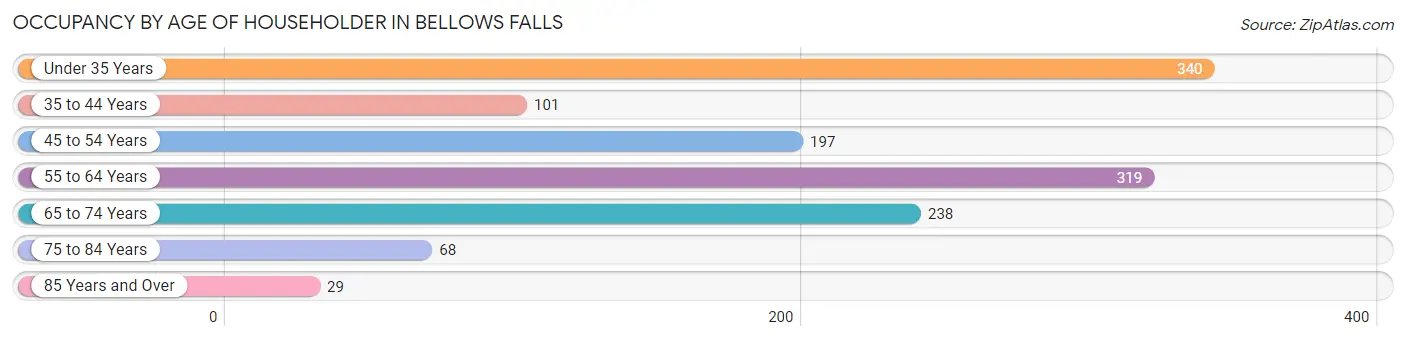
| Age Bracket | # Households | % Households |
| Under 35 Years | 340 | 26.3% |
| 35 to 44 Years | 101 | 7.8% |
| 45 to 54 Years | 197 | 15.2% |
| 55 to 64 Years | 319 | 24.7% |
| 65 to 74 Years | 238 | 18.4% |
| 75 to 84 Years | 68 | 5.3% |
| 85 Years and Over | 29 | 2.2% |
| Total | 1,292 | 100.0% |
Housing Finances in Bellows Falls
Median Income by Occupancy in Bellows Falls
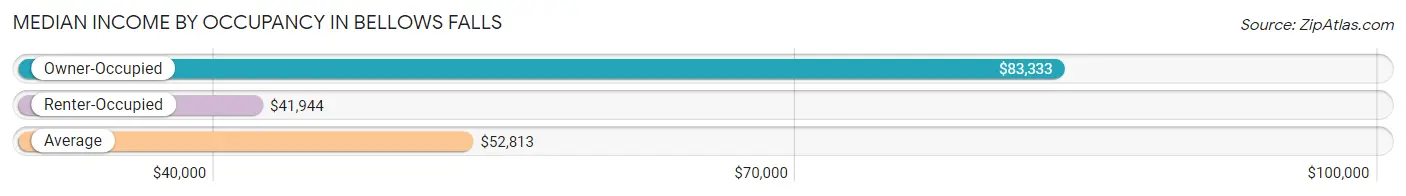
| Occupancy Type | # Households | Median Income |
| Owner-Occupied | 616 (47.7%) | $83,333 |
| Renter-Occupied | 676 (52.3%) | $41,944 |
| Average | 1,292 (100.0%) | $52,813 |
Occupancy by Householder Income Bracket in Bellows Falls
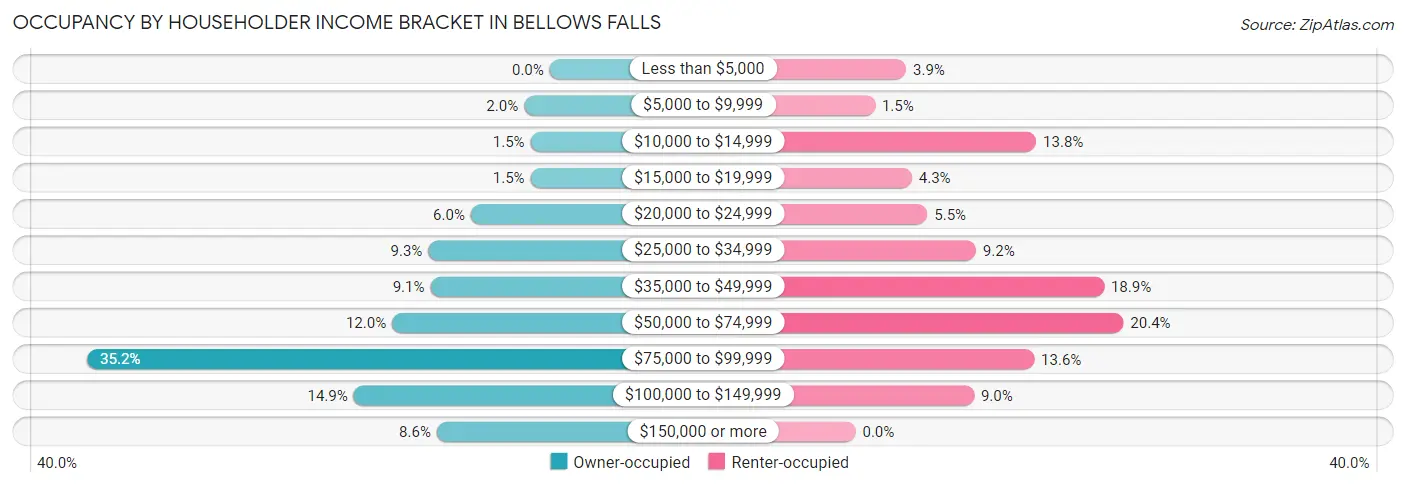
| Income Bracket | Owner-occupied | Renter-occupied |
| Less than $5,000 | 0 (0.0%) | 26 (3.8%) |
| $5,000 to $9,999 | 12 (1.9%) | 10 (1.5%) |
| $10,000 to $14,999 | 9 (1.5%) | 93 (13.8%) |
| $15,000 to $19,999 | 9 (1.5%) | 29 (4.3%) |
| $20,000 to $24,999 | 37 (6.0%) | 37 (5.5%) |
| $25,000 to $34,999 | 57 (9.2%) | 62 (9.2%) |
| $35,000 to $49,999 | 56 (9.1%) | 128 (18.9%) |
| $50,000 to $74,999 | 74 (12.0%) | 138 (20.4%) |
| $75,000 to $99,999 | 217 (35.2%) | 92 (13.6%) |
| $100,000 to $149,999 | 92 (14.9%) | 61 (9.0%) |
| $150,000 or more | 53 (8.6%) | 0 (0.0%) |
| Total | 616 (100.0%) | 676 (100.0%) |
Monthly Housing Cost Tiers in Bellows Falls
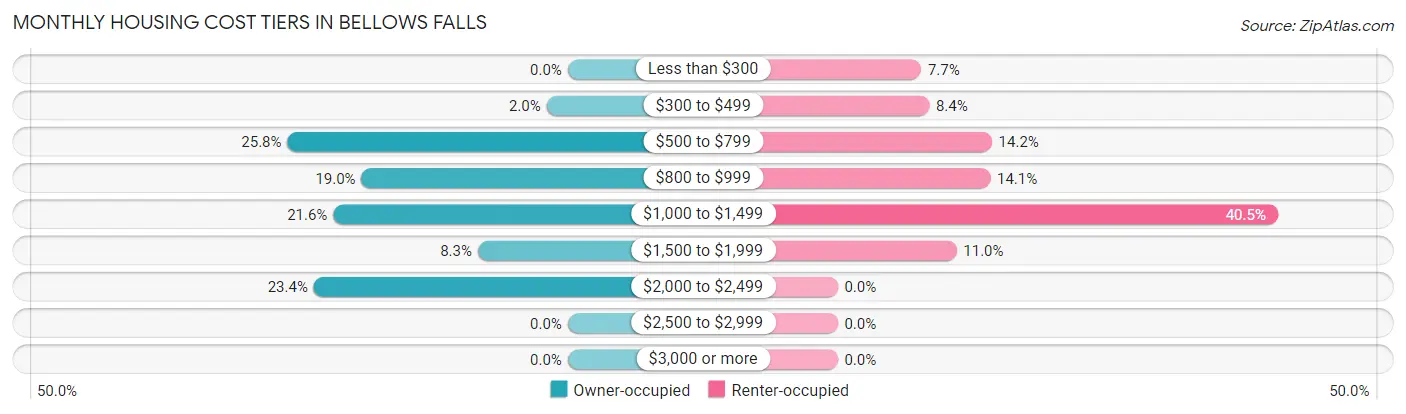
| Monthly Cost | Owner-occupied | Renter-occupied |
| Less than $300 | 0 (0.0%) | 52 (7.7%) |
| $300 to $499 | 12 (1.9%) | 57 (8.4%) |
| $500 to $799 | 159 (25.8%) | 96 (14.2%) |
| $800 to $999 | 117 (19.0%) | 95 (14.1%) |
| $1,000 to $1,499 | 133 (21.6%) | 274 (40.5%) |
| $1,500 to $1,999 | 51 (8.3%) | 74 (11.0%) |
| $2,000 to $2,499 | 144 (23.4%) | 0 (0.0%) |
| $2,500 to $2,999 | 0 (0.0%) | 0 (0.0%) |
| $3,000 or more | 0 (0.0%) | 0 (0.0%) |
| Total | 616 (100.0%) | 676 (100.0%) |
Physical Housing Characteristics in Bellows Falls
Housing Structures in Bellows Falls
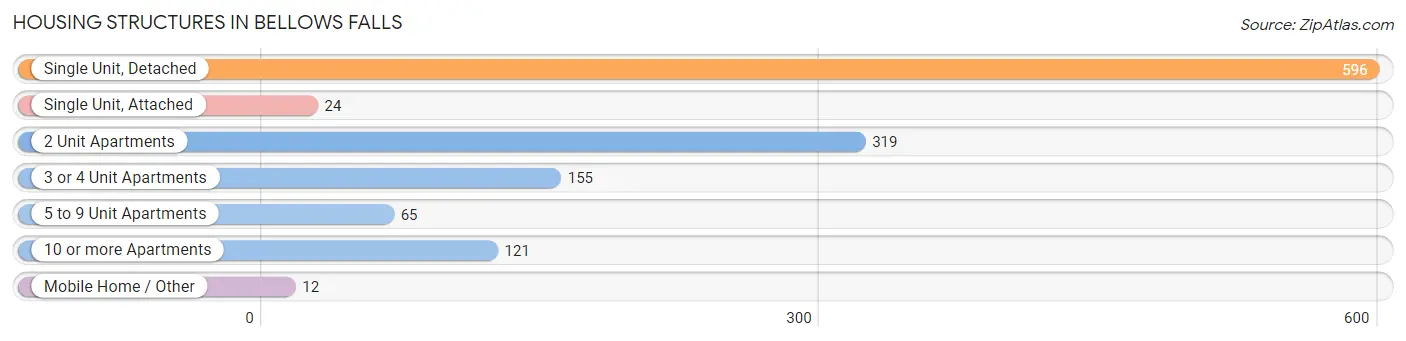
| Structure Type | # Housing Units | % Housing Units |
| Single Unit, Detached | 596 | 46.1% |
| Single Unit, Attached | 24 | 1.9% |
| 2 Unit Apartments | 319 | 24.7% |
| 3 or 4 Unit Apartments | 155 | 12.0% |
| 5 to 9 Unit Apartments | 65 | 5.0% |
| 10 or more Apartments | 121 | 9.4% |
| Mobile Home / Other | 12 | 0.9% |
| Total | 1,292 | 100.0% |
Housing Structures by Occupancy in Bellows Falls
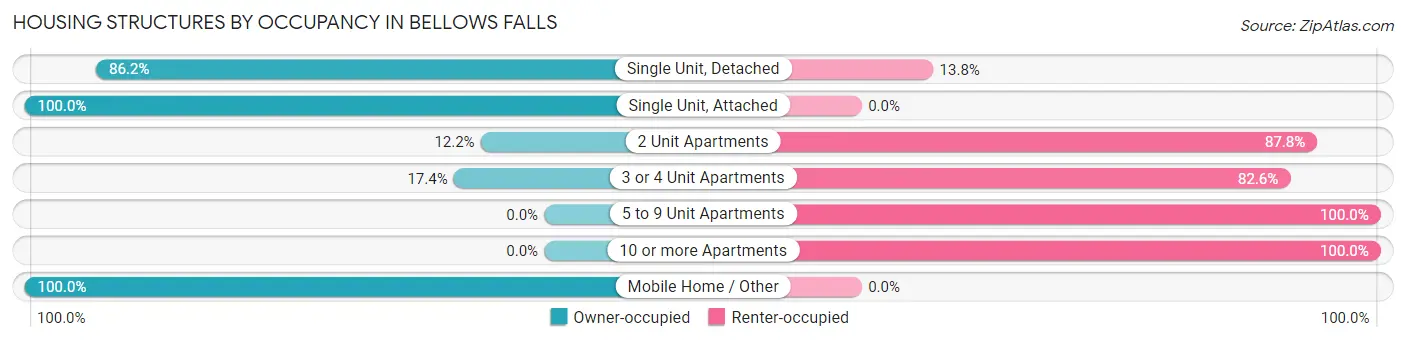
| Structure Type | Owner-occupied | Renter-occupied |
| Single Unit, Detached | 514 (86.2%) | 82 (13.8%) |
| Single Unit, Attached | 24 (100.0%) | 0 (0.0%) |
| 2 Unit Apartments | 39 (12.2%) | 280 (87.8%) |
| 3 or 4 Unit Apartments | 27 (17.4%) | 128 (82.6%) |
| 5 to 9 Unit Apartments | 0 (0.0%) | 65 (100.0%) |
| 10 or more Apartments | 0 (0.0%) | 121 (100.0%) |
| Mobile Home / Other | 12 (100.0%) | 0 (0.0%) |
| Total | 616 (47.7%) | 676 (52.3%) |
Housing Structures by Number of Rooms in Bellows Falls
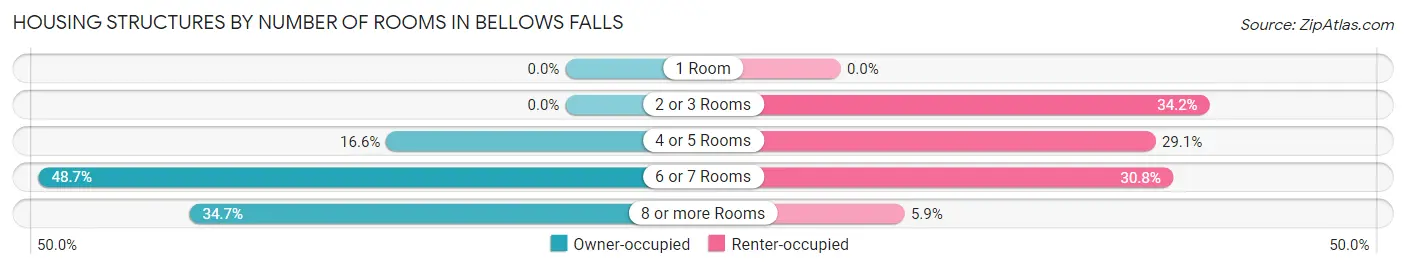
| Number of Rooms | Owner-occupied | Renter-occupied |
| 1 Room | 0 (0.0%) | 0 (0.0%) |
| 2 or 3 Rooms | 0 (0.0%) | 231 (34.2%) |
| 4 or 5 Rooms | 102 (16.6%) | 197 (29.1%) |
| 6 or 7 Rooms | 300 (48.7%) | 208 (30.8%) |
| 8 or more Rooms | 214 (34.7%) | 40 (5.9%) |
| Total | 616 (100.0%) | 676 (100.0%) |
Housing Structure by Heating Type in Bellows Falls
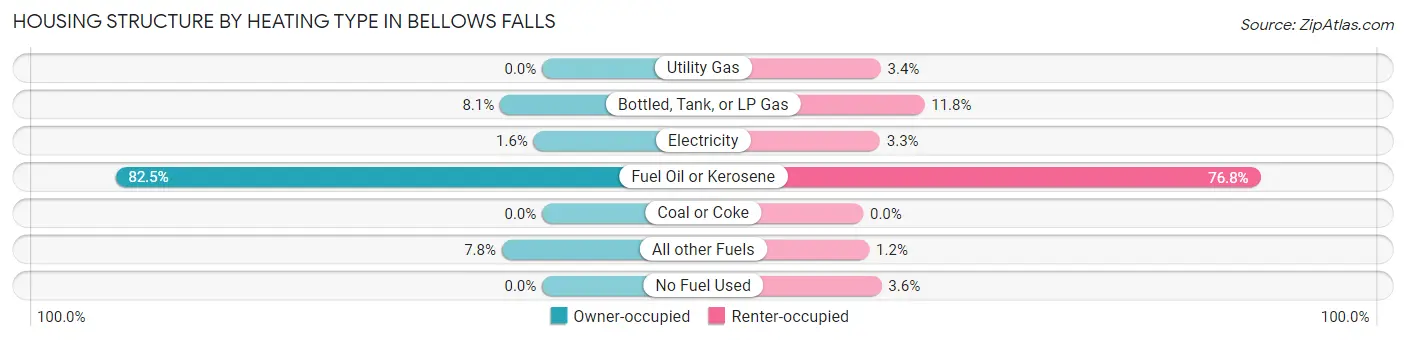
| Heating Type | Owner-occupied | Renter-occupied |
| Utility Gas | 0 (0.0%) | 23 (3.4%) |
| Bottled, Tank, or LP Gas | 50 (8.1%) | 80 (11.8%) |
| Electricity | 10 (1.6%) | 22 (3.3%) |
| Fuel Oil or Kerosene | 508 (82.5%) | 519 (76.8%) |
| Coal or Coke | 0 (0.0%) | 0 (0.0%) |
| All other Fuels | 48 (7.8%) | 8 (1.2%) |
| No Fuel Used | 0 (0.0%) | 24 (3.5%) |
| Total | 616 (100.0%) | 676 (100.0%) |
Household Vehicle Usage in Bellows Falls
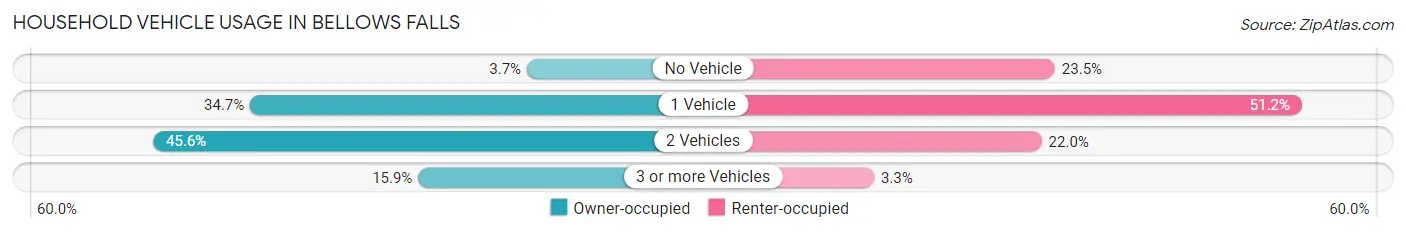
| Vehicles per Household | Owner-occupied | Renter-occupied |
| No Vehicle | 23 (3.7%) | 159 (23.5%) |
| 1 Vehicle | 214 (34.7%) | 346 (51.2%) |
| 2 Vehicles | 281 (45.6%) | 149 (22.0%) |
| 3 or more Vehicles | 98 (15.9%) | 22 (3.3%) |
| Total | 616 (100.0%) | 676 (100.0%) |
Real Estate & Mortgages in Bellows Falls
Real Estate and Mortgage Overview in Bellows Falls
| Characteristic | Without Mortgage | With Mortgage |
| Housing Units | 273 | 343 |
| Median Property Value | $146,600 | $170,900 |
| Median Household Income | $67,656 | $44 |
| Monthly Housing Costs | $690 | $0 |
| Real Estate Taxes | $4,750 | $0 |
Property Value by Mortgage Status in Bellows Falls
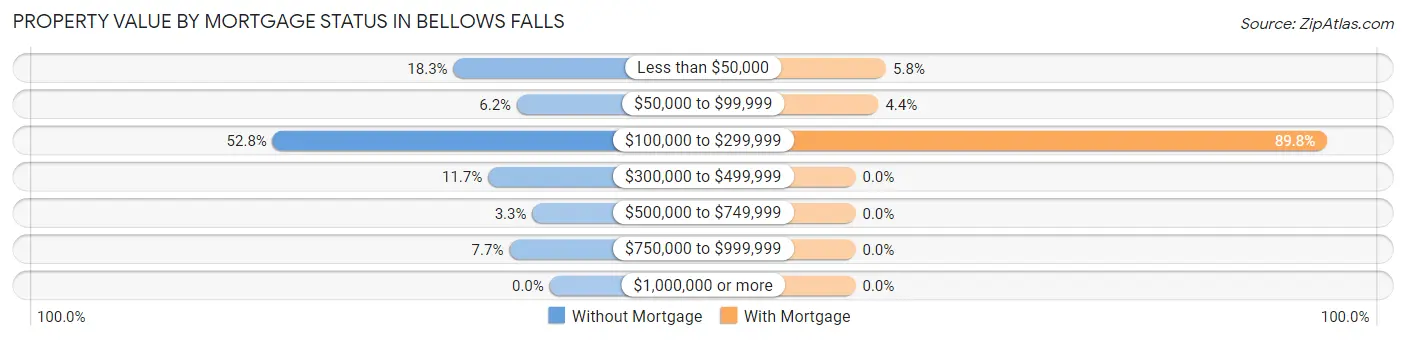
| Property Value | Without Mortgage | With Mortgage |
| Less than $50,000 | 50 (18.3%) | 20 (5.8%) |
| $50,000 to $99,999 | 17 (6.2%) | 15 (4.4%) |
| $100,000 to $299,999 | 144 (52.7%) | 308 (89.8%) |
| $300,000 to $499,999 | 32 (11.7%) | 0 (0.0%) |
| $500,000 to $749,999 | 9 (3.3%) | 0 (0.0%) |
| $750,000 to $999,999 | 21 (7.7%) | 0 (0.0%) |
| $1,000,000 or more | 0 (0.0%) | 0 (0.0%) |
| Total | 273 (100.0%) | 343 (100.0%) |
Household Income by Mortgage Status in Bellows Falls
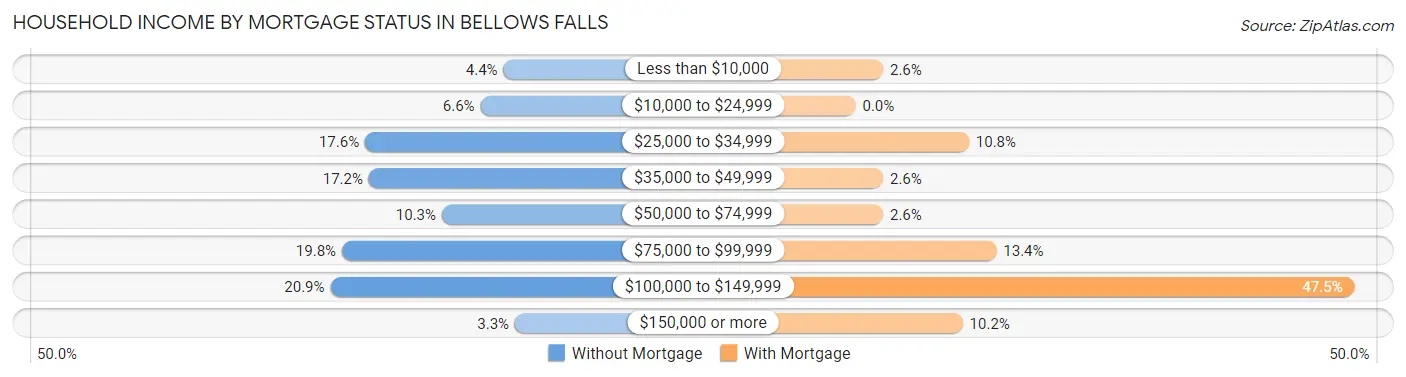
| Household Income | Without Mortgage | With Mortgage |
| Less than $10,000 | 12 (4.4%) | 9 (2.6%) |
| $10,000 to $24,999 | 18 (6.6%) | 0 (0.0%) |
| $25,000 to $34,999 | 48 (17.6%) | 37 (10.8%) |
| $35,000 to $49,999 | 47 (17.2%) | 9 (2.6%) |
| $50,000 to $74,999 | 28 (10.3%) | 9 (2.6%) |
| $75,000 to $99,999 | 54 (19.8%) | 46 (13.4%) |
| $100,000 to $149,999 | 57 (20.9%) | 163 (47.5%) |
| $150,000 or more | 9 (3.3%) | 35 (10.2%) |
| Total | 273 (100.0%) | 343 (100.0%) |
Property Value to Household Income Ratio in Bellows Falls
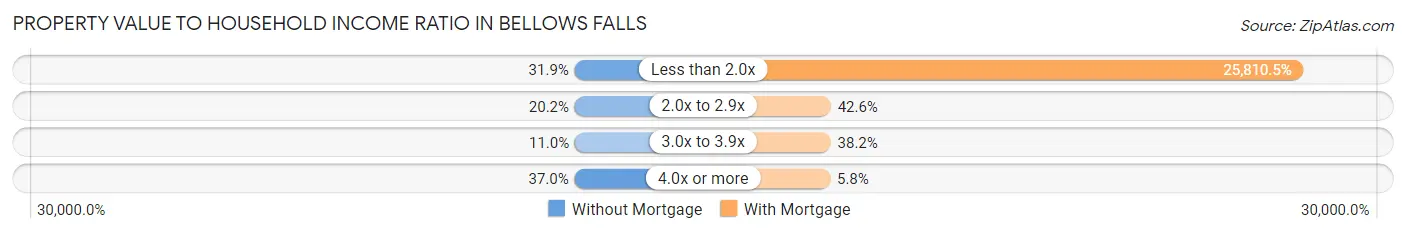
| Value-to-Income Ratio | Without Mortgage | With Mortgage |
| Less than 2.0x | 87 (31.9%) | 88,530 (25,810.5%) |
| 2.0x to 2.9x | 55 (20.2%) | 146 (42.6%) |
| 3.0x to 3.9x | 30 (11.0%) | 131 (38.2%) |
| 4.0x or more | 101 (37.0%) | 20 (5.8%) |
| Total | 273 (100.0%) | 343 (100.0%) |
Real Estate Taxes by Mortgage Status in Bellows Falls
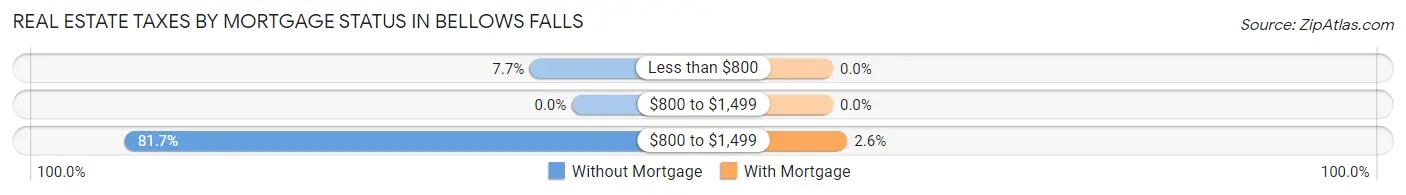
| Property Taxes | Without Mortgage | With Mortgage |
| Less than $800 | 21 (7.7%) | 0 (0.0%) |
| $800 to $1,499 | 0 (0.0%) | 0 (0.0%) |
| $800 to $1,499 | 223 (81.7%) | 9 (2.6%) |
| Total | 273 (100.0%) | 343 (100.0%) |
Health & Disability in Bellows Falls
Health Insurance Coverage by Age in Bellows Falls
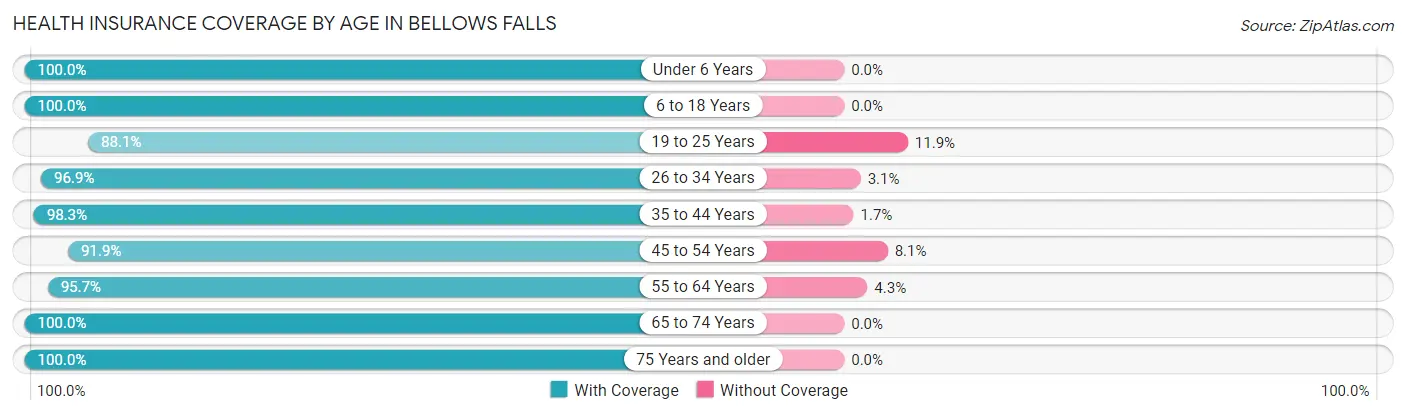
| Age Bracket | With Coverage | Without Coverage |
| Under 6 Years | 207 (100.0%) | 0 (0.0%) |
| 6 to 18 Years | 470 (100.0%) | 0 (0.0%) |
| 19 to 25 Years | 275 (88.1%) | 37 (11.9%) |
| 26 to 34 Years | 221 (96.9%) | 7 (3.1%) |
| 35 to 44 Years | 284 (98.3%) | 5 (1.7%) |
| 45 to 54 Years | 261 (91.9%) | 23 (8.1%) |
| 55 to 64 Years | 466 (95.7%) | 21 (4.3%) |
| 65 to 74 Years | 302 (100.0%) | 0 (0.0%) |
| 75 Years and older | 220 (100.0%) | 0 (0.0%) |
| Total | 2,706 (96.7%) | 93 (3.3%) |
Health Insurance Coverage by Citizenship Status in Bellows Falls
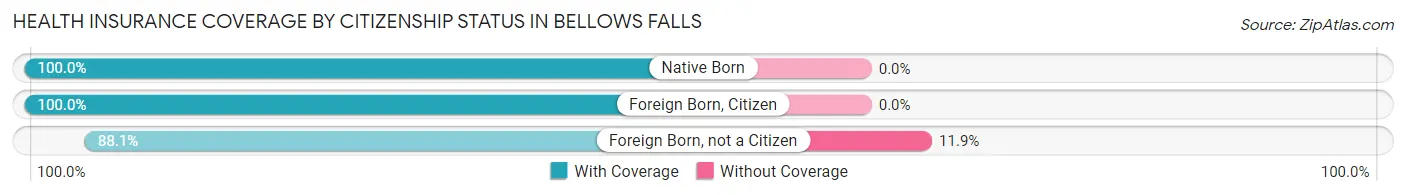
| Citizenship Status | With Coverage | Without Coverage |
| Native Born | 207 (100.0%) | 0 (0.0%) |
| Foreign Born, Citizen | 470 (100.0%) | 0 (0.0%) |
| Foreign Born, not a Citizen | 275 (88.1%) | 37 (11.9%) |
Health Insurance Coverage by Household Income in Bellows Falls
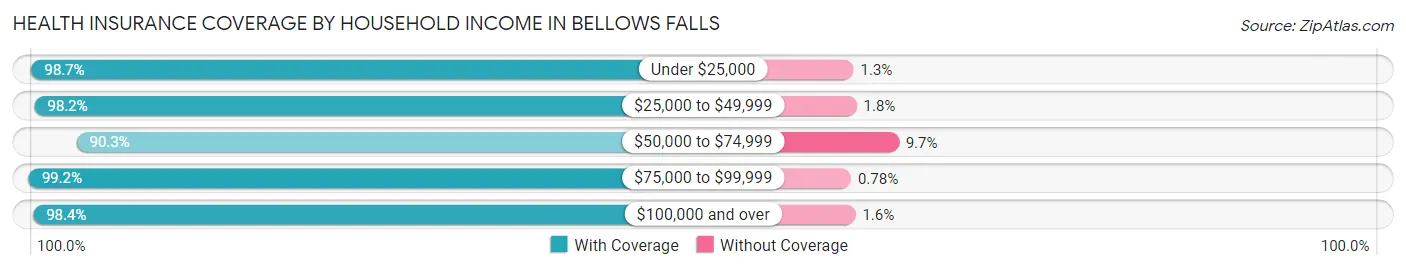
| Household Income | With Coverage | Without Coverage |
| Under $25,000 | 389 (98.7%) | 5 (1.3%) |
| $25,000 to $49,999 | 375 (98.2%) | 7 (1.8%) |
| $50,000 to $74,999 | 604 (90.3%) | 65 (9.7%) |
| $75,000 to $99,999 | 636 (99.2%) | 5 (0.8%) |
| $100,000 and over | 670 (98.4%) | 11 (1.6%) |
Public vs Private Health Insurance Coverage by Age in Bellows Falls
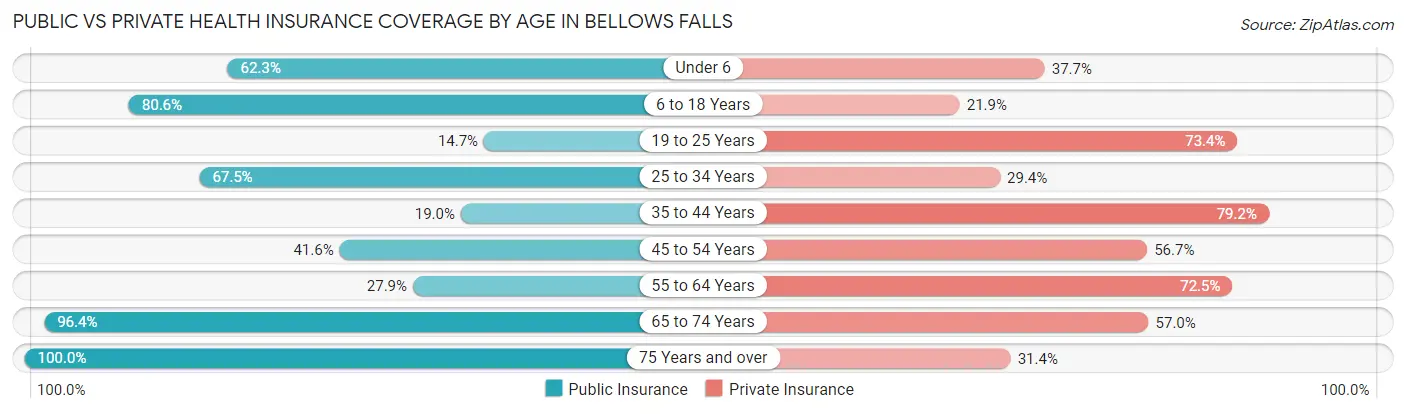
| Age Bracket | Public Insurance | Private Insurance |
| Under 6 | 129 (62.3%) | 78 (37.7%) |
| 6 to 18 Years | 379 (80.6%) | 103 (21.9%) |
| 19 to 25 Years | 46 (14.7%) | 229 (73.4%) |
| 25 to 34 Years | 154 (67.5%) | 67 (29.4%) |
| 35 to 44 Years | 55 (19.0%) | 229 (79.2%) |
| 45 to 54 Years | 118 (41.5%) | 161 (56.7%) |
| 55 to 64 Years | 136 (27.9%) | 353 (72.5%) |
| 65 to 74 Years | 291 (96.4%) | 172 (57.0%) |
| 75 Years and over | 220 (100.0%) | 69 (31.4%) |
| Total | 1,528 (54.6%) | 1,461 (52.2%) |
Disability Status by Sex by Age in Bellows Falls
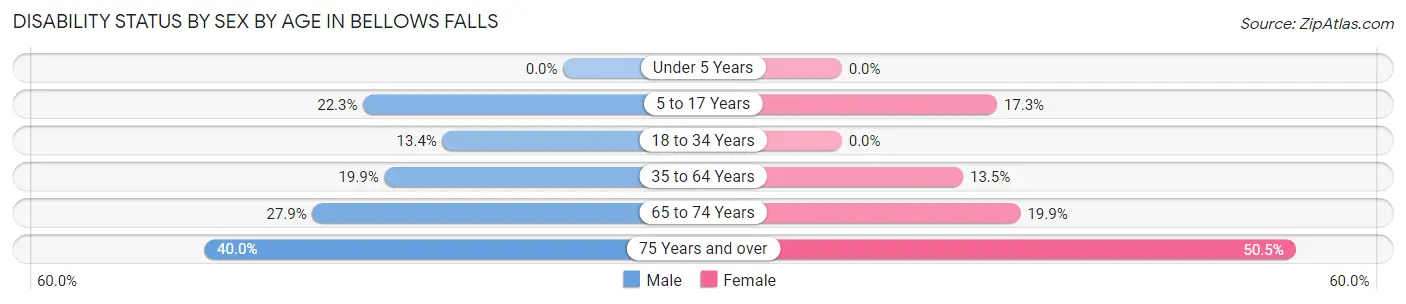
| Age Bracket | Male | Female |
| Under 5 Years | 0 (0.0%) | 0 (0.0%) |
| 5 to 17 Years | 43 (22.3%) | 42 (17.3%) |
| 18 to 34 Years | 25 (13.4%) | 0 (0.0%) |
| 35 to 64 Years | 99 (19.9%) | 76 (13.5%) |
| 65 to 74 Years | 31 (27.9%) | 38 (19.9%) |
| 75 Years and over | 12 (40.0%) | 96 (50.5%) |
Disability Class by Sex by Age in Bellows Falls
Disability Class: Hearing Difficulty
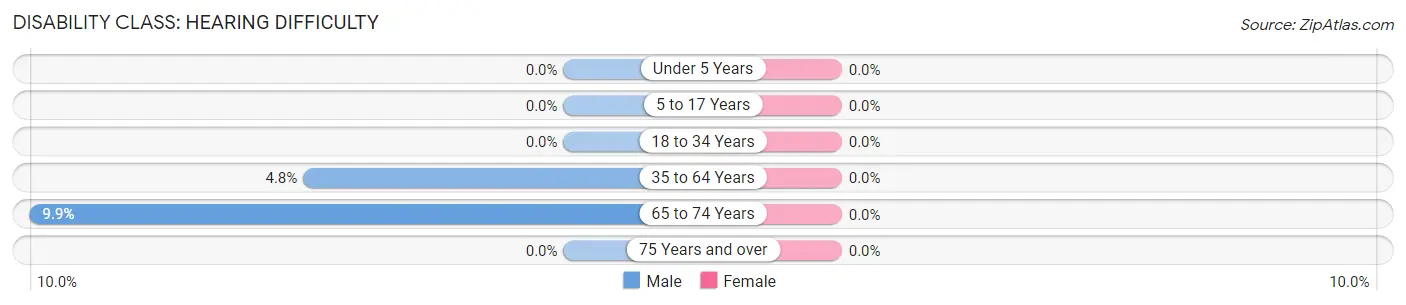
| Age Bracket | Male | Female |
| Under 5 Years | 0 (0.0%) | 0 (0.0%) |
| 5 to 17 Years | 0 (0.0%) | 0 (0.0%) |
| 18 to 34 Years | 0 (0.0%) | 0 (0.0%) |
| 35 to 64 Years | 24 (4.8%) | 0 (0.0%) |
| 65 to 74 Years | 11 (9.9%) | 0 (0.0%) |
| 75 Years and over | 0 (0.0%) | 0 (0.0%) |
Disability Class: Vision Difficulty
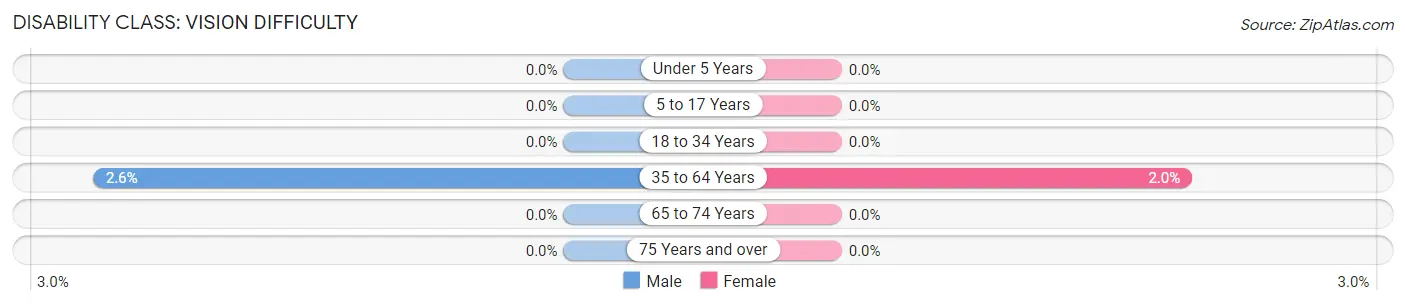
| Age Bracket | Male | Female |
| Under 5 Years | 0 (0.0%) | 0 (0.0%) |
| 5 to 17 Years | 0 (0.0%) | 0 (0.0%) |
| 18 to 34 Years | 0 (0.0%) | 0 (0.0%) |
| 35 to 64 Years | 13 (2.6%) | 11 (1.9%) |
| 65 to 74 Years | 0 (0.0%) | 0 (0.0%) |
| 75 Years and over | 0 (0.0%) | 0 (0.0%) |
Disability Class: Cognitive Difficulty
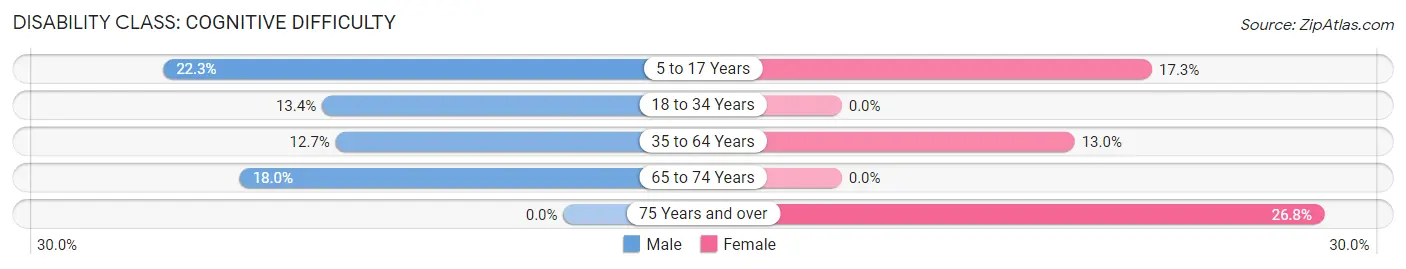
| Age Bracket | Male | Female |
| 5 to 17 Years | 43 (22.3%) | 42 (17.3%) |
| 18 to 34 Years | 25 (13.4%) | 0 (0.0%) |
| 35 to 64 Years | 63 (12.7%) | 73 (13.0%) |
| 65 to 74 Years | 20 (18.0%) | 0 (0.0%) |
| 75 Years and over | 0 (0.0%) | 51 (26.8%) |
Disability Class: Ambulatory Difficulty
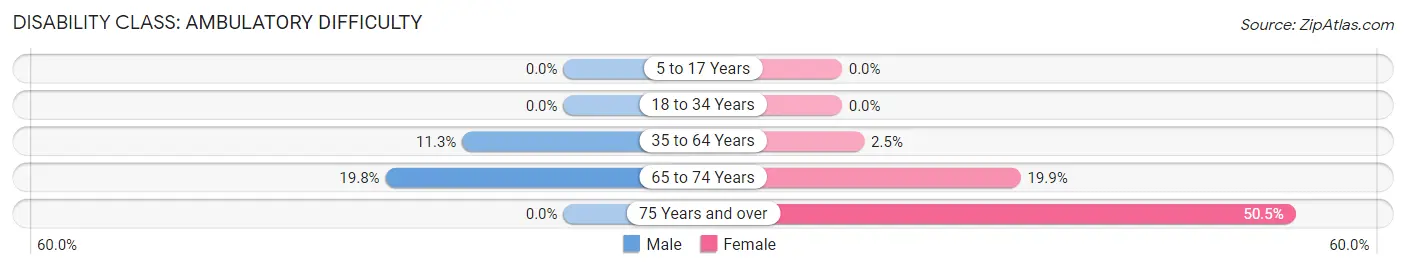
| Age Bracket | Male | Female |
| 5 to 17 Years | 0 (0.0%) | 0 (0.0%) |
| 18 to 34 Years | 0 (0.0%) | 0 (0.0%) |
| 35 to 64 Years | 56 (11.3%) | 14 (2.5%) |
| 65 to 74 Years | 22 (19.8%) | 38 (19.9%) |
| 75 Years and over | 0 (0.0%) | 96 (50.5%) |
Disability Class: Self-Care Difficulty
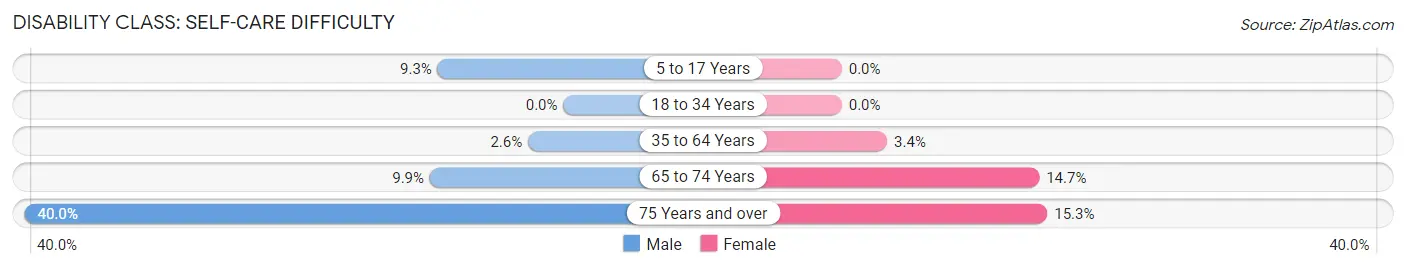
| Age Bracket | Male | Female |
| 5 to 17 Years | 18 (9.3%) | 0 (0.0%) |
| 18 to 34 Years | 0 (0.0%) | 0 (0.0%) |
| 35 to 64 Years | 13 (2.6%) | 19 (3.4%) |
| 65 to 74 Years | 11 (9.9%) | 28 (14.7%) |
| 75 Years and over | 12 (40.0%) | 29 (15.3%) |
Technology Access in Bellows Falls
Computing Device Access in Bellows Falls
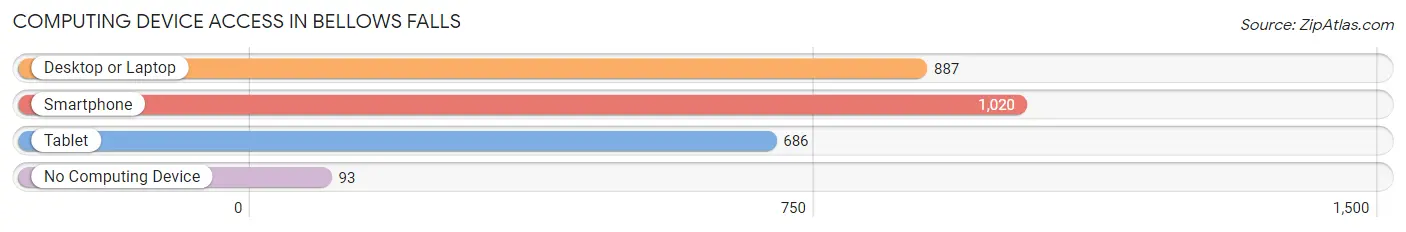
| Device Type | # Households | % Households |
| Desktop or Laptop | 887 | 68.6% |
| Smartphone | 1,020 | 78.9% |
| Tablet | 686 | 53.1% |
| No Computing Device | 93 | 7.2% |
| Total | 1,292 | 100.0% |
Internet Access in Bellows Falls
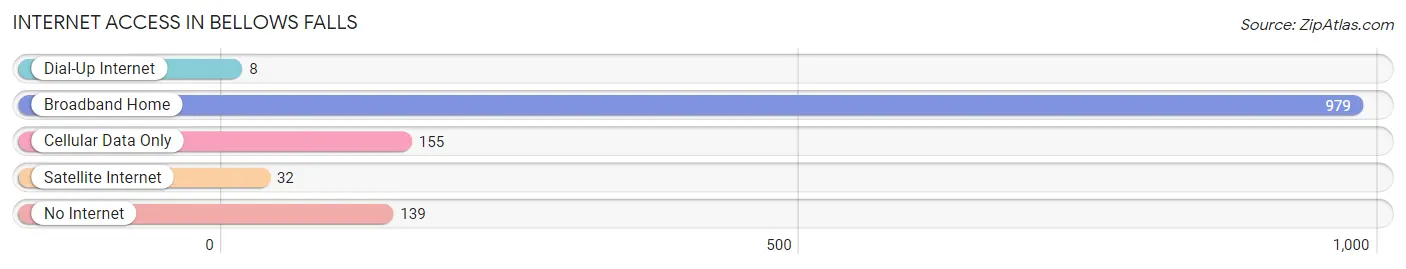
| Internet Type | # Households | % Households |
| Dial-Up Internet | 8 | 0.6% |
| Broadband Home | 979 | 75.8% |
| Cellular Data Only | 155 | 12.0% |
| Satellite Internet | 32 | 2.5% |
| No Internet | 139 | 10.8% |
| Total | 1,292 | 100.0% |
Bellows Falls Summary
Bellows Falls, Vermont is a small village located in the southeastern corner of the state, in the town of Rockingham. It is situated on the Connecticut River, which forms the border between Vermont and New Hampshire. The village is home to a population of approximately 3,000 people, and is part of the larger Windham County.
History
Bellows Falls has a long and varied history, beginning with its first settlers in the late 1700s. The area was originally inhabited by the Abenaki people, who called the area “Namaoskeag”, meaning “place of many falls”. The first European settlers arrived in 1753, and the town was officially incorporated in 1761.
The town was named after Colonel Benjamin Bellows, who was a prominent figure in the area during the Revolutionary War. He was responsible for the construction of a bridge across the Connecticut River, which allowed for easier transportation of goods and people.
The town grew rapidly in the 19th century, due to its location on the Connecticut River. It became a major hub for transportation and industry, with several mills and factories being built along the river. The town was also home to several railroad lines, which connected it to other parts of the state and the country.
The town experienced a decline in the 20th century, as the mills and factories closed and the railroad lines were abandoned. However, the town has seen a resurgence in recent years, with the opening of several new businesses and the revitalization of its historic downtown.
Geography
Bellows Falls is located in the southeastern corner of Vermont, in the town of Rockingham. It is situated on the Connecticut River, which forms the border between Vermont and New Hampshire. The village is located at the confluence of the Saxtons River and the Williams River, which both flow into the Connecticut River.
The town is located in a valley, surrounded by hills and mountains. The highest point in the area is the summit of Mount Wantastiquet, which is located just outside of town. The town is also home to several parks and recreational areas, including the Bellows Falls Village Green and the Bellows Falls Canal.
Economy
The economy of Bellows Falls is largely based on tourism and service industries. The town is home to several restaurants, shops, and other businesses that cater to visitors. The town is also home to several manufacturing companies, including a paper mill and a plastics factory.
The town is also home to several educational institutions, including the Bellows Falls Union High School and the Bellows Falls Community College. The town is also home to several historic sites, including the Bellows Falls Canal and the Bellows Falls Village Green.
Demographics
As of the 2010 census, the population of Bellows Falls was 3,077. The racial makeup of the town was 94.3% White, 1.2% African American, 0.3% Native American, 0.7% Asian, 0.1% Pacific Islander, 1.2% from other races, and 2.3% from two or more races. Hispanic or Latino of any race were 3.2% of the population.
The median household income in Bellows Falls was $41,944, and the median family income was $50,917. The per capita income for the town was $20,945. About 11.2% of families and 14.3% of the population were below the poverty line, including 19.2% of those under age 18 and 8.2% of those age 65 or over.
Conclusion
Bellows Falls, Vermont is a small village located in the southeastern corner of the state, in the town of Rockingham. It is situated on the Connecticut River, which forms the border between Vermont and New Hampshire. The village is home to a population of approximately 3,000 people, and is part of the larger Windham County. The town has a long and varied history, and has seen a resurgence in recent years with the opening of several new businesses and the revitalization of its historic downtown. The economy of Bellows Falls is largely based on tourism and service industries, and the town is home to several educational institutions and historic sites. The population of Bellows Falls is largely white, with a small percentage of African American, Native American, Asian, and Pacific Islander residents. The median household income in Bellows Falls is slightly below the state average, and the poverty rate is slightly higher than the state average.
Common Questions
What is Per Capita Income in Bellows Falls?
Per Capita income in Bellows Falls is $30,072.
What is the Median Family Income in Bellows Falls?
Median Family Income in Bellows Falls is $76,250.
What is the Median Household income in Bellows Falls?
Median Household Income in Bellows Falls is $52,813.
What is Income or Wage Gap in Bellows Falls?
Income or Wage Gap in Bellows Falls is 0.0%.
Women in Bellows Falls earn 100.0 cents for every dollar earned by a man.
What is Family Income Deficit in Bellows Falls?
Family Income Deficit in Bellows Falls is $15,558.
Families that are below poverty line in Bellows Falls earn $15,558 less on average than the poverty threshold level.
What is Inequality or Gini Index in Bellows Falls?
Inequality or Gini Index in Bellows Falls is 0.38.
What is the Total Population of Bellows Falls?
Total Population of Bellows Falls is 2,824.
What is the Total Male Population of Bellows Falls?
Total Male Population of Bellows Falls is 1,107.
What is the Total Female Population of Bellows Falls?
Total Female Population of Bellows Falls is 1,717.
What is the Ratio of Males per 100 Females in Bellows Falls?
There are 64.47 Males per 100 Females in Bellows Falls.
What is the Ratio of Females per 100 Males in Bellows Falls?
There are 155.10 Females per 100 Males in Bellows Falls.
What is the Median Population Age in Bellows Falls?
Median Population Age in Bellows Falls is 41.9 Years.
What is the Average Family Size in Bellows Falls
Average Family Size in Bellows Falls is 3.0 People.
What is the Average Household Size in Bellows Falls
Average Household Size in Bellows Falls is 2.1 People.
How Large is the Labor Force in Bellows Falls?
There are 1,538 People in the Labor Forcein in Bellows Falls.
What is the Percentage of People in the Labor Force in Bellows Falls?
67.5% of People are in the Labor Force in Bellows Falls.
What is the Unemployment Rate in Bellows Falls?
Unemployment Rate in Bellows Falls is 3.0%.