Lawler, IA Map & Demographics
Lawler Map
Lawler Overview
$30,836
PER CAPITA INCOME
$77,188
AVG FAMILY INCOME
$54,688
AVG HOUSEHOLD INCOME
0.4%
WAGE / INCOME GAP [ % ]
99.6¢/ $1
WAGE / INCOME GAP [ $ ]
0.37
INEQUALITY / GINI INDEX
377
TOTAL POPULATION
186
MALE POPULATION
191
FEMALE POPULATION
97.38
MALES / 100 FEMALES
102.69
FEMALES / 100 MALES
40.7
MEDIAN AGE
2.8
AVG FAMILY SIZE
2.1
AVG HOUSEHOLD SIZE
212
LABOR FORCE [ PEOPLE ]
69.3%
PERCENT IN LABOR FORCE
5.2%
UNEMPLOYMENT RATE
Lawler Zip Codes
Lawler Area Codes
Income in Lawler
Income Overview in Lawler
Per Capita Income in Lawler is $30,836, while median incomes of families and households are $77,188 and $54,688 respectively.
| Characteristic | Number | Measure |
| Per Capita Income | 377 | $30,836 |
| Median Family Income | 99 | $77,188 |
| Mean Family Income | 99 | $79,463 |
| Median Household Income | 177 | $54,688 |
| Mean Household Income | 177 | $63,688 |
| Income Deficit | 99 | $0 |
| Wage / Income Gap (%) | 377 | 0.41% |
| Wage / Income Gap ($) | 377 | 99.59¢ per $1 |
| Gini / Inequality Index | 377 | 0.37 |
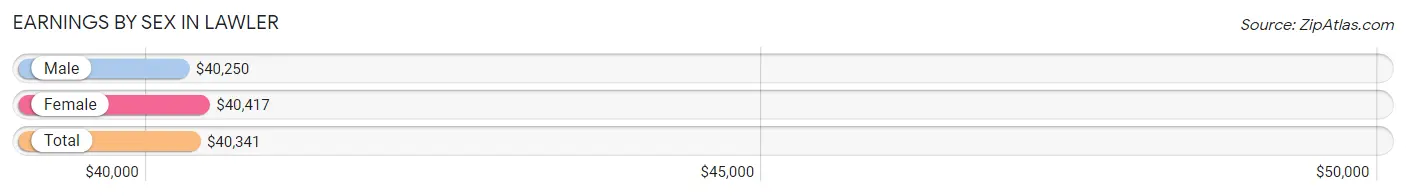
Earnings by Sex in Lawler
Average Earnings in Lawler are $40,341, $40,250 for men and $40,417 for women, a difference of 0.4%.
| Sex | Number | Average Earnings |
| Male | 119 (53.4%) | $40,250 |
| Female | 104 (46.6%) | $40,417 |
| Total | 223 (100.0%) | $40,341 |
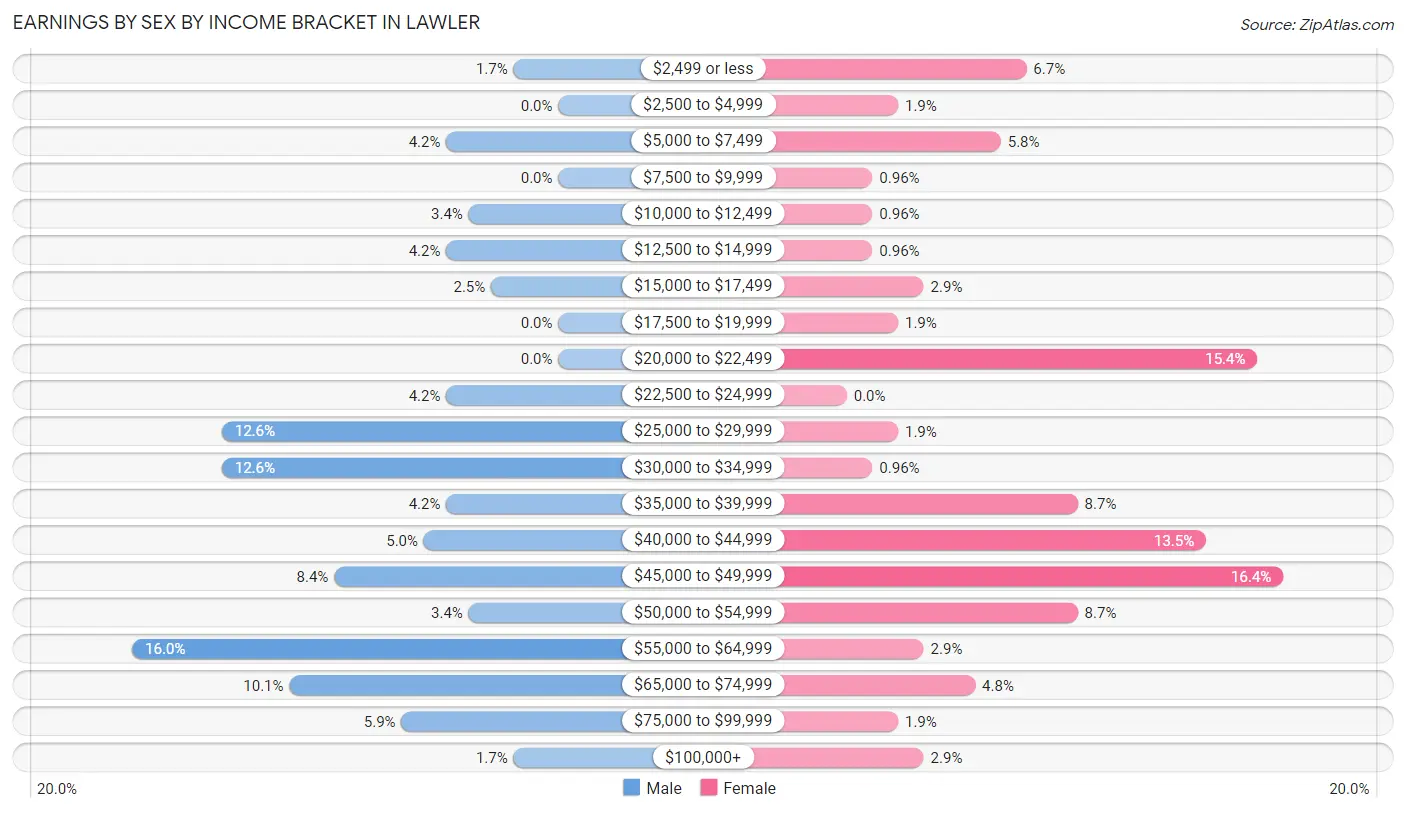
Earnings by Sex by Income Bracket in Lawler
The most common earnings brackets in Lawler are $55,000 to $64,999 for men (19 | 16.0%) and $45,000 to $49,999 for women (17 | 16.4%).
| Income | Male | Female |
| $2,499 or less | 2 (1.7%) | 7 (6.7%) |
| $2,500 to $4,999 | 0 (0.0%) | 2 (1.9%) |
| $5,000 to $7,499 | 5 (4.2%) | 6 (5.8%) |
| $7,500 to $9,999 | 0 (0.0%) | 1 (1.0%) |
| $10,000 to $12,499 | 4 (3.4%) | 1 (1.0%) |
| $12,500 to $14,999 | 5 (4.2%) | 1 (1.0%) |
| $15,000 to $17,499 | 3 (2.5%) | 3 (2.9%) |
| $17,500 to $19,999 | 0 (0.0%) | 2 (1.9%) |
| $20,000 to $22,499 | 0 (0.0%) | 16 (15.4%) |
| $22,500 to $24,999 | 5 (4.2%) | 0 (0.0%) |
| $25,000 to $29,999 | 15 (12.6%) | 2 (1.9%) |
| $30,000 to $34,999 | 15 (12.6%) | 1 (1.0%) |
| $35,000 to $39,999 | 5 (4.2%) | 9 (8.6%) |
| $40,000 to $44,999 | 6 (5.0%) | 14 (13.5%) |
| $45,000 to $49,999 | 10 (8.4%) | 17 (16.4%) |
| $50,000 to $54,999 | 4 (3.4%) | 9 (8.6%) |
| $55,000 to $64,999 | 19 (16.0%) | 3 (2.9%) |
| $65,000 to $74,999 | 12 (10.1%) | 5 (4.8%) |
| $75,000 to $99,999 | 7 (5.9%) | 2 (1.9%) |
| $100,000+ | 2 (1.7%) | 3 (2.9%) |
| Total | 119 (100.0%) | 104 (100.0%) |
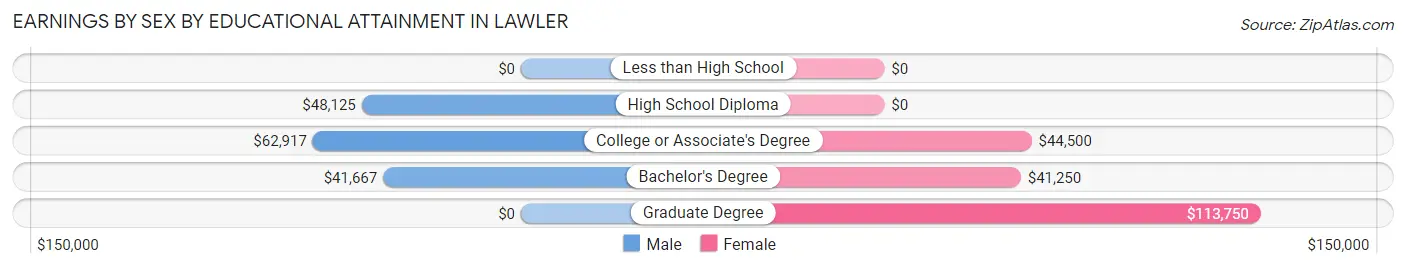
Earnings by Sex by Educational Attainment in Lawler
Average earnings in Lawler are $47,083 for men and $43,906 for women, a difference of 6.8%. Men with an educational attainment of college or associate's degree enjoy the highest average annual earnings of $62,917, while those with bachelor's degree education earn the least with $41,667. Women with an educational attainment of graduate degree earn the most with the average annual earnings of $113,750, while those with bachelor's degree education have the smallest earnings of $41,250.
| Educational Attainment | Male Income | Female Income |
| Less than High School | - | - |
| High School Diploma | $48,125 | $0 |
| College or Associate's Degree | $62,917 | $44,500 |
| Bachelor's Degree | $41,667 | $41,250 |
| Graduate Degree | - | - |
| Total | $47,083 | $43,906 |
Family Income in Lawler
Family Income Brackets in Lawler
According to the Lawler family income data, there are 27 families falling into the $75,000 to $99,999 income range, which is the most common income bracket and makes up 27.3% of all families.
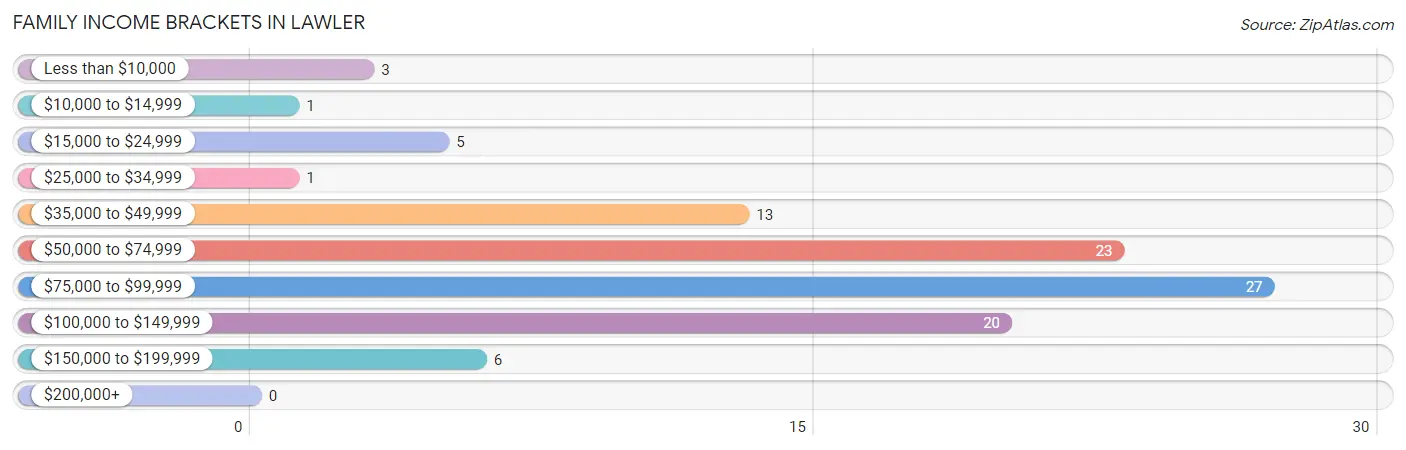
| Income Bracket | # Families | % Families |
| Less than $10,000 | 3 | 3.0% |
| $10,000 to $14,999 | 1 | 1.0% |
| $15,000 to $24,999 | 5 | 5.1% |
| $25,000 to $34,999 | 1 | 1.0% |
| $35,000 to $49,999 | 13 | 13.1% |
| $50,000 to $74,999 | 23 | 23.2% |
| $75,000 to $99,999 | 27 | 27.3% |
| $100,000 to $149,999 | 20 | 20.2% |
| $150,000 to $199,999 | 6 | 6.1% |
| $200,000+ | 0 | 0.0% |
Family Income by Famaliy Size in Lawler
4-person families (13 | 13.1%) account for the highest median family income in Lawler with $96,875 per family, while 2-person families (54 | 54.5%) have the highest median income of $38,125 per family member.
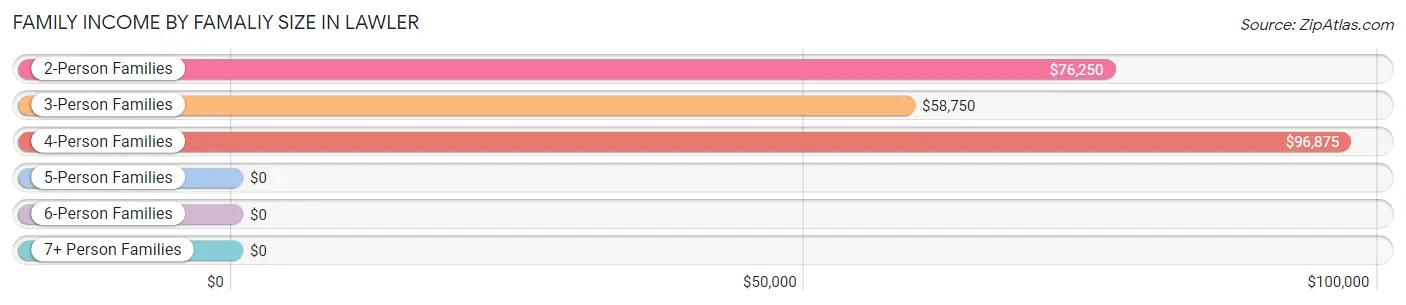
| Income Bracket | # Families | Median Income |
| 2-Person Families | 54 (54.5%) | $76,250 |
| 3-Person Families | 26 (26.3%) | $58,750 |
| 4-Person Families | 13 (13.1%) | $96,875 |
| 5-Person Families | 2 (2.0%) | $0 |
| 6-Person Families | 0 (0.0%) | $0 |
| 7+ Person Families | 4 (4.0%) | $0 |
| Total | 99 (100.0%) | $77,188 |
Family Income by Number of Earners in Lawler
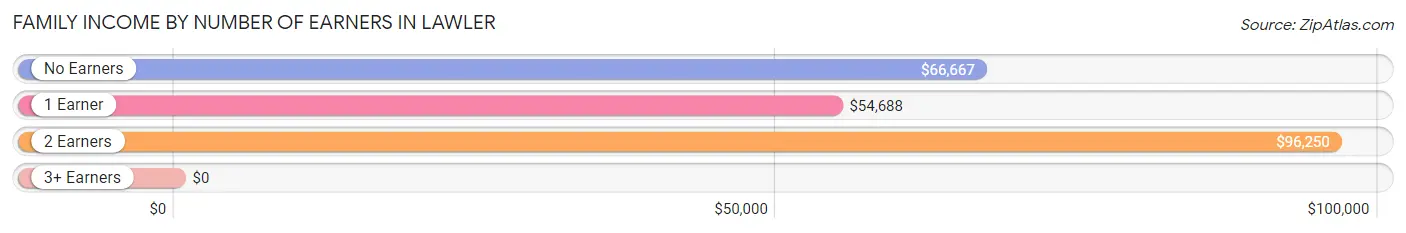
| Number of Earners | # Families | Median Income |
| No Earners | 8 (8.1%) | $66,667 |
| 1 Earner | 37 (37.4%) | $54,688 |
| 2 Earners | 50 (50.5%) | $96,250 |
| 3+ Earners | 4 (4.0%) | $0 |
| Total | 99 (100.0%) | $77,188 |
Household Income in Lawler
Household Income Brackets in Lawler
With 38 households falling in the category, the $75,000 to $99,999 income range is the most frequent in Lawler, accounting for 21.5% of all households. In contrast, only 3 households (1.7%) fall into the $150,000 to $199,999 income bracket, making it the least populous group.
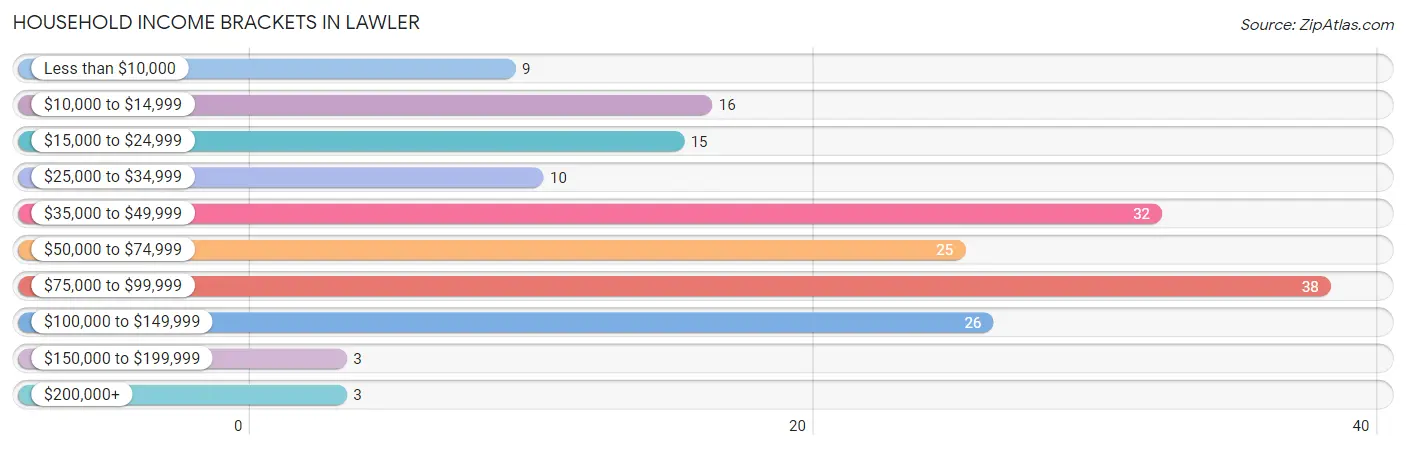
| Income Bracket | # Households | % Households |
| Less than $10,000 | 9 | 5.1% |
| $10,000 to $14,999 | 16 | 9.0% |
| $15,000 to $24,999 | 15 | 8.5% |
| $25,000 to $34,999 | 10 | 5.6% |
| $35,000 to $49,999 | 32 | 18.1% |
| $50,000 to $74,999 | 25 | 14.1% |
| $75,000 to $99,999 | 38 | 21.5% |
| $100,000 to $149,999 | 26 | 14.7% |
| $150,000 to $199,999 | 3 | 1.7% |
| $200,000+ | 3 | 1.7% |
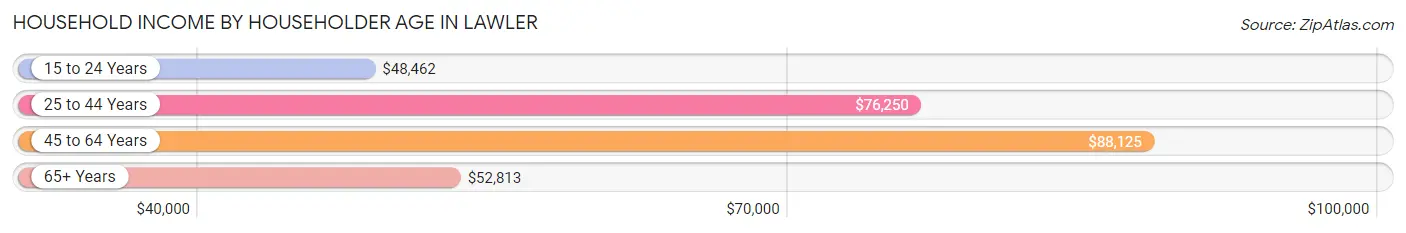
Household Income by Householder Age in Lawler
The median household income in Lawler is $54,688, with the highest median household income of $88,125 found in the 45 to 64 years age bracket for the primary householder. A total of 35 households (19.8%) fall into this category. Meanwhile, the 15 to 24 years age bracket for the primary householder has the lowest median household income of $48,462, with 20 households (11.3%) in this group.
| Income Bracket | # Households | Median Income |
| 15 to 24 Years | 20 (11.3%) | $48,462 |
| 25 to 44 Years | 55 (31.1%) | $76,250 |
| 45 to 64 Years | 35 (19.8%) | $88,125 |
| 65+ Years | 67 (37.9%) | $52,813 |
| Total | 177 (100.0%) | $54,688 |
Poverty in Lawler
Income Below Poverty by Sex and Age in Lawler
With 10.2% poverty level for males and 12.6% for females among the residents of Lawler, 16 and 17 year old males and under 5 year old females are the most vulnerable to poverty, with 2 males (100.0%) and 5 females (50.0%) in their respective age groups living below the poverty level.
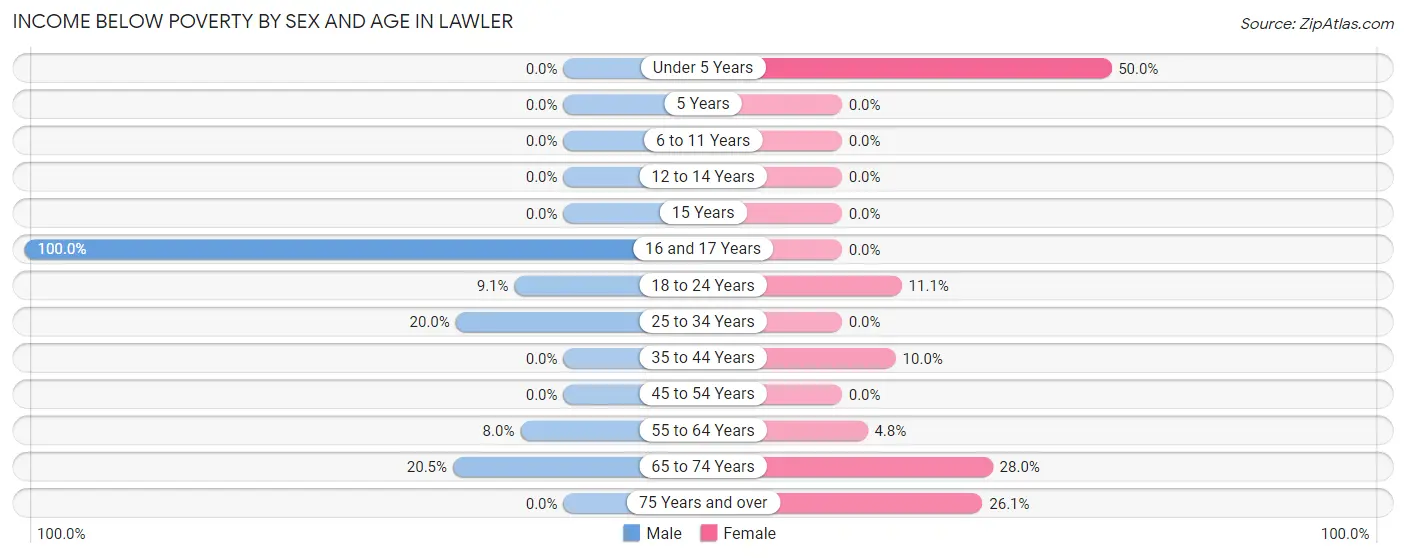
| Age Bracket | Male | Female |
| Under 5 Years | 0 (0.0%) | 5 (50.0%) |
| 5 Years | 0 (0.0%) | 0 (0.0%) |
| 6 to 11 Years | 0 (0.0%) | 0 (0.0%) |
| 12 to 14 Years | 0 (0.0%) | 0 (0.0%) |
| 15 Years | 0 (0.0%) | 0 (0.0%) |
| 16 and 17 Years | 2 (100.0%) | 0 (0.0%) |
| 18 to 24 Years | 2 (9.1%) | 3 (11.1%) |
| 25 to 34 Years | 5 (20.0%) | 0 (0.0%) |
| 35 to 44 Years | 0 (0.0%) | 2 (10.0%) |
| 45 to 54 Years | 0 (0.0%) | 0 (0.0%) |
| 55 to 64 Years | 2 (8.0%) | 1 (4.8%) |
| 65 to 74 Years | 8 (20.5%) | 7 (28.0%) |
| 75 Years and over | 0 (0.0%) | 6 (26.1%) |
| Total | 19 (10.2%) | 24 (12.6%) |
Income Above Poverty by Sex and Age in Lawler
According to the poverty statistics in Lawler, males aged under 5 years and females aged 5 years are the age groups that are most secure financially, with 100.0% of males and 100.0% of females in these age groups living above the poverty line.
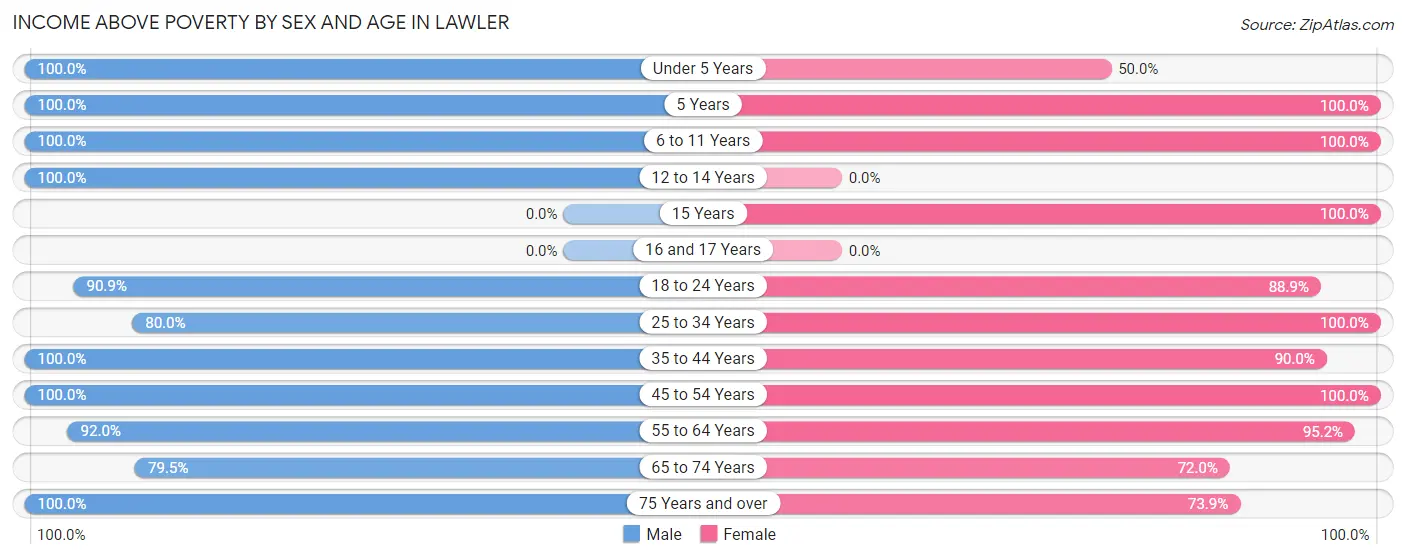
| Age Bracket | Male | Female |
| Under 5 Years | 7 (100.0%) | 5 (50.0%) |
| 5 Years | 4 (100.0%) | 3 (100.0%) |
| 6 to 11 Years | 7 (100.0%) | 30 (100.0%) |
| 12 to 14 Years | 9 (100.0%) | 0 (0.0%) |
| 15 Years | 0 (0.0%) | 1 (100.0%) |
| 16 and 17 Years | 0 (0.0%) | 0 (0.0%) |
| 18 to 24 Years | 20 (90.9%) | 24 (88.9%) |
| 25 to 34 Years | 20 (80.0%) | 20 (100.0%) |
| 35 to 44 Years | 20 (100.0%) | 18 (90.0%) |
| 45 to 54 Years | 14 (100.0%) | 11 (100.0%) |
| 55 to 64 Years | 23 (92.0%) | 20 (95.2%) |
| 65 to 74 Years | 31 (79.5%) | 18 (72.0%) |
| 75 Years and over | 12 (100.0%) | 17 (73.9%) |
| Total | 167 (89.8%) | 167 (87.4%) |
Income Below Poverty Among Married-Couple Families in Lawler
The poverty statistics for married-couple families in Lawler show that 7.9% or 6 of the total 76 families live below the poverty line. Families with 1 or 2 children have the highest poverty rate of 11.1%, comprising of 3 families. On the other hand, families with 5 or more children have the lowest poverty rate of 0.0%, which includes 0 families.
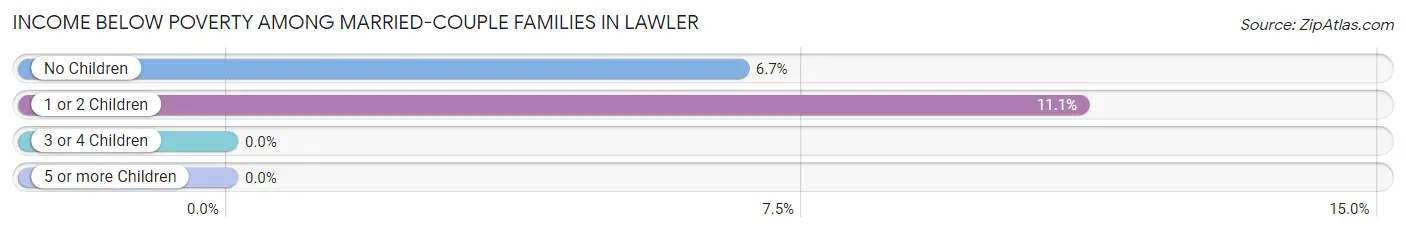
| Children | Above Poverty | Below Poverty |
| No Children | 42 (93.3%) | 3 (6.7%) |
| 1 or 2 Children | 24 (88.9%) | 3 (11.1%) |
| 3 or 4 Children | 0 (0.0%) | 0 (0.0%) |
| 5 or more Children | 4 (100.0%) | 0 (0.0%) |
| Total | 70 (92.1%) | 6 (7.9%) |
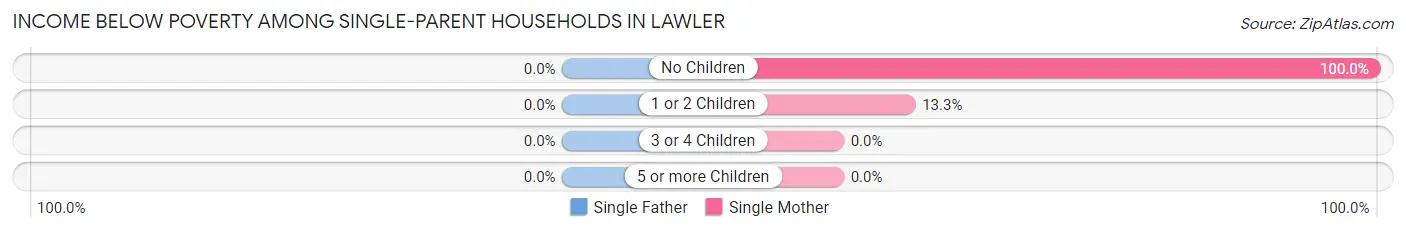
Income Below Poverty Among Single-Parent Households in Lawler
| Children | Single Father | Single Mother |
| No Children | 0 (0.0%) | 1 (100.0%) |
| 1 or 2 Children | 0 (0.0%) | 2 (13.3%) |
| 3 or 4 Children | 0 (0.0%) | 0 (0.0%) |
| 5 or more Children | 0 (0.0%) | 0 (0.0%) |
| Total | 0 (0.0%) | 3 (18.8%) |
Income Below Poverty Among Married-Couple vs Single-Parent Households in Lawler
The poverty data for Lawler shows that 6 of the married-couple family households (7.9%) and 3 of the single-parent households (13.0%) are living below the poverty level. Within the married-couple family households, those with 1 or 2 children have the highest poverty rate, with 3 households (11.1%) falling below the poverty line. Among the single-parent households, those with no children have the highest poverty rate, with 1 household (25.0%) living below poverty.
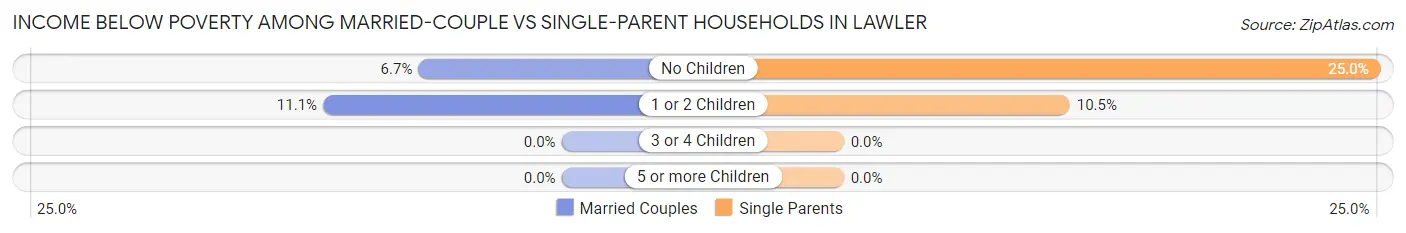
| Children | Married-Couple Families | Single-Parent Households |
| No Children | 3 (6.7%) | 1 (25.0%) |
| 1 or 2 Children | 3 (11.1%) | 2 (10.5%) |
| 3 or 4 Children | 0 (0.0%) | 0 (0.0%) |
| 5 or more Children | 0 (0.0%) | 0 (0.0%) |
| Total | 6 (7.9%) | 3 (13.0%) |
Race in Lawler
The most populous races in Lawler are White / Caucasian (359 | 95.2%), Hispanic or Latino (22 | 5.8%), and Two or more Races (16 | 4.2%).
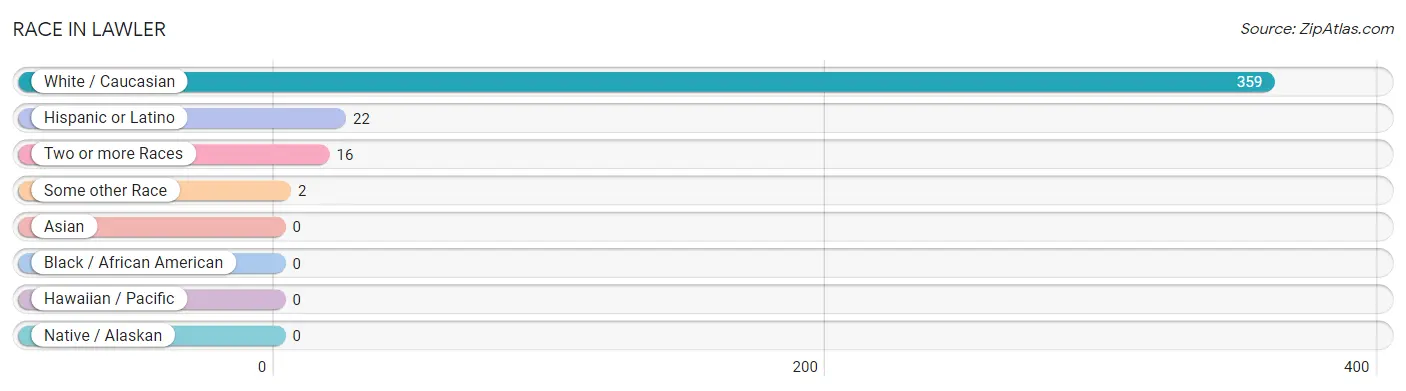
| Race | # Population | % Population |
| Asian | 0 | 0.0% |
| Black / African American | 0 | 0.0% |
| Hawaiian / Pacific | 0 | 0.0% |
| Hispanic or Latino | 22 | 5.8% |
| Native / Alaskan | 0 | 0.0% |
| White / Caucasian | 359 | 95.2% |
| Two or more Races | 16 | 4.2% |
| Some other Race | 2 | 0.5% |
| Total | 377 | 100.0% |
Ancestry in Lawler
The most populous ancestries reported in Lawler are German (227 | 60.2%), Irish (89 | 23.6%), English (27 | 7.2%), Norwegian (25 | 6.6%), and Mexican (20 | 5.3%), together accounting for 102.9% of all Lawler residents.
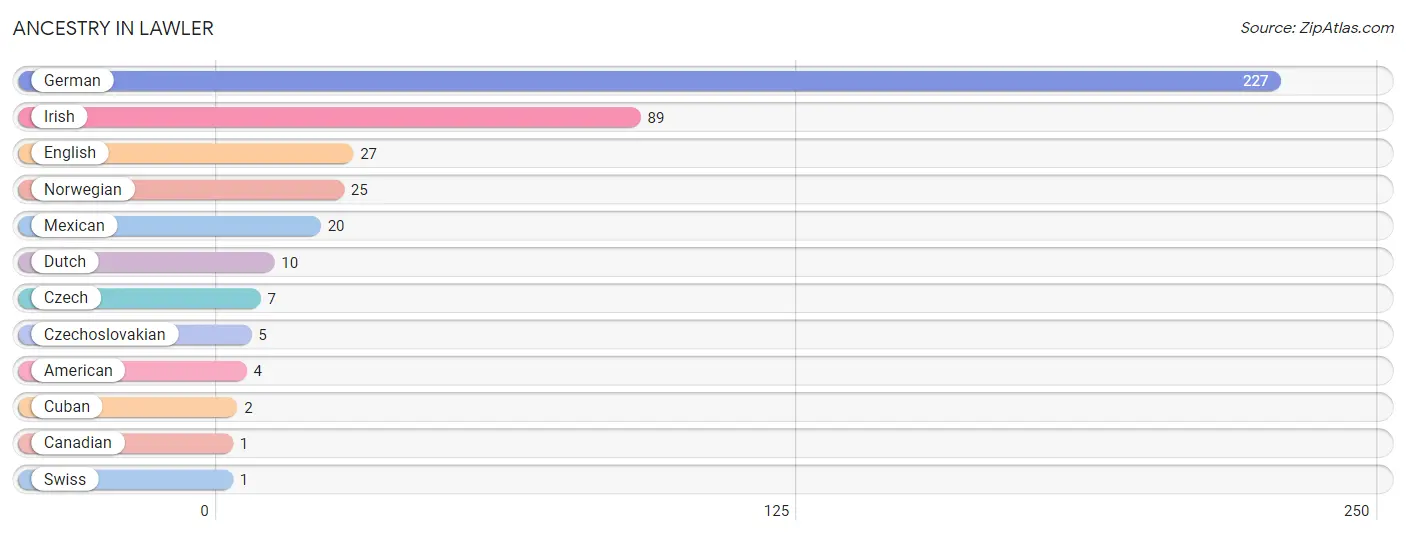
| Ancestry | # Population | % Population |
| American | 4 | 1.1% |
| Canadian | 1 | 0.3% |
| Cuban | 2 | 0.5% |
| Czech | 7 | 1.9% |
| Czechoslovakian | 5 | 1.3% |
| Dutch | 10 | 2.6% |
| English | 27 | 7.2% |
| German | 227 | 60.2% |
| Irish | 89 | 23.6% |
| Mexican | 20 | 5.3% |
| Norwegian | 25 | 6.6% |
| Swiss | 1 | 0.3% | View All 12 Rows |
Immigrants in Lawler
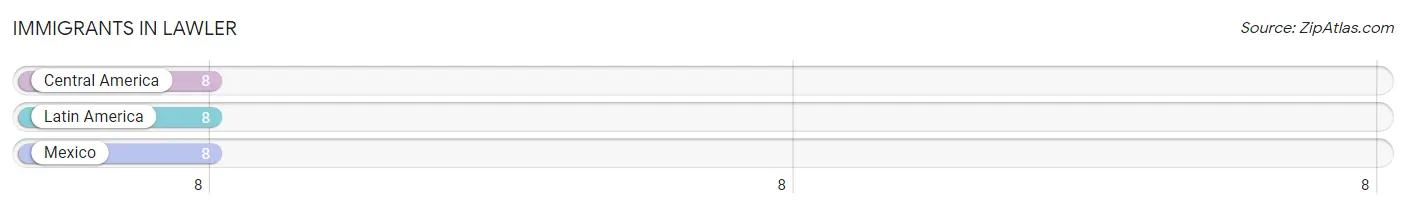
The most numerous immigrant groups reported in Lawler came from Central America (8 | 2.1%), Latin America (8 | 2.1%), and Mexico (8 | 2.1%), together accounting for 6.4% of all Lawler residents.
| Immigration Origin | # Population | % Population |
| Central America | 8 | 2.1% |
| Latin America | 8 | 2.1% |
| Mexico | 8 | 2.1% | View All 3 Rows |
Sex and Age in Lawler
Sex and Age in Lawler
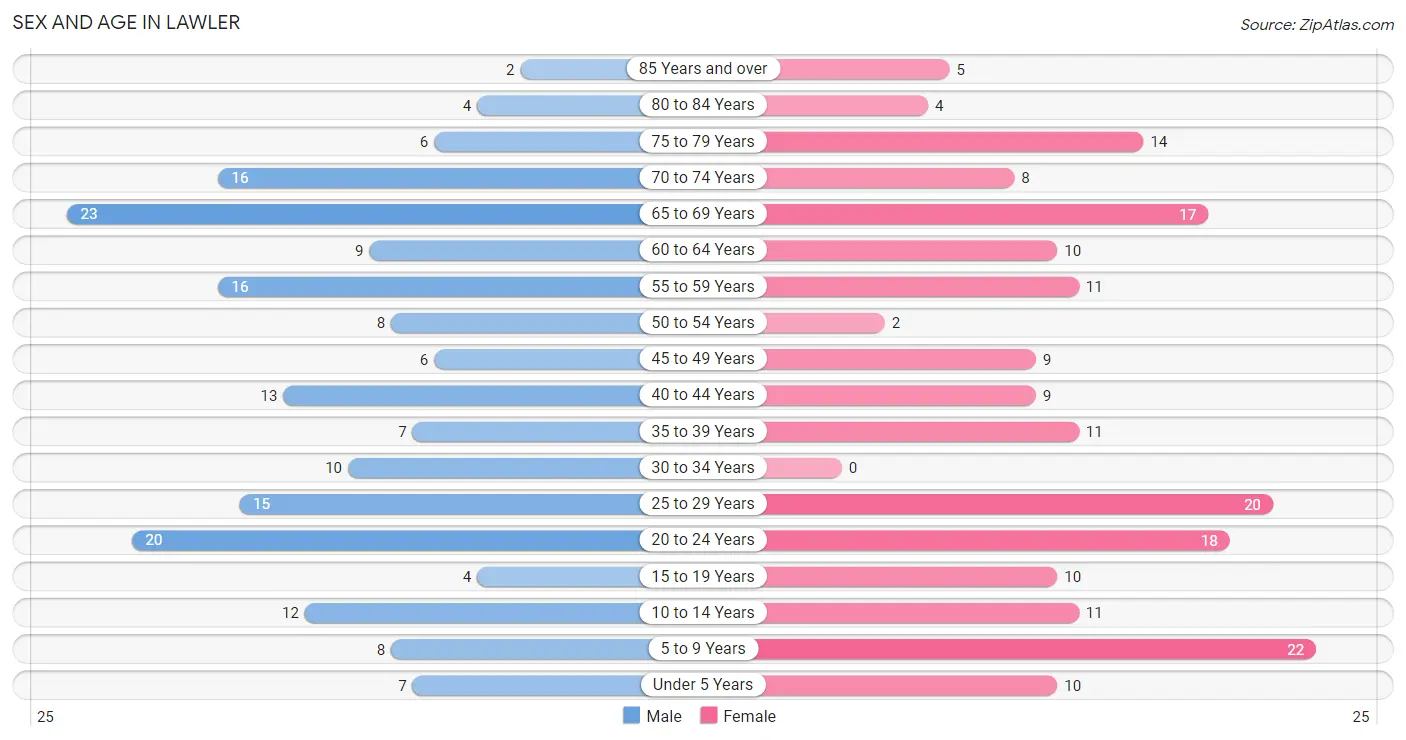
The most populous age groups in Lawler are 65 to 69 Years (23 | 12.4%) for men and 5 to 9 Years (22 | 11.5%) for women.
| Age Bracket | Male | Female |
| Under 5 Years | 7 (3.8%) | 10 (5.2%) |
| 5 to 9 Years | 8 (4.3%) | 22 (11.5%) |
| 10 to 14 Years | 12 (6.5%) | 11 (5.8%) |
| 15 to 19 Years | 4 (2.1%) | 10 (5.2%) |
| 20 to 24 Years | 20 (10.7%) | 18 (9.4%) |
| 25 to 29 Years | 15 (8.1%) | 20 (10.5%) |
| 30 to 34 Years | 10 (5.4%) | 0 (0.0%) |
| 35 to 39 Years | 7 (3.8%) | 11 (5.8%) |
| 40 to 44 Years | 13 (7.0%) | 9 (4.7%) |
| 45 to 49 Years | 6 (3.2%) | 9 (4.7%) |
| 50 to 54 Years | 8 (4.3%) | 2 (1.1%) |
| 55 to 59 Years | 16 (8.6%) | 11 (5.8%) |
| 60 to 64 Years | 9 (4.8%) | 10 (5.2%) |
| 65 to 69 Years | 23 (12.4%) | 17 (8.9%) |
| 70 to 74 Years | 16 (8.6%) | 8 (4.2%) |
| 75 to 79 Years | 6 (3.2%) | 14 (7.3%) |
| 80 to 84 Years | 4 (2.1%) | 4 (2.1%) |
| 85 Years and over | 2 (1.1%) | 5 (2.6%) |
| Total | 186 (100.0%) | 191 (100.0%) |
Families and Households in Lawler
Median Family Size in Lawler
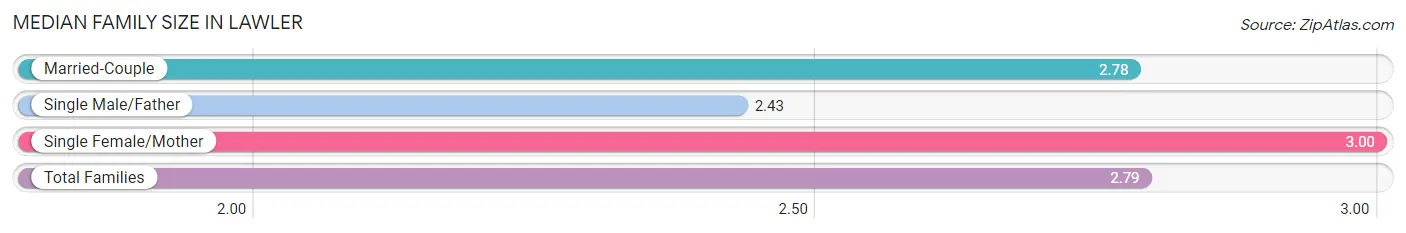
The median family size in Lawler is 2.79 persons per family, with single female/mother families (16 | 16.2%) accounting for the largest median family size of 3 persons per family. On the other hand, single male/father families (7 | 7.1%) represent the smallest median family size with 2.43 persons per family.
| Family Type | # Families | Family Size |
| Married-Couple | 76 (76.8%) | 2.78 |
| Single Male/Father | 7 (7.1%) | 2.43 |
| Single Female/Mother | 16 (16.2%) | 3.00 |
| Total Families | 99 (100.0%) | 2.79 |
Median Household Size in Lawler
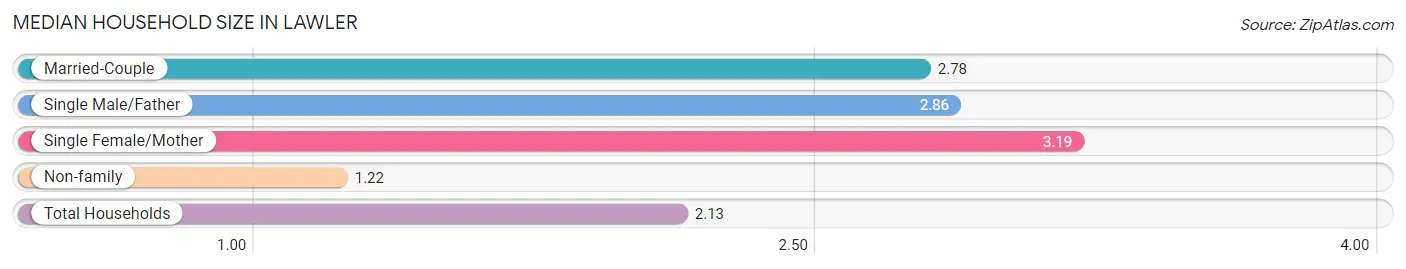
The median household size in Lawler is 2.13 persons per household, with single female/mother households (16 | 9.0%) accounting for the largest median household size of 3.19 persons per household. non-family households (78 | 44.1%) represent the smallest median household size with 1.22 persons per household.
| Household Type | # Households | Household Size |
| Married-Couple | 76 (42.9%) | 2.78 |
| Single Male/Father | 7 (4.0%) | 2.86 |
| Single Female/Mother | 16 (9.0%) | 3.19 |
| Non-family | 78 (44.1%) | 1.22 |
| Total Households | 177 (100.0%) | 2.13 |
Household Size by Marriage Status in Lawler
Out of a total of 177 households in Lawler, 99 (55.9%) are family households, while 78 (44.1%) are nonfamily households. The most numerous type of family households are 2-person households, comprising 49, and the most common type of nonfamily households are 1-person households, comprising 59.
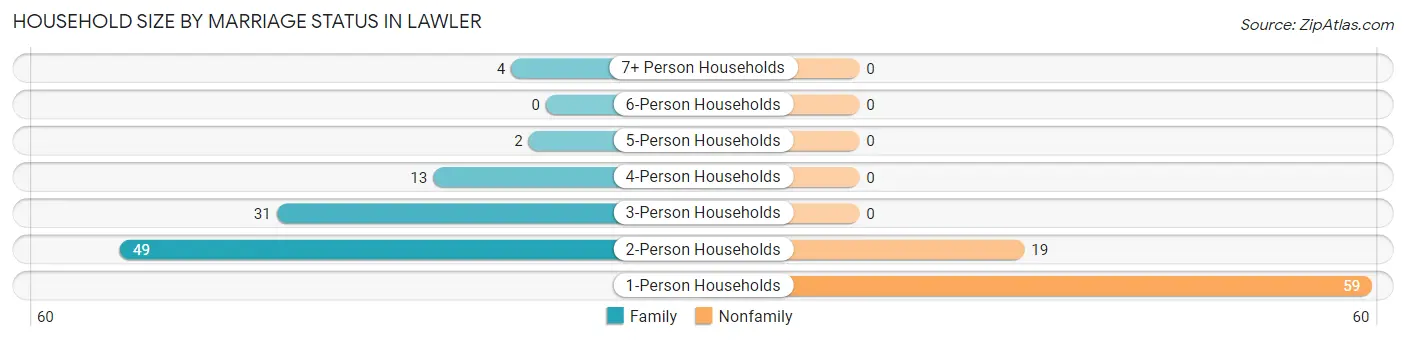
| Household Size | Family Households | Nonfamily Households |
| 1-Person Households | - | 59 (33.3%) |
| 2-Person Households | 49 (27.7%) | 19 (10.7%) |
| 3-Person Households | 31 (17.5%) | 0 (0.0%) |
| 4-Person Households | 13 (7.3%) | 0 (0.0%) |
| 5-Person Households | 2 (1.1%) | 0 (0.0%) |
| 6-Person Households | 0 (0.0%) | 0 (0.0%) |
| 7+ Person Households | 4 (2.3%) | 0 (0.0%) |
| Total | 99 (55.9%) | 78 (44.1%) |
Female Fertility in Lawler
Fertility by Age in Lawler
Average fertility rate in Lawler is 91.0 births per 1,000 women. Women in the age bracket of 20 to 34 years have the highest fertility rate with 184.0 births per 1,000 women. Women in the age bracket of 20 to 34 years acount for 100.0% of all women with births.
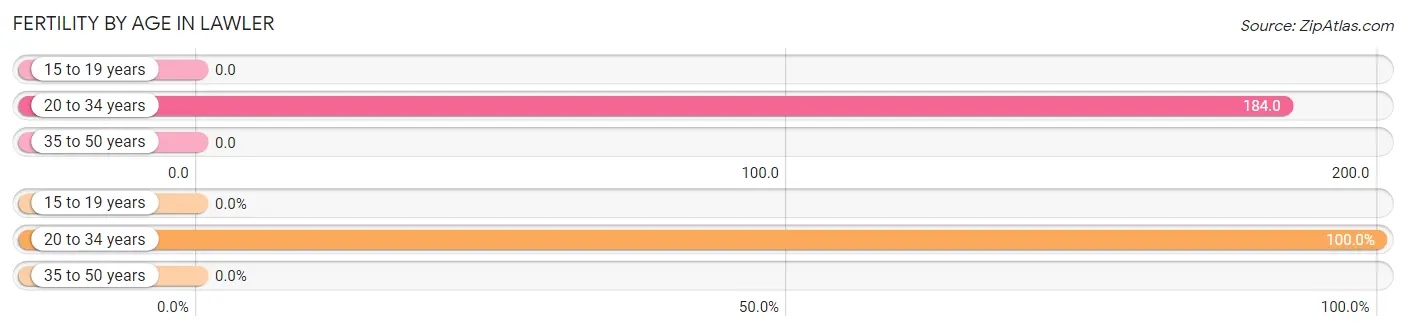
| Age Bracket | Women with Births | Births / 1,000 Women |
| 15 to 19 years | 0 (0.0%) | 0.0 |
| 20 to 34 years | 7 (100.0%) | 184.0 |
| 35 to 50 years | 0 (0.0%) | 0.0 |
| Total | 7 (100.0%) | 91.0 |
Fertility by Age by Marriage Status in Lawler
71.4% of women with births (7) in Lawler are married. The highest percentage of unmarried women with births falls into 20 to 34 years age bracket with 28.6% of them unmarried at the time of birth, while the lowest percentage of unmarried women with births belong to 20 to 34 years age bracket with 28.6% of them unmarried.
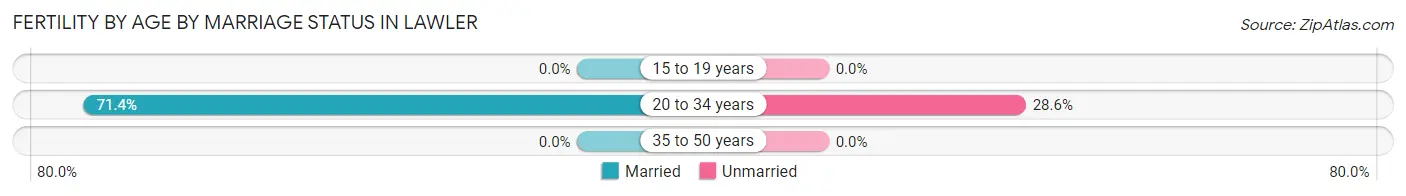
| Age Bracket | Married | Unmarried |
| 15 to 19 years | 0 (0.0%) | 0 (0.0%) |
| 20 to 34 years | 5 (71.4%) | 2 (28.6%) |
| 35 to 50 years | 0 (0.0%) | 0 (0.0%) |
| Total | 5 (71.4%) | 2 (28.6%) |
Fertility by Education in Lawler
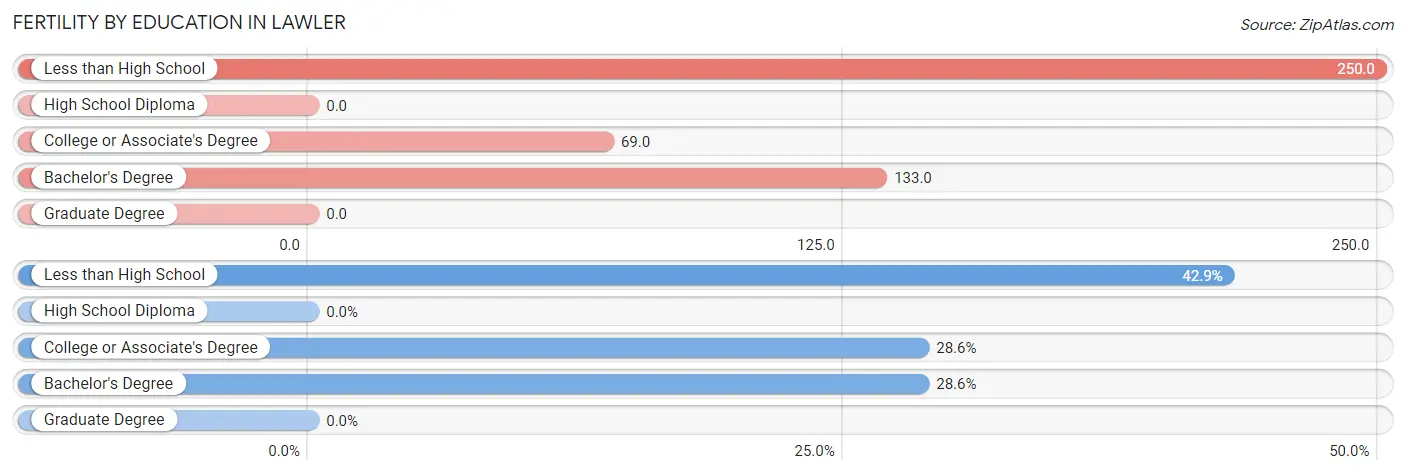
| Educational Attainment | Women with Births | Births / 1,000 Women |
| Less than High School | 3 (42.9%) | 250.0 |
| High School Diploma | 0 (0.0%) | 0.0 |
| College or Associate's Degree | 2 (28.6%) | 69.0 |
| Bachelor's Degree | 2 (28.6%) | 133.0 |
| Graduate Degree | 0 (0.0%) | 0.0 |
| Total | 7 (100.0%) | 91.0 |
Fertility by Education by Marriage Status in Lawler
28.6% of women with births in Lawler are unmarried. Women with the educational attainment of less than high school are most likely to be married with 100.0% of them married at childbirth, while women with the educational attainment of bachelor's degree are least likely to be married with 100.0% of them unmarried at childbirth.
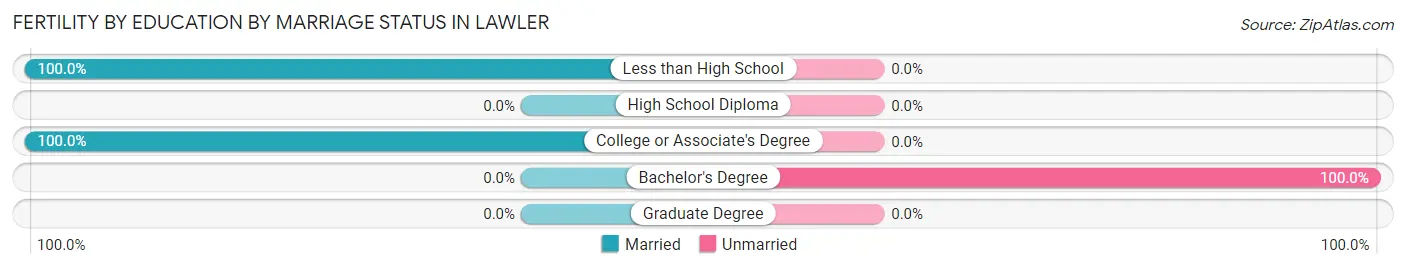
| Educational Attainment | Married | Unmarried |
| Less than High School | 3 (100.0%) | 0 (0.0%) |
| High School Diploma | 0 (0.0%) | 0 (0.0%) |
| College or Associate's Degree | 2 (100.0%) | 0 (0.0%) |
| Bachelor's Degree | 0 (0.0%) | 2 (100.0%) |
| Graduate Degree | 0 (0.0%) | 0 (0.0%) |
| Total | 5 (71.4%) | 2 (28.6%) |
Employment Characteristics in Lawler
Employment by Class of Employer in Lawler
Among the 201 employed individuals in Lawler, private company employees (146 | 72.6%), local government employees (15 | 7.5%), and not-for-profit organizations (13 | 6.5%) make up the most common classes of employment.
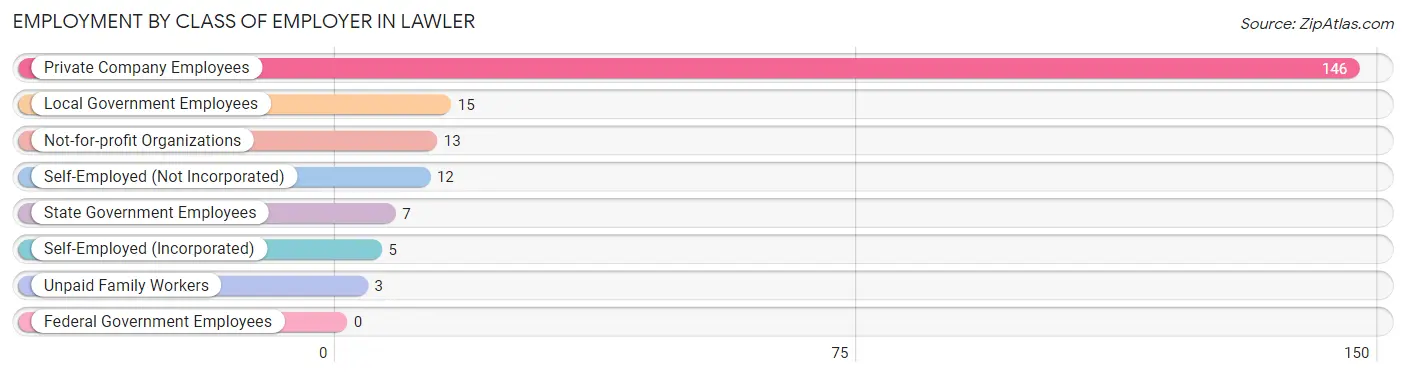
| Employer Class | # Employees | % Employees |
| Private Company Employees | 146 | 72.6% |
| Self-Employed (Incorporated) | 5 | 2.5% |
| Self-Employed (Not Incorporated) | 12 | 6.0% |
| Not-for-profit Organizations | 13 | 6.5% |
| Local Government Employees | 15 | 7.5% |
| State Government Employees | 7 | 3.5% |
| Federal Government Employees | 0 | 0.0% |
| Unpaid Family Workers | 3 | 1.5% |
| Total | 201 | 100.0% |
Employment Status by Age in Lawler
According to the labor force statistics for Lawler, out of the total population over 16 years of age (306), 69.3% or 212 individuals are in the labor force, with 5.2% or 11 of them unemployed. The age group with the highest labor force participation rate is 35 to 44 years, with 100.0% or 40 individuals in the labor force. Within the labor force, the 25 to 29 years age range has the highest percentage of unemployed individuals, with 18.8% or 6 of them being unemployed.
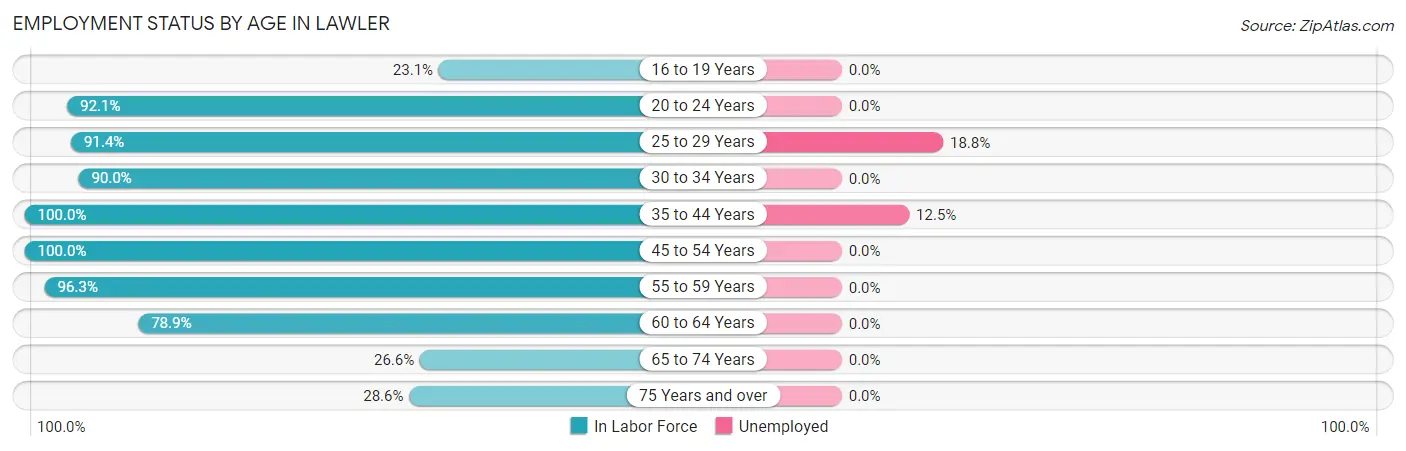
| Age Bracket | In Labor Force | Unemployed |
| 16 to 19 Years | 3 (23.1%) | 0 (0.0%) |
| 20 to 24 Years | 35 (92.1%) | 0 (0.0%) |
| 25 to 29 Years | 32 (91.4%) | 6 (18.8%) |
| 30 to 34 Years | 9 (90.0%) | 0 (0.0%) |
| 35 to 44 Years | 40 (100.0%) | 5 (12.5%) |
| 45 to 54 Years | 25 (100.0%) | 0 (0.0%) |
| 55 to 59 Years | 26 (96.3%) | 0 (0.0%) |
| 60 to 64 Years | 15 (78.9%) | 0 (0.0%) |
| 65 to 74 Years | 17 (26.6%) | 0 (0.0%) |
| 75 Years and over | 10 (28.6%) | 0 (0.0%) |
| Total | 212 (69.3%) | 11 (5.2%) |
Employment Status by Educational Attainment in Lawler
According to labor force statistics for Lawler, 94.2% of individuals (147) out of the total population between 25 and 64 years of age (156) are in the labor force, with 7.5% or 11 of them being unemployed. The group with the highest labor force participation rate are those with the educational attainment of bachelor's degree or higher, with 100.0% or 30 individuals in the labor force. Within the labor force, individuals with bachelor's degree or higher education have the highest percentage of unemployment, with 13.3% or 4 of them being unemployed.
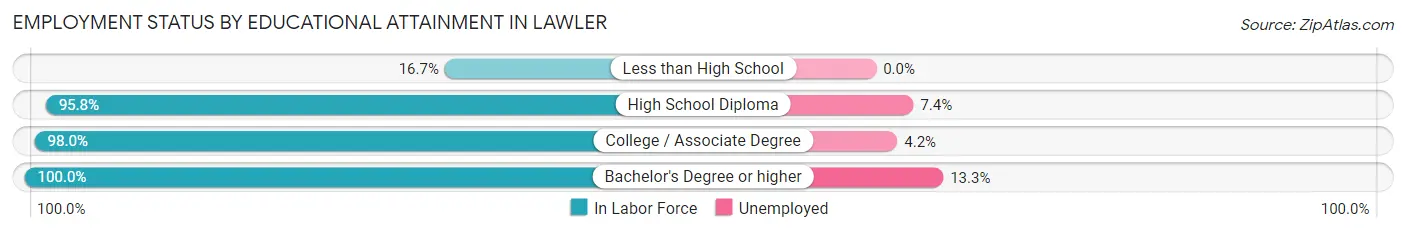
| Educational Attainment | In Labor Force | Unemployed |
| Less than High School | 1 (16.7%) | 0 (0.0%) |
| High School Diploma | 68 (95.8%) | 5 (7.4%) |
| College / Associate Degree | 48 (98.0%) | 2 (4.2%) |
| Bachelor's Degree or higher | 30 (100.0%) | 4 (13.3%) |
| Total | 147 (94.2%) | 12 (7.5%) |
Employment Occupations by Sex in Lawler
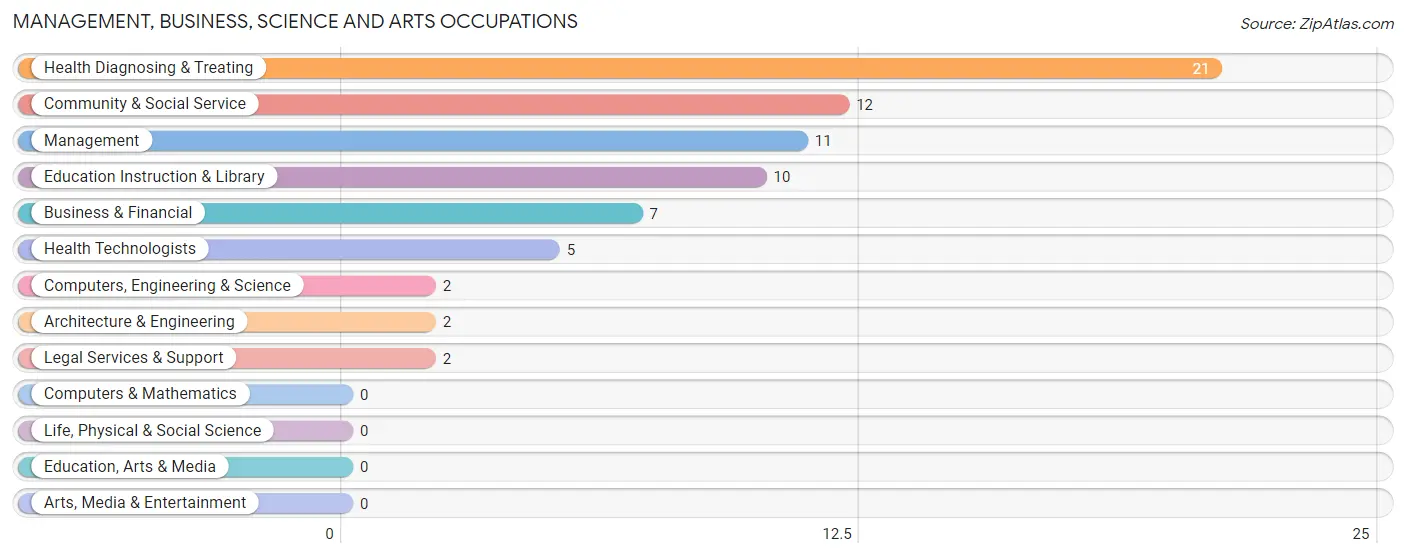
Management, Business, Science and Arts Occupations
The most common Management, Business, Science and Arts occupations in Lawler are Health Diagnosing & Treating (21 | 10.4%), Community & Social Service (12 | 6.0%), Management (11 | 5.5%), Education Instruction & Library (10 | 5.0%), and Business & Financial (7 | 3.5%).
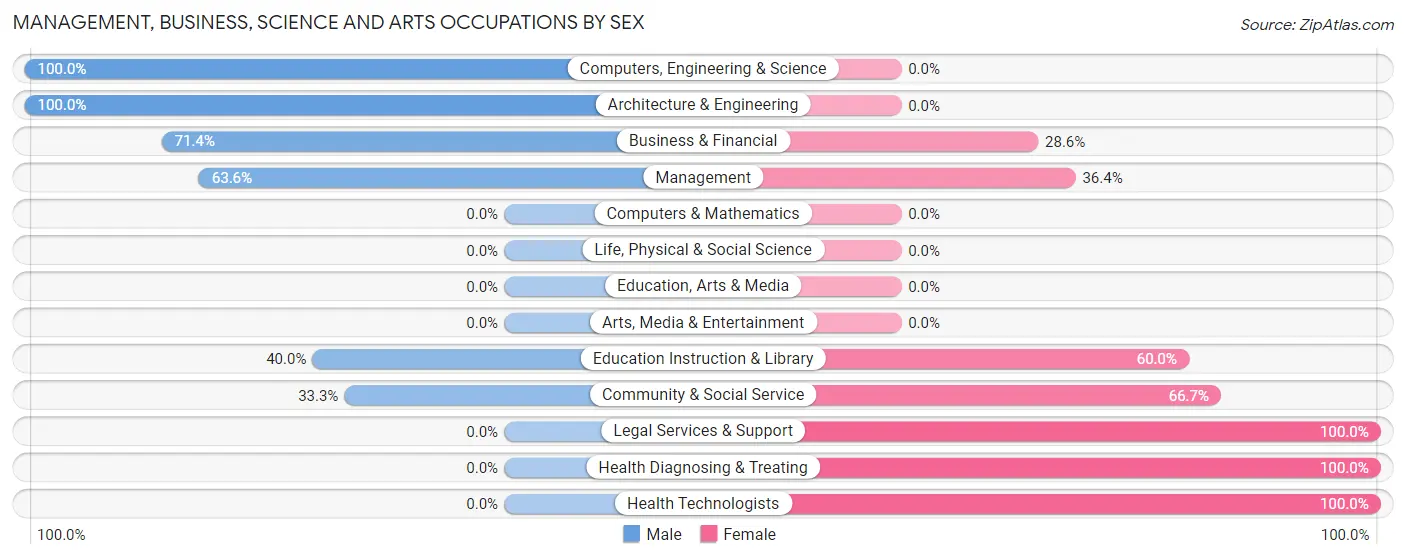
Management, Business, Science and Arts Occupations by Sex
Within the Management, Business, Science and Arts occupations in Lawler, the most male-oriented occupations are Computers, Engineering & Science (100.0%), Architecture & Engineering (100.0%), and Business & Financial (71.4%), while the most female-oriented occupations are Legal Services & Support (100.0%), Health Diagnosing & Treating (100.0%), and Health Technologists (100.0%).
| Occupation | Male | Female |
| Management | 7 (63.6%) | 4 (36.4%) |
| Business & Financial | 5 (71.4%) | 2 (28.6%) |
| Computers, Engineering & Science | 2 (100.0%) | 0 (0.0%) |
| Computers & Mathematics | 0 (0.0%) | 0 (0.0%) |
| Architecture & Engineering | 2 (100.0%) | 0 (0.0%) |
| Life, Physical & Social Science | 0 (0.0%) | 0 (0.0%) |
| Community & Social Service | 4 (33.3%) | 8 (66.7%) |
| Education, Arts & Media | 0 (0.0%) | 0 (0.0%) |
| Legal Services & Support | 0 (0.0%) | 2 (100.0%) |
| Education Instruction & Library | 4 (40.0%) | 6 (60.0%) |
| Arts, Media & Entertainment | 0 (0.0%) | 0 (0.0%) |
| Health Diagnosing & Treating | 0 (0.0%) | 21 (100.0%) |
| Health Technologists | 0 (0.0%) | 5 (100.0%) |
| Total (Category) | 18 (34.0%) | 35 (66.0%) |
| Total (Overall) | 109 (54.2%) | 92 (45.8%) |
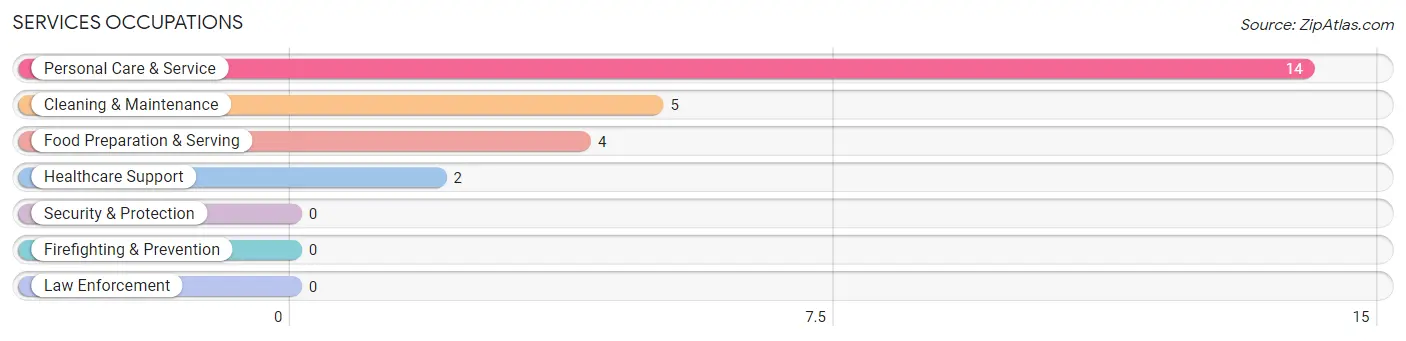
Services Occupations
The most common Services occupations in Lawler are Personal Care & Service (14 | 7.0%), Cleaning & Maintenance (5 | 2.5%), Food Preparation & Serving (4 | 2.0%), and Healthcare Support (2 | 1.0%).
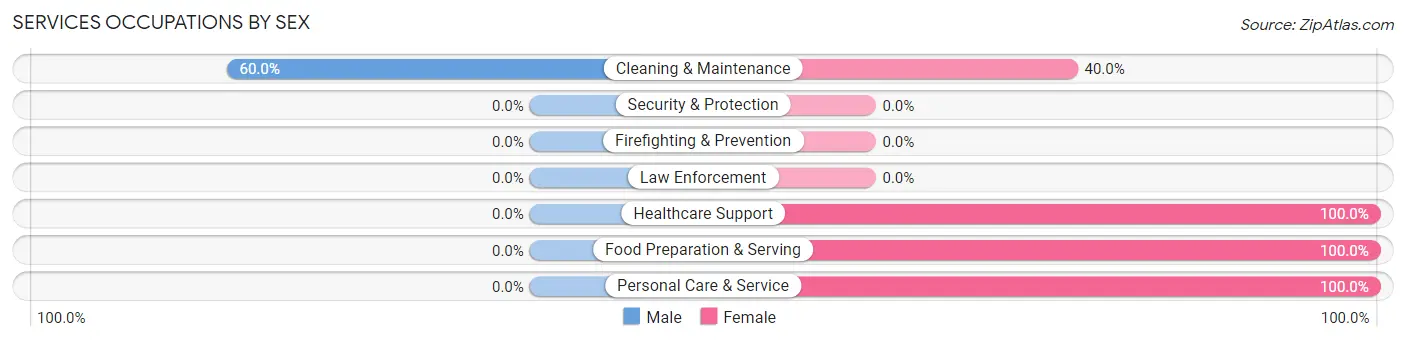
Services Occupations by Sex
| Occupation | Male | Female |
| Healthcare Support | 0 (0.0%) | 2 (100.0%) |
| Security & Protection | 0 (0.0%) | 0 (0.0%) |
| Firefighting & Prevention | 0 (0.0%) | 0 (0.0%) |
| Law Enforcement | 0 (0.0%) | 0 (0.0%) |
| Food Preparation & Serving | 0 (0.0%) | 4 (100.0%) |
| Cleaning & Maintenance | 3 (60.0%) | 2 (40.0%) |
| Personal Care & Service | 0 (0.0%) | 14 (100.0%) |
| Total (Category) | 3 (12.0%) | 22 (88.0%) |
| Total (Overall) | 109 (54.2%) | 92 (45.8%) |
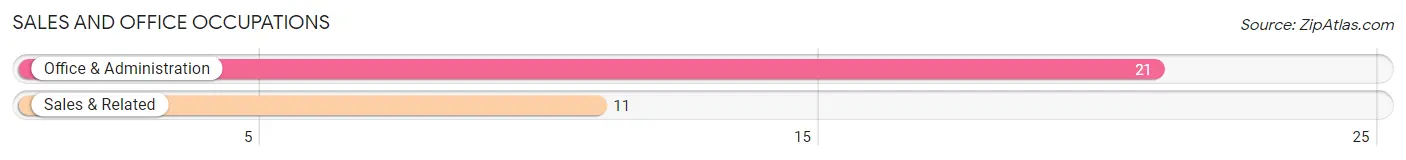
Sales and Office Occupations
The most common Sales and Office occupations in Lawler are Office & Administration (21 | 10.4%), and Sales & Related (11 | 5.5%).
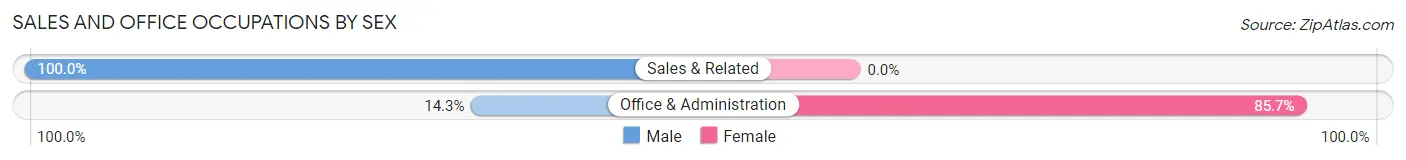
Sales and Office Occupations by Sex
| Occupation | Male | Female |
| Sales & Related | 11 (100.0%) | 0 (0.0%) |
| Office & Administration | 3 (14.3%) | 18 (85.7%) |
| Total (Category) | 14 (43.8%) | 18 (56.2%) |
| Total (Overall) | 109 (54.2%) | 92 (45.8%) |
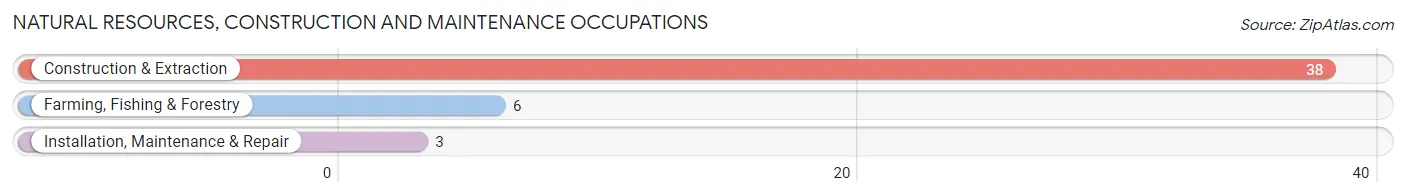
Natural Resources, Construction and Maintenance Occupations
The most common Natural Resources, Construction and Maintenance occupations in Lawler are Construction & Extraction (38 | 18.9%), Farming, Fishing & Forestry (6 | 3.0%), and Installation, Maintenance & Repair (3 | 1.5%).
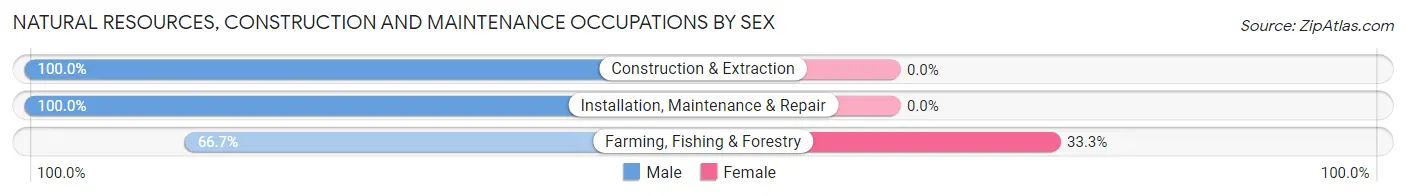
Natural Resources, Construction and Maintenance Occupations by Sex
| Occupation | Male | Female |
| Farming, Fishing & Forestry | 4 (66.7%) | 2 (33.3%) |
| Construction & Extraction | 38 (100.0%) | 0 (0.0%) |
| Installation, Maintenance & Repair | 3 (100.0%) | 0 (0.0%) |
| Total (Category) | 45 (95.7%) | 2 (4.3%) |
| Total (Overall) | 109 (54.2%) | 92 (45.8%) |
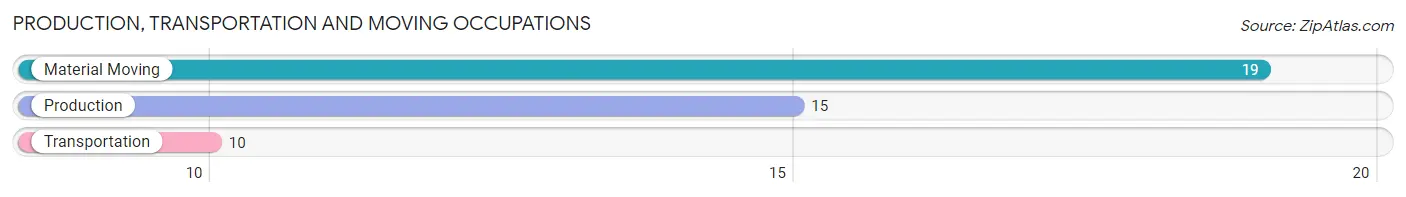
Production, Transportation and Moving Occupations
The most common Production, Transportation and Moving occupations in Lawler are Material Moving (19 | 9.5%), Production (15 | 7.5%), and Transportation (10 | 5.0%).
Production, Transportation and Moving Occupations by Sex
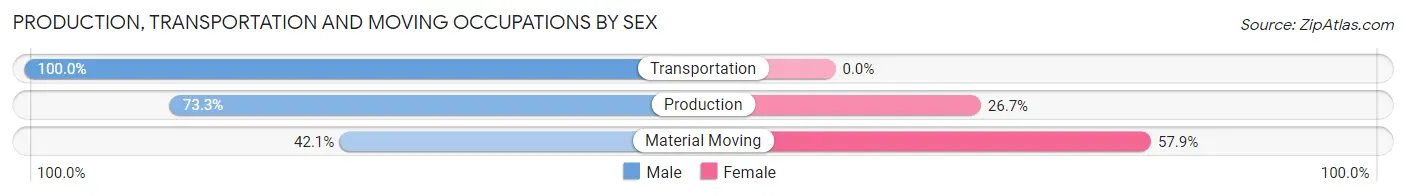
| Occupation | Male | Female |
| Production | 11 (73.3%) | 4 (26.7%) |
| Transportation | 10 (100.0%) | 0 (0.0%) |
| Material Moving | 8 (42.1%) | 11 (57.9%) |
| Total (Category) | 29 (65.9%) | 15 (34.1%) |
| Total (Overall) | 109 (54.2%) | 92 (45.8%) |
Employment Industries by Sex in Lawler
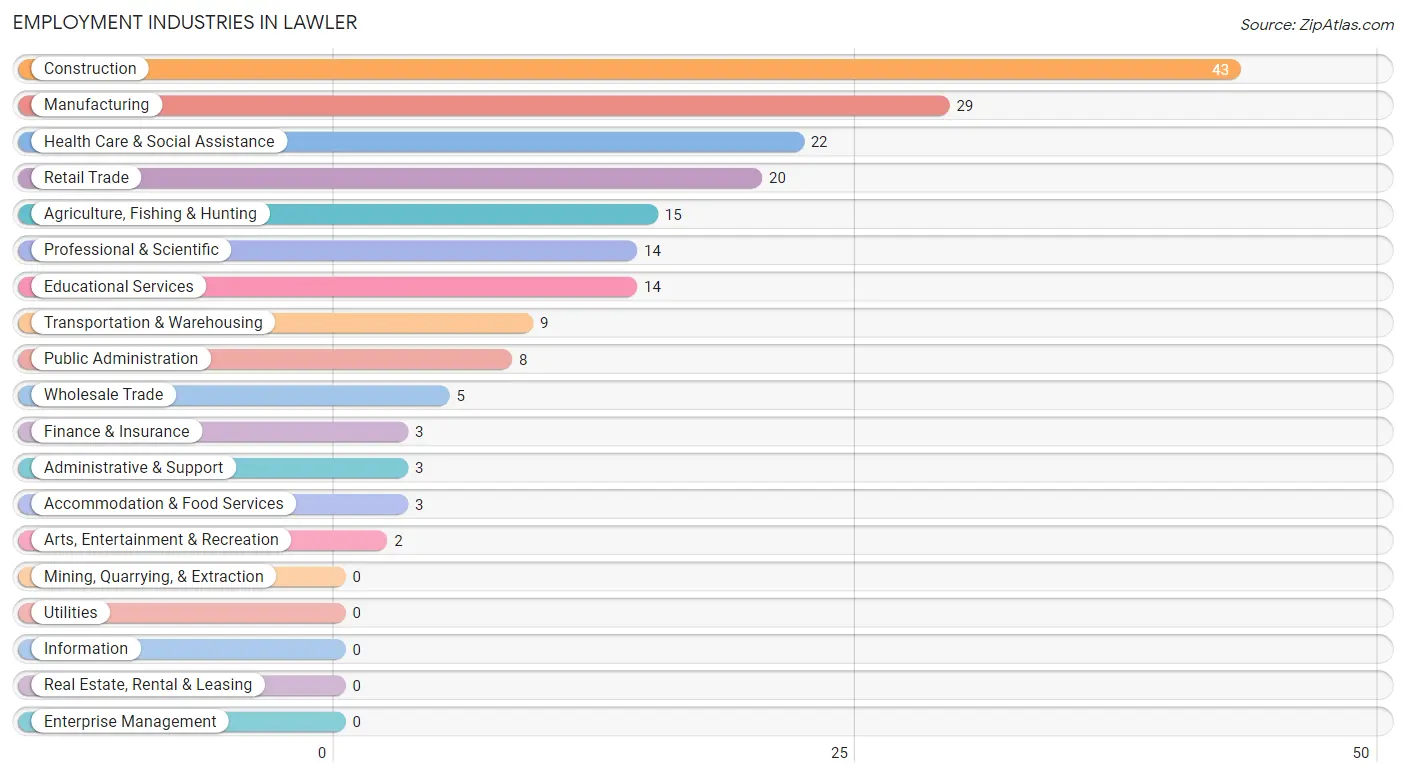
Employment Industries in Lawler
The major employment industries in Lawler include Construction (43 | 21.4%), Manufacturing (29 | 14.4%), Health Care & Social Assistance (22 | 11.0%), Retail Trade (20 | 10.0%), and Agriculture, Fishing & Hunting (15 | 7.5%).
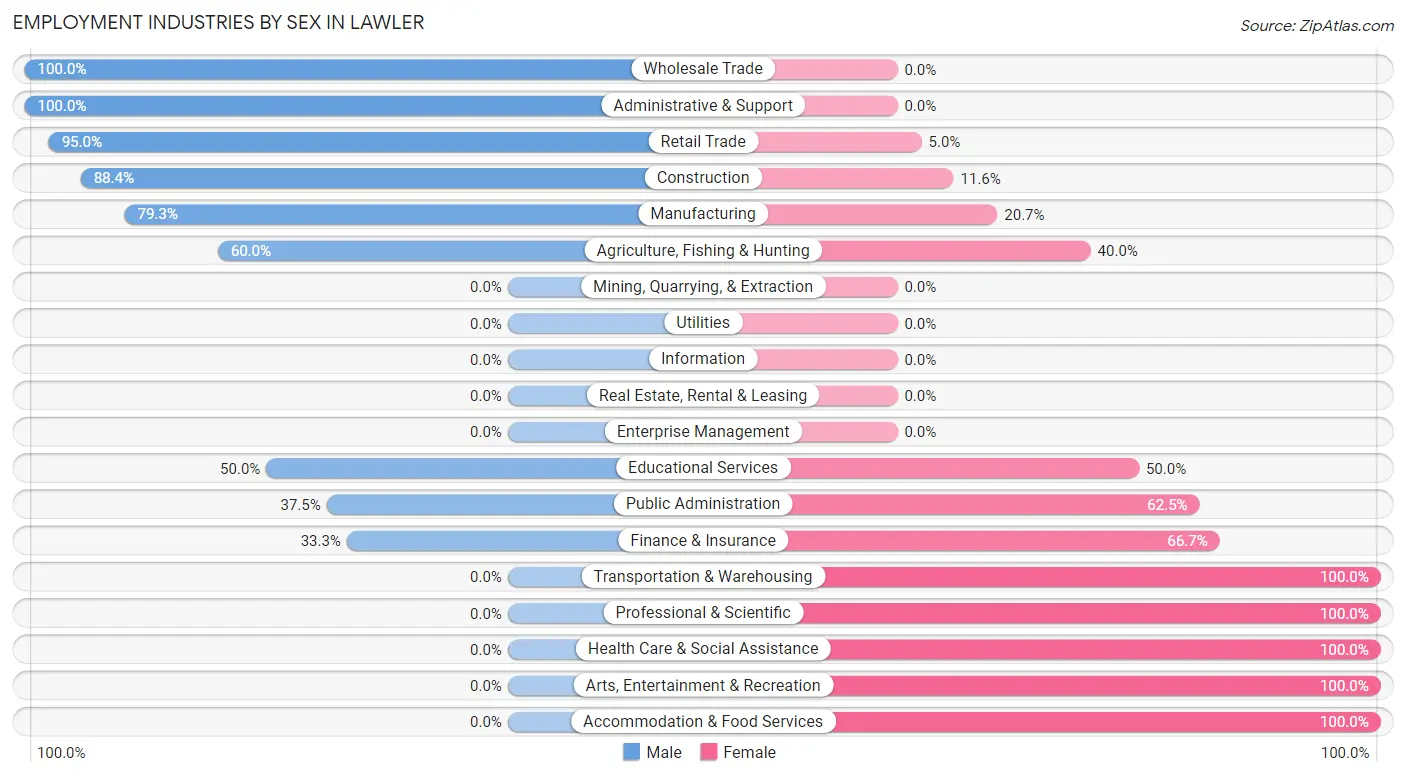
Employment Industries by Sex in Lawler
The Lawler industries that see more men than women are Wholesale Trade (100.0%), Administrative & Support (100.0%), and Retail Trade (95.0%), whereas the industries that tend to have a higher number of women are Transportation & Warehousing (100.0%), Professional & Scientific (100.0%), and Health Care & Social Assistance (100.0%).
| Industry | Male | Female |
| Agriculture, Fishing & Hunting | 9 (60.0%) | 6 (40.0%) |
| Mining, Quarrying, & Extraction | 0 (0.0%) | 0 (0.0%) |
| Construction | 38 (88.4%) | 5 (11.6%) |
| Manufacturing | 23 (79.3%) | 6 (20.7%) |
| Wholesale Trade | 5 (100.0%) | 0 (0.0%) |
| Retail Trade | 19 (95.0%) | 1 (5.0%) |
| Transportation & Warehousing | 0 (0.0%) | 9 (100.0%) |
| Utilities | 0 (0.0%) | 0 (0.0%) |
| Information | 0 (0.0%) | 0 (0.0%) |
| Finance & Insurance | 1 (33.3%) | 2 (66.7%) |
| Real Estate, Rental & Leasing | 0 (0.0%) | 0 (0.0%) |
| Professional & Scientific | 0 (0.0%) | 14 (100.0%) |
| Enterprise Management | 0 (0.0%) | 0 (0.0%) |
| Administrative & Support | 3 (100.0%) | 0 (0.0%) |
| Educational Services | 7 (50.0%) | 7 (50.0%) |
| Health Care & Social Assistance | 0 (0.0%) | 22 (100.0%) |
| Arts, Entertainment & Recreation | 0 (0.0%) | 2 (100.0%) |
| Accommodation & Food Services | 0 (0.0%) | 3 (100.0%) |
| Public Administration | 3 (37.5%) | 5 (62.5%) |
| Total | 109 (54.2%) | 92 (45.8%) |
Education in Lawler
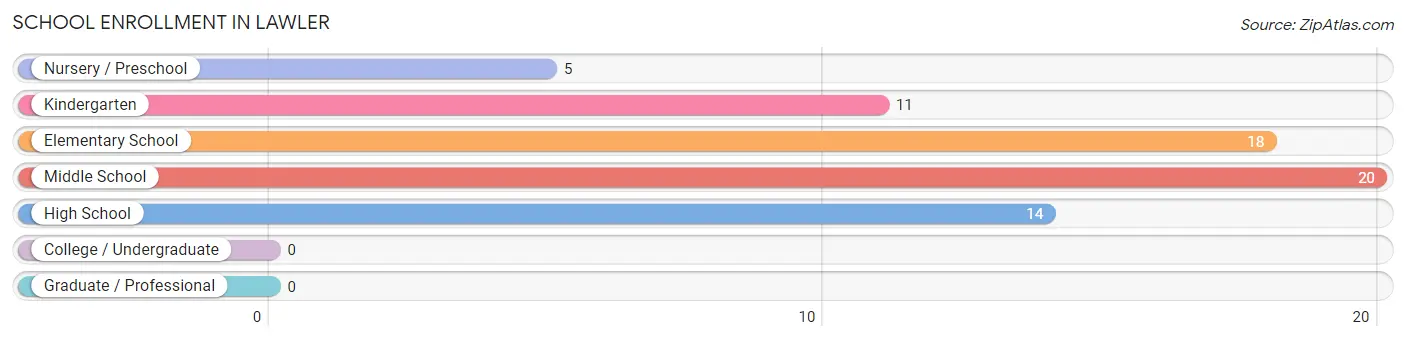
School Enrollment in Lawler
The most common levels of schooling among the 68 students in Lawler are middle school (20 | 29.4%), elementary school (18 | 26.5%), and high school (14 | 20.6%).
| School Level | # Students | % Students |
| Nursery / Preschool | 5 | 7.3% |
| Kindergarten | 11 | 16.2% |
| Elementary School | 18 | 26.5% |
| Middle School | 20 | 29.4% |
| High School | 14 | 20.6% |
| College / Undergraduate | 0 | 0.0% |
| Graduate / Professional | 0 | 0.0% |
| Total | 68 | 100.0% |
School Enrollment by Age by Funding Source in Lawler
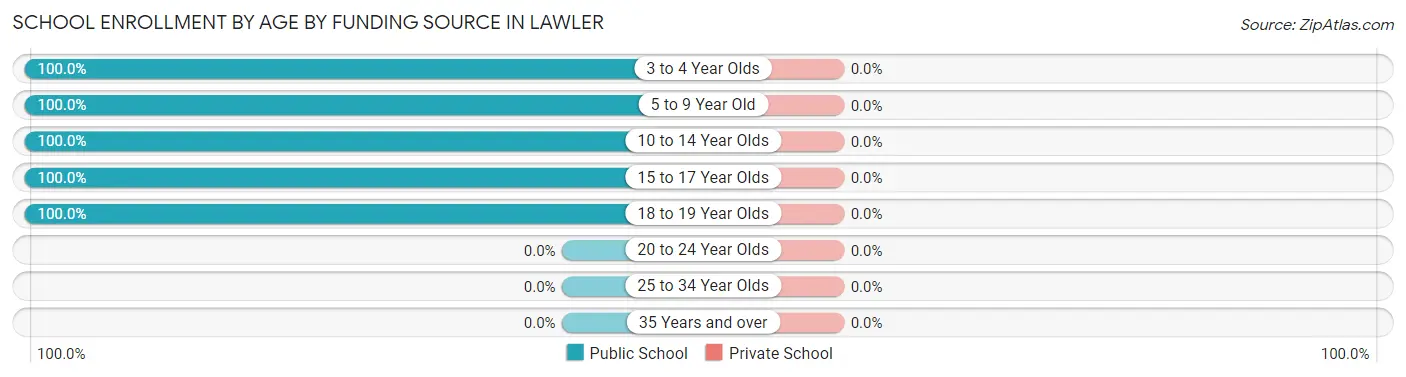
| Age Bracket | Public School | Private School |
| 3 to 4 Year Olds | 3 (100.0%) | 0 (0.0%) |
| 5 to 9 Year Old | 30 (100.0%) | 0 (0.0%) |
| 10 to 14 Year Olds | 21 (100.0%) | 0 (0.0%) |
| 15 to 17 Year Olds | 3 (100.0%) | 0 (0.0%) |
| 18 to 19 Year Olds | 11 (100.0%) | 0 (0.0%) |
| 20 to 24 Year Olds | 0 (0.0%) | 0 (0.0%) |
| 25 to 34 Year Olds | 0 (0.0%) | 0 (0.0%) |
| 35 Years and over | 0 (0.0%) | 0 (0.0%) |
| Total | 68 (100.0%) | 0 (0.0%) |
Educational Attainment by Field of Study in Lawler
Education (15 | 28.3%), business (11 | 20.7%), science & technology (9 | 17.0%), arts & humanities (6 | 11.3%), and engineering (5 | 9.4%) are the most common fields of study among 53 individuals in Lawler who have obtained a bachelor's degree or higher.
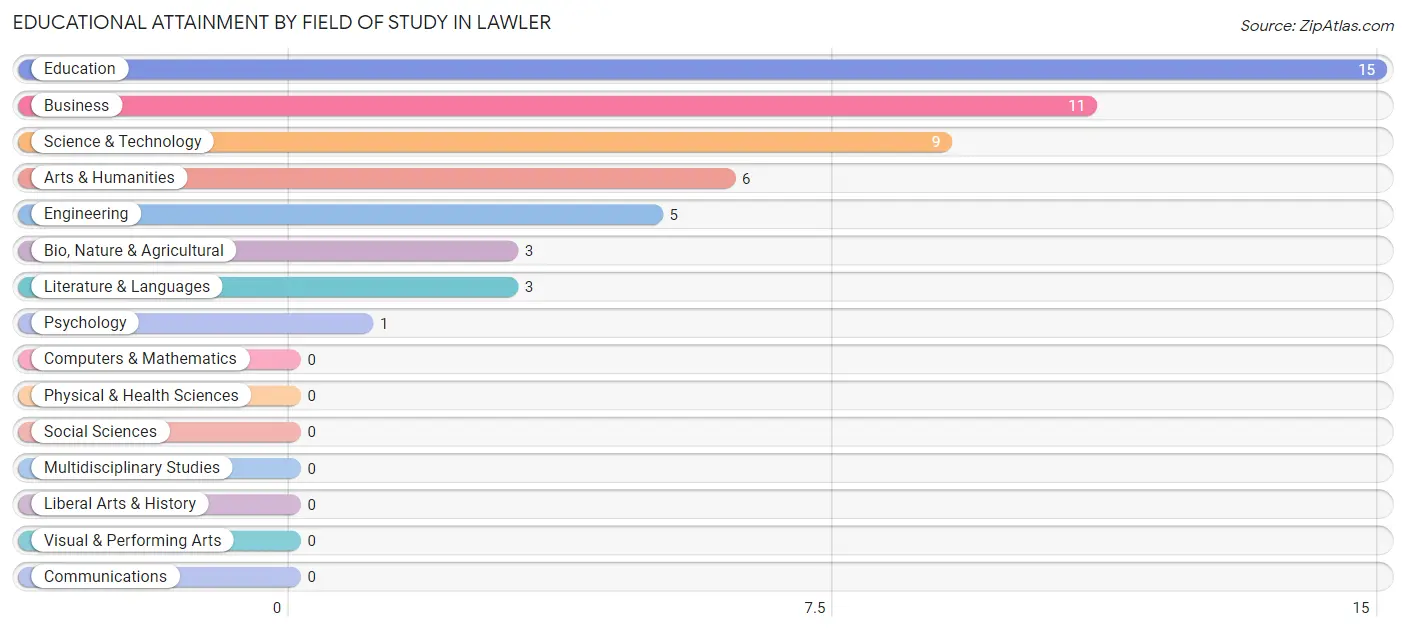
| Field of Study | # Graduates | % Graduates |
| Computers & Mathematics | 0 | 0.0% |
| Bio, Nature & Agricultural | 3 | 5.7% |
| Physical & Health Sciences | 0 | 0.0% |
| Psychology | 1 | 1.9% |
| Social Sciences | 0 | 0.0% |
| Engineering | 5 | 9.4% |
| Multidisciplinary Studies | 0 | 0.0% |
| Science & Technology | 9 | 17.0% |
| Business | 11 | 20.7% |
| Education | 15 | 28.3% |
| Literature & Languages | 3 | 5.7% |
| Liberal Arts & History | 0 | 0.0% |
| Visual & Performing Arts | 0 | 0.0% |
| Communications | 0 | 0.0% |
| Arts & Humanities | 6 | 11.3% |
| Total | 53 | 100.0% |
Transportation & Commute in Lawler
Vehicle Availability by Sex in Lawler
The most prevalent vehicle ownership categories in Lawler are males with 2 vehicles (45, accounting for 41.3%) and females with 2 vehicles (45, making up 48.9%).
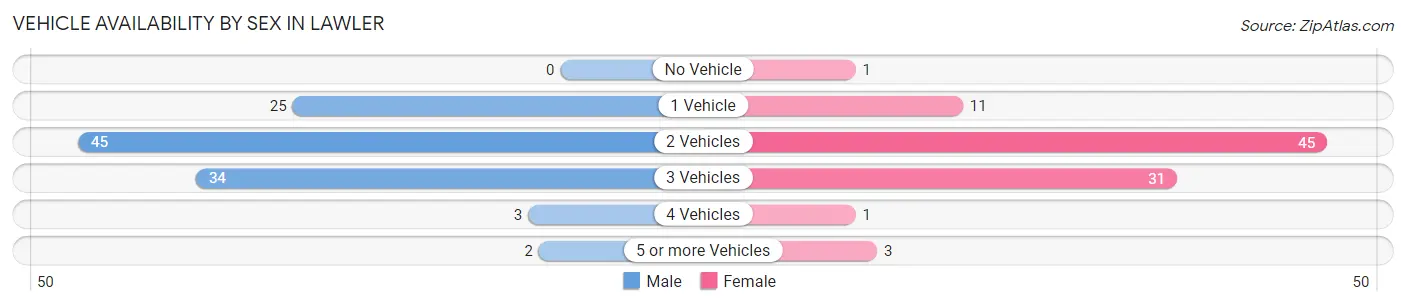
| Vehicles Available | Male | Female |
| No Vehicle | 0 (0.0%) | 1 (1.1%) |
| 1 Vehicle | 25 (22.9%) | 11 (12.0%) |
| 2 Vehicles | 45 (41.3%) | 45 (48.9%) |
| 3 Vehicles | 34 (31.2%) | 31 (33.7%) |
| 4 Vehicles | 3 (2.8%) | 1 (1.1%) |
| 5 or more Vehicles | 2 (1.8%) | 3 (3.3%) |
| Total | 109 (100.0%) | 92 (100.0%) |
Commute Time in Lawler
The most frequently occuring commute durations in Lawler are 10 to 14 minutes (46 commuters, 25.3%), 15 to 19 minutes (40 commuters, 22.0%), and 35 to 39 minutes (24 commuters, 13.2%).
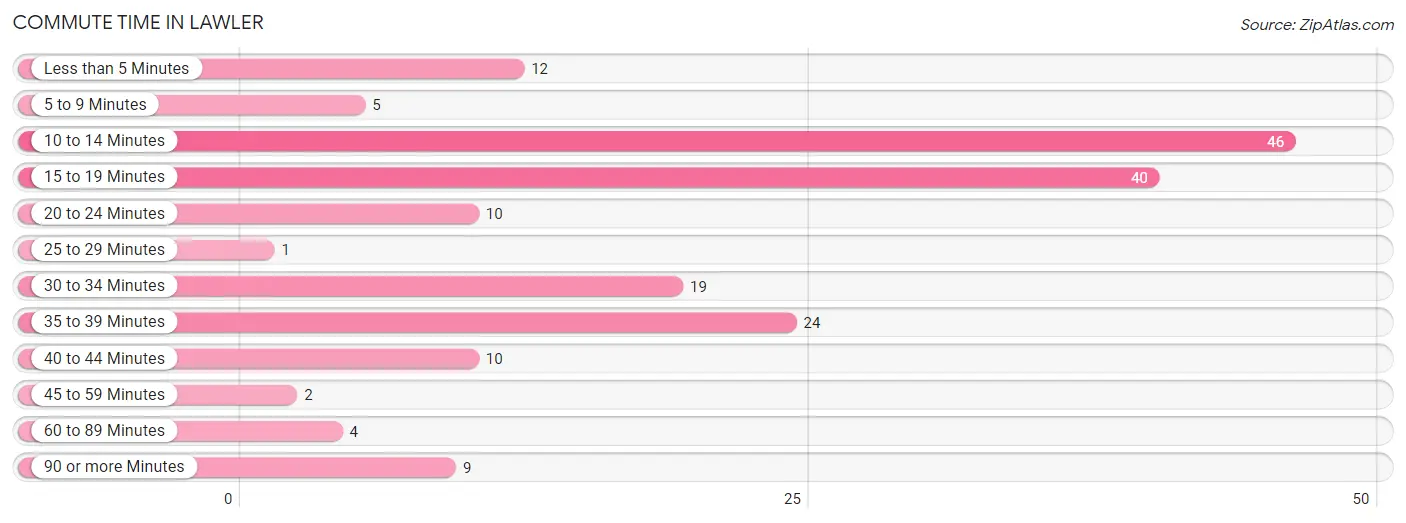
| Commute Time | # Commuters | % Commuters |
| Less than 5 Minutes | 12 | 6.6% |
| 5 to 9 Minutes | 5 | 2.8% |
| 10 to 14 Minutes | 46 | 25.3% |
| 15 to 19 Minutes | 40 | 22.0% |
| 20 to 24 Minutes | 10 | 5.5% |
| 25 to 29 Minutes | 1 | 0.5% |
| 30 to 34 Minutes | 19 | 10.4% |
| 35 to 39 Minutes | 24 | 13.2% |
| 40 to 44 Minutes | 10 | 5.5% |
| 45 to 59 Minutes | 2 | 1.1% |
| 60 to 89 Minutes | 4 | 2.2% |
| 90 or more Minutes | 9 | 5.0% |
Commute Time by Sex in Lawler
The most common commute times in Lawler are 10 to 14 minutes (28 commuters, 27.5%) for males and 10 to 14 minutes (18 commuters, 22.5%) for females.
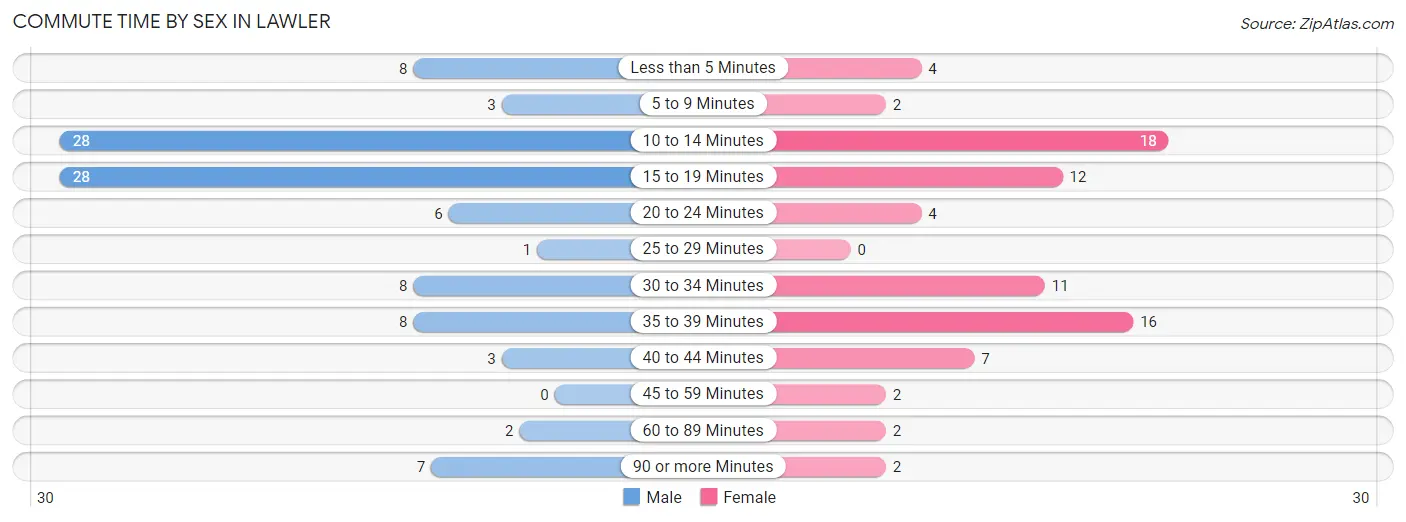
| Commute Time | Male | Female |
| Less than 5 Minutes | 8 (7.8%) | 4 (5.0%) |
| 5 to 9 Minutes | 3 (2.9%) | 2 (2.5%) |
| 10 to 14 Minutes | 28 (27.5%) | 18 (22.5%) |
| 15 to 19 Minutes | 28 (27.5%) | 12 (15.0%) |
| 20 to 24 Minutes | 6 (5.9%) | 4 (5.0%) |
| 25 to 29 Minutes | 1 (1.0%) | 0 (0.0%) |
| 30 to 34 Minutes | 8 (7.8%) | 11 (13.8%) |
| 35 to 39 Minutes | 8 (7.8%) | 16 (20.0%) |
| 40 to 44 Minutes | 3 (2.9%) | 7 (8.7%) |
| 45 to 59 Minutes | 0 (0.0%) | 2 (2.5%) |
| 60 to 89 Minutes | 2 (2.0%) | 2 (2.5%) |
| 90 or more Minutes | 7 (6.9%) | 2 (2.5%) |
Time of Departure to Work by Sex in Lawler
The most frequent times of departure to work in Lawler are 7:00 AM to 7:29 AM (22, 21.6%) for males and 12:00 AM to 4:59 AM (16, 20.0%) for females.
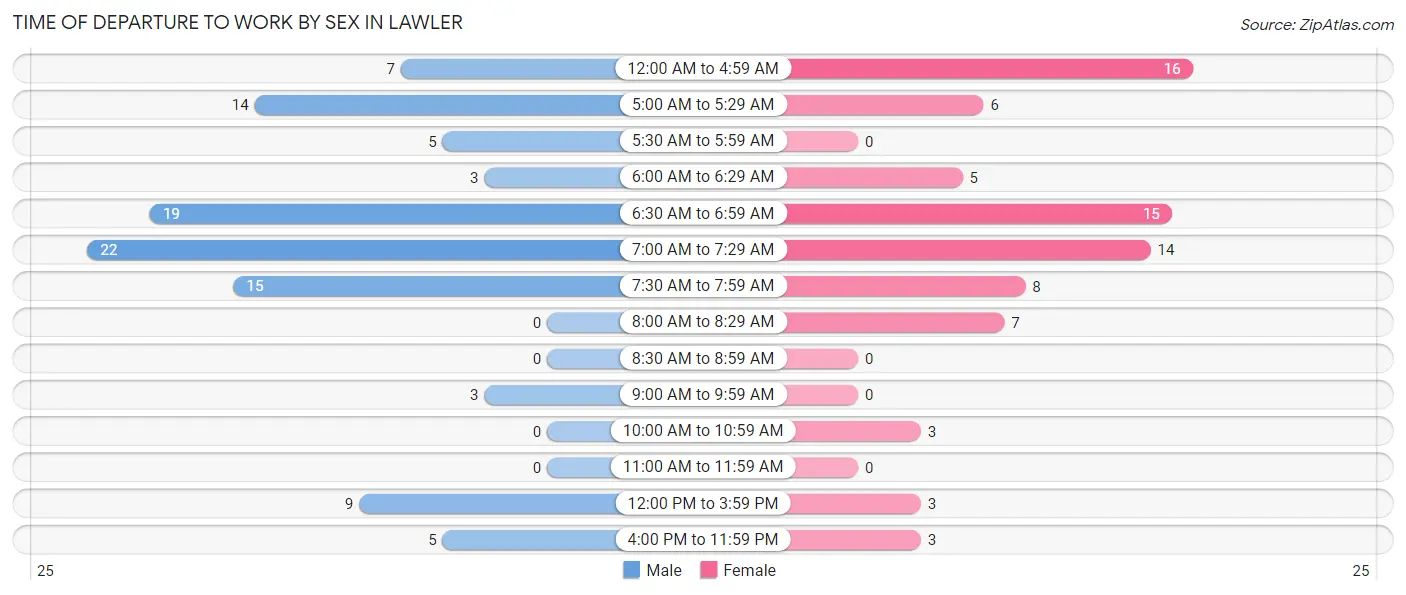
| Time of Departure | Male | Female |
| 12:00 AM to 4:59 AM | 7 (6.9%) | 16 (20.0%) |
| 5:00 AM to 5:29 AM | 14 (13.7%) | 6 (7.5%) |
| 5:30 AM to 5:59 AM | 5 (4.9%) | 0 (0.0%) |
| 6:00 AM to 6:29 AM | 3 (2.9%) | 5 (6.2%) |
| 6:30 AM to 6:59 AM | 19 (18.6%) | 15 (18.8%) |
| 7:00 AM to 7:29 AM | 22 (21.6%) | 14 (17.5%) |
| 7:30 AM to 7:59 AM | 15 (14.7%) | 8 (10.0%) |
| 8:00 AM to 8:29 AM | 0 (0.0%) | 7 (8.7%) |
| 8:30 AM to 8:59 AM | 0 (0.0%) | 0 (0.0%) |
| 9:00 AM to 9:59 AM | 3 (2.9%) | 0 (0.0%) |
| 10:00 AM to 10:59 AM | 0 (0.0%) | 3 (3.7%) |
| 11:00 AM to 11:59 AM | 0 (0.0%) | 0 (0.0%) |
| 12:00 PM to 3:59 PM | 9 (8.8%) | 3 (3.7%) |
| 4:00 PM to 11:59 PM | 5 (4.9%) | 3 (3.7%) |
| Total | 102 (100.0%) | 80 (100.0%) |
Housing Occupancy in Lawler
Occupancy by Ownership in Lawler
Of the total 177 dwellings in Lawler, owner-occupied units account for 130 (73.5%), while renter-occupied units make up 47 (26.6%).
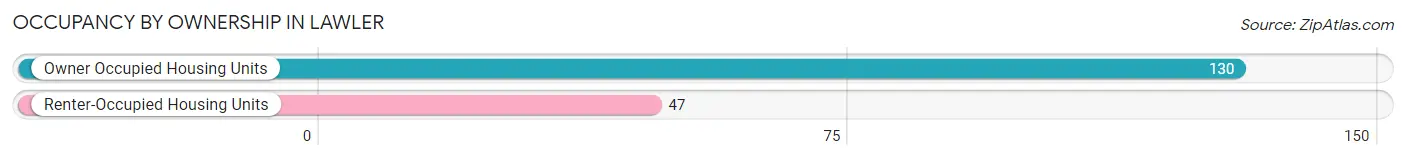
| Occupancy | # Housing Units | % Housing Units |
| Owner Occupied Housing Units | 130 | 73.5% |
| Renter-Occupied Housing Units | 47 | 26.6% |
| Total Occupied Housing Units | 177 | 100.0% |
Occupancy by Household Size in Lawler
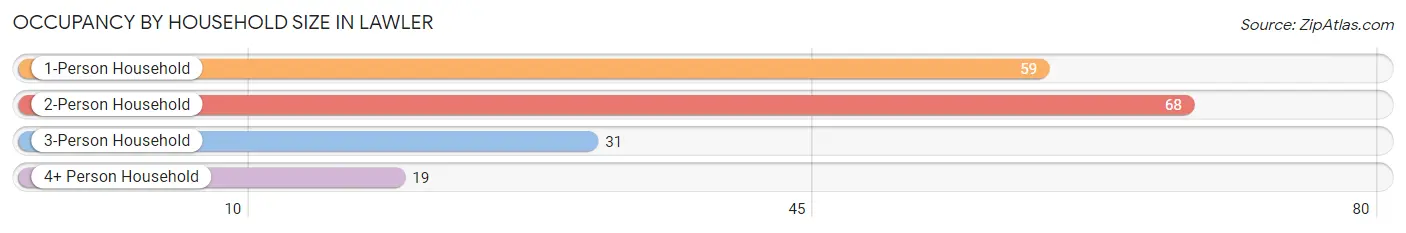
| Household Size | # Housing Units | % Housing Units |
| 1-Person Household | 59 | 33.3% |
| 2-Person Household | 68 | 38.4% |
| 3-Person Household | 31 | 17.5% |
| 4+ Person Household | 19 | 10.7% |
| Total Housing Units | 177 | 100.0% |
Occupancy by Ownership by Household Size in Lawler
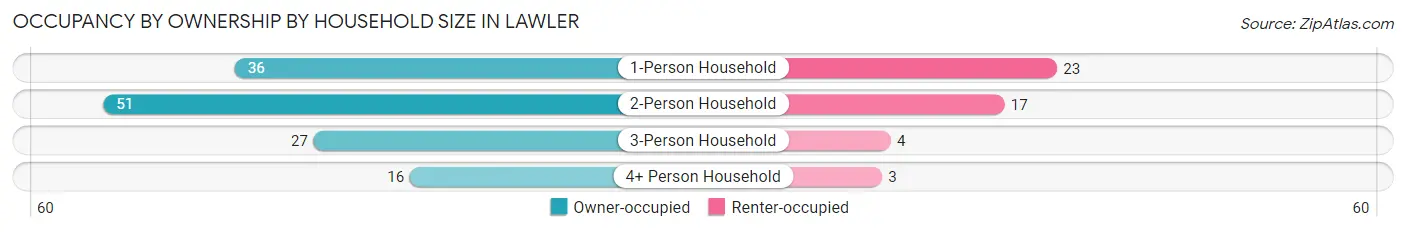
| Household Size | Owner-occupied | Renter-occupied |
| 1-Person Household | 36 (61.0%) | 23 (39.0%) |
| 2-Person Household | 51 (75.0%) | 17 (25.0%) |
| 3-Person Household | 27 (87.1%) | 4 (12.9%) |
| 4+ Person Household | 16 (84.2%) | 3 (15.8%) |
| Total Housing Units | 130 (73.5%) | 47 (26.6%) |
Occupancy by Educational Attainment in Lawler
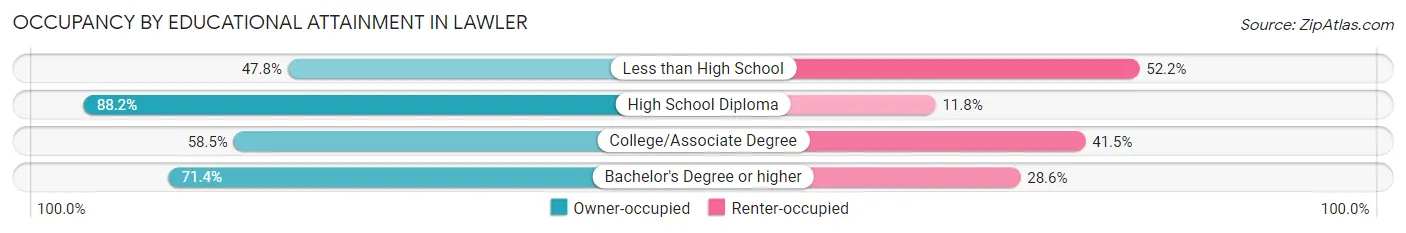
| Household Size | Owner-occupied | Renter-occupied |
| Less than High School | 11 (47.8%) | 12 (52.2%) |
| High School Diploma | 75 (88.2%) | 10 (11.8%) |
| College/Associate Degree | 24 (58.5%) | 17 (41.5%) |
| Bachelor's Degree or higher | 20 (71.4%) | 8 (28.6%) |
Occupancy by Age of Householder in Lawler
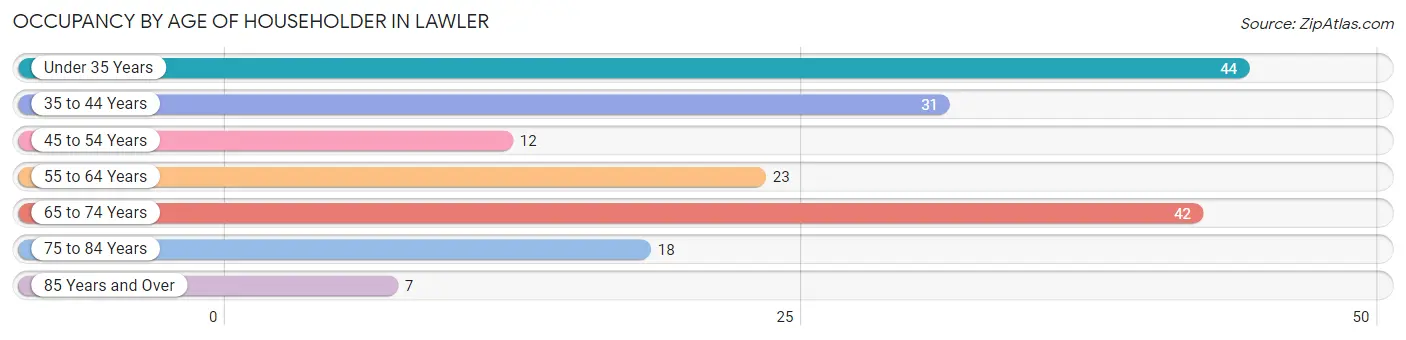
| Age Bracket | # Households | % Households |
| Under 35 Years | 44 | 24.9% |
| 35 to 44 Years | 31 | 17.5% |
| 45 to 54 Years | 12 | 6.8% |
| 55 to 64 Years | 23 | 13.0% |
| 65 to 74 Years | 42 | 23.7% |
| 75 to 84 Years | 18 | 10.2% |
| 85 Years and Over | 7 | 4.0% |
| Total | 177 | 100.0% |
Housing Finances in Lawler
Median Income by Occupancy in Lawler
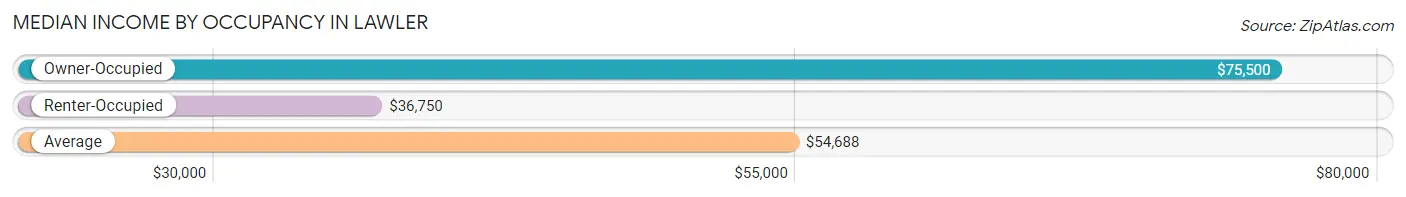
| Occupancy Type | # Households | Median Income |
| Owner-Occupied | 130 (73.5%) | $75,500 |
| Renter-Occupied | 47 (26.6%) | $36,750 |
| Average | 177 (100.0%) | $54,688 |
Occupancy by Householder Income Bracket in Lawler
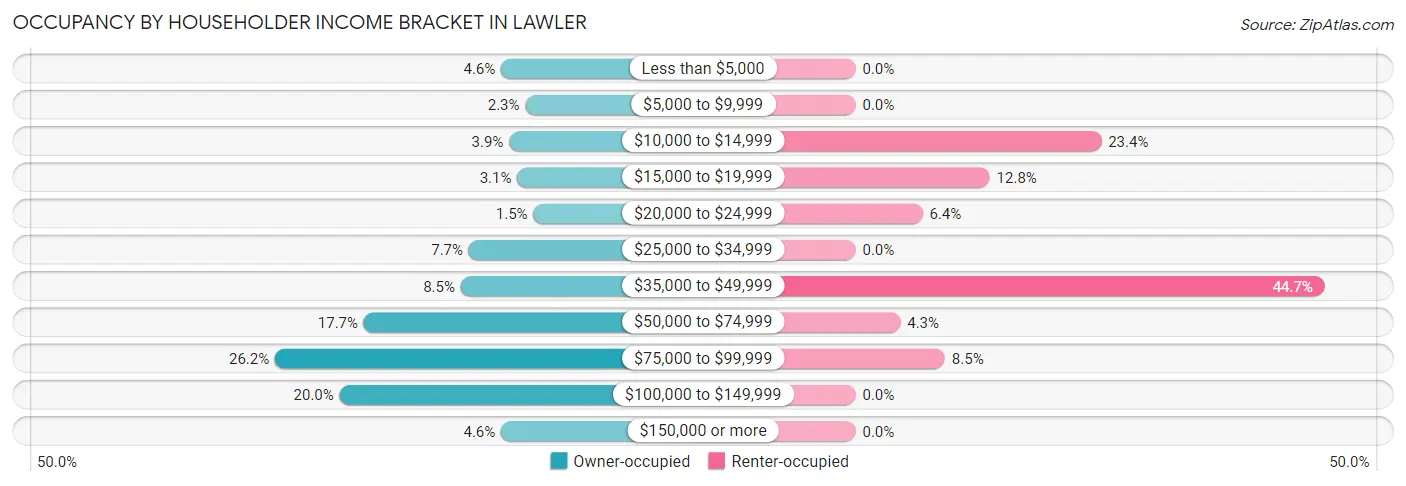
| Income Bracket | Owner-occupied | Renter-occupied |
| Less than $5,000 | 6 (4.6%) | 0 (0.0%) |
| $5,000 to $9,999 | 3 (2.3%) | 0 (0.0%) |
| $10,000 to $14,999 | 5 (3.8%) | 11 (23.4%) |
| $15,000 to $19,999 | 4 (3.1%) | 6 (12.8%) |
| $20,000 to $24,999 | 2 (1.5%) | 3 (6.4%) |
| $25,000 to $34,999 | 10 (7.7%) | 0 (0.0%) |
| $35,000 to $49,999 | 11 (8.5%) | 21 (44.7%) |
| $50,000 to $74,999 | 23 (17.7%) | 2 (4.3%) |
| $75,000 to $99,999 | 34 (26.2%) | 4 (8.5%) |
| $100,000 to $149,999 | 26 (20.0%) | 0 (0.0%) |
| $150,000 or more | 6 (4.6%) | 0 (0.0%) |
| Total | 130 (100.0%) | 47 (100.0%) |
Monthly Housing Cost Tiers in Lawler
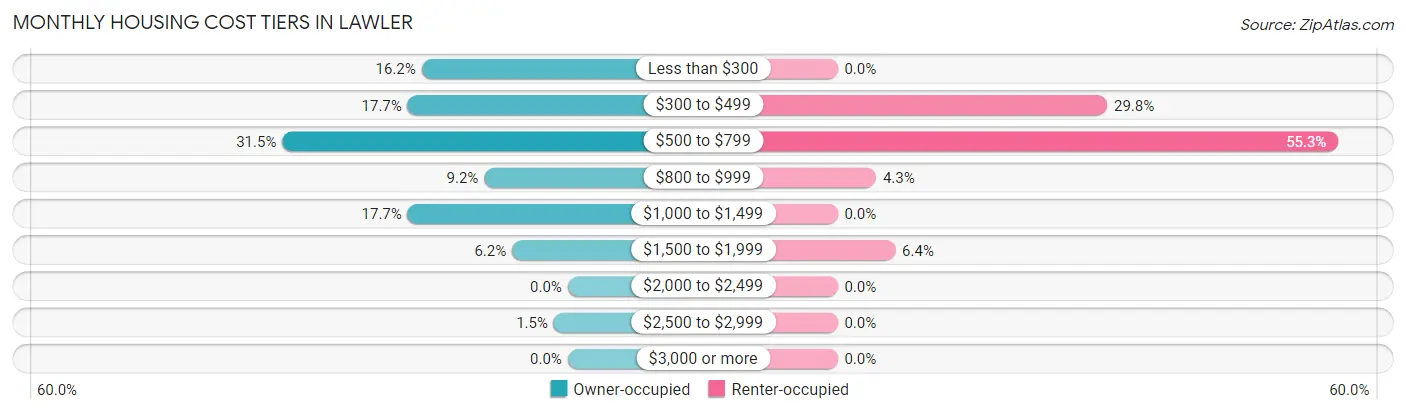
| Monthly Cost | Owner-occupied | Renter-occupied |
| Less than $300 | 21 (16.2%) | 0 (0.0%) |
| $300 to $499 | 23 (17.7%) | 14 (29.8%) |
| $500 to $799 | 41 (31.5%) | 26 (55.3%) |
| $800 to $999 | 12 (9.2%) | 2 (4.3%) |
| $1,000 to $1,499 | 23 (17.7%) | 0 (0.0%) |
| $1,500 to $1,999 | 8 (6.1%) | 3 (6.4%) |
| $2,000 to $2,499 | 0 (0.0%) | 0 (0.0%) |
| $2,500 to $2,999 | 2 (1.5%) | 0 (0.0%) |
| $3,000 or more | 0 (0.0%) | 0 (0.0%) |
| Total | 130 (100.0%) | 47 (100.0%) |
Physical Housing Characteristics in Lawler
Housing Structures in Lawler
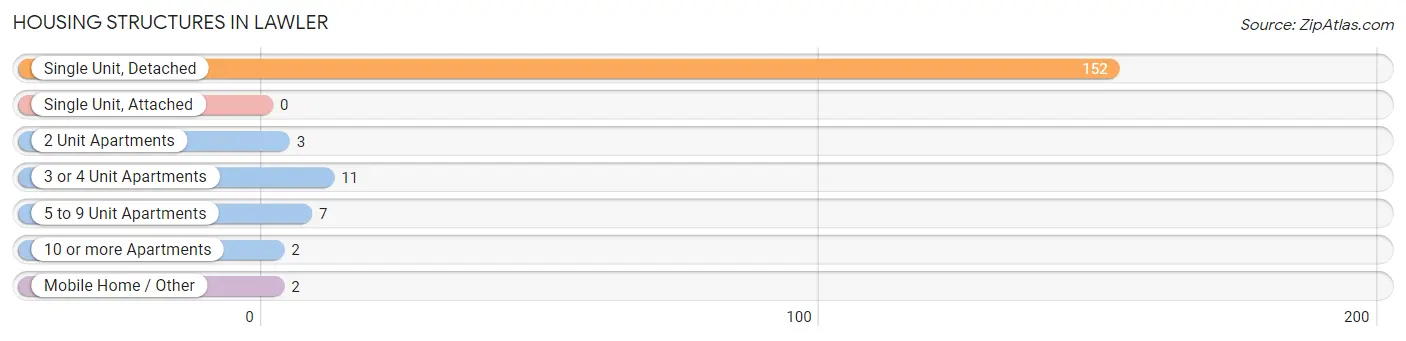
| Structure Type | # Housing Units | % Housing Units |
| Single Unit, Detached | 152 | 85.9% |
| Single Unit, Attached | 0 | 0.0% |
| 2 Unit Apartments | 3 | 1.7% |
| 3 or 4 Unit Apartments | 11 | 6.2% |
| 5 to 9 Unit Apartments | 7 | 4.0% |
| 10 or more Apartments | 2 | 1.1% |
| Mobile Home / Other | 2 | 1.1% |
| Total | 177 | 100.0% |
Housing Structures by Occupancy in Lawler
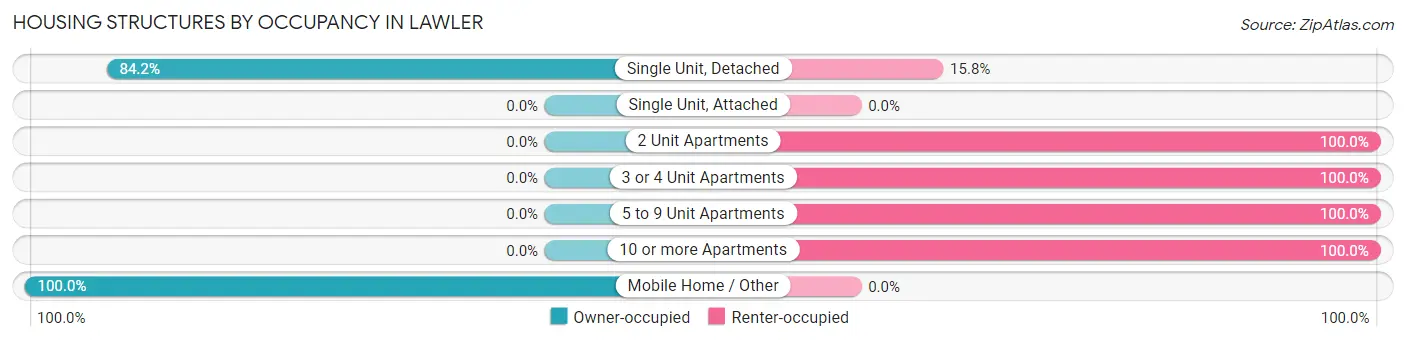
| Structure Type | Owner-occupied | Renter-occupied |
| Single Unit, Detached | 128 (84.2%) | 24 (15.8%) |
| Single Unit, Attached | 0 (0.0%) | 0 (0.0%) |
| 2 Unit Apartments | 0 (0.0%) | 3 (100.0%) |
| 3 or 4 Unit Apartments | 0 (0.0%) | 11 (100.0%) |
| 5 to 9 Unit Apartments | 0 (0.0%) | 7 (100.0%) |
| 10 or more Apartments | 0 (0.0%) | 2 (100.0%) |
| Mobile Home / Other | 2 (100.0%) | 0 (0.0%) |
| Total | 130 (73.5%) | 47 (26.6%) |
Housing Structures by Number of Rooms in Lawler
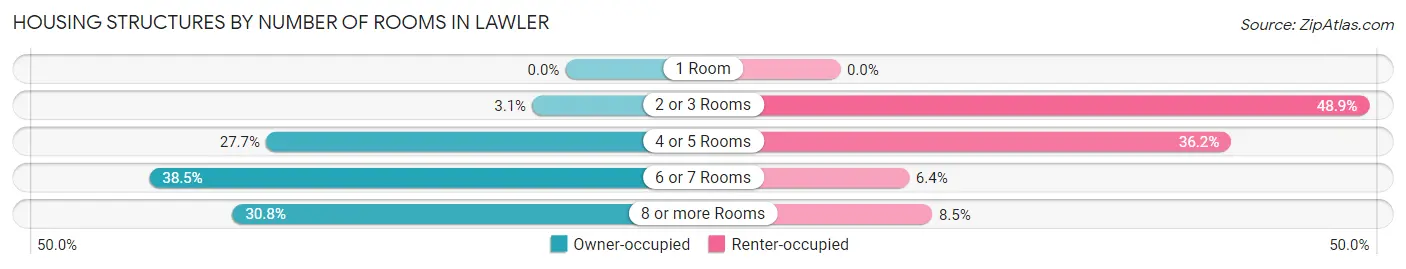
| Number of Rooms | Owner-occupied | Renter-occupied |
| 1 Room | 0 (0.0%) | 0 (0.0%) |
| 2 or 3 Rooms | 4 (3.1%) | 23 (48.9%) |
| 4 or 5 Rooms | 36 (27.7%) | 17 (36.2%) |
| 6 or 7 Rooms | 50 (38.5%) | 3 (6.4%) |
| 8 or more Rooms | 40 (30.8%) | 4 (8.5%) |
| Total | 130 (100.0%) | 47 (100.0%) |
Housing Structure by Heating Type in Lawler
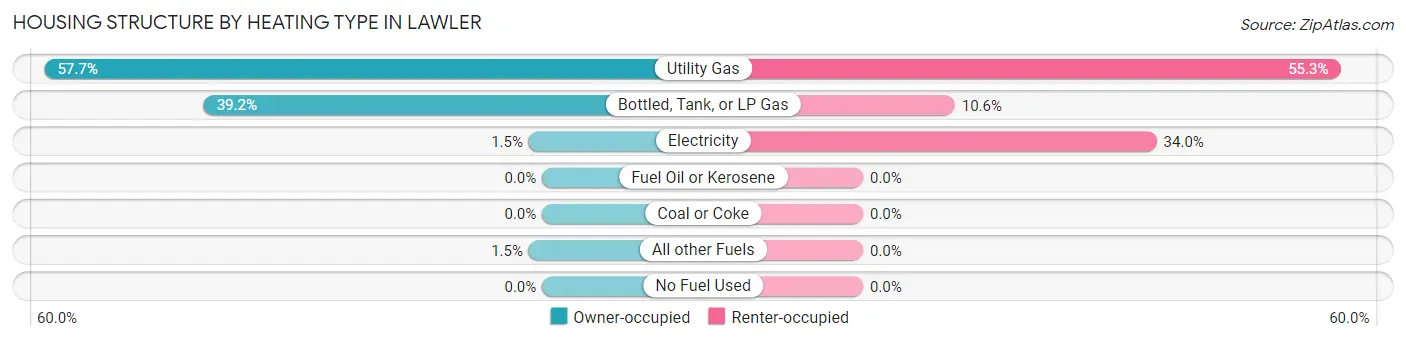
| Heating Type | Owner-occupied | Renter-occupied |
| Utility Gas | 75 (57.7%) | 26 (55.3%) |
| Bottled, Tank, or LP Gas | 51 (39.2%) | 5 (10.6%) |
| Electricity | 2 (1.5%) | 16 (34.0%) |
| Fuel Oil or Kerosene | 0 (0.0%) | 0 (0.0%) |
| Coal or Coke | 0 (0.0%) | 0 (0.0%) |
| All other Fuels | 2 (1.5%) | 0 (0.0%) |
| No Fuel Used | 0 (0.0%) | 0 (0.0%) |
| Total | 130 (100.0%) | 47 (100.0%) |
Household Vehicle Usage in Lawler
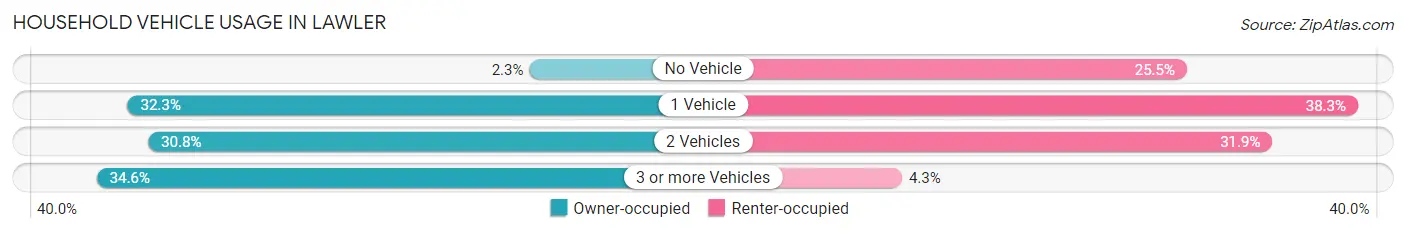
| Vehicles per Household | Owner-occupied | Renter-occupied |
| No Vehicle | 3 (2.3%) | 12 (25.5%) |
| 1 Vehicle | 42 (32.3%) | 18 (38.3%) |
| 2 Vehicles | 40 (30.8%) | 15 (31.9%) |
| 3 or more Vehicles | 45 (34.6%) | 2 (4.3%) |
| Total | 130 (100.0%) | 47 (100.0%) |
Real Estate & Mortgages in Lawler
Real Estate and Mortgage Overview in Lawler
| Characteristic | Without Mortgage | With Mortgage |
| Housing Units | 71 | 59 |
| Median Property Value | $90,700 | $89,700 |
| Median Household Income | $59,583 | $4 |
| Monthly Housing Costs | $388 | $0 |
| Real Estate Taxes | $1,042 | $0 |
Property Value by Mortgage Status in Lawler
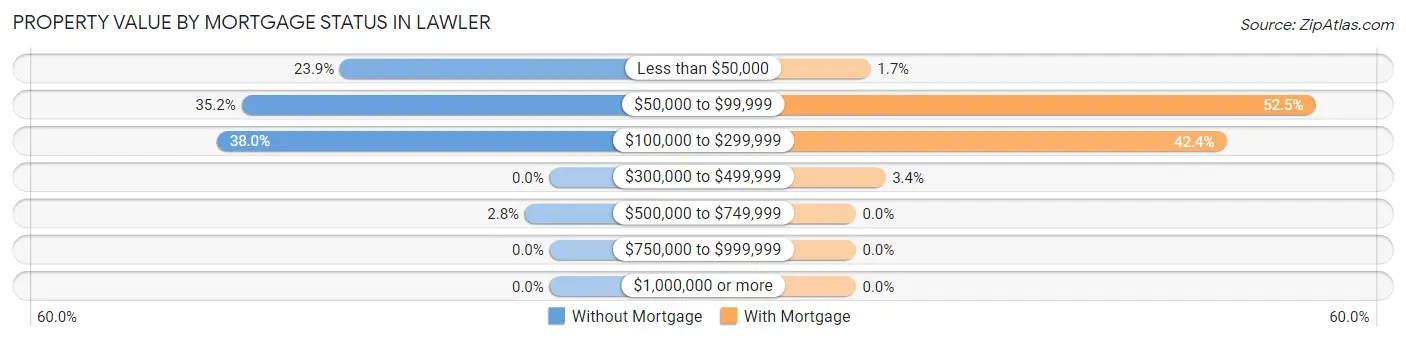
| Property Value | Without Mortgage | With Mortgage |
| Less than $50,000 | 17 (23.9%) | 1 (1.7%) |
| $50,000 to $99,999 | 25 (35.2%) | 31 (52.5%) |
| $100,000 to $299,999 | 27 (38.0%) | 25 (42.4%) |
| $300,000 to $499,999 | 0 (0.0%) | 2 (3.4%) |
| $500,000 to $749,999 | 2 (2.8%) | 0 (0.0%) |
| $750,000 to $999,999 | 0 (0.0%) | 0 (0.0%) |
| $1,000,000 or more | 0 (0.0%) | 0 (0.0%) |
| Total | 71 (100.0%) | 59 (100.0%) |
Household Income by Mortgage Status in Lawler
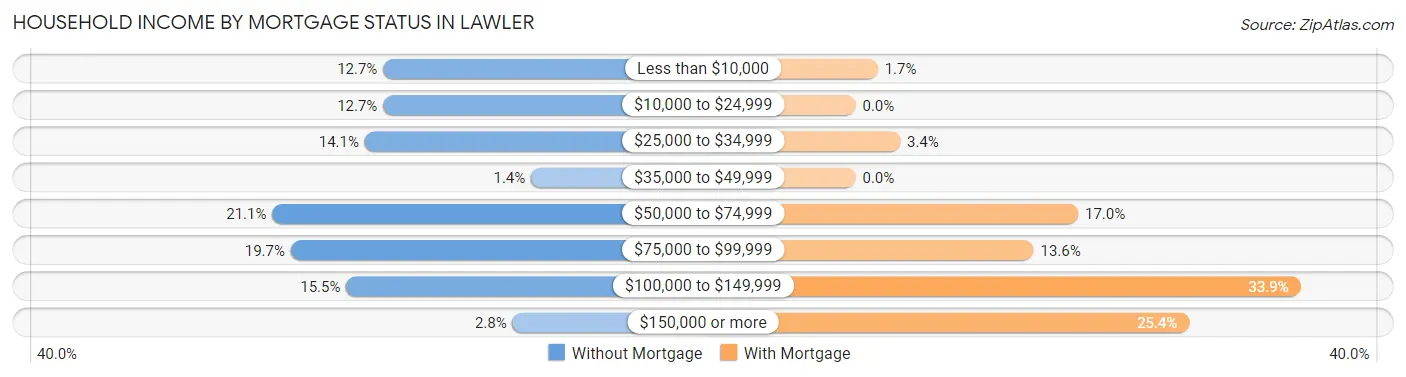
| Household Income | Without Mortgage | With Mortgage |
| Less than $10,000 | 9 (12.7%) | 1 (1.7%) |
| $10,000 to $24,999 | 9 (12.7%) | 0 (0.0%) |
| $25,000 to $34,999 | 10 (14.1%) | 2 (3.4%) |
| $35,000 to $49,999 | 1 (1.4%) | 0 (0.0%) |
| $50,000 to $74,999 | 15 (21.1%) | 10 (17.0%) |
| $75,000 to $99,999 | 14 (19.7%) | 8 (13.6%) |
| $100,000 to $149,999 | 11 (15.5%) | 20 (33.9%) |
| $150,000 or more | 2 (2.8%) | 15 (25.4%) |
| Total | 71 (100.0%) | 59 (100.0%) |
Property Value to Household Income Ratio in Lawler
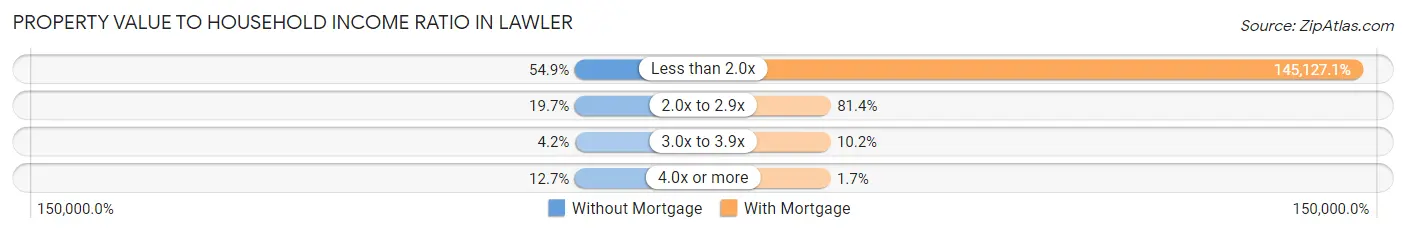
| Value-to-Income Ratio | Without Mortgage | With Mortgage |
| Less than 2.0x | 39 (54.9%) | 85,625 (145,127.1%) |
| 2.0x to 2.9x | 14 (19.7%) | 48 (81.4%) |
| 3.0x to 3.9x | 3 (4.2%) | 6 (10.2%) |
| 4.0x or more | 9 (12.7%) | 1 (1.7%) |
| Total | 71 (100.0%) | 59 (100.0%) |
Real Estate Taxes by Mortgage Status in Lawler
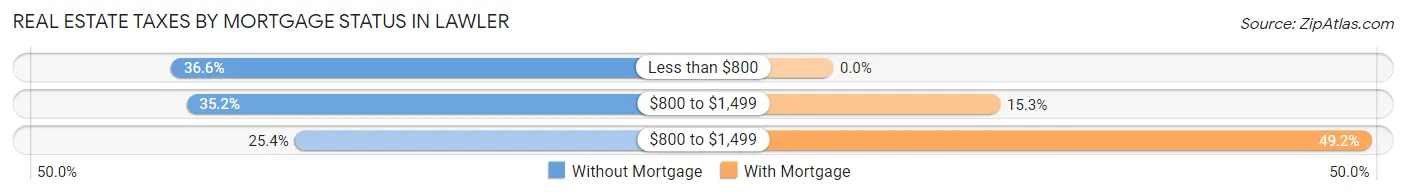
| Property Taxes | Without Mortgage | With Mortgage |
| Less than $800 | 26 (36.6%) | 0 (0.0%) |
| $800 to $1,499 | 25 (35.2%) | 9 (15.2%) |
| $800 to $1,499 | 18 (25.4%) | 29 (49.1%) |
| Total | 71 (100.0%) | 59 (100.0%) |
Health & Disability in Lawler
Health Insurance Coverage by Age in Lawler
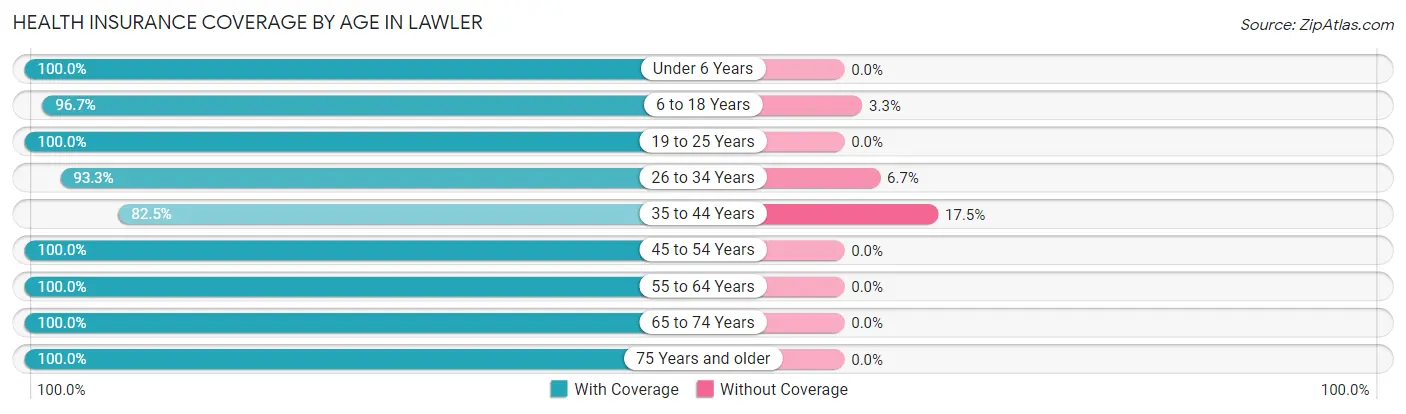
| Age Bracket | With Coverage | Without Coverage |
| Under 6 Years | 24 (100.0%) | 0 (0.0%) |
| 6 to 18 Years | 58 (96.7%) | 2 (3.3%) |
| 19 to 25 Years | 38 (100.0%) | 0 (0.0%) |
| 26 to 34 Years | 42 (93.3%) | 3 (6.7%) |
| 35 to 44 Years | 33 (82.5%) | 7 (17.5%) |
| 45 to 54 Years | 25 (100.0%) | 0 (0.0%) |
| 55 to 64 Years | 46 (100.0%) | 0 (0.0%) |
| 65 to 74 Years | 64 (100.0%) | 0 (0.0%) |
| 75 Years and older | 35 (100.0%) | 0 (0.0%) |
| Total | 365 (96.8%) | 12 (3.2%) |
Health Insurance Coverage by Citizenship Status in Lawler
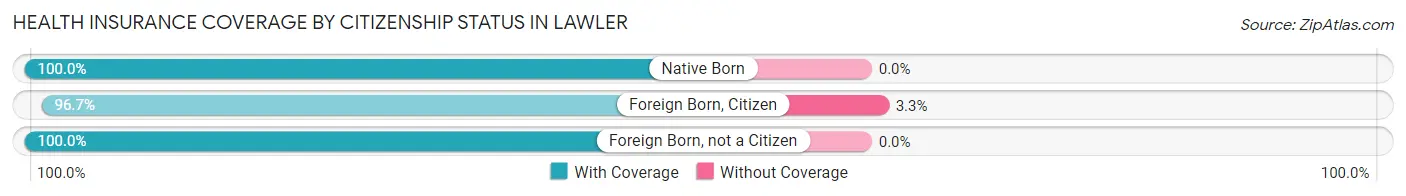
| Citizenship Status | With Coverage | Without Coverage |
| Native Born | 24 (100.0%) | 0 (0.0%) |
| Foreign Born, Citizen | 58 (96.7%) | 2 (3.3%) |
| Foreign Born, not a Citizen | 38 (100.0%) | 0 (0.0%) |
Health Insurance Coverage by Household Income in Lawler
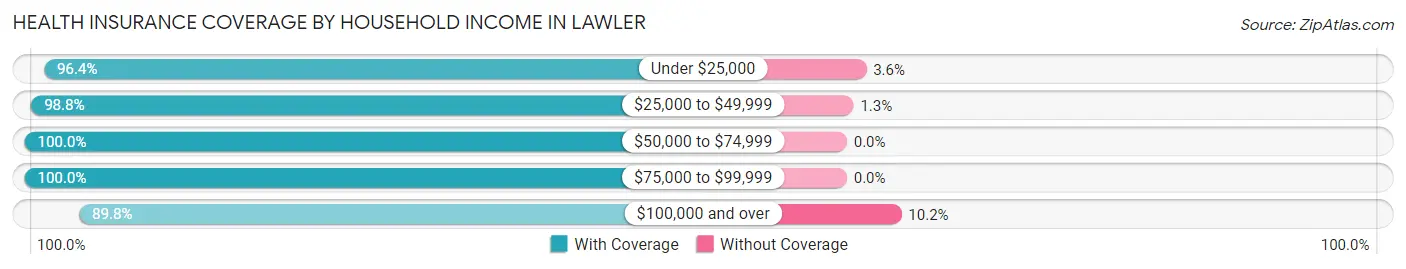
| Household Income | With Coverage | Without Coverage |
| Under $25,000 | 53 (96.4%) | 2 (3.6%) |
| $25,000 to $49,999 | 79 (98.8%) | 1 (1.3%) |
| $50,000 to $74,999 | 56 (100.0%) | 0 (0.0%) |
| $75,000 to $99,999 | 98 (100.0%) | 0 (0.0%) |
| $100,000 and over | 79 (89.8%) | 9 (10.2%) |
Public vs Private Health Insurance Coverage by Age in Lawler
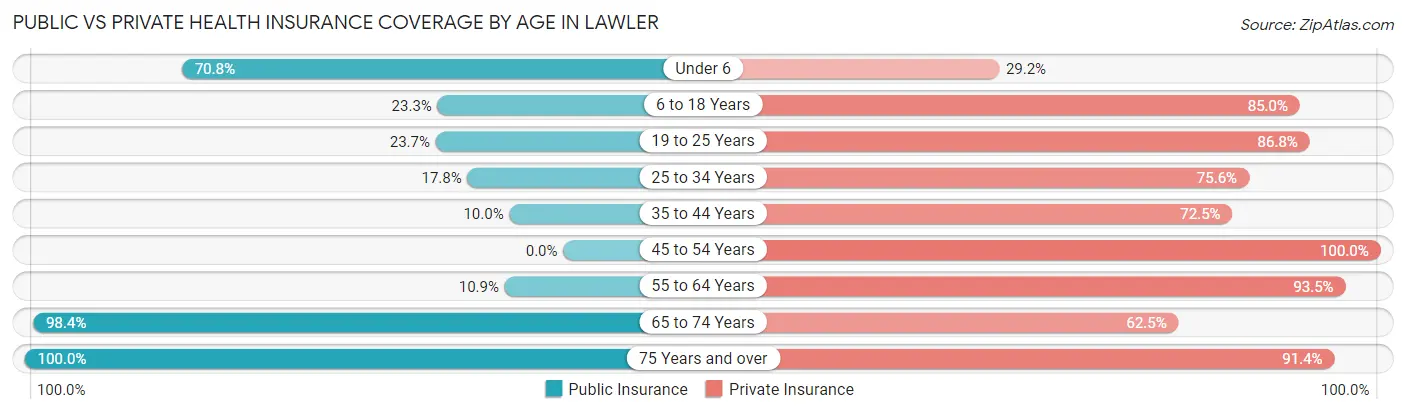
| Age Bracket | Public Insurance | Private Insurance |
| Under 6 | 17 (70.8%) | 7 (29.2%) |
| 6 to 18 Years | 14 (23.3%) | 51 (85.0%) |
| 19 to 25 Years | 9 (23.7%) | 33 (86.8%) |
| 25 to 34 Years | 8 (17.8%) | 34 (75.6%) |
| 35 to 44 Years | 4 (10.0%) | 29 (72.5%) |
| 45 to 54 Years | 0 (0.0%) | 25 (100.0%) |
| 55 to 64 Years | 5 (10.9%) | 43 (93.5%) |
| 65 to 74 Years | 63 (98.4%) | 40 (62.5%) |
| 75 Years and over | 35 (100.0%) | 32 (91.4%) |
| Total | 155 (41.1%) | 294 (78.0%) |
Disability Status by Sex by Age in Lawler
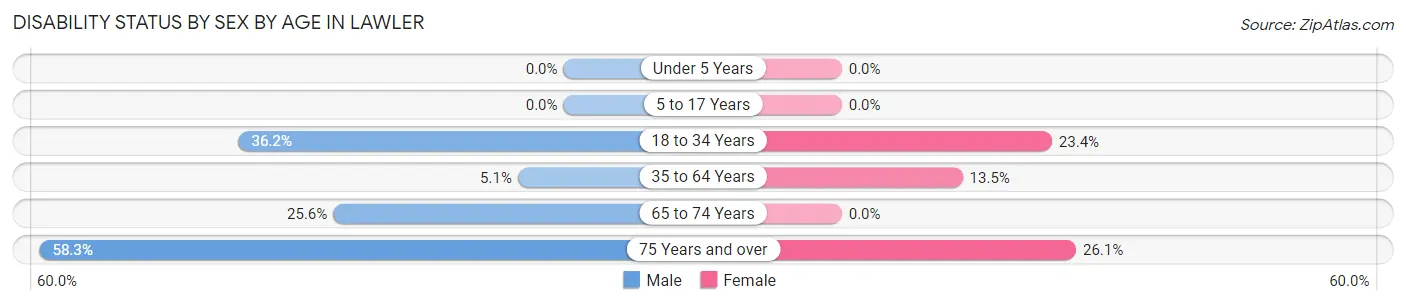
| Age Bracket | Male | Female |
| Under 5 Years | 0 (0.0%) | 0 (0.0%) |
| 5 to 17 Years | 0 (0.0%) | 0 (0.0%) |
| 18 to 34 Years | 17 (36.2%) | 11 (23.4%) |
| 35 to 64 Years | 3 (5.1%) | 7 (13.5%) |
| 65 to 74 Years | 10 (25.6%) | 0 (0.0%) |
| 75 Years and over | 7 (58.3%) | 6 (26.1%) |
Disability Class by Sex by Age in Lawler
Disability Class: Hearing Difficulty
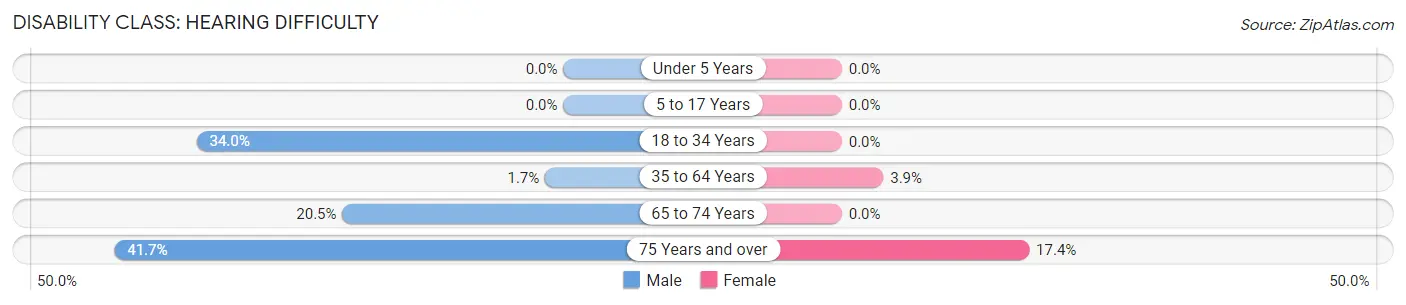
| Age Bracket | Male | Female |
| Under 5 Years | 0 (0.0%) | 0 (0.0%) |
| 5 to 17 Years | 0 (0.0%) | 0 (0.0%) |
| 18 to 34 Years | 16 (34.0%) | 0 (0.0%) |
| 35 to 64 Years | 1 (1.7%) | 2 (3.8%) |
| 65 to 74 Years | 8 (20.5%) | 0 (0.0%) |
| 75 Years and over | 5 (41.7%) | 4 (17.4%) |
Disability Class: Vision Difficulty
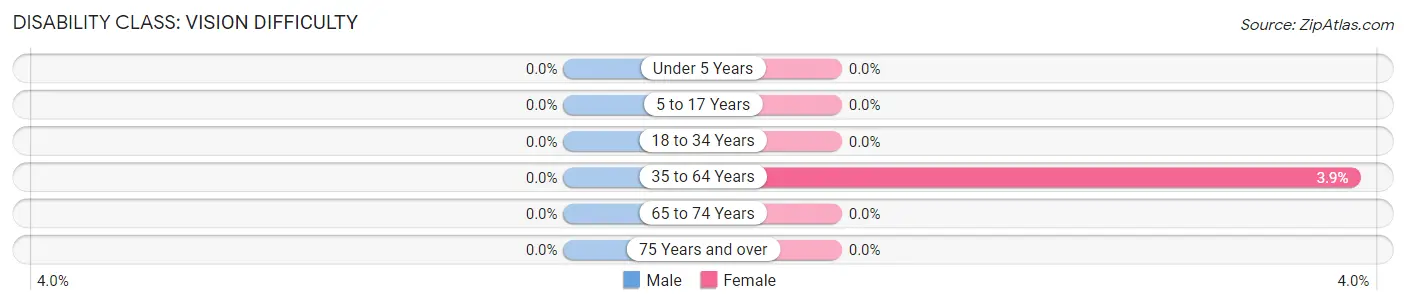
| Age Bracket | Male | Female |
| Under 5 Years | 0 (0.0%) | 0 (0.0%) |
| 5 to 17 Years | 0 (0.0%) | 0 (0.0%) |
| 18 to 34 Years | 0 (0.0%) | 0 (0.0%) |
| 35 to 64 Years | 0 (0.0%) | 2 (3.8%) |
| 65 to 74 Years | 0 (0.0%) | 0 (0.0%) |
| 75 Years and over | 0 (0.0%) | 0 (0.0%) |
Disability Class: Cognitive Difficulty
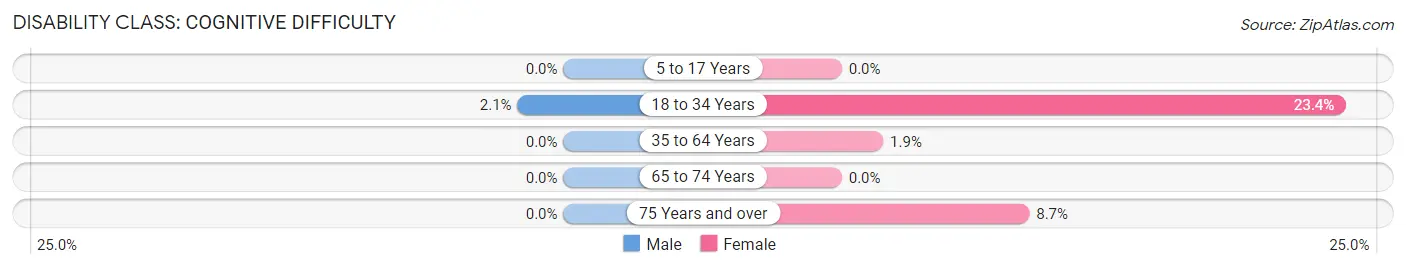
| Age Bracket | Male | Female |
| 5 to 17 Years | 0 (0.0%) | 0 (0.0%) |
| 18 to 34 Years | 1 (2.1%) | 11 (23.4%) |
| 35 to 64 Years | 0 (0.0%) | 1 (1.9%) |
| 65 to 74 Years | 0 (0.0%) | 0 (0.0%) |
| 75 Years and over | 0 (0.0%) | 2 (8.7%) |
Disability Class: Ambulatory Difficulty
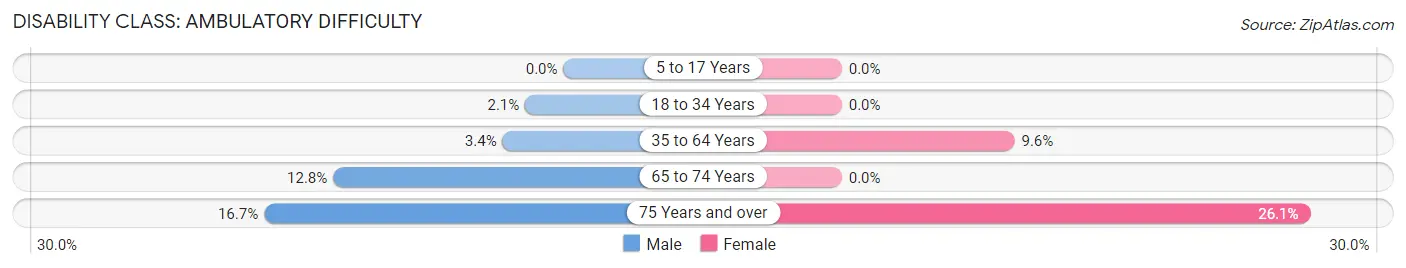
| Age Bracket | Male | Female |
| 5 to 17 Years | 0 (0.0%) | 0 (0.0%) |
| 18 to 34 Years | 1 (2.1%) | 0 (0.0%) |
| 35 to 64 Years | 2 (3.4%) | 5 (9.6%) |
| 65 to 74 Years | 5 (12.8%) | 0 (0.0%) |
| 75 Years and over | 2 (16.7%) | 6 (26.1%) |
Disability Class: Self-Care Difficulty
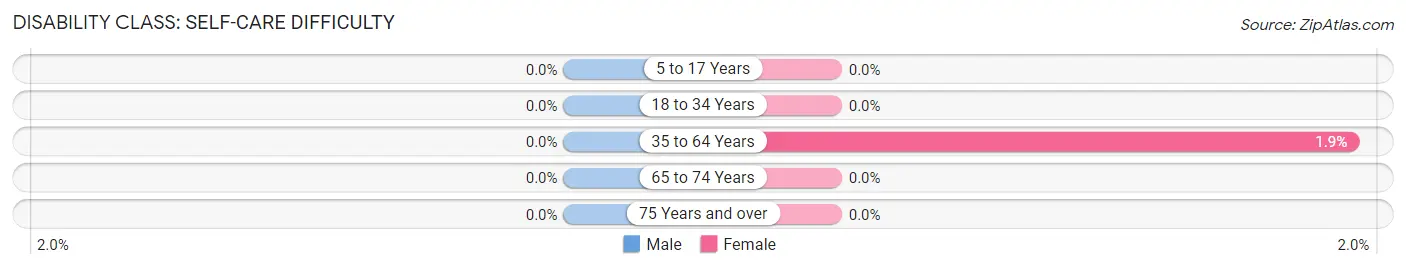
| Age Bracket | Male | Female |
| 5 to 17 Years | 0 (0.0%) | 0 (0.0%) |
| 18 to 34 Years | 0 (0.0%) | 0 (0.0%) |
| 35 to 64 Years | 0 (0.0%) | 1 (1.9%) |
| 65 to 74 Years | 0 (0.0%) | 0 (0.0%) |
| 75 Years and over | 0 (0.0%) | 0 (0.0%) |
Technology Access in Lawler
Computing Device Access in Lawler
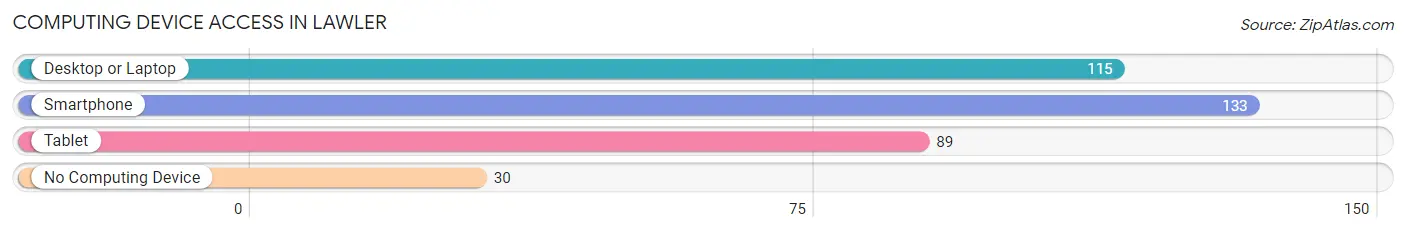
| Device Type | # Households | % Households |
| Desktop or Laptop | 115 | 65.0% |
| Smartphone | 133 | 75.1% |
| Tablet | 89 | 50.3% |
| No Computing Device | 30 | 17.0% |
| Total | 177 | 100.0% |
Internet Access in Lawler
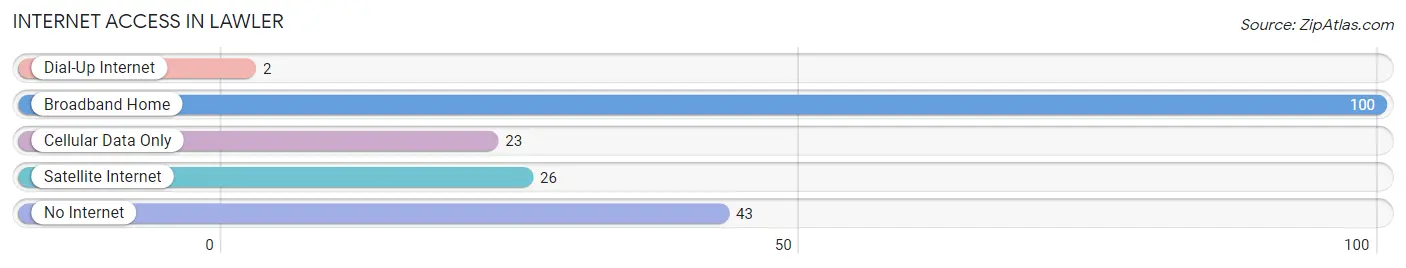
| Internet Type | # Households | % Households |
| Dial-Up Internet | 2 | 1.1% |
| Broadband Home | 100 | 56.5% |
| Cellular Data Only | 23 | 13.0% |
| Satellite Internet | 26 | 14.7% |
| No Internet | 43 | 24.3% |
| Total | 177 | 100.0% |
Lawler Summary
Lawler, Iowa is a small city located in the northeastern corner of the state, in the county of Chickasaw. It is situated on the banks of the Upper Iowa River, and is surrounded by rolling hills and farmland. The city has a population of just over 1,000 people, and is part of the Waterloo-Cedar Falls Metropolitan Statistical Area.
History
Lawler was founded in 1856 by a group of settlers from Germany, who named the town after their leader, John Lawler. The town was originally a farming community, and the settlers built a grist mill and a sawmill to help support the local economy. The town grew slowly, and by the turn of the century, it had a population of just over 500 people.
In the early 1900s, Lawler began to experience a period of growth and development. The town was incorporated in 1906, and the first mayor was elected in 1907. The town was connected to the outside world by the Chicago Great Western Railway, which ran through the town. This allowed for the transportation of goods and people, and helped to spur the growth of the town.
In the 1920s, Lawler experienced a period of rapid growth. The population increased from 500 to over 1,000 people, and the town was connected to the outside world by the Chicago Great Western Railway. The town also saw the construction of a new school, a bank, and a post office.
Geography
Lawler is located in the northeastern corner of Iowa, in the county of Chickasaw. It is situated on the banks of the Upper Iowa River, and is surrounded by rolling hills and farmland. The city has a total area of 1.2 square miles, all of which is land.
The climate in Lawler is classified as humid continental, with hot summers and cold winters. The average temperature in the summer is around 75 degrees Fahrenheit, and the average temperature in the winter is around 25 degrees Fahrenheit. The average annual precipitation is around 35 inches.
Economy
The economy of Lawler is largely based on agriculture. The town is surrounded by farmland, and the main crops grown in the area are corn, soybeans, and hay. The town also has a few small businesses, including a grocery store, a hardware store, and a few restaurants.
The town is also home to a few manufacturing companies, including a furniture factory and a plastics factory. The town also has a few small service businesses, such as a gas station and a car repair shop.
Demographics
As of the 2010 census, the population of Lawler was 1,072 people. The racial makeup of the town was 97.3% White, 0.7% African American, 0.2% Native American, 0.2% Asian, 0.2% from other races, and 1.6% from two or more races. Hispanic or Latino of any race were 1.2% of the population.
The median household income in Lawler was $41,250, and the median family income was $48,750. The per capita income for the town was $19,945. About 8.3% of families and 10.2% of the population were below the poverty line, including 13.2% of those under the age of 18 and 8.3% of those 65 and older.
Common Questions
What is Per Capita Income in Lawler?
Per Capita income in Lawler is $30,836.
What is the Median Family Income in Lawler?
Median Family Income in Lawler is $77,188.
What is the Median Household income in Lawler?
Median Household Income in Lawler is $54,688.
What is Income or Wage Gap in Lawler?
Income or Wage Gap in Lawler is 0.4%.
Women in Lawler earn 99.6 cents for every dollar earned by a man.
What is Inequality or Gini Index in Lawler?
Inequality or Gini Index in Lawler is 0.37.
What is the Total Population of Lawler?
Total Population of Lawler is 377.
What is the Total Male Population of Lawler?
Total Male Population of Lawler is 186.
What is the Total Female Population of Lawler?
Total Female Population of Lawler is 191.
What is the Ratio of Males per 100 Females in Lawler?
There are 97.38 Males per 100 Females in Lawler.
What is the Ratio of Females per 100 Males in Lawler?
There are 102.69 Females per 100 Males in Lawler.
What is the Median Population Age in Lawler?
Median Population Age in Lawler is 40.7 Years.
What is the Average Family Size in Lawler
Average Family Size in Lawler is 2.8 People.
What is the Average Household Size in Lawler
Average Household Size in Lawler is 2.1 People.
How Large is the Labor Force in Lawler?
There are 212 People in the Labor Forcein in Lawler.
What is the Percentage of People in the Labor Force in Lawler?
69.3% of People are in the Labor Force in Lawler.
What is the Unemployment Rate in Lawler?
Unemployment Rate in Lawler is 5.2%.