Big Falls, WI Map & Demographics
Big Falls Map
Big Falls Overview
$48,850
PER CAPITA INCOME
$141,066
AVG FAMILY INCOME
0.3%
WAGE / INCOME GAP [ % ]
99.7¢/ $1
WAGE / INCOME GAP [ $ ]
0.41
INEQUALITY / GINI INDEX
149
TOTAL POPULATION
79
MALE POPULATION
70
FEMALE POPULATION
112.86
MALES / 100 FEMALES
88.61
FEMALES / 100 MALES
60.2
MEDIAN AGE
2.2
AVG FAMILY SIZE
1.8
AVG HOUSEHOLD SIZE
101
LABOR FORCE [ PEOPLE ]
67.8%
PERCENT IN LABOR FORCE
4.0%
UNEMPLOYMENT RATE
Big Falls Zip Codes
Income in Big Falls
Income Overview in Big Falls
| Characteristic | Number | Measure |
| Per Capita Income | 149 | $48,850 |
| Median Family Income | 43 | $141,066 |
| Mean Family Income | 43 | $132,844 |
| Median Household Income | 84 | $0 |
| Mean Household Income | 84 | $79,186 |
| Income Deficit | 43 | $0 |
| Wage / Income Gap (%) | 149 | 0.30% |
| Wage / Income Gap ($) | 149 | 99.70¢ per $1 |
| Gini / Inequality Index | 149 | 0.41 |
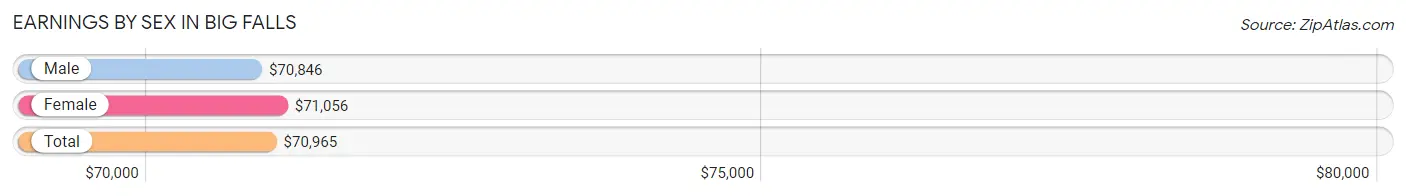
Earnings by Sex in Big Falls
Average Earnings in Big Falls are $70,965, $70,846 for men and $71,056 for women, a difference of 0.3%.
| Sex | Number | Average Earnings |
| Male | 45 (46.4%) | $70,846 |
| Female | 52 (53.6%) | $71,056 |
| Total | 97 (100.0%) | $70,965 |
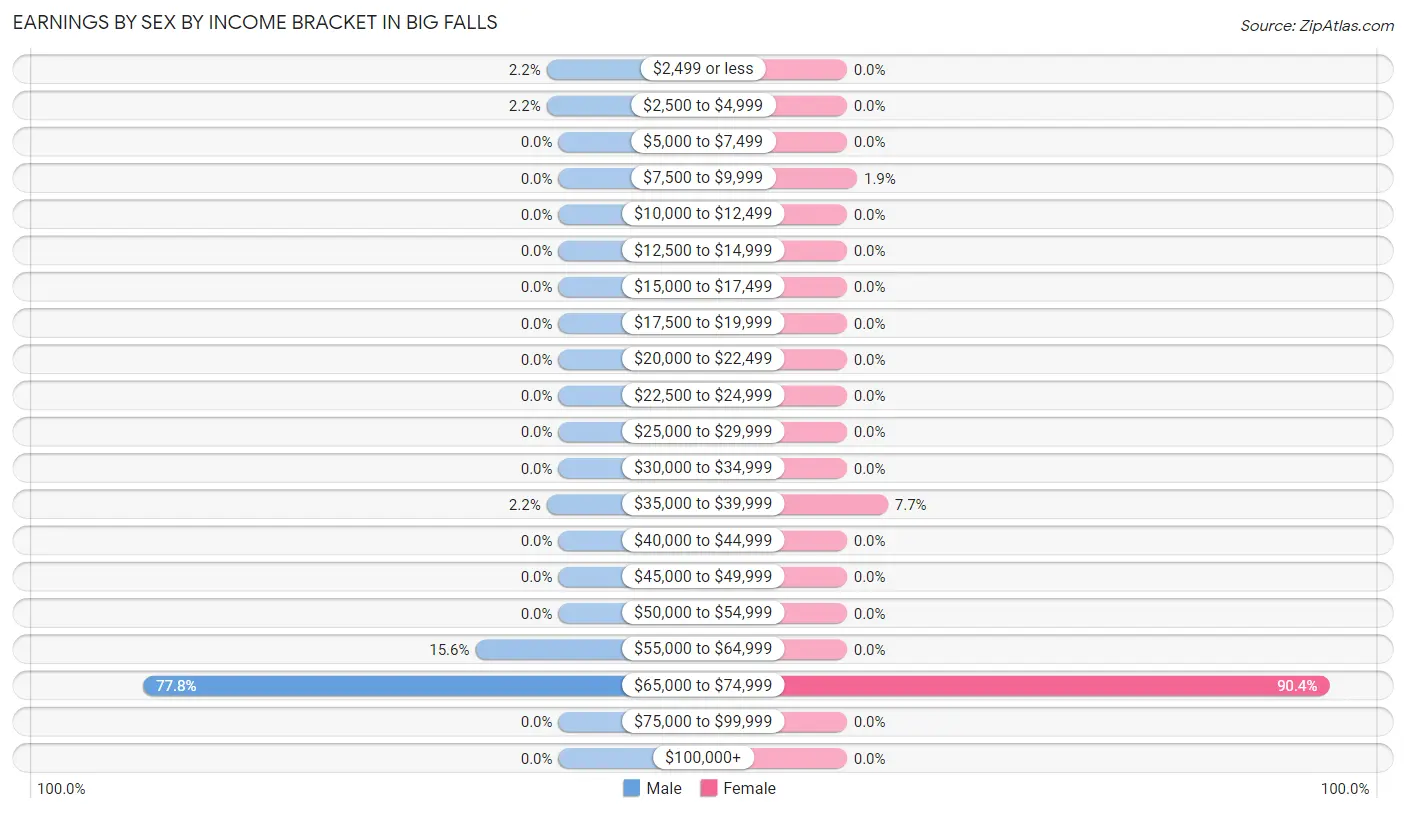
Earnings by Sex by Income Bracket in Big Falls
The most common earnings brackets in Big Falls are $65,000 to $74,999 for men (35 | 77.8%) and $65,000 to $74,999 for women (47 | 90.4%).
| Income | Male | Female |
| $2,499 or less | 1 (2.2%) | 0 (0.0%) |
| $2,500 to $4,999 | 1 (2.2%) | 0 (0.0%) |
| $5,000 to $7,499 | 0 (0.0%) | 0 (0.0%) |
| $7,500 to $9,999 | 0 (0.0%) | 1 (1.9%) |
| $10,000 to $12,499 | 0 (0.0%) | 0 (0.0%) |
| $12,500 to $14,999 | 0 (0.0%) | 0 (0.0%) |
| $15,000 to $17,499 | 0 (0.0%) | 0 (0.0%) |
| $17,500 to $19,999 | 0 (0.0%) | 0 (0.0%) |
| $20,000 to $22,499 | 0 (0.0%) | 0 (0.0%) |
| $22,500 to $24,999 | 0 (0.0%) | 0 (0.0%) |
| $25,000 to $29,999 | 0 (0.0%) | 0 (0.0%) |
| $30,000 to $34,999 | 0 (0.0%) | 0 (0.0%) |
| $35,000 to $39,999 | 1 (2.2%) | 4 (7.7%) |
| $40,000 to $44,999 | 0 (0.0%) | 0 (0.0%) |
| $45,000 to $49,999 | 0 (0.0%) | 0 (0.0%) |
| $50,000 to $54,999 | 0 (0.0%) | 0 (0.0%) |
| $55,000 to $64,999 | 7 (15.6%) | 0 (0.0%) |
| $65,000 to $74,999 | 35 (77.8%) | 47 (90.4%) |
| $75,000 to $99,999 | 0 (0.0%) | 0 (0.0%) |
| $100,000+ | 0 (0.0%) | 0 (0.0%) |
| Total | 45 (100.0%) | 52 (100.0%) |
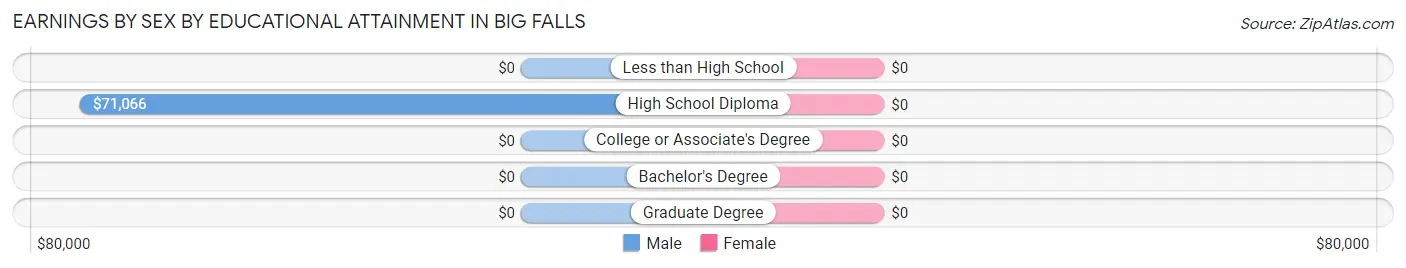
Earnings by Sex by Educational Attainment in Big Falls
| Educational Attainment | Male Income | Female Income |
| Less than High School | - | - |
| High School Diploma | $71,066 | $0 |
| College or Associate's Degree | - | - |
| Bachelor's Degree | - | - |
| Graduate Degree | - | - |
| Total | $70,846 | $71,056 |
Family Income in Big Falls
Family Income Brackets in Big Falls
According to the Big Falls family income data, there are 34 families falling into the $100,000 to $149,999 income range, which is the most common income bracket and makes up 79.1% of all families.
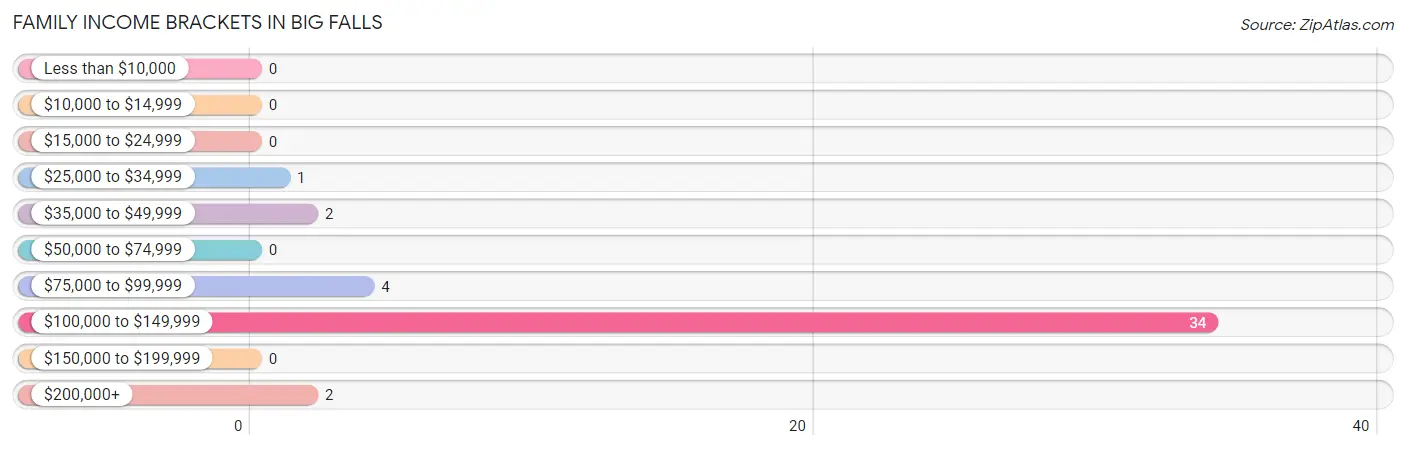
| Income Bracket | # Families | % Families |
| Less than $10,000 | 0 | 0.0% |
| $10,000 to $14,999 | 0 | 0.0% |
| $15,000 to $24,999 | 0 | 0.0% |
| $25,000 to $34,999 | 1 | 2.3% |
| $35,000 to $49,999 | 2 | 4.7% |
| $50,000 to $74,999 | 0 | 0.0% |
| $75,000 to $99,999 | 4 | 9.3% |
| $100,000 to $149,999 | 34 | 79.1% |
| $150,000 to $199,999 | 0 | 0.0% |
| $200,000+ | 2 | 4.7% |
Family Income by Famaliy Size in Big Falls
2-person families (43 | 100.0%) account for the highest median family income in Big Falls with $141,066 per family, while 2-person families (43 | 100.0%) have the highest median income of $70,533 per family member.
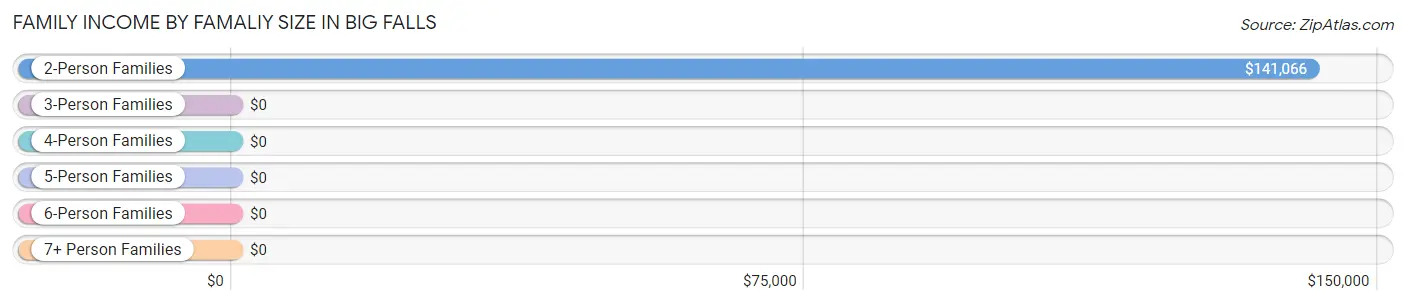
| Income Bracket | # Families | Median Income |
| 2-Person Families | 43 (100.0%) | $141,066 |
| 3-Person Families | 0 (0.0%) | $0 |
| 4-Person Families | 0 (0.0%) | $0 |
| 5-Person Families | 0 (0.0%) | $0 |
| 6-Person Families | 0 (0.0%) | $0 |
| 7+ Person Families | 0 (0.0%) | $0 |
| Total | 43 (100.0%) | $141,066 |
Family Income by Number of Earners in Big Falls
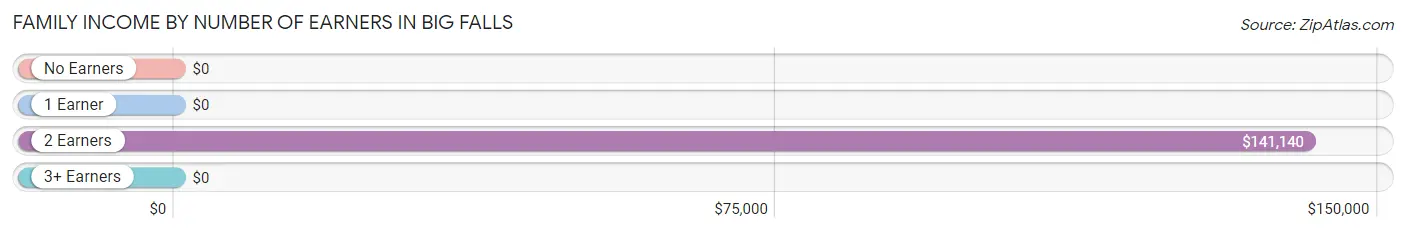
| Number of Earners | # Families | Median Income |
| No Earners | 1 (2.3%) | $0 |
| 1 Earner | 1 (2.3%) | $0 |
| 2 Earners | 41 (95.4%) | $141,140 |
| 3+ Earners | 0 (0.0%) | $0 |
| Total | 43 (100.0%) | $141,066 |
Household Income in Big Falls
Household Income Brackets in Big Falls
With 34 households falling in the category, the $100,000 to $149,999 income range is the most frequent in Big Falls, accounting for 40.5% of all households.
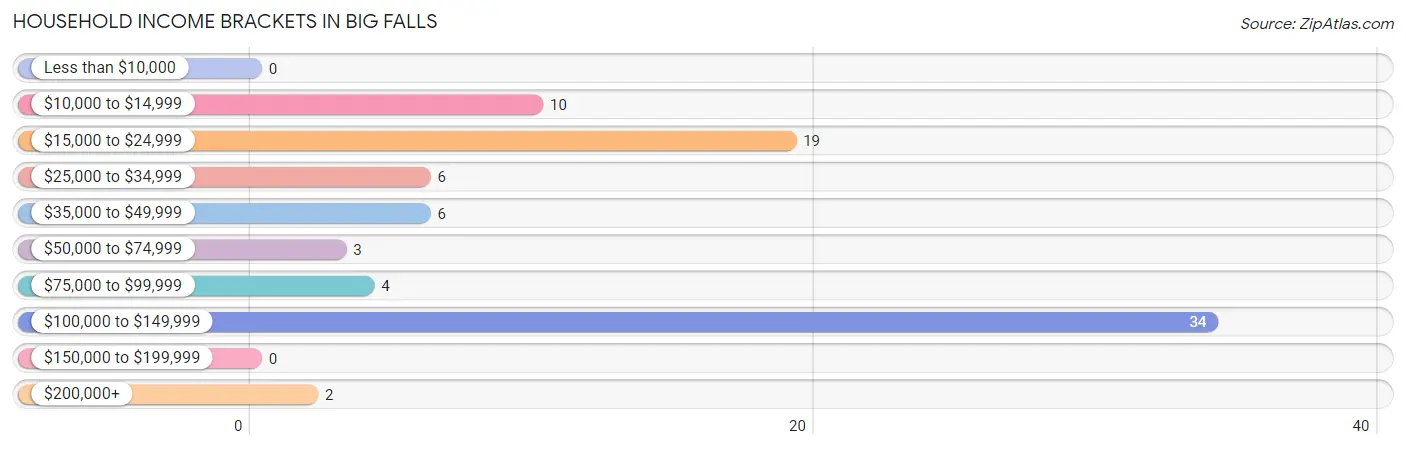
| Income Bracket | # Households | % Households |
| Less than $10,000 | 0 | 0.0% |
| $10,000 to $14,999 | 10 | 11.9% |
| $15,000 to $24,999 | 19 | 22.6% |
| $25,000 to $34,999 | 6 | 7.1% |
| $35,000 to $49,999 | 6 | 7.1% |
| $50,000 to $74,999 | 3 | 3.6% |
| $75,000 to $99,999 | 4 | 4.8% |
| $100,000 to $149,999 | 34 | 40.5% |
| $150,000 to $199,999 | 0 | 0.0% |
| $200,000+ | 2 | 2.4% |
Household Income by Householder Age in Big Falls
The median household income in Big Falls is $0, with the highest median household income of $140,478 found in the 45 to 64 years age bracket for the primary householder. A total of 59 households (70.2%) fall into this category.
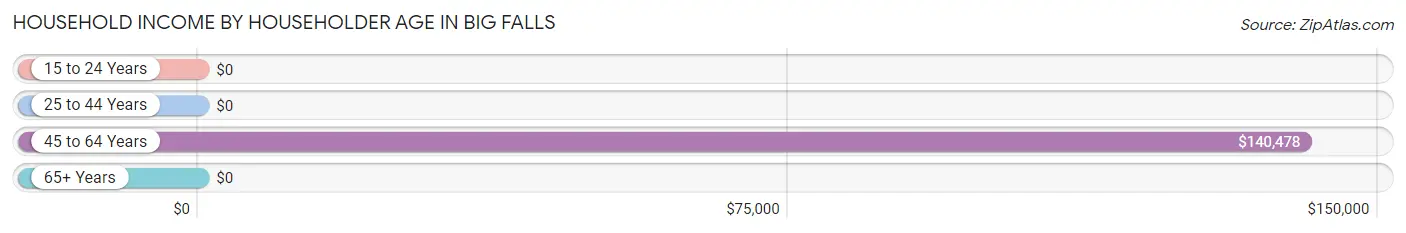
| Income Bracket | # Households | Median Income |
| 15 to 24 Years | 0 (0.0%) | $0 |
| 25 to 44 Years | 0 (0.0%) | $0 |
| 45 to 64 Years | 59 (70.2%) | $140,478 |
| 65+ Years | 25 (29.8%) | $0 |
| Total | 84 (100.0%) | $0 |
Poverty in Big Falls
Income Below Poverty by Sex and Age in Big Falls
With 19.0% poverty level for males and 15.7% for females among the residents of Big Falls, 65 to 74 year old males and 55 to 64 year old females are the most vulnerable to poverty, with 8 males (57.1%) and 6 females (100.0%) in their respective age groups living below the poverty level.
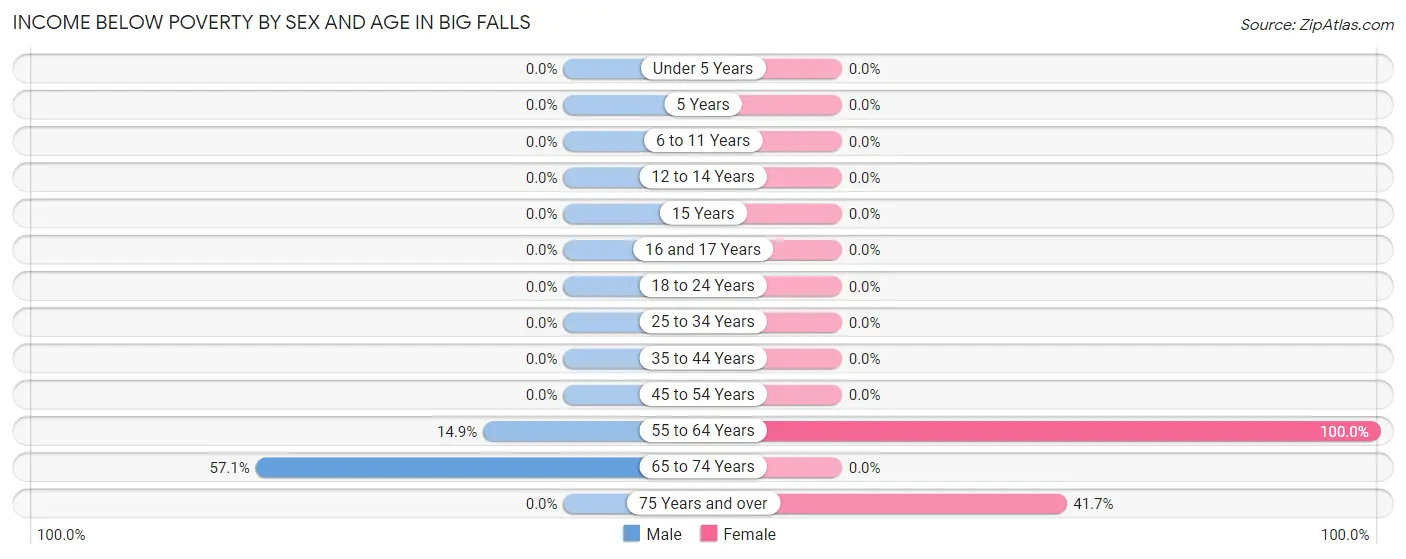
| Age Bracket | Male | Female |
| Under 5 Years | 0 (0.0%) | 0 (0.0%) |
| 5 Years | 0 (0.0%) | 0 (0.0%) |
| 6 to 11 Years | 0 (0.0%) | 0 (0.0%) |
| 12 to 14 Years | 0 (0.0%) | 0 (0.0%) |
| 15 Years | 0 (0.0%) | 0 (0.0%) |
| 16 and 17 Years | 0 (0.0%) | 0 (0.0%) |
| 18 to 24 Years | 0 (0.0%) | 0 (0.0%) |
| 25 to 34 Years | 0 (0.0%) | 0 (0.0%) |
| 35 to 44 Years | 0 (0.0%) | 0 (0.0%) |
| 45 to 54 Years | 0 (0.0%) | 0 (0.0%) |
| 55 to 64 Years | 7 (14.9%) | 6 (100.0%) |
| 65 to 74 Years | 8 (57.1%) | 0 (0.0%) |
| 75 Years and over | 0 (0.0%) | 5 (41.7%) |
| Total | 15 (19.0%) | 11 (15.7%) |
Income Above Poverty by Sex and Age in Big Falls
According to the poverty statistics in Big Falls, males aged 35 to 44 years and females aged 45 to 54 years are the age groups that are most secure financially, with 100.0% of males and 100.0% of females in these age groups living above the poverty line.
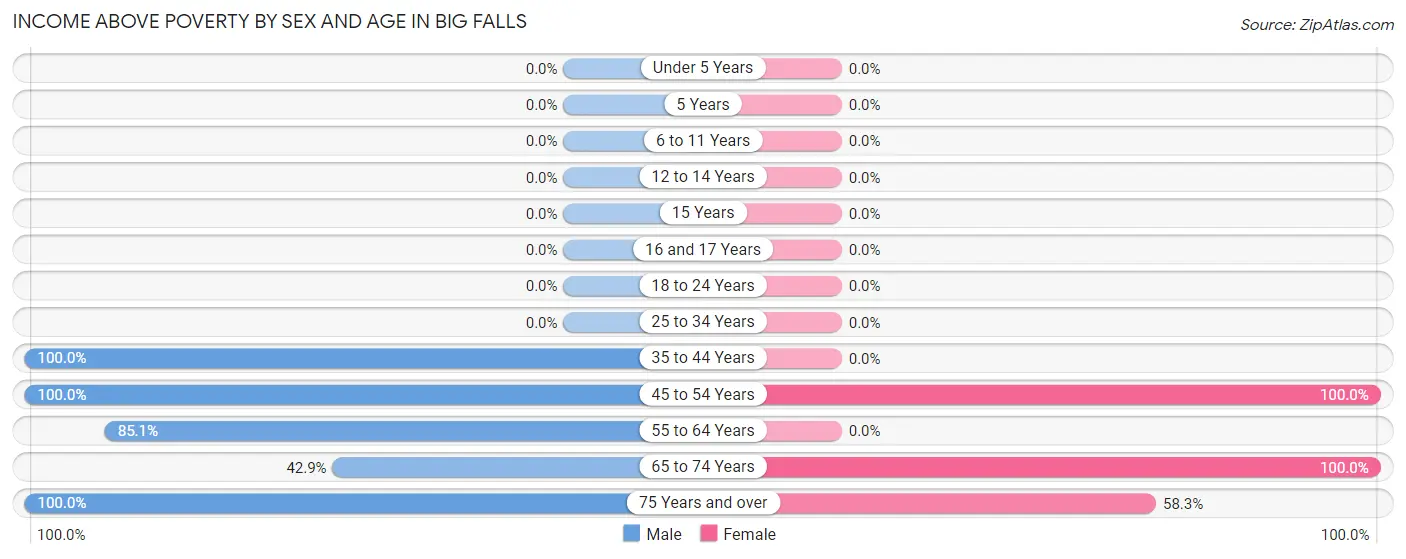
| Age Bracket | Male | Female |
| Under 5 Years | 0 (0.0%) | 0 (0.0%) |
| 5 Years | 0 (0.0%) | 0 (0.0%) |
| 6 to 11 Years | 0 (0.0%) | 0 (0.0%) |
| 12 to 14 Years | 0 (0.0%) | 0 (0.0%) |
| 15 Years | 0 (0.0%) | 0 (0.0%) |
| 16 and 17 Years | 0 (0.0%) | 0 (0.0%) |
| 18 to 24 Years | 0 (0.0%) | 0 (0.0%) |
| 25 to 34 Years | 0 (0.0%) | 0 (0.0%) |
| 35 to 44 Years | 1 (100.0%) | 0 (0.0%) |
| 45 to 54 Years | 12 (100.0%) | 51 (100.0%) |
| 55 to 64 Years | 40 (85.1%) | 0 (0.0%) |
| 65 to 74 Years | 6 (42.9%) | 1 (100.0%) |
| 75 Years and over | 5 (100.0%) | 7 (58.3%) |
| Total | 64 (81.0%) | 59 (84.3%) |
Income Below Poverty Among Married-Couple Families in Big Falls
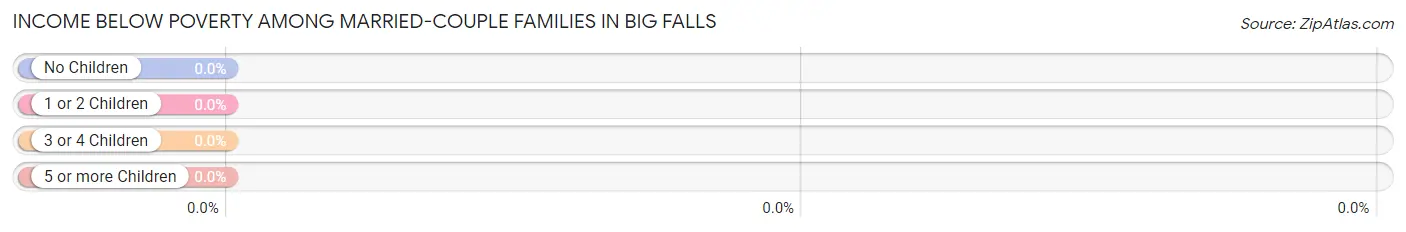
| Children | Above Poverty | Below Poverty |
| No Children | 42 (100.0%) | 0 (0.0%) |
| 1 or 2 Children | 0 (0.0%) | 0 (0.0%) |
| 3 or 4 Children | 0 (0.0%) | 0 (0.0%) |
| 5 or more Children | 0 (0.0%) | 0 (0.0%) |
| Total | 42 (100.0%) | 0 (0.0%) |
Income Below Poverty Among Single-Parent Households in Big Falls
| Children | Single Father | Single Mother |
| No Children | 0 (0.0%) | 0 (0.0%) |
| 1 or 2 Children | 0 (0.0%) | 0 (0.0%) |
| 3 or 4 Children | 0 (0.0%) | 0 (0.0%) |
| 5 or more Children | 0 (0.0%) | 0 (0.0%) |
| Total | 0 (0.0%) | 0 (0.0%) |
Income Below Poverty Among Married-Couple vs Single-Parent Households in Big Falls
| Children | Married-Couple Families | Single-Parent Households |
| No Children | 0 (0.0%) | 0 (0.0%) |
| 1 or 2 Children | 0 (0.0%) | 0 (0.0%) |
| 3 or 4 Children | 0 (0.0%) | 0 (0.0%) |
| 5 or more Children | 0 (0.0%) | 0 (0.0%) |
| Total | 0 (0.0%) | 0 (0.0%) |
Race in Big Falls
The most populous races in Big Falls are White / Caucasian (141 | 94.6%), Hispanic or Latino (8 | 5.4%), and Some other Race (8 | 5.4%).
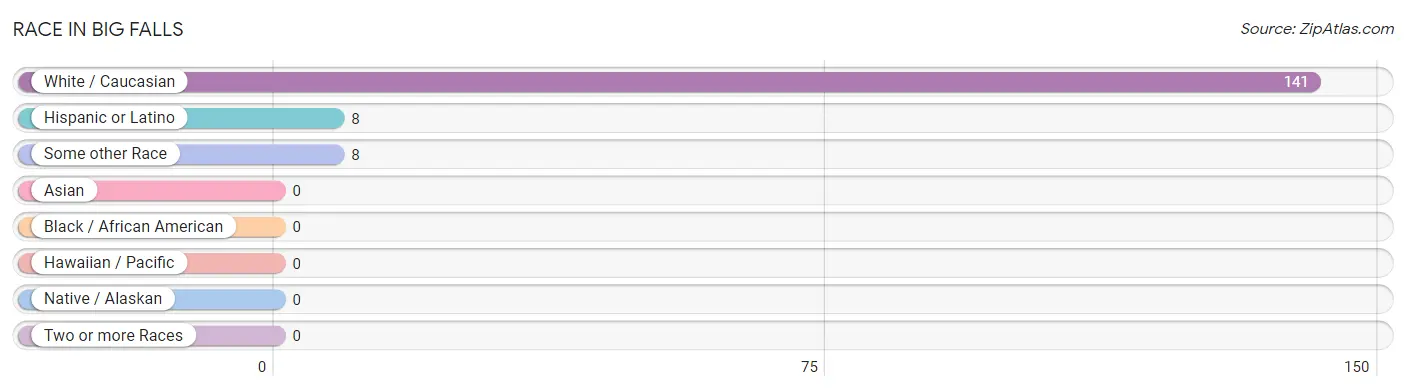
| Race | # Population | % Population |
| Asian | 0 | 0.0% |
| Black / African American | 0 | 0.0% |
| Hawaiian / Pacific | 0 | 0.0% |
| Hispanic or Latino | 8 | 5.4% |
| Native / Alaskan | 0 | 0.0% |
| White / Caucasian | 141 | 94.6% |
| Two or more Races | 0 | 0.0% |
| Some other Race | 8 | 5.4% |
| Total | 149 | 100.0% |
Ancestry in Big Falls
The most populous ancestries reported in Big Falls are Norwegian (92 | 61.7%), German (25 | 16.8%), Mexican (8 | 5.4%), Polish (7 | 4.7%), and Russian (5 | 3.4%), together accounting for 91.9% of all Big Falls residents.
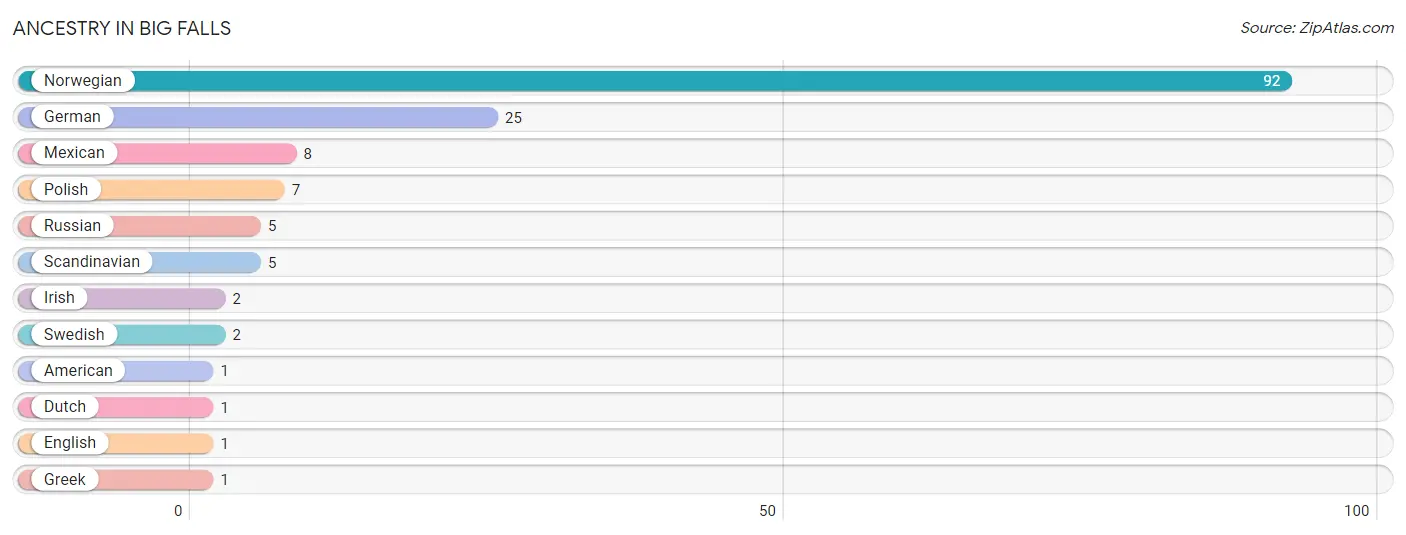
| Ancestry | # Population | % Population |
| American | 1 | 0.7% |
| Dutch | 1 | 0.7% |
| English | 1 | 0.7% |
| German | 25 | 16.8% |
| Greek | 1 | 0.7% |
| Irish | 2 | 1.3% |
| Mexican | 8 | 5.4% |
| Norwegian | 92 | 61.7% |
| Polish | 7 | 4.7% |
| Russian | 5 | 3.4% |
| Scandinavian | 5 | 3.4% |
| Swedish | 2 | 1.3% | View All 12 Rows |
Immigrants in Big Falls

| Immigration Origin | # Population | % Population | View All 0 Rows |
Sex and Age in Big Falls
Sex and Age in Big Falls
The most populous age groups in Big Falls are 60 to 64 Years (43 | 54.4%) for men and 50 to 54 Years (51 | 72.9%) for women.
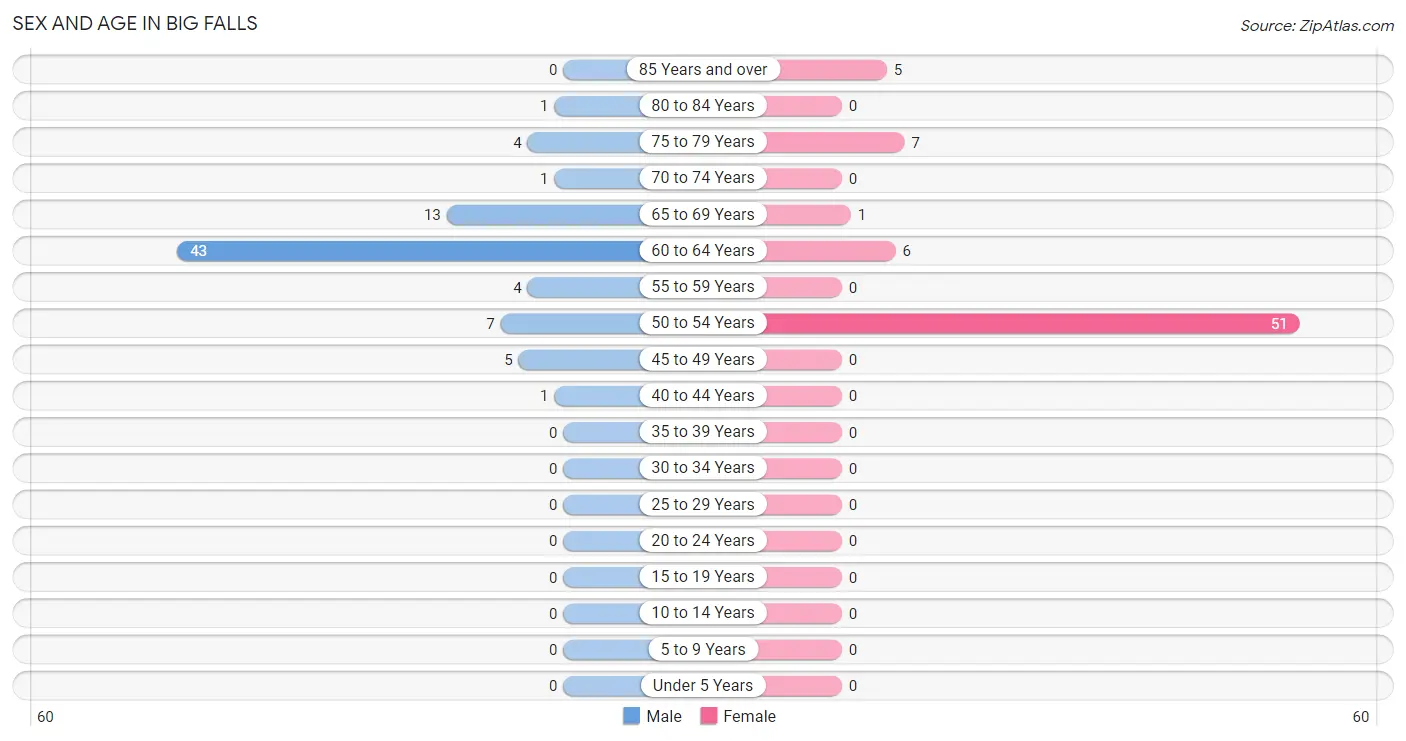
| Age Bracket | Male | Female |
| Under 5 Years | 0 (0.0%) | 0 (0.0%) |
| 5 to 9 Years | 0 (0.0%) | 0 (0.0%) |
| 10 to 14 Years | 0 (0.0%) | 0 (0.0%) |
| 15 to 19 Years | 0 (0.0%) | 0 (0.0%) |
| 20 to 24 Years | 0 (0.0%) | 0 (0.0%) |
| 25 to 29 Years | 0 (0.0%) | 0 (0.0%) |
| 30 to 34 Years | 0 (0.0%) | 0 (0.0%) |
| 35 to 39 Years | 0 (0.0%) | 0 (0.0%) |
| 40 to 44 Years | 1 (1.3%) | 0 (0.0%) |
| 45 to 49 Years | 5 (6.3%) | 0 (0.0%) |
| 50 to 54 Years | 7 (8.9%) | 51 (72.9%) |
| 55 to 59 Years | 4 (5.1%) | 0 (0.0%) |
| 60 to 64 Years | 43 (54.4%) | 6 (8.6%) |
| 65 to 69 Years | 13 (16.5%) | 1 (1.4%) |
| 70 to 74 Years | 1 (1.3%) | 0 (0.0%) |
| 75 to 79 Years | 4 (5.1%) | 7 (10.0%) |
| 80 to 84 Years | 1 (1.3%) | 0 (0.0%) |
| 85 Years and over | 0 (0.0%) | 5 (7.1%) |
| Total | 79 (100.0%) | 70 (100.0%) |
Families and Households in Big Falls
Median Family Size in Big Falls
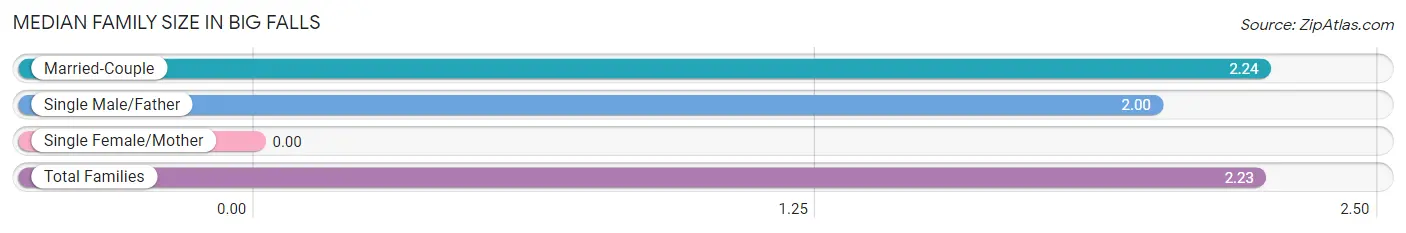
| Family Type | # Families | Family Size |
| Married-Couple | 42 (97.7%) | 2.24 |
| Single Male/Father | 1 (2.3%) | 2.00 |
| Single Female/Mother | 0 (0.0%) | - |
| Total Families | 43 (100.0%) | 2.23 |
Median Household Size in Big Falls
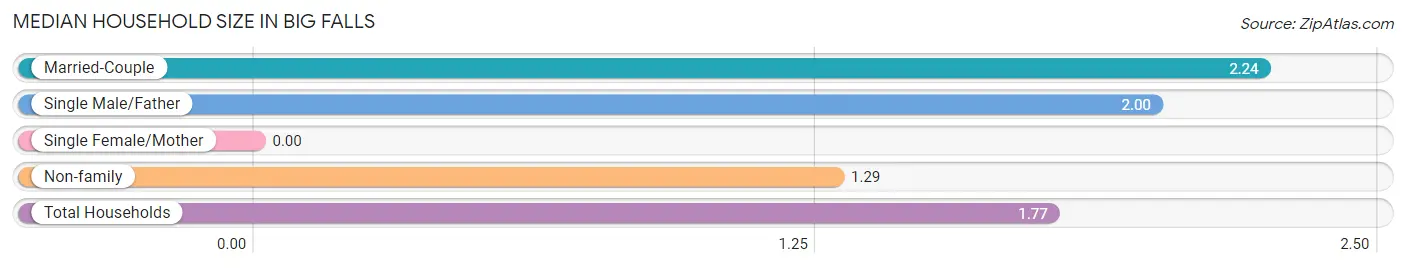
| Household Type | # Households | Household Size |
| Married-Couple | 42 (50.0%) | 2.24 |
| Single Male/Father | 1 (1.2%) | 2.00 |
| Single Female/Mother | 0 (0.0%) | - |
| Non-family | 41 (48.8%) | 1.29 |
| Total Households | 84 (100.0%) | 1.77 |
Household Size by Marriage Status in Big Falls
Out of a total of 84 households in Big Falls, 43 (51.2%) are family households, while 41 (48.8%) are nonfamily households. The most numerous type of family households are 2-person households, comprising 43, and the most common type of nonfamily households are 1-person households, comprising 30.
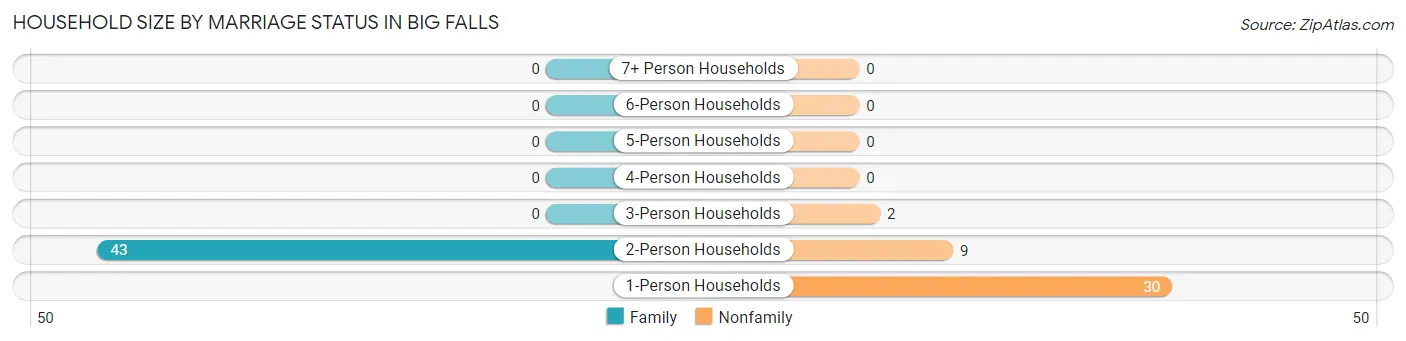
| Household Size | Family Households | Nonfamily Households |
| 1-Person Households | - | 30 (35.7%) |
| 2-Person Households | 43 (51.2%) | 9 (10.7%) |
| 3-Person Households | 0 (0.0%) | 2 (2.4%) |
| 4-Person Households | 0 (0.0%) | 0 (0.0%) |
| 5-Person Households | 0 (0.0%) | 0 (0.0%) |
| 6-Person Households | 0 (0.0%) | 0 (0.0%) |
| 7+ Person Households | 0 (0.0%) | 0 (0.0%) |
| Total | 43 (51.2%) | 41 (48.8%) |
Female Fertility in Big Falls
Fertility by Age in Big Falls
| Age Bracket | Women with Births | Births / 1,000 Women |
| 15 to 19 years | 0 (0.0%) | 0.0 |
| 20 to 34 years | 0 (0.0%) | 0.0 |
| 35 to 50 years | 0 (0.0%) | 0.0 |
| Total | 0 (0.0%) | 0.0 |
Fertility by Age by Marriage Status in Big Falls
| Age Bracket | Married | Unmarried |
| 15 to 19 years | 0 (0.0%) | 0 (0.0%) |
| 20 to 34 years | 0 (0.0%) | 0 (0.0%) |
| 35 to 50 years | 0 (0.0%) | 0 (0.0%) |
| Total | 0 (0.0%) | 0 (0.0%) |
Fertility by Education in Big Falls
| Educational Attainment | Women with Births | Births / 1,000 Women |
| Less than High School | 0 (0.0%) | 0.0 |
| High School Diploma | 0 (0.0%) | 0.0 |
| College or Associate's Degree | 0 (0.0%) | 0.0 |
| Bachelor's Degree | 0 (0.0%) | 0.0 |
| Graduate Degree | 0 (0.0%) | 0.0 |
| Total | 0 (0.0%) | 0.0 |
Fertility by Education by Marriage Status in Big Falls
| Educational Attainment | Married | Unmarried |
| Less than High School | 0 (0.0%) | 0 (0.0%) |
| High School Diploma | 0 (0.0%) | 0 (0.0%) |
| College or Associate's Degree | 0 (0.0%) | 0 (0.0%) |
| Bachelor's Degree | 0 (0.0%) | 0 (0.0%) |
| Graduate Degree | 0 (0.0%) | 0 (0.0%) |
| Total | 0 (0.0%) | 0 (0.0%) |
Employment Characteristics in Big Falls
Employment by Class of Employer in Big Falls
Among the 97 employed individuals in Big Falls, private company employees (91 | 93.8%), local government employees (4 | 4.1%), and not-for-profit organizations (2 | 2.1%) make up the most common classes of employment.
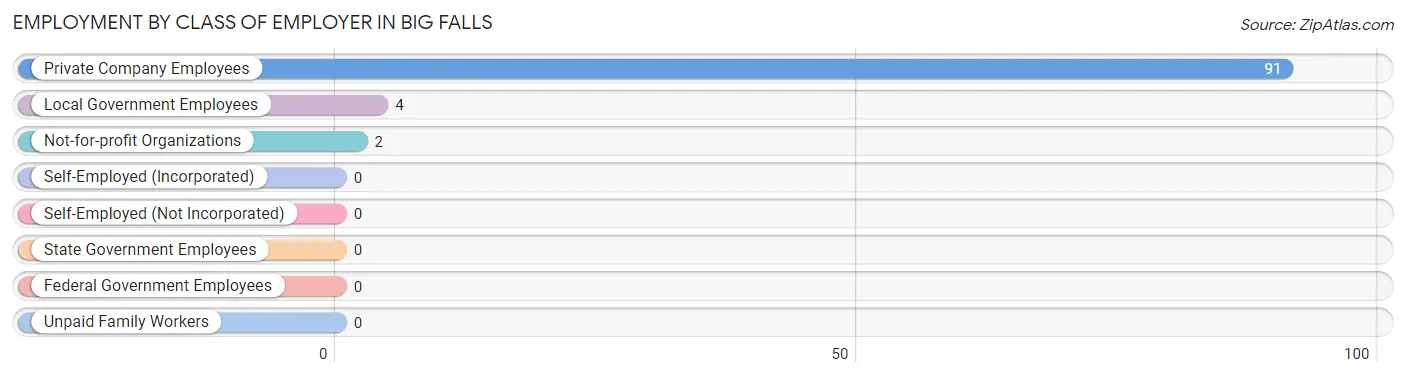
| Employer Class | # Employees | % Employees |
| Private Company Employees | 91 | 93.8% |
| Self-Employed (Incorporated) | 0 | 0.0% |
| Self-Employed (Not Incorporated) | 0 | 0.0% |
| Not-for-profit Organizations | 2 | 2.1% |
| Local Government Employees | 4 | 4.1% |
| State Government Employees | 0 | 0.0% |
| Federal Government Employees | 0 | 0.0% |
| Unpaid Family Workers | 0 | 0.0% |
| Total | 97 | 100.0% |
Employment Status by Age in Big Falls
According to the labor force statistics for Big Falls, out of the total population over 16 years of age (149), 67.8% or 101 individuals are in the labor force, with 4.0% or 4 of them unemployed. The age group with the highest labor force participation rate is 35 to 44 years, with 100.0% or 1 individuals in the labor force. Within the labor force, the 60 to 64 years age range has the highest percentage of unemployed individuals, with 10.0% or 4 of them being unemployed.
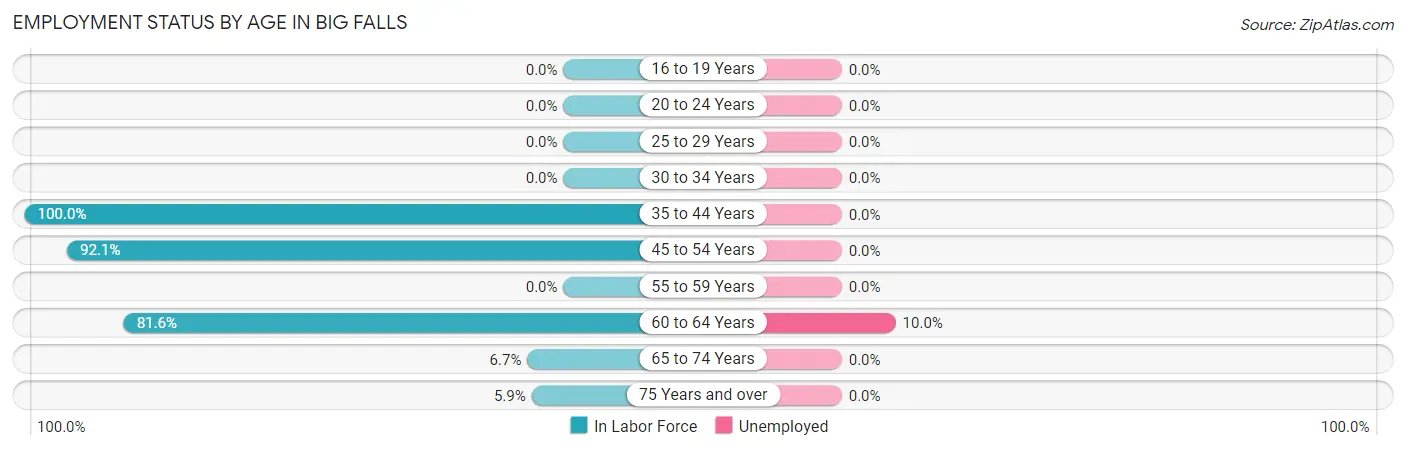
| Age Bracket | In Labor Force | Unemployed |
| 16 to 19 Years | 0 (0.0%) | 0 (0.0%) |
| 20 to 24 Years | 0 (0.0%) | 0 (0.0%) |
| 25 to 29 Years | 0 (0.0%) | 0 (0.0%) |
| 30 to 34 Years | 0 (0.0%) | 0 (0.0%) |
| 35 to 44 Years | 1 (100.0%) | 0 (0.0%) |
| 45 to 54 Years | 58 (92.1%) | 0 (0.0%) |
| 55 to 59 Years | 0 (0.0%) | 0 (0.0%) |
| 60 to 64 Years | 40 (81.6%) | 4 (10.0%) |
| 65 to 74 Years | 1 (6.7%) | 0 (0.0%) |
| 75 Years and over | 1 (5.9%) | 0 (0.0%) |
| Total | 101 (67.8%) | 4 (4.0%) |
Employment Status by Educational Attainment in Big Falls
According to labor force statistics for Big Falls, 84.6% of individuals (99) out of the total population between 25 and 64 years of age (117) are in the labor force, with 4.0% or 4 of them being unemployed. The group with the highest labor force participation rate are those with the educational attainment of bachelor's degree or higher, with 100.0% or 49 individuals in the labor force. Within the labor force, individuals with high school diploma education have the highest percentage of unemployment, with 4.4% or 2 of them being unemployed.
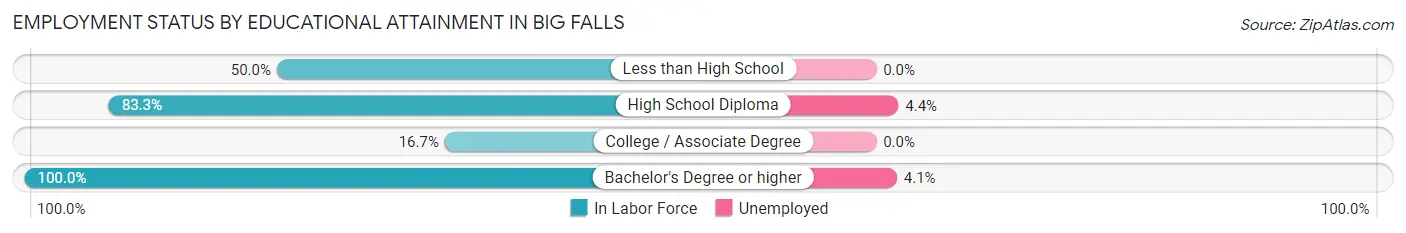
| Educational Attainment | In Labor Force | Unemployed |
| Less than High School | 4 (50.0%) | 0 (0.0%) |
| High School Diploma | 45 (83.3%) | 2 (4.4%) |
| College / Associate Degree | 1 (16.7%) | 0 (0.0%) |
| Bachelor's Degree or higher | 49 (100.0%) | 2 (4.1%) |
| Total | 99 (84.6%) | 5 (4.0%) |
Employment Occupations by Sex in Big Falls
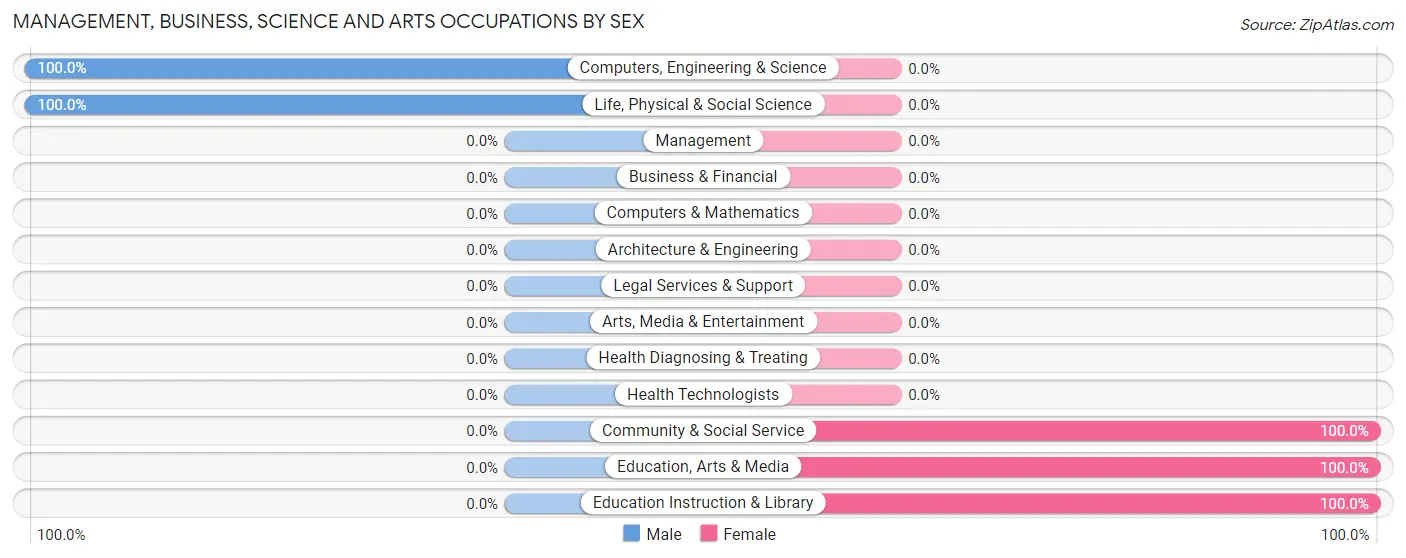
Management, Business, Science and Arts Occupations
The most common Management, Business, Science and Arts occupations in Big Falls are Community & Social Service (5 | 5.1%), Education Instruction & Library (4 | 4.1%), Computers, Engineering & Science (1 | 1.0%), Life, Physical & Social Science (1 | 1.0%), and Education, Arts & Media (1 | 1.0%).
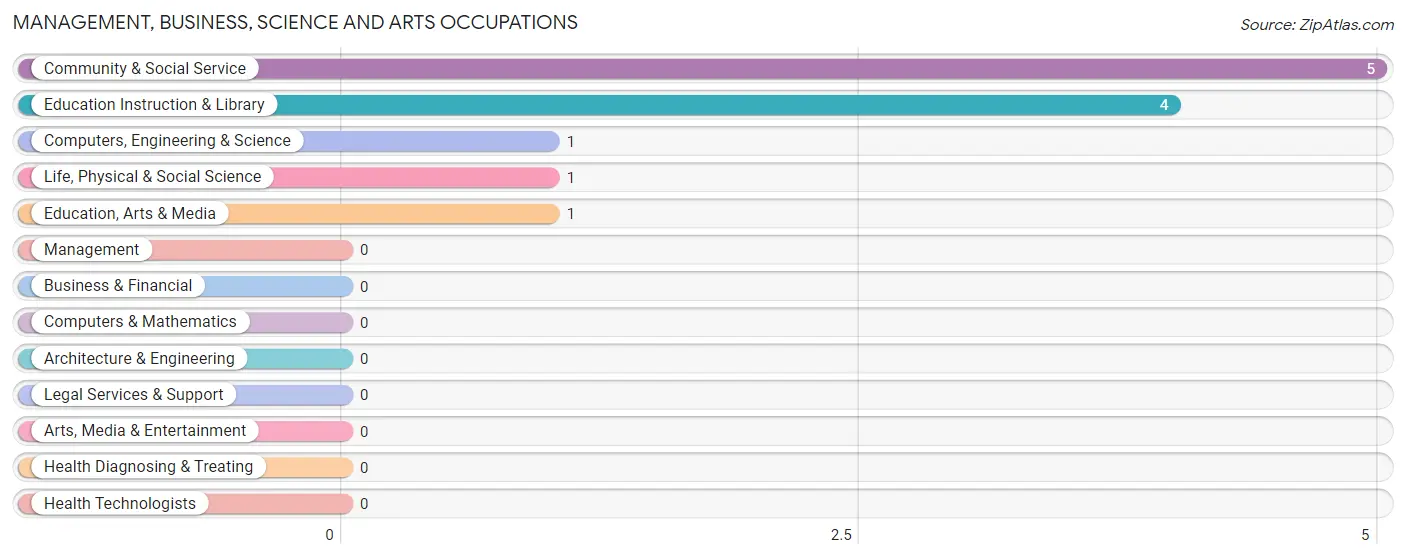
Management, Business, Science and Arts Occupations by Sex
Within the Management, Business, Science and Arts occupations in Big Falls, the most male-oriented occupations are Computers, Engineering & Science (100.0%), and Life, Physical & Social Science (100.0%), while the most female-oriented occupations are Community & Social Service (100.0%), Education, Arts & Media (100.0%), and Education Instruction & Library (100.0%).
| Occupation | Male | Female |
| Management | 0 (0.0%) | 0 (0.0%) |
| Business & Financial | 0 (0.0%) | 0 (0.0%) |
| Computers, Engineering & Science | 1 (100.0%) | 0 (0.0%) |
| Computers & Mathematics | 0 (0.0%) | 0 (0.0%) |
| Architecture & Engineering | 0 (0.0%) | 0 (0.0%) |
| Life, Physical & Social Science | 1 (100.0%) | 0 (0.0%) |
| Community & Social Service | 0 (0.0%) | 5 (100.0%) |
| Education, Arts & Media | 0 (0.0%) | 1 (100.0%) |
| Legal Services & Support | 0 (0.0%) | 0 (0.0%) |
| Education Instruction & Library | 0 (0.0%) | 4 (100.0%) |
| Arts, Media & Entertainment | 0 (0.0%) | 0 (0.0%) |
| Health Diagnosing & Treating | 0 (0.0%) | 0 (0.0%) |
| Health Technologists | 0 (0.0%) | 0 (0.0%) |
| Total (Category) | 1 (16.7%) | 5 (83.3%) |
| Total (Overall) | 45 (46.4%) | 52 (53.6%) |
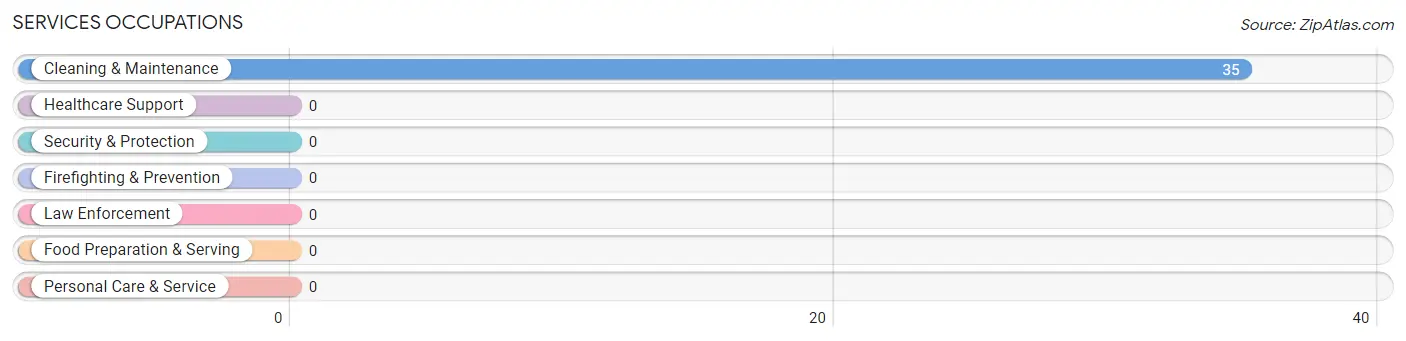
Services Occupations
The most common Services occupations in Big Falls are , and Cleaning & Maintenance (35 | 36.1%).
Services Occupations by Sex
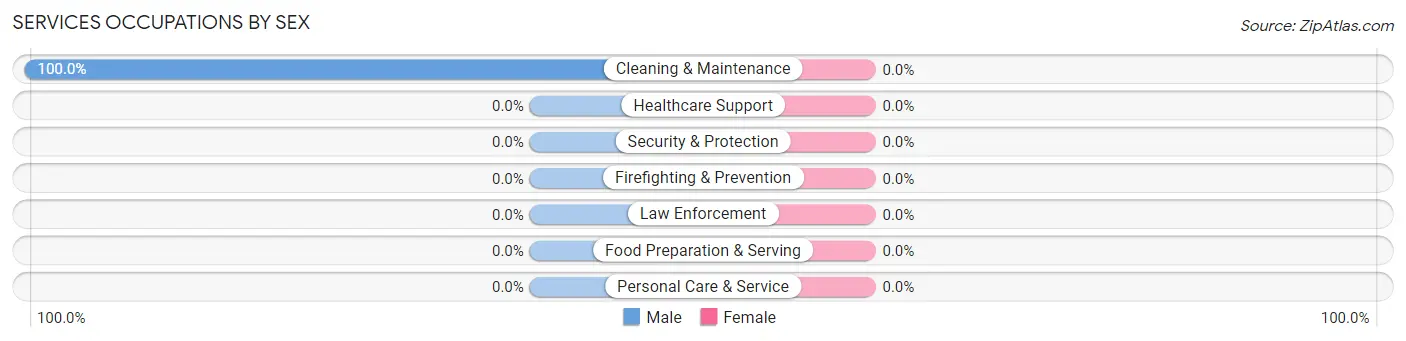
| Occupation | Male | Female |
| Healthcare Support | 0 (0.0%) | 0 (0.0%) |
| Security & Protection | 0 (0.0%) | 0 (0.0%) |
| Firefighting & Prevention | 0 (0.0%) | 0 (0.0%) |
| Law Enforcement | 0 (0.0%) | 0 (0.0%) |
| Food Preparation & Serving | 0 (0.0%) | 0 (0.0%) |
| Cleaning & Maintenance | 35 (100.0%) | 0 (0.0%) |
| Personal Care & Service | 0 (0.0%) | 0 (0.0%) |
| Total (Category) | 35 (100.0%) | 0 (0.0%) |
| Total (Overall) | 45 (46.4%) | 52 (53.6%) |
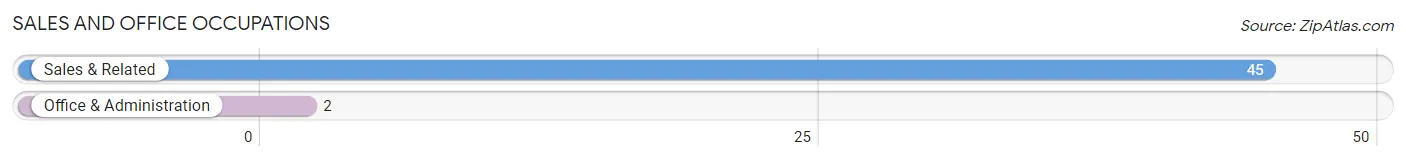
Sales and Office Occupations
The most common Sales and Office occupations in Big Falls are Sales & Related (45 | 46.4%), and Office & Administration (2 | 2.1%).
Sales and Office Occupations by Sex
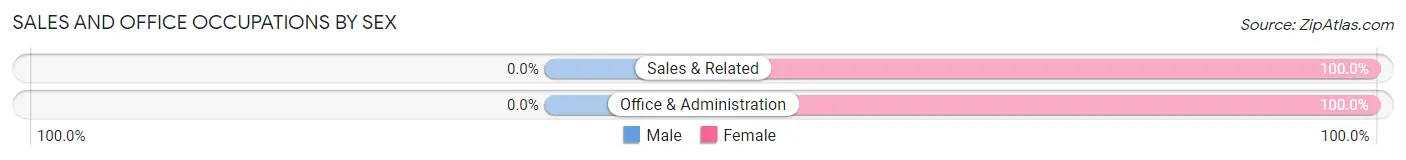
| Occupation | Male | Female |
| Sales & Related | 0 (0.0%) | 45 (100.0%) |
| Office & Administration | 0 (0.0%) | 2 (100.0%) |
| Total (Category) | 0 (0.0%) | 47 (100.0%) |
| Total (Overall) | 45 (46.4%) | 52 (53.6%) |
Natural Resources, Construction and Maintenance Occupations
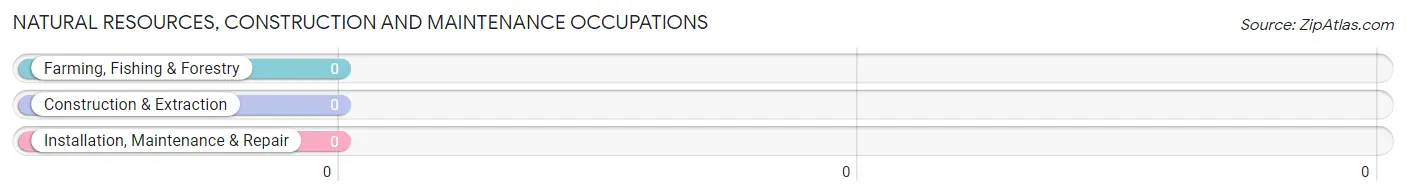
Natural Resources, Construction and Maintenance Occupations by Sex
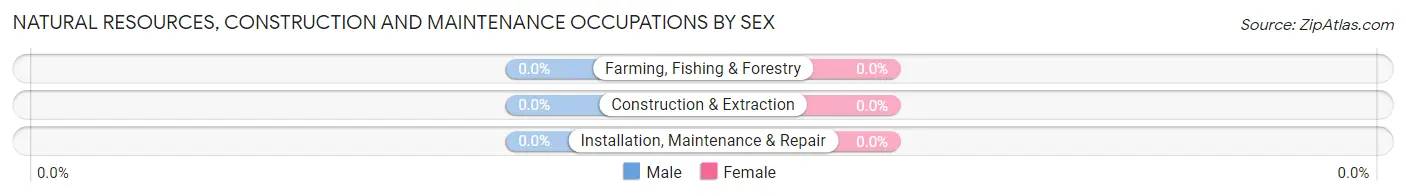
| Occupation | Male | Female |
| Farming, Fishing & Forestry | 0 (0.0%) | 0 (0.0%) |
| Construction & Extraction | 0 (0.0%) | 0 (0.0%) |
| Installation, Maintenance & Repair | 0 (0.0%) | 0 (0.0%) |
| Total (Category) | 0 (0.0%) | 0 (0.0%) |
| Total (Overall) | 45 (46.4%) | 52 (53.6%) |
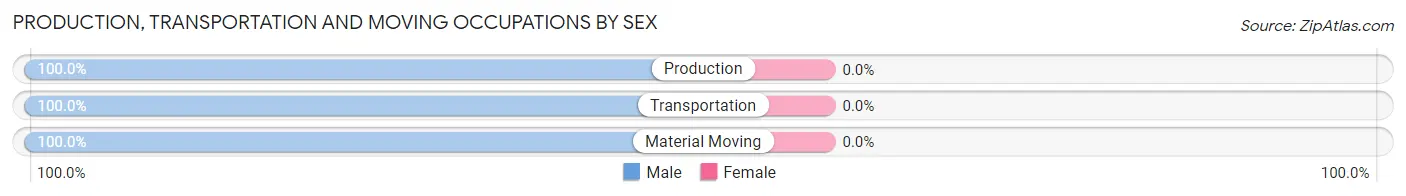
Production, Transportation and Moving Occupations
The most common Production, Transportation and Moving occupations in Big Falls are Production (4 | 4.1%), Transportation (3 | 3.1%), and Material Moving (2 | 2.1%).
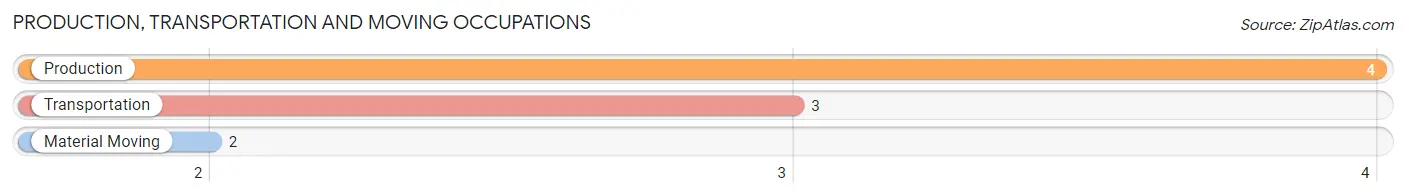
Production, Transportation and Moving Occupations by Sex
| Occupation | Male | Female |
| Production | 4 (100.0%) | 0 (0.0%) |
| Transportation | 3 (100.0%) | 0 (0.0%) |
| Material Moving | 2 (100.0%) | 0 (0.0%) |
| Total (Category) | 9 (100.0%) | 0 (0.0%) |
| Total (Overall) | 45 (46.4%) | 52 (53.6%) |
Employment Industries by Sex in Big Falls
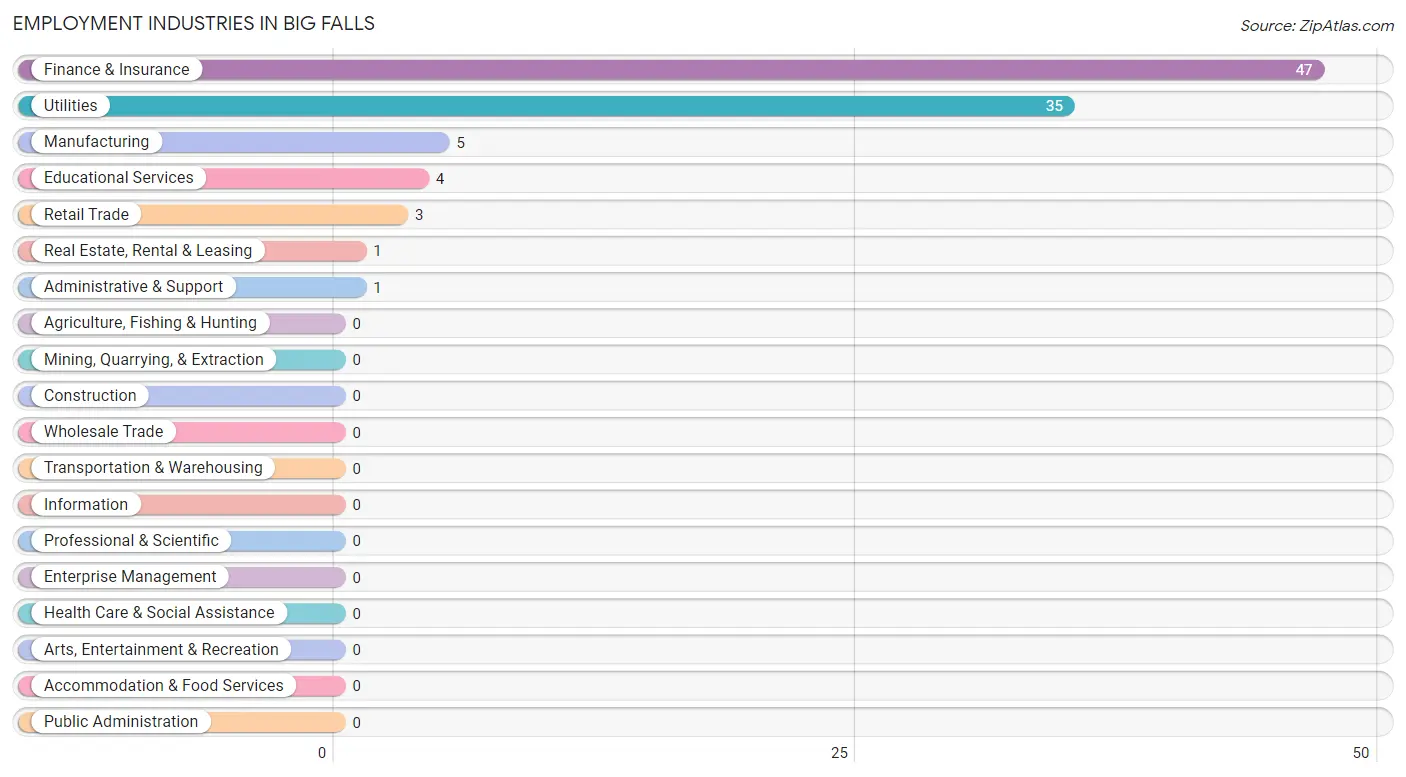
Employment Industries in Big Falls
The major employment industries in Big Falls include Finance & Insurance (47 | 48.4%), Utilities (35 | 36.1%), Manufacturing (5 | 5.1%), Educational Services (4 | 4.1%), and Retail Trade (3 | 3.1%).
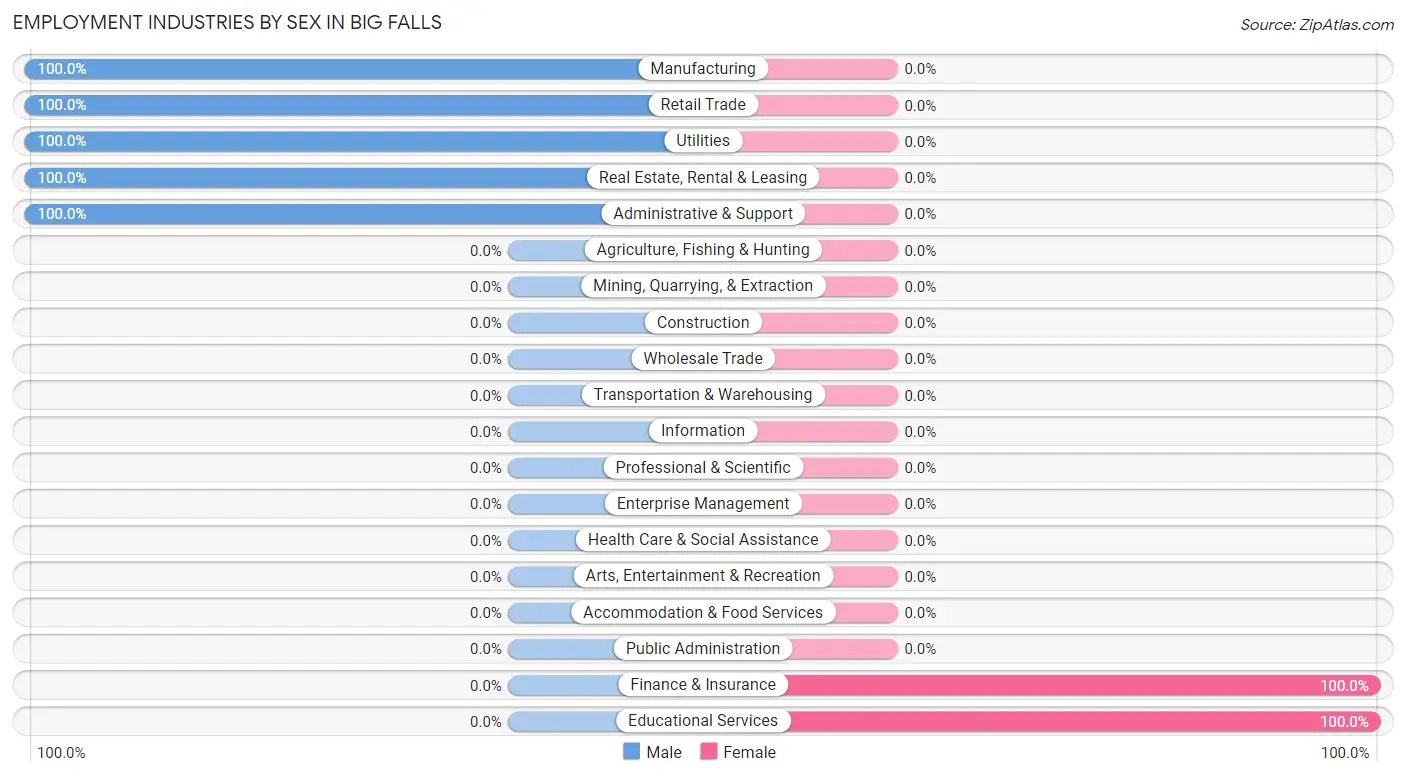
Employment Industries by Sex in Big Falls
The Big Falls industries that see more men than women are Manufacturing (100.0%), Retail Trade (100.0%), and Utilities (100.0%), whereas the industries that tend to have a higher number of women are Finance & Insurance (100.0%), and Educational Services (100.0%).
| Industry | Male | Female |
| Agriculture, Fishing & Hunting | 0 (0.0%) | 0 (0.0%) |
| Mining, Quarrying, & Extraction | 0 (0.0%) | 0 (0.0%) |
| Construction | 0 (0.0%) | 0 (0.0%) |
| Manufacturing | 5 (100.0%) | 0 (0.0%) |
| Wholesale Trade | 0 (0.0%) | 0 (0.0%) |
| Retail Trade | 3 (100.0%) | 0 (0.0%) |
| Transportation & Warehousing | 0 (0.0%) | 0 (0.0%) |
| Utilities | 35 (100.0%) | 0 (0.0%) |
| Information | 0 (0.0%) | 0 (0.0%) |
| Finance & Insurance | 0 (0.0%) | 47 (100.0%) |
| Real Estate, Rental & Leasing | 1 (100.0%) | 0 (0.0%) |
| Professional & Scientific | 0 (0.0%) | 0 (0.0%) |
| Enterprise Management | 0 (0.0%) | 0 (0.0%) |
| Administrative & Support | 1 (100.0%) | 0 (0.0%) |
| Educational Services | 0 (0.0%) | 4 (100.0%) |
| Health Care & Social Assistance | 0 (0.0%) | 0 (0.0%) |
| Arts, Entertainment & Recreation | 0 (0.0%) | 0 (0.0%) |
| Accommodation & Food Services | 0 (0.0%) | 0 (0.0%) |
| Public Administration | 0 (0.0%) | 0 (0.0%) |
| Total | 45 (46.4%) | 52 (53.6%) |
Education in Big Falls
School Enrollment in Big Falls
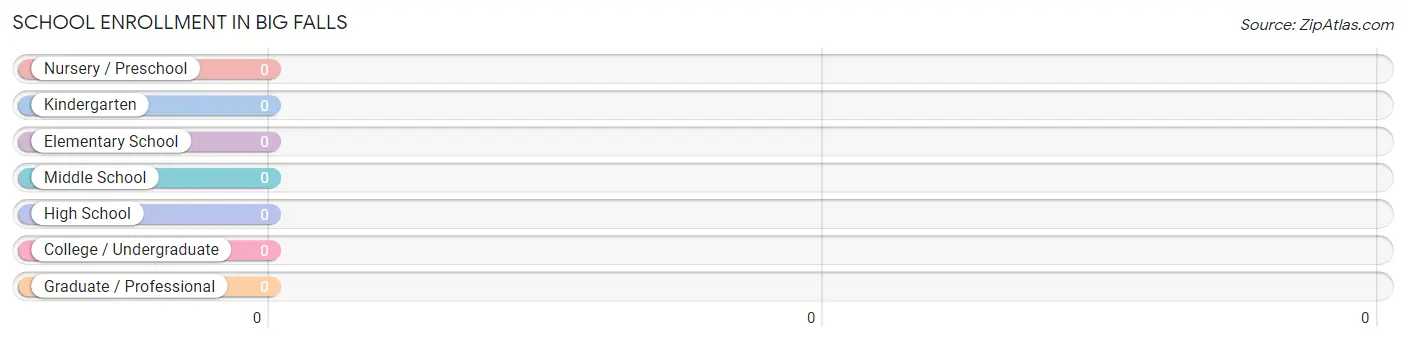
| School Level | # Students | % Students |
| Nursery / Preschool | 0 | 0.0% |
| Kindergarten | 0 | 0.0% |
| Elementary School | 0 | 0.0% |
| Middle School | 0 | 0.0% |
| High School | 0 | 0.0% |
| College / Undergraduate | 0 | 0.0% |
| Graduate / Professional | 0 | 0.0% |
| Total | 0 | 0.0% |
School Enrollment by Age by Funding Source in Big Falls
| Age Bracket | Public School | Private School |
| 3 to 4 Year Olds | 0 (0.0%) | 0 (0.0%) |
| 5 to 9 Year Old | 0 (0.0%) | 0 (0.0%) |
| 10 to 14 Year Olds | 0 (0.0%) | 0 (0.0%) |
| 15 to 17 Year Olds | 0 (0.0%) | 0 (0.0%) |
| 18 to 19 Year Olds | 0 (0.0%) | 0 (0.0%) |
| 20 to 24 Year Olds | 0 (0.0%) | 0 (0.0%) |
| 25 to 34 Year Olds | 0 (0.0%) | 0 (0.0%) |
| 35 Years and over | 0 (0.0%) | 0 (0.0%) |
| Total | 0 (0.0%) | 0 (0.0%) |
Educational Attainment by Field of Study in Big Falls
Business (50 | 92.6%), engineering (2 | 3.7%), and education (2 | 3.7%) are the most common fields of study among 54 individuals in Big Falls who have obtained a bachelor's degree or higher.
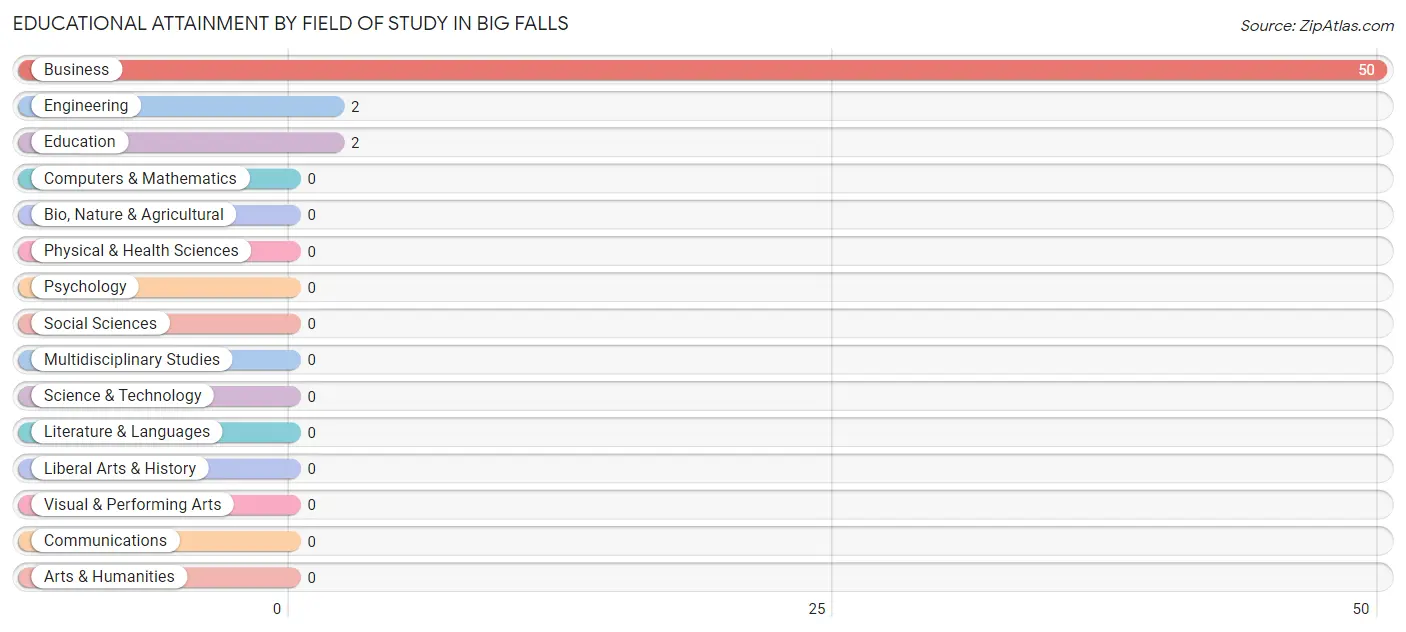
| Field of Study | # Graduates | % Graduates |
| Computers & Mathematics | 0 | 0.0% |
| Bio, Nature & Agricultural | 0 | 0.0% |
| Physical & Health Sciences | 0 | 0.0% |
| Psychology | 0 | 0.0% |
| Social Sciences | 0 | 0.0% |
| Engineering | 2 | 3.7% |
| Multidisciplinary Studies | 0 | 0.0% |
| Science & Technology | 0 | 0.0% |
| Business | 50 | 92.6% |
| Education | 2 | 3.7% |
| Literature & Languages | 0 | 0.0% |
| Liberal Arts & History | 0 | 0.0% |
| Visual & Performing Arts | 0 | 0.0% |
| Communications | 0 | 0.0% |
| Arts & Humanities | 0 | 0.0% |
| Total | 54 | 100.0% |
Transportation & Commute in Big Falls
Vehicle Availability by Sex in Big Falls
The most prevalent vehicle ownership categories in Big Falls are males with 3 vehicles (39, accounting for 86.7%) and females with 3 vehicles (49, making up 75.0%).
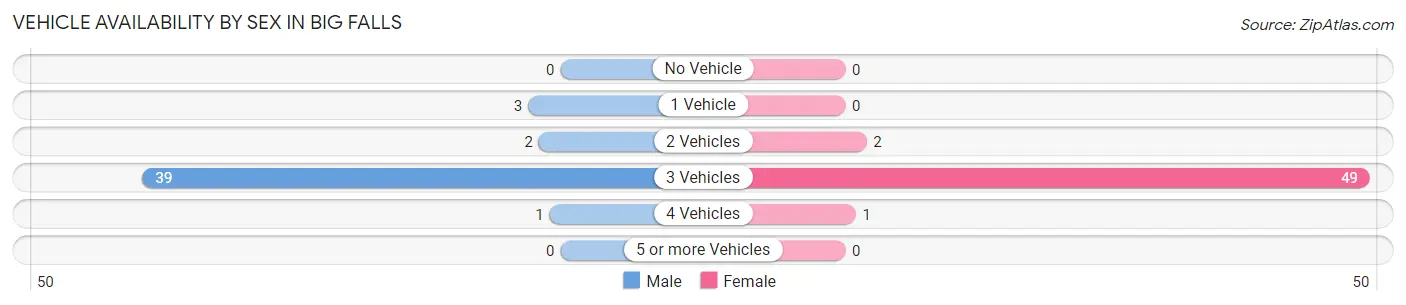
| Vehicles Available | Male | Female |
| No Vehicle | 0 (0.0%) | 0 (0.0%) |
| 1 Vehicle | 3 (6.7%) | 0 (0.0%) |
| 2 Vehicles | 2 (4.4%) | 2 (3.8%) |
| 3 Vehicles | 39 (86.7%) | 49 (94.2%) |
| 4 Vehicles | 1 (2.2%) | 1 (1.9%) |
| 5 or more Vehicles | 0 (0.0%) | 0 (0.0%) |
| Total | 45 (100.0%) | 52 (100.0%) |
Commute Time in Big Falls
The most frequently occuring commute durations in Big Falls are less than 5 minutes (46 commuters, 48.4%), 60 to 89 minutes (34 commuters, 35.8%), and 15 to 19 minutes (8 commuters, 8.4%).
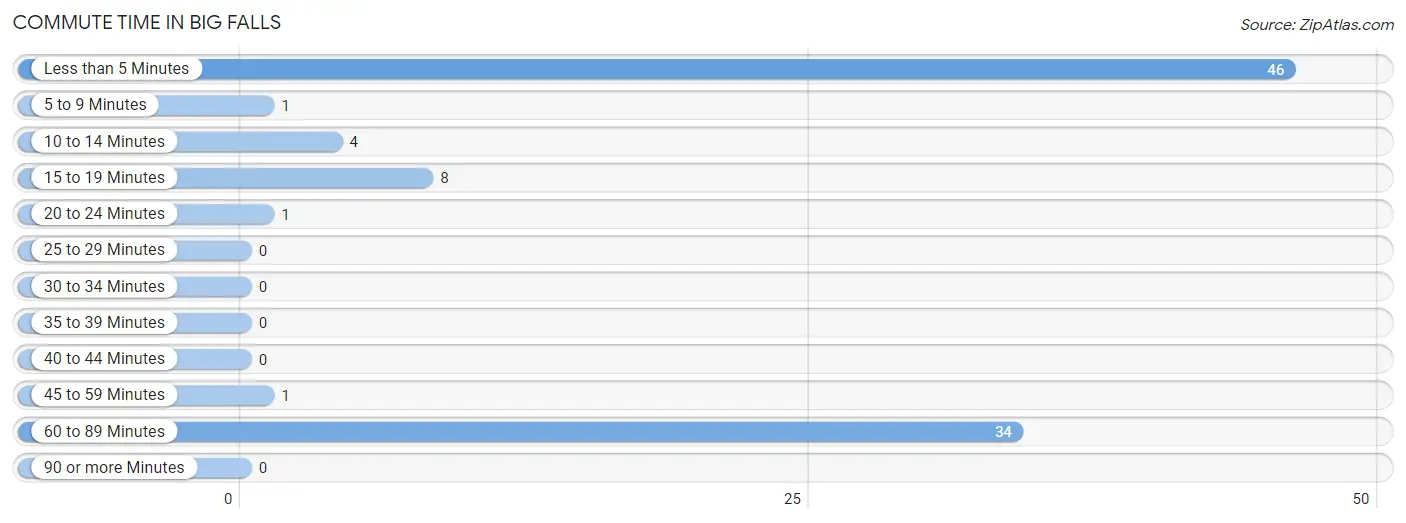
| Commute Time | # Commuters | % Commuters |
| Less than 5 Minutes | 46 | 48.4% |
| 5 to 9 Minutes | 1 | 1.1% |
| 10 to 14 Minutes | 4 | 4.2% |
| 15 to 19 Minutes | 8 | 8.4% |
| 20 to 24 Minutes | 1 | 1.1% |
| 25 to 29 Minutes | 0 | 0.0% |
| 30 to 34 Minutes | 0 | 0.0% |
| 35 to 39 Minutes | 0 | 0.0% |
| 40 to 44 Minutes | 0 | 0.0% |
| 45 to 59 Minutes | 1 | 1.1% |
| 60 to 89 Minutes | 34 | 35.8% |
| 90 or more Minutes | 0 | 0.0% |
Commute Time by Sex in Big Falls
The most common commute times in Big Falls are 60 to 89 minutes (34 commuters, 75.6%) for males and less than 5 minutes (45 commuters, 90.0%) for females.
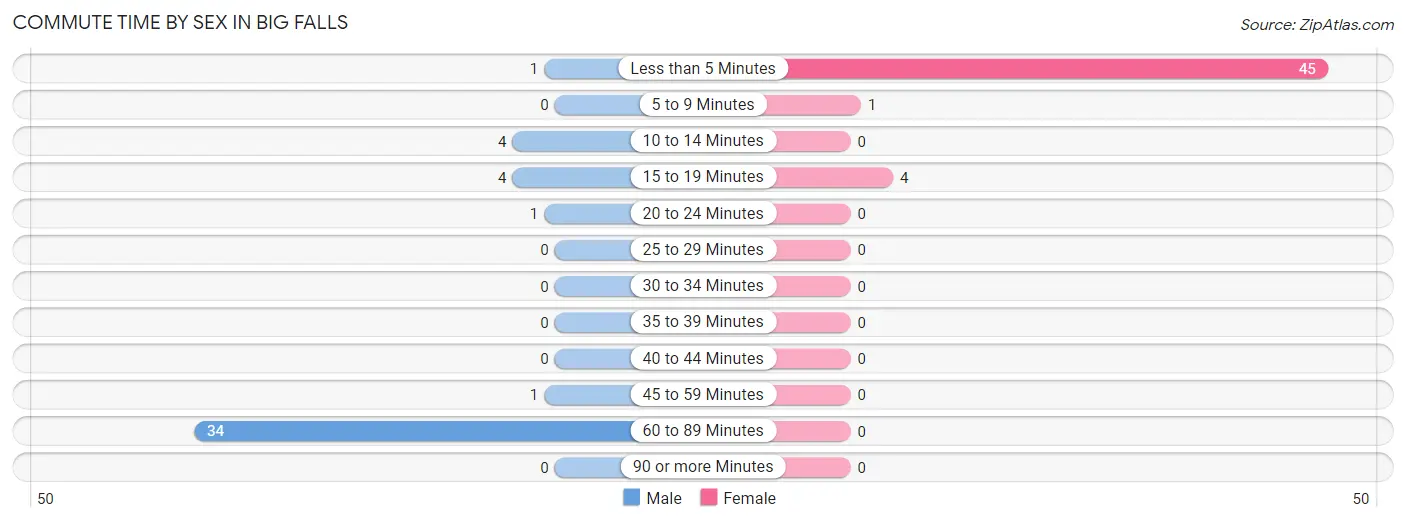
| Commute Time | Male | Female |
| Less than 5 Minutes | 1 (2.2%) | 45 (90.0%) |
| 5 to 9 Minutes | 0 (0.0%) | 1 (2.0%) |
| 10 to 14 Minutes | 4 (8.9%) | 0 (0.0%) |
| 15 to 19 Minutes | 4 (8.9%) | 4 (8.0%) |
| 20 to 24 Minutes | 1 (2.2%) | 0 (0.0%) |
| 25 to 29 Minutes | 0 (0.0%) | 0 (0.0%) |
| 30 to 34 Minutes | 0 (0.0%) | 0 (0.0%) |
| 35 to 39 Minutes | 0 (0.0%) | 0 (0.0%) |
| 40 to 44 Minutes | 0 (0.0%) | 0 (0.0%) |
| 45 to 59 Minutes | 1 (2.2%) | 0 (0.0%) |
| 60 to 89 Minutes | 34 (75.6%) | 0 (0.0%) |
| 90 or more Minutes | 0 (0.0%) | 0 (0.0%) |
Time of Departure to Work by Sex in Big Falls
The most frequent times of departure to work in Big Falls are 12:00 AM to 4:59 AM (40, 88.9%) for males and 7:00 AM to 7:29 AM (49, 98.0%) for females.
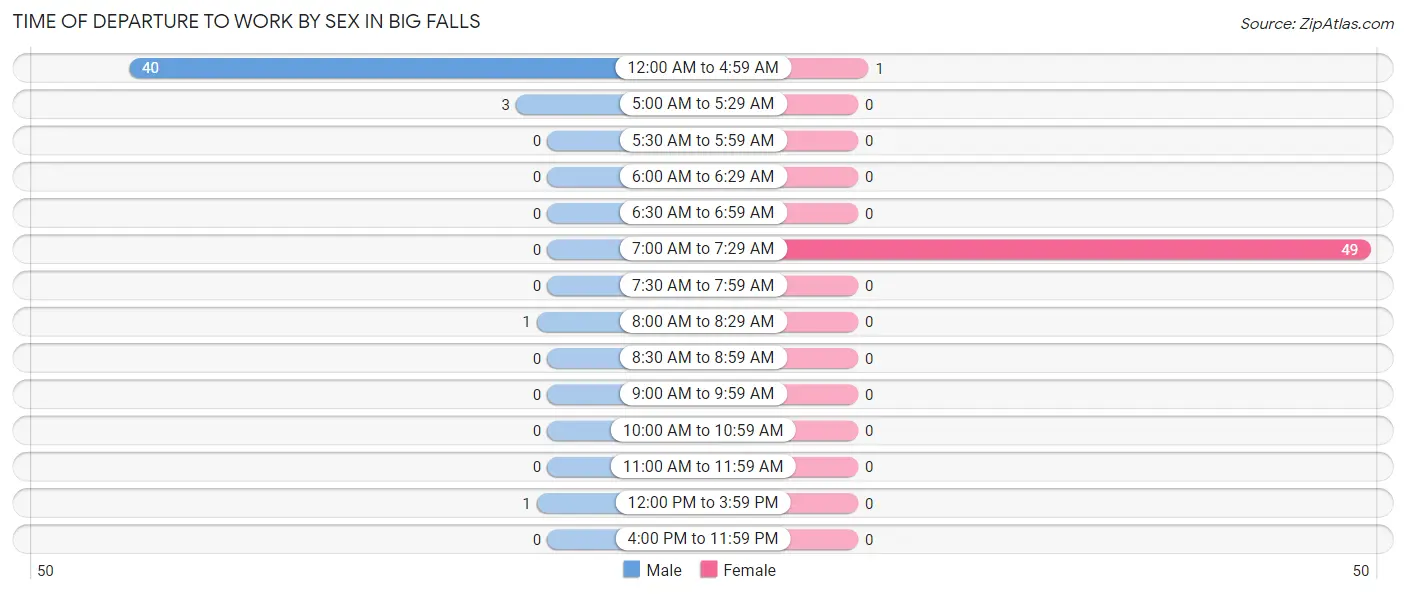
| Time of Departure | Male | Female |
| 12:00 AM to 4:59 AM | 40 (88.9%) | 1 (2.0%) |
| 5:00 AM to 5:29 AM | 3 (6.7%) | 0 (0.0%) |
| 5:30 AM to 5:59 AM | 0 (0.0%) | 0 (0.0%) |
| 6:00 AM to 6:29 AM | 0 (0.0%) | 0 (0.0%) |
| 6:30 AM to 6:59 AM | 0 (0.0%) | 0 (0.0%) |
| 7:00 AM to 7:29 AM | 0 (0.0%) | 49 (98.0%) |
| 7:30 AM to 7:59 AM | 0 (0.0%) | 0 (0.0%) |
| 8:00 AM to 8:29 AM | 1 (2.2%) | 0 (0.0%) |
| 8:30 AM to 8:59 AM | 0 (0.0%) | 0 (0.0%) |
| 9:00 AM to 9:59 AM | 0 (0.0%) | 0 (0.0%) |
| 10:00 AM to 10:59 AM | 0 (0.0%) | 0 (0.0%) |
| 11:00 AM to 11:59 AM | 0 (0.0%) | 0 (0.0%) |
| 12:00 PM to 3:59 PM | 1 (2.2%) | 0 (0.0%) |
| 4:00 PM to 11:59 PM | 0 (0.0%) | 0 (0.0%) |
| Total | 45 (100.0%) | 50 (100.0%) |
Housing Occupancy in Big Falls
Occupancy by Ownership in Big Falls
Of the total 84 dwellings in Big Falls, owner-occupied units account for 69 (82.1%), while renter-occupied units make up 15 (17.9%).
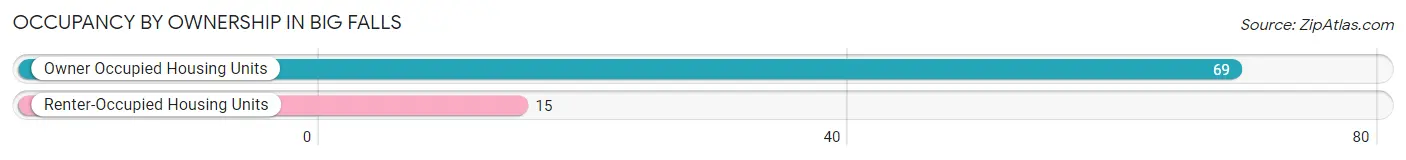
| Occupancy | # Housing Units | % Housing Units |
| Owner Occupied Housing Units | 69 | 82.1% |
| Renter-Occupied Housing Units | 15 | 17.9% |
| Total Occupied Housing Units | 84 | 100.0% |
Occupancy by Household Size in Big Falls
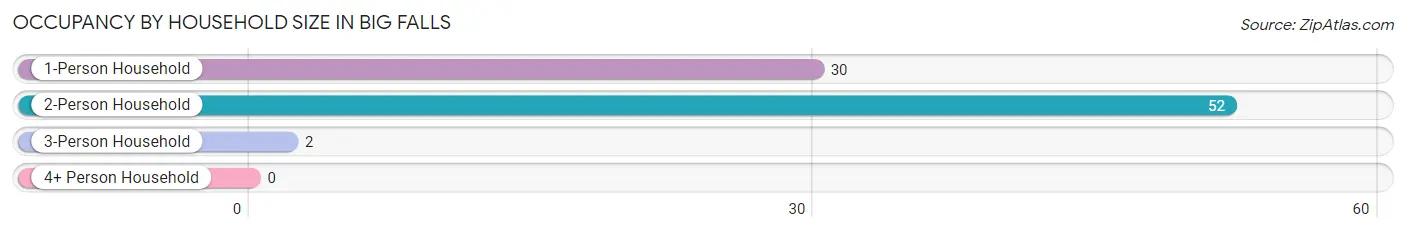
| Household Size | # Housing Units | % Housing Units |
| 1-Person Household | 30 | 35.7% |
| 2-Person Household | 52 | 61.9% |
| 3-Person Household | 2 | 2.4% |
| 4+ Person Household | 0 | 0.0% |
| Total Housing Units | 84 | 100.0% |
Occupancy by Ownership by Household Size in Big Falls
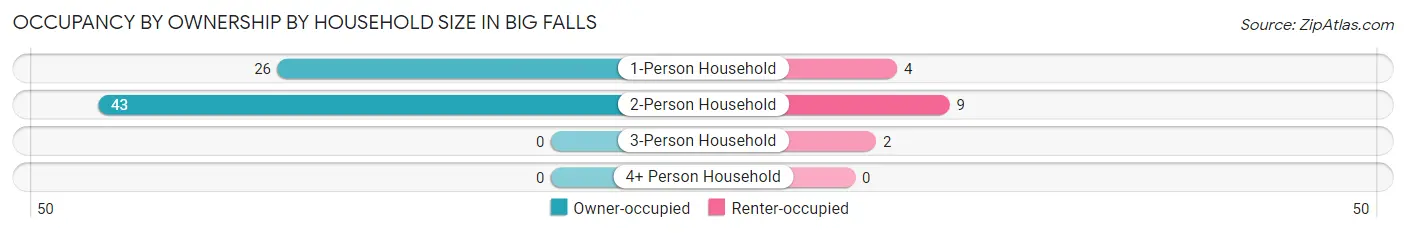
| Household Size | Owner-occupied | Renter-occupied |
| 1-Person Household | 26 (86.7%) | 4 (13.3%) |
| 2-Person Household | 43 (82.7%) | 9 (17.3%) |
| 3-Person Household | 0 (0.0%) | 2 (100.0%) |
| 4+ Person Household | 0 (0.0%) | 0 (0.0%) |
| Total Housing Units | 69 (82.1%) | 15 (17.9%) |
Occupancy by Educational Attainment in Big Falls
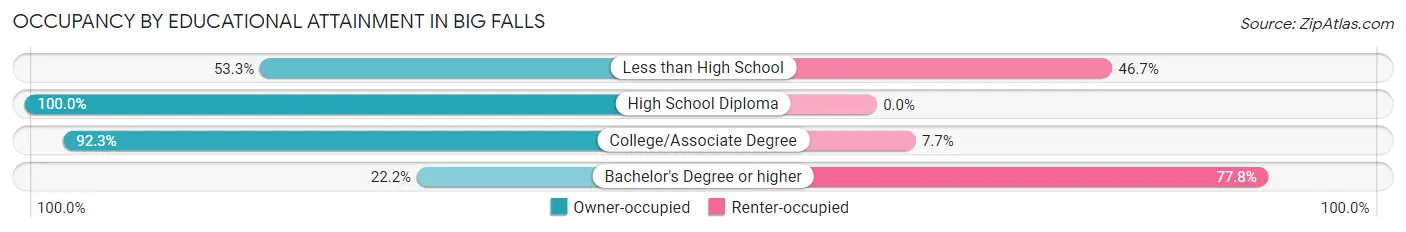
| Household Size | Owner-occupied | Renter-occupied |
| Less than High School | 8 (53.3%) | 7 (46.7%) |
| High School Diploma | 47 (100.0%) | 0 (0.0%) |
| College/Associate Degree | 12 (92.3%) | 1 (7.7%) |
| Bachelor's Degree or higher | 2 (22.2%) | 7 (77.8%) |
Occupancy by Age of Householder in Big Falls
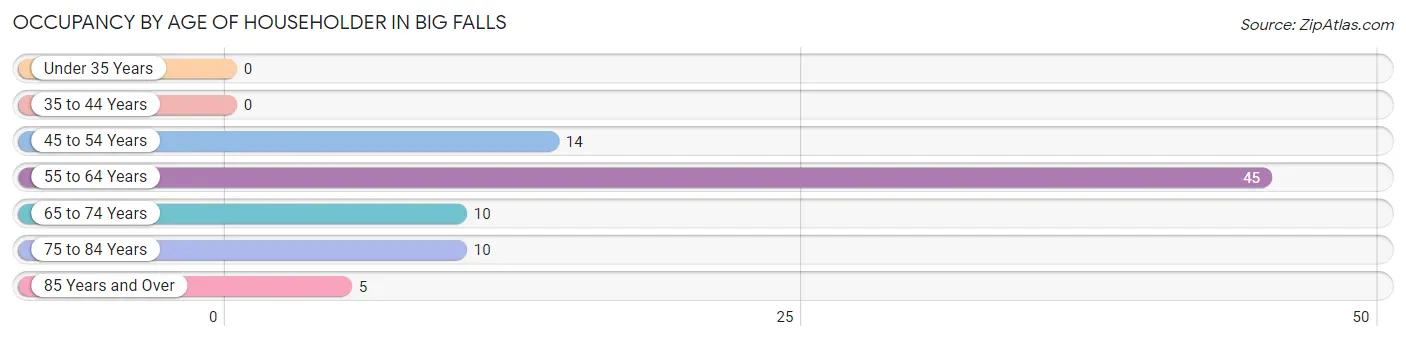
| Age Bracket | # Households | % Households |
| Under 35 Years | 0 | 0.0% |
| 35 to 44 Years | 0 | 0.0% |
| 45 to 54 Years | 14 | 16.7% |
| 55 to 64 Years | 45 | 53.6% |
| 65 to 74 Years | 10 | 11.9% |
| 75 to 84 Years | 10 | 11.9% |
| 85 Years and Over | 5 | 5.9% |
| Total | 84 | 100.0% |
Housing Finances in Big Falls
Median Income by Occupancy in Big Falls
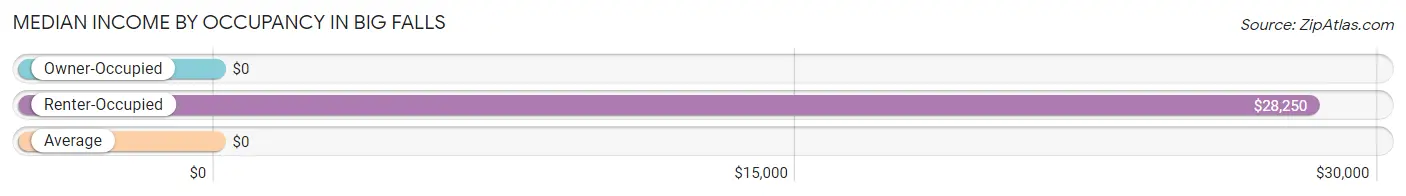
| Occupancy Type | # Households | Median Income |
| Owner-Occupied | 69 (82.1%) | $0 |
| Renter-Occupied | 15 (17.9%) | $28,250 |
| Average | 84 (100.0%) | $0 |
Occupancy by Householder Income Bracket in Big Falls
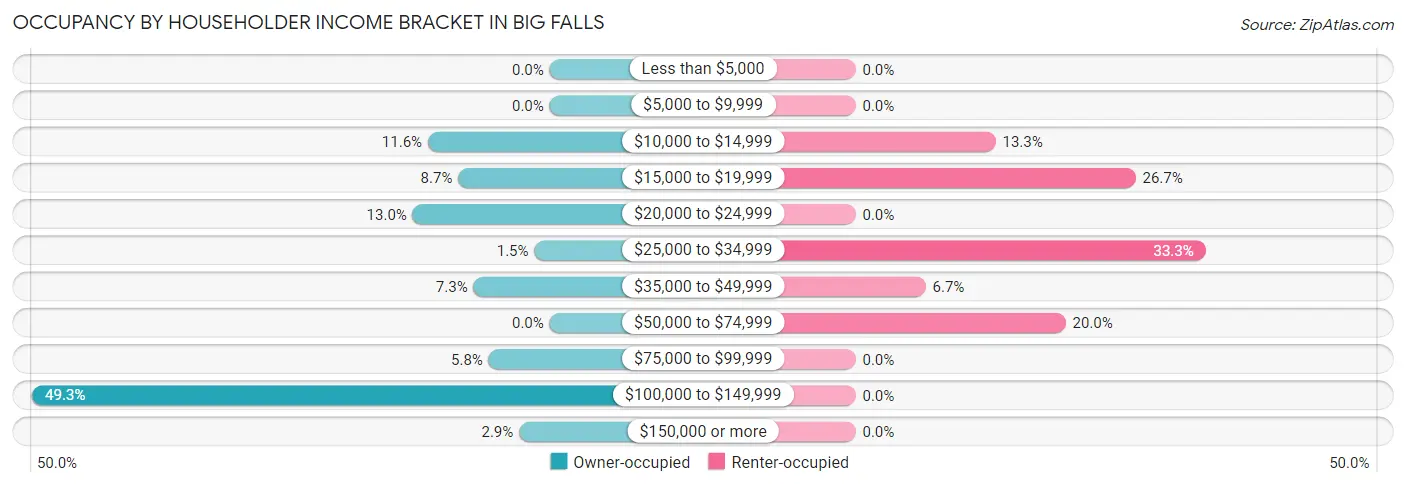
| Income Bracket | Owner-occupied | Renter-occupied |
| Less than $5,000 | 0 (0.0%) | 0 (0.0%) |
| $5,000 to $9,999 | 0 (0.0%) | 0 (0.0%) |
| $10,000 to $14,999 | 8 (11.6%) | 2 (13.3%) |
| $15,000 to $19,999 | 6 (8.7%) | 4 (26.7%) |
| $20,000 to $24,999 | 9 (13.0%) | 0 (0.0%) |
| $25,000 to $34,999 | 1 (1.5%) | 5 (33.3%) |
| $35,000 to $49,999 | 5 (7.2%) | 1 (6.7%) |
| $50,000 to $74,999 | 0 (0.0%) | 3 (20.0%) |
| $75,000 to $99,999 | 4 (5.8%) | 0 (0.0%) |
| $100,000 to $149,999 | 34 (49.3%) | 0 (0.0%) |
| $150,000 or more | 2 (2.9%) | 0 (0.0%) |
| Total | 69 (100.0%) | 15 (100.0%) |
Monthly Housing Cost Tiers in Big Falls
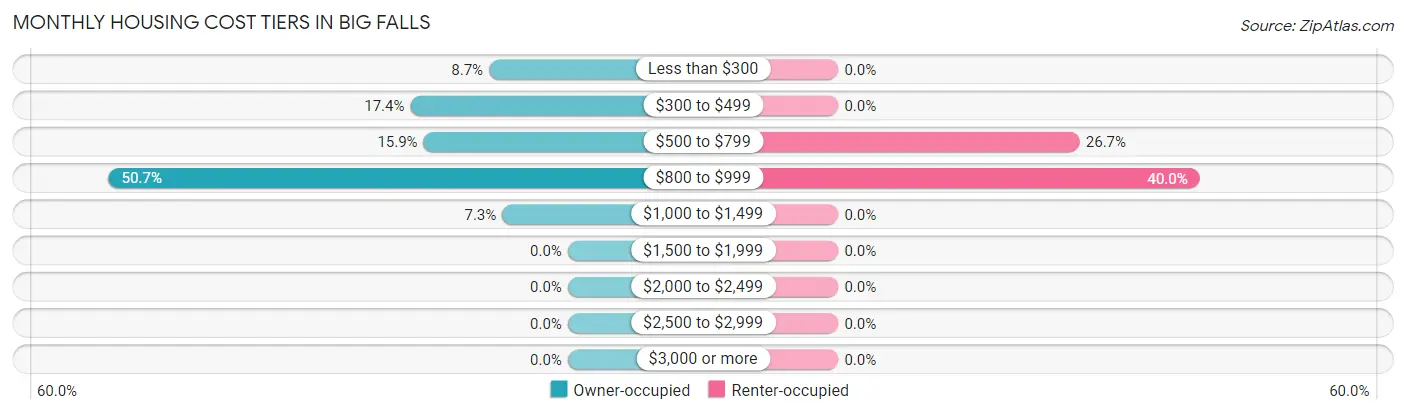
| Monthly Cost | Owner-occupied | Renter-occupied |
| Less than $300 | 6 (8.7%) | 0 (0.0%) |
| $300 to $499 | 12 (17.4%) | 0 (0.0%) |
| $500 to $799 | 11 (15.9%) | 4 (26.7%) |
| $800 to $999 | 35 (50.7%) | 6 (40.0%) |
| $1,000 to $1,499 | 5 (7.2%) | 0 (0.0%) |
| $1,500 to $1,999 | 0 (0.0%) | 0 (0.0%) |
| $2,000 to $2,499 | 0 (0.0%) | 0 (0.0%) |
| $2,500 to $2,999 | 0 (0.0%) | 0 (0.0%) |
| $3,000 or more | 0 (0.0%) | 0 (0.0%) |
| Total | 69 (100.0%) | 15 (100.0%) |
Physical Housing Characteristics in Big Falls
Housing Structures in Big Falls
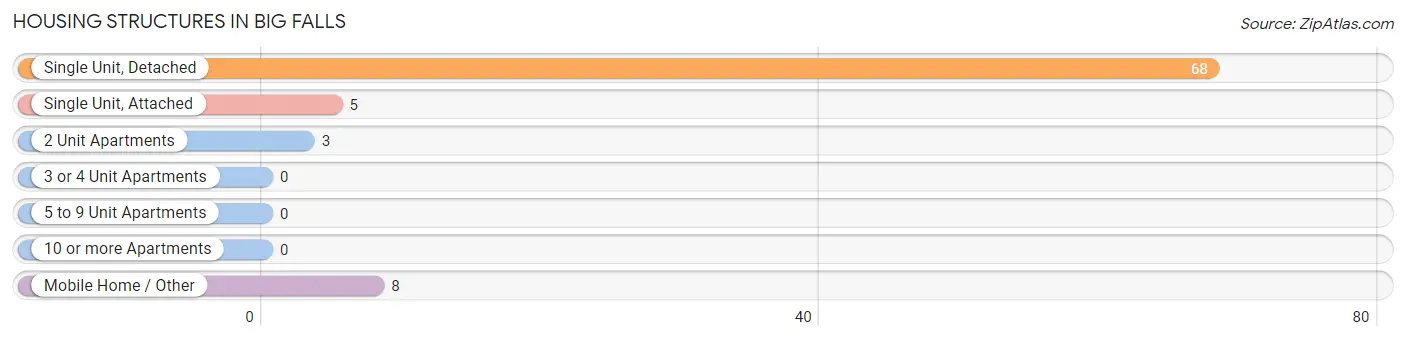
| Structure Type | # Housing Units | % Housing Units |
| Single Unit, Detached | 68 | 80.9% |
| Single Unit, Attached | 5 | 5.9% |
| 2 Unit Apartments | 3 | 3.6% |
| 3 or 4 Unit Apartments | 0 | 0.0% |
| 5 to 9 Unit Apartments | 0 | 0.0% |
| 10 or more Apartments | 0 | 0.0% |
| Mobile Home / Other | 8 | 9.5% |
| Total | 84 | 100.0% |
Housing Structures by Occupancy in Big Falls
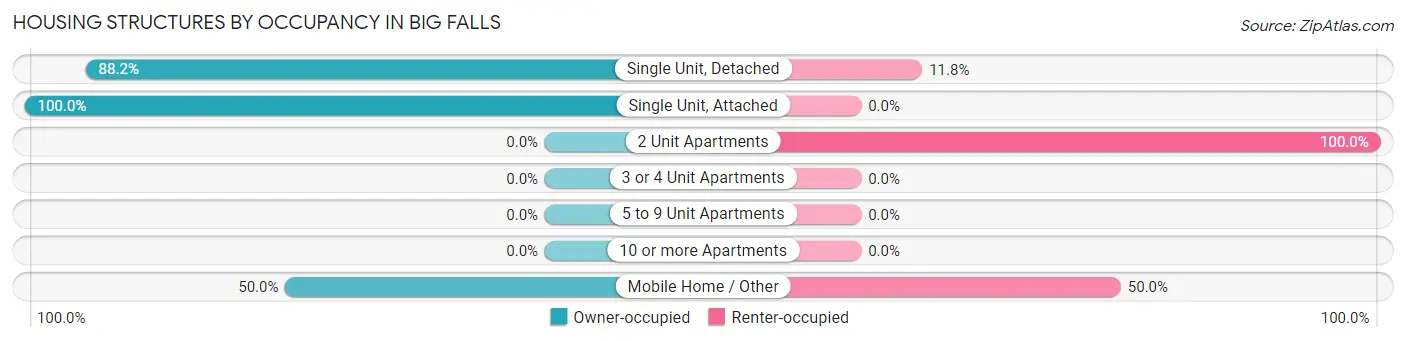
| Structure Type | Owner-occupied | Renter-occupied |
| Single Unit, Detached | 60 (88.2%) | 8 (11.8%) |
| Single Unit, Attached | 5 (100.0%) | 0 (0.0%) |
| 2 Unit Apartments | 0 (0.0%) | 3 (100.0%) |
| 3 or 4 Unit Apartments | 0 (0.0%) | 0 (0.0%) |
| 5 to 9 Unit Apartments | 0 (0.0%) | 0 (0.0%) |
| 10 or more Apartments | 0 (0.0%) | 0 (0.0%) |
| Mobile Home / Other | 4 (50.0%) | 4 (50.0%) |
| Total | 69 (82.1%) | 15 (17.9%) |
Housing Structures by Number of Rooms in Big Falls
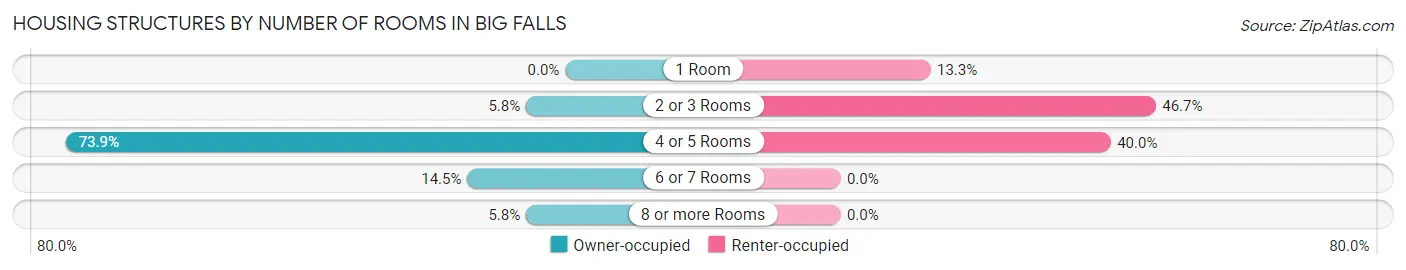
| Number of Rooms | Owner-occupied | Renter-occupied |
| 1 Room | 0 (0.0%) | 2 (13.3%) |
| 2 or 3 Rooms | 4 (5.8%) | 7 (46.7%) |
| 4 or 5 Rooms | 51 (73.9%) | 6 (40.0%) |
| 6 or 7 Rooms | 10 (14.5%) | 0 (0.0%) |
| 8 or more Rooms | 4 (5.8%) | 0 (0.0%) |
| Total | 69 (100.0%) | 15 (100.0%) |
Housing Structure by Heating Type in Big Falls
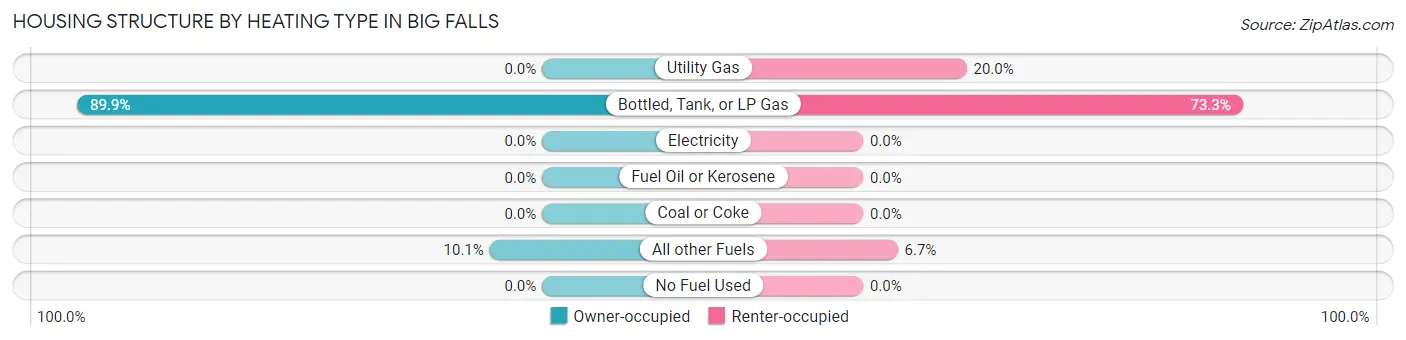
| Heating Type | Owner-occupied | Renter-occupied |
| Utility Gas | 0 (0.0%) | 3 (20.0%) |
| Bottled, Tank, or LP Gas | 62 (89.9%) | 11 (73.3%) |
| Electricity | 0 (0.0%) | 0 (0.0%) |
| Fuel Oil or Kerosene | 0 (0.0%) | 0 (0.0%) |
| Coal or Coke | 0 (0.0%) | 0 (0.0%) |
| All other Fuels | 7 (10.1%) | 1 (6.7%) |
| No Fuel Used | 0 (0.0%) | 0 (0.0%) |
| Total | 69 (100.0%) | 15 (100.0%) |
Household Vehicle Usage in Big Falls
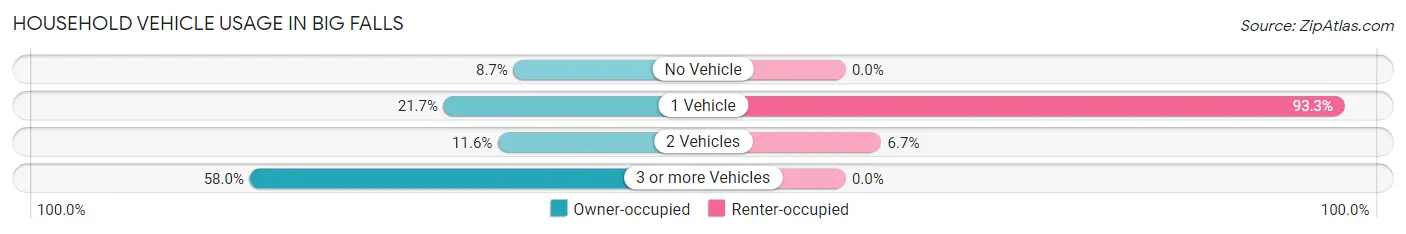
| Vehicles per Household | Owner-occupied | Renter-occupied |
| No Vehicle | 6 (8.7%) | 0 (0.0%) |
| 1 Vehicle | 15 (21.7%) | 14 (93.3%) |
| 2 Vehicles | 8 (11.6%) | 1 (6.7%) |
| 3 or more Vehicles | 40 (58.0%) | 0 (0.0%) |
| Total | 69 (100.0%) | 15 (100.0%) |
Real Estate & Mortgages in Big Falls
Real Estate and Mortgage Overview in Big Falls
| Characteristic | Without Mortgage | With Mortgage |
| Housing Units | 55 | 14 |
| Median Property Value | $64,300 | $0 |
| Median Household Income | - | - |
| Monthly Housing Costs | $834 | $0 |
| Real Estate Taxes | $950 | $0 |
Property Value by Mortgage Status in Big Falls
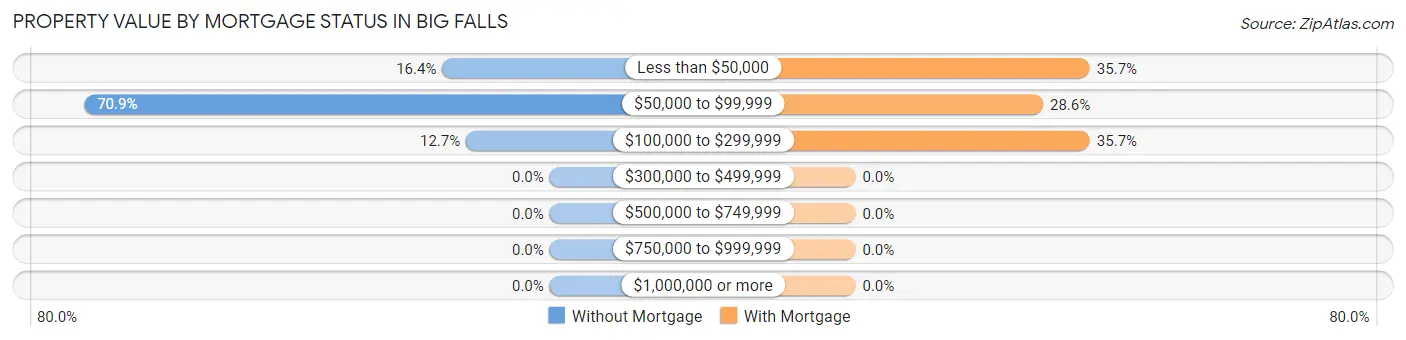
| Property Value | Without Mortgage | With Mortgage |
| Less than $50,000 | 9 (16.4%) | 5 (35.7%) |
| $50,000 to $99,999 | 39 (70.9%) | 4 (28.6%) |
| $100,000 to $299,999 | 7 (12.7%) | 5 (35.7%) |
| $300,000 to $499,999 | 0 (0.0%) | 0 (0.0%) |
| $500,000 to $749,999 | 0 (0.0%) | 0 (0.0%) |
| $750,000 to $999,999 | 0 (0.0%) | 0 (0.0%) |
| $1,000,000 or more | 0 (0.0%) | 0 (0.0%) |
| Total | 55 (100.0%) | 14 (100.0%) |
Household Income by Mortgage Status in Big Falls
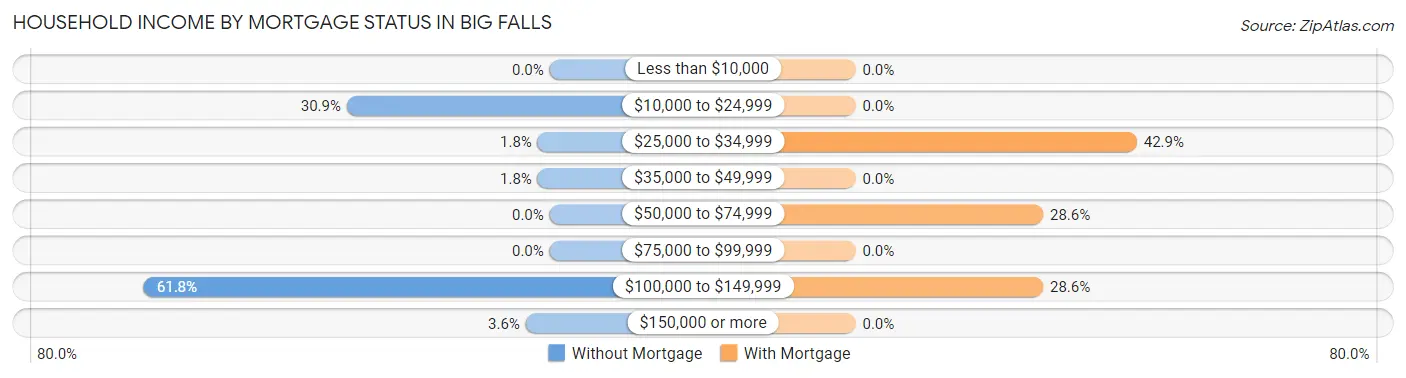
| Household Income | Without Mortgage | With Mortgage |
| Less than $10,000 | 0 (0.0%) | 0 (0.0%) |
| $10,000 to $24,999 | 17 (30.9%) | 0 (0.0%) |
| $25,000 to $34,999 | 1 (1.8%) | 6 (42.9%) |
| $35,000 to $49,999 | 1 (1.8%) | 0 (0.0%) |
| $50,000 to $74,999 | 0 (0.0%) | 4 (28.6%) |
| $75,000 to $99,999 | 0 (0.0%) | 0 (0.0%) |
| $100,000 to $149,999 | 34 (61.8%) | 4 (28.6%) |
| $150,000 or more | 2 (3.6%) | 0 (0.0%) |
| Total | 55 (100.0%) | 14 (100.0%) |
Property Value to Household Income Ratio in Big Falls
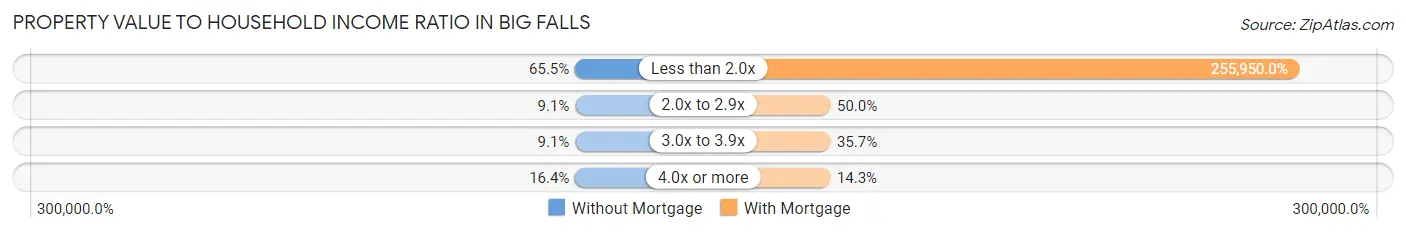
| Value-to-Income Ratio | Without Mortgage | With Mortgage |
| Less than 2.0x | 36 (65.4%) | 35,833 (255,950.0%) |
| 2.0x to 2.9x | 5 (9.1%) | 7 (50.0%) |
| 3.0x to 3.9x | 5 (9.1%) | 5 (35.7%) |
| 4.0x or more | 9 (16.4%) | 2 (14.3%) |
| Total | 55 (100.0%) | 14 (100.0%) |
Real Estate Taxes by Mortgage Status in Big Falls
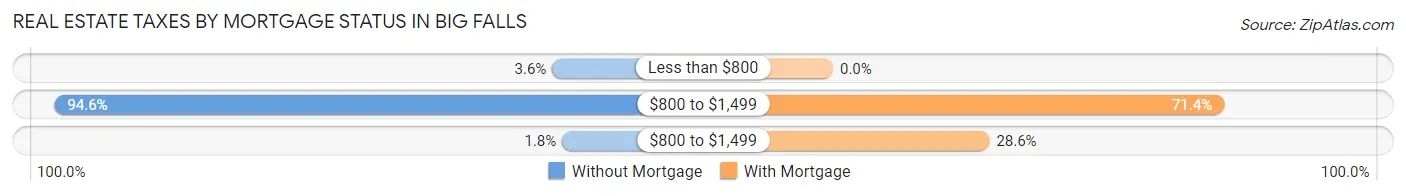
| Property Taxes | Without Mortgage | With Mortgage |
| Less than $800 | 2 (3.6%) | 0 (0.0%) |
| $800 to $1,499 | 52 (94.6%) | 10 (71.4%) |
| $800 to $1,499 | 1 (1.8%) | 4 (28.6%) |
| Total | 55 (100.0%) | 14 (100.0%) |
Health & Disability in Big Falls
Health Insurance Coverage by Age in Big Falls
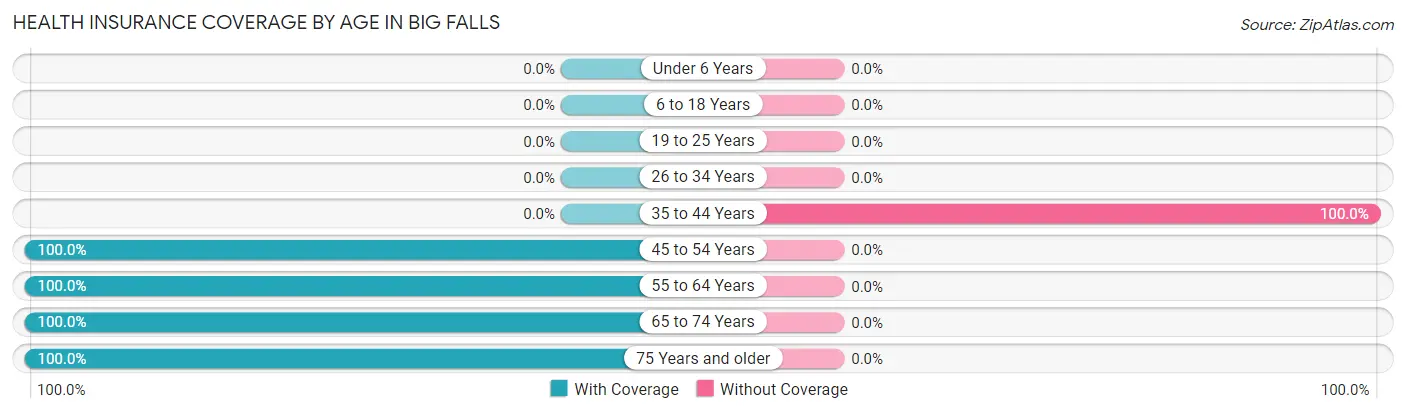
| Age Bracket | With Coverage | Without Coverage |
| Under 6 Years | 0 (0.0%) | 0 (0.0%) |
| 6 to 18 Years | 0 (0.0%) | 0 (0.0%) |
| 19 to 25 Years | 0 (0.0%) | 0 (0.0%) |
| 26 to 34 Years | 0 (0.0%) | 0 (0.0%) |
| 35 to 44 Years | 0 (0.0%) | 1 (100.0%) |
| 45 to 54 Years | 63 (100.0%) | 0 (0.0%) |
| 55 to 64 Years | 53 (100.0%) | 0 (0.0%) |
| 65 to 74 Years | 15 (100.0%) | 0 (0.0%) |
| 75 Years and older | 17 (100.0%) | 0 (0.0%) |
| Total | 148 (99.3%) | 1 (0.7%) |
Health Insurance Coverage by Citizenship Status in Big Falls
| Citizenship Status | With Coverage | Without Coverage |
| Native Born | 0 (0.0%) | 0 (0.0%) |
| Foreign Born, Citizen | 0 (0.0%) | 0 (0.0%) |
| Foreign Born, not a Citizen | 0 (0.0%) | 0 (0.0%) |
Health Insurance Coverage by Household Income in Big Falls
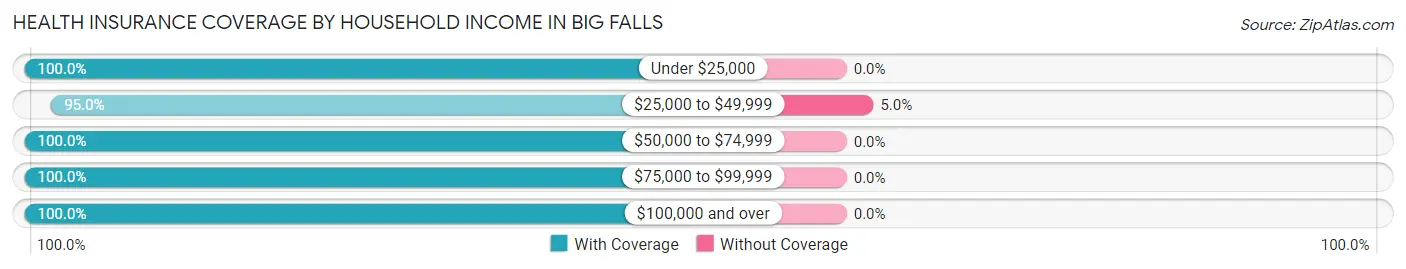
| Household Income | With Coverage | Without Coverage |
| Under $25,000 | 36 (100.0%) | 0 (0.0%) |
| $25,000 to $49,999 | 19 (95.0%) | 1 (5.0%) |
| $50,000 to $74,999 | 3 (100.0%) | 0 (0.0%) |
| $75,000 to $99,999 | 8 (100.0%) | 0 (0.0%) |
| $100,000 and over | 82 (100.0%) | 0 (0.0%) |
Public vs Private Health Insurance Coverage by Age in Big Falls
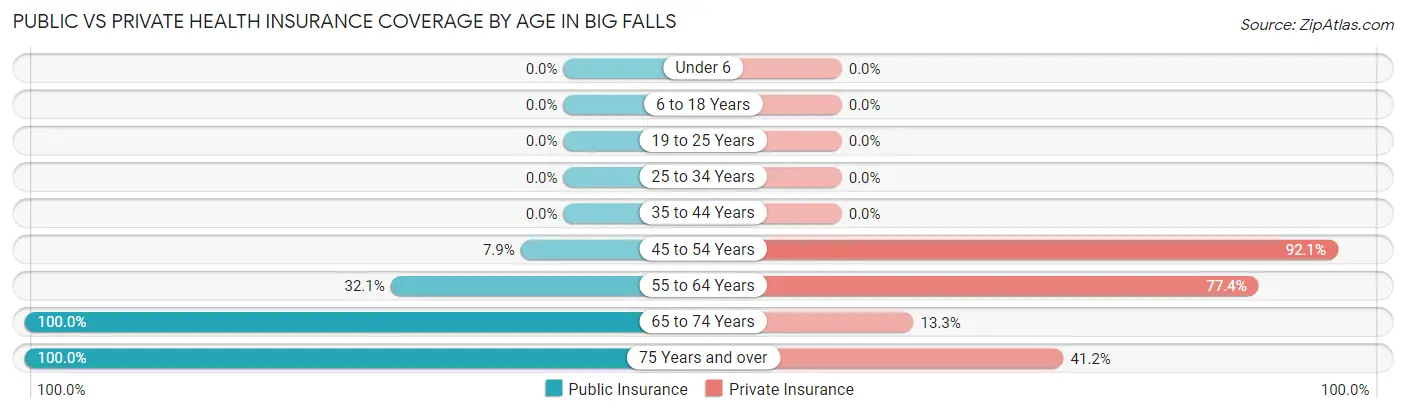
| Age Bracket | Public Insurance | Private Insurance |
| Under 6 | 0 (0.0%) | 0 (0.0%) |
| 6 to 18 Years | 0 (0.0%) | 0 (0.0%) |
| 19 to 25 Years | 0 (0.0%) | 0 (0.0%) |
| 25 to 34 Years | 0 (0.0%) | 0 (0.0%) |
| 35 to 44 Years | 0 (0.0%) | 0 (0.0%) |
| 45 to 54 Years | 5 (7.9%) | 58 (92.1%) |
| 55 to 64 Years | 17 (32.1%) | 41 (77.4%) |
| 65 to 74 Years | 15 (100.0%) | 2 (13.3%) |
| 75 Years and over | 17 (100.0%) | 7 (41.2%) |
| Total | 54 (36.2%) | 108 (72.5%) |
Disability Status by Sex by Age in Big Falls
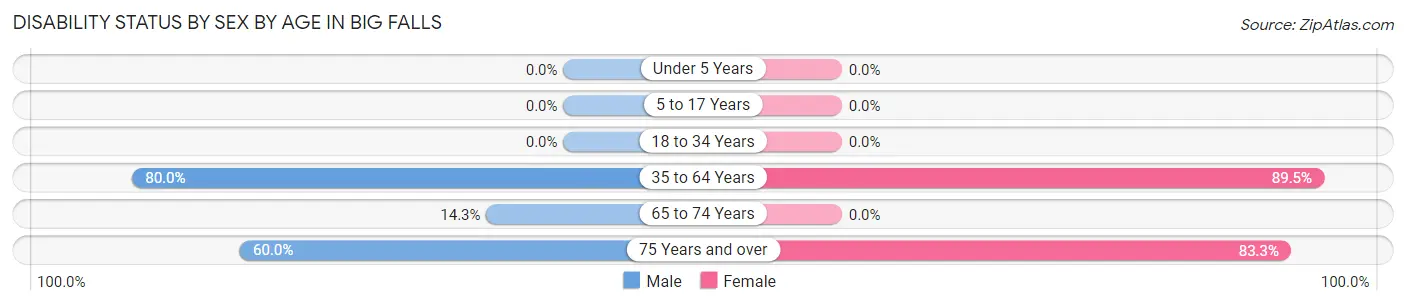
| Age Bracket | Male | Female |
| Under 5 Years | 0 (0.0%) | 0 (0.0%) |
| 5 to 17 Years | 0 (0.0%) | 0 (0.0%) |
| 18 to 34 Years | 0 (0.0%) | 0 (0.0%) |
| 35 to 64 Years | 48 (80.0%) | 51 (89.5%) |
| 65 to 74 Years | 2 (14.3%) | 0 (0.0%) |
| 75 Years and over | 3 (60.0%) | 10 (83.3%) |
Disability Class by Sex by Age in Big Falls
Disability Class: Hearing Difficulty
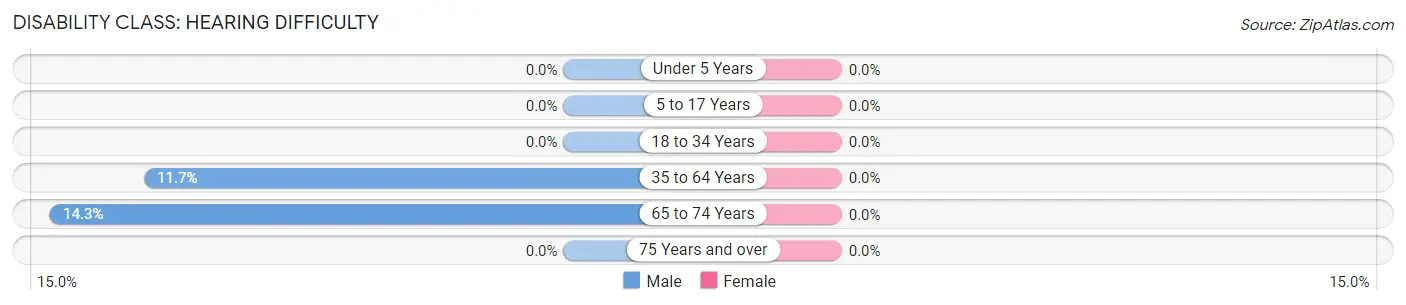
| Age Bracket | Male | Female |
| Under 5 Years | 0 (0.0%) | 0 (0.0%) |
| 5 to 17 Years | 0 (0.0%) | 0 (0.0%) |
| 18 to 34 Years | 0 (0.0%) | 0 (0.0%) |
| 35 to 64 Years | 7 (11.7%) | 0 (0.0%) |
| 65 to 74 Years | 2 (14.3%) | 0 (0.0%) |
| 75 Years and over | 0 (0.0%) | 0 (0.0%) |
Disability Class: Vision Difficulty
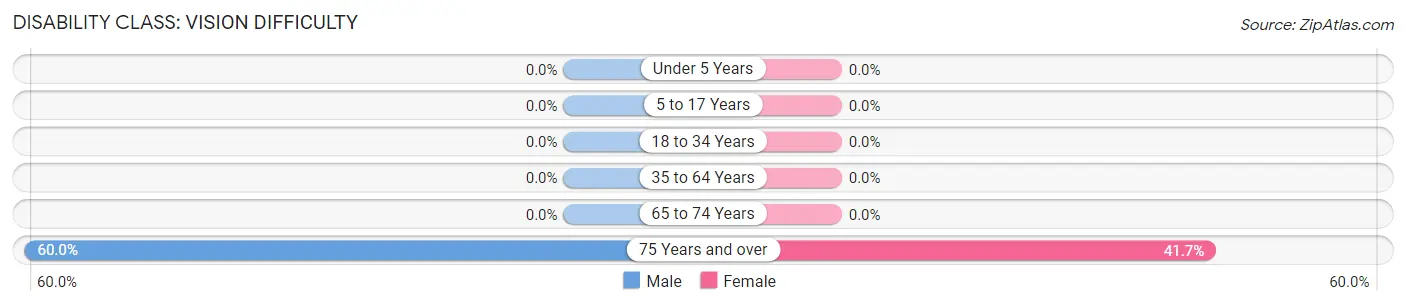
| Age Bracket | Male | Female |
| Under 5 Years | 0 (0.0%) | 0 (0.0%) |
| 5 to 17 Years | 0 (0.0%) | 0 (0.0%) |
| 18 to 34 Years | 0 (0.0%) | 0 (0.0%) |
| 35 to 64 Years | 0 (0.0%) | 0 (0.0%) |
| 65 to 74 Years | 0 (0.0%) | 0 (0.0%) |
| 75 Years and over | 3 (60.0%) | 5 (41.7%) |
Disability Class: Cognitive Difficulty
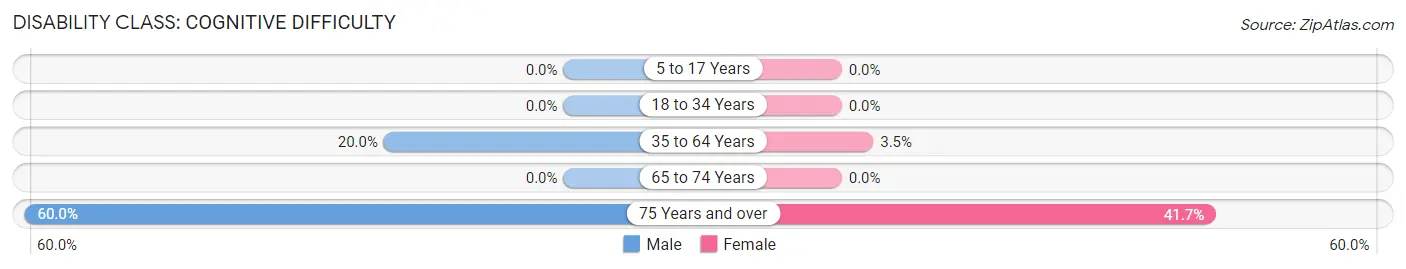
| Age Bracket | Male | Female |
| 5 to 17 Years | 0 (0.0%) | 0 (0.0%) |
| 18 to 34 Years | 0 (0.0%) | 0 (0.0%) |
| 35 to 64 Years | 12 (20.0%) | 2 (3.5%) |
| 65 to 74 Years | 0 (0.0%) | 0 (0.0%) |
| 75 Years and over | 3 (60.0%) | 5 (41.7%) |
Disability Class: Ambulatory Difficulty
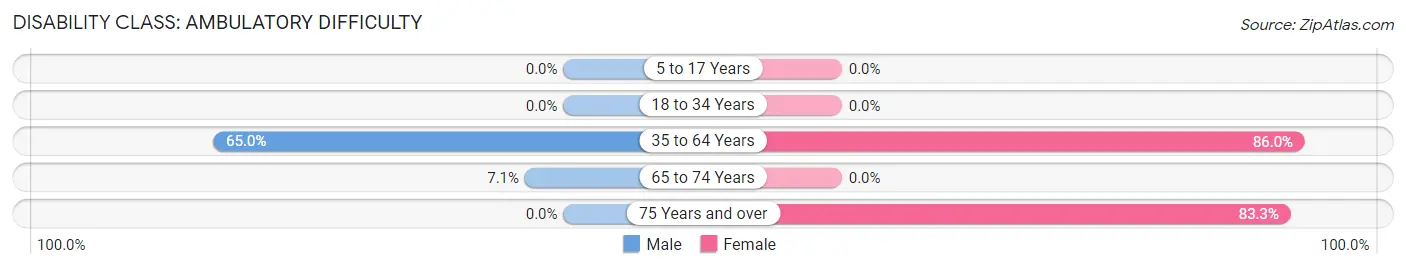
| Age Bracket | Male | Female |
| 5 to 17 Years | 0 (0.0%) | 0 (0.0%) |
| 18 to 34 Years | 0 (0.0%) | 0 (0.0%) |
| 35 to 64 Years | 39 (65.0%) | 49 (86.0%) |
| 65 to 74 Years | 1 (7.1%) | 0 (0.0%) |
| 75 Years and over | 0 (0.0%) | 10 (83.3%) |
Disability Class: Self-Care Difficulty
| Age Bracket | Male | Female |
| 5 to 17 Years | 0 (0.0%) | 0 (0.0%) |
| 18 to 34 Years | 0 (0.0%) | 0 (0.0%) |
| 35 to 64 Years | 0 (0.0%) | 0 (0.0%) |
| 65 to 74 Years | 0 (0.0%) | 0 (0.0%) |
| 75 Years and over | 0 (0.0%) | 0 (0.0%) |
Technology Access in Big Falls
Computing Device Access in Big Falls
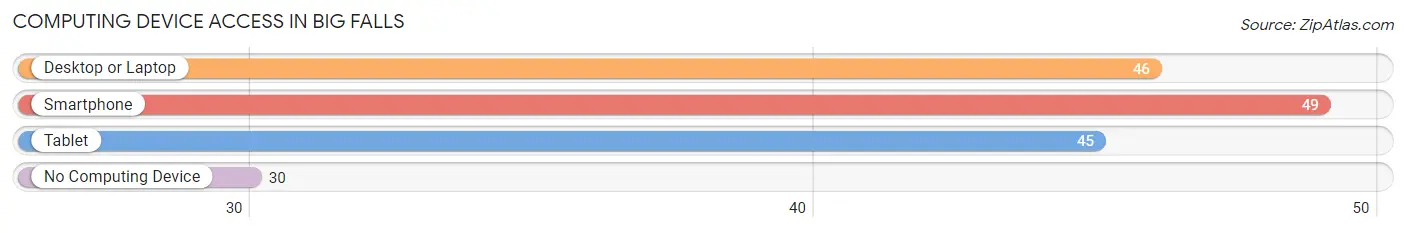
| Device Type | # Households | % Households |
| Desktop or Laptop | 46 | 54.8% |
| Smartphone | 49 | 58.3% |
| Tablet | 45 | 53.6% |
| No Computing Device | 30 | 35.7% |
| Total | 84 | 100.0% |
Internet Access in Big Falls
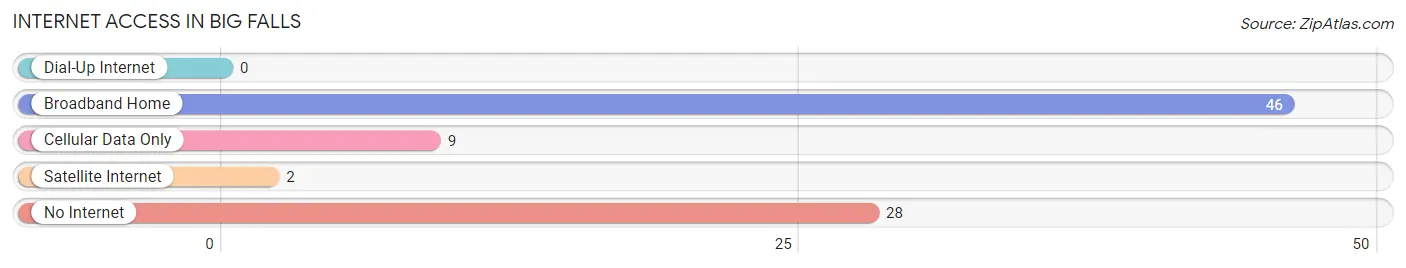
| Internet Type | # Households | % Households |
| Dial-Up Internet | 0 | 0.0% |
| Broadband Home | 46 | 54.8% |
| Cellular Data Only | 9 | 10.7% |
| Satellite Internet | 2 | 2.4% |
| No Internet | 28 | 33.3% |
| Total | 84 | 100.0% |
Big Falls Summary
History
Big Falls, Wisconsin is a small town located in the northern part of the state, near the border of Michigan. It was founded in 1854 by a group of settlers from New York and Pennsylvania. The town was originally called Big Falls because of the large waterfall located nearby. The waterfall was used to power a sawmill and gristmill, which were the main sources of income for the early settlers.
The town grew slowly over the years, but it was not until the late 19th century that it began to experience significant growth. In 1887, the Wisconsin Central Railroad was built through Big Falls, connecting it to the larger cities of Milwaukee and Chicago. This allowed for increased trade and commerce, and the town began to thrive.
In the early 20th century, Big Falls was a popular tourist destination. The town was known for its beautiful scenery and outdoor activities, such as fishing, hunting, and camping. It was also home to several resorts, which attracted visitors from all over the country.
Geography
Big Falls is located in the northern part of Wisconsin, near the border of Michigan. It is situated in the Chequamegon-Nicolet National Forest, which is a large area of protected land. The town is surrounded by forests, lakes, and rivers, making it a popular destination for outdoor activities.
The town is located on the banks of the Big Falls River, which is a tributary of the Wisconsin River. The river is used for fishing, canoeing, and kayaking. The town is also home to several small lakes, which are popular for swimming and boating.
Economy
The economy of Big Falls is largely based on tourism and outdoor recreation. The town is home to several resorts, which attract visitors from all over the country. The town is also known for its excellent fishing and hunting opportunities, which draw in many visitors each year.
In addition to tourism, the town is also home to several small businesses, such as restaurants, shops, and gas stations. The town is also home to a small manufacturing plant, which produces paper products.
Demographics
As of the 2010 census, the population of Big Falls was 1,845. The town is predominantly white, with 95.3% of the population identifying as such. The median household income is $41,250, and the median age is 44.7 years.
Conclusion
Big Falls, Wisconsin is a small town located in the northern part of the state, near the border of Michigan. It was founded in 1854 and has since grown into a popular tourist destination. The town is surrounded by forests, lakes, and rivers, making it a popular destination for outdoor activities. The economy of Big Falls is largely based on tourism and outdoor recreation, and the town is home to several small businesses. As of the 2010 census, the population of Big Falls was 1,845.
Common Questions
What is Per Capita Income in Big Falls?
Per Capita income in Big Falls is $48,850.
What is the Median Family Income in Big Falls?
Median Family Income in Big Falls is $141,066.
What is Income or Wage Gap in Big Falls?
Income or Wage Gap in Big Falls is 0.3%.
Women in Big Falls earn 99.7 cents for every dollar earned by a man.
What is Inequality or Gini Index in Big Falls?
Inequality or Gini Index in Big Falls is 0.41.
What is the Total Population of Big Falls?
Total Population of Big Falls is 149.
What is the Total Male Population of Big Falls?
Total Male Population of Big Falls is 79.
What is the Total Female Population of Big Falls?
Total Female Population of Big Falls is 70.
What is the Ratio of Males per 100 Females in Big Falls?
There are 112.86 Males per 100 Females in Big Falls.
What is the Ratio of Females per 100 Males in Big Falls?
There are 88.61 Females per 100 Males in Big Falls.
What is the Median Population Age in Big Falls?
Median Population Age in Big Falls is 60.2 Years.
What is the Average Family Size in Big Falls
Average Family Size in Big Falls is 2.2 People.
What is the Average Household Size in Big Falls
Average Household Size in Big Falls is 1.8 People.
How Large is the Labor Force in Big Falls?
There are 101 People in the Labor Forcein in Big Falls.
What is the Percentage of People in the Labor Force in Big Falls?
67.8% of People are in the Labor Force in Big Falls.
What is the Unemployment Rate in Big Falls?
Unemployment Rate in Big Falls is 4.0%.