Edgewater, AL Map & Demographics
Edgewater Map
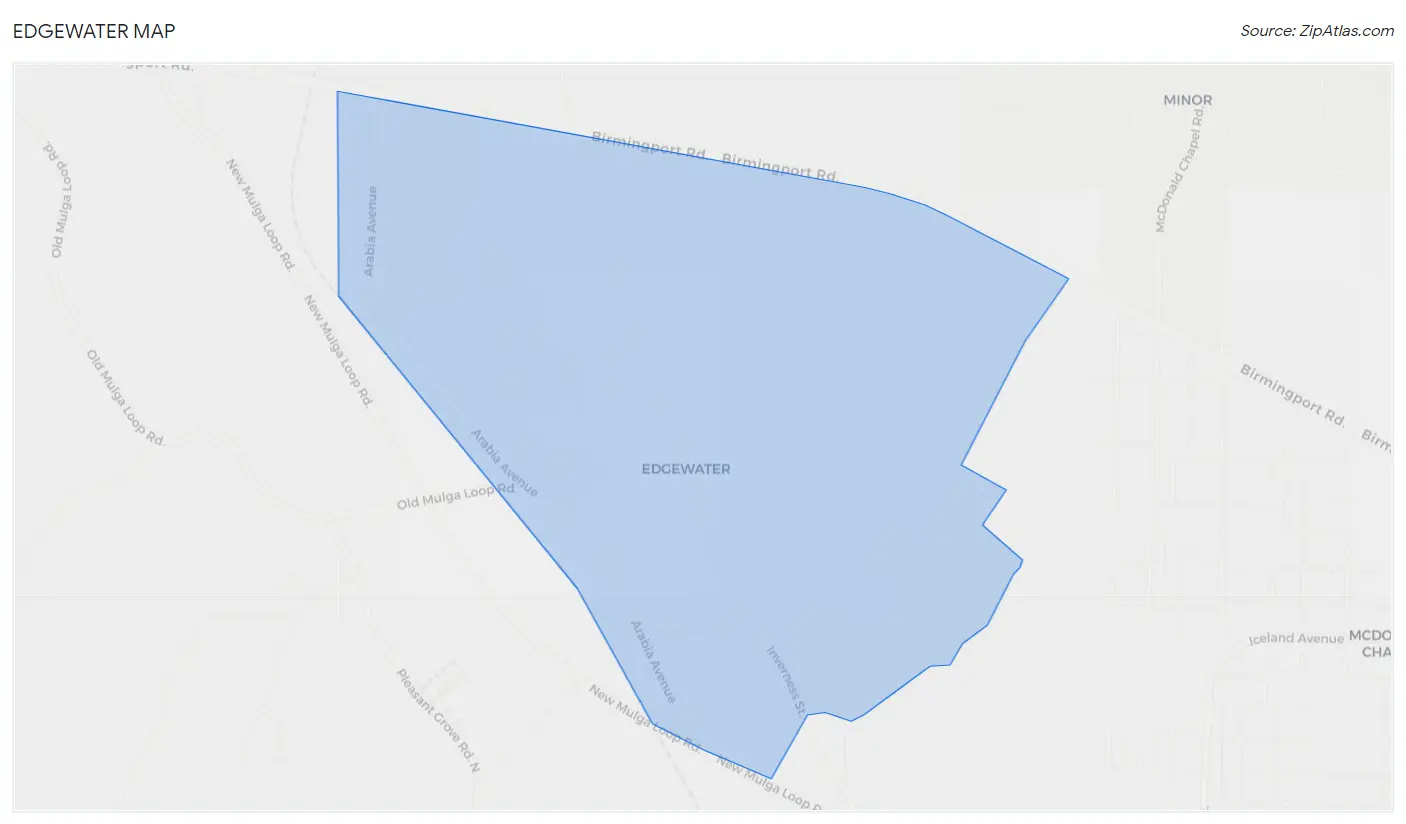
Edgewater Overview
$54,498
PER CAPITA INCOME
$167,657
AVG FAMILY INCOME
$140,679
AVG HOUSEHOLD INCOME
0.4%
WAGE / INCOME GAP [ % ]
99.6¢/ $1
WAGE / INCOME GAP [ $ ]
0.32
INEQUALITY / GINI INDEX
793
TOTAL POPULATION
350
MALE POPULATION
443
FEMALE POPULATION
79.01
MALES / 100 FEMALES
126.57
FEMALES / 100 MALES
50.9
MEDIAN AGE
2.5
AVG FAMILY SIZE
2.2
AVG HOUSEHOLD SIZE
354
LABOR FORCE [ PEOPLE ]
51.0%
PERCENT IN LABOR FORCE
7.5%
UNEMPLOYMENT RATE
Income in Edgewater
Income Overview in Edgewater
Per Capita Income in Edgewater is $54,498, while median incomes of families and households are $167,657 and $140,679 respectively.
| Characteristic | Number | Measure |
| Per Capita Income | 793 | $54,498 |
| Median Family Income | 259 | $167,657 |
| Mean Family Income | 259 | $133,288 |
| Median Household Income | 363 | $140,679 |
| Mean Household Income | 363 | $110,832 |
| Income Deficit | 259 | $0 |
| Wage / Income Gap (%) | 793 | 0.44% |
| Wage / Income Gap ($) | 793 | 99.56¢ per $1 |
| Gini / Inequality Index | 793 | 0.32 |
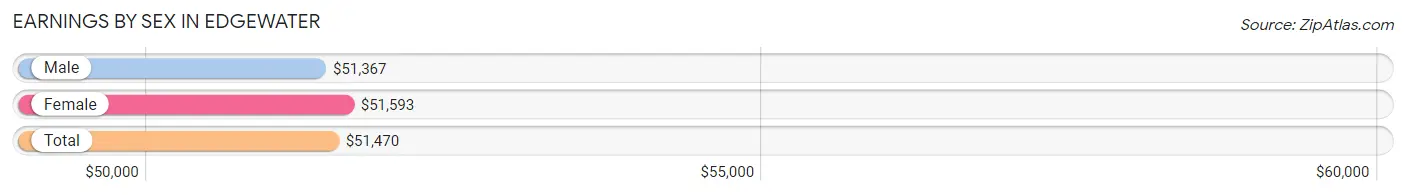
Earnings by Sex in Edgewater
Average Earnings in Edgewater are $51,470, $51,367 for men and $51,593 for women, a difference of 0.4%.
| Sex | Number | Average Earnings |
| Male | 251 (47.6%) | $51,367 |
| Female | 276 (52.4%) | $51,593 |
| Total | 527 (100.0%) | $51,470 |
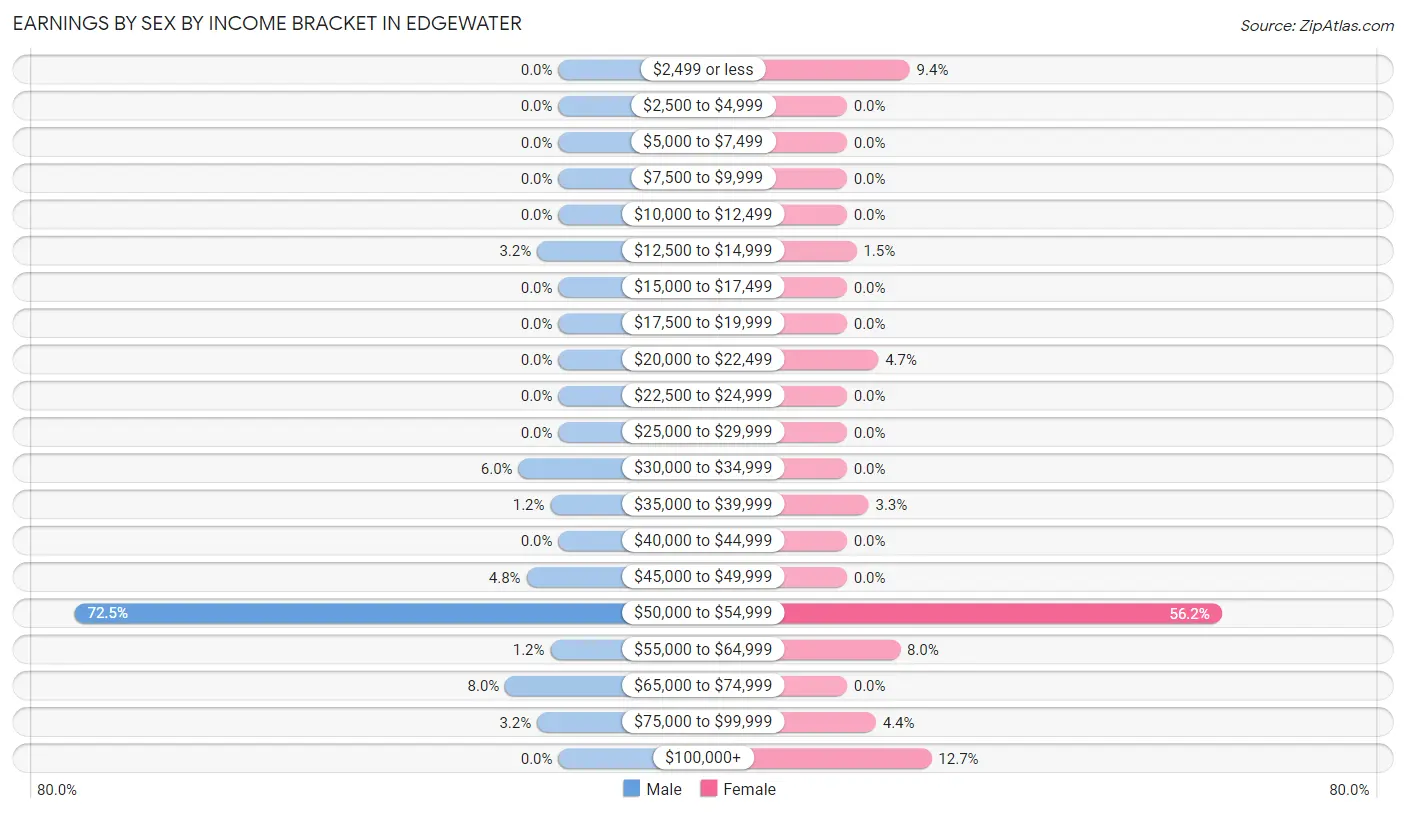
Earnings by Sex by Income Bracket in Edgewater
The most common earnings brackets in Edgewater are $50,000 to $54,999 for men (182 | 72.5%) and $50,000 to $54,999 for women (155 | 56.2%).
| Income | Male | Female |
| $2,499 or less | 0 (0.0%) | 26 (9.4%) |
| $2,500 to $4,999 | 0 (0.0%) | 0 (0.0%) |
| $5,000 to $7,499 | 0 (0.0%) | 0 (0.0%) |
| $7,500 to $9,999 | 0 (0.0%) | 0 (0.0%) |
| $10,000 to $12,499 | 0 (0.0%) | 0 (0.0%) |
| $12,500 to $14,999 | 8 (3.2%) | 4 (1.5%) |
| $15,000 to $17,499 | 0 (0.0%) | 0 (0.0%) |
| $17,500 to $19,999 | 0 (0.0%) | 0 (0.0%) |
| $20,000 to $22,499 | 0 (0.0%) | 13 (4.7%) |
| $22,500 to $24,999 | 0 (0.0%) | 0 (0.0%) |
| $25,000 to $29,999 | 0 (0.0%) | 0 (0.0%) |
| $30,000 to $34,999 | 15 (6.0%) | 0 (0.0%) |
| $35,000 to $39,999 | 3 (1.2%) | 9 (3.3%) |
| $40,000 to $44,999 | 0 (0.0%) | 0 (0.0%) |
| $45,000 to $49,999 | 12 (4.8%) | 0 (0.0%) |
| $50,000 to $54,999 | 182 (72.5%) | 155 (56.2%) |
| $55,000 to $64,999 | 3 (1.2%) | 22 (8.0%) |
| $65,000 to $74,999 | 20 (8.0%) | 0 (0.0%) |
| $75,000 to $99,999 | 8 (3.2%) | 12 (4.3%) |
| $100,000+ | 0 (0.0%) | 35 (12.7%) |
| Total | 251 (100.0%) | 276 (100.0%) |
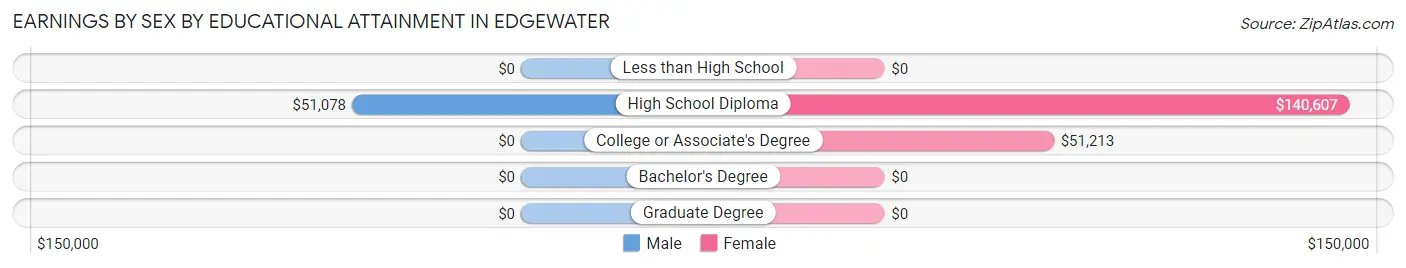
Earnings by Sex by Educational Attainment in Edgewater
Average earnings in Edgewater are $51,391 for men and $51,833 for women, a difference of 0.9%. Men with an educational attainment of high school diploma enjoy the highest average annual earnings of $51,078, while those with high school diploma education earn the least with $51,078. Women with an educational attainment of high school diploma earn the most with the average annual earnings of $140,607, while those with college or associate's degree education have the smallest earnings of $51,213.
| Educational Attainment | Male Income | Female Income |
| Less than High School | - | - |
| High School Diploma | $51,078 | $140,607 |
| College or Associate's Degree | - | - |
| Bachelor's Degree | - | - |
| Graduate Degree | - | - |
| Total | $51,391 | $51,833 |
Family Income in Edgewater
Family Income Brackets in Edgewater
According to the Edgewater family income data, there are 138 families falling into the $150,000 to $199,999 income range, which is the most common income bracket and makes up 53.3% of all families.
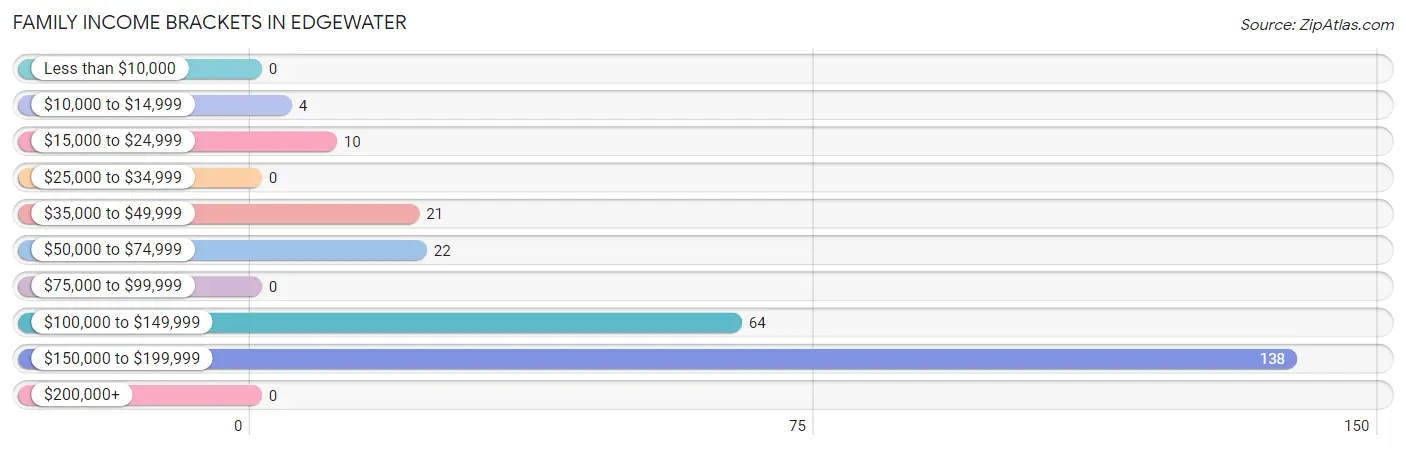
| Income Bracket | # Families | % Families |
| Less than $10,000 | 0 | 0.0% |
| $10,000 to $14,999 | 4 | 1.5% |
| $15,000 to $24,999 | 10 | 3.9% |
| $25,000 to $34,999 | 0 | 0.0% |
| $35,000 to $49,999 | 21 | 8.1% |
| $50,000 to $74,999 | 22 | 8.5% |
| $75,000 to $99,999 | 0 | 0.0% |
| $100,000 to $149,999 | 64 | 24.7% |
| $150,000 to $199,999 | 138 | 53.3% |
| $200,000+ | 0 | 0.0% |
Family Income by Famaliy Size in Edgewater
2-person families (211 | 81.5%) account for the highest median family income in Edgewater with $168,046 per family, while 2-person families (211 | 81.5%) have the highest median income of $84,023 per family member.
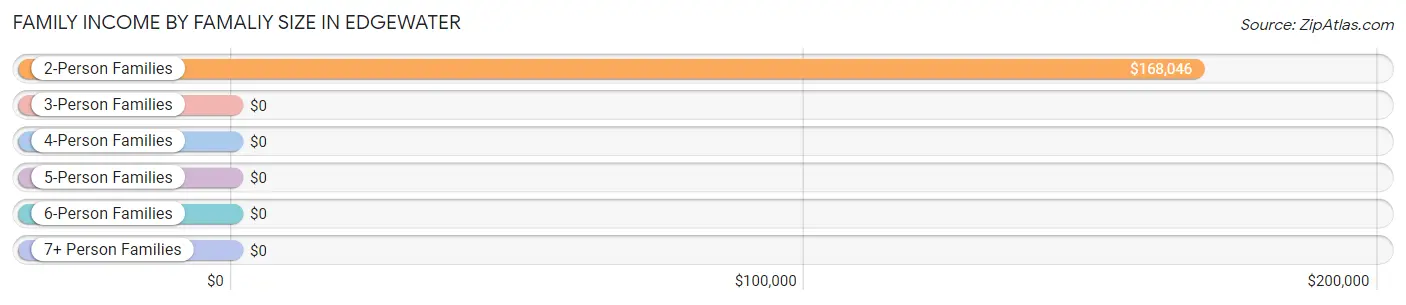
| Income Bracket | # Families | Median Income |
| 2-Person Families | 211 (81.5%) | $168,046 |
| 3-Person Families | 39 (15.1%) | $0 |
| 4-Person Families | 0 (0.0%) | $0 |
| 5-Person Families | 9 (3.5%) | $0 |
| 6-Person Families | 0 (0.0%) | $0 |
| 7+ Person Families | 0 (0.0%) | $0 |
| Total | 259 (100.0%) | $167,657 |
Family Income by Number of Earners in Edgewater
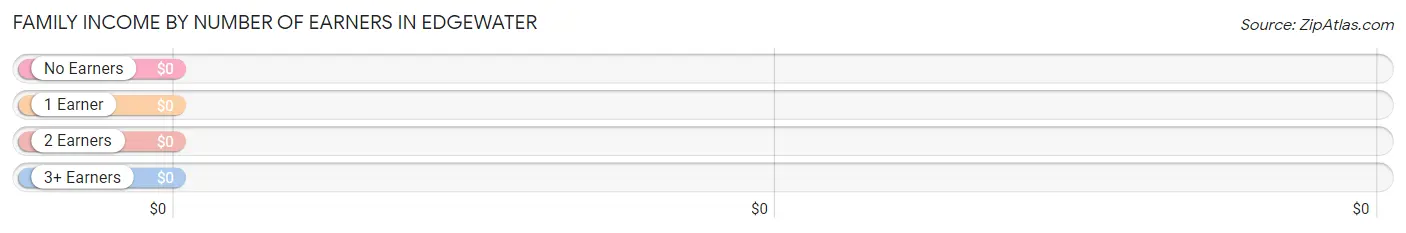
| Number of Earners | # Families | Median Income |
| No Earners | 20 (7.7%) | $0 |
| 1 Earner | 70 (27.0%) | $0 |
| 2 Earners | 144 (55.6%) | $0 |
| 3+ Earners | 25 (9.7%) | $0 |
| Total | 259 (100.0%) | $167,657 |
Household Income in Edgewater
Household Income Brackets in Edgewater
With 156 households falling in the category, the $150,000 to $199,999 income range is the most frequent in Edgewater, accounting for 43.0% of all households.
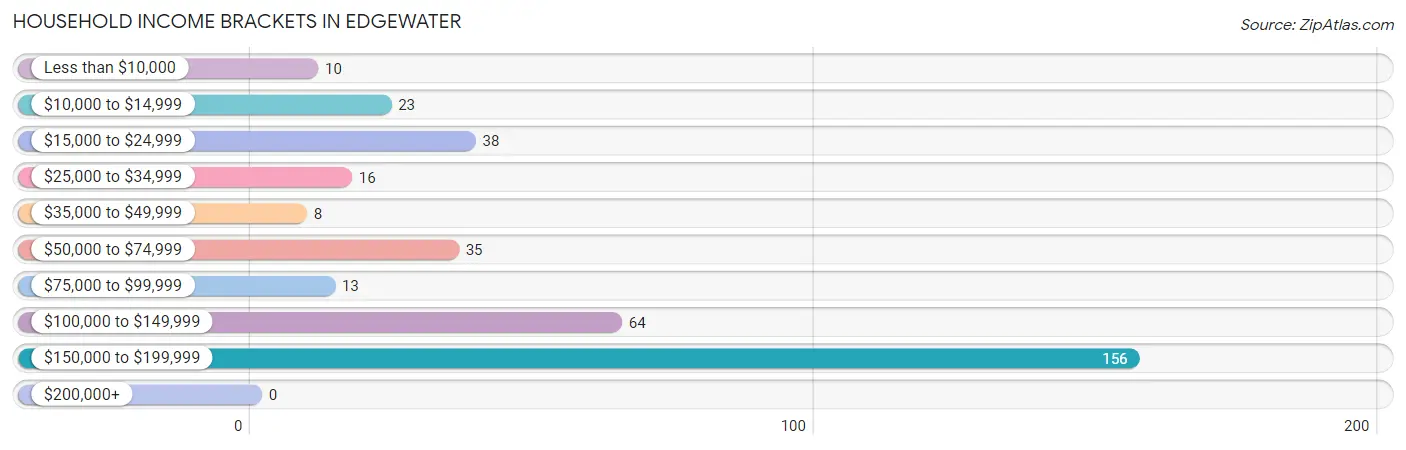
| Income Bracket | # Households | % Households |
| Less than $10,000 | 10 | 2.8% |
| $10,000 to $14,999 | 23 | 6.3% |
| $15,000 to $24,999 | 38 | 10.5% |
| $25,000 to $34,999 | 16 | 4.4% |
| $35,000 to $49,999 | 8 | 2.2% |
| $50,000 to $74,999 | 35 | 9.6% |
| $75,000 to $99,999 | 13 | 3.6% |
| $100,000 to $149,999 | 64 | 17.6% |
| $150,000 to $199,999 | 156 | 43.0% |
| $200,000+ | 0 | 0.0% |
Household Income by Householder Age in Edgewater
The median household income in Edgewater is $140,679, with the highest median household income of $167,815 found in the 45 to 64 years age bracket for the primary householder. A total of 258 households (71.1%) fall into this category.
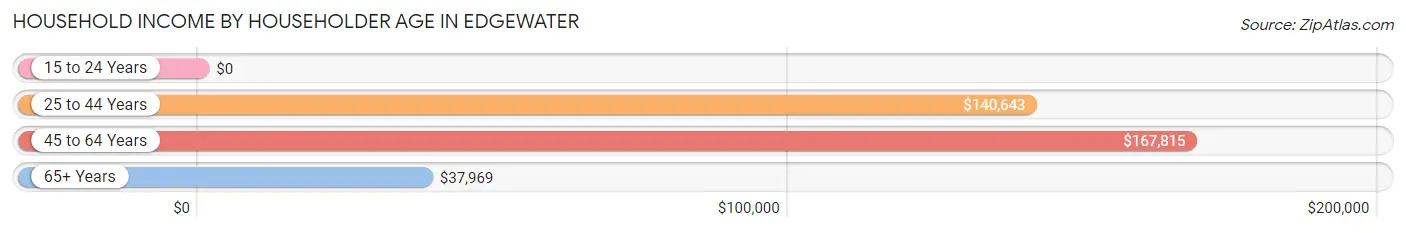
| Income Bracket | # Households | Median Income |
| 15 to 24 Years | 0 (0.0%) | $0 |
| 25 to 44 Years | 52 (14.3%) | $140,643 |
| 45 to 64 Years | 258 (71.1%) | $167,815 |
| 65+ Years | 53 (14.6%) | $37,969 |
| Total | 363 (100.0%) | $140,679 |
Poverty in Edgewater
Income Below Poverty by Sex and Age in Edgewater
With 14.9% poverty level for males and 8.8% for females among the residents of Edgewater, under 5 year old males and 6 to 11 year old females are the most vulnerable to poverty, with 30 males (100.0%) and 5 females (31.2%) in their respective age groups living below the poverty level.
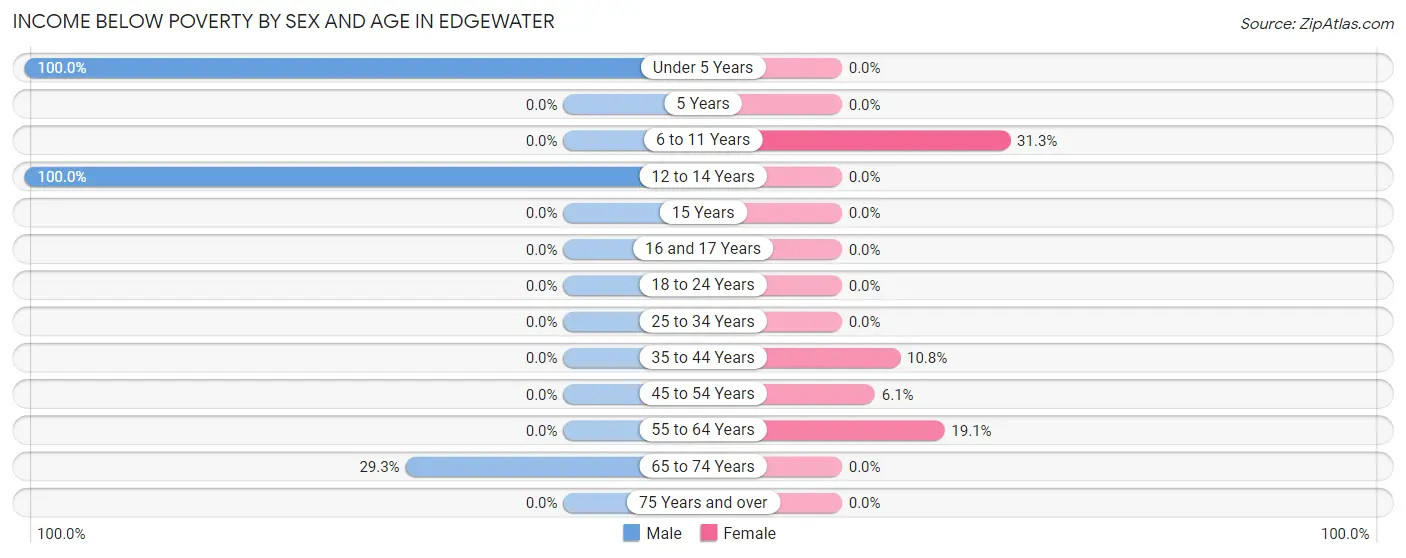
| Age Bracket | Male | Female |
| Under 5 Years | 30 (100.0%) | 0 (0.0%) |
| 5 Years | 0 (0.0%) | 0 (0.0%) |
| 6 to 11 Years | 0 (0.0%) | 5 (31.2%) |
| 12 to 14 Years | 5 (100.0%) | 0 (0.0%) |
| 15 Years | 0 (0.0%) | 0 (0.0%) |
| 16 and 17 Years | 0 (0.0%) | 0 (0.0%) |
| 18 to 24 Years | 0 (0.0%) | 0 (0.0%) |
| 25 to 34 Years | 0 (0.0%) | 0 (0.0%) |
| 35 to 44 Years | 0 (0.0%) | 4 (10.8%) |
| 45 to 54 Years | 0 (0.0%) | 10 (6.1%) |
| 55 to 64 Years | 0 (0.0%) | 20 (19.1%) |
| 65 to 74 Years | 17 (29.3%) | 0 (0.0%) |
| 75 Years and over | 0 (0.0%) | 0 (0.0%) |
| Total | 52 (14.9%) | 39 (8.8%) |
Income Above Poverty by Sex and Age in Edgewater
According to the poverty statistics in Edgewater, males aged 18 to 24 years and females aged under 5 years are the age groups that are most secure financially, with 100.0% of males and 100.0% of females in these age groups living above the poverty line.
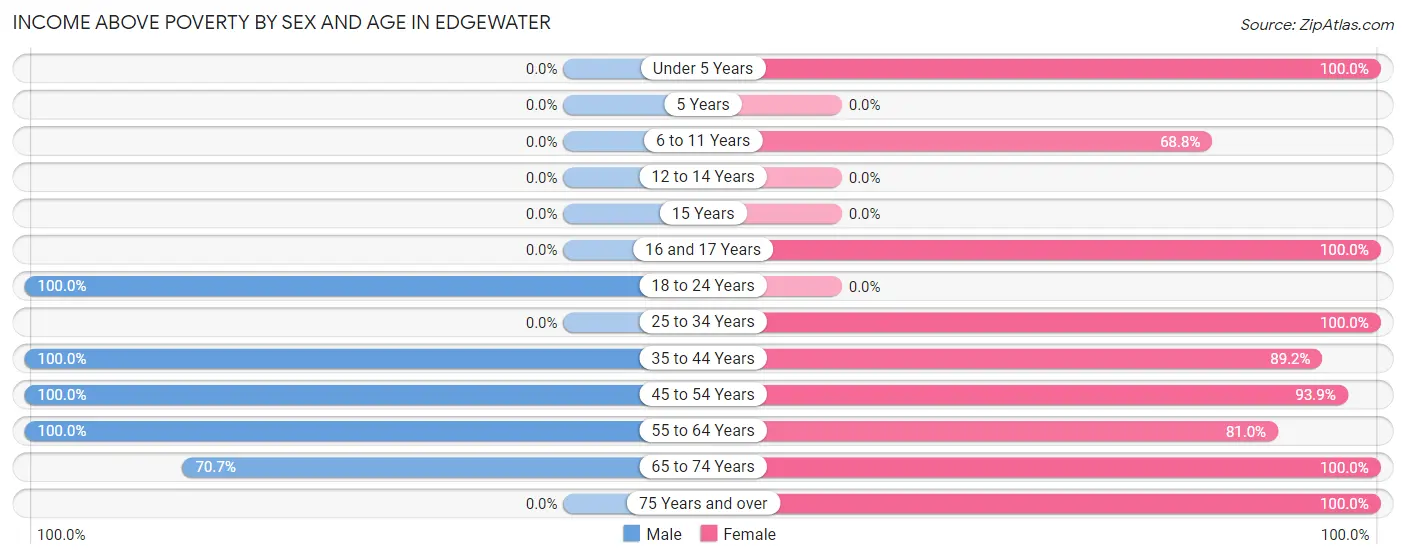
| Age Bracket | Male | Female |
| Under 5 Years | 0 (0.0%) | 48 (100.0%) |
| 5 Years | 0 (0.0%) | 0 (0.0%) |
| 6 to 11 Years | 0 (0.0%) | 11 (68.8%) |
| 12 to 14 Years | 0 (0.0%) | 0 (0.0%) |
| 15 Years | 0 (0.0%) | 0 (0.0%) |
| 16 and 17 Years | 0 (0.0%) | 26 (100.0%) |
| 18 to 24 Years | 3 (100.0%) | 0 (0.0%) |
| 25 to 34 Years | 0 (0.0%) | 35 (100.0%) |
| 35 to 44 Years | 40 (100.0%) | 33 (89.2%) |
| 45 to 54 Years | 203 (100.0%) | 153 (93.9%) |
| 55 to 64 Years | 11 (100.0%) | 85 (80.9%) |
| 65 to 74 Years | 41 (70.7%) | 3 (100.0%) |
| 75 Years and over | 0 (0.0%) | 10 (100.0%) |
| Total | 298 (85.1%) | 404 (91.2%) |
Income Below Poverty Among Married-Couple Families in Edgewater
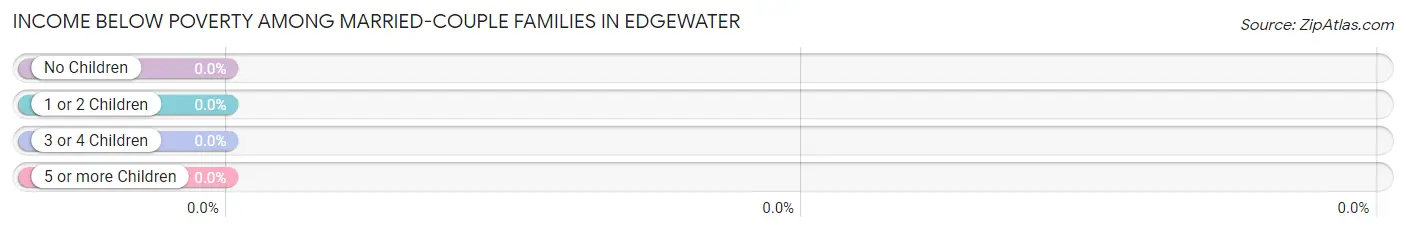
| Children | Above Poverty | Below Poverty |
| No Children | 169 (100.0%) | 0 (0.0%) |
| 1 or 2 Children | 22 (100.0%) | 0 (0.0%) |
| 3 or 4 Children | 0 (0.0%) | 0 (0.0%) |
| 5 or more Children | 0 (0.0%) | 0 (0.0%) |
| Total | 191 (100.0%) | 0 (0.0%) |
Income Below Poverty Among Single-Parent Households in Edgewater
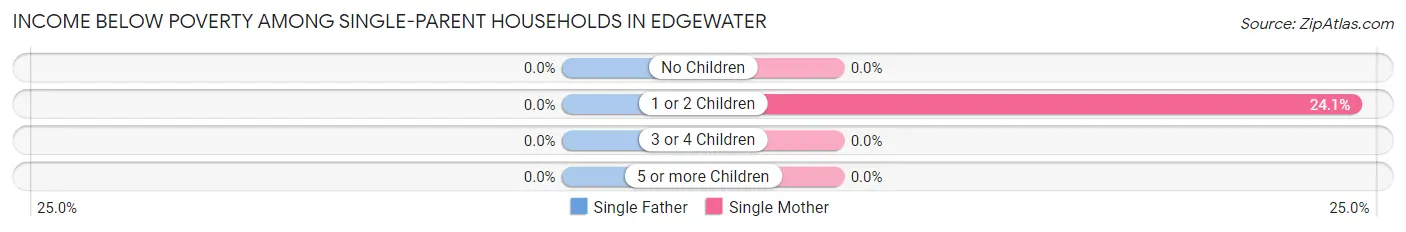
| Children | Single Father | Single Mother |
| No Children | 0 (0.0%) | 0 (0.0%) |
| 1 or 2 Children | 0 (0.0%) | 14 (24.1%) |
| 3 or 4 Children | 0 (0.0%) | 0 (0.0%) |
| 5 or more Children | 0 (0.0%) | 0 (0.0%) |
| Total | 0 (0.0%) | 14 (23.0%) |
Income Below Poverty Among Married-Couple vs Single-Parent Households in Edgewater
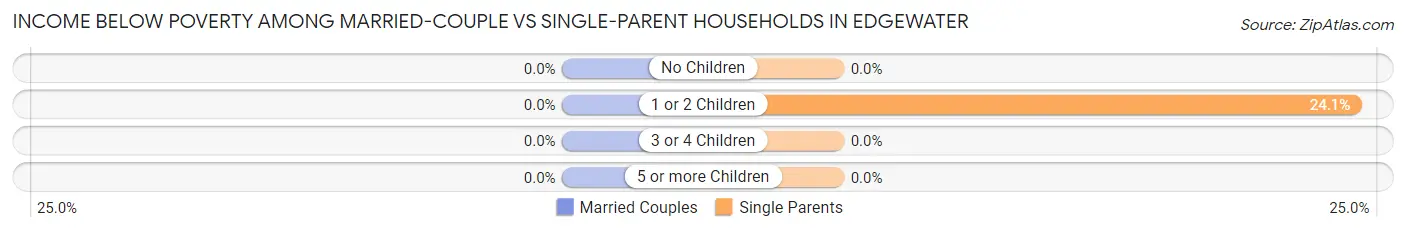
| Children | Married-Couple Families | Single-Parent Households |
| No Children | 0 (0.0%) | 0 (0.0%) |
| 1 or 2 Children | 0 (0.0%) | 14 (24.1%) |
| 3 or 4 Children | 0 (0.0%) | 0 (0.0%) |
| 5 or more Children | 0 (0.0%) | 0 (0.0%) |
| Total | 0 (0.0%) | 14 (20.6%) |
Race in Edgewater
The most populous races in Edgewater are Black / African American (655 | 82.6%), White / Caucasian (98 | 12.4%), and Hispanic or Latino (40 | 5.0%).
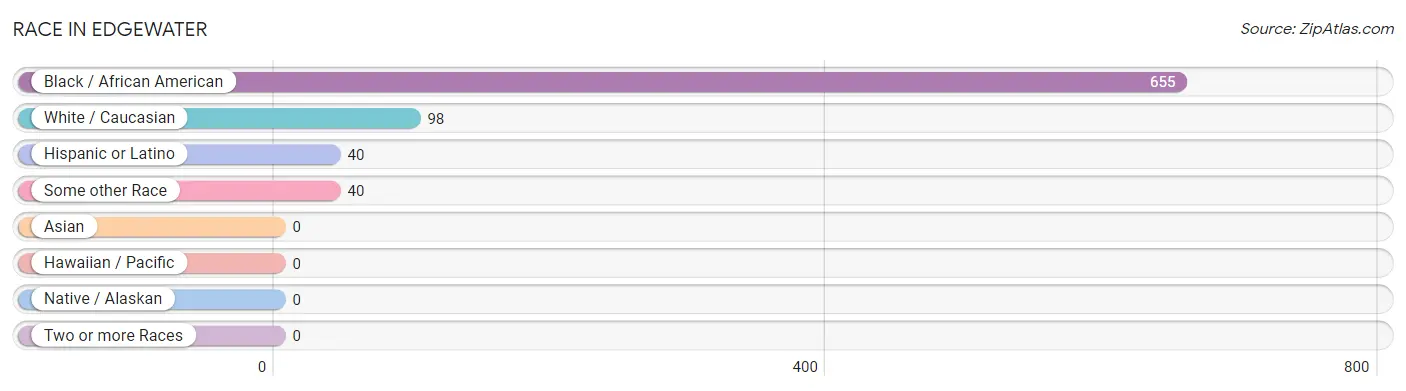
| Race | # Population | % Population |
| Asian | 0 | 0.0% |
| Black / African American | 655 | 82.6% |
| Hawaiian / Pacific | 0 | 0.0% |
| Hispanic or Latino | 40 | 5.0% |
| Native / Alaskan | 0 | 0.0% |
| White / Caucasian | 98 | 12.4% |
| Two or more Races | 0 | 0.0% |
| Some other Race | 40 | 5.0% |
| Total | 793 | 100.0% |
Ancestry in Edgewater
The most populous ancestries reported in Edgewater are English (44 | 5.6%), American (43 | 5.4%), Mexican (40 | 5.0%), German (18 | 2.3%), and Scottish (15 | 1.9%), together accounting for 20.2% of all Edgewater residents.
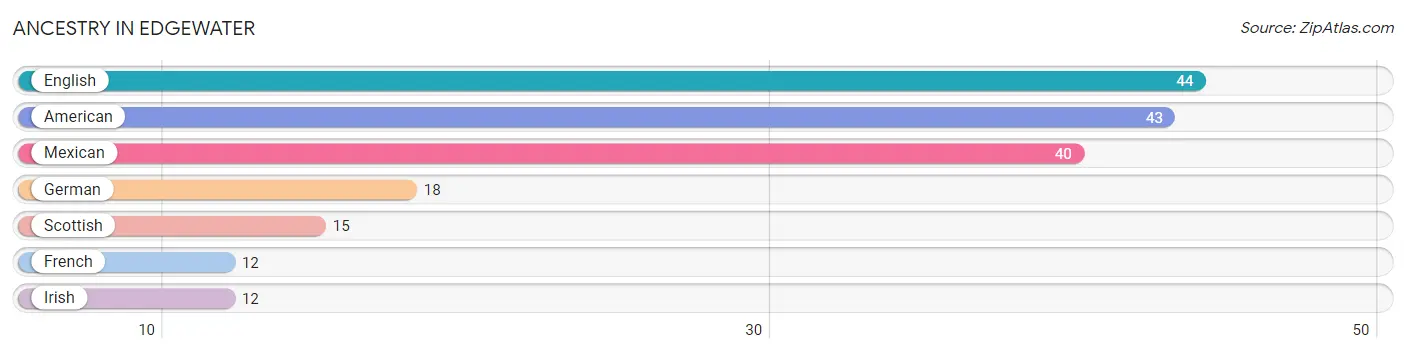
| Ancestry | # Population | % Population |
| American | 43 | 5.4% |
| English | 44 | 5.6% |
| French | 12 | 1.5% |
| German | 18 | 2.3% |
| Irish | 12 | 1.5% |
| Mexican | 40 | 5.0% |
| Scottish | 15 | 1.9% | View All 7 Rows |
Immigrants in Edgewater
The most numerous immigrant groups reported in Edgewater came from Central America (40 | 5.0%), Latin America (40 | 5.0%), and Mexico (40 | 5.0%), together accounting for 15.1% of all Edgewater residents.
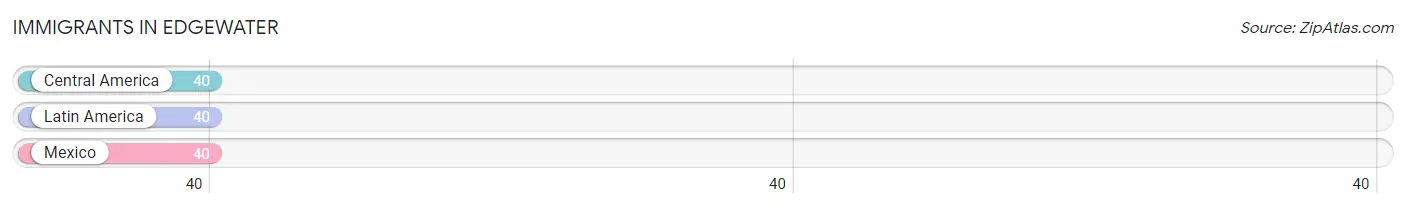
| Immigration Origin | # Population | % Population |
| Central America | 40 | 5.0% |
| Latin America | 40 | 5.0% |
| Mexico | 40 | 5.0% | View All 3 Rows |
Sex and Age in Edgewater
Sex and Age in Edgewater
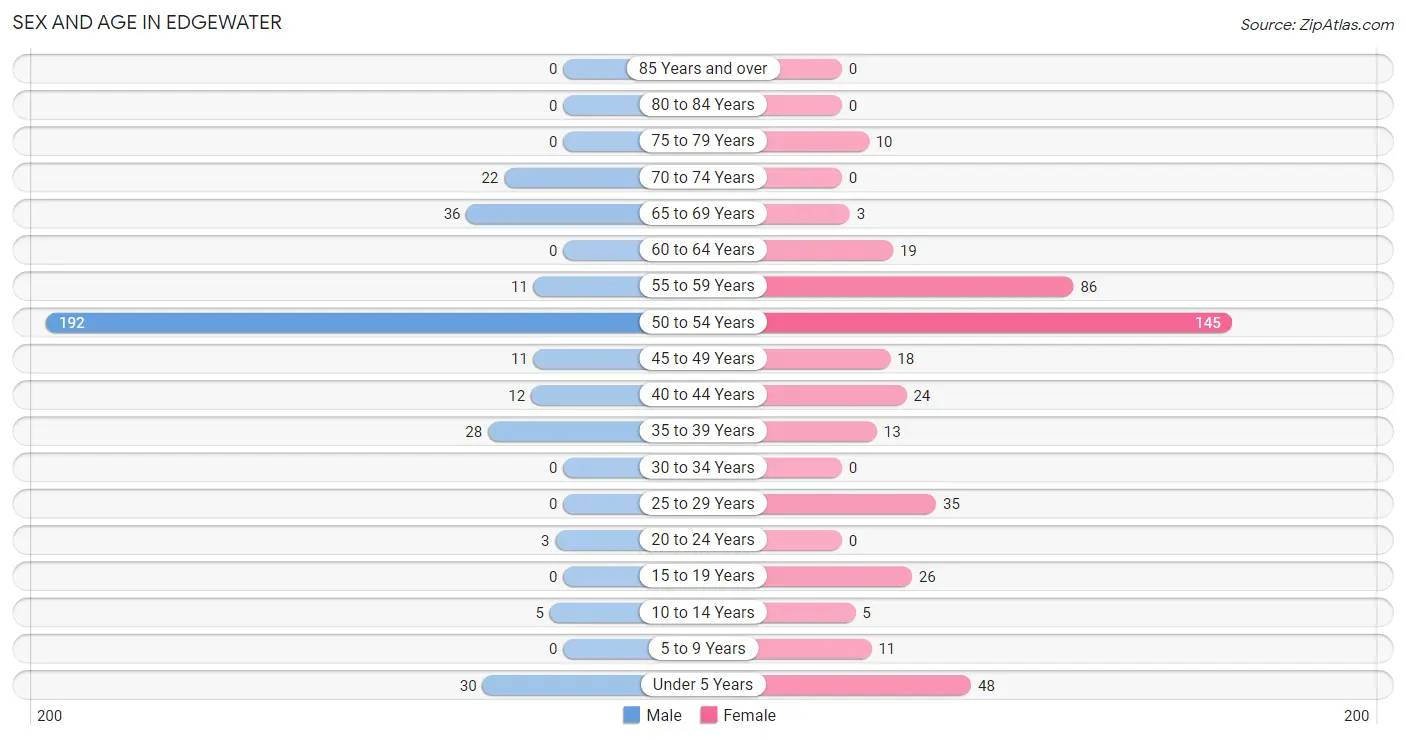
The most populous age groups in Edgewater are 50 to 54 Years (192 | 54.9%) for men and 50 to 54 Years (145 | 32.7%) for women.
| Age Bracket | Male | Female |
| Under 5 Years | 30 (8.6%) | 48 (10.8%) |
| 5 to 9 Years | 0 (0.0%) | 11 (2.5%) |
| 10 to 14 Years | 5 (1.4%) | 5 (1.1%) |
| 15 to 19 Years | 0 (0.0%) | 26 (5.9%) |
| 20 to 24 Years | 3 (0.9%) | 0 (0.0%) |
| 25 to 29 Years | 0 (0.0%) | 35 (7.9%) |
| 30 to 34 Years | 0 (0.0%) | 0 (0.0%) |
| 35 to 39 Years | 28 (8.0%) | 13 (2.9%) |
| 40 to 44 Years | 12 (3.4%) | 24 (5.4%) |
| 45 to 49 Years | 11 (3.1%) | 18 (4.1%) |
| 50 to 54 Years | 192 (54.9%) | 145 (32.7%) |
| 55 to 59 Years | 11 (3.1%) | 86 (19.4%) |
| 60 to 64 Years | 0 (0.0%) | 19 (4.3%) |
| 65 to 69 Years | 36 (10.3%) | 3 (0.7%) |
| 70 to 74 Years | 22 (6.3%) | 0 (0.0%) |
| 75 to 79 Years | 0 (0.0%) | 10 (2.3%) |
| 80 to 84 Years | 0 (0.0%) | 0 (0.0%) |
| 85 Years and over | 0 (0.0%) | 0 (0.0%) |
| Total | 350 (100.0%) | 443 (100.0%) |
Families and Households in Edgewater
Median Family Size in Edgewater
The median family size in Edgewater is 2.50 persons per family, with single female/mother families (61 | 23.5%) accounting for the largest median family size of 3.28 persons per family. On the other hand, single male/father families (7 | 2.7%) represent the smallest median family size with 2.14 persons per family.
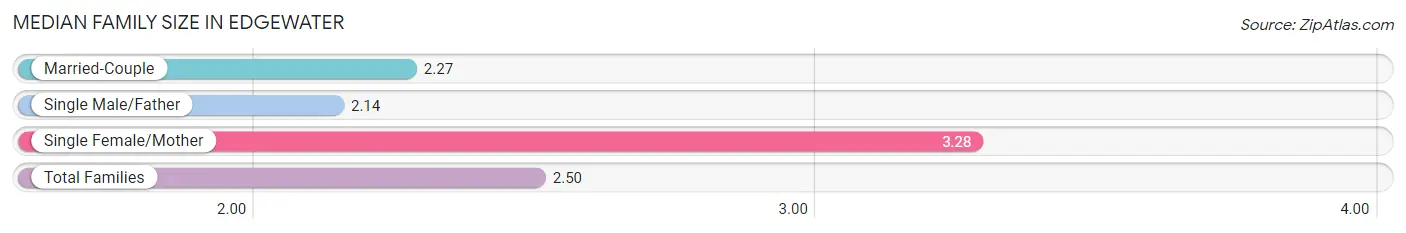
| Family Type | # Families | Family Size |
| Married-Couple | 191 (73.8%) | 2.27 |
| Single Male/Father | 7 (2.7%) | 2.14 |
| Single Female/Mother | 61 (23.5%) | 3.28 |
| Total Families | 259 (100.0%) | 2.50 |
Median Household Size in Edgewater
The median household size in Edgewater is 2.18 persons per household, with single female/mother households (61 | 16.8%) accounting for the largest median household size of 3.28 persons per household. non-family households (104 | 28.6%) represent the smallest median household size with 1.25 persons per household.
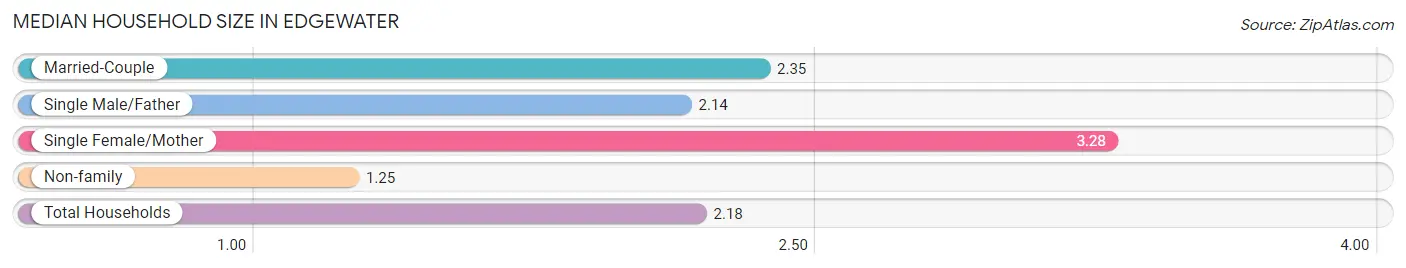
| Household Type | # Households | Household Size |
| Married-Couple | 191 (52.6%) | 2.35 |
| Single Male/Father | 7 (1.9%) | 2.14 |
| Single Female/Mother | 61 (16.8%) | 3.28 |
| Non-family | 104 (28.6%) | 1.25 |
| Total Households | 363 (100.0%) | 2.18 |
Household Size by Marriage Status in Edgewater
Out of a total of 363 households in Edgewater, 259 (71.4%) are family households, while 104 (28.6%) are nonfamily households. The most numerous type of family households are 2-person households, comprising 198, and the most common type of nonfamily households are 1-person households, comprising 78.
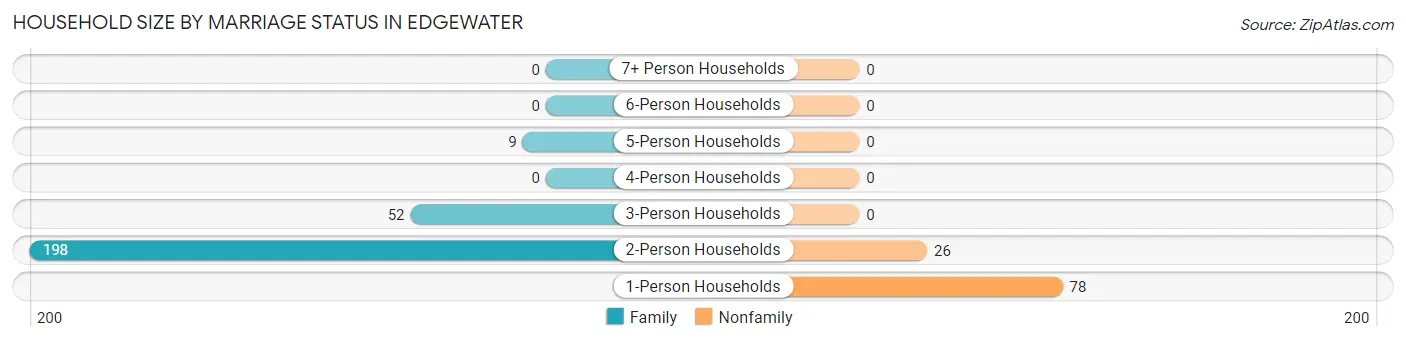
| Household Size | Family Households | Nonfamily Households |
| 1-Person Households | - | 78 (21.5%) |
| 2-Person Households | 198 (54.5%) | 26 (7.2%) |
| 3-Person Households | 52 (14.3%) | 0 (0.0%) |
| 4-Person Households | 0 (0.0%) | 0 (0.0%) |
| 5-Person Households | 9 (2.5%) | 0 (0.0%) |
| 6-Person Households | 0 (0.0%) | 0 (0.0%) |
| 7+ Person Households | 0 (0.0%) | 0 (0.0%) |
| Total | 259 (71.4%) | 104 (28.6%) |
Female Fertility in Edgewater
Fertility by Age in Edgewater
| Age Bracket | Women with Births | Births / 1,000 Women |
| 15 to 19 years | 0 (0.0%) | 0.0 |
| 20 to 34 years | 0 (0.0%) | 0.0 |
| 35 to 50 years | 0 (0.0%) | 0.0 |
| Total | 0 (0.0%) | 0.0 |
Fertility by Age by Marriage Status in Edgewater
| Age Bracket | Married | Unmarried |
| 15 to 19 years | 0 (0.0%) | 0 (0.0%) |
| 20 to 34 years | 0 (0.0%) | 0 (0.0%) |
| 35 to 50 years | 0 (0.0%) | 0 (0.0%) |
| Total | 0 (0.0%) | 0 (0.0%) |
Fertility by Education in Edgewater
| Educational Attainment | Women with Births | Births / 1,000 Women |
| Less than High School | 0 (0.0%) | 0.0 |
| High School Diploma | 0 (0.0%) | 0.0 |
| College or Associate's Degree | 0 (0.0%) | 0.0 |
| Bachelor's Degree | 0 (0.0%) | 0.0 |
| Graduate Degree | 0 (0.0%) | 0.0 |
| Total | 0 (0.0%) | 0.0 |
Fertility by Education by Marriage Status in Edgewater
| Educational Attainment | Married | Unmarried |
| Less than High School | 0 (0.0%) | 0 (0.0%) |
| High School Diploma | 0 (0.0%) | 0 (0.0%) |
| College or Associate's Degree | 0 (0.0%) | 0 (0.0%) |
| Bachelor's Degree | 0 (0.0%) | 0 (0.0%) |
| Graduate Degree | 0 (0.0%) | 0 (0.0%) |
| Total | 0 (0.0%) | 0 (0.0%) |
Employment Characteristics in Edgewater
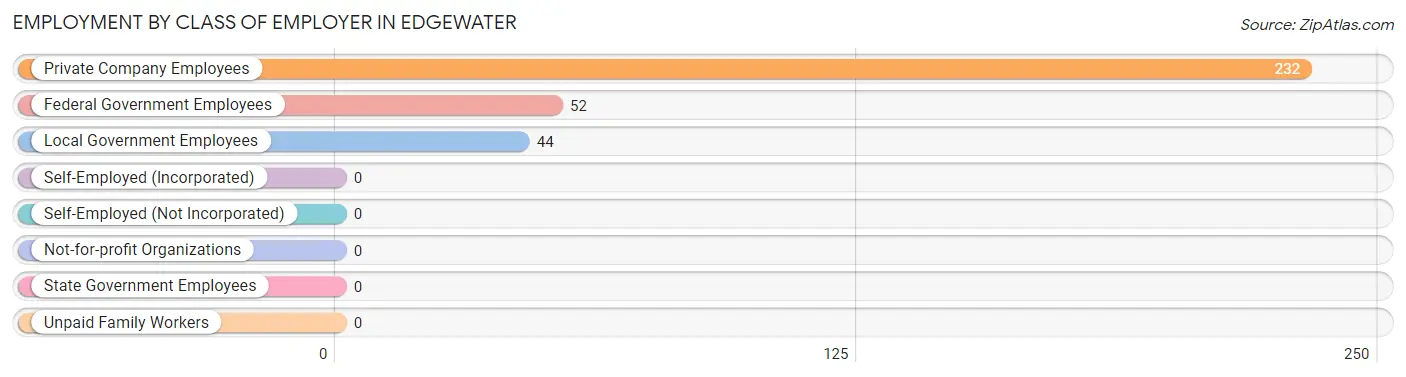
Employment by Class of Employer in Edgewater
Among the 328 employed individuals in Edgewater, private company employees (232 | 70.7%), federal government employees (52 | 15.9%), and local government employees (44 | 13.4%) make up the most common classes of employment.
| Employer Class | # Employees | % Employees |
| Private Company Employees | 232 | 70.7% |
| Self-Employed (Incorporated) | 0 | 0.0% |
| Self-Employed (Not Incorporated) | 0 | 0.0% |
| Not-for-profit Organizations | 0 | 0.0% |
| Local Government Employees | 44 | 13.4% |
| State Government Employees | 0 | 0.0% |
| Federal Government Employees | 52 | 15.9% |
| Unpaid Family Workers | 0 | 0.0% |
| Total | 328 | 100.0% |
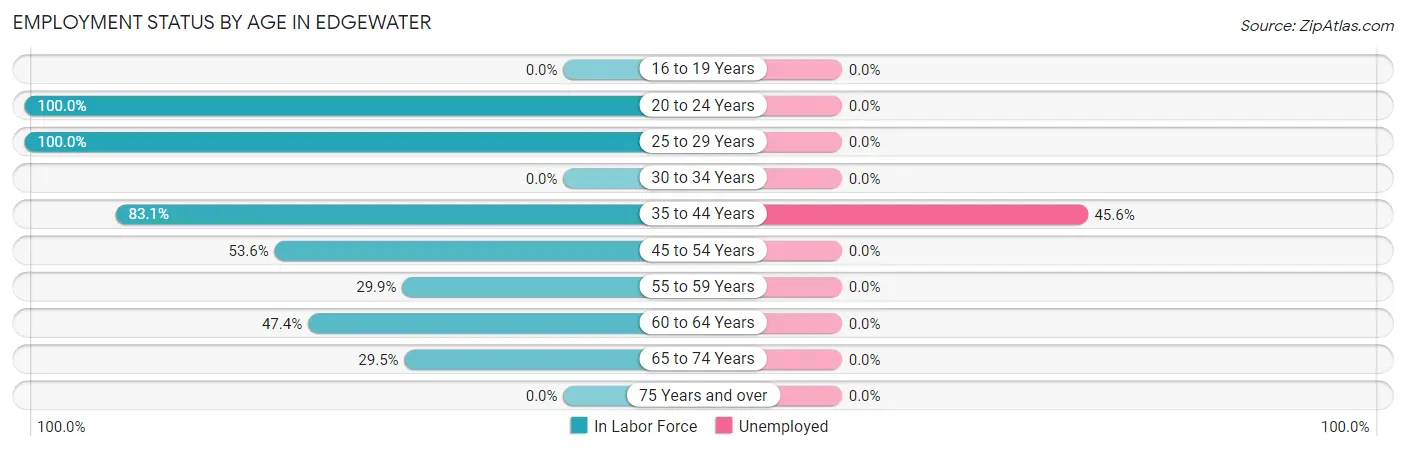
Employment Status by Age in Edgewater
According to the labor force statistics for Edgewater, out of the total population over 16 years of age (694), 51.0% or 354 individuals are in the labor force, with 7.5% or 27 of them unemployed. The age group with the highest labor force participation rate is 20 to 24 years, with 100.0% or 3 individuals in the labor force. Within the labor force, the 35 to 44 years age range has the highest percentage of unemployed individuals, with 45.6% or 29 of them being unemployed.
| Age Bracket | In Labor Force | Unemployed |
| 16 to 19 Years | 0 (0.0%) | 0 (0.0%) |
| 20 to 24 Years | 3 (100.0%) | 0 (0.0%) |
| 25 to 29 Years | 35 (100.0%) | 0 (0.0%) |
| 30 to 34 Years | 0 (0.0%) | 0 (0.0%) |
| 35 to 44 Years | 64 (83.1%) | 29 (45.6%) |
| 45 to 54 Years | 196 (53.6%) | 0 (0.0%) |
| 55 to 59 Years | 29 (29.9%) | 0 (0.0%) |
| 60 to 64 Years | 9 (47.4%) | 0 (0.0%) |
| 65 to 74 Years | 18 (29.5%) | 0 (0.0%) |
| 75 Years and over | 0 (0.0%) | 0 (0.0%) |
| Total | 354 (51.0%) | 27 (7.5%) |
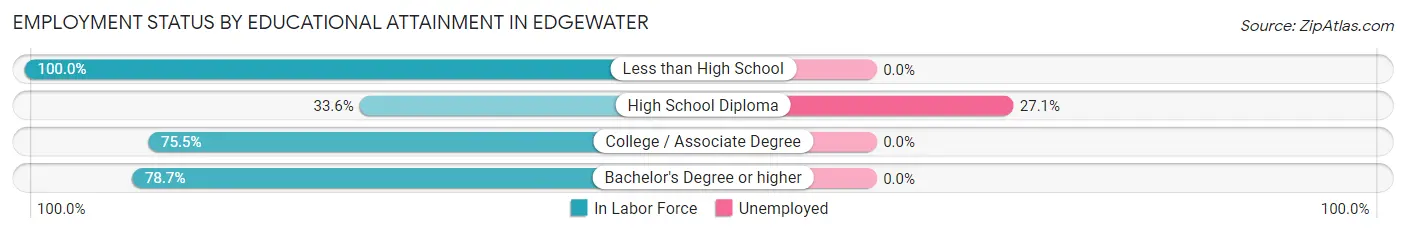
Employment Status by Educational Attainment in Edgewater
According to labor force statistics for Edgewater, 56.1% of individuals (333) out of the total population between 25 and 64 years of age (594) are in the labor force, with 8.0% or 27 of them being unemployed. The group with the highest labor force participation rate are those with the educational attainment of less than high school, with 100.0% or 10 individuals in the labor force. Within the labor force, individuals with high school diploma education have the highest percentage of unemployment, with 27.1% or 26 of them being unemployed.
| Educational Attainment | In Labor Force | Unemployed |
| Less than High School | 10 (100.0%) | 0 (0.0%) |
| High School Diploma | 96 (33.6%) | 78 (27.1%) |
| College / Associate Degree | 179 (75.5%) | 0 (0.0%) |
| Bachelor's Degree or higher | 48 (78.7%) | 0 (0.0%) |
| Total | 333 (56.1%) | 48 (8.0%) |
Employment Occupations by Sex in Edgewater
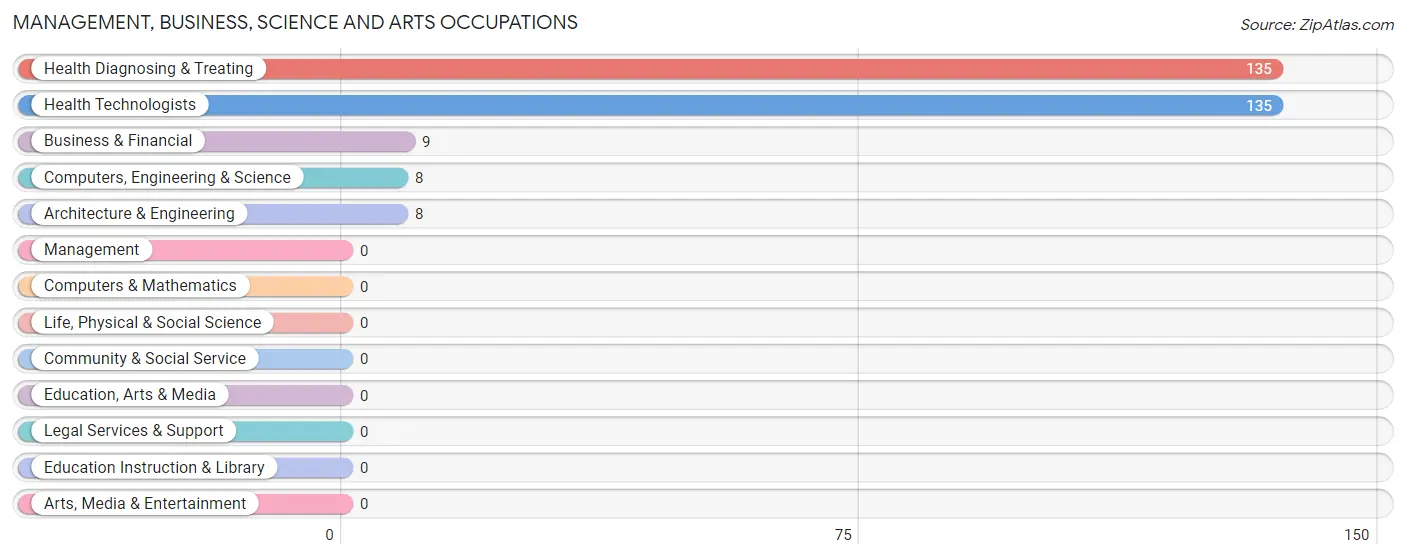
Management, Business, Science and Arts Occupations
The most common Management, Business, Science and Arts occupations in Edgewater are Health Diagnosing & Treating (135 | 42.1%), Health Technologists (135 | 42.1%), Business & Financial (9 | 2.8%), Computers, Engineering & Science (8 | 2.5%), and Architecture & Engineering (8 | 2.5%).
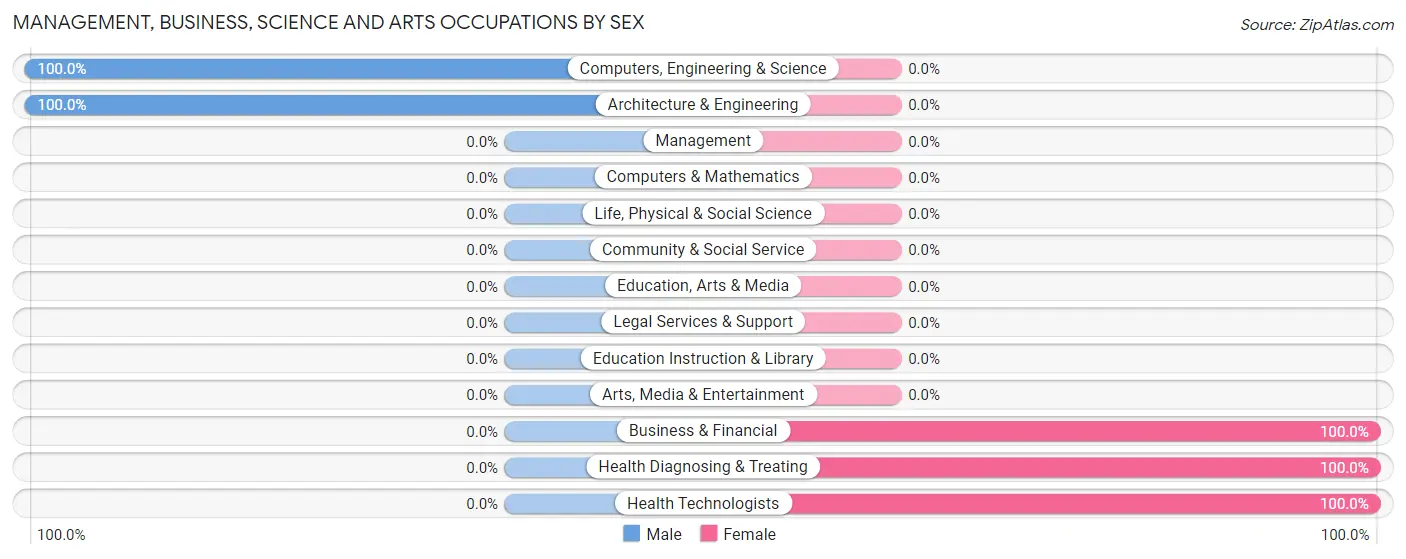
Management, Business, Science and Arts Occupations by Sex
Within the Management, Business, Science and Arts occupations in Edgewater, the most male-oriented occupations are Computers, Engineering & Science (100.0%), and Architecture & Engineering (100.0%), while the most female-oriented occupations are Business & Financial (100.0%), Health Diagnosing & Treating (100.0%), and Health Technologists (100.0%).
| Occupation | Male | Female |
| Management | 0 (0.0%) | 0 (0.0%) |
| Business & Financial | 0 (0.0%) | 9 (100.0%) |
| Computers, Engineering & Science | 8 (100.0%) | 0 (0.0%) |
| Computers & Mathematics | 0 (0.0%) | 0 (0.0%) |
| Architecture & Engineering | 8 (100.0%) | 0 (0.0%) |
| Life, Physical & Social Science | 0 (0.0%) | 0 (0.0%) |
| Community & Social Service | 0 (0.0%) | 0 (0.0%) |
| Education, Arts & Media | 0 (0.0%) | 0 (0.0%) |
| Legal Services & Support | 0 (0.0%) | 0 (0.0%) |
| Education Instruction & Library | 0 (0.0%) | 0 (0.0%) |
| Arts, Media & Entertainment | 0 (0.0%) | 0 (0.0%) |
| Health Diagnosing & Treating | 0 (0.0%) | 135 (100.0%) |
| Health Technologists | 0 (0.0%) | 135 (100.0%) |
| Total (Category) | 8 (5.3%) | 144 (94.7%) |
| Total (Overall) | 91 (28.3%) | 230 (71.7%) |
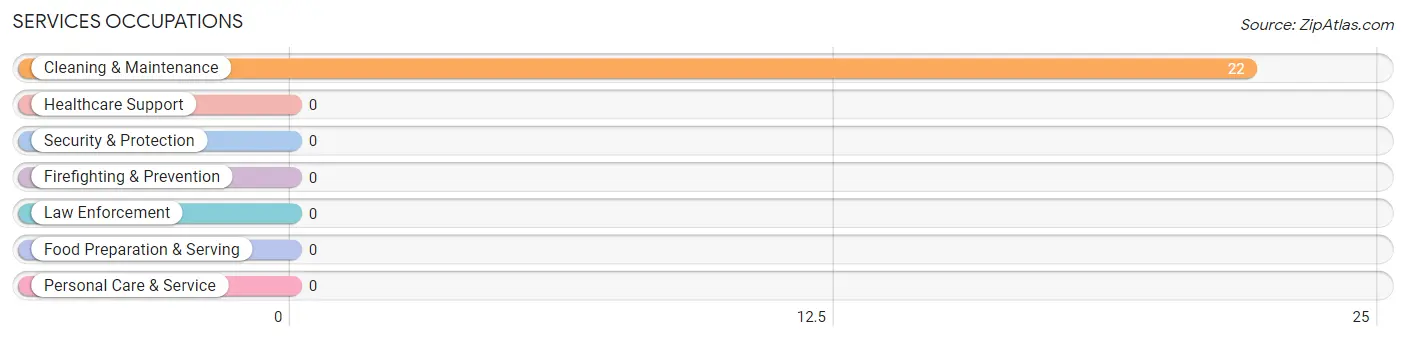
Services Occupations
The most common Services occupations in Edgewater are , and Cleaning & Maintenance (22 | 6.9%).
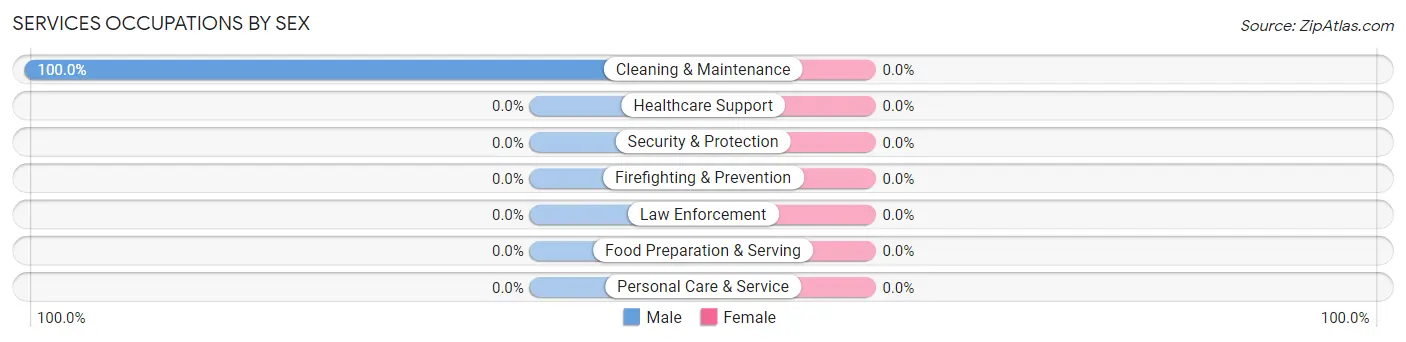
Services Occupations by Sex
| Occupation | Male | Female |
| Healthcare Support | 0 (0.0%) | 0 (0.0%) |
| Security & Protection | 0 (0.0%) | 0 (0.0%) |
| Firefighting & Prevention | 0 (0.0%) | 0 (0.0%) |
| Law Enforcement | 0 (0.0%) | 0 (0.0%) |
| Food Preparation & Serving | 0 (0.0%) | 0 (0.0%) |
| Cleaning & Maintenance | 22 (100.0%) | 0 (0.0%) |
| Personal Care & Service | 0 (0.0%) | 0 (0.0%) |
| Total (Category) | 22 (100.0%) | 0 (0.0%) |
| Total (Overall) | 91 (28.3%) | 230 (71.7%) |
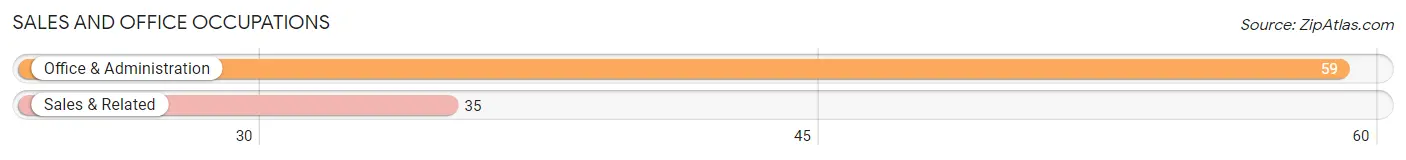
Sales and Office Occupations
The most common Sales and Office occupations in Edgewater are Office & Administration (59 | 18.4%), and Sales & Related (35 | 10.9%).
Sales and Office Occupations by Sex
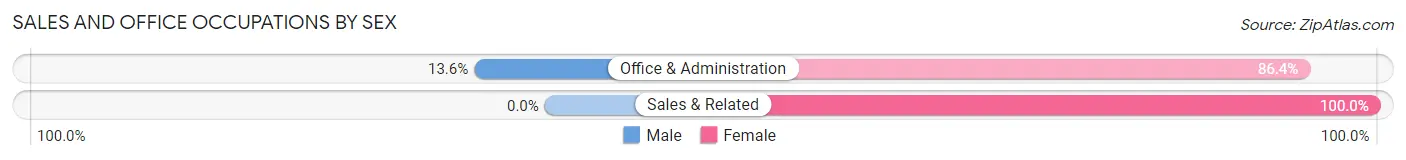
| Occupation | Male | Female |
| Sales & Related | 0 (0.0%) | 35 (100.0%) |
| Office & Administration | 8 (13.6%) | 51 (86.4%) |
| Total (Category) | 8 (8.5%) | 86 (91.5%) |
| Total (Overall) | 91 (28.3%) | 230 (71.7%) |
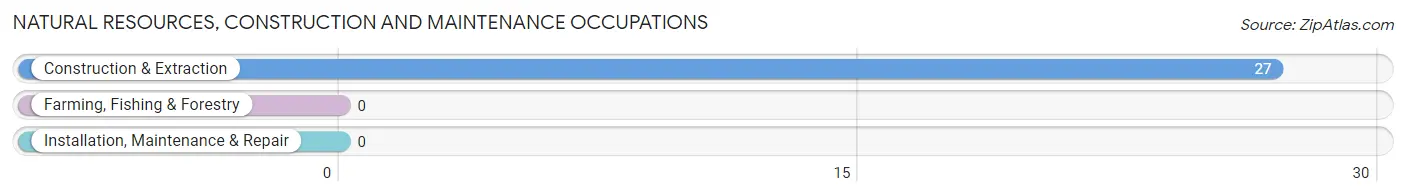
Natural Resources, Construction and Maintenance Occupations
The most common Natural Resources, Construction and Maintenance occupations in Edgewater are , and Construction & Extraction (27 | 8.4%).
Natural Resources, Construction and Maintenance Occupations by Sex
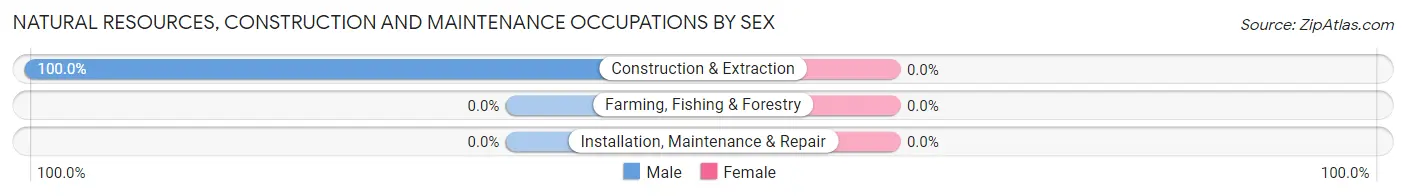
| Occupation | Male | Female |
| Farming, Fishing & Forestry | 0 (0.0%) | 0 (0.0%) |
| Construction & Extraction | 27 (100.0%) | 0 (0.0%) |
| Installation, Maintenance & Repair | 0 (0.0%) | 0 (0.0%) |
| Total (Category) | 27 (100.0%) | 0 (0.0%) |
| Total (Overall) | 91 (28.3%) | 230 (71.7%) |
Production, Transportation and Moving Occupations
The most common Production, Transportation and Moving occupations in Edgewater are Transportation (23 | 7.2%), and Production (3 | 0.9%).
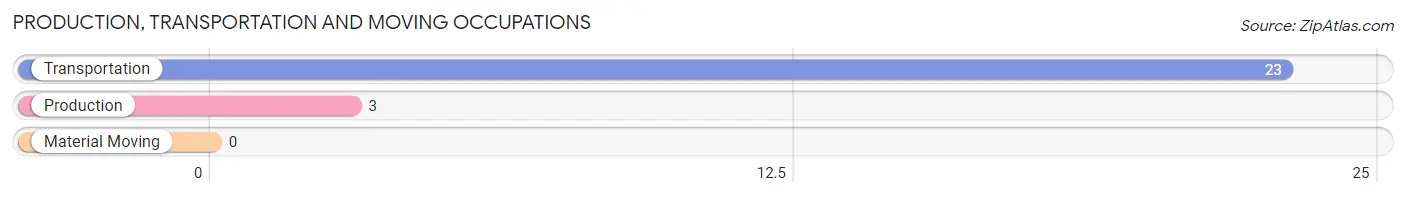
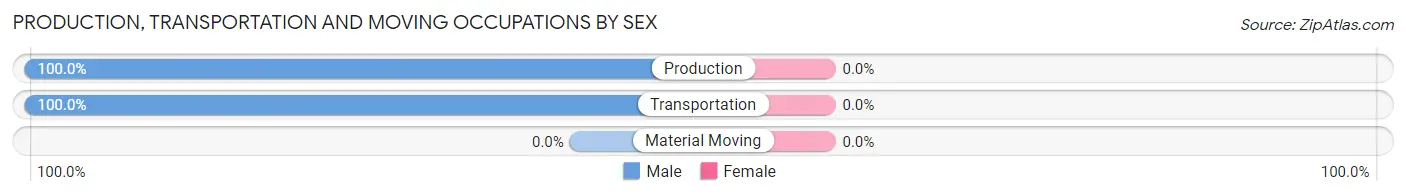
Production, Transportation and Moving Occupations by Sex
| Occupation | Male | Female |
| Production | 3 (100.0%) | 0 (0.0%) |
| Transportation | 23 (100.0%) | 0 (0.0%) |
| Material Moving | 0 (0.0%) | 0 (0.0%) |
| Total (Category) | 26 (100.0%) | 0 (0.0%) |
| Total (Overall) | 91 (28.3%) | 230 (71.7%) |
Employment Industries by Sex in Edgewater
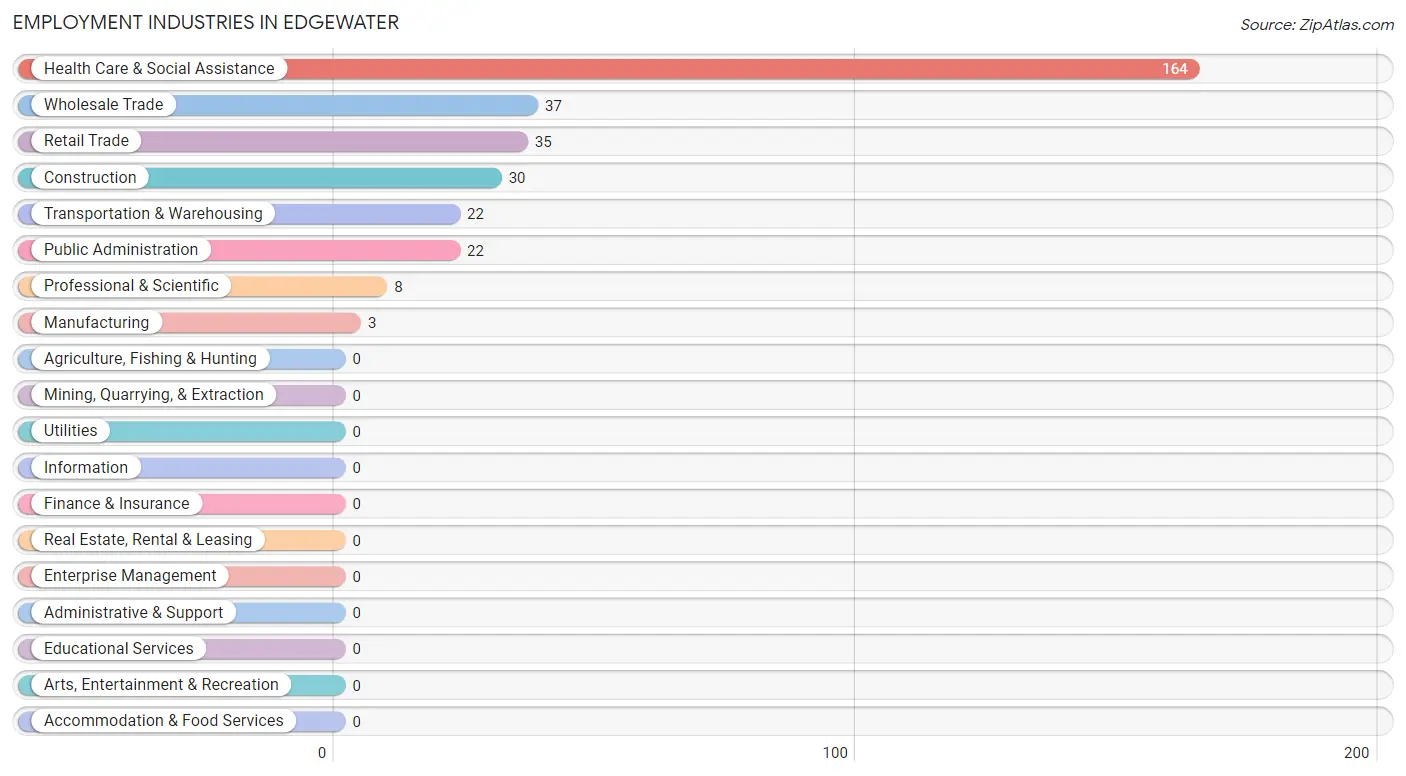
Employment Industries in Edgewater
The major employment industries in Edgewater include Health Care & Social Assistance (164 | 51.1%), Wholesale Trade (37 | 11.5%), Retail Trade (35 | 10.9%), Construction (30 | 9.3%), and Transportation & Warehousing (22 | 6.9%).
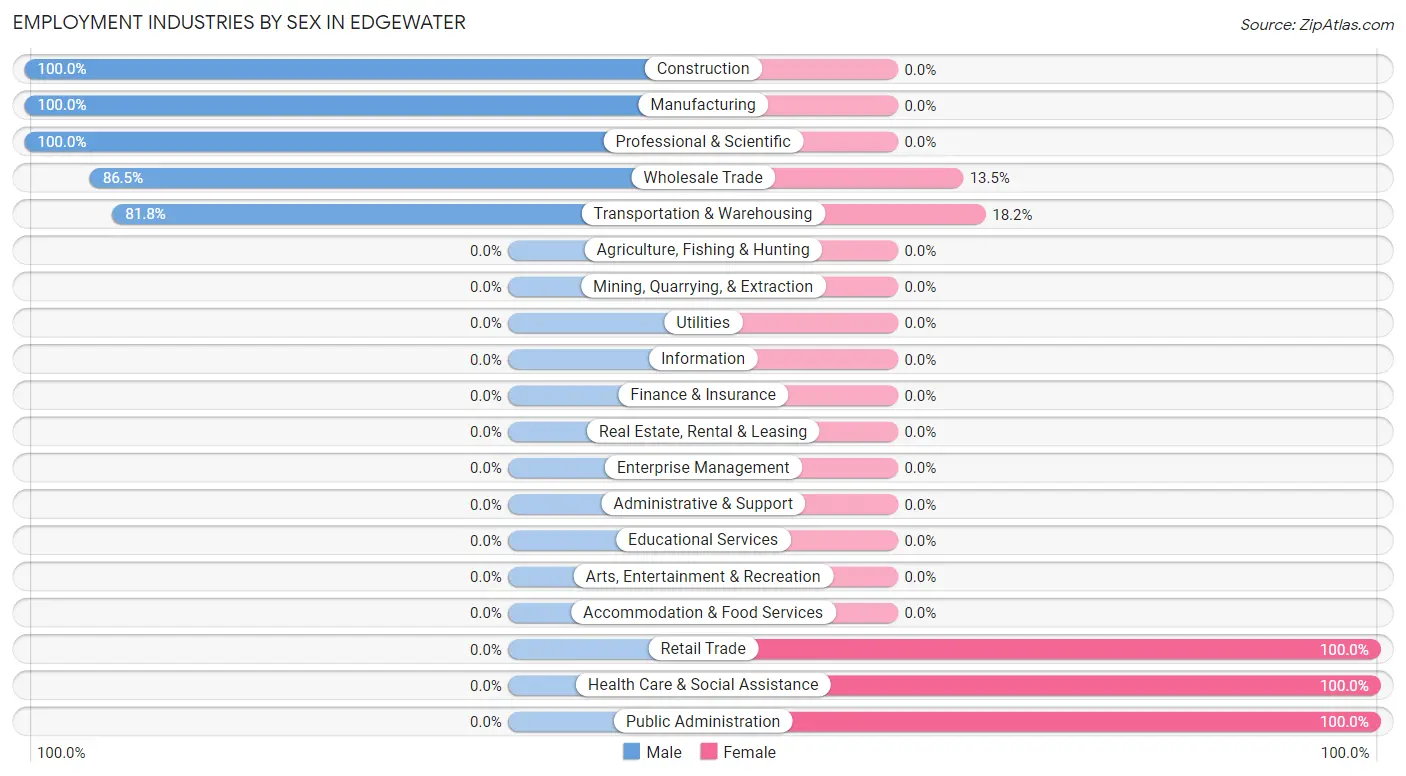
Employment Industries by Sex in Edgewater
The Edgewater industries that see more men than women are Construction (100.0%), Manufacturing (100.0%), and Professional & Scientific (100.0%), whereas the industries that tend to have a higher number of women are Retail Trade (100.0%), Health Care & Social Assistance (100.0%), and Public Administration (100.0%).
| Industry | Male | Female |
| Agriculture, Fishing & Hunting | 0 (0.0%) | 0 (0.0%) |
| Mining, Quarrying, & Extraction | 0 (0.0%) | 0 (0.0%) |
| Construction | 30 (100.0%) | 0 (0.0%) |
| Manufacturing | 3 (100.0%) | 0 (0.0%) |
| Wholesale Trade | 32 (86.5%) | 5 (13.5%) |
| Retail Trade | 0 (0.0%) | 35 (100.0%) |
| Transportation & Warehousing | 18 (81.8%) | 4 (18.2%) |
| Utilities | 0 (0.0%) | 0 (0.0%) |
| Information | 0 (0.0%) | 0 (0.0%) |
| Finance & Insurance | 0 (0.0%) | 0 (0.0%) |
| Real Estate, Rental & Leasing | 0 (0.0%) | 0 (0.0%) |
| Professional & Scientific | 8 (100.0%) | 0 (0.0%) |
| Enterprise Management | 0 (0.0%) | 0 (0.0%) |
| Administrative & Support | 0 (0.0%) | 0 (0.0%) |
| Educational Services | 0 (0.0%) | 0 (0.0%) |
| Health Care & Social Assistance | 0 (0.0%) | 164 (100.0%) |
| Arts, Entertainment & Recreation | 0 (0.0%) | 0 (0.0%) |
| Accommodation & Food Services | 0 (0.0%) | 0 (0.0%) |
| Public Administration | 0 (0.0%) | 22 (100.0%) |
| Total | 91 (28.3%) | 230 (71.7%) |
Education in Edgewater
School Enrollment in Edgewater
The most common levels of schooling among the 199 students in Edgewater are college / undergraduate (152 | 76.4%), high school (26 | 13.1%), and kindergarten (11 | 5.5%).
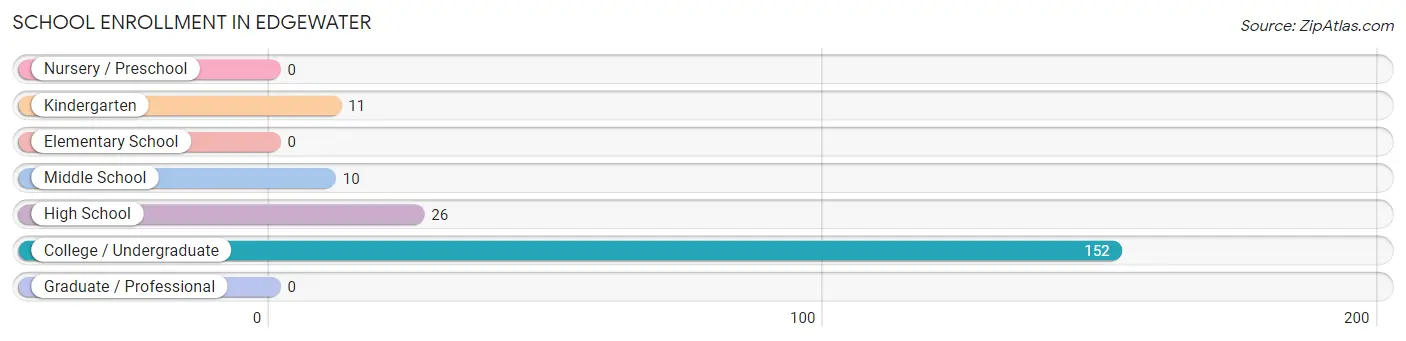
| School Level | # Students | % Students |
| Nursery / Preschool | 0 | 0.0% |
| Kindergarten | 11 | 5.5% |
| Elementary School | 0 | 0.0% |
| Middle School | 10 | 5.0% |
| High School | 26 | 13.1% |
| College / Undergraduate | 152 | 76.4% |
| Graduate / Professional | 0 | 0.0% |
| Total | 199 | 100.0% |
School Enrollment by Age by Funding Source in Edgewater
Out of a total of 199 students who are enrolled in schools in Edgewater, 4 (2.0%) attend a private institution, while the remaining 195 (98.0%) are enrolled in public schools. The age group of 35 years and over has the highest likelihood of being enrolled in private schools, with 4 (2.6% in the age bracket) enrolled. Conversely, the age group of 5 to 9 year old has the lowest likelihood of being enrolled in a private school, with 11 (100.0% in the age bracket) attending a public institution.
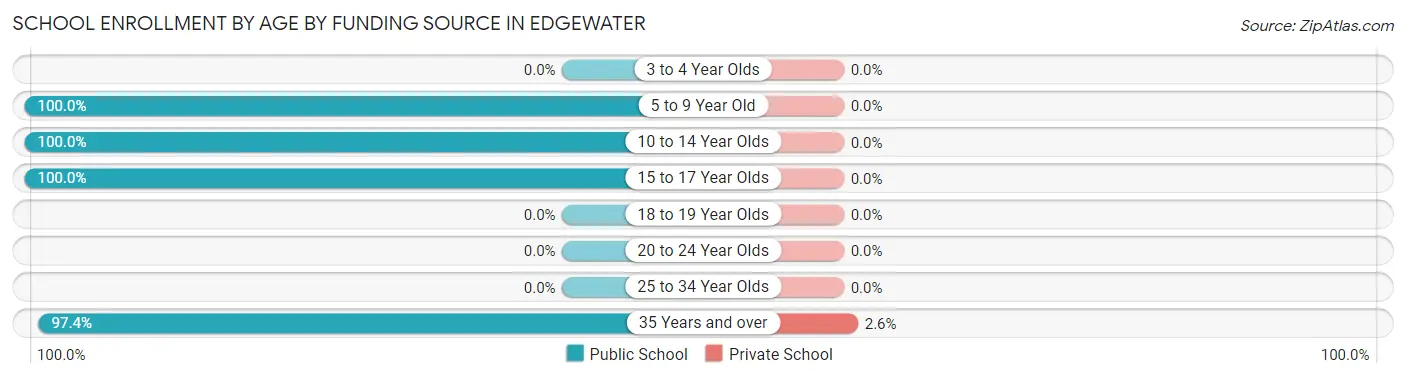
| Age Bracket | Public School | Private School |
| 3 to 4 Year Olds | 0 (0.0%) | 0 (0.0%) |
| 5 to 9 Year Old | 11 (100.0%) | 0 (0.0%) |
| 10 to 14 Year Olds | 10 (100.0%) | 0 (0.0%) |
| 15 to 17 Year Olds | 26 (100.0%) | 0 (0.0%) |
| 18 to 19 Year Olds | 0 (0.0%) | 0 (0.0%) |
| 20 to 24 Year Olds | 0 (0.0%) | 0 (0.0%) |
| 25 to 34 Year Olds | 0 (0.0%) | 0 (0.0%) |
| 35 Years and over | 148 (97.4%) | 4 (2.6%) |
| Total | 195 (98.0%) | 4 (2.0%) |
Educational Attainment by Field of Study in Edgewater
Education (23 | 27.4%), computers & mathematics (20 | 23.8%), liberal arts & history (13 | 15.5%), arts & humanities (13 | 15.5%), and engineering (8 | 9.5%) are the most common fields of study among 84 individuals in Edgewater who have obtained a bachelor's degree or higher.
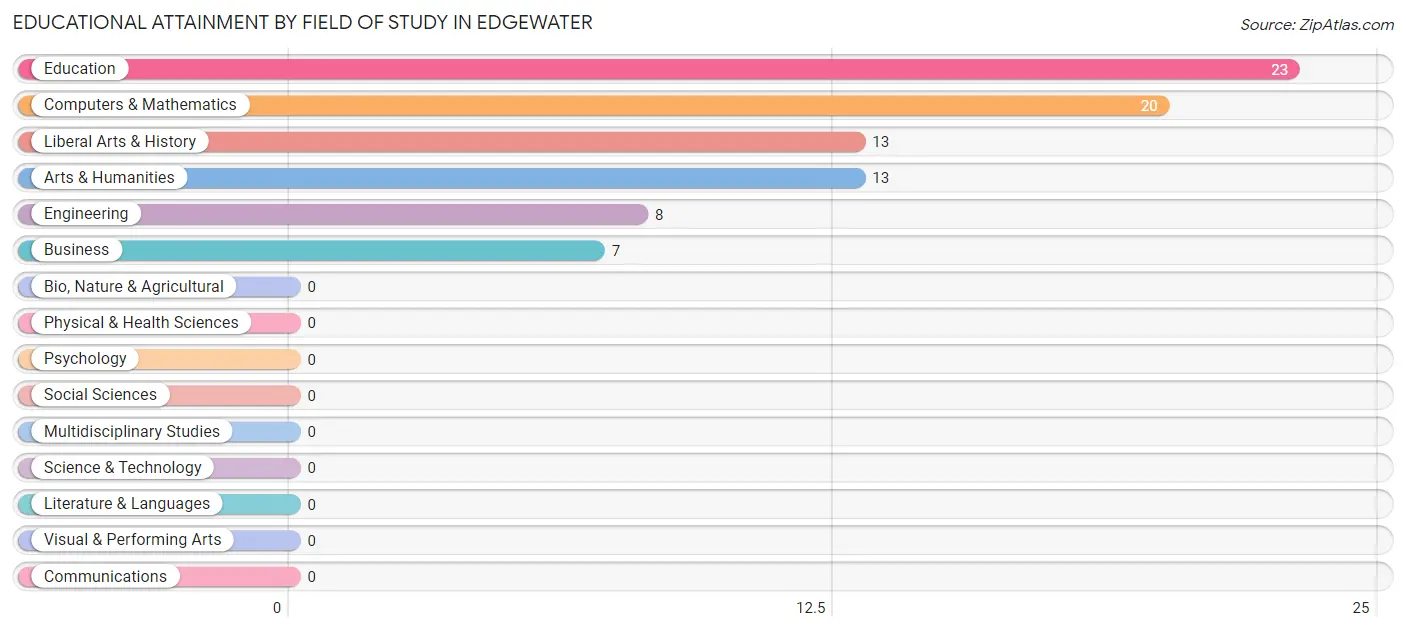
| Field of Study | # Graduates | % Graduates |
| Computers & Mathematics | 20 | 23.8% |
| Bio, Nature & Agricultural | 0 | 0.0% |
| Physical & Health Sciences | 0 | 0.0% |
| Psychology | 0 | 0.0% |
| Social Sciences | 0 | 0.0% |
| Engineering | 8 | 9.5% |
| Multidisciplinary Studies | 0 | 0.0% |
| Science & Technology | 0 | 0.0% |
| Business | 7 | 8.3% |
| Education | 23 | 27.4% |
| Literature & Languages | 0 | 0.0% |
| Liberal Arts & History | 13 | 15.5% |
| Visual & Performing Arts | 0 | 0.0% |
| Communications | 0 | 0.0% |
| Arts & Humanities | 13 | 15.5% |
| Total | 84 | 100.0% |
Transportation & Commute in Edgewater
Vehicle Availability by Sex in Edgewater
The most prevalent vehicle ownership categories in Edgewater are males with 2 vehicles (48, accounting for 52.7%) and females with 2 vehicles (171, making up 20.3%).
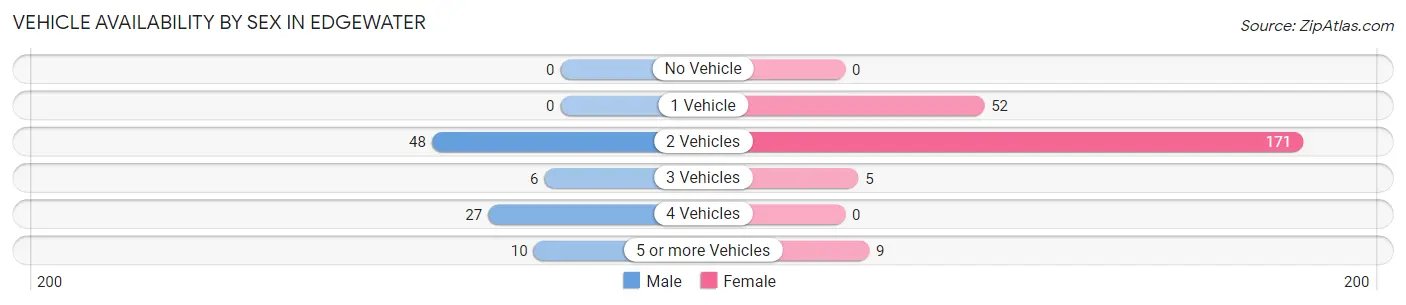
| Vehicles Available | Male | Female |
| No Vehicle | 0 (0.0%) | 0 (0.0%) |
| 1 Vehicle | 0 (0.0%) | 52 (21.9%) |
| 2 Vehicles | 48 (52.7%) | 171 (72.2%) |
| 3 Vehicles | 6 (6.6%) | 5 (2.1%) |
| 4 Vehicles | 27 (29.7%) | 0 (0.0%) |
| 5 or more Vehicles | 10 (11.0%) | 9 (3.8%) |
| Total | 91 (100.0%) | 237 (100.0%) |
Commute Time in Edgewater
The most frequently occuring commute durations in Edgewater are 15 to 19 minutes (185 commuters, 56.4%), 30 to 34 minutes (77 commuters, 23.5%), and 20 to 24 minutes (39 commuters, 11.9%).
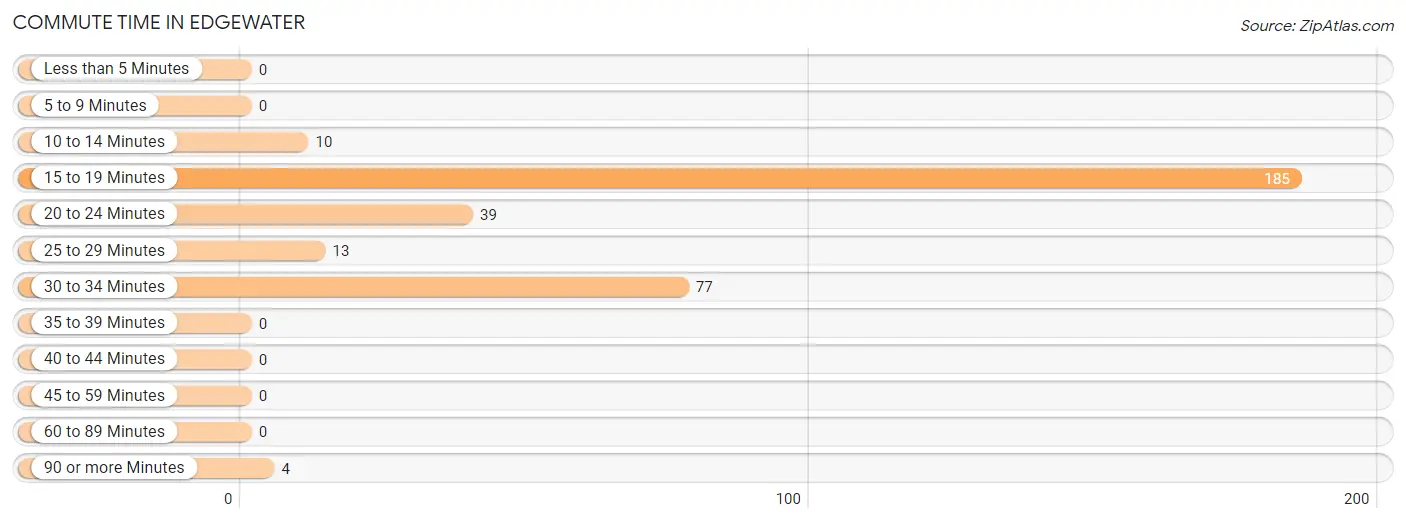
| Commute Time | # Commuters | % Commuters |
| Less than 5 Minutes | 0 | 0.0% |
| 5 to 9 Minutes | 0 | 0.0% |
| 10 to 14 Minutes | 10 | 3.0% |
| 15 to 19 Minutes | 185 | 56.4% |
| 20 to 24 Minutes | 39 | 11.9% |
| 25 to 29 Minutes | 13 | 4.0% |
| 30 to 34 Minutes | 77 | 23.5% |
| 35 to 39 Minutes | 0 | 0.0% |
| 40 to 44 Minutes | 0 | 0.0% |
| 45 to 59 Minutes | 0 | 0.0% |
| 60 to 89 Minutes | 0 | 0.0% |
| 90 or more Minutes | 4 | 1.2% |
Commute Time by Sex in Edgewater
The most common commute times in Edgewater are 30 to 34 minutes (57 commuters, 62.6%) for males and 15 to 19 minutes (182 commuters, 76.8%) for females.

| Commute Time | Male | Female |
| Less than 5 Minutes | 0 (0.0%) | 0 (0.0%) |
| 5 to 9 Minutes | 0 (0.0%) | 0 (0.0%) |
| 10 to 14 Minutes | 10 (11.0%) | 0 (0.0%) |
| 15 to 19 Minutes | 3 (3.3%) | 182 (76.8%) |
| 20 to 24 Minutes | 21 (23.1%) | 18 (7.6%) |
| 25 to 29 Minutes | 0 (0.0%) | 13 (5.5%) |
| 30 to 34 Minutes | 57 (62.6%) | 20 (8.4%) |
| 35 to 39 Minutes | 0 (0.0%) | 0 (0.0%) |
| 40 to 44 Minutes | 0 (0.0%) | 0 (0.0%) |
| 45 to 59 Minutes | 0 (0.0%) | 0 (0.0%) |
| 60 to 89 Minutes | 0 (0.0%) | 0 (0.0%) |
| 90 or more Minutes | 0 (0.0%) | 4 (1.7%) |
Time of Departure to Work by Sex in Edgewater
The most frequent times of departure to work in Edgewater are 5:00 AM to 5:29 AM (35, 38.5%) for males and 6:00 AM to 6:29 AM (135, 57.0%) for females.
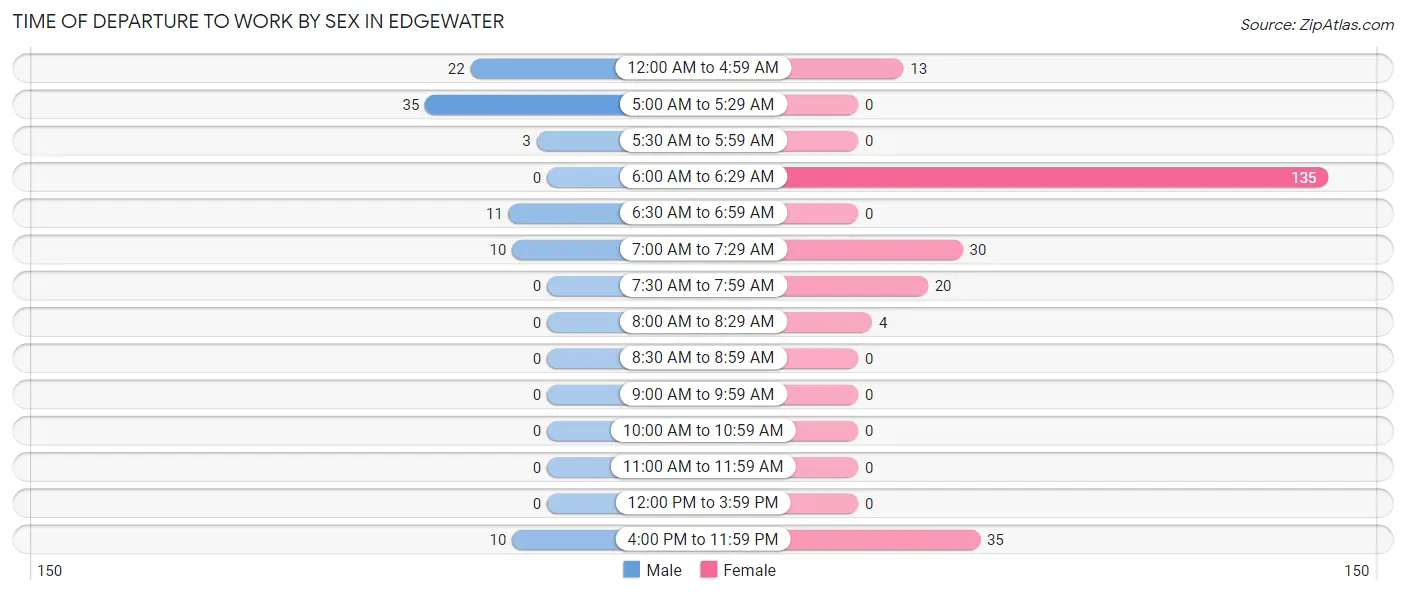
| Time of Departure | Male | Female |
| 12:00 AM to 4:59 AM | 22 (24.2%) | 13 (5.5%) |
| 5:00 AM to 5:29 AM | 35 (38.5%) | 0 (0.0%) |
| 5:30 AM to 5:59 AM | 3 (3.3%) | 0 (0.0%) |
| 6:00 AM to 6:29 AM | 0 (0.0%) | 135 (57.0%) |
| 6:30 AM to 6:59 AM | 11 (12.1%) | 0 (0.0%) |
| 7:00 AM to 7:29 AM | 10 (11.0%) | 30 (12.7%) |
| 7:30 AM to 7:59 AM | 0 (0.0%) | 20 (8.4%) |
| 8:00 AM to 8:29 AM | 0 (0.0%) | 4 (1.7%) |
| 8:30 AM to 8:59 AM | 0 (0.0%) | 0 (0.0%) |
| 9:00 AM to 9:59 AM | 0 (0.0%) | 0 (0.0%) |
| 10:00 AM to 10:59 AM | 0 (0.0%) | 0 (0.0%) |
| 11:00 AM to 11:59 AM | 0 (0.0%) | 0 (0.0%) |
| 12:00 PM to 3:59 PM | 0 (0.0%) | 0 (0.0%) |
| 4:00 PM to 11:59 PM | 10 (11.0%) | 35 (14.8%) |
| Total | 91 (100.0%) | 237 (100.0%) |
Housing Occupancy in Edgewater
Occupancy by Ownership in Edgewater
Of the total 363 dwellings in Edgewater, owner-occupied units account for 291 (80.2%), while renter-occupied units make up 72 (19.8%).
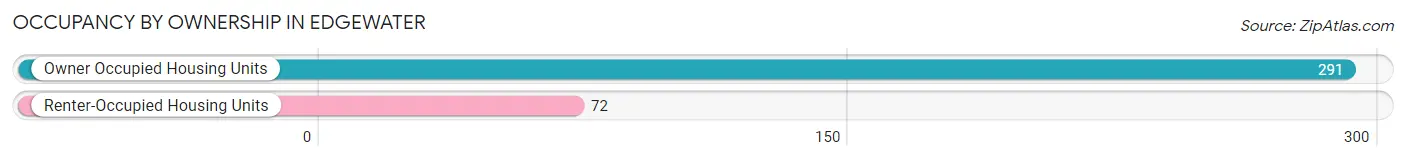
| Occupancy | # Housing Units | % Housing Units |
| Owner Occupied Housing Units | 291 | 80.2% |
| Renter-Occupied Housing Units | 72 | 19.8% |
| Total Occupied Housing Units | 363 | 100.0% |
Occupancy by Household Size in Edgewater
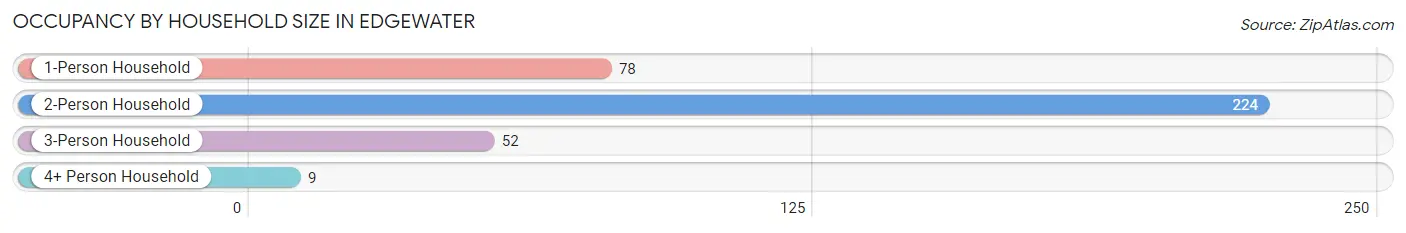
| Household Size | # Housing Units | % Housing Units |
| 1-Person Household | 78 | 21.5% |
| 2-Person Household | 224 | 61.7% |
| 3-Person Household | 52 | 14.3% |
| 4+ Person Household | 9 | 2.5% |
| Total Housing Units | 363 | 100.0% |
Occupancy by Ownership by Household Size in Edgewater
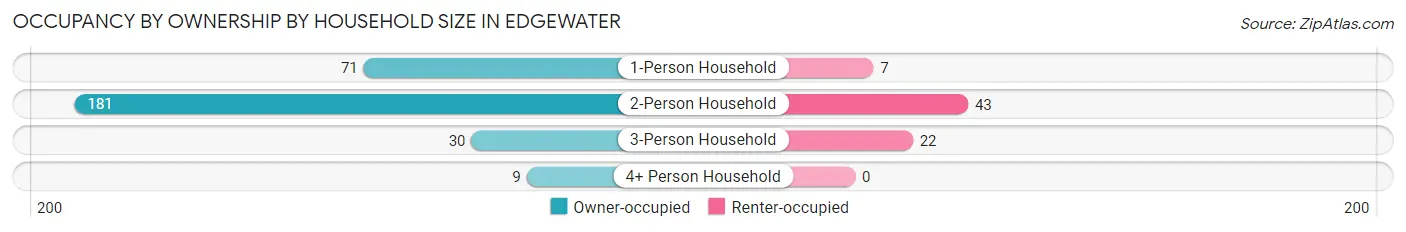
| Household Size | Owner-occupied | Renter-occupied |
| 1-Person Household | 71 (91.0%) | 7 (9.0%) |
| 2-Person Household | 181 (80.8%) | 43 (19.2%) |
| 3-Person Household | 30 (57.7%) | 22 (42.3%) |
| 4+ Person Household | 9 (100.0%) | 0 (0.0%) |
| Total Housing Units | 291 (80.2%) | 72 (19.8%) |
Occupancy by Educational Attainment in Edgewater
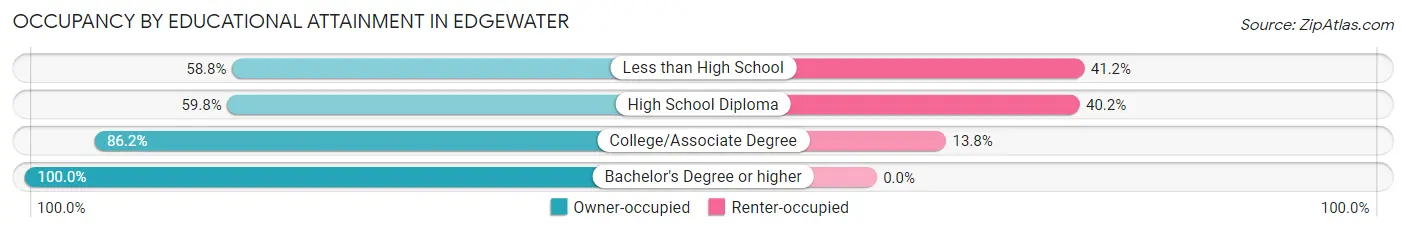
| Household Size | Owner-occupied | Renter-occupied |
| Less than High School | 10 (58.8%) | 7 (41.2%) |
| High School Diploma | 52 (59.8%) | 35 (40.2%) |
| College/Associate Degree | 188 (86.2%) | 30 (13.8%) |
| Bachelor's Degree or higher | 41 (100.0%) | 0 (0.0%) |
Occupancy by Age of Householder in Edgewater
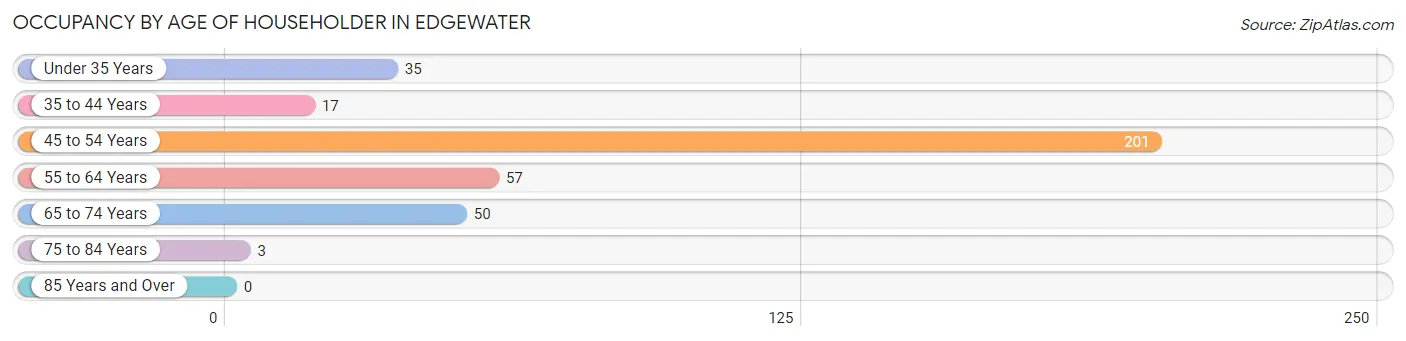
| Age Bracket | # Households | % Households |
| Under 35 Years | 35 | 9.6% |
| 35 to 44 Years | 17 | 4.7% |
| 45 to 54 Years | 201 | 55.4% |
| 55 to 64 Years | 57 | 15.7% |
| 65 to 74 Years | 50 | 13.8% |
| 75 to 84 Years | 3 | 0.8% |
| 85 Years and Over | 0 | 0.0% |
| Total | 363 | 100.0% |
Housing Finances in Edgewater
Median Income by Occupancy in Edgewater
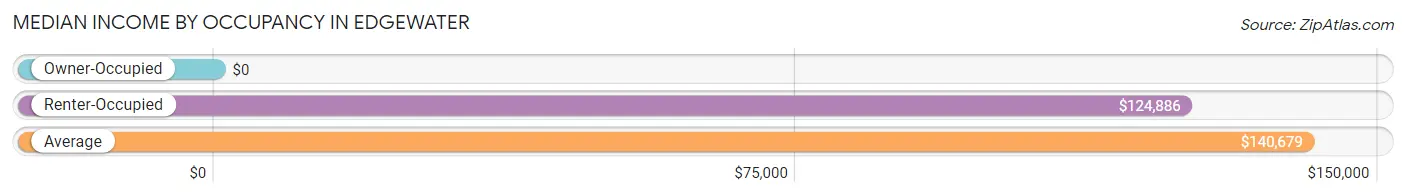
| Occupancy Type | # Households | Median Income |
| Owner-Occupied | 291 (80.2%) | $0 |
| Renter-Occupied | 72 (19.8%) | $124,886 |
| Average | 363 (100.0%) | $140,679 |
Occupancy by Householder Income Bracket in Edgewater
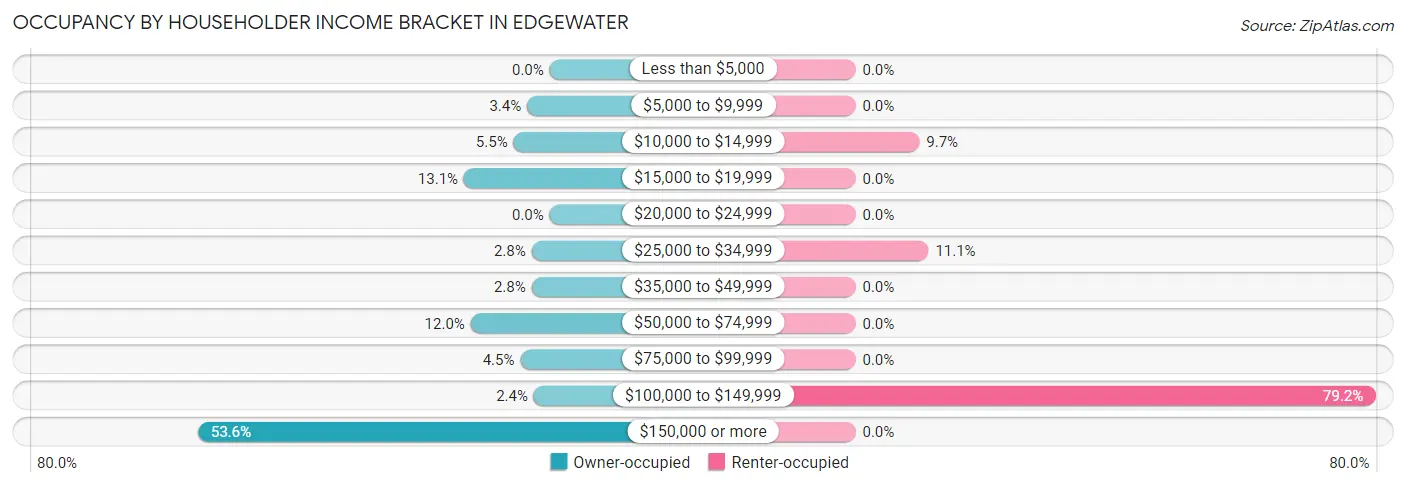
| Income Bracket | Owner-occupied | Renter-occupied |
| Less than $5,000 | 0 (0.0%) | 0 (0.0%) |
| $5,000 to $9,999 | 10 (3.4%) | 0 (0.0%) |
| $10,000 to $14,999 | 16 (5.5%) | 7 (9.7%) |
| $15,000 to $19,999 | 38 (13.1%) | 0 (0.0%) |
| $20,000 to $24,999 | 0 (0.0%) | 0 (0.0%) |
| $25,000 to $34,999 | 8 (2.8%) | 8 (11.1%) |
| $35,000 to $49,999 | 8 (2.8%) | 0 (0.0%) |
| $50,000 to $74,999 | 35 (12.0%) | 0 (0.0%) |
| $75,000 to $99,999 | 13 (4.5%) | 0 (0.0%) |
| $100,000 to $149,999 | 7 (2.4%) | 57 (79.2%) |
| $150,000 or more | 156 (53.6%) | 0 (0.0%) |
| Total | 291 (100.0%) | 72 (100.0%) |
Monthly Housing Cost Tiers in Edgewater
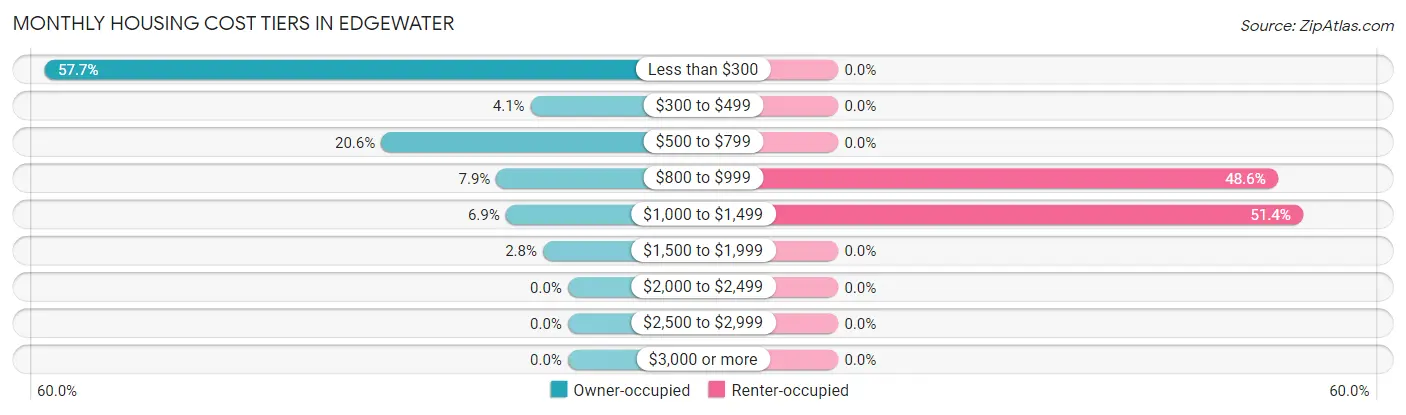
| Monthly Cost | Owner-occupied | Renter-occupied |
| Less than $300 | 168 (57.7%) | 0 (0.0%) |
| $300 to $499 | 12 (4.1%) | 0 (0.0%) |
| $500 to $799 | 60 (20.6%) | 0 (0.0%) |
| $800 to $999 | 23 (7.9%) | 35 (48.6%) |
| $1,000 to $1,499 | 20 (6.9%) | 37 (51.4%) |
| $1,500 to $1,999 | 8 (2.8%) | 0 (0.0%) |
| $2,000 to $2,499 | 0 (0.0%) | 0 (0.0%) |
| $2,500 to $2,999 | 0 (0.0%) | 0 (0.0%) |
| $3,000 or more | 0 (0.0%) | 0 (0.0%) |
| Total | 291 (100.0%) | 72 (100.0%) |
Physical Housing Characteristics in Edgewater
Housing Structures in Edgewater
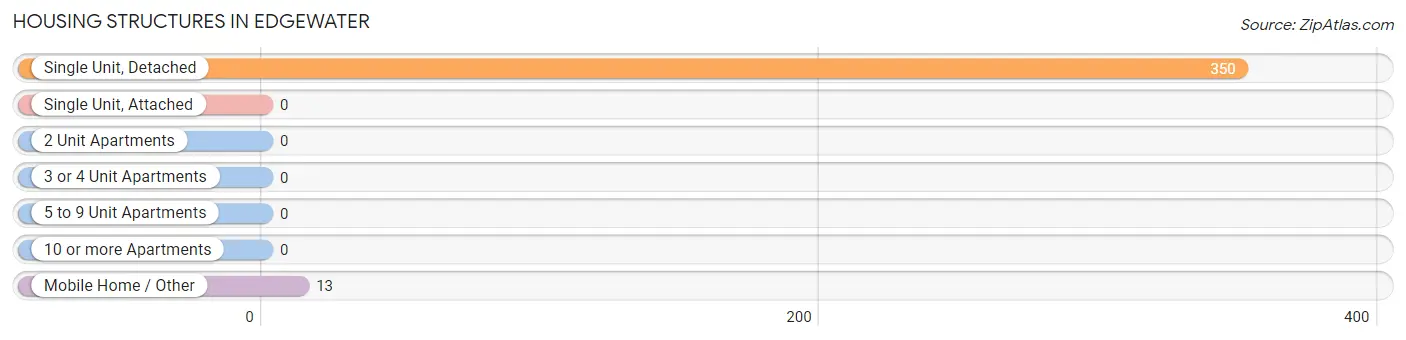
| Structure Type | # Housing Units | % Housing Units |
| Single Unit, Detached | 350 | 96.4% |
| Single Unit, Attached | 0 | 0.0% |
| 2 Unit Apartments | 0 | 0.0% |
| 3 or 4 Unit Apartments | 0 | 0.0% |
| 5 to 9 Unit Apartments | 0 | 0.0% |
| 10 or more Apartments | 0 | 0.0% |
| Mobile Home / Other | 13 | 3.6% |
| Total | 363 | 100.0% |
Housing Structures by Occupancy in Edgewater
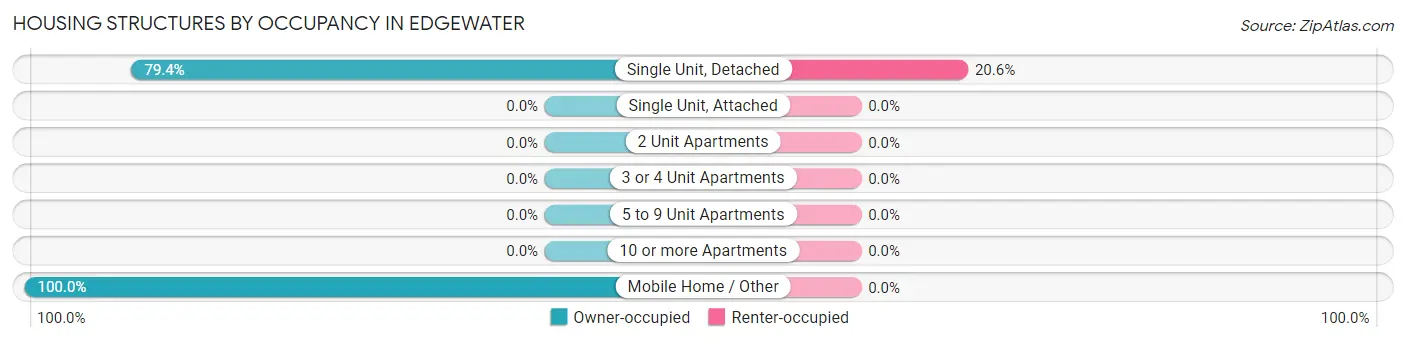
| Structure Type | Owner-occupied | Renter-occupied |
| Single Unit, Detached | 278 (79.4%) | 72 (20.6%) |
| Single Unit, Attached | 0 (0.0%) | 0 (0.0%) |
| 2 Unit Apartments | 0 (0.0%) | 0 (0.0%) |
| 3 or 4 Unit Apartments | 0 (0.0%) | 0 (0.0%) |
| 5 to 9 Unit Apartments | 0 (0.0%) | 0 (0.0%) |
| 10 or more Apartments | 0 (0.0%) | 0 (0.0%) |
| Mobile Home / Other | 13 (100.0%) | 0 (0.0%) |
| Total | 291 (80.2%) | 72 (19.8%) |
Housing Structures by Number of Rooms in Edgewater
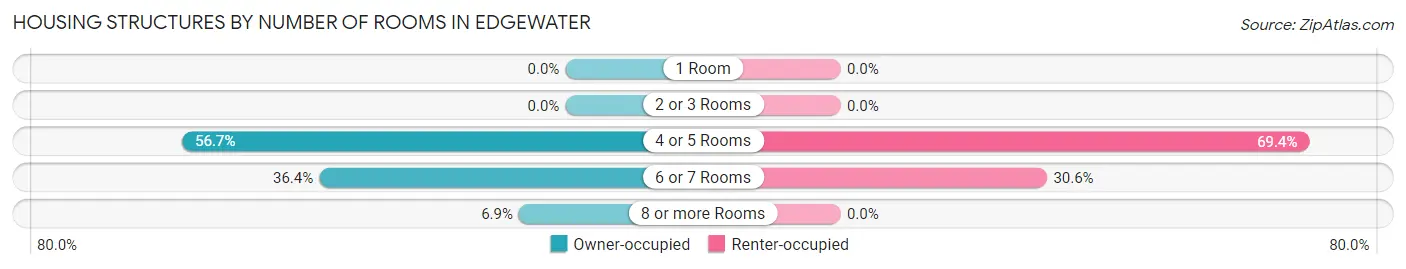
| Number of Rooms | Owner-occupied | Renter-occupied |
| 1 Room | 0 (0.0%) | 0 (0.0%) |
| 2 or 3 Rooms | 0 (0.0%) | 0 (0.0%) |
| 4 or 5 Rooms | 165 (56.7%) | 50 (69.4%) |
| 6 or 7 Rooms | 106 (36.4%) | 22 (30.6%) |
| 8 or more Rooms | 20 (6.9%) | 0 (0.0%) |
| Total | 291 (100.0%) | 72 (100.0%) |
Housing Structure by Heating Type in Edgewater
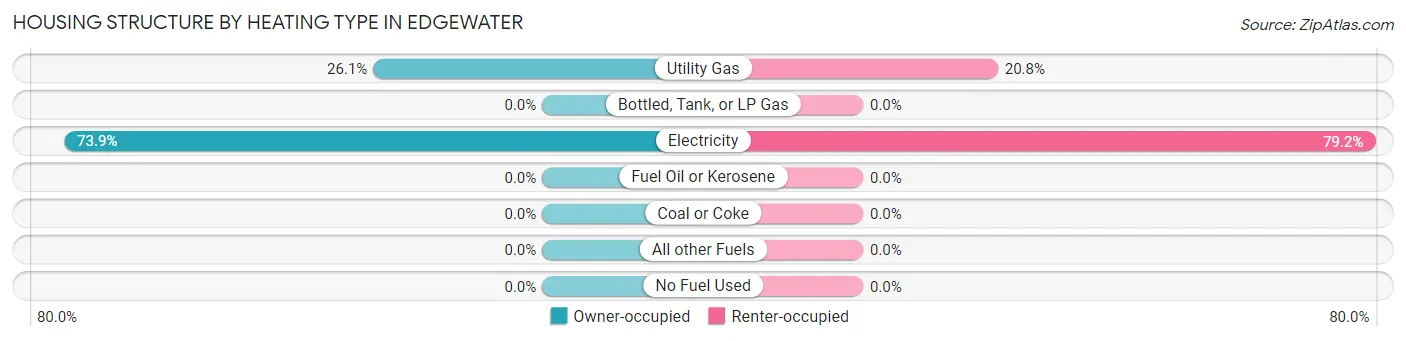
| Heating Type | Owner-occupied | Renter-occupied |
| Utility Gas | 76 (26.1%) | 15 (20.8%) |
| Bottled, Tank, or LP Gas | 0 (0.0%) | 0 (0.0%) |
| Electricity | 215 (73.9%) | 57 (79.2%) |
| Fuel Oil or Kerosene | 0 (0.0%) | 0 (0.0%) |
| Coal or Coke | 0 (0.0%) | 0 (0.0%) |
| All other Fuels | 0 (0.0%) | 0 (0.0%) |
| No Fuel Used | 0 (0.0%) | 0 (0.0%) |
| Total | 291 (100.0%) | 72 (100.0%) |
Household Vehicle Usage in Edgewater
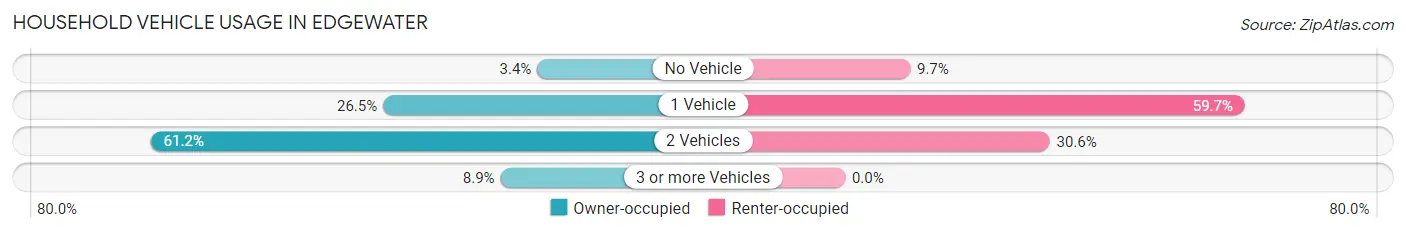
| Vehicles per Household | Owner-occupied | Renter-occupied |
| No Vehicle | 10 (3.4%) | 7 (9.7%) |
| 1 Vehicle | 77 (26.5%) | 43 (59.7%) |
| 2 Vehicles | 178 (61.2%) | 22 (30.6%) |
| 3 or more Vehicles | 26 (8.9%) | 0 (0.0%) |
| Total | 291 (100.0%) | 72 (100.0%) |
Real Estate & Mortgages in Edgewater
Real Estate and Mortgage Overview in Edgewater
| Characteristic | Without Mortgage | With Mortgage |
| Housing Units | 218 | 73 |
| Median Property Value | $45,600 | $105,500 |
| Median Household Income | $168,167 | $11 |
| Monthly Housing Costs | $278 | $0 |
| Real Estate Taxes | $199 | $0 |
Property Value by Mortgage Status in Edgewater
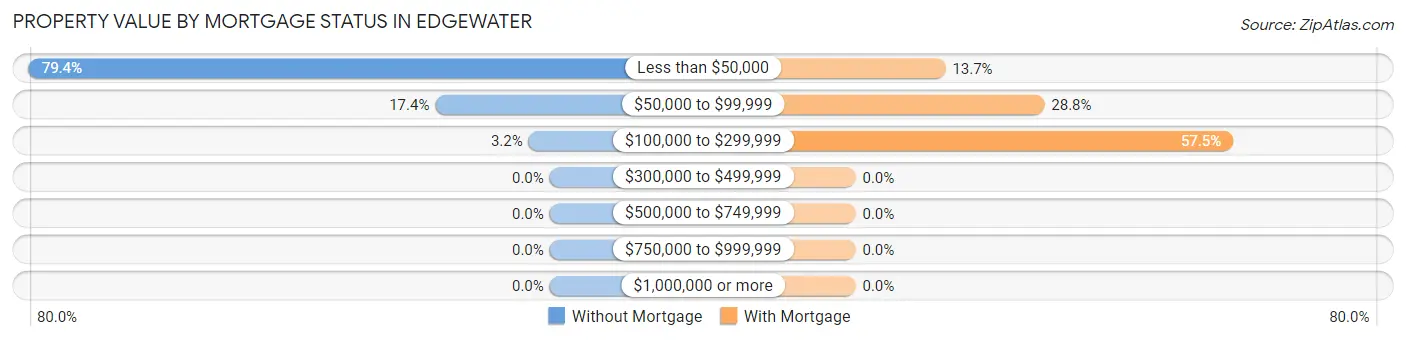
| Property Value | Without Mortgage | With Mortgage |
| Less than $50,000 | 173 (79.4%) | 10 (13.7%) |
| $50,000 to $99,999 | 38 (17.4%) | 21 (28.8%) |
| $100,000 to $299,999 | 7 (3.2%) | 42 (57.5%) |
| $300,000 to $499,999 | 0 (0.0%) | 0 (0.0%) |
| $500,000 to $749,999 | 0 (0.0%) | 0 (0.0%) |
| $750,000 to $999,999 | 0 (0.0%) | 0 (0.0%) |
| $1,000,000 or more | 0 (0.0%) | 0 (0.0%) |
| Total | 218 (100.0%) | 73 (100.0%) |
Household Income by Mortgage Status in Edgewater
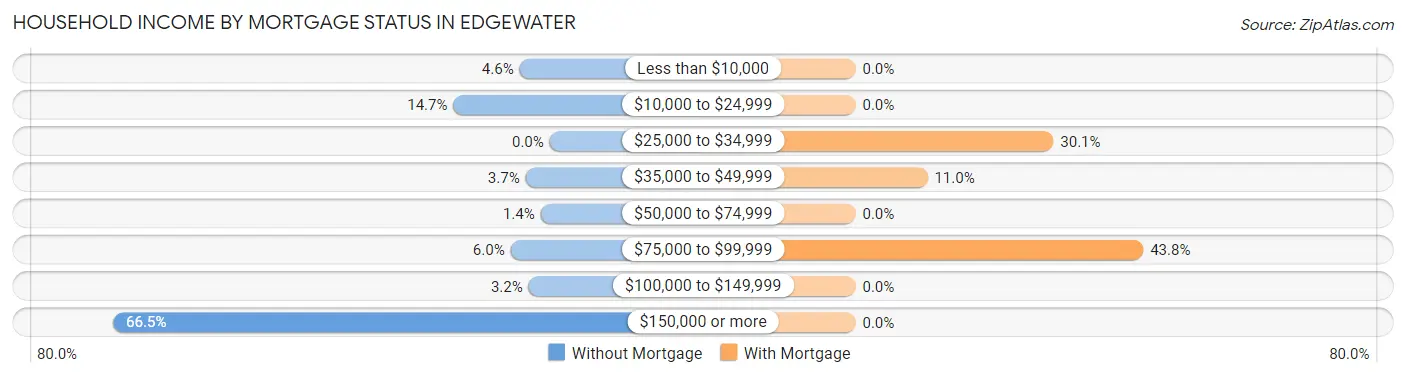
| Household Income | Without Mortgage | With Mortgage |
| Less than $10,000 | 10 (4.6%) | 0 (0.0%) |
| $10,000 to $24,999 | 32 (14.7%) | 0 (0.0%) |
| $25,000 to $34,999 | 0 (0.0%) | 22 (30.1%) |
| $35,000 to $49,999 | 8 (3.7%) | 8 (11.0%) |
| $50,000 to $74,999 | 3 (1.4%) | 0 (0.0%) |
| $75,000 to $99,999 | 13 (6.0%) | 32 (43.8%) |
| $100,000 to $149,999 | 7 (3.2%) | 0 (0.0%) |
| $150,000 or more | 145 (66.5%) | 0 (0.0%) |
| Total | 218 (100.0%) | 73 (100.0%) |
Property Value to Household Income Ratio in Edgewater
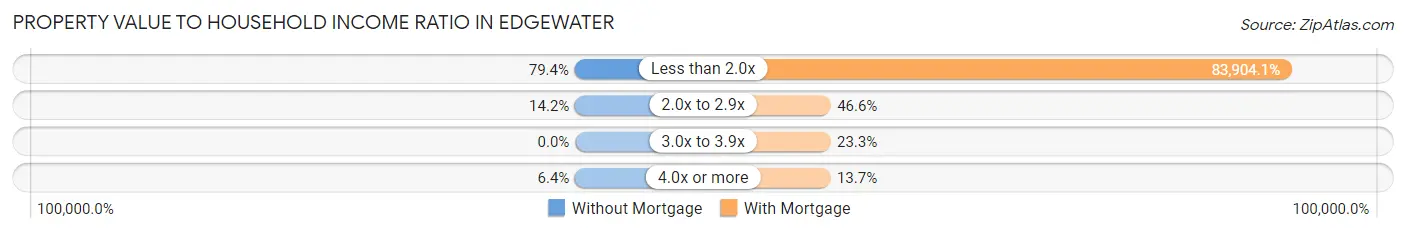
| Value-to-Income Ratio | Without Mortgage | With Mortgage |
| Less than 2.0x | 173 (79.4%) | 61,250 (83,904.1%) |
| 2.0x to 2.9x | 31 (14.2%) | 34 (46.6%) |
| 3.0x to 3.9x | 0 (0.0%) | 17 (23.3%) |
| 4.0x or more | 14 (6.4%) | 10 (13.7%) |
| Total | 218 (100.0%) | 73 (100.0%) |
Real Estate Taxes by Mortgage Status in Edgewater
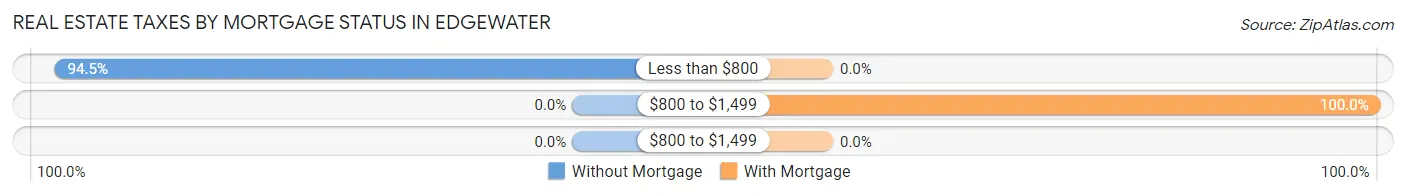
| Property Taxes | Without Mortgage | With Mortgage |
| Less than $800 | 206 (94.5%) | 0 (0.0%) |
| $800 to $1,499 | 0 (0.0%) | 73 (100.0%) |
| $800 to $1,499 | 0 (0.0%) | 0 (0.0%) |
| Total | 218 (100.0%) | 73 (100.0%) |
Health & Disability in Edgewater
Health Insurance Coverage by Age in Edgewater
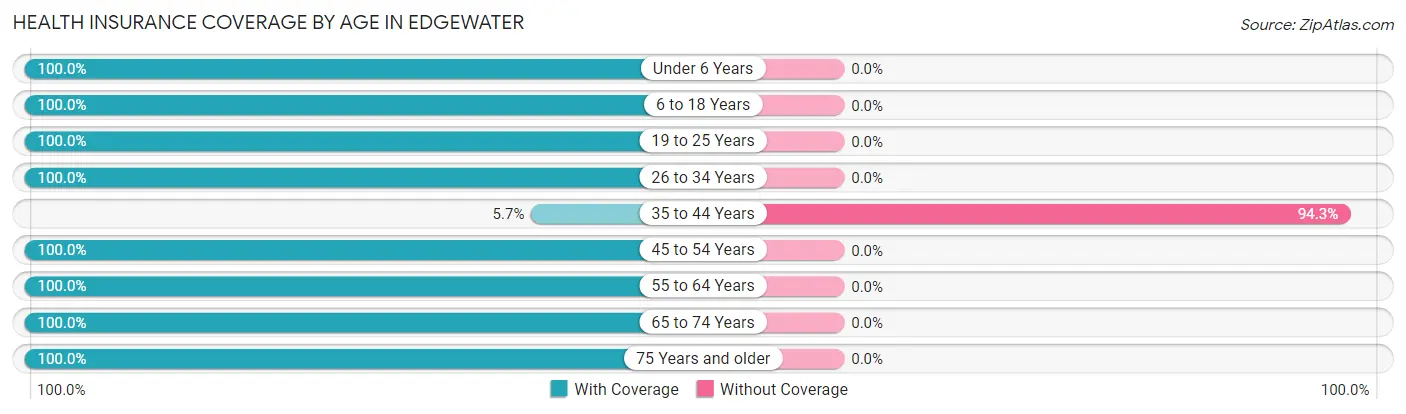
| Age Bracket | With Coverage | Without Coverage |
| Under 6 Years | 78 (100.0%) | 0 (0.0%) |
| 6 to 18 Years | 47 (100.0%) | 0 (0.0%) |
| 19 to 25 Years | 3 (100.0%) | 0 (0.0%) |
| 26 to 34 Years | 35 (100.0%) | 0 (0.0%) |
| 35 to 44 Years | 4 (5.7%) | 66 (94.3%) |
| 45 to 54 Years | 366 (100.0%) | 0 (0.0%) |
| 55 to 64 Years | 116 (100.0%) | 0 (0.0%) |
| 65 to 74 Years | 61 (100.0%) | 0 (0.0%) |
| 75 Years and older | 10 (100.0%) | 0 (0.0%) |
| Total | 720 (91.6%) | 66 (8.4%) |
Health Insurance Coverage by Citizenship Status in Edgewater
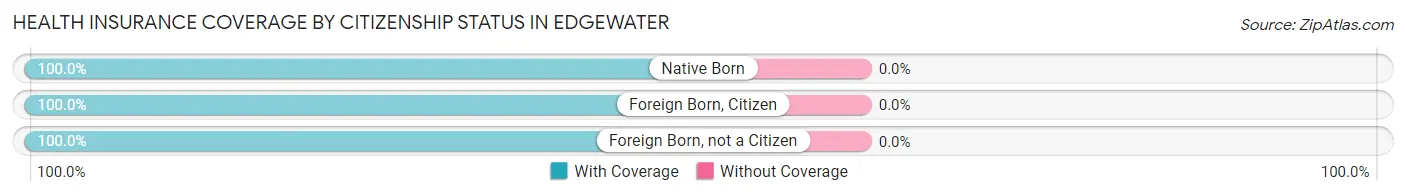
| Citizenship Status | With Coverage | Without Coverage |
| Native Born | 78 (100.0%) | 0 (0.0%) |
| Foreign Born, Citizen | 47 (100.0%) | 0 (0.0%) |
| Foreign Born, not a Citizen | 3 (100.0%) | 0 (0.0%) |
Health Insurance Coverage by Household Income in Edgewater
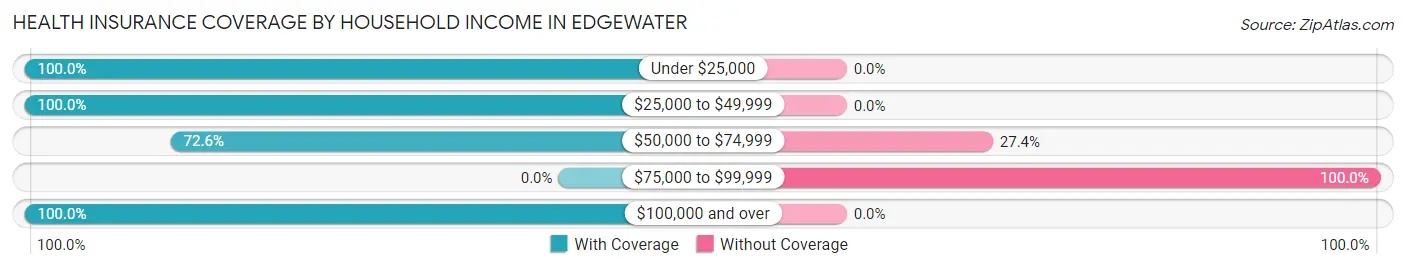
| Household Income | With Coverage | Without Coverage |
| Under $25,000 | 111 (100.0%) | 0 (0.0%) |
| $25,000 to $49,999 | 41 (100.0%) | 0 (0.0%) |
| $50,000 to $74,999 | 69 (72.6%) | 26 (27.4%) |
| $75,000 to $99,999 | 0 (0.0%) | 40 (100.0%) |
| $100,000 and over | 499 (100.0%) | 0 (0.0%) |
Public vs Private Health Insurance Coverage by Age in Edgewater
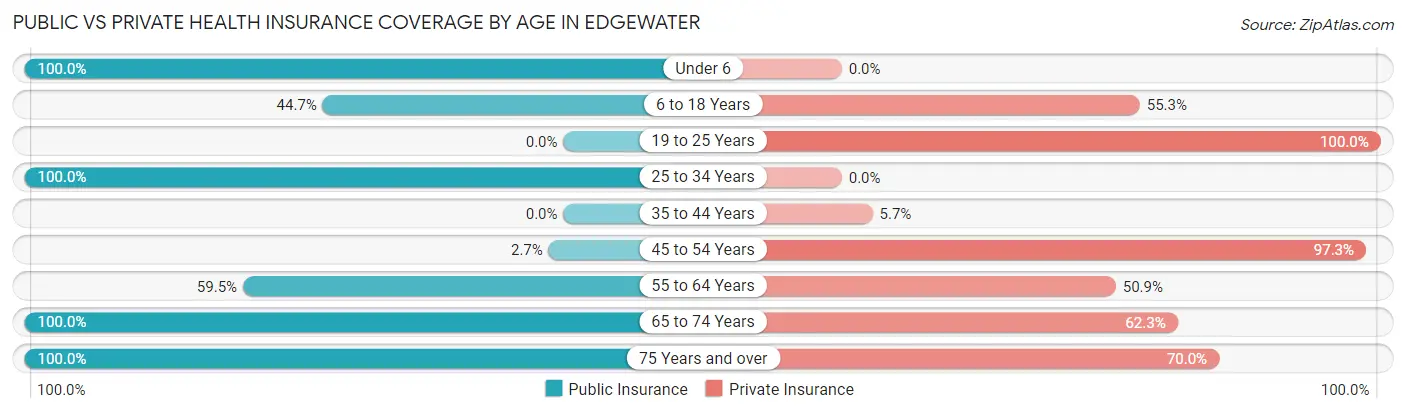
| Age Bracket | Public Insurance | Private Insurance |
| Under 6 | 78 (100.0%) | 0 (0.0%) |
| 6 to 18 Years | 21 (44.7%) | 26 (55.3%) |
| 19 to 25 Years | 0 (0.0%) | 3 (100.0%) |
| 25 to 34 Years | 35 (100.0%) | 0 (0.0%) |
| 35 to 44 Years | 0 (0.0%) | 4 (5.7%) |
| 45 to 54 Years | 10 (2.7%) | 356 (97.3%) |
| 55 to 64 Years | 69 (59.5%) | 59 (50.9%) |
| 65 to 74 Years | 61 (100.0%) | 38 (62.3%) |
| 75 Years and over | 10 (100.0%) | 7 (70.0%) |
| Total | 284 (36.1%) | 493 (62.7%) |
Disability Status by Sex by Age in Edgewater
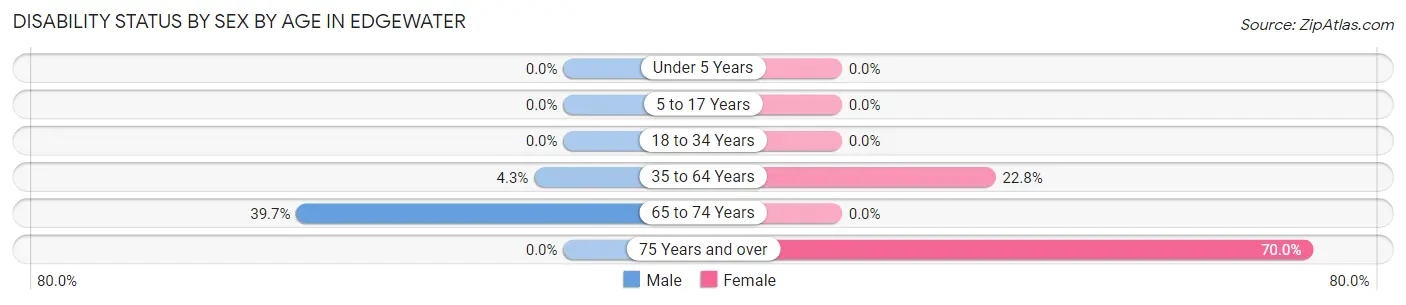
| Age Bracket | Male | Female |
| Under 5 Years | 0 (0.0%) | 0 (0.0%) |
| 5 to 17 Years | 0 (0.0%) | 0 (0.0%) |
| 18 to 34 Years | 0 (0.0%) | 0 (0.0%) |
| 35 to 64 Years | 11 (4.3%) | 68 (22.8%) |
| 65 to 74 Years | 23 (39.7%) | 0 (0.0%) |
| 75 Years and over | 0 (0.0%) | 7 (70.0%) |
Disability Class by Sex by Age in Edgewater
Disability Class: Hearing Difficulty
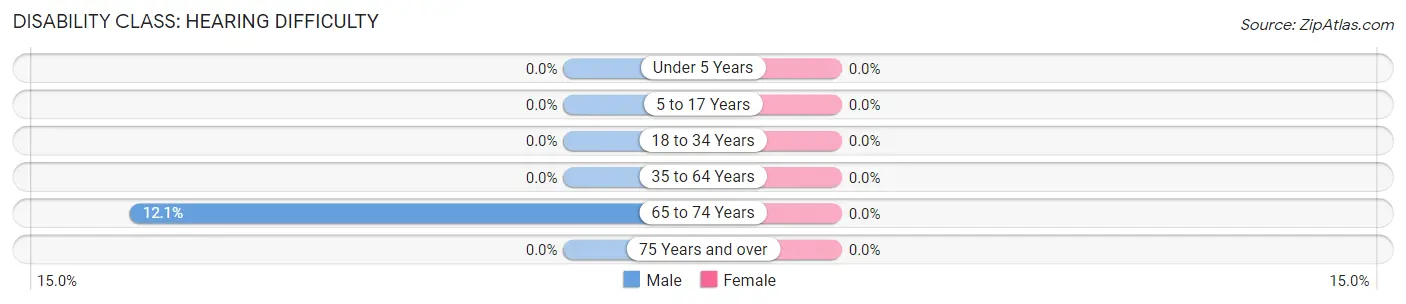
| Age Bracket | Male | Female |
| Under 5 Years | 0 (0.0%) | 0 (0.0%) |
| 5 to 17 Years | 0 (0.0%) | 0 (0.0%) |
| 18 to 34 Years | 0 (0.0%) | 0 (0.0%) |
| 35 to 64 Years | 0 (0.0%) | 0 (0.0%) |
| 65 to 74 Years | 7 (12.1%) | 0 (0.0%) |
| 75 Years and over | 0 (0.0%) | 0 (0.0%) |
Disability Class: Vision Difficulty
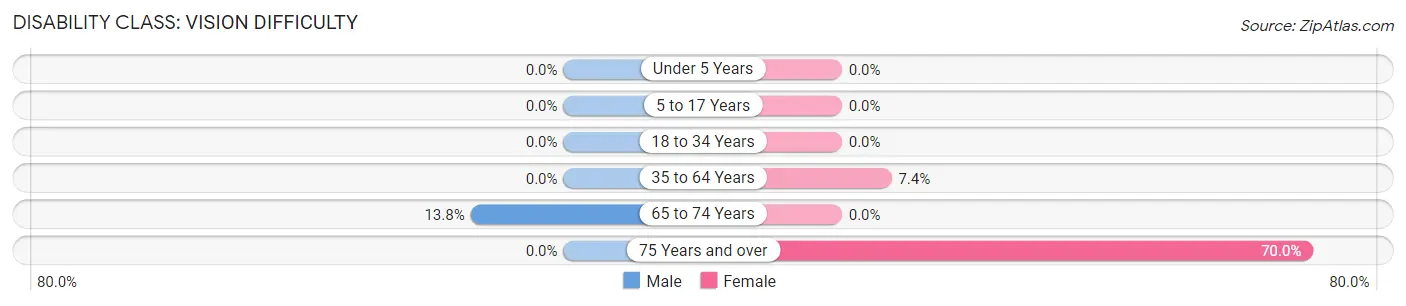
| Age Bracket | Male | Female |
| Under 5 Years | 0 (0.0%) | 0 (0.0%) |
| 5 to 17 Years | 0 (0.0%) | 0 (0.0%) |
| 18 to 34 Years | 0 (0.0%) | 0 (0.0%) |
| 35 to 64 Years | 0 (0.0%) | 22 (7.4%) |
| 65 to 74 Years | 8 (13.8%) | 0 (0.0%) |
| 75 Years and over | 0 (0.0%) | 7 (70.0%) |
Disability Class: Cognitive Difficulty
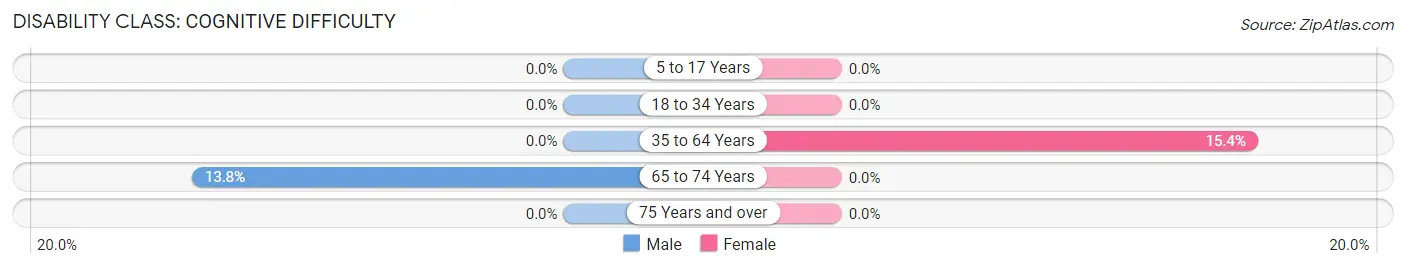
| Age Bracket | Male | Female |
| 5 to 17 Years | 0 (0.0%) | 0 (0.0%) |
| 18 to 34 Years | 0 (0.0%) | 0 (0.0%) |
| 35 to 64 Years | 0 (0.0%) | 46 (15.4%) |
| 65 to 74 Years | 8 (13.8%) | 0 (0.0%) |
| 75 Years and over | 0 (0.0%) | 0 (0.0%) |
Disability Class: Ambulatory Difficulty
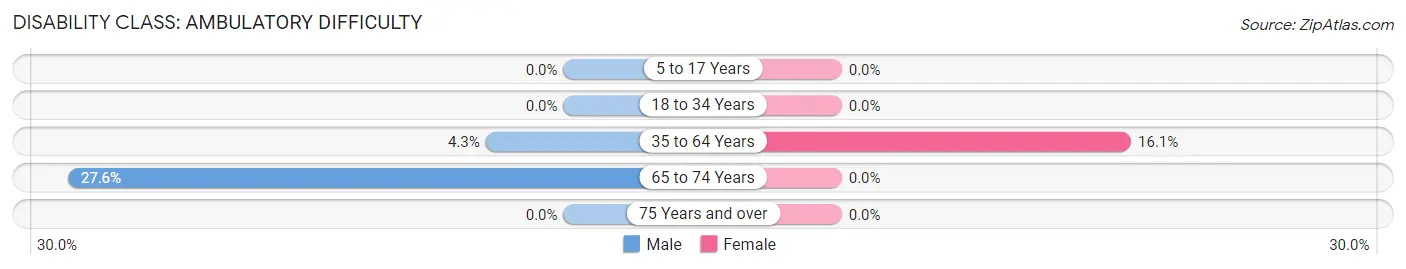
| Age Bracket | Male | Female |
| 5 to 17 Years | 0 (0.0%) | 0 (0.0%) |
| 18 to 34 Years | 0 (0.0%) | 0 (0.0%) |
| 35 to 64 Years | 11 (4.3%) | 48 (16.1%) |
| 65 to 74 Years | 16 (27.6%) | 0 (0.0%) |
| 75 Years and over | 0 (0.0%) | 0 (0.0%) |
Disability Class: Self-Care Difficulty
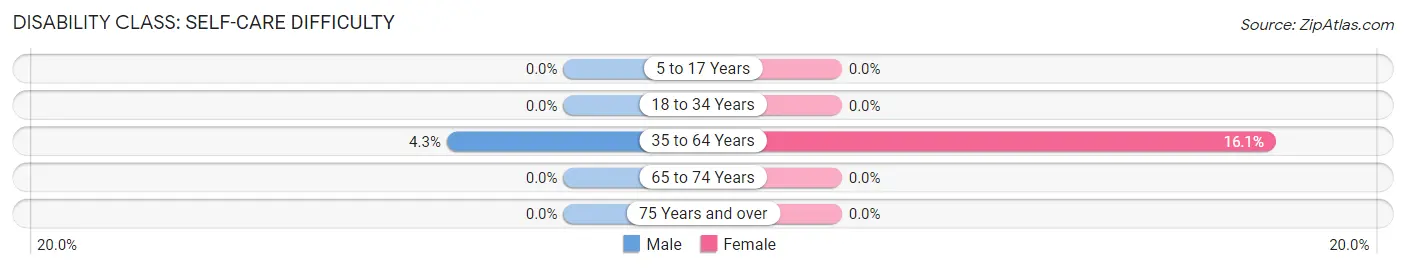
| Age Bracket | Male | Female |
| 5 to 17 Years | 0 (0.0%) | 0 (0.0%) |
| 18 to 34 Years | 0 (0.0%) | 0 (0.0%) |
| 35 to 64 Years | 11 (4.3%) | 48 (16.1%) |
| 65 to 74 Years | 0 (0.0%) | 0 (0.0%) |
| 75 Years and over | 0 (0.0%) | 0 (0.0%) |
Technology Access in Edgewater
Computing Device Access in Edgewater
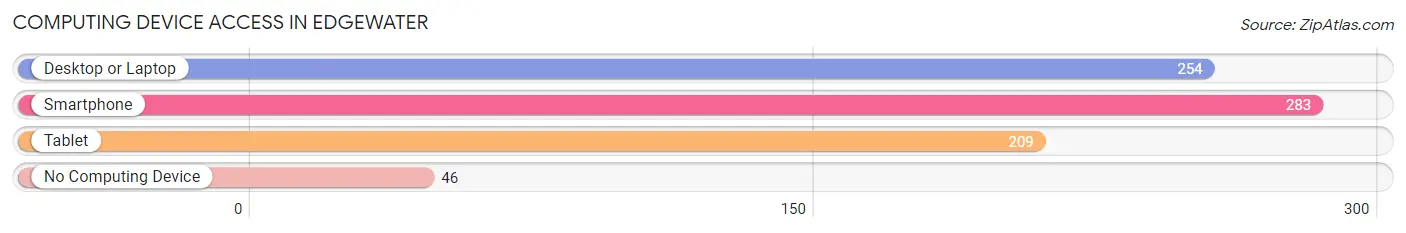
| Device Type | # Households | % Households |
| Desktop or Laptop | 254 | 70.0% |
| Smartphone | 283 | 78.0% |
| Tablet | 209 | 57.6% |
| No Computing Device | 46 | 12.7% |
| Total | 363 | 100.0% |
Internet Access in Edgewater
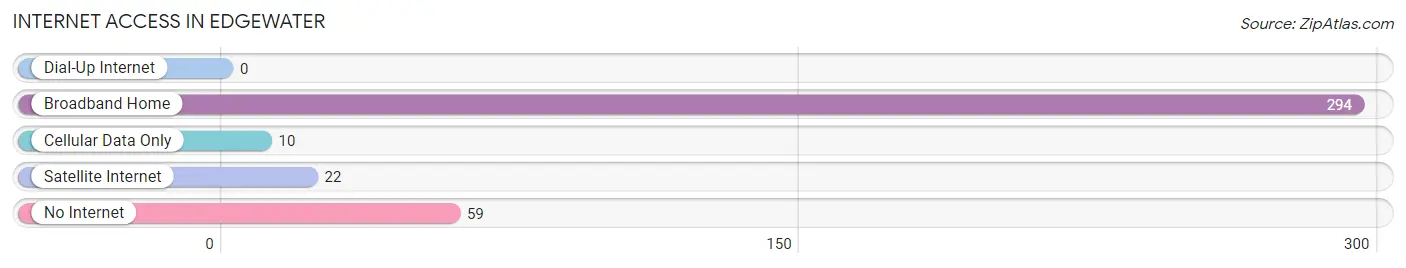
| Internet Type | # Households | % Households |
| Dial-Up Internet | 0 | 0.0% |
| Broadband Home | 294 | 81.0% |
| Cellular Data Only | 10 | 2.8% |
| Satellite Internet | 22 | 6.1% |
| No Internet | 59 | 16.3% |
| Total | 363 | 100.0% |
Edgewater Summary
Edgewater is a small town located in Baldwin County, Alabama. It is situated on the eastern shore of Mobile Bay, approximately 25 miles east of Mobile. The town has a population of approximately 1,000 people and is part of the Daphne-Fairhope-Foley Metropolitan Statistical Area.
History
Edgewater was founded in 1887 by a group of settlers from the nearby town of Fairhope. The town was originally known as “Edgewater Beach” and was a popular summer destination for families from Mobile and other nearby towns. The town was incorporated in 1901 and the name was changed to Edgewater.
In the early 1900s, Edgewater was a thriving fishing village. The town was home to several seafood processing plants and canneries, as well as a number of oyster beds. The town also had a thriving lumber industry, with several sawmills located in the area.
In the 1950s, Edgewater began to experience a decline in its economy. The seafood industry began to decline due to overfishing and pollution, and the lumber industry was also in decline due to the depletion of the local forests. The town’s population began to decline as well, as many of the town’s residents moved away in search of better economic opportunities.
In the late 1970s, Edgewater began to experience a resurgence in its economy. The town was designated as a “Growth Point” by the state of Alabama, and the town began to attract new businesses and residents. The town’s population began to grow again, and the economy began to diversify.
Geography
Edgewater is located on the eastern shore of Mobile Bay, approximately 25 miles east of Mobile. The town is situated on a peninsula, with the bay to the north and the Gulf of Mexico to the south. The town is bordered by the towns of Fairhope to the west and Daphne to the east.
The town is located in a humid subtropical climate zone, with hot, humid summers and mild winters. The average annual temperature is around 70 degrees Fahrenheit, with an average high of around 90 degrees in the summer and an average low of around 50 degrees in the winter.
Economy
Edgewater’s economy is largely based on tourism and the service industry. The town is home to several restaurants, hotels, and other tourist attractions. The town is also home to a number of small businesses, including a marina, a boat repair shop, and a seafood market.
The town is also home to a number of manufacturing and industrial businesses, including a paper mill, a plastics factory, and a metal fabrication plant. The town is also home to a number of seafood processing plants and canneries.
Demographics
As of the 2010 census, Edgewater had a population of 1,000 people. The racial makeup of the town was 94.2% White, 2.2% African American, 0.7% Native American, 0.7% Asian, 0.3% from other races, and 1.9% from two or more races. Hispanic or Latino of any race were 1.3% of the population.
The median household income in Edgewater was $41,250, and the median family income was $50,000. The per capita income for the town was $20,945. About 11.2% of families and 14.2% of the population were below the poverty line, including 18.2% of those under age 18 and 8.3% of those age 65 or over.
Common Questions
What is Per Capita Income in Edgewater?
Per Capita income in Edgewater is $54,498.
What is the Median Family Income in Edgewater?
Median Family Income in Edgewater is $167,657.
What is the Median Household income in Edgewater?
Median Household Income in Edgewater is $140,679.
What is Income or Wage Gap in Edgewater?
Income or Wage Gap in Edgewater is 0.4%.
Women in Edgewater earn 99.6 cents for every dollar earned by a man.
What is Inequality or Gini Index in Edgewater?
Inequality or Gini Index in Edgewater is 0.32.
What is the Total Population of Edgewater?
Total Population of Edgewater is 793.
What is the Total Male Population of Edgewater?
Total Male Population of Edgewater is 350.
What is the Total Female Population of Edgewater?
Total Female Population of Edgewater is 443.
What is the Ratio of Males per 100 Females in Edgewater?
There are 79.01 Males per 100 Females in Edgewater.
What is the Ratio of Females per 100 Males in Edgewater?
There are 126.57 Females per 100 Males in Edgewater.
What is the Median Population Age in Edgewater?
Median Population Age in Edgewater is 50.9 Years.
What is the Average Family Size in Edgewater
Average Family Size in Edgewater is 2.5 People.
What is the Average Household Size in Edgewater
Average Household Size in Edgewater is 2.2 People.
How Large is the Labor Force in Edgewater?
There are 354 People in the Labor Forcein in Edgewater.
What is the Percentage of People in the Labor Force in Edgewater?
51.0% of People are in the Labor Force in Edgewater.
What is the Unemployment Rate in Edgewater?
Unemployment Rate in Edgewater is 7.5%.