Evergreen, LA Map & Demographics
Evergreen Map
Evergreen Overview
$22,086
PER CAPITA INCOME
$45,000
AVG FAMILY INCOME
$33,125
AVG HOUSEHOLD INCOME
0.1%
WAGE / INCOME GAP [ % ]
99.9¢/ $1
WAGE / INCOME GAP [ $ ]
0.49
INEQUALITY / GINI INDEX
285
TOTAL POPULATION
152
MALE POPULATION
133
FEMALE POPULATION
114.29
MALES / 100 FEMALES
87.50
FEMALES / 100 MALES
49.0
MEDIAN AGE
3.3
AVG FAMILY SIZE
2.5
AVG HOUSEHOLD SIZE
103
LABOR FORCE [ PEOPLE ]
46.6%
PERCENT IN LABOR FORCE
12.6%
UNEMPLOYMENT RATE
Evergreen Zip Codes
Evergreen Area Codes
Income in Evergreen
Income Overview in Evergreen
Per Capita Income in Evergreen is $22,086, while median incomes of families and households are $45,000 and $33,125 respectively.
| Characteristic | Number | Measure |
| Per Capita Income | 285 | $22,086 |
| Median Family Income | 72 | $45,000 |
| Mean Family Income | 72 | $64,090 |
| Median Household Income | 114 | $33,125 |
| Mean Household Income | 114 | $51,879 |
| Income Deficit | 72 | $0 |
| Wage / Income Gap (%) | 285 | 0.09% |
| Wage / Income Gap ($) | 285 | 99.91¢ per $1 |
| Gini / Inequality Index | 285 | 0.49 |
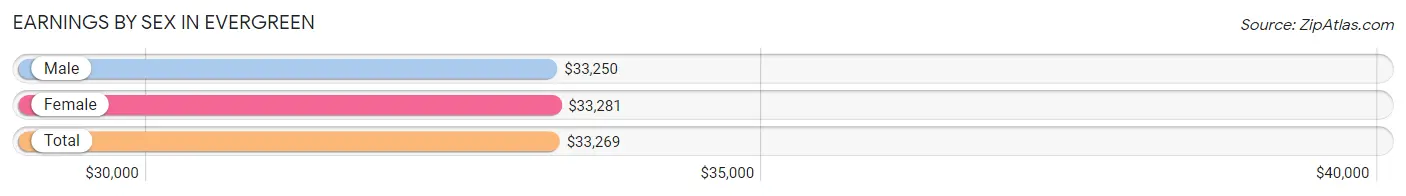
Earnings by Sex in Evergreen
Average Earnings in Evergreen are $33,269, $33,250 for men and $33,281 for women, a difference of 0.1%.
| Sex | Number | Average Earnings |
| Male | 47 (49.0%) | $33,250 |
| Female | 49 (51.0%) | $33,281 |
| Total | 96 (100.0%) | $33,269 |
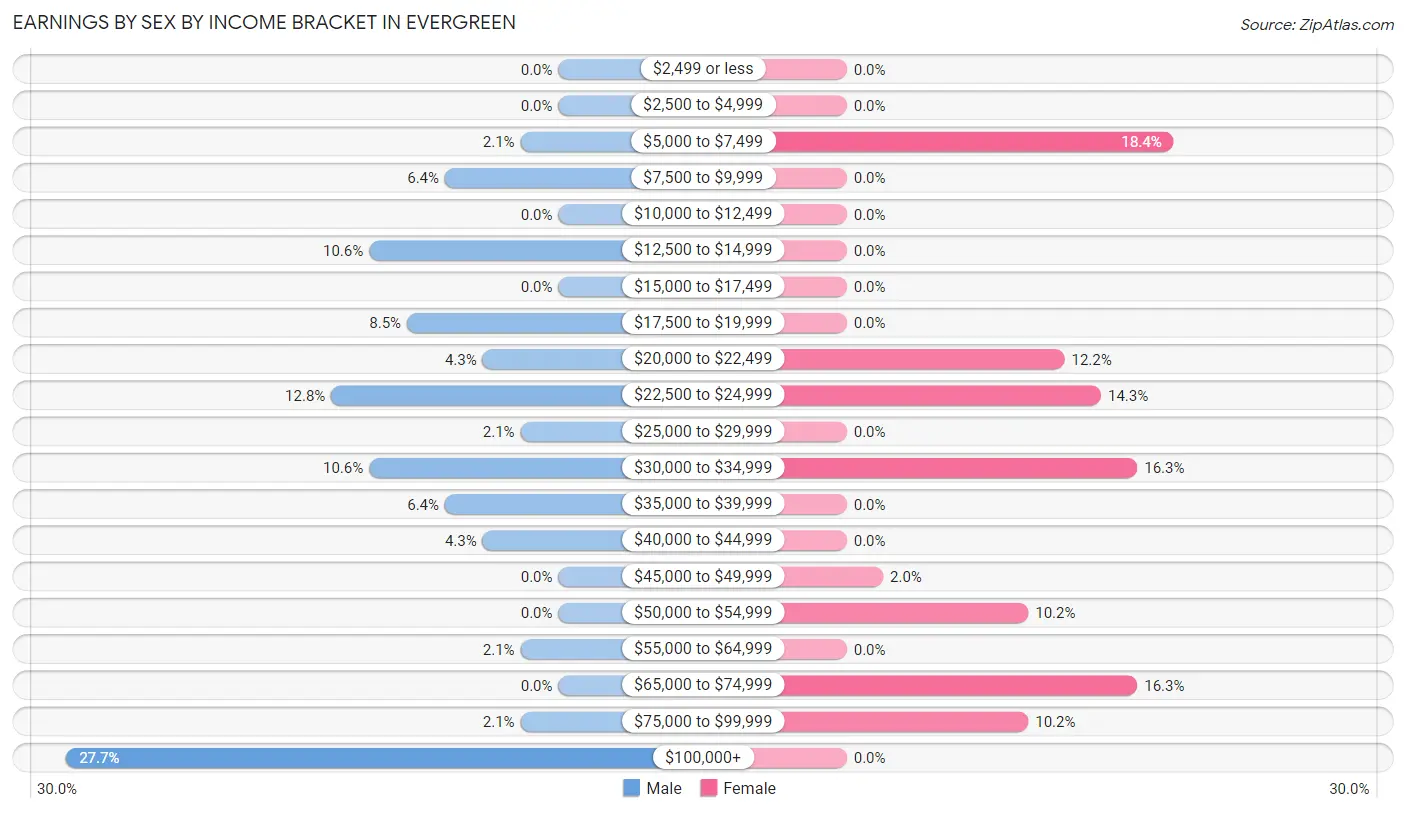
Earnings by Sex by Income Bracket in Evergreen
The most common earnings brackets in Evergreen are $100,000+ for men (13 | 27.7%) and $5,000 to $7,499 for women (9 | 18.4%).
| Income | Male | Female |
| $2,499 or less | 0 (0.0%) | 0 (0.0%) |
| $2,500 to $4,999 | 0 (0.0%) | 0 (0.0%) |
| $5,000 to $7,499 | 1 (2.1%) | 9 (18.4%) |
| $7,500 to $9,999 | 3 (6.4%) | 0 (0.0%) |
| $10,000 to $12,499 | 0 (0.0%) | 0 (0.0%) |
| $12,500 to $14,999 | 5 (10.6%) | 0 (0.0%) |
| $15,000 to $17,499 | 0 (0.0%) | 0 (0.0%) |
| $17,500 to $19,999 | 4 (8.5%) | 0 (0.0%) |
| $20,000 to $22,499 | 2 (4.3%) | 6 (12.2%) |
| $22,500 to $24,999 | 6 (12.8%) | 7 (14.3%) |
| $25,000 to $29,999 | 1 (2.1%) | 0 (0.0%) |
| $30,000 to $34,999 | 5 (10.6%) | 8 (16.3%) |
| $35,000 to $39,999 | 3 (6.4%) | 0 (0.0%) |
| $40,000 to $44,999 | 2 (4.3%) | 0 (0.0%) |
| $45,000 to $49,999 | 0 (0.0%) | 1 (2.0%) |
| $50,000 to $54,999 | 0 (0.0%) | 5 (10.2%) |
| $55,000 to $64,999 | 1 (2.1%) | 0 (0.0%) |
| $65,000 to $74,999 | 0 (0.0%) | 8 (16.3%) |
| $75,000 to $99,999 | 1 (2.1%) | 5 (10.2%) |
| $100,000+ | 13 (27.7%) | 0 (0.0%) |
| Total | 47 (100.0%) | 49 (100.0%) |
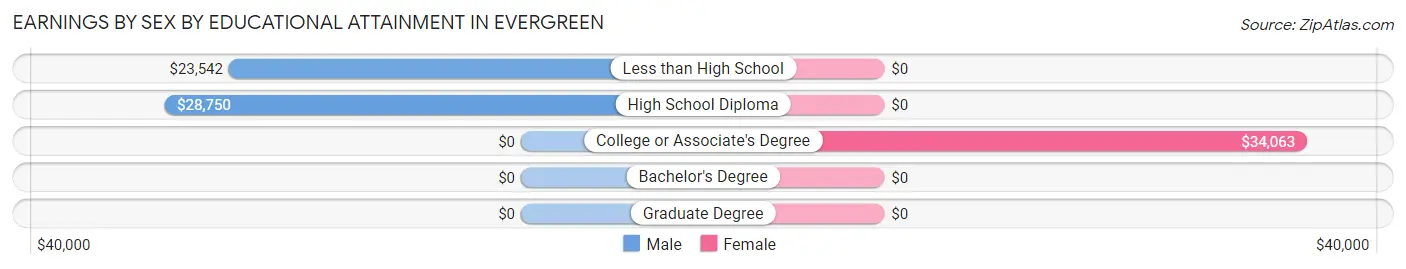
Earnings by Sex by Educational Attainment in Evergreen
| Educational Attainment | Male Income | Female Income |
| Less than High School | $23,542 | $0 |
| High School Diploma | $28,750 | $0 |
| College or Associate's Degree | - | - |
| Bachelor's Degree | - | - |
| Graduate Degree | - | - |
| Total | - | - |
Family Income in Evergreen
Family Income Brackets in Evergreen
According to the Evergreen family income data, there are 14 families falling into the $25,000 to $34,999 income range, which is the most common income bracket and makes up 19.4% of all families.
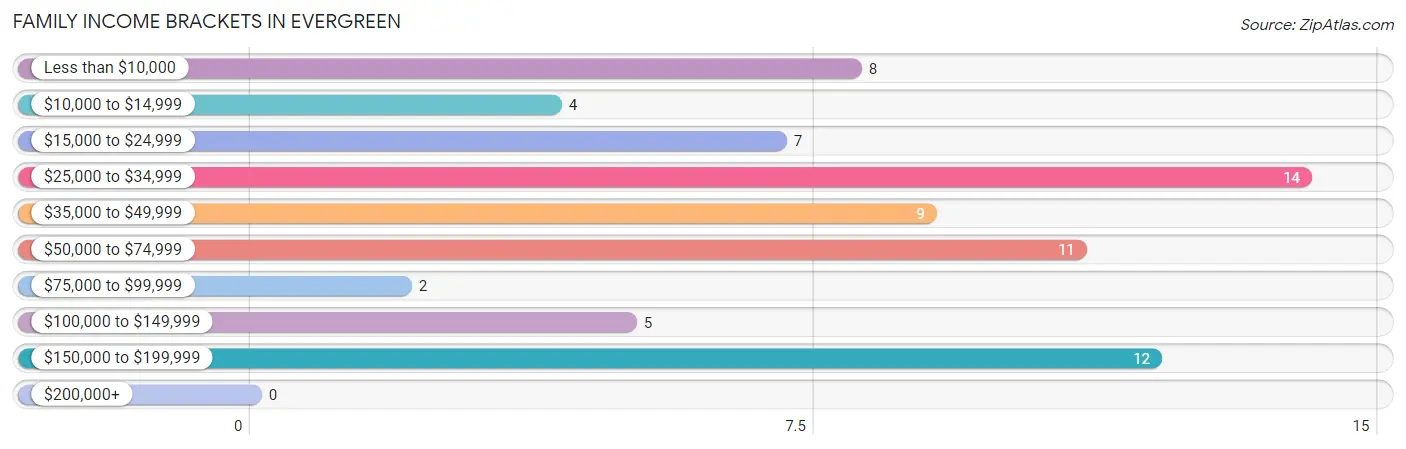
| Income Bracket | # Families | % Families |
| Less than $10,000 | 8 | 11.1% |
| $10,000 to $14,999 | 4 | 5.6% |
| $15,000 to $24,999 | 7 | 9.7% |
| $25,000 to $34,999 | 14 | 19.4% |
| $35,000 to $49,999 | 9 | 12.5% |
| $50,000 to $74,999 | 11 | 15.3% |
| $75,000 to $99,999 | 2 | 2.8% |
| $100,000 to $149,999 | 5 | 6.9% |
| $150,000 to $199,999 | 12 | 16.7% |
| $200,000+ | 0 | 0.0% |
Family Income by Famaliy Size in Evergreen
4-person families (15 | 20.8%) account for the highest median family income in Evergreen with $46,458 per family, while 2-person families (52 | 72.2%) have the highest median income of $15,714 per family member.
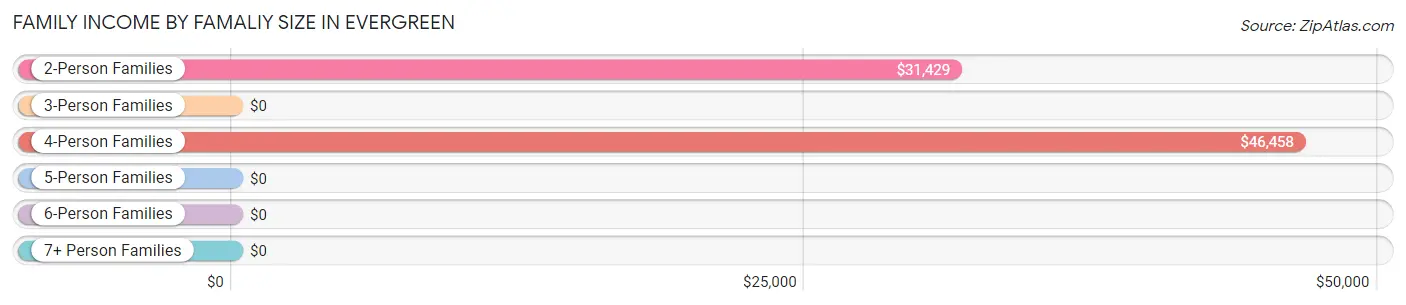
| Income Bracket | # Families | Median Income |
| 2-Person Families | 52 (72.2%) | $31,429 |
| 3-Person Families | 0 (0.0%) | $0 |
| 4-Person Families | 15 (20.8%) | $46,458 |
| 5-Person Families | 5 (6.9%) | $0 |
| 6-Person Families | 0 (0.0%) | $0 |
| 7+ Person Families | 0 (0.0%) | $0 |
| Total | 72 (100.0%) | $45,000 |
Family Income by Number of Earners in Evergreen
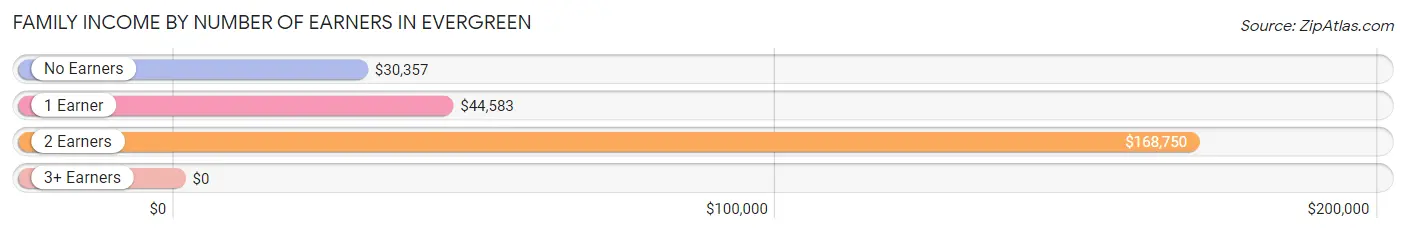
| Number of Earners | # Families | Median Income |
| No Earners | 22 (30.6%) | $30,357 |
| 1 Earner | 31 (43.1%) | $44,583 |
| 2 Earners | 19 (26.4%) | $168,750 |
| 3+ Earners | 0 (0.0%) | $0 |
| Total | 72 (100.0%) | $45,000 |
Household Income in Evergreen
Household Income Brackets in Evergreen
With 25 households falling in the category, the $50,000 to $74,999 income range is the most frequent in Evergreen, accounting for 21.9% of all households.
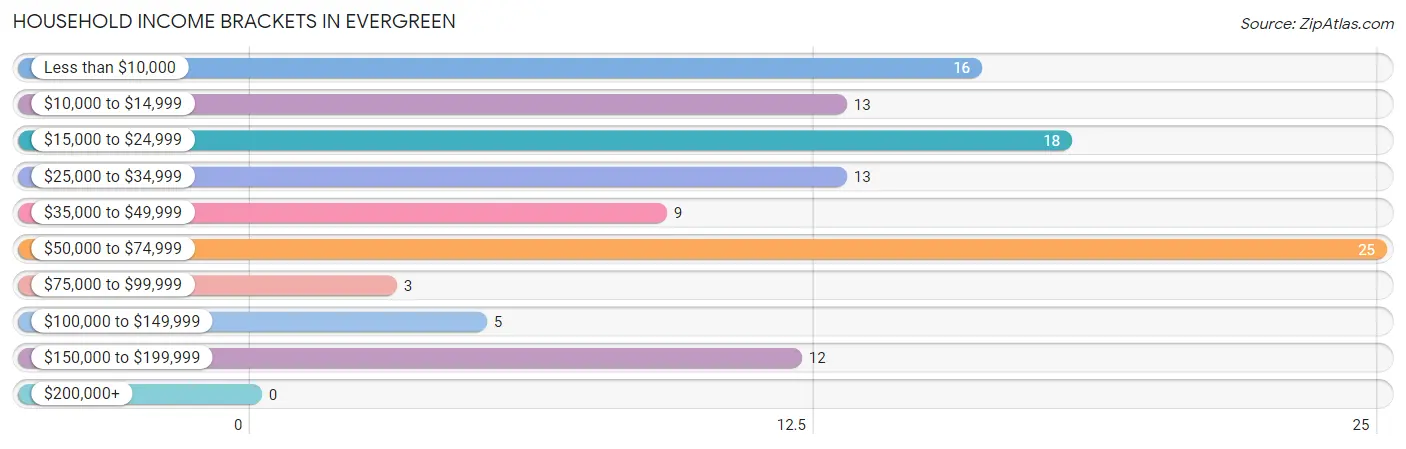
| Income Bracket | # Households | % Households |
| Less than $10,000 | 16 | 14.0% |
| $10,000 to $14,999 | 13 | 11.4% |
| $15,000 to $24,999 | 18 | 15.8% |
| $25,000 to $34,999 | 13 | 11.4% |
| $35,000 to $49,999 | 9 | 7.9% |
| $50,000 to $74,999 | 25 | 21.9% |
| $75,000 to $99,999 | 3 | 2.6% |
| $100,000 to $149,999 | 5 | 4.4% |
| $150,000 to $199,999 | 12 | 10.5% |
| $200,000+ | 0 | 0.0% |
Household Income by Householder Age in Evergreen
The median household income in Evergreen is $33,125, with the highest median household income of $56,500 found in the 45 to 64 years age bracket for the primary householder. A total of 50 households (43.9%) fall into this category. Meanwhile, the 15 to 24 years age bracket for the primary householder has the lowest median household income of $0, with 11 households (9.7%) in this group.
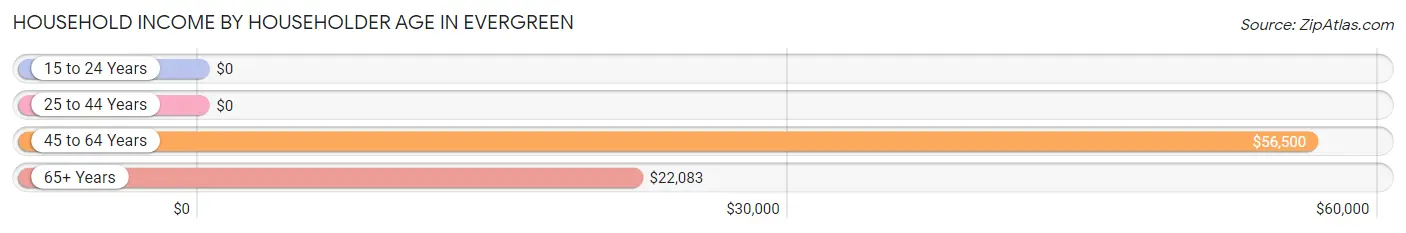
| Income Bracket | # Households | Median Income |
| 15 to 24 Years | 11 (9.7%) | $0 |
| 25 to 44 Years | 10 (8.8%) | $0 |
| 45 to 64 Years | 50 (43.9%) | $56,500 |
| 65+ Years | 43 (37.7%) | $22,083 |
| Total | 114 (100.0%) | $33,125 |
Poverty in Evergreen
Income Below Poverty by Sex and Age in Evergreen
With 13.2% poverty level for males and 17.3% for females among the residents of Evergreen, under 5 year old males and 16 and 17 year old females are the most vulnerable to poverty, with 5 males (83.3%) and 2 females (100.0%) in their respective age groups living below the poverty level.
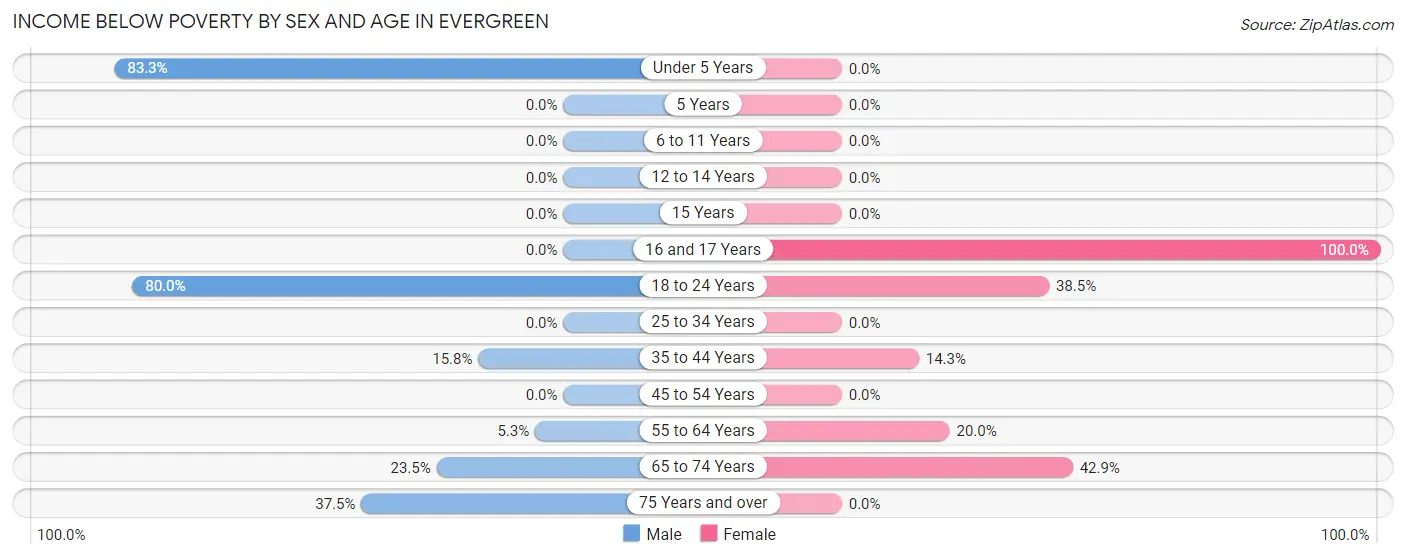
| Age Bracket | Male | Female |
| Under 5 Years | 5 (83.3%) | 0 (0.0%) |
| 5 Years | 0 (0.0%) | 0 (0.0%) |
| 6 to 11 Years | 0 (0.0%) | 0 (0.0%) |
| 12 to 14 Years | 0 (0.0%) | 0 (0.0%) |
| 15 Years | 0 (0.0%) | 0 (0.0%) |
| 16 and 17 Years | 0 (0.0%) | 2 (100.0%) |
| 18 to 24 Years | 4 (80.0%) | 5 (38.5%) |
| 25 to 34 Years | 0 (0.0%) | 0 (0.0%) |
| 35 to 44 Years | 3 (15.8%) | 1 (14.3%) |
| 45 to 54 Years | 0 (0.0%) | 0 (0.0%) |
| 55 to 64 Years | 1 (5.3%) | 6 (20.0%) |
| 65 to 74 Years | 4 (23.5%) | 9 (42.9%) |
| 75 Years and over | 3 (37.5%) | 0 (0.0%) |
| Total | 20 (13.2%) | 23 (17.3%) |
Income Above Poverty by Sex and Age in Evergreen
According to the poverty statistics in Evergreen, males aged 6 to 11 years and females aged 6 to 11 years are the age groups that are most secure financially, with 100.0% of males and 100.0% of females in these age groups living above the poverty line.
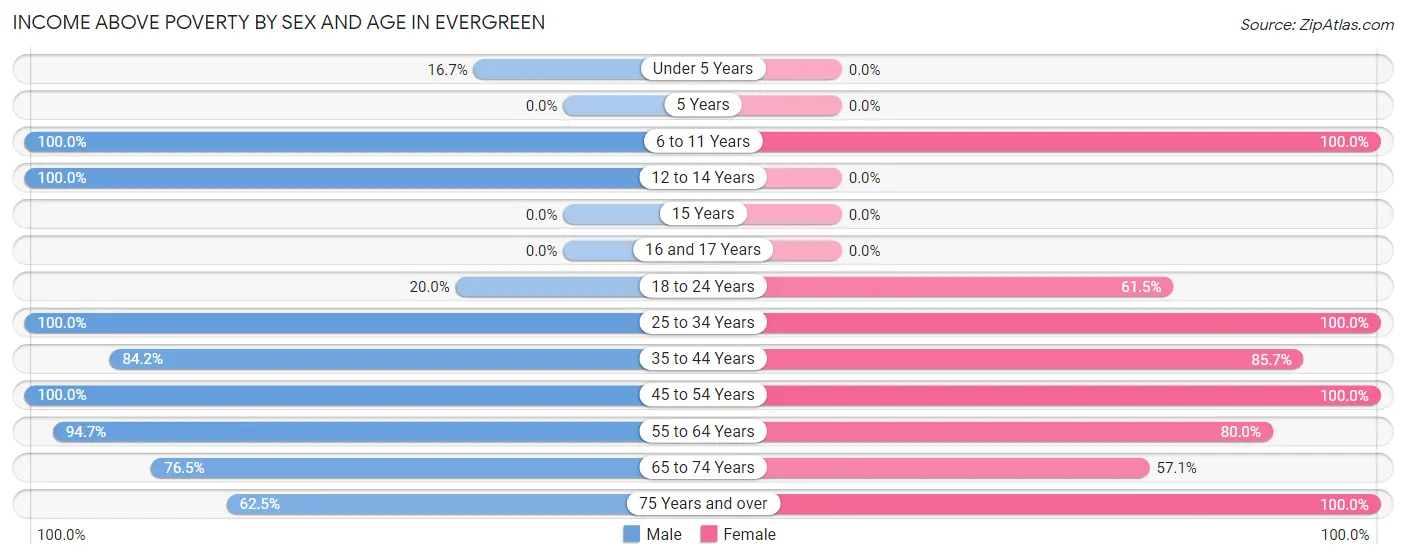
| Age Bracket | Male | Female |
| Under 5 Years | 1 (16.7%) | 0 (0.0%) |
| 5 Years | 0 (0.0%) | 0 (0.0%) |
| 6 to 11 Years | 29 (100.0%) | 4 (100.0%) |
| 12 to 14 Years | 25 (100.0%) | 0 (0.0%) |
| 15 Years | 0 (0.0%) | 0 (0.0%) |
| 16 and 17 Years | 0 (0.0%) | 0 (0.0%) |
| 18 to 24 Years | 1 (20.0%) | 8 (61.5%) |
| 25 to 34 Years | 11 (100.0%) | 18 (100.0%) |
| 35 to 44 Years | 16 (84.2%) | 6 (85.7%) |
| 45 to 54 Years | 13 (100.0%) | 19 (100.0%) |
| 55 to 64 Years | 18 (94.7%) | 24 (80.0%) |
| 65 to 74 Years | 13 (76.5%) | 12 (57.1%) |
| 75 Years and over | 5 (62.5%) | 19 (100.0%) |
| Total | 132 (86.8%) | 110 (82.7%) |
Income Below Poverty Among Married-Couple Families in Evergreen
The poverty statistics for married-couple families in Evergreen show that 2.2% or 1 of the total 45 families live below the poverty line. Families with no children have the highest poverty rate of 2.7%, comprising of 1 families. On the other hand, families with 1 or 2 children have the lowest poverty rate of 0.0%, which includes 0 families.
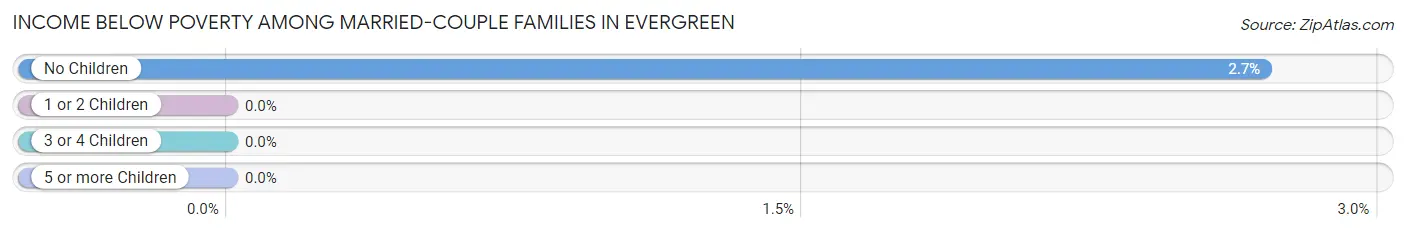
| Children | Above Poverty | Below Poverty |
| No Children | 36 (97.3%) | 1 (2.7%) |
| 1 or 2 Children | 3 (100.0%) | 0 (0.0%) |
| 3 or 4 Children | 5 (100.0%) | 0 (0.0%) |
| 5 or more Children | 0 (0.0%) | 0 (0.0%) |
| Total | 44 (97.8%) | 1 (2.2%) |
Income Below Poverty Among Single-Parent Households in Evergreen
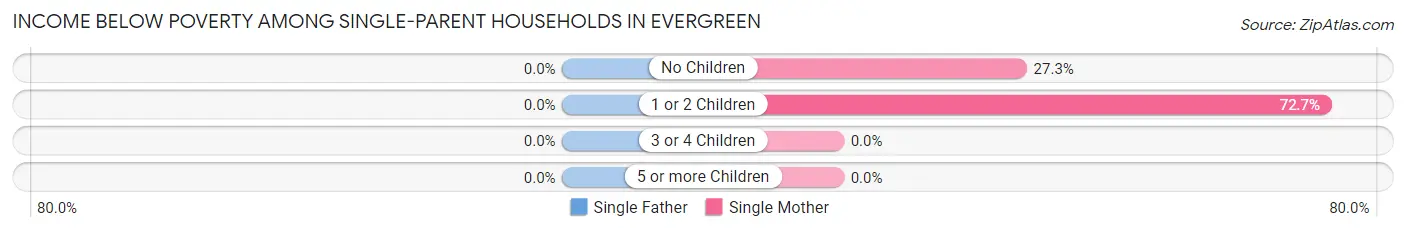
| Children | Single Father | Single Mother |
| No Children | 0 (0.0%) | 3 (27.3%) |
| 1 or 2 Children | 0 (0.0%) | 8 (72.7%) |
| 3 or 4 Children | 0 (0.0%) | 0 (0.0%) |
| 5 or more Children | 0 (0.0%) | 0 (0.0%) |
| Total | 0 (0.0%) | 11 (50.0%) |
Income Below Poverty Among Married-Couple vs Single-Parent Households in Evergreen
The poverty data for Evergreen shows that 1 of the married-couple family households (2.2%) and 11 of the single-parent households (40.7%) are living below the poverty level. Within the married-couple family households, those with no children have the highest poverty rate, with 1 households (2.7%) falling below the poverty line. Among the single-parent households, those with 1 or 2 children have the highest poverty rate, with 8 household (66.7%) living below poverty.
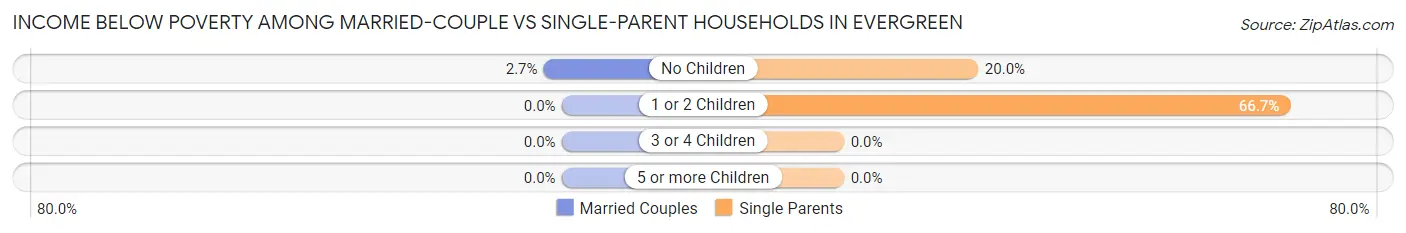
| Children | Married-Couple Families | Single-Parent Households |
| No Children | 1 (2.7%) | 3 (20.0%) |
| 1 or 2 Children | 0 (0.0%) | 8 (66.7%) |
| 3 or 4 Children | 0 (0.0%) | 0 (0.0%) |
| 5 or more Children | 0 (0.0%) | 0 (0.0%) |
| Total | 1 (2.2%) | 11 (40.7%) |
Race in Evergreen
The most populous races in Evergreen are White / Caucasian (228 | 80.0%), and Black / African American (57 | 20.0%).
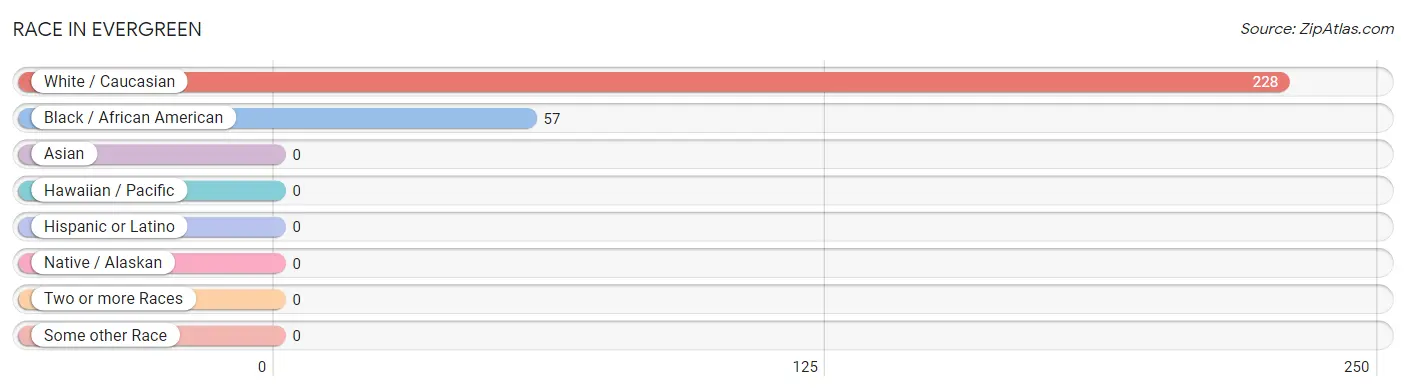
| Race | # Population | % Population |
| Asian | 0 | 0.0% |
| Black / African American | 57 | 20.0% |
| Hawaiian / Pacific | 0 | 0.0% |
| Hispanic or Latino | 0 | 0.0% |
| Native / Alaskan | 0 | 0.0% |
| White / Caucasian | 228 | 80.0% |
| Two or more Races | 0 | 0.0% |
| Some other Race | 0 | 0.0% |
| Total | 285 | 100.0% |
Ancestry in Evergreen
The most populous ancestries reported in Evergreen are French (110 | 38.6%), English (23 | 8.1%), German (17 | 6.0%), Irish (16 | 5.6%), and American (12 | 4.2%), together accounting for 62.5% of all Evergreen residents.
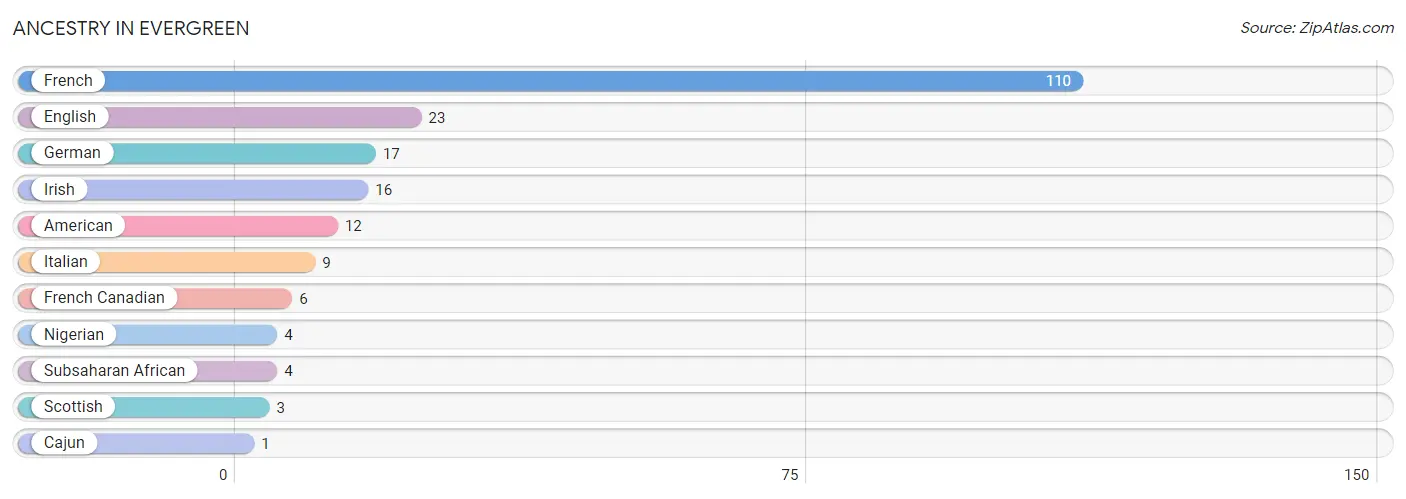
| Ancestry | # Population | % Population |
| American | 12 | 4.2% |
| Cajun | 1 | 0.4% |
| English | 23 | 8.1% |
| French | 110 | 38.6% |
| French Canadian | 6 | 2.1% |
| German | 17 | 6.0% |
| Irish | 16 | 5.6% |
| Italian | 9 | 3.2% |
| Nigerian | 4 | 1.4% |
| Scottish | 3 | 1.1% |
| Subsaharan African | 4 | 1.4% | View All 11 Rows |
Immigrants in Evergreen

| Immigration Origin | # Population | % Population | View All 0 Rows |
Sex and Age in Evergreen
Sex and Age in Evergreen
The most populous age groups in Evergreen are 10 to 14 Years (31 | 20.4%) for men and 60 to 64 Years (20 | 15.0%) for women.
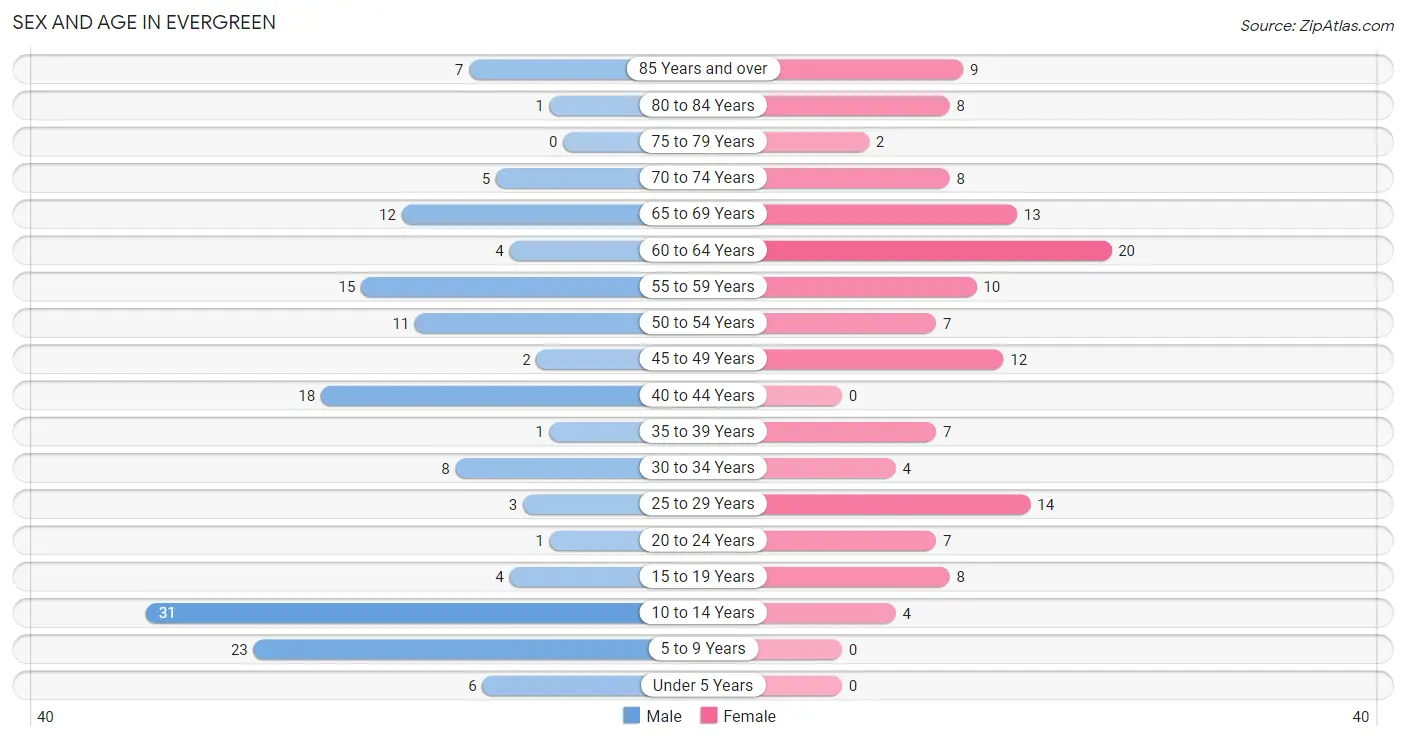
| Age Bracket | Male | Female |
| Under 5 Years | 6 (4.0%) | 0 (0.0%) |
| 5 to 9 Years | 23 (15.1%) | 0 (0.0%) |
| 10 to 14 Years | 31 (20.4%) | 4 (3.0%) |
| 15 to 19 Years | 4 (2.6%) | 8 (6.0%) |
| 20 to 24 Years | 1 (0.7%) | 7 (5.3%) |
| 25 to 29 Years | 3 (2.0%) | 14 (10.5%) |
| 30 to 34 Years | 8 (5.3%) | 4 (3.0%) |
| 35 to 39 Years | 1 (0.7%) | 7 (5.3%) |
| 40 to 44 Years | 18 (11.8%) | 0 (0.0%) |
| 45 to 49 Years | 2 (1.3%) | 12 (9.0%) |
| 50 to 54 Years | 11 (7.2%) | 7 (5.3%) |
| 55 to 59 Years | 15 (9.9%) | 10 (7.5%) |
| 60 to 64 Years | 4 (2.6%) | 20 (15.0%) |
| 65 to 69 Years | 12 (7.9%) | 13 (9.8%) |
| 70 to 74 Years | 5 (3.3%) | 8 (6.0%) |
| 75 to 79 Years | 0 (0.0%) | 2 (1.5%) |
| 80 to 84 Years | 1 (0.7%) | 8 (6.0%) |
| 85 Years and over | 7 (4.6%) | 9 (6.8%) |
| Total | 152 (100.0%) | 133 (100.0%) |
Families and Households in Evergreen
Median Family Size in Evergreen
The median family size in Evergreen is 3.31 persons per family, with single female/mother families (22 | 30.6%) accounting for the largest median family size of 3.91 persons per family. On the other hand, single male/father families (5 | 6.9%) represent the smallest median family size with 1.60 persons per family.
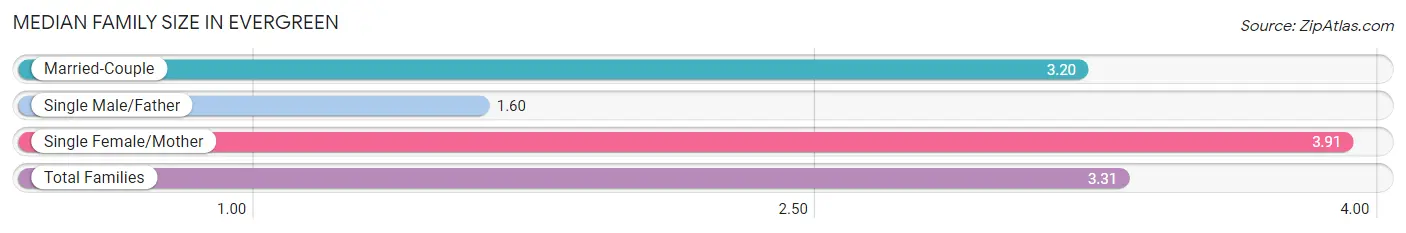
| Family Type | # Families | Family Size |
| Married-Couple | 45 (62.5%) | 3.20 |
| Single Male/Father | 5 (6.9%) | 1.60 |
| Single Female/Mother | 22 (30.6%) | 3.91 |
| Total Families | 72 (100.0%) | 3.31 |
Median Household Size in Evergreen
The median household size in Evergreen is 2.50 persons per household, with single female/mother households (22 | 19.3%) accounting for the largest median household size of 3.91 persons per household. non-family households (42 | 36.8%) represent the smallest median household size with 1.10 persons per household.
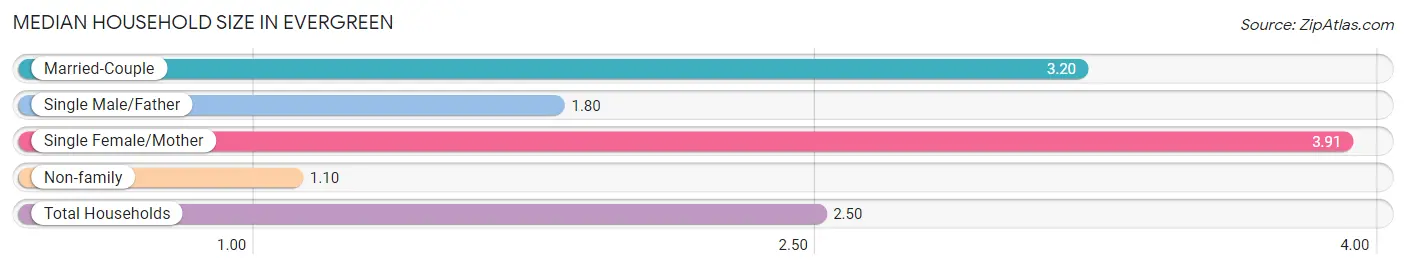
| Household Type | # Households | Household Size |
| Married-Couple | 45 (39.5%) | 3.20 |
| Single Male/Father | 5 (4.4%) | 1.80 |
| Single Female/Mother | 22 (19.3%) | 3.91 |
| Non-family | 42 (36.8%) | 1.10 |
| Total Households | 114 (100.0%) | 2.50 |
Household Size by Marriage Status in Evergreen
Out of a total of 114 households in Evergreen, 72 (63.2%) are family households, while 42 (36.8%) are nonfamily households. The most numerous type of family households are 2-person households, comprising 51, and the most common type of nonfamily households are 1-person households, comprising 36.
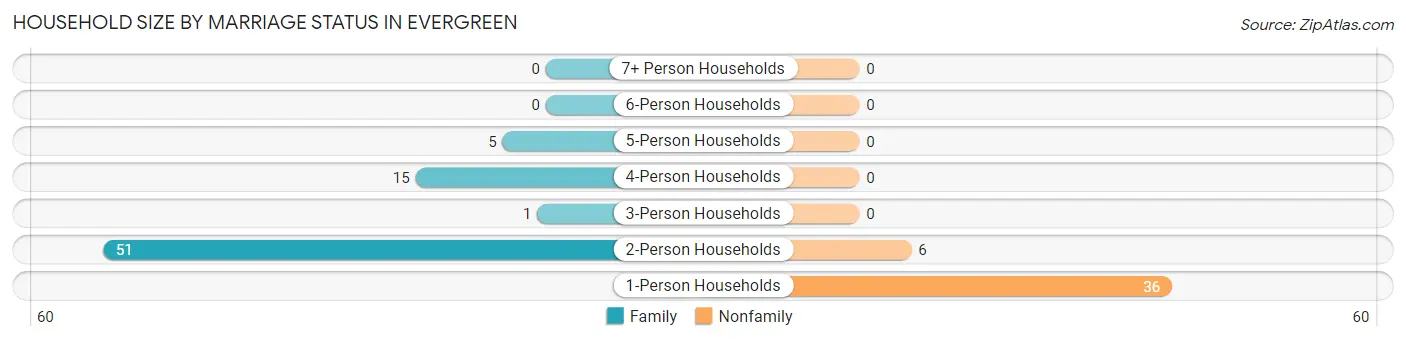
| Household Size | Family Households | Nonfamily Households |
| 1-Person Households | - | 36 (31.6%) |
| 2-Person Households | 51 (44.7%) | 6 (5.3%) |
| 3-Person Households | 1 (0.9%) | 0 (0.0%) |
| 4-Person Households | 15 (13.2%) | 0 (0.0%) |
| 5-Person Households | 5 (4.4%) | 0 (0.0%) |
| 6-Person Households | 0 (0.0%) | 0 (0.0%) |
| 7+ Person Households | 0 (0.0%) | 0 (0.0%) |
| Total | 72 (63.2%) | 42 (36.8%) |
Female Fertility in Evergreen
Fertility by Age in Evergreen
Average fertility rate in Evergreen is 115.0 births per 1,000 women. Women in the age bracket of 20 to 34 years have the highest fertility rate with 200.0 births per 1,000 women. Women in the age bracket of 20 to 34 years acount for 83.3% of all women with births.
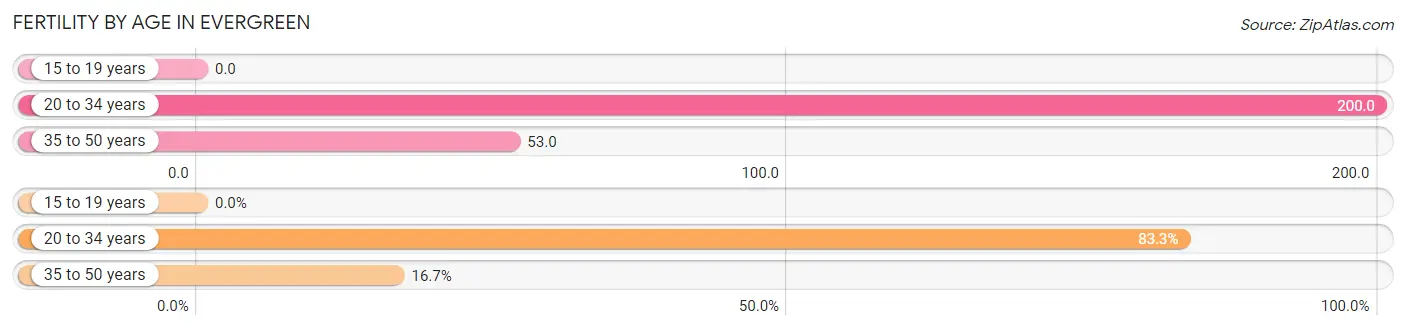
| Age Bracket | Women with Births | Births / 1,000 Women |
| 15 to 19 years | 0 (0.0%) | 0.0 |
| 20 to 34 years | 5 (83.3%) | 200.0 |
| 35 to 50 years | 1 (16.7%) | 53.0 |
| Total | 6 (100.0%) | 115.0 |
Fertility by Age by Marriage Status in Evergreen
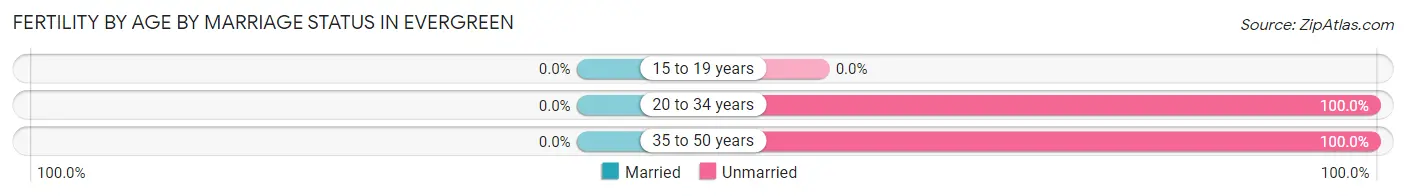
| Age Bracket | Married | Unmarried |
| 15 to 19 years | 0 (0.0%) | 0 (0.0%) |
| 20 to 34 years | 0 (0.0%) | 5 (100.0%) |
| 35 to 50 years | 0 (0.0%) | 1 (100.0%) |
| Total | 0 (0.0%) | 6 (100.0%) |
Fertility by Education in Evergreen
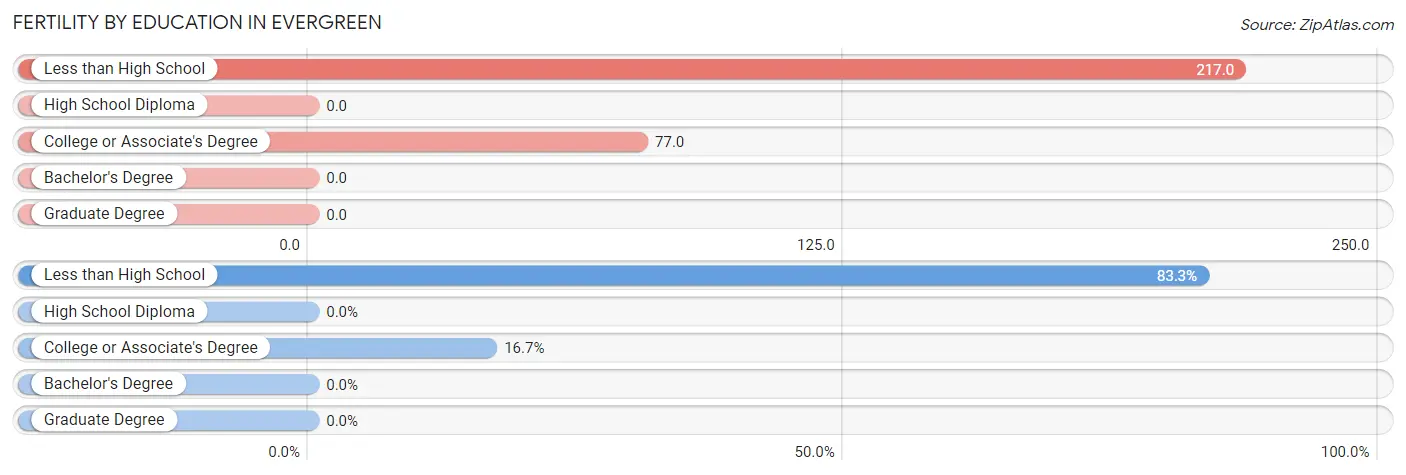
| Educational Attainment | Women with Births | Births / 1,000 Women |
| Less than High School | 5 (83.3%) | 217.0 |
| High School Diploma | 0 (0.0%) | 0.0 |
| College or Associate's Degree | 1 (16.7%) | 77.0 |
| Bachelor's Degree | 0 (0.0%) | 0.0 |
| Graduate Degree | 0 (0.0%) | 0.0 |
| Total | 6 (100.0%) | 115.0 |
Fertility by Education by Marriage Status in Evergreen
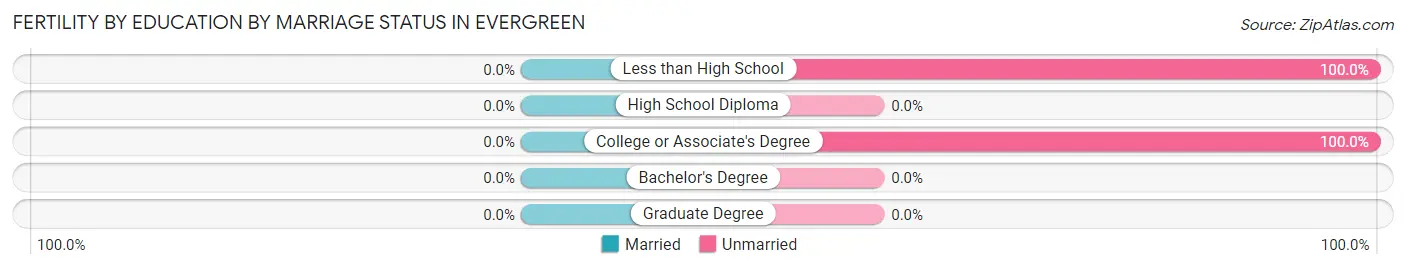
| Educational Attainment | Married | Unmarried |
| Less than High School | 0 (0.0%) | 5 (100.0%) |
| High School Diploma | 0 (0.0%) | 0 (0.0%) |
| College or Associate's Degree | 0 (0.0%) | 1 (100.0%) |
| Bachelor's Degree | 0 (0.0%) | 0 (0.0%) |
| Graduate Degree | 0 (0.0%) | 0 (0.0%) |
| Total | 0 (0.0%) | 6 (100.0%) |
Employment Characteristics in Evergreen
Employment by Class of Employer in Evergreen
Among the 90 employed individuals in Evergreen, private company employees (63 | 70.0%), self-employed (incorporated) (7 | 7.8%), and local government employees (6 | 6.7%) make up the most common classes of employment.
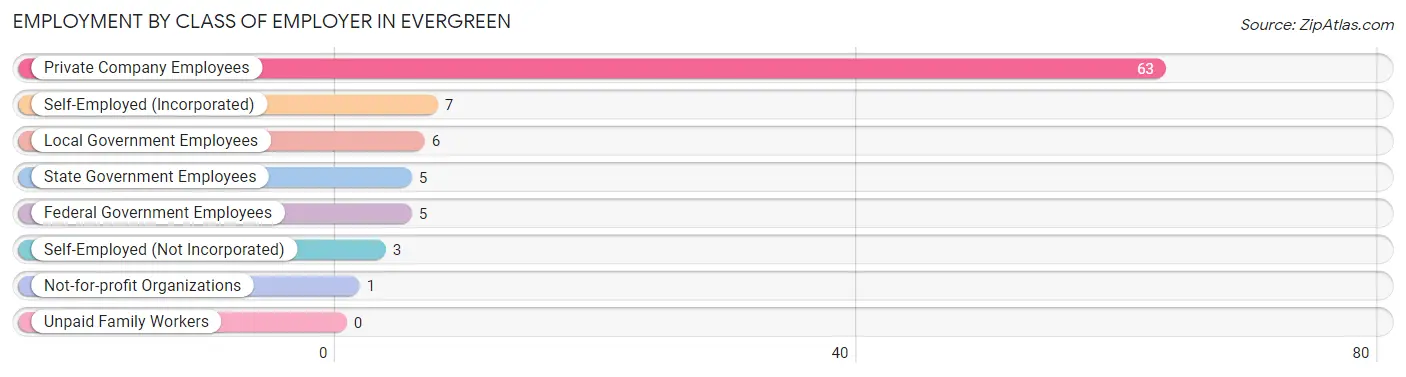
| Employer Class | # Employees | % Employees |
| Private Company Employees | 63 | 70.0% |
| Self-Employed (Incorporated) | 7 | 7.8% |
| Self-Employed (Not Incorporated) | 3 | 3.3% |
| Not-for-profit Organizations | 1 | 1.1% |
| Local Government Employees | 6 | 6.7% |
| State Government Employees | 5 | 5.6% |
| Federal Government Employees | 5 | 5.6% |
| Unpaid Family Workers | 0 | 0.0% |
| Total | 90 | 100.0% |
Employment Status by Age in Evergreen
According to the labor force statistics for Evergreen, out of the total population over 16 years of age (221), 46.6% or 103 individuals are in the labor force, with 12.6% or 13 of them unemployed. The age group with the highest labor force participation rate is 20 to 24 years, with 100.0% or 8 individuals in the labor force. Within the labor force, the 20 to 24 years age range has the highest percentage of unemployed individuals, with 62.5% or 5 of them being unemployed.
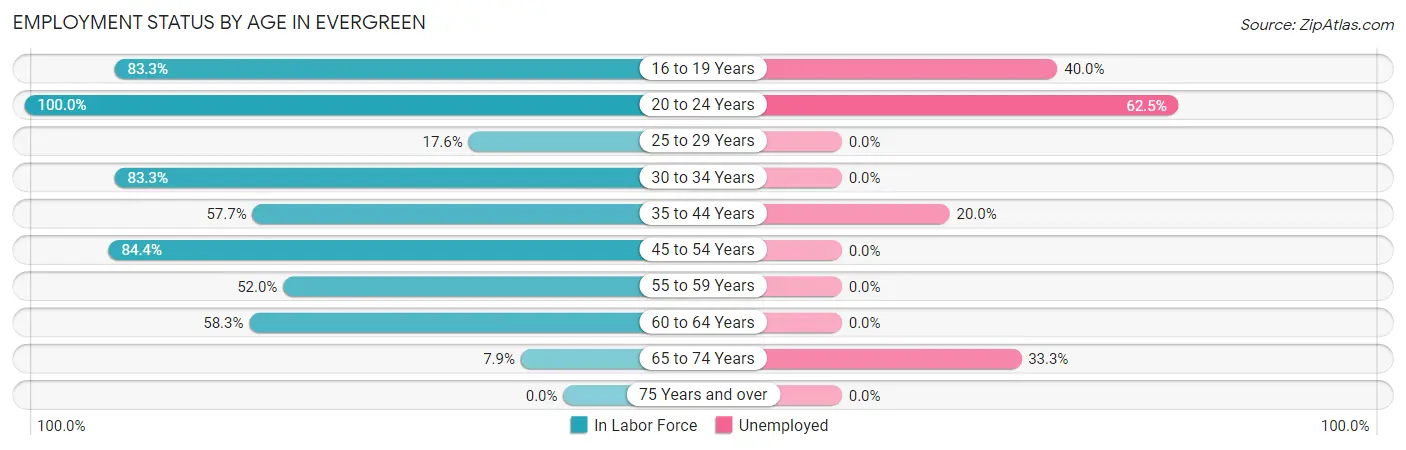
| Age Bracket | In Labor Force | Unemployed |
| 16 to 19 Years | 10 (83.3%) | 4 (40.0%) |
| 20 to 24 Years | 8 (100.0%) | 5 (62.5%) |
| 25 to 29 Years | 3 (17.6%) | 0 (0.0%) |
| 30 to 34 Years | 10 (83.3%) | 0 (0.0%) |
| 35 to 44 Years | 15 (57.7%) | 3 (20.0%) |
| 45 to 54 Years | 27 (84.4%) | 0 (0.0%) |
| 55 to 59 Years | 13 (52.0%) | 0 (0.0%) |
| 60 to 64 Years | 14 (58.3%) | 0 (0.0%) |
| 65 to 74 Years | 3 (7.9%) | 1 (33.3%) |
| 75 Years and over | 0 (0.0%) | 0 (0.0%) |
| Total | 103 (46.6%) | 13 (12.6%) |
Employment Status by Educational Attainment in Evergreen
According to labor force statistics for Evergreen, 60.3% of individuals (82) out of the total population between 25 and 64 years of age (136) are in the labor force, with 3.7% or 3 of them being unemployed. The group with the highest labor force participation rate are those with the educational attainment of college / associate degree, with 90.2% or 37 individuals in the labor force. Within the labor force, individuals with high school diploma education have the highest percentage of unemployment, with 16.7% or 3 of them being unemployed.
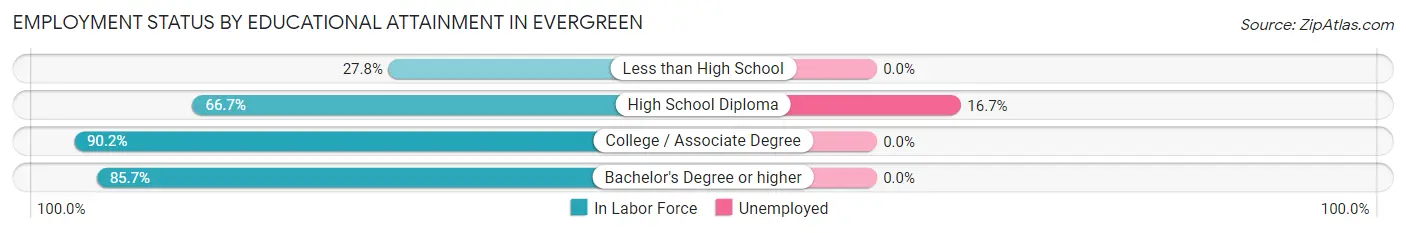
| Educational Attainment | In Labor Force | Unemployed |
| Less than High School | 15 (27.8%) | 0 (0.0%) |
| High School Diploma | 18 (66.7%) | 5 (16.7%) |
| College / Associate Degree | 37 (90.2%) | 0 (0.0%) |
| Bachelor's Degree or higher | 12 (85.7%) | 0 (0.0%) |
| Total | 82 (60.3%) | 5 (3.7%) |
Employment Occupations by Sex in Evergreen
Management, Business, Science and Arts Occupations
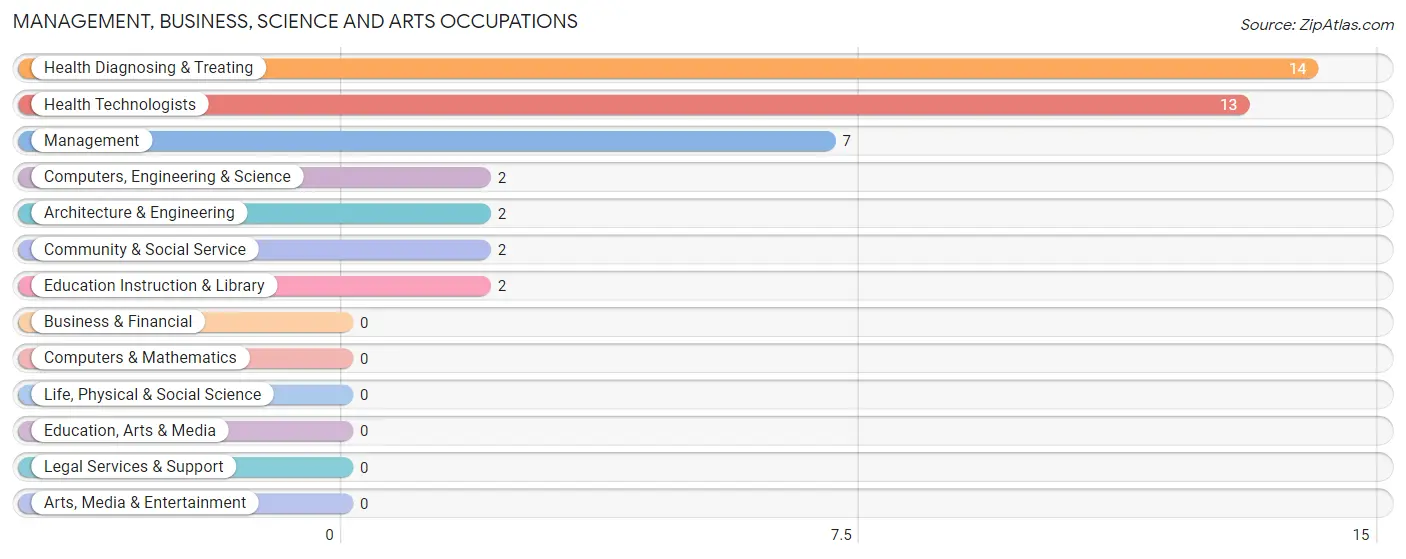
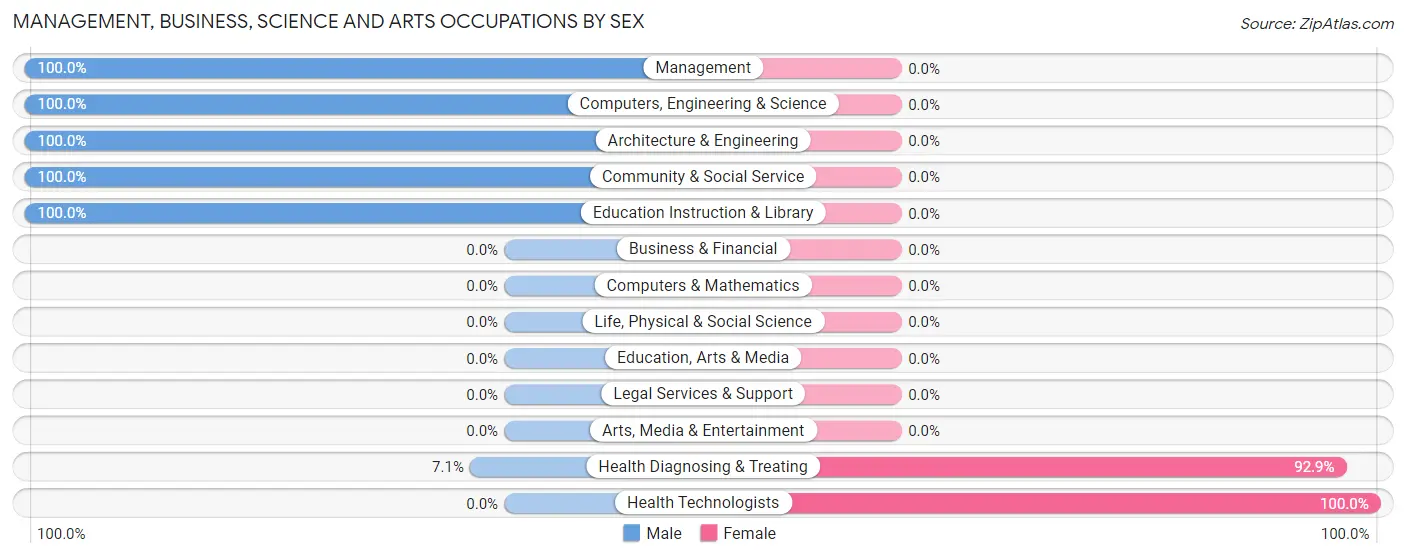
The most common Management, Business, Science and Arts occupations in Evergreen are Health Diagnosing & Treating (14 | 15.6%), Health Technologists (13 | 14.4%), Management (7 | 7.8%), Computers, Engineering & Science (2 | 2.2%), and Architecture & Engineering (2 | 2.2%).
Management, Business, Science and Arts Occupations by Sex
Within the Management, Business, Science and Arts occupations in Evergreen, the most male-oriented occupations are Management (100.0%), Computers, Engineering & Science (100.0%), and Architecture & Engineering (100.0%), while the most female-oriented occupations are Health Technologists (100.0%), and Health Diagnosing & Treating (92.9%).
| Occupation | Male | Female |
| Management | 7 (100.0%) | 0 (0.0%) |
| Business & Financial | 0 (0.0%) | 0 (0.0%) |
| Computers, Engineering & Science | 2 (100.0%) | 0 (0.0%) |
| Computers & Mathematics | 0 (0.0%) | 0 (0.0%) |
| Architecture & Engineering | 2 (100.0%) | 0 (0.0%) |
| Life, Physical & Social Science | 0 (0.0%) | 0 (0.0%) |
| Community & Social Service | 2 (100.0%) | 0 (0.0%) |
| Education, Arts & Media | 0 (0.0%) | 0 (0.0%) |
| Legal Services & Support | 0 (0.0%) | 0 (0.0%) |
| Education Instruction & Library | 2 (100.0%) | 0 (0.0%) |
| Arts, Media & Entertainment | 0 (0.0%) | 0 (0.0%) |
| Health Diagnosing & Treating | 1 (7.1%) | 13 (92.9%) |
| Health Technologists | 0 (0.0%) | 13 (100.0%) |
| Total (Category) | 12 (48.0%) | 13 (52.0%) |
| Total (Overall) | 46 (51.1%) | 44 (48.9%) |
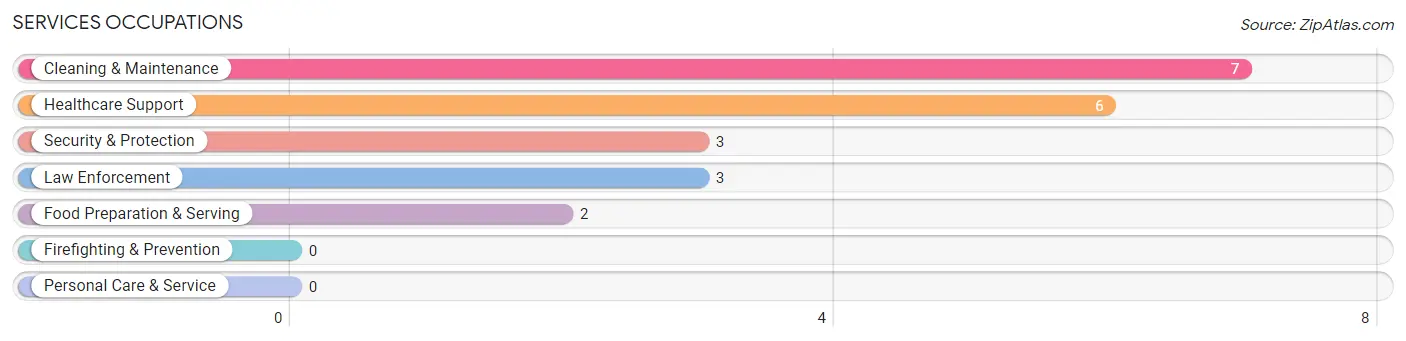
Services Occupations
The most common Services occupations in Evergreen are Cleaning & Maintenance (7 | 7.8%), Healthcare Support (6 | 6.7%), Security & Protection (3 | 3.3%), Law Enforcement (3 | 3.3%), and Food Preparation & Serving (2 | 2.2%).
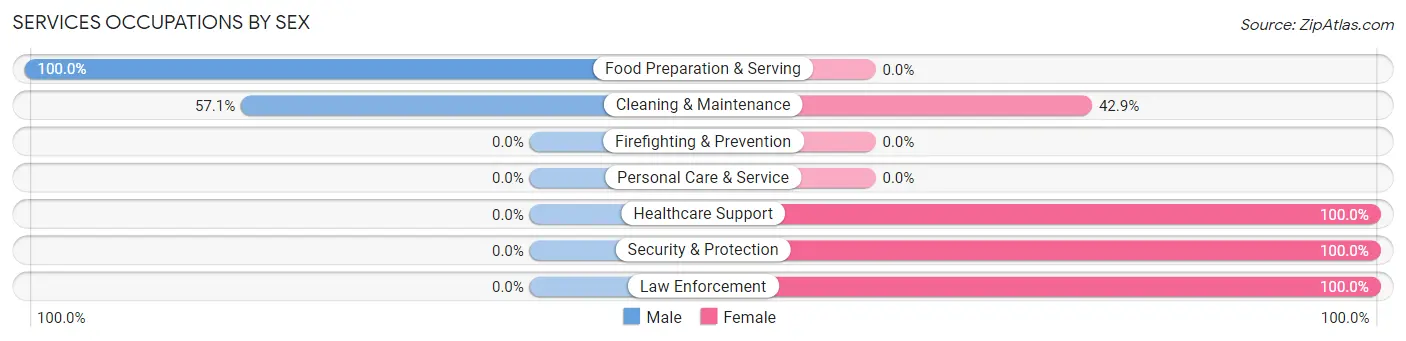
Services Occupations by Sex
Within the Services occupations in Evergreen, the most male-oriented occupations are Food Preparation & Serving (100.0%), and Cleaning & Maintenance (57.1%), while the most female-oriented occupations are Healthcare Support (100.0%), Security & Protection (100.0%), and Law Enforcement (100.0%).
| Occupation | Male | Female |
| Healthcare Support | 0 (0.0%) | 6 (100.0%) |
| Security & Protection | 0 (0.0%) | 3 (100.0%) |
| Firefighting & Prevention | 0 (0.0%) | 0 (0.0%) |
| Law Enforcement | 0 (0.0%) | 3 (100.0%) |
| Food Preparation & Serving | 2 (100.0%) | 0 (0.0%) |
| Cleaning & Maintenance | 4 (57.1%) | 3 (42.9%) |
| Personal Care & Service | 0 (0.0%) | 0 (0.0%) |
| Total (Category) | 6 (33.3%) | 12 (66.7%) |
| Total (Overall) | 46 (51.1%) | 44 (48.9%) |
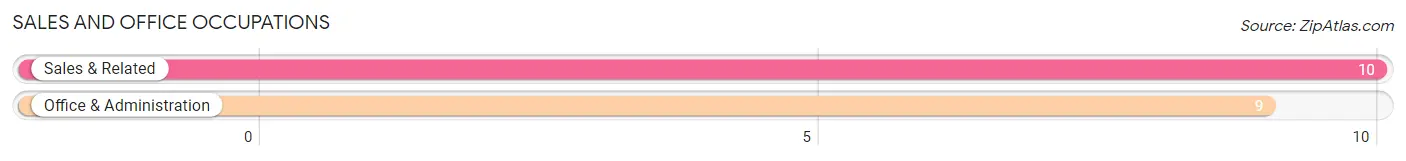
Sales and Office Occupations
The most common Sales and Office occupations in Evergreen are Sales & Related (10 | 11.1%), and Office & Administration (9 | 10.0%).
Sales and Office Occupations by Sex
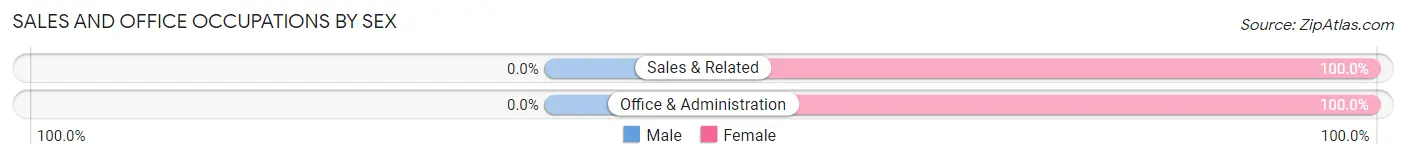
| Occupation | Male | Female |
| Sales & Related | 0 (0.0%) | 10 (100.0%) |
| Office & Administration | 0 (0.0%) | 9 (100.0%) |
| Total (Category) | 0 (0.0%) | 19 (100.0%) |
| Total (Overall) | 46 (51.1%) | 44 (48.9%) |
Natural Resources, Construction and Maintenance Occupations
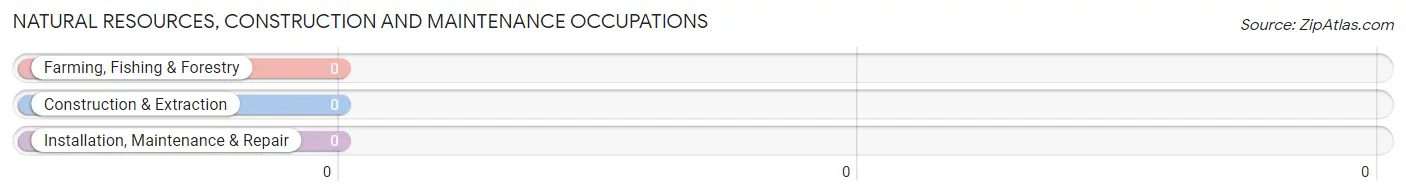
Natural Resources, Construction and Maintenance Occupations by Sex
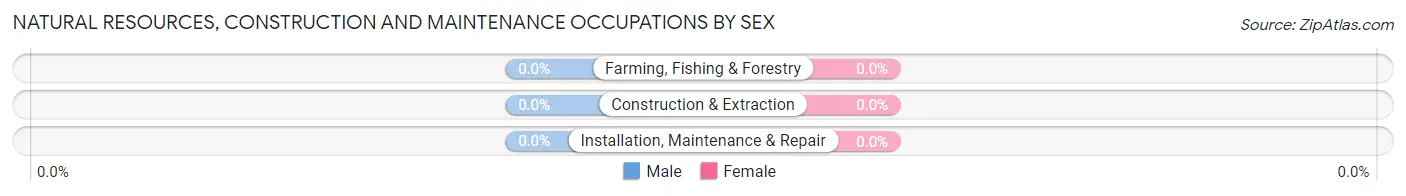
| Occupation | Male | Female |
| Farming, Fishing & Forestry | 0 (0.0%) | 0 (0.0%) |
| Construction & Extraction | 0 (0.0%) | 0 (0.0%) |
| Installation, Maintenance & Repair | 0 (0.0%) | 0 (0.0%) |
| Total (Category) | 0 (0.0%) | 0 (0.0%) |
| Total (Overall) | 46 (51.1%) | 44 (48.9%) |
Production, Transportation and Moving Occupations
The most common Production, Transportation and Moving occupations in Evergreen are Production (14 | 15.6%), Material Moving (12 | 13.3%), and Transportation (2 | 2.2%).
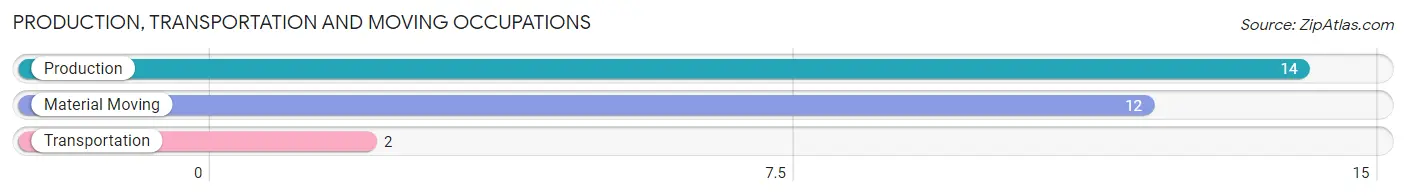
Production, Transportation and Moving Occupations by Sex
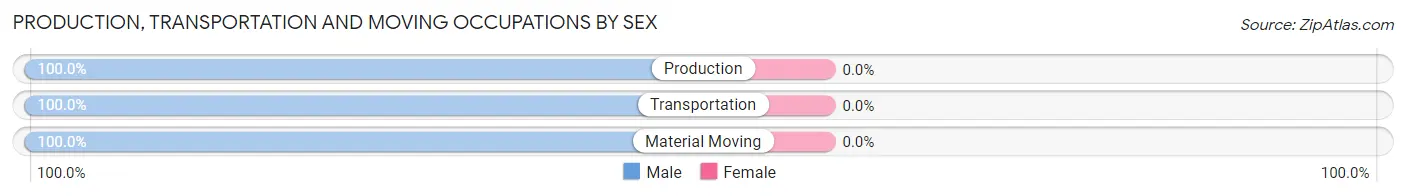
| Occupation | Male | Female |
| Production | 14 (100.0%) | 0 (0.0%) |
| Transportation | 2 (100.0%) | 0 (0.0%) |
| Material Moving | 12 (100.0%) | 0 (0.0%) |
| Total (Category) | 28 (100.0%) | 0 (0.0%) |
| Total (Overall) | 46 (51.1%) | 44 (48.9%) |
Employment Industries by Sex in Evergreen
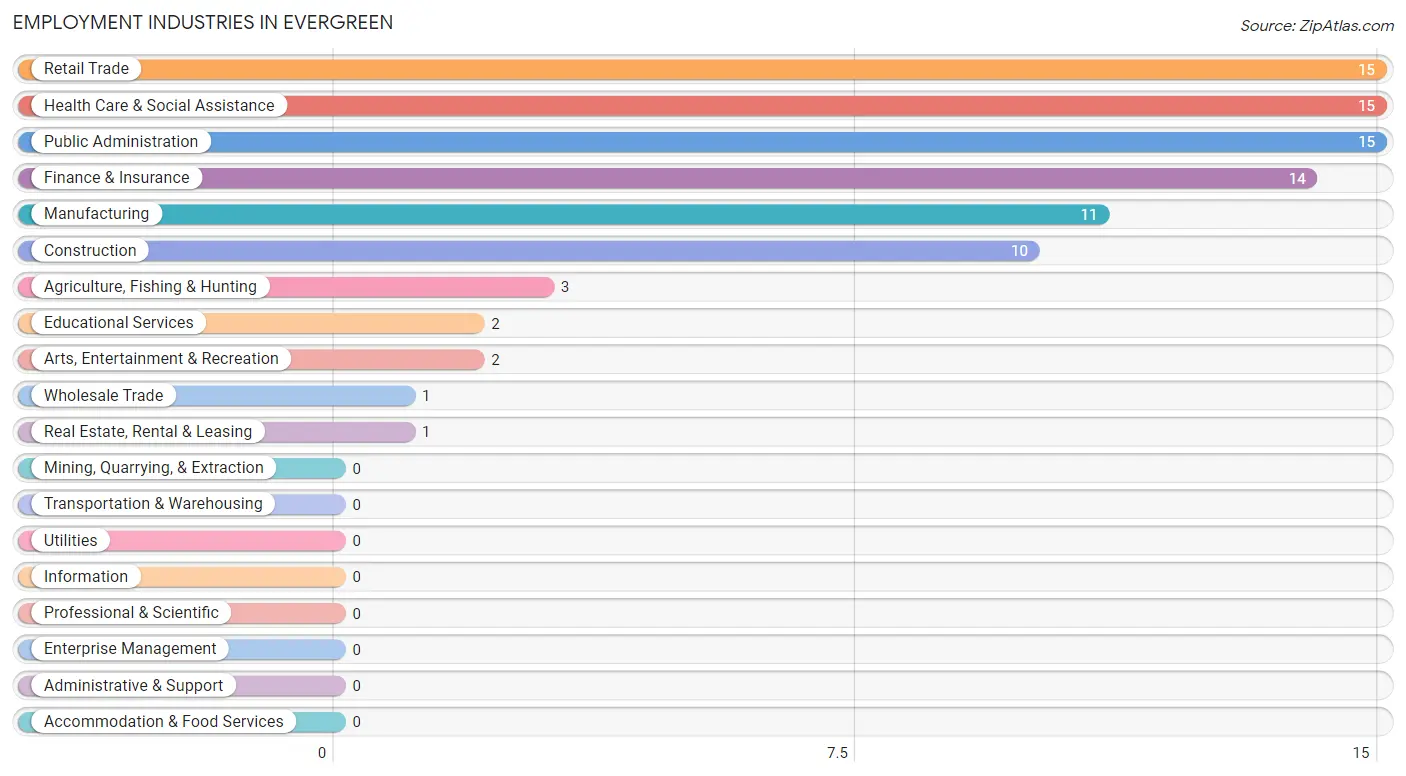
Employment Industries in Evergreen
The major employment industries in Evergreen include Retail Trade (15 | 16.7%), Health Care & Social Assistance (15 | 16.7%), Public Administration (15 | 16.7%), Finance & Insurance (14 | 15.6%), and Manufacturing (11 | 12.2%).
Employment Industries by Sex in Evergreen
The Evergreen industries that see more men than women are Construction (100.0%), Manufacturing (100.0%), and Wholesale Trade (100.0%), whereas the industries that tend to have a higher number of women are Agriculture, Fishing & Hunting (100.0%), Finance & Insurance (100.0%), and Health Care & Social Assistance (93.3%).
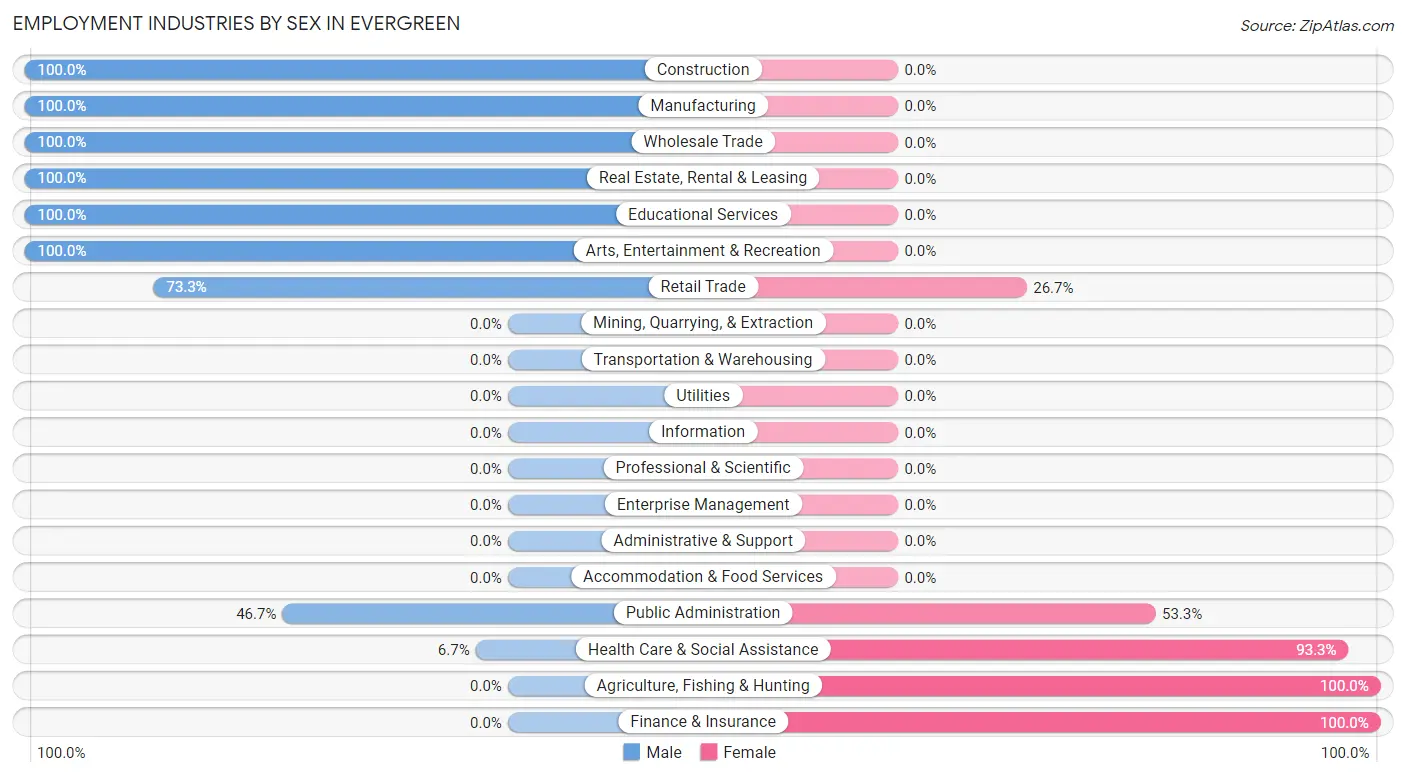
| Industry | Male | Female |
| Agriculture, Fishing & Hunting | 0 (0.0%) | 3 (100.0%) |
| Mining, Quarrying, & Extraction | 0 (0.0%) | 0 (0.0%) |
| Construction | 10 (100.0%) | 0 (0.0%) |
| Manufacturing | 11 (100.0%) | 0 (0.0%) |
| Wholesale Trade | 1 (100.0%) | 0 (0.0%) |
| Retail Trade | 11 (73.3%) | 4 (26.7%) |
| Transportation & Warehousing | 0 (0.0%) | 0 (0.0%) |
| Utilities | 0 (0.0%) | 0 (0.0%) |
| Information | 0 (0.0%) | 0 (0.0%) |
| Finance & Insurance | 0 (0.0%) | 14 (100.0%) |
| Real Estate, Rental & Leasing | 1 (100.0%) | 0 (0.0%) |
| Professional & Scientific | 0 (0.0%) | 0 (0.0%) |
| Enterprise Management | 0 (0.0%) | 0 (0.0%) |
| Administrative & Support | 0 (0.0%) | 0 (0.0%) |
| Educational Services | 2 (100.0%) | 0 (0.0%) |
| Health Care & Social Assistance | 1 (6.7%) | 14 (93.3%) |
| Arts, Entertainment & Recreation | 2 (100.0%) | 0 (0.0%) |
| Accommodation & Food Services | 0 (0.0%) | 0 (0.0%) |
| Public Administration | 7 (46.7%) | 8 (53.3%) |
| Total | 46 (51.1%) | 44 (48.9%) |
Education in Evergreen
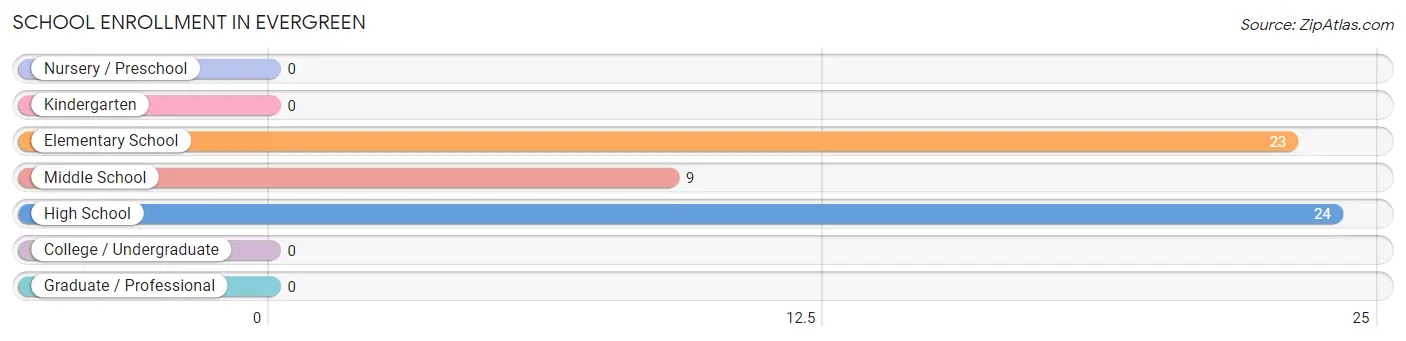
School Enrollment in Evergreen
The most common levels of schooling among the 56 students in Evergreen are high school (24 | 42.9%), elementary school (23 | 41.1%), and middle school (9 | 16.1%).
| School Level | # Students | % Students |
| Nursery / Preschool | 0 | 0.0% |
| Kindergarten | 0 | 0.0% |
| Elementary School | 23 | 41.1% |
| Middle School | 9 | 16.1% |
| High School | 24 | 42.9% |
| College / Undergraduate | 0 | 0.0% |
| Graduate / Professional | 0 | 0.0% |
| Total | 56 | 100.0% |
School Enrollment by Age by Funding Source in Evergreen
Out of a total of 56 students who are enrolled in schools in Evergreen, 2 (3.6%) attend a private institution, while the remaining 54 (96.4%) are enrolled in public schools. The age group of 15 to 17 year olds has the highest likelihood of being enrolled in private schools, with 2 (100.0% in the age bracket) enrolled. Conversely, the age group of 5 to 9 year old has the lowest likelihood of being enrolled in a private school, with 23 (100.0% in the age bracket) attending a public institution.
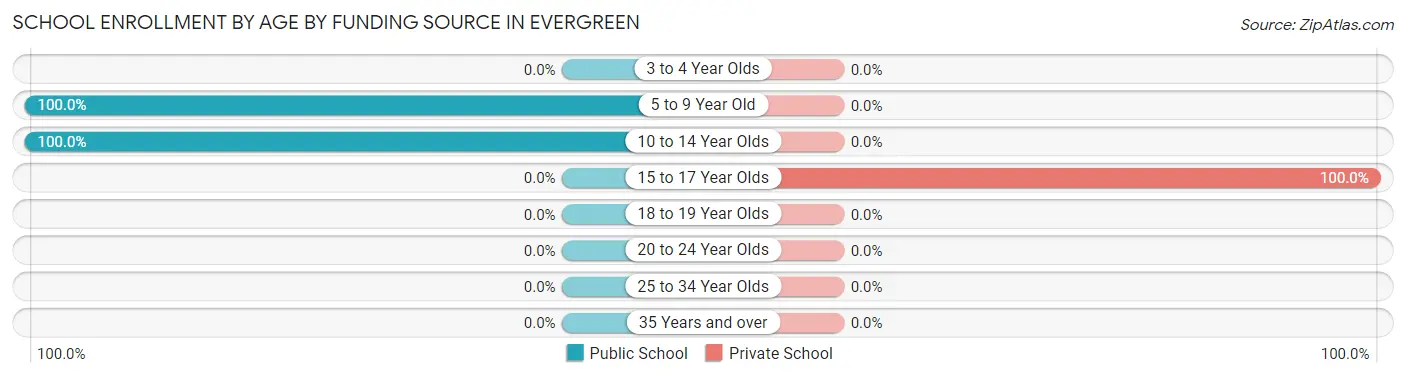
| Age Bracket | Public School | Private School |
| 3 to 4 Year Olds | 0 (0.0%) | 0 (0.0%) |
| 5 to 9 Year Old | 23 (100.0%) | 0 (0.0%) |
| 10 to 14 Year Olds | 31 (100.0%) | 0 (0.0%) |
| 15 to 17 Year Olds | 0 (0.0%) | 2 (100.0%) |
| 18 to 19 Year Olds | 0 (0.0%) | 0 (0.0%) |
| 20 to 24 Year Olds | 0 (0.0%) | 0 (0.0%) |
| 25 to 34 Year Olds | 0 (0.0%) | 0 (0.0%) |
| 35 Years and over | 0 (0.0%) | 0 (0.0%) |
| Total | 54 (96.4%) | 2 (3.6%) |
Educational Attainment by Field of Study in Evergreen
Science & technology (12 | 70.6%), education (3 | 17.6%), and bio, nature & agricultural (2 | 11.8%) are the most common fields of study among 17 individuals in Evergreen who have obtained a bachelor's degree or higher.
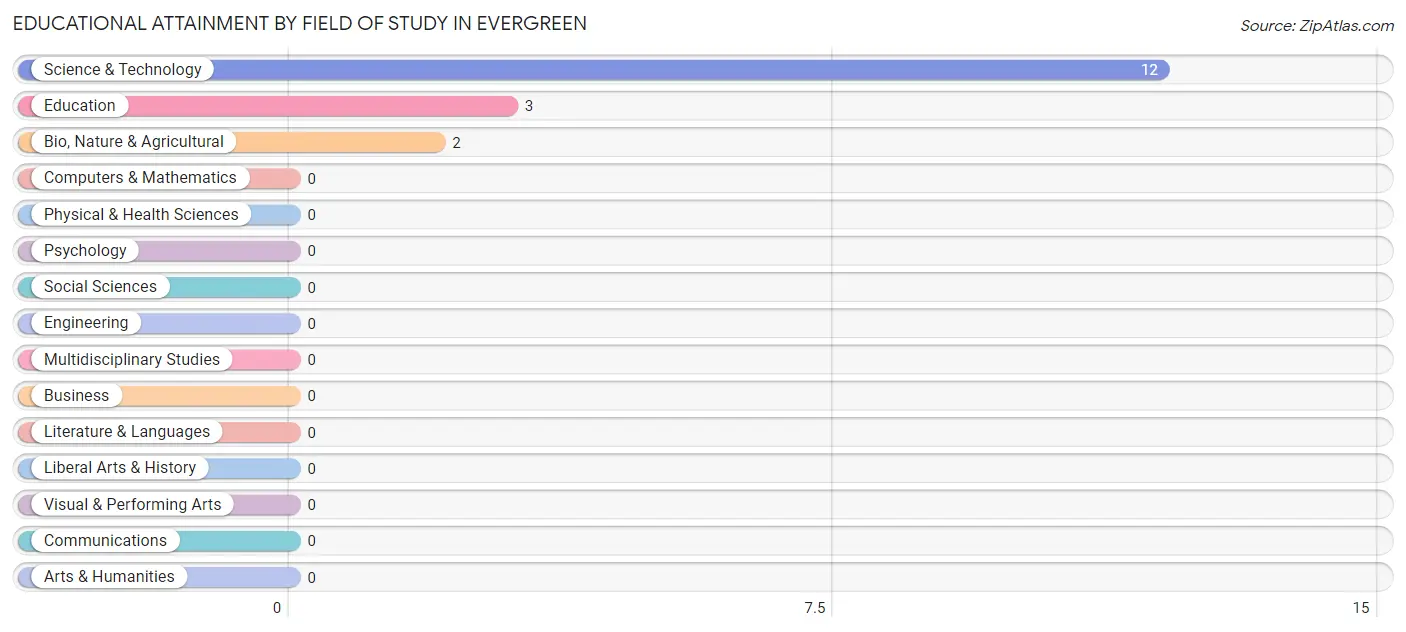
| Field of Study | # Graduates | % Graduates |
| Computers & Mathematics | 0 | 0.0% |
| Bio, Nature & Agricultural | 2 | 11.8% |
| Physical & Health Sciences | 0 | 0.0% |
| Psychology | 0 | 0.0% |
| Social Sciences | 0 | 0.0% |
| Engineering | 0 | 0.0% |
| Multidisciplinary Studies | 0 | 0.0% |
| Science & Technology | 12 | 70.6% |
| Business | 0 | 0.0% |
| Education | 3 | 17.6% |
| Literature & Languages | 0 | 0.0% |
| Liberal Arts & History | 0 | 0.0% |
| Visual & Performing Arts | 0 | 0.0% |
| Communications | 0 | 0.0% |
| Arts & Humanities | 0 | 0.0% |
| Total | 17 | 100.0% |
Transportation & Commute in Evergreen
Vehicle Availability by Sex in Evergreen
The most prevalent vehicle ownership categories in Evergreen are males with 2 vehicles (30, accounting for 65.2%) and females with 2 vehicles (33, making up 68.2%).
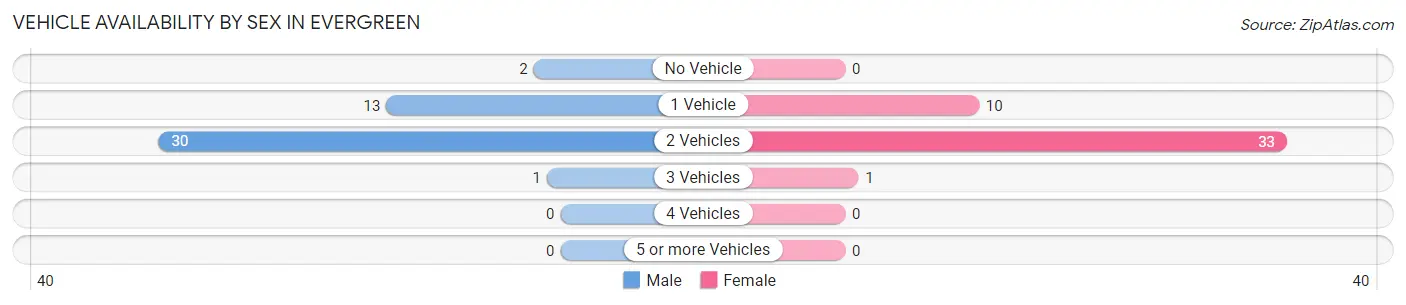
| Vehicles Available | Male | Female |
| No Vehicle | 2 (4.3%) | 0 (0.0%) |
| 1 Vehicle | 13 (28.3%) | 10 (22.7%) |
| 2 Vehicles | 30 (65.2%) | 33 (75.0%) |
| 3 Vehicles | 1 (2.2%) | 1 (2.3%) |
| 4 Vehicles | 0 (0.0%) | 0 (0.0%) |
| 5 or more Vehicles | 0 (0.0%) | 0 (0.0%) |
| Total | 46 (100.0%) | 44 (100.0%) |
Commute Time in Evergreen
The most frequently occuring commute durations in Evergreen are 30 to 34 minutes (20 commuters, 24.1%), 45 to 59 minutes (16 commuters, 19.3%), and 20 to 24 minutes (10 commuters, 12.0%).
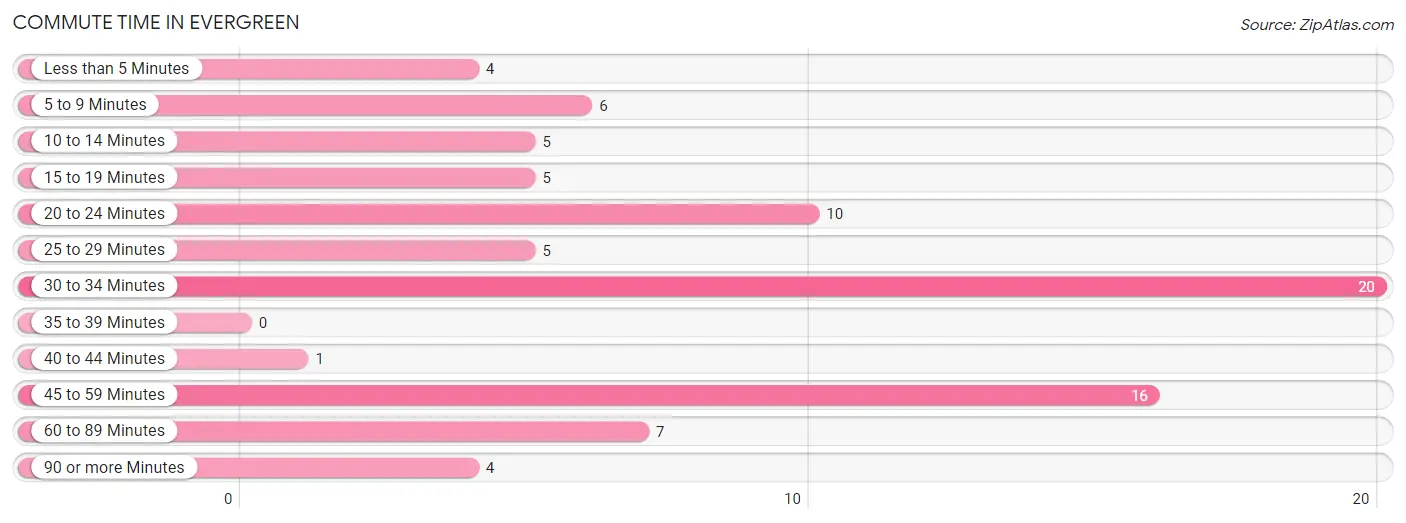
| Commute Time | # Commuters | % Commuters |
| Less than 5 Minutes | 4 | 4.8% |
| 5 to 9 Minutes | 6 | 7.2% |
| 10 to 14 Minutes | 5 | 6.0% |
| 15 to 19 Minutes | 5 | 6.0% |
| 20 to 24 Minutes | 10 | 12.0% |
| 25 to 29 Minutes | 5 | 6.0% |
| 30 to 34 Minutes | 20 | 24.1% |
| 35 to 39 Minutes | 0 | 0.0% |
| 40 to 44 Minutes | 1 | 1.2% |
| 45 to 59 Minutes | 16 | 19.3% |
| 60 to 89 Minutes | 7 | 8.4% |
| 90 or more Minutes | 4 | 4.8% |
Commute Time by Sex in Evergreen
The most common commute times in Evergreen are 30 to 34 minutes (13 commuters, 28.3%) for males and 45 to 59 minutes (15 commuters, 40.5%) for females.
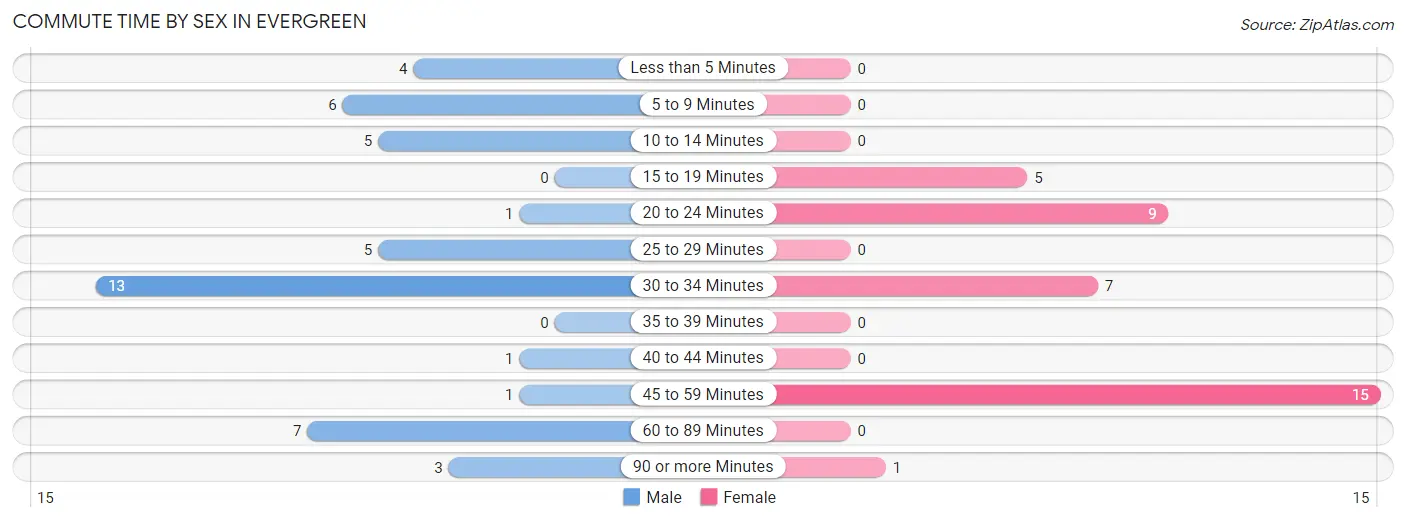
| Commute Time | Male | Female |
| Less than 5 Minutes | 4 (8.7%) | 0 (0.0%) |
| 5 to 9 Minutes | 6 (13.0%) | 0 (0.0%) |
| 10 to 14 Minutes | 5 (10.9%) | 0 (0.0%) |
| 15 to 19 Minutes | 0 (0.0%) | 5 (13.5%) |
| 20 to 24 Minutes | 1 (2.2%) | 9 (24.3%) |
| 25 to 29 Minutes | 5 (10.9%) | 0 (0.0%) |
| 30 to 34 Minutes | 13 (28.3%) | 7 (18.9%) |
| 35 to 39 Minutes | 0 (0.0%) | 0 (0.0%) |
| 40 to 44 Minutes | 1 (2.2%) | 0 (0.0%) |
| 45 to 59 Minutes | 1 (2.2%) | 15 (40.5%) |
| 60 to 89 Minutes | 7 (15.2%) | 0 (0.0%) |
| 90 or more Minutes | 3 (6.5%) | 1 (2.7%) |
Time of Departure to Work by Sex in Evergreen
The most frequent times of departure to work in Evergreen are 5:30 AM to 5:59 AM (13, 28.3%) for males and 5:30 AM to 5:59 AM (9, 24.3%) for females.
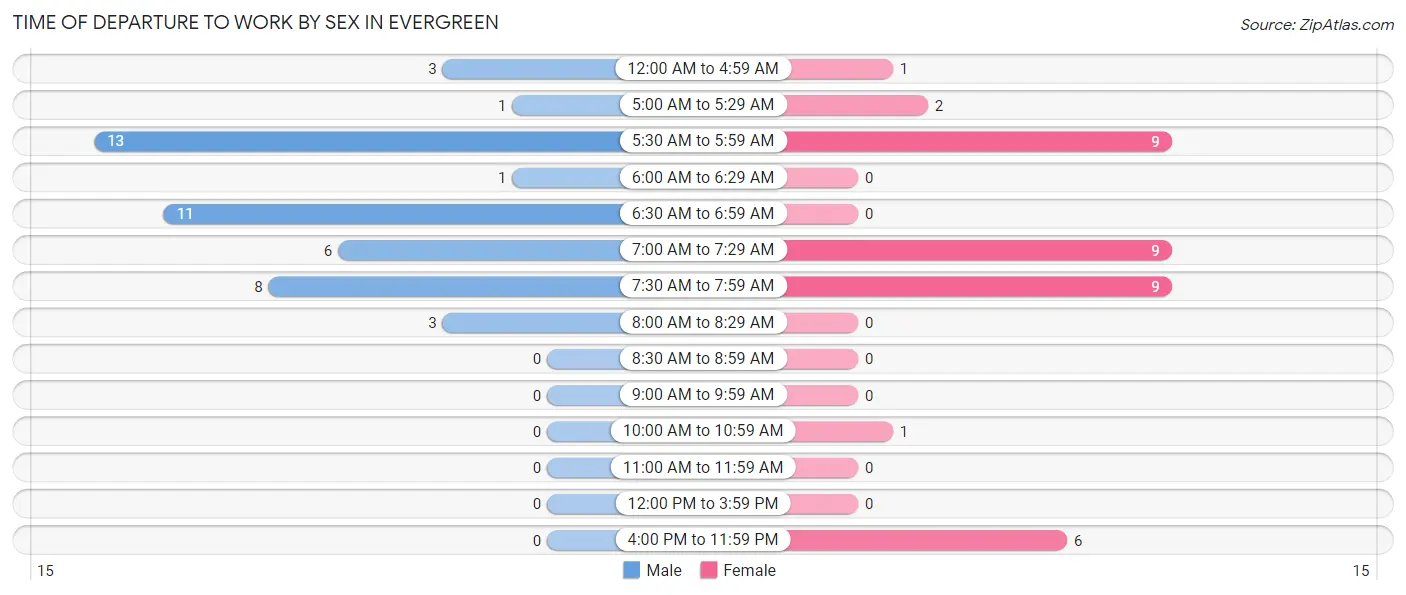
| Time of Departure | Male | Female |
| 12:00 AM to 4:59 AM | 3 (6.5%) | 1 (2.7%) |
| 5:00 AM to 5:29 AM | 1 (2.2%) | 2 (5.4%) |
| 5:30 AM to 5:59 AM | 13 (28.3%) | 9 (24.3%) |
| 6:00 AM to 6:29 AM | 1 (2.2%) | 0 (0.0%) |
| 6:30 AM to 6:59 AM | 11 (23.9%) | 0 (0.0%) |
| 7:00 AM to 7:29 AM | 6 (13.0%) | 9 (24.3%) |
| 7:30 AM to 7:59 AM | 8 (17.4%) | 9 (24.3%) |
| 8:00 AM to 8:29 AM | 3 (6.5%) | 0 (0.0%) |
| 8:30 AM to 8:59 AM | 0 (0.0%) | 0 (0.0%) |
| 9:00 AM to 9:59 AM | 0 (0.0%) | 0 (0.0%) |
| 10:00 AM to 10:59 AM | 0 (0.0%) | 1 (2.7%) |
| 11:00 AM to 11:59 AM | 0 (0.0%) | 0 (0.0%) |
| 12:00 PM to 3:59 PM | 0 (0.0%) | 0 (0.0%) |
| 4:00 PM to 11:59 PM | 0 (0.0%) | 6 (16.2%) |
| Total | 46 (100.0%) | 37 (100.0%) |
Housing Occupancy in Evergreen
Occupancy by Ownership in Evergreen
Of the total 114 dwellings in Evergreen, owner-occupied units account for 72 (63.2%), while renter-occupied units make up 42 (36.8%).
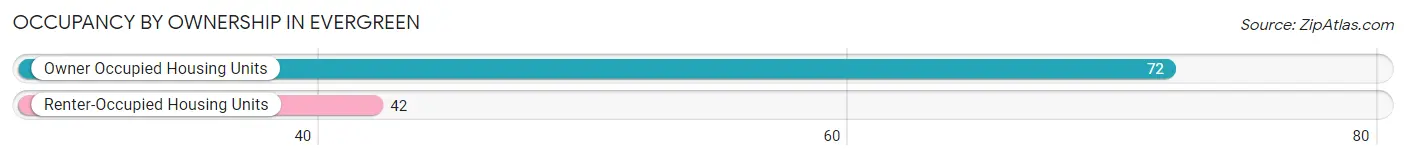
| Occupancy | # Housing Units | % Housing Units |
| Owner Occupied Housing Units | 72 | 63.2% |
| Renter-Occupied Housing Units | 42 | 36.8% |
| Total Occupied Housing Units | 114 | 100.0% |
Occupancy by Household Size in Evergreen
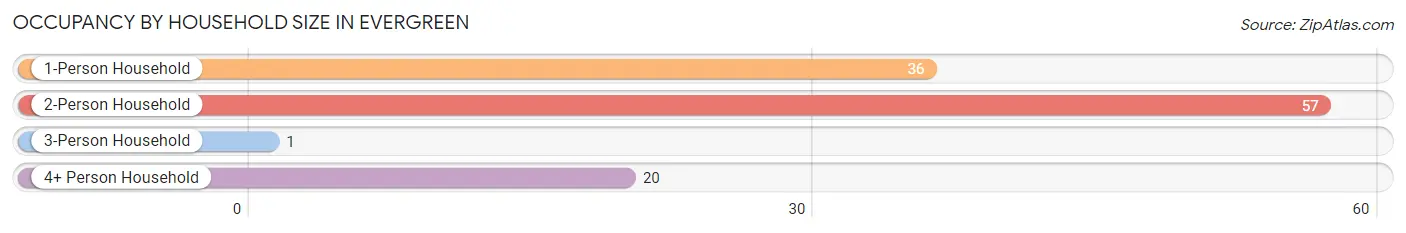
| Household Size | # Housing Units | % Housing Units |
| 1-Person Household | 36 | 31.6% |
| 2-Person Household | 57 | 50.0% |
| 3-Person Household | 1 | 0.9% |
| 4+ Person Household | 20 | 17.5% |
| Total Housing Units | 114 | 100.0% |
Occupancy by Ownership by Household Size in Evergreen
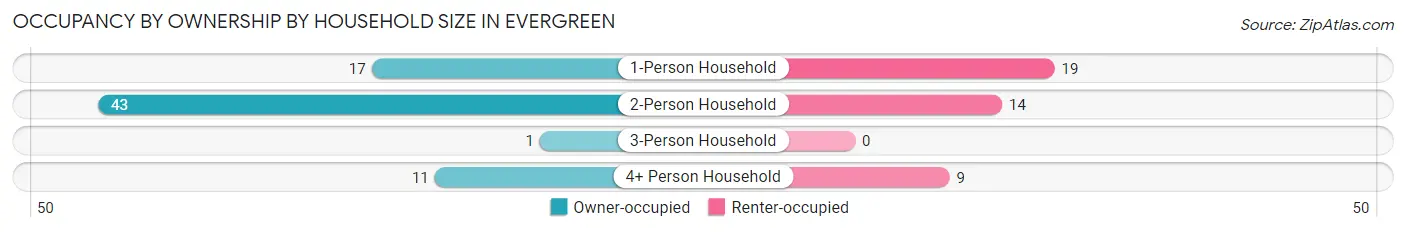
| Household Size | Owner-occupied | Renter-occupied |
| 1-Person Household | 17 (47.2%) | 19 (52.8%) |
| 2-Person Household | 43 (75.4%) | 14 (24.6%) |
| 3-Person Household | 1 (100.0%) | 0 (0.0%) |
| 4+ Person Household | 11 (55.0%) | 9 (45.0%) |
| Total Housing Units | 72 (63.2%) | 42 (36.8%) |
Occupancy by Educational Attainment in Evergreen
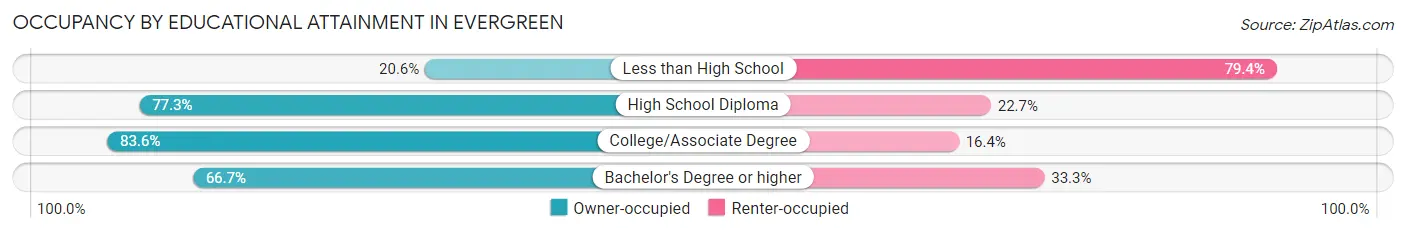
| Household Size | Owner-occupied | Renter-occupied |
| Less than High School | 7 (20.6%) | 27 (79.4%) |
| High School Diploma | 17 (77.3%) | 5 (22.7%) |
| College/Associate Degree | 46 (83.6%) | 9 (16.4%) |
| Bachelor's Degree or higher | 2 (66.7%) | 1 (33.3%) |
Occupancy by Age of Householder in Evergreen
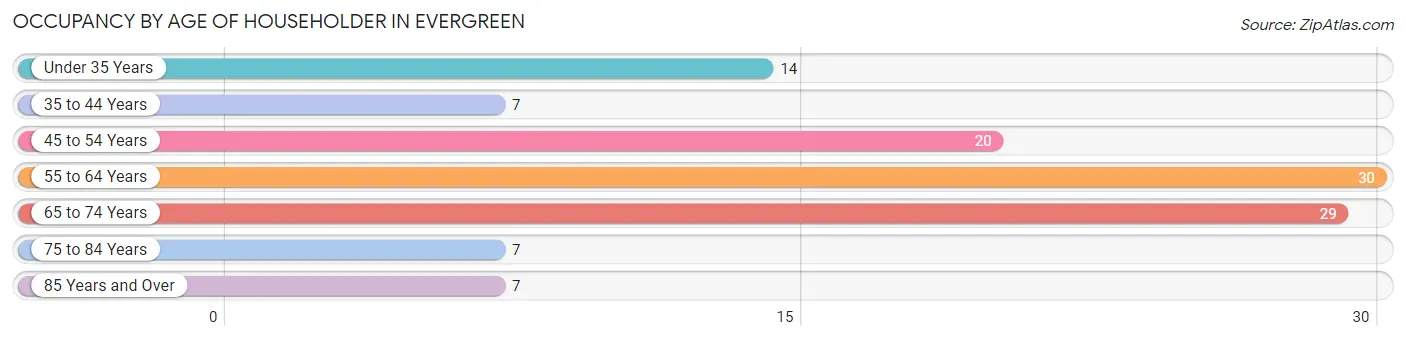
| Age Bracket | # Households | % Households |
| Under 35 Years | 14 | 12.3% |
| 35 to 44 Years | 7 | 6.1% |
| 45 to 54 Years | 20 | 17.5% |
| 55 to 64 Years | 30 | 26.3% |
| 65 to 74 Years | 29 | 25.4% |
| 75 to 84 Years | 7 | 6.1% |
| 85 Years and Over | 7 | 6.1% |
| Total | 114 | 100.0% |
Housing Finances in Evergreen
Median Income by Occupancy in Evergreen
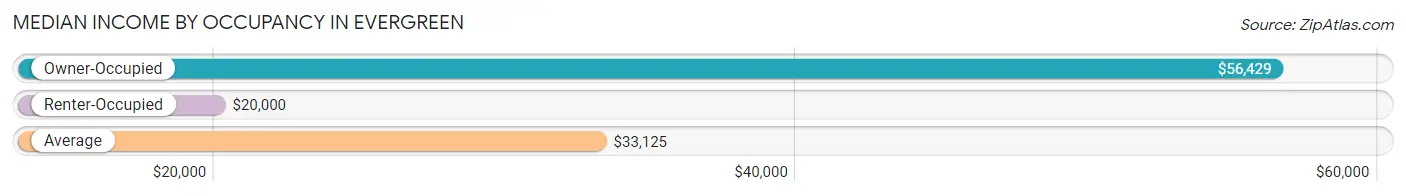
| Occupancy Type | # Households | Median Income |
| Owner-Occupied | 72 (63.2%) | $56,429 |
| Renter-Occupied | 42 (36.8%) | $20,000 |
| Average | 114 (100.0%) | $33,125 |
Occupancy by Householder Income Bracket in Evergreen
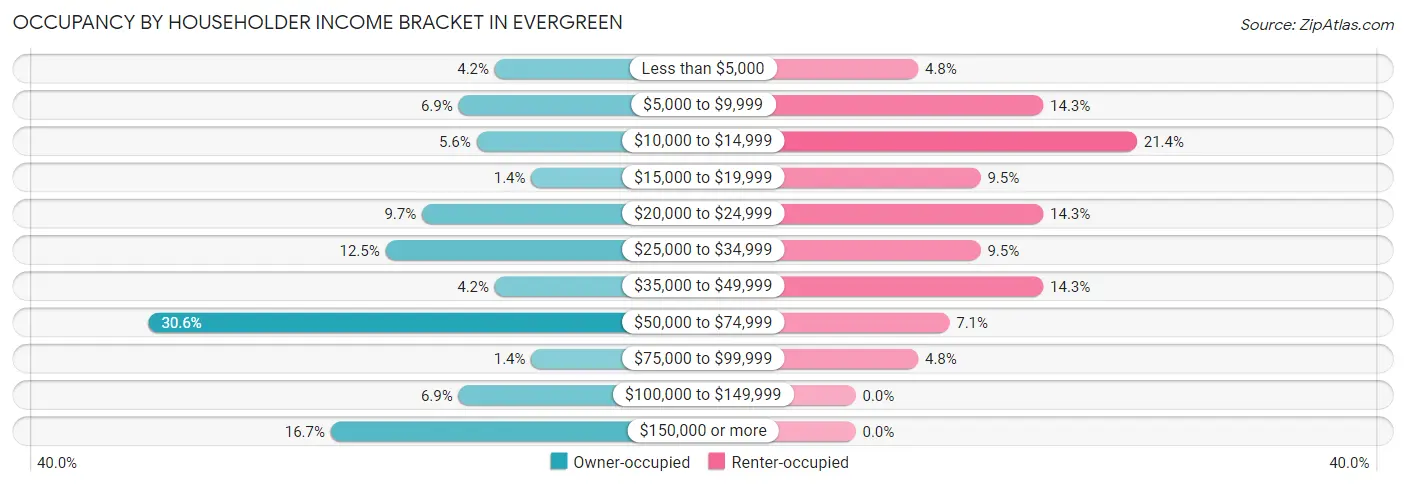
| Income Bracket | Owner-occupied | Renter-occupied |
| Less than $5,000 | 3 (4.2%) | 2 (4.8%) |
| $5,000 to $9,999 | 5 (6.9%) | 6 (14.3%) |
| $10,000 to $14,999 | 4 (5.6%) | 9 (21.4%) |
| $15,000 to $19,999 | 1 (1.4%) | 4 (9.5%) |
| $20,000 to $24,999 | 7 (9.7%) | 6 (14.3%) |
| $25,000 to $34,999 | 9 (12.5%) | 4 (9.5%) |
| $35,000 to $49,999 | 3 (4.2%) | 6 (14.3%) |
| $50,000 to $74,999 | 22 (30.6%) | 3 (7.1%) |
| $75,000 to $99,999 | 1 (1.4%) | 2 (4.8%) |
| $100,000 to $149,999 | 5 (6.9%) | 0 (0.0%) |
| $150,000 or more | 12 (16.7%) | 0 (0.0%) |
| Total | 72 (100.0%) | 42 (100.0%) |
Monthly Housing Cost Tiers in Evergreen
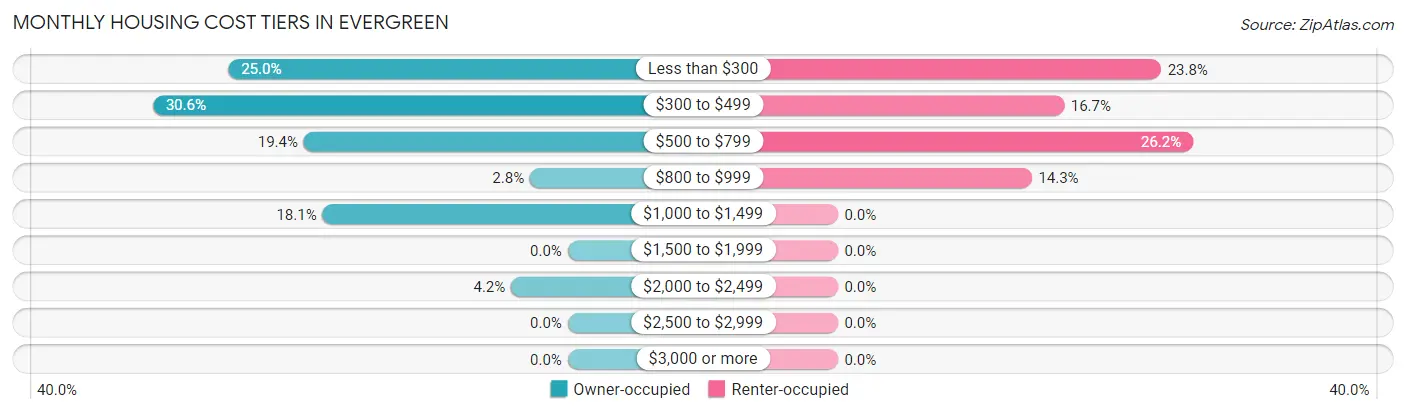
| Monthly Cost | Owner-occupied | Renter-occupied |
| Less than $300 | 18 (25.0%) | 10 (23.8%) |
| $300 to $499 | 22 (30.6%) | 7 (16.7%) |
| $500 to $799 | 14 (19.4%) | 11 (26.2%) |
| $800 to $999 | 2 (2.8%) | 6 (14.3%) |
| $1,000 to $1,499 | 13 (18.1%) | 0 (0.0%) |
| $1,500 to $1,999 | 0 (0.0%) | 0 (0.0%) |
| $2,000 to $2,499 | 3 (4.2%) | 0 (0.0%) |
| $2,500 to $2,999 | 0 (0.0%) | 0 (0.0%) |
| $3,000 or more | 0 (0.0%) | 0 (0.0%) |
| Total | 72 (100.0%) | 42 (100.0%) |
Physical Housing Characteristics in Evergreen
Housing Structures in Evergreen
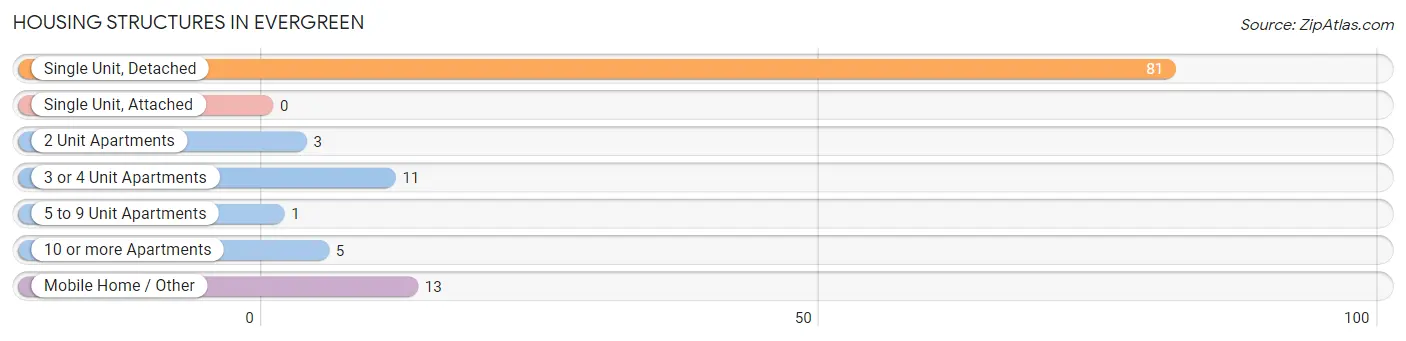
| Structure Type | # Housing Units | % Housing Units |
| Single Unit, Detached | 81 | 71.1% |
| Single Unit, Attached | 0 | 0.0% |
| 2 Unit Apartments | 3 | 2.6% |
| 3 or 4 Unit Apartments | 11 | 9.7% |
| 5 to 9 Unit Apartments | 1 | 0.9% |
| 10 or more Apartments | 5 | 4.4% |
| Mobile Home / Other | 13 | 11.4% |
| Total | 114 | 100.0% |
Housing Structures by Occupancy in Evergreen
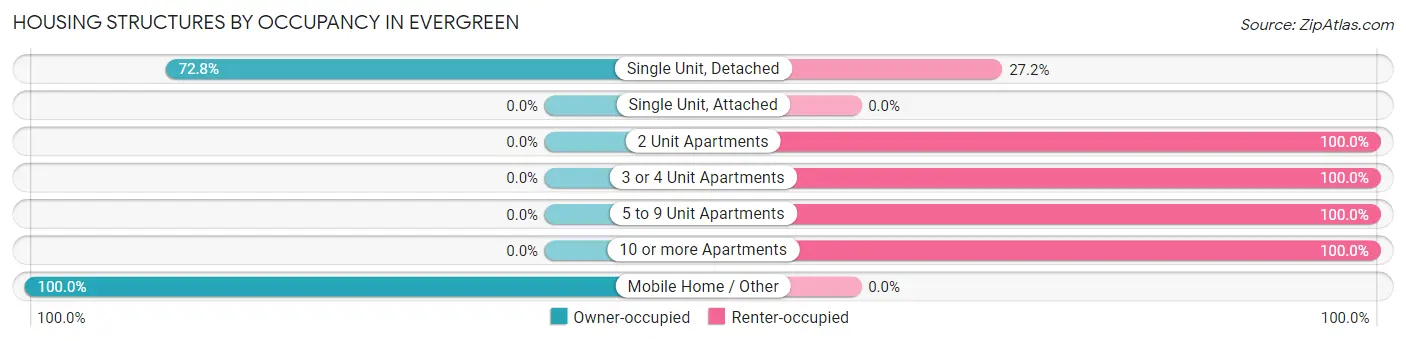
| Structure Type | Owner-occupied | Renter-occupied |
| Single Unit, Detached | 59 (72.8%) | 22 (27.2%) |
| Single Unit, Attached | 0 (0.0%) | 0 (0.0%) |
| 2 Unit Apartments | 0 (0.0%) | 3 (100.0%) |
| 3 or 4 Unit Apartments | 0 (0.0%) | 11 (100.0%) |
| 5 to 9 Unit Apartments | 0 (0.0%) | 1 (100.0%) |
| 10 or more Apartments | 0 (0.0%) | 5 (100.0%) |
| Mobile Home / Other | 13 (100.0%) | 0 (0.0%) |
| Total | 72 (63.2%) | 42 (36.8%) |
Housing Structures by Number of Rooms in Evergreen
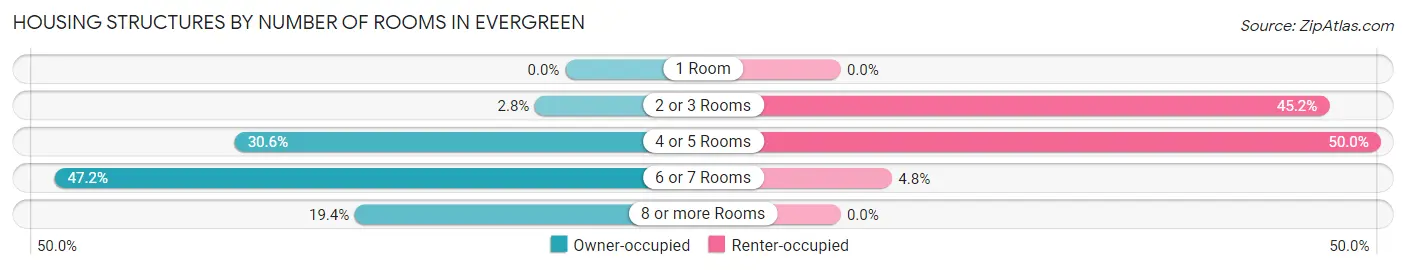
| Number of Rooms | Owner-occupied | Renter-occupied |
| 1 Room | 0 (0.0%) | 0 (0.0%) |
| 2 or 3 Rooms | 2 (2.8%) | 19 (45.2%) |
| 4 or 5 Rooms | 22 (30.6%) | 21 (50.0%) |
| 6 or 7 Rooms | 34 (47.2%) | 2 (4.8%) |
| 8 or more Rooms | 14 (19.4%) | 0 (0.0%) |
| Total | 72 (100.0%) | 42 (100.0%) |
Housing Structure by Heating Type in Evergreen
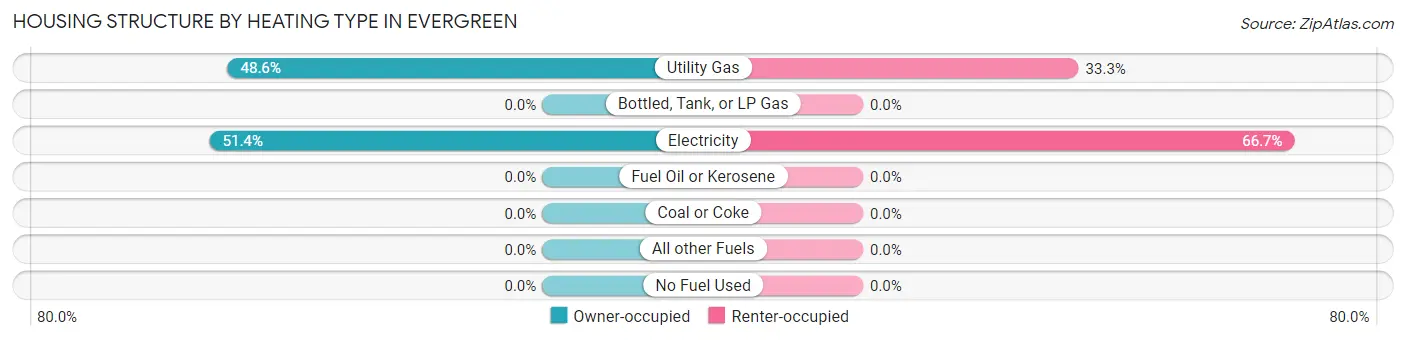
| Heating Type | Owner-occupied | Renter-occupied |
| Utility Gas | 35 (48.6%) | 14 (33.3%) |
| Bottled, Tank, or LP Gas | 0 (0.0%) | 0 (0.0%) |
| Electricity | 37 (51.4%) | 28 (66.7%) |
| Fuel Oil or Kerosene | 0 (0.0%) | 0 (0.0%) |
| Coal or Coke | 0 (0.0%) | 0 (0.0%) |
| All other Fuels | 0 (0.0%) | 0 (0.0%) |
| No Fuel Used | 0 (0.0%) | 0 (0.0%) |
| Total | 72 (100.0%) | 42 (100.0%) |
Household Vehicle Usage in Evergreen
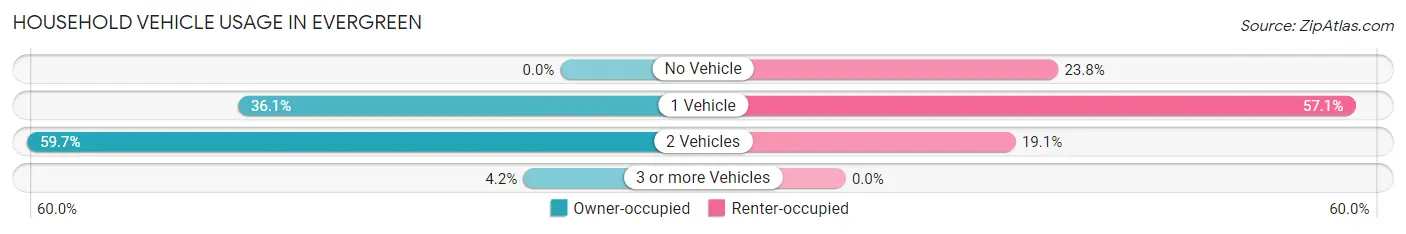
| Vehicles per Household | Owner-occupied | Renter-occupied |
| No Vehicle | 0 (0.0%) | 10 (23.8%) |
| 1 Vehicle | 26 (36.1%) | 24 (57.1%) |
| 2 Vehicles | 43 (59.7%) | 8 (19.1%) |
| 3 or more Vehicles | 3 (4.2%) | 0 (0.0%) |
| Total | 72 (100.0%) | 42 (100.0%) |
Real Estate & Mortgages in Evergreen
Real Estate and Mortgage Overview in Evergreen
| Characteristic | Without Mortgage | With Mortgage |
| Housing Units | 56 | 16 |
| Median Property Value | $111,100 | $82,000 |
| Median Household Income | $55,714 | $5 |
| Monthly Housing Costs | $367 | $0 |
| Real Estate Taxes | $199 | $0 |
Property Value by Mortgage Status in Evergreen
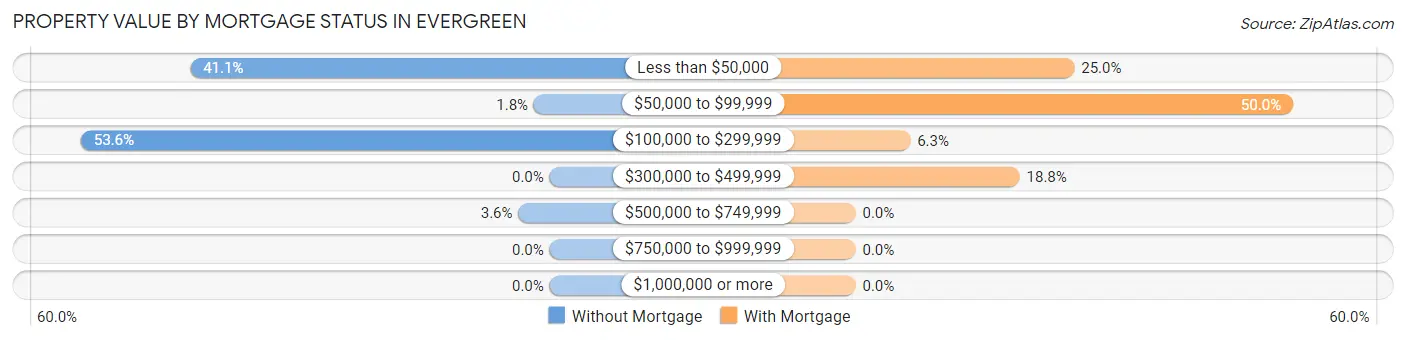
| Property Value | Without Mortgage | With Mortgage |
| Less than $50,000 | 23 (41.1%) | 4 (25.0%) |
| $50,000 to $99,999 | 1 (1.8%) | 8 (50.0%) |
| $100,000 to $299,999 | 30 (53.6%) | 1 (6.2%) |
| $300,000 to $499,999 | 0 (0.0%) | 3 (18.8%) |
| $500,000 to $749,999 | 2 (3.6%) | 0 (0.0%) |
| $750,000 to $999,999 | 0 (0.0%) | 0 (0.0%) |
| $1,000,000 or more | 0 (0.0%) | 0 (0.0%) |
| Total | 56 (100.0%) | 16 (100.0%) |
Household Income by Mortgage Status in Evergreen
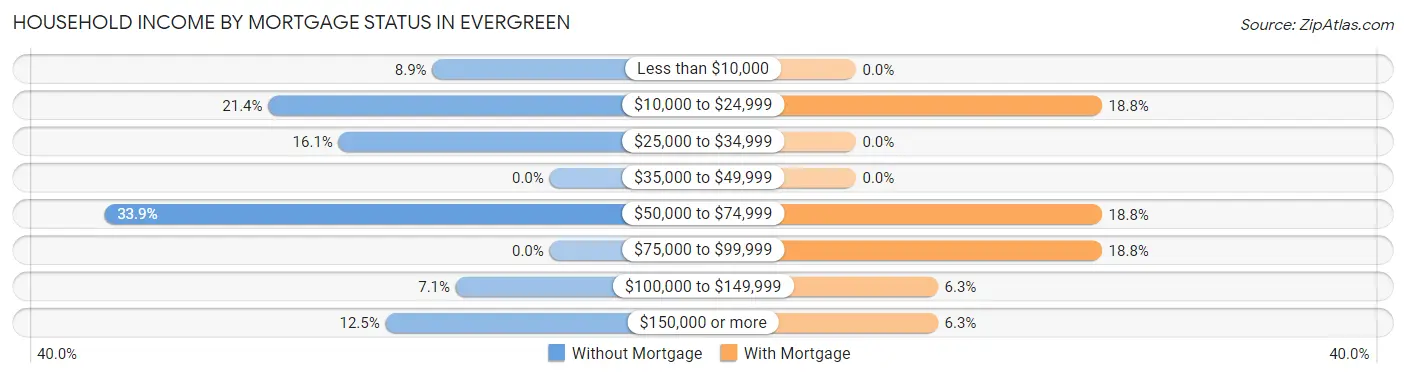
| Household Income | Without Mortgage | With Mortgage |
| Less than $10,000 | 5 (8.9%) | 0 (0.0%) |
| $10,000 to $24,999 | 12 (21.4%) | 3 (18.8%) |
| $25,000 to $34,999 | 9 (16.1%) | 0 (0.0%) |
| $35,000 to $49,999 | 0 (0.0%) | 0 (0.0%) |
| $50,000 to $74,999 | 19 (33.9%) | 3 (18.8%) |
| $75,000 to $99,999 | 0 (0.0%) | 3 (18.8%) |
| $100,000 to $149,999 | 4 (7.1%) | 1 (6.2%) |
| $150,000 or more | 7 (12.5%) | 1 (6.2%) |
| Total | 56 (100.0%) | 16 (100.0%) |
Property Value to Household Income Ratio in Evergreen
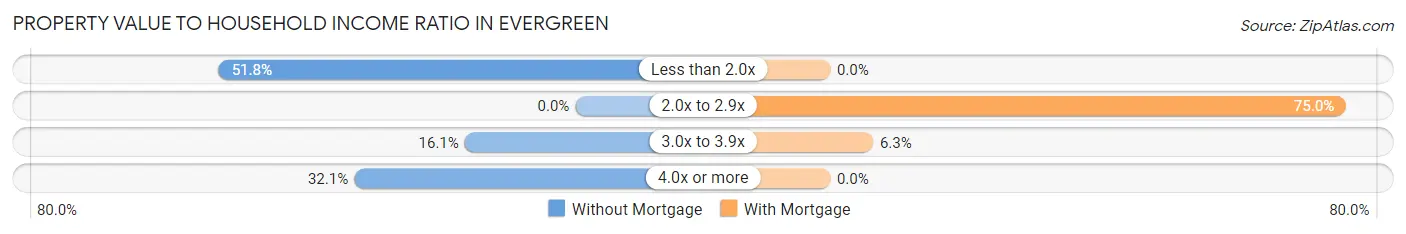
| Value-to-Income Ratio | Without Mortgage | With Mortgage |
| Less than 2.0x | 29 (51.8%) | 0 (0.0%) |
| 2.0x to 2.9x | 0 (0.0%) | 12 (75.0%) |
| 3.0x to 3.9x | 9 (16.1%) | 1 (6.2%) |
| 4.0x or more | 18 (32.1%) | 0 (0.0%) |
| Total | 56 (100.0%) | 16 (100.0%) |
Real Estate Taxes by Mortgage Status in Evergreen
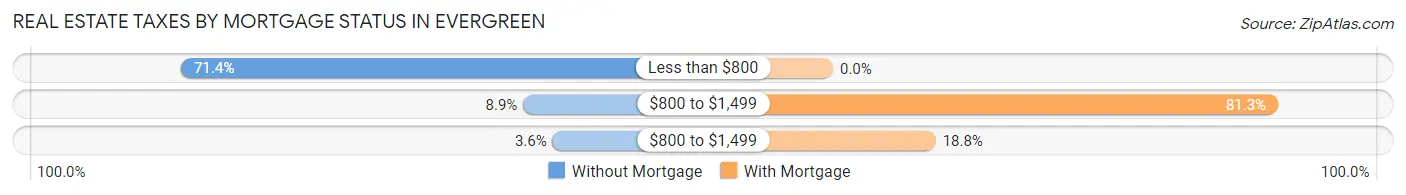
| Property Taxes | Without Mortgage | With Mortgage |
| Less than $800 | 40 (71.4%) | 0 (0.0%) |
| $800 to $1,499 | 5 (8.9%) | 13 (81.2%) |
| $800 to $1,499 | 2 (3.6%) | 3 (18.8%) |
| Total | 56 (100.0%) | 16 (100.0%) |
Health & Disability in Evergreen
Health Insurance Coverage by Age in Evergreen
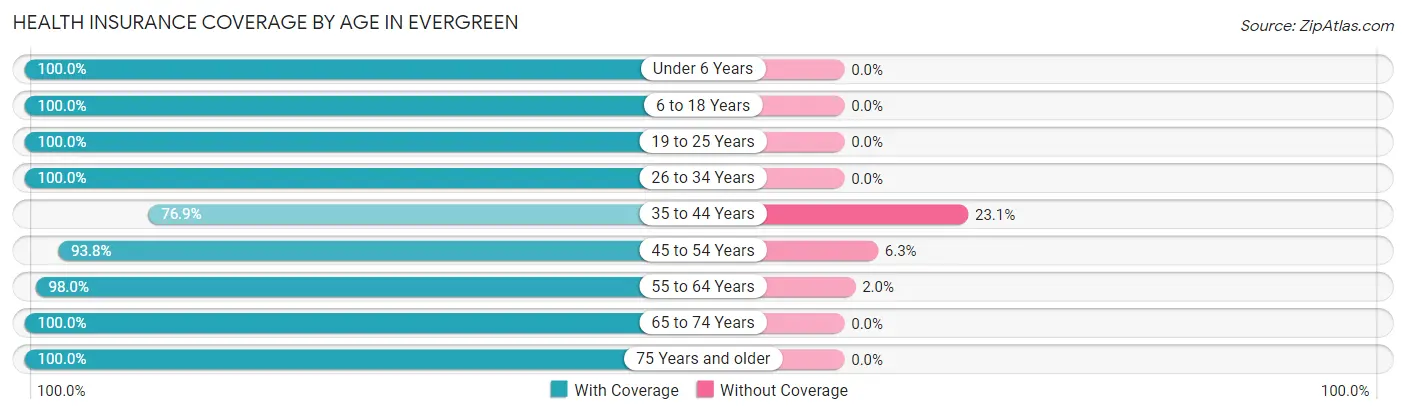
| Age Bracket | With Coverage | Without Coverage |
| Under 6 Years | 6 (100.0%) | 0 (0.0%) |
| 6 to 18 Years | 64 (100.0%) | 0 (0.0%) |
| 19 to 25 Years | 14 (100.0%) | 0 (0.0%) |
| 26 to 34 Years | 29 (100.0%) | 0 (0.0%) |
| 35 to 44 Years | 20 (76.9%) | 6 (23.1%) |
| 45 to 54 Years | 30 (93.8%) | 2 (6.2%) |
| 55 to 64 Years | 48 (98.0%) | 1 (2.0%) |
| 65 to 74 Years | 38 (100.0%) | 0 (0.0%) |
| 75 Years and older | 27 (100.0%) | 0 (0.0%) |
| Total | 276 (96.8%) | 9 (3.2%) |
Health Insurance Coverage by Citizenship Status in Evergreen
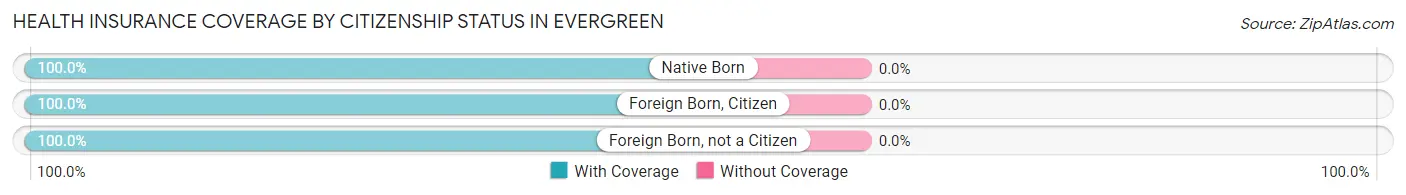
| Citizenship Status | With Coverage | Without Coverage |
| Native Born | 6 (100.0%) | 0 (0.0%) |
| Foreign Born, Citizen | 64 (100.0%) | 0 (0.0%) |
| Foreign Born, not a Citizen | 14 (100.0%) | 0 (0.0%) |
Health Insurance Coverage by Household Income in Evergreen
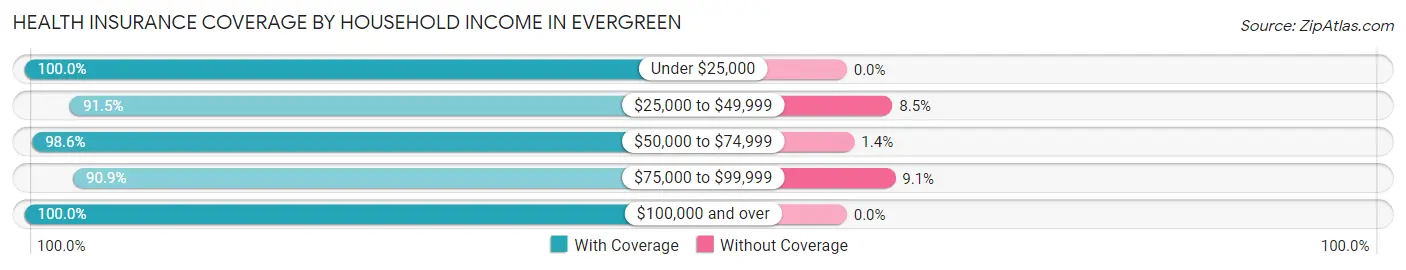
| Household Income | With Coverage | Without Coverage |
| Under $25,000 | 68 (100.0%) | 0 (0.0%) |
| $25,000 to $49,999 | 75 (91.5%) | 7 (8.5%) |
| $50,000 to $74,999 | 69 (98.6%) | 1 (1.4%) |
| $75,000 to $99,999 | 10 (90.9%) | 1 (9.1%) |
| $100,000 and over | 54 (100.0%) | 0 (0.0%) |
Public vs Private Health Insurance Coverage by Age in Evergreen
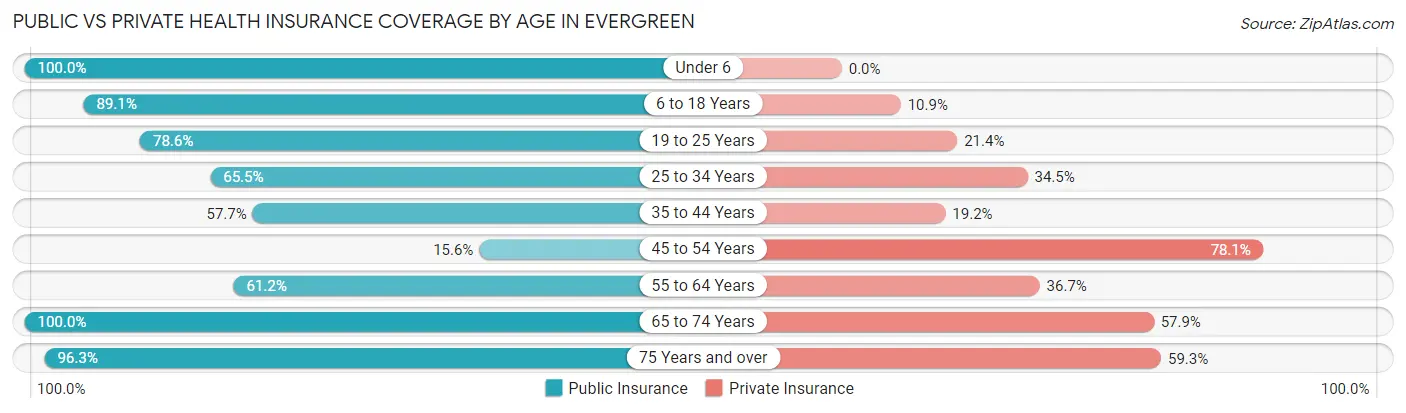
| Age Bracket | Public Insurance | Private Insurance |
| Under 6 | 6 (100.0%) | 0 (0.0%) |
| 6 to 18 Years | 57 (89.1%) | 7 (10.9%) |
| 19 to 25 Years | 11 (78.6%) | 3 (21.4%) |
| 25 to 34 Years | 19 (65.5%) | 10 (34.5%) |
| 35 to 44 Years | 15 (57.7%) | 5 (19.2%) |
| 45 to 54 Years | 5 (15.6%) | 25 (78.1%) |
| 55 to 64 Years | 30 (61.2%) | 18 (36.7%) |
| 65 to 74 Years | 38 (100.0%) | 22 (57.9%) |
| 75 Years and over | 26 (96.3%) | 16 (59.3%) |
| Total | 207 (72.6%) | 106 (37.2%) |
Disability Status by Sex by Age in Evergreen
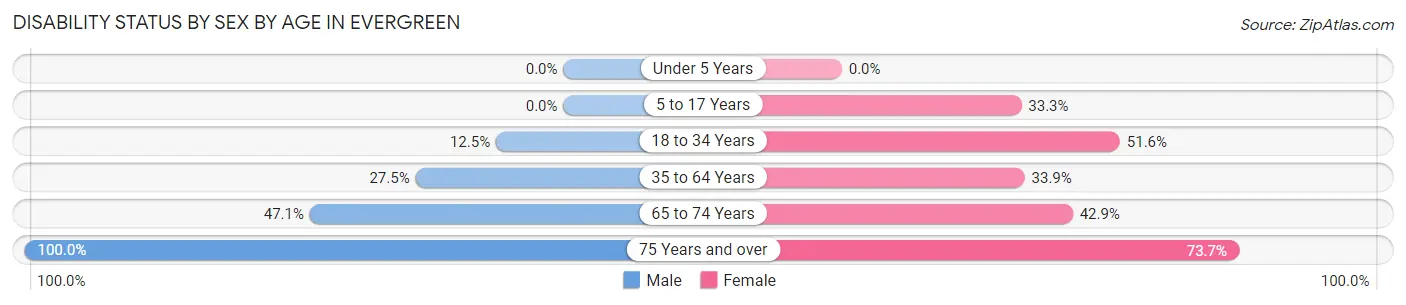
| Age Bracket | Male | Female |
| Under 5 Years | 0 (0.0%) | 0 (0.0%) |
| 5 to 17 Years | 0 (0.0%) | 2 (33.3%) |
| 18 to 34 Years | 2 (12.5%) | 16 (51.6%) |
| 35 to 64 Years | 14 (27.5%) | 19 (33.9%) |
| 65 to 74 Years | 8 (47.1%) | 9 (42.9%) |
| 75 Years and over | 8 (100.0%) | 14 (73.7%) |
Disability Class by Sex by Age in Evergreen
Disability Class: Hearing Difficulty
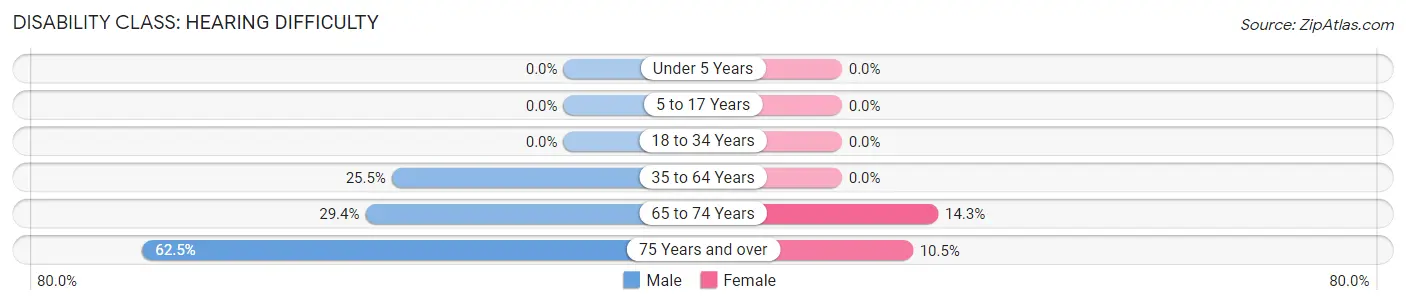
| Age Bracket | Male | Female |
| Under 5 Years | 0 (0.0%) | 0 (0.0%) |
| 5 to 17 Years | 0 (0.0%) | 0 (0.0%) |
| 18 to 34 Years | 0 (0.0%) | 0 (0.0%) |
| 35 to 64 Years | 13 (25.5%) | 0 (0.0%) |
| 65 to 74 Years | 5 (29.4%) | 3 (14.3%) |
| 75 Years and over | 5 (62.5%) | 2 (10.5%) |
Disability Class: Vision Difficulty
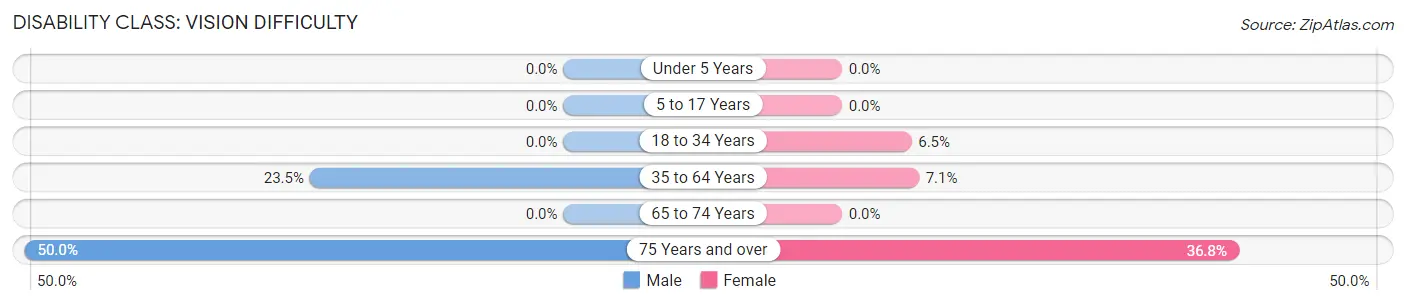
| Age Bracket | Male | Female |
| Under 5 Years | 0 (0.0%) | 0 (0.0%) |
| 5 to 17 Years | 0 (0.0%) | 0 (0.0%) |
| 18 to 34 Years | 0 (0.0%) | 2 (6.5%) |
| 35 to 64 Years | 12 (23.5%) | 4 (7.1%) |
| 65 to 74 Years | 0 (0.0%) | 0 (0.0%) |
| 75 Years and over | 4 (50.0%) | 7 (36.8%) |
Disability Class: Cognitive Difficulty
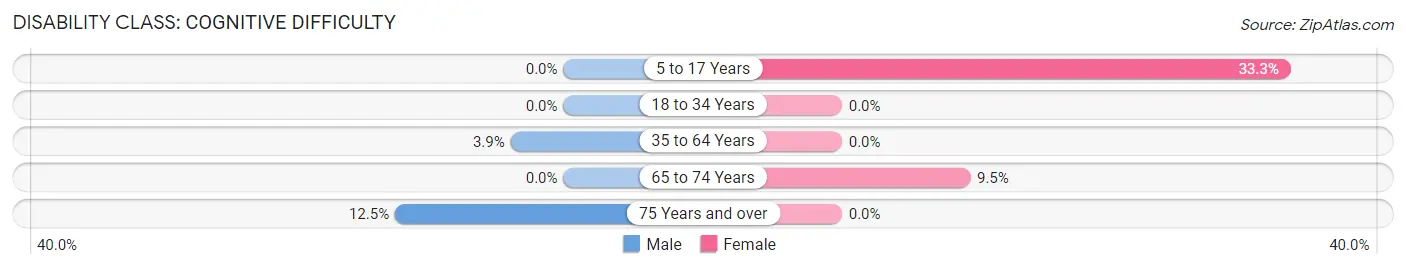
| Age Bracket | Male | Female |
| 5 to 17 Years | 0 (0.0%) | 2 (33.3%) |
| 18 to 34 Years | 0 (0.0%) | 0 (0.0%) |
| 35 to 64 Years | 2 (3.9%) | 0 (0.0%) |
| 65 to 74 Years | 0 (0.0%) | 2 (9.5%) |
| 75 Years and over | 1 (12.5%) | 0 (0.0%) |
Disability Class: Ambulatory Difficulty
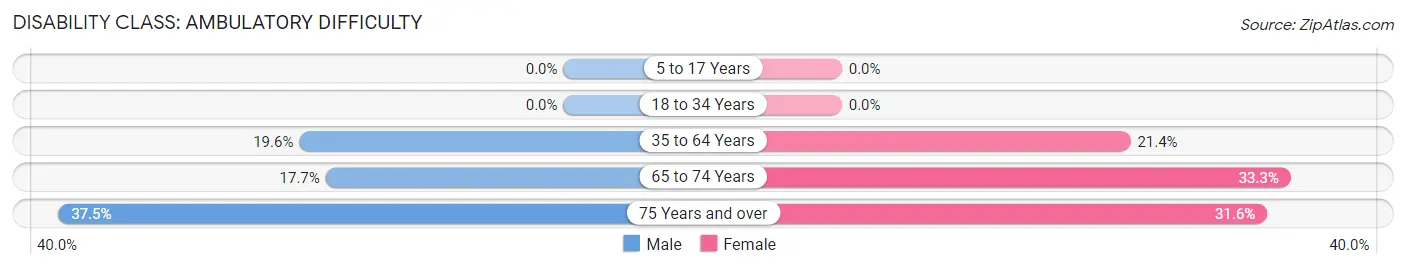
| Age Bracket | Male | Female |
| 5 to 17 Years | 0 (0.0%) | 0 (0.0%) |
| 18 to 34 Years | 0 (0.0%) | 0 (0.0%) |
| 35 to 64 Years | 10 (19.6%) | 12 (21.4%) |
| 65 to 74 Years | 3 (17.6%) | 7 (33.3%) |
| 75 Years and over | 3 (37.5%) | 6 (31.6%) |
Disability Class: Self-Care Difficulty
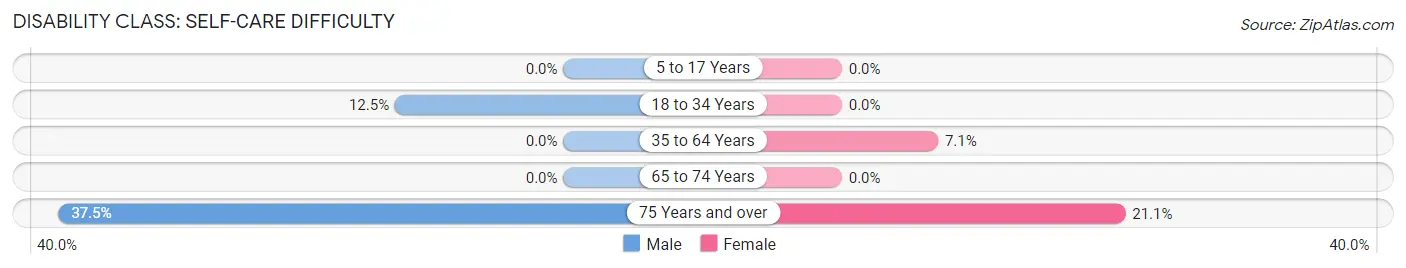
| Age Bracket | Male | Female |
| 5 to 17 Years | 0 (0.0%) | 0 (0.0%) |
| 18 to 34 Years | 2 (12.5%) | 0 (0.0%) |
| 35 to 64 Years | 0 (0.0%) | 4 (7.1%) |
| 65 to 74 Years | 0 (0.0%) | 0 (0.0%) |
| 75 Years and over | 3 (37.5%) | 4 (21.0%) |
Technology Access in Evergreen
Computing Device Access in Evergreen
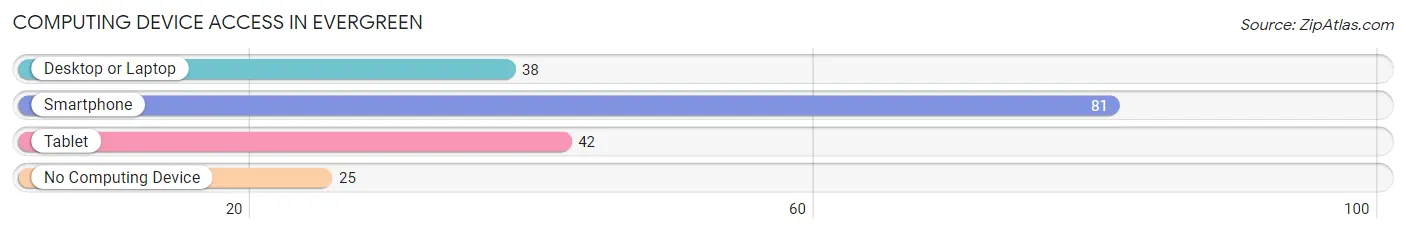
| Device Type | # Households | % Households |
| Desktop or Laptop | 38 | 33.3% |
| Smartphone | 81 | 71.1% |
| Tablet | 42 | 36.8% |
| No Computing Device | 25 | 21.9% |
| Total | 114 | 100.0% |
Internet Access in Evergreen
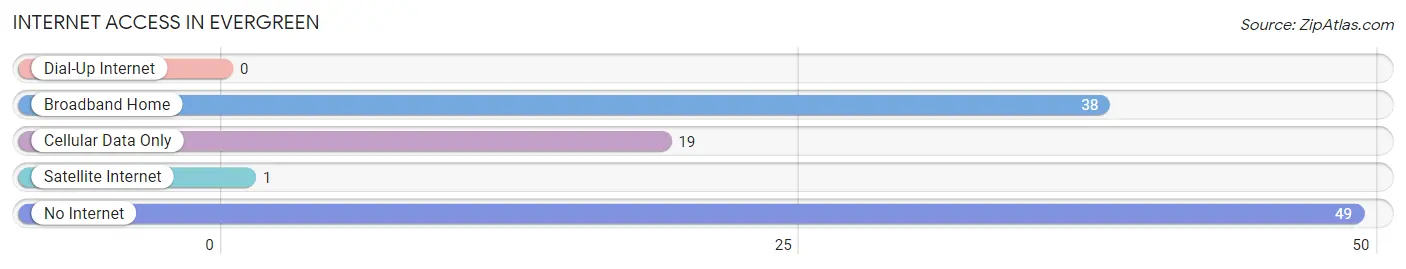
| Internet Type | # Households | % Households |
| Dial-Up Internet | 0 | 0.0% |
| Broadband Home | 38 | 33.3% |
| Cellular Data Only | 19 | 16.7% |
| Satellite Internet | 1 | 0.9% |
| No Internet | 49 | 43.0% |
| Total | 114 | 100.0% |
Evergreen Summary
History
The small town of Evergreen, Louisiana is located in the northern part of the state, in the parish of Rapides. It is situated on the banks of the Red River, and is surrounded by the Kisatchie National Forest. The town was founded in 1845 by a group of settlers from the nearby town of Alexandria. The settlers were looking for a place to settle and start a new life, and they chose the area around Evergreen because of its fertile soil and abundant natural resources.
The town was originally called "Evergreen Grove" and was named after the evergreen trees that grew in the area. The town was incorporated in 1848 and was the first town in Rapides Parish to be incorporated.
The town grew slowly but steadily over the years, and by the turn of the 20th century, it had become a thriving community. The town was home to several businesses, including a sawmill, a cotton gin, and a general store. The town also had a post office, a bank, and a school.
In the early 1900s, the town began to experience a period of growth and prosperity. The population increased from around 500 in 1900 to over 1,000 by the 1920s. The town was home to several churches, a movie theater, and a library.
The Great Depression hit the town hard, and many of the businesses closed. The population declined to around 500 by the 1940s. The town experienced a resurgence in the 1950s and 1960s, as the population increased to over 1,000.
The town experienced a period of decline in the 1970s and 1980s, as the population decreased to around 500. The town has since experienced a period of growth and revitalization, and the population has increased to over 1,000.
Geography
Evergreen is located in the northern part of Rapides Parish, in the state of Louisiana. It is situated on the banks of the Red River, and is surrounded by the Kisatchie National Forest. The town is located about 25 miles north of Alexandria, and about 50 miles south of Shreveport.
The town is situated on a flat plain, with an elevation of around 200 feet. The climate is humid subtropical, with hot summers and mild winters. The average annual temperature is around 70 degrees Fahrenheit.
The town is home to several parks, including Evergreen Park, which is located on the banks of the Red River. The park features a playground, picnic areas, and a walking trail.
Economy
The economy of Evergreen is largely based on agriculture. The town is home to several farms, which produce a variety of crops, including cotton, corn, soybeans, and wheat. The town is also home to several small businesses, including a sawmill, a cotton gin, and a general store.
The town is also home to several manufacturing companies, which produce a variety of products, including furniture, clothing, and electronics. The town is also home to several restaurants, bars, and other businesses.
Demographics
As of the 2010 census, the population of Evergreen was 1,093. The racial makeup of the town was 79.3% White, 17.2% African American, 0.7% Native American, 0.3% Asian, 0.1% Pacific Islander, and 2.4% from other races. Hispanic or Latino of any race were 2.7% of the population.
The median household income in Evergreen was $37,917, and the median family income was $45,625. The per capita income was $19,945. About 17.2% of families and 20.3% of the population were below the poverty line, including 28.3% of those under age 18 and 11.2% of those age 65 or over.
Common Questions
What is Per Capita Income in Evergreen?
Per Capita income in Evergreen is $22,086.
What is the Median Family Income in Evergreen?
Median Family Income in Evergreen is $45,000.
What is the Median Household income in Evergreen?
Median Household Income in Evergreen is $33,125.
What is Income or Wage Gap in Evergreen?
Income or Wage Gap in Evergreen is 0.1%.
Women in Evergreen earn 99.9 cents for every dollar earned by a man.
What is Inequality or Gini Index in Evergreen?
Inequality or Gini Index in Evergreen is 0.49.
What is the Total Population of Evergreen?
Total Population of Evergreen is 285.
What is the Total Male Population of Evergreen?
Total Male Population of Evergreen is 152.
What is the Total Female Population of Evergreen?
Total Female Population of Evergreen is 133.
What is the Ratio of Males per 100 Females in Evergreen?
There are 114.29 Males per 100 Females in Evergreen.
What is the Ratio of Females per 100 Males in Evergreen?
There are 87.50 Females per 100 Males in Evergreen.
What is the Median Population Age in Evergreen?
Median Population Age in Evergreen is 49.0 Years.
What is the Average Family Size in Evergreen
Average Family Size in Evergreen is 3.3 People.
What is the Average Household Size in Evergreen
Average Household Size in Evergreen is 2.5 People.
How Large is the Labor Force in Evergreen?
There are 103 People in the Labor Forcein in Evergreen.
What is the Percentage of People in the Labor Force in Evergreen?
46.6% of People are in the Labor Force in Evergreen.
What is the Unemployment Rate in Evergreen?
Unemployment Rate in Evergreen is 12.6%.