Scottsville, TX Map & Demographics
Scottsville Map
Scottsville Overview
$25,977
PER CAPITA INCOME
$56,875
AVG FAMILY INCOME
$47,500
AVG HOUSEHOLD INCOME
0.3%
WAGE / INCOME GAP [ % ]
99.7¢/ $1
WAGE / INCOME GAP [ $ ]
0.43
INEQUALITY / GINI INDEX
279
TOTAL POPULATION
142
MALE POPULATION
137
FEMALE POPULATION
103.65
MALES / 100 FEMALES
96.48
FEMALES / 100 MALES
50.9
MEDIAN AGE
2.8
AVG FAMILY SIZE
2.4
AVG HOUSEHOLD SIZE
130
LABOR FORCE [ PEOPLE ]
57.3%
PERCENT IN LABOR FORCE
Scottsville Area Codes
Income in Scottsville
Income Overview in Scottsville
Per Capita Income in Scottsville is $25,977, while median incomes of families and households are $56,875 and $47,500 respectively.
| Characteristic | Number | Measure |
| Per Capita Income | 279 | $25,977 |
| Median Family Income | 83 | $56,875 |
| Mean Family Income | 83 | $69,881 |
| Median Household Income | 118 | $47,500 |
| Mean Household Income | 118 | $59,512 |
| Income Deficit | 83 | $0 |
| Wage / Income Gap (%) | 279 | 0.30% |
| Wage / Income Gap ($) | 279 | 99.70¢ per $1 |
| Gini / Inequality Index | 279 | 0.43 |
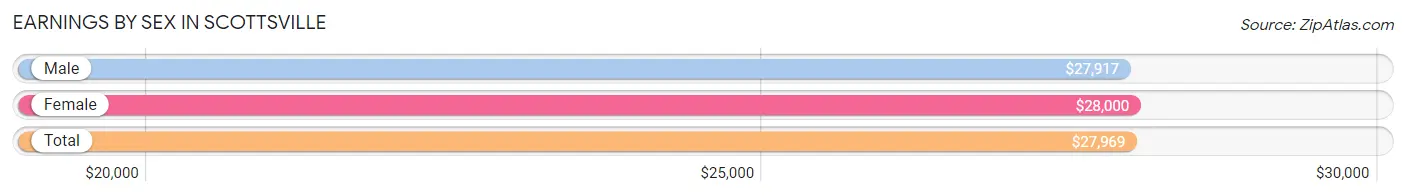
Earnings by Sex in Scottsville
Average Earnings in Scottsville are $27,969, $27,917 for men and $28,000 for women, a difference of 0.3%.
| Sex | Number | Average Earnings |
| Male | 74 (55.2%) | $27,917 |
| Female | 60 (44.8%) | $28,000 |
| Total | 134 (100.0%) | $27,969 |
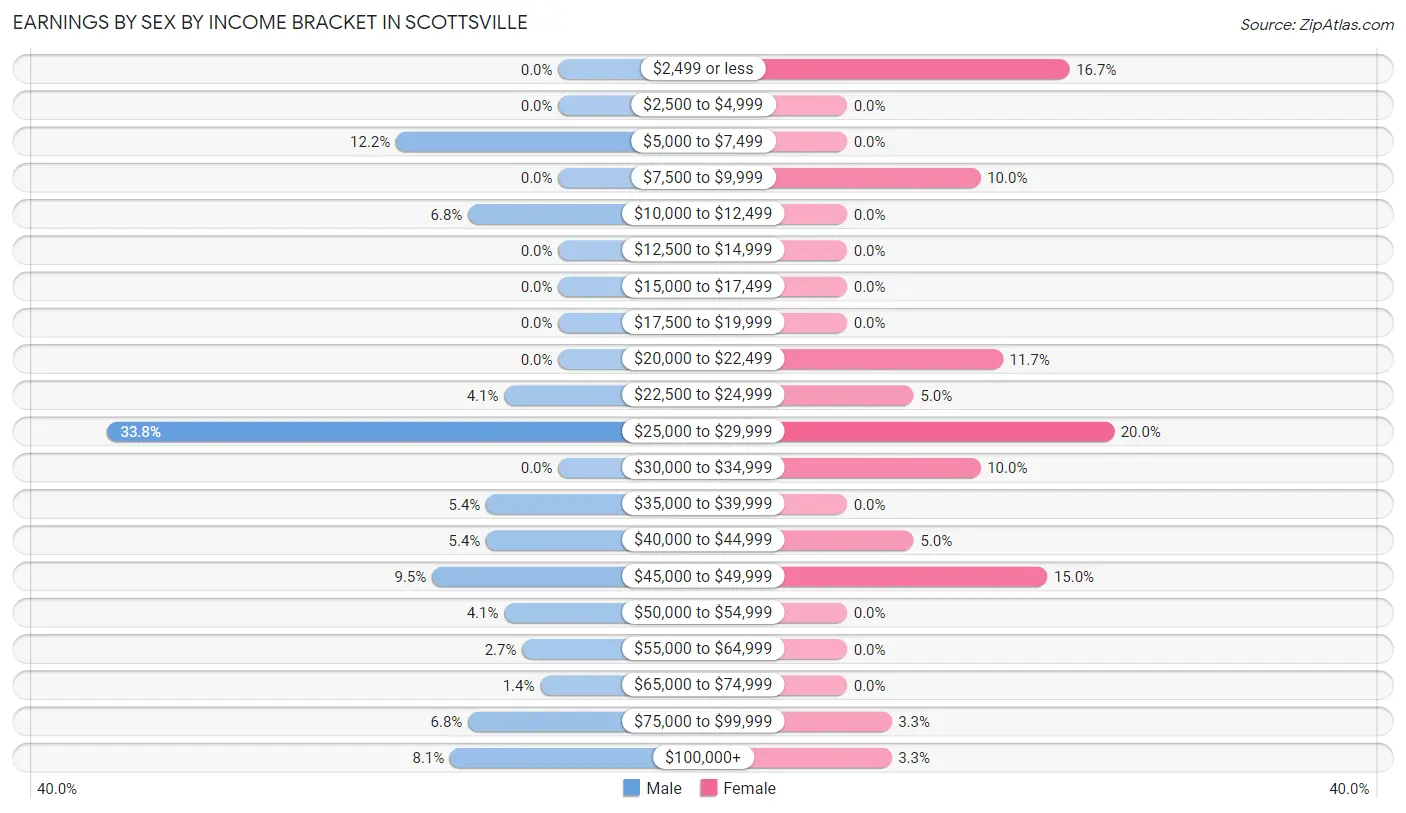
Earnings by Sex by Income Bracket in Scottsville
The most common earnings brackets in Scottsville are $25,000 to $29,999 for men (25 | 33.8%) and $25,000 to $29,999 for women (12 | 20.0%).
| Income | Male | Female |
| $2,499 or less | 0 (0.0%) | 10 (16.7%) |
| $2,500 to $4,999 | 0 (0.0%) | 0 (0.0%) |
| $5,000 to $7,499 | 9 (12.2%) | 0 (0.0%) |
| $7,500 to $9,999 | 0 (0.0%) | 6 (10.0%) |
| $10,000 to $12,499 | 5 (6.8%) | 0 (0.0%) |
| $12,500 to $14,999 | 0 (0.0%) | 0 (0.0%) |
| $15,000 to $17,499 | 0 (0.0%) | 0 (0.0%) |
| $17,500 to $19,999 | 0 (0.0%) | 0 (0.0%) |
| $20,000 to $22,499 | 0 (0.0%) | 7 (11.7%) |
| $22,500 to $24,999 | 3 (4.1%) | 3 (5.0%) |
| $25,000 to $29,999 | 25 (33.8%) | 12 (20.0%) |
| $30,000 to $34,999 | 0 (0.0%) | 6 (10.0%) |
| $35,000 to $39,999 | 4 (5.4%) | 0 (0.0%) |
| $40,000 to $44,999 | 4 (5.4%) | 3 (5.0%) |
| $45,000 to $49,999 | 7 (9.5%) | 9 (15.0%) |
| $50,000 to $54,999 | 3 (4.1%) | 0 (0.0%) |
| $55,000 to $64,999 | 2 (2.7%) | 0 (0.0%) |
| $65,000 to $74,999 | 1 (1.3%) | 0 (0.0%) |
| $75,000 to $99,999 | 5 (6.8%) | 2 (3.3%) |
| $100,000+ | 6 (8.1%) | 2 (3.3%) |
| Total | 74 (100.0%) | 60 (100.0%) |
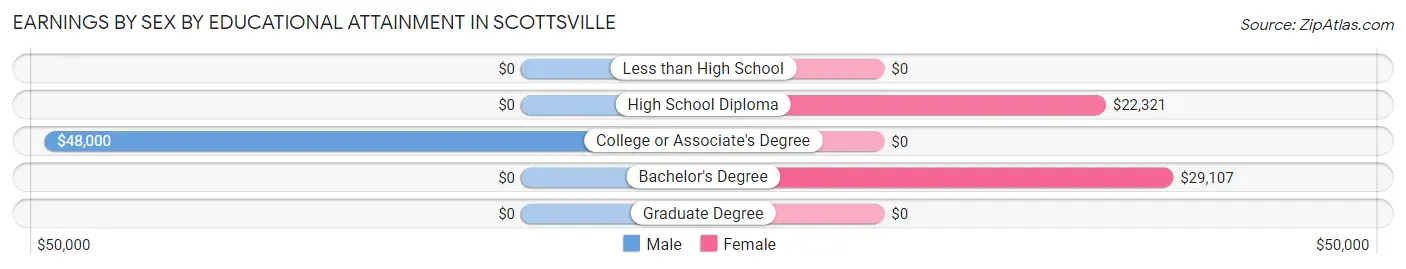
Earnings by Sex by Educational Attainment in Scottsville
Average earnings in Scottsville are $40,313 for men and $28,000 for women, a difference of 30.5%. Men with an educational attainment of college or associate's degree enjoy the highest average annual earnings of $48,000, while those with college or associate's degree education earn the least with $48,000. Women with an educational attainment of bachelor's degree earn the most with the average annual earnings of $29,107, while those with high school diploma education have the smallest earnings of $22,321.
| Educational Attainment | Male Income | Female Income |
| Less than High School | - | - |
| High School Diploma | - | - |
| College or Associate's Degree | $48,000 | $0 |
| Bachelor's Degree | - | - |
| Graduate Degree | - | - |
| Total | $40,313 | $28,000 |
Family Income in Scottsville
Family Income Brackets in Scottsville
According to the Scottsville family income data, there are 27 families falling into the $50,000 to $74,999 income range, which is the most common income bracket and makes up 32.5% of all families.
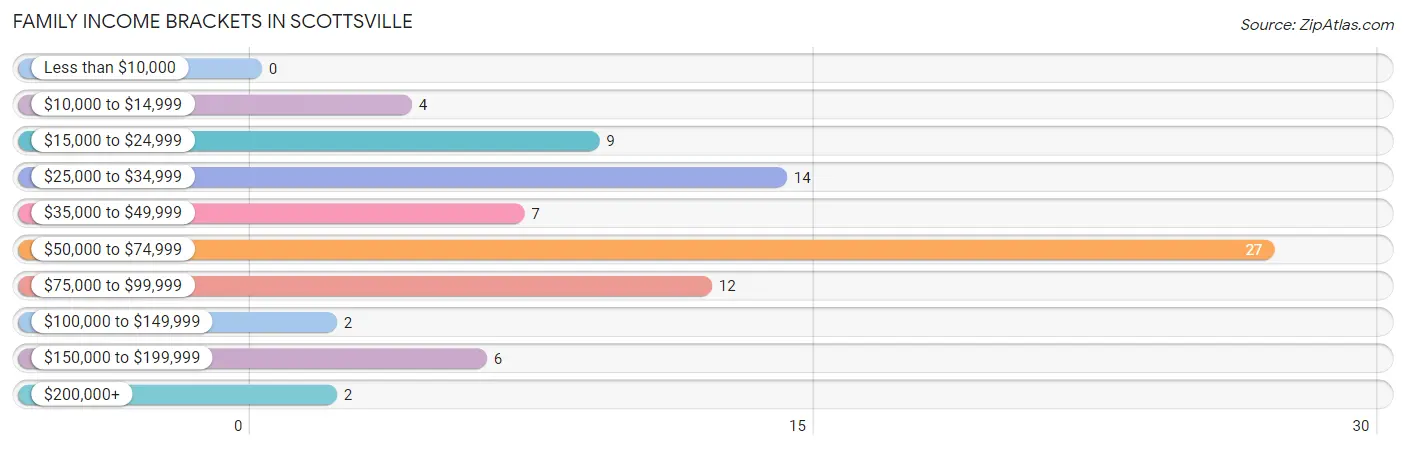
| Income Bracket | # Families | % Families |
| Less than $10,000 | 0 | 0.0% |
| $10,000 to $14,999 | 4 | 4.8% |
| $15,000 to $24,999 | 9 | 10.8% |
| $25,000 to $34,999 | 14 | 16.9% |
| $35,000 to $49,999 | 7 | 8.4% |
| $50,000 to $74,999 | 27 | 32.5% |
| $75,000 to $99,999 | 12 | 14.5% |
| $100,000 to $149,999 | 2 | 2.4% |
| $150,000 to $199,999 | 6 | 7.2% |
| $200,000+ | 2 | 2.4% |
Family Income by Famaliy Size in Scottsville
2-person families (57 | 68.7%) account for the highest median family income in Scottsville with $63,542 per family, while 2-person families (57 | 68.7%) have the highest median income of $31,771 per family member.
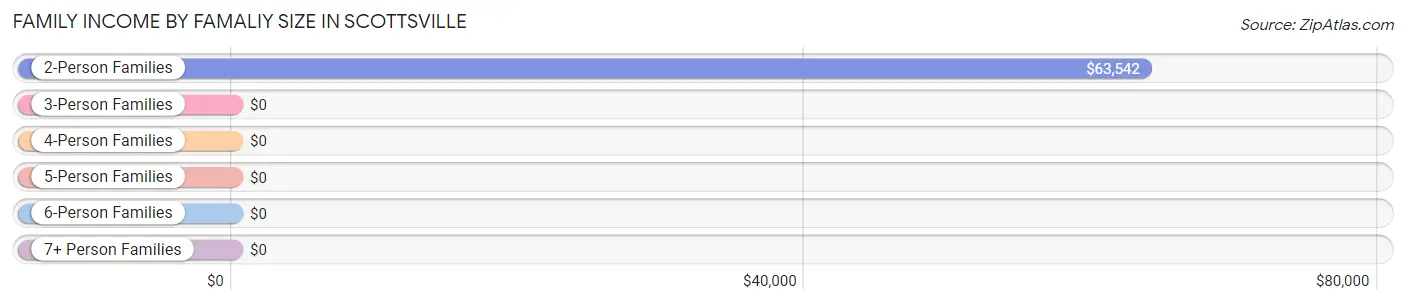
| Income Bracket | # Families | Median Income |
| 2-Person Families | 57 (68.7%) | $63,542 |
| 3-Person Families | 11 (13.3%) | $0 |
| 4-Person Families | 8 (9.6%) | $0 |
| 5-Person Families | 3 (3.6%) | $0 |
| 6-Person Families | 4 (4.8%) | $0 |
| 7+ Person Families | 0 (0.0%) | $0 |
| Total | 83 (100.0%) | $56,875 |
Family Income by Number of Earners in Scottsville
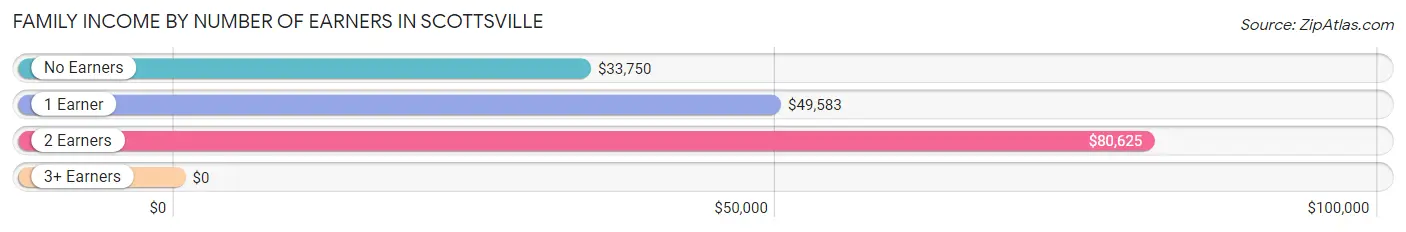
| Number of Earners | # Families | Median Income |
| No Earners | 20 (24.1%) | $33,750 |
| 1 Earner | 31 (37.3%) | $49,583 |
| 2 Earners | 27 (32.5%) | $80,625 |
| 3+ Earners | 5 (6.0%) | $0 |
| Total | 83 (100.0%) | $56,875 |
Household Income in Scottsville
Household Income Brackets in Scottsville
With 33 households falling in the category, the $50,000 to $74,999 income range is the most frequent in Scottsville, accounting for 28.0% of all households. In contrast, only 2 households (1.7%) fall into the $200,000+ income bracket, making it the least populous group.
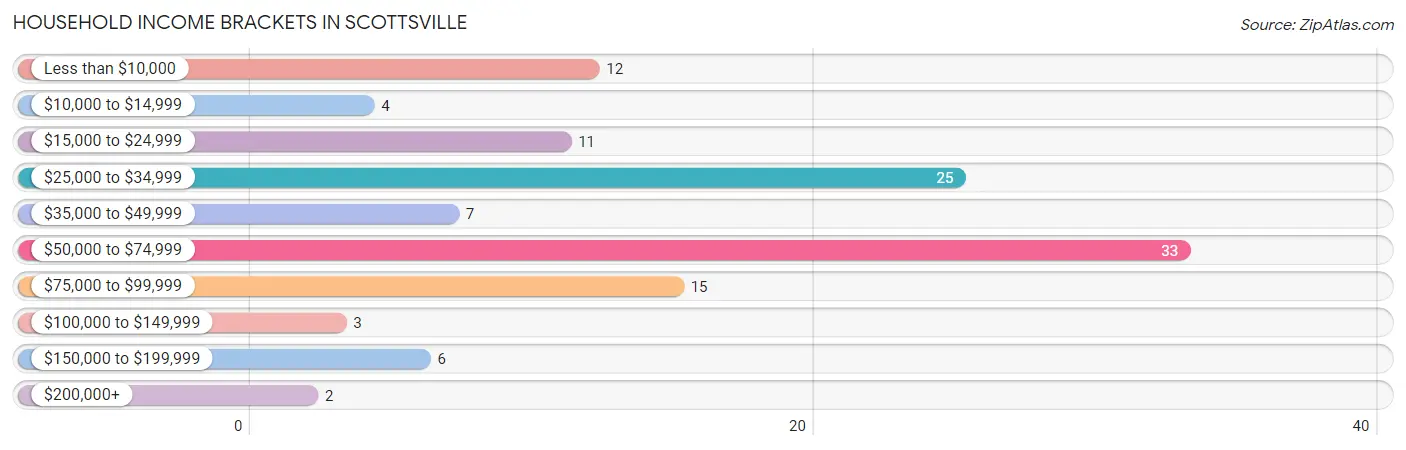
| Income Bracket | # Households | % Households |
| Less than $10,000 | 12 | 10.2% |
| $10,000 to $14,999 | 4 | 3.4% |
| $15,000 to $24,999 | 11 | 9.3% |
| $25,000 to $34,999 | 25 | 21.2% |
| $35,000 to $49,999 | 7 | 5.9% |
| $50,000 to $74,999 | 33 | 28.0% |
| $75,000 to $99,999 | 15 | 12.7% |
| $100,000 to $149,999 | 3 | 2.5% |
| $150,000 to $199,999 | 6 | 5.1% |
| $200,000+ | 2 | 1.7% |
Household Income by Householder Age in Scottsville
The median household income in Scottsville is $47,500, with the highest median household income of $66,875 found in the 45 to 64 years age bracket for the primary householder. A total of 63 households (53.4%) fall into this category.
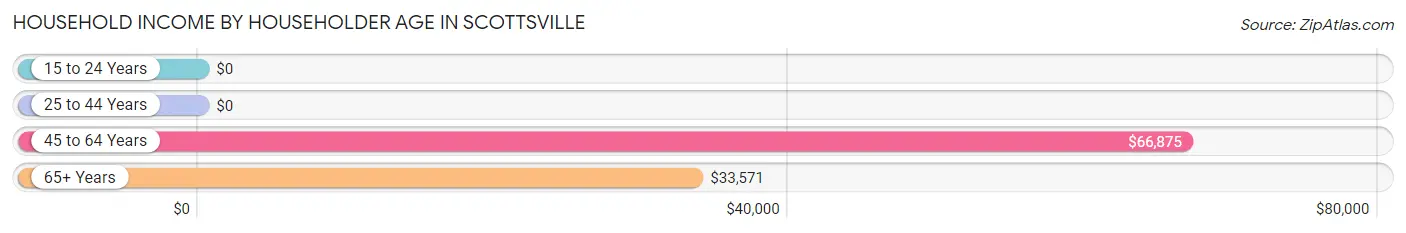
| Income Bracket | # Households | Median Income |
| 15 to 24 Years | 0 (0.0%) | $0 |
| 25 to 44 Years | 21 (17.8%) | $0 |
| 45 to 64 Years | 63 (53.4%) | $66,875 |
| 65+ Years | 34 (28.8%) | $33,571 |
| Total | 118 (100.0%) | $47,500 |
Poverty in Scottsville
Income Below Poverty by Sex and Age in Scottsville
With 38.7% poverty level for males and 32.1% for females among the residents of Scottsville, under 5 year old males and 16 and 17 year old females are the most vulnerable to poverty, with 14 males (100.0%) and 3 females (100.0%) in their respective age groups living below the poverty level.
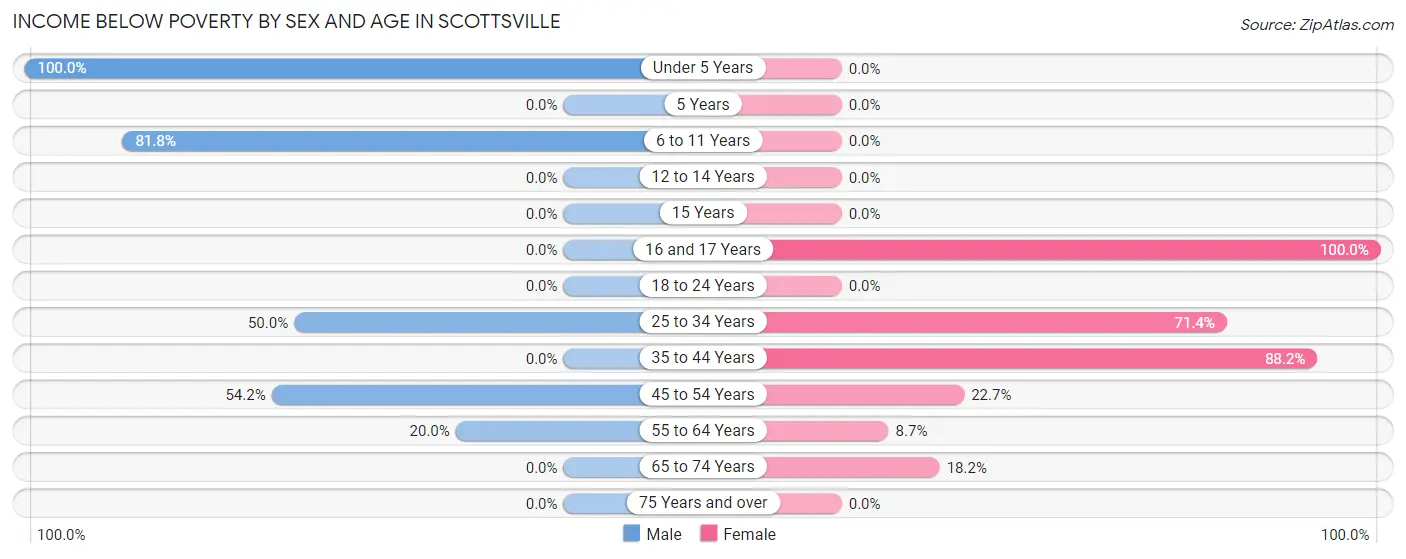
| Age Bracket | Male | Female |
| Under 5 Years | 14 (100.0%) | 0 (0.0%) |
| 5 Years | 0 (0.0%) | 0 (0.0%) |
| 6 to 11 Years | 18 (81.8%) | 0 (0.0%) |
| 12 to 14 Years | 0 (0.0%) | 0 (0.0%) |
| 15 Years | 0 (0.0%) | 0 (0.0%) |
| 16 and 17 Years | 0 (0.0%) | 3 (100.0%) |
| 18 to 24 Years | 0 (0.0%) | 0 (0.0%) |
| 25 to 34 Years | 6 (50.0%) | 15 (71.4%) |
| 35 to 44 Years | 0 (0.0%) | 15 (88.2%) |
| 45 to 54 Years | 13 (54.2%) | 5 (22.7%) |
| 55 to 64 Years | 4 (20.0%) | 2 (8.7%) |
| 65 to 74 Years | 0 (0.0%) | 4 (18.2%) |
| 75 Years and over | 0 (0.0%) | 0 (0.0%) |
| Total | 55 (38.7%) | 44 (32.1%) |
Income Above Poverty by Sex and Age in Scottsville
According to the poverty statistics in Scottsville, males aged 15 years and females aged under 5 years are the age groups that are most secure financially, with 100.0% of males and 100.0% of females in these age groups living above the poverty line.
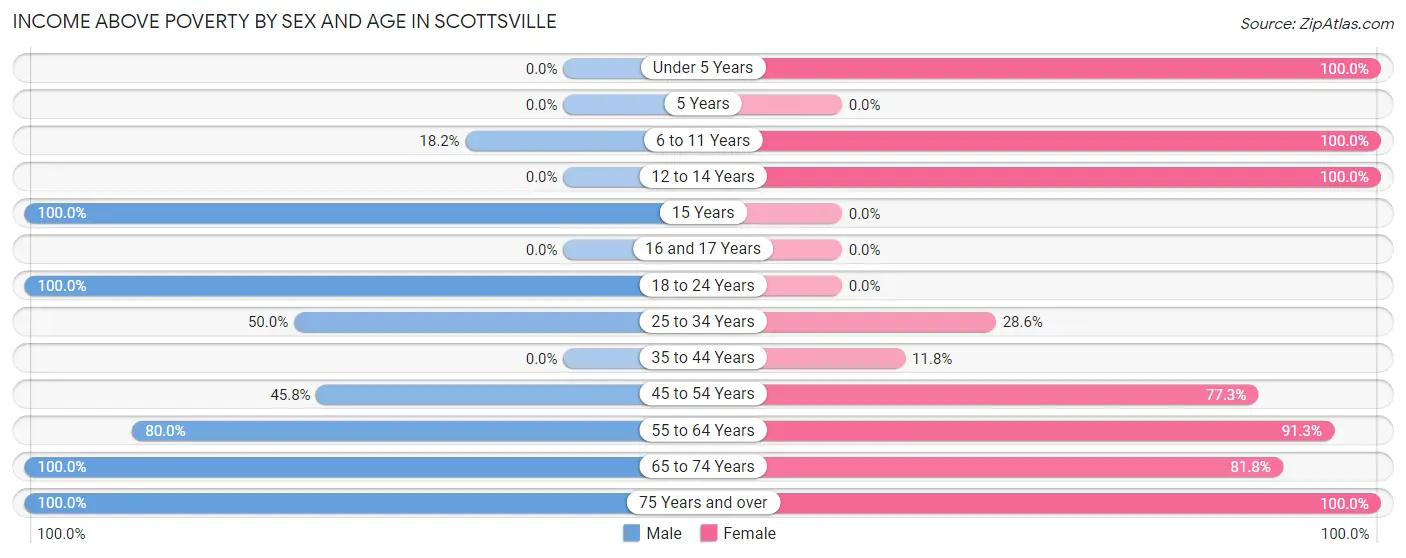
| Age Bracket | Male | Female |
| Under 5 Years | 0 (0.0%) | 2 (100.0%) |
| 5 Years | 0 (0.0%) | 0 (0.0%) |
| 6 to 11 Years | 4 (18.2%) | 7 (100.0%) |
| 12 to 14 Years | 0 (0.0%) | 4 (100.0%) |
| 15 Years | 3 (100.0%) | 0 (0.0%) |
| 16 and 17 Years | 0 (0.0%) | 0 (0.0%) |
| 18 to 24 Years | 19 (100.0%) | 0 (0.0%) |
| 25 to 34 Years | 6 (50.0%) | 6 (28.6%) |
| 35 to 44 Years | 0 (0.0%) | 2 (11.8%) |
| 45 to 54 Years | 11 (45.8%) | 17 (77.3%) |
| 55 to 64 Years | 16 (80.0%) | 21 (91.3%) |
| 65 to 74 Years | 20 (100.0%) | 18 (81.8%) |
| 75 Years and over | 8 (100.0%) | 16 (100.0%) |
| Total | 87 (61.3%) | 93 (67.9%) |
Income Below Poverty Among Married-Couple Families in Scottsville
The poverty statistics for married-couple families in Scottsville show that 17.5% or 10 of the total 57 families live below the poverty line. Families with 1 or 2 children have the highest poverty rate of 83.3%, comprising of 10 families. On the other hand, families with no children have the lowest poverty rate of 0.0%, which includes 0 families.
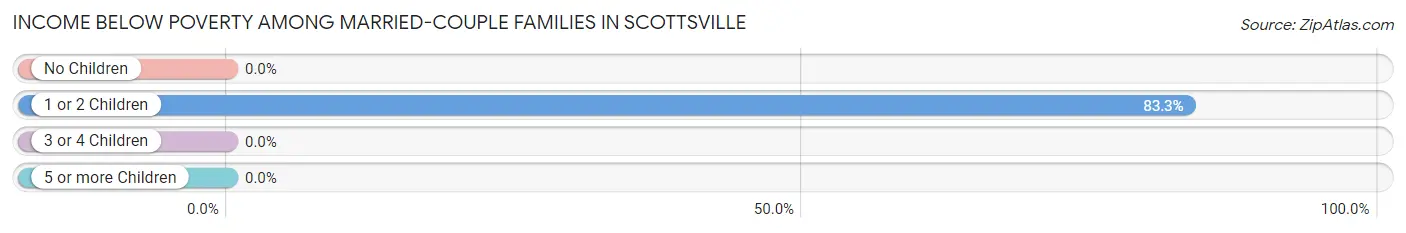
| Children | Above Poverty | Below Poverty |
| No Children | 42 (100.0%) | 0 (0.0%) |
| 1 or 2 Children | 2 (16.7%) | 10 (83.3%) |
| 3 or 4 Children | 3 (100.0%) | 0 (0.0%) |
| 5 or more Children | 0 (0.0%) | 0 (0.0%) |
| Total | 47 (82.5%) | 10 (17.5%) |
Income Below Poverty Among Single-Parent Households in Scottsville
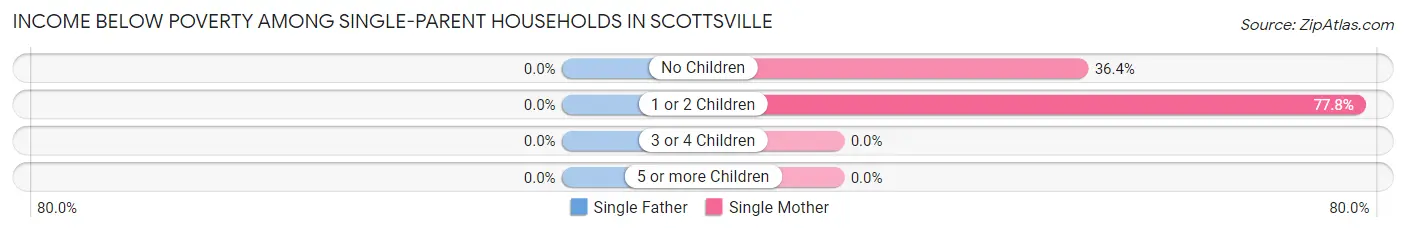
| Children | Single Father | Single Mother |
| No Children | 0 (0.0%) | 4 (36.4%) |
| 1 or 2 Children | 0 (0.0%) | 7 (77.8%) |
| 3 or 4 Children | 0 (0.0%) | 0 (0.0%) |
| 5 or more Children | 0 (0.0%) | 0 (0.0%) |
| Total | 0 (0.0%) | 11 (55.0%) |
Income Below Poverty Among Married-Couple vs Single-Parent Households in Scottsville
The poverty data for Scottsville shows that 10 of the married-couple family households (17.5%) and 11 of the single-parent households (42.3%) are living below the poverty level. Within the married-couple family households, those with 1 or 2 children have the highest poverty rate, with 10 households (83.3%) falling below the poverty line. Among the single-parent households, those with 1 or 2 children have the highest poverty rate, with 7 household (58.3%) living below poverty.
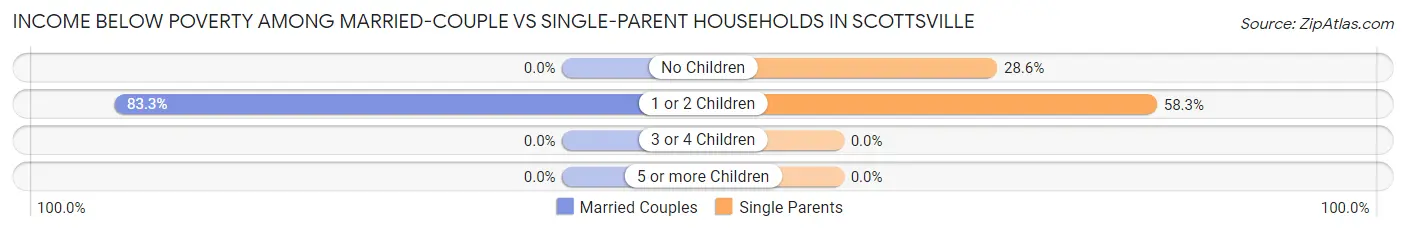
| Children | Married-Couple Families | Single-Parent Households |
| No Children | 0 (0.0%) | 4 (28.6%) |
| 1 or 2 Children | 10 (83.3%) | 7 (58.3%) |
| 3 or 4 Children | 0 (0.0%) | 0 (0.0%) |
| 5 or more Children | 0 (0.0%) | 0 (0.0%) |
| Total | 10 (17.5%) | 11 (42.3%) |
Race in Scottsville
The most populous races in Scottsville are White / Caucasian (167 | 59.9%), Black / African American (86 | 30.8%), and Hispanic or Latino (29 | 10.4%).
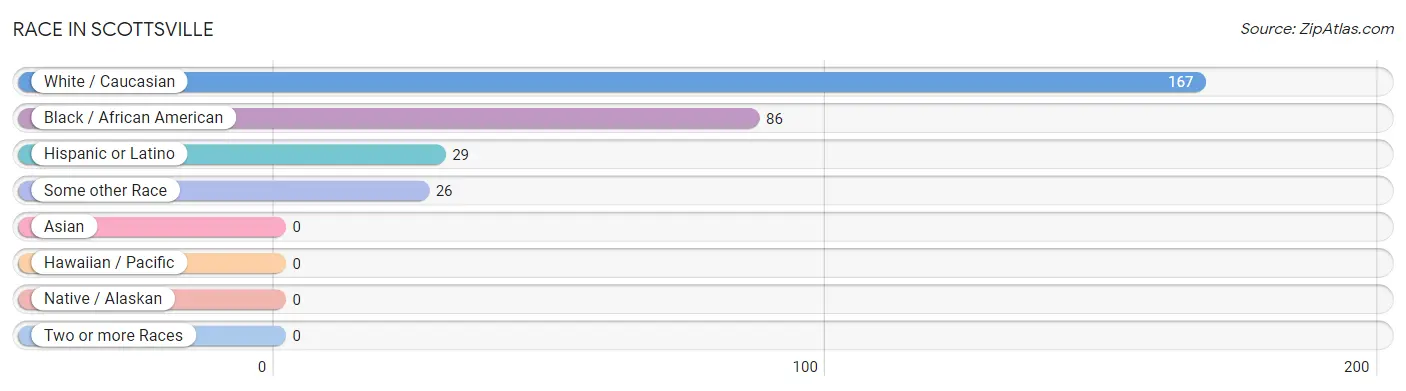
| Race | # Population | % Population |
| Asian | 0 | 0.0% |
| Black / African American | 86 | 30.8% |
| Hawaiian / Pacific | 0 | 0.0% |
| Hispanic or Latino | 29 | 10.4% |
| Native / Alaskan | 0 | 0.0% |
| White / Caucasian | 167 | 59.9% |
| Two or more Races | 0 | 0.0% |
| Some other Race | 26 | 9.3% |
| Total | 279 | 100.0% |
Ancestry in Scottsville
The most populous ancestries reported in Scottsville are English (42 | 15.0%), Irish (32 | 11.5%), Mexican (29 | 10.4%), African (23 | 8.2%), and Subsaharan African (23 | 8.2%), together accounting for 53.4% of all Scottsville residents.
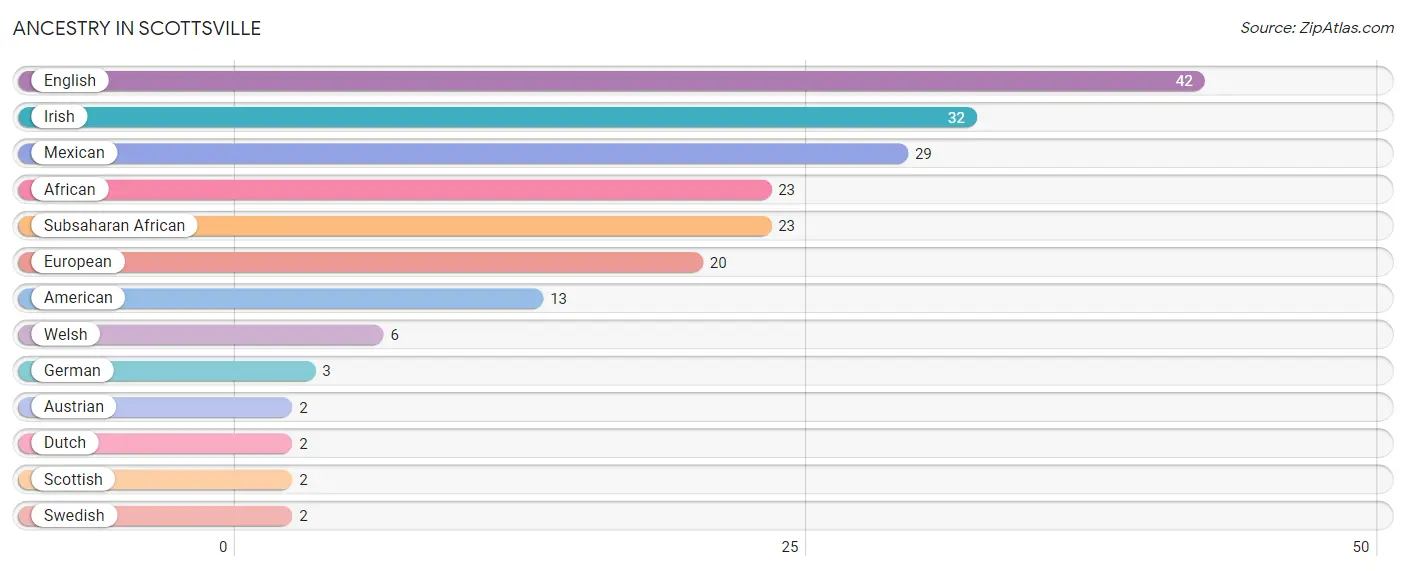
| Ancestry | # Population | % Population |
| African | 23 | 8.2% |
| American | 13 | 4.7% |
| Austrian | 2 | 0.7% |
| Dutch | 2 | 0.7% |
| English | 42 | 15.0% |
| European | 20 | 7.2% |
| German | 3 | 1.1% |
| Irish | 32 | 11.5% |
| Mexican | 29 | 10.4% |
| Scottish | 2 | 0.7% |
| Subsaharan African | 23 | 8.2% |
| Swedish | 2 | 0.7% |
| Welsh | 6 | 2.1% | View All 13 Rows |
Immigrants in Scottsville
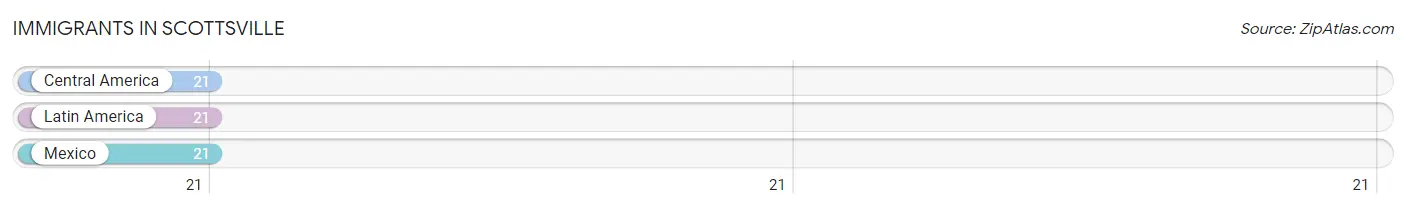
The most numerous immigrant groups reported in Scottsville came from Central America (21 | 7.5%), Latin America (21 | 7.5%), and Mexico (21 | 7.5%), together accounting for 22.6% of all Scottsville residents.
| Immigration Origin | # Population | % Population |
| Central America | 21 | 7.5% |
| Latin America | 21 | 7.5% |
| Mexico | 21 | 7.5% | View All 3 Rows |
Sex and Age in Scottsville
Sex and Age in Scottsville
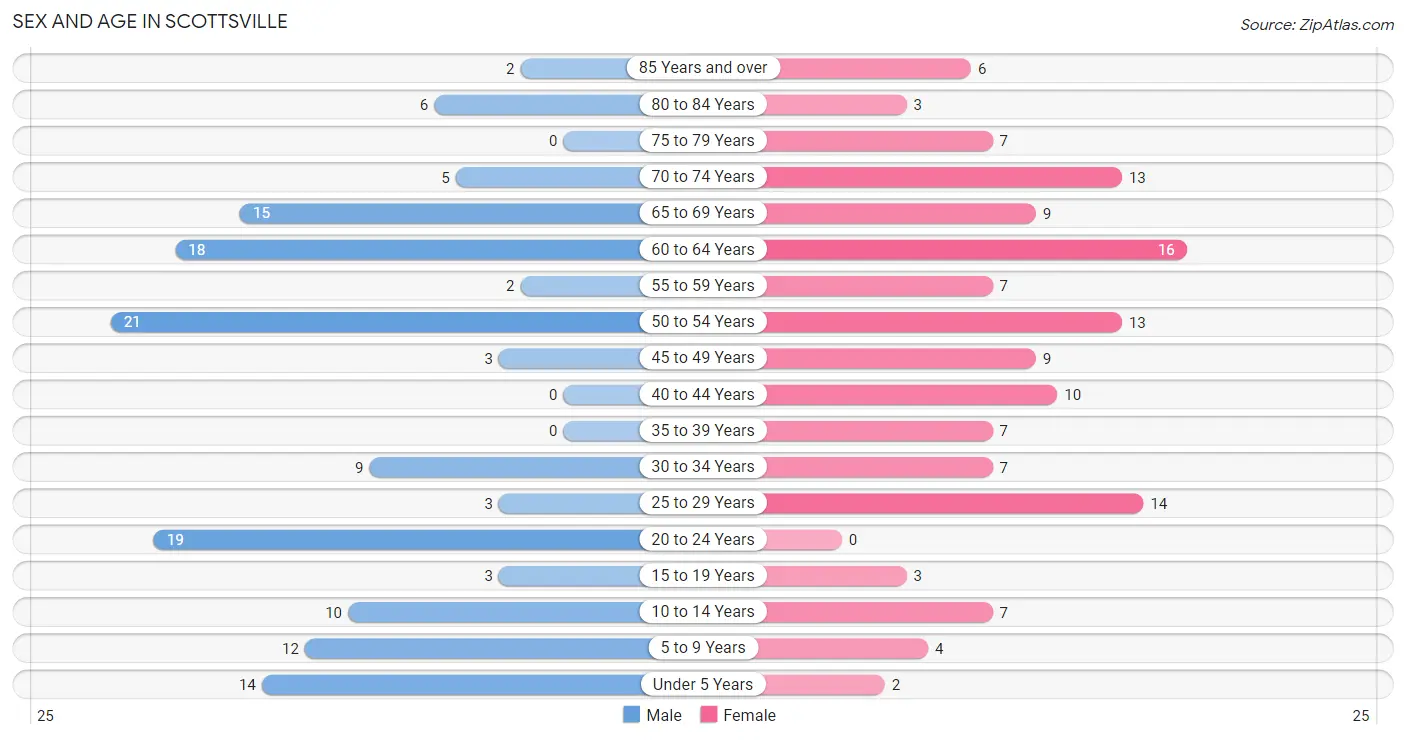
The most populous age groups in Scottsville are 50 to 54 Years (21 | 14.8%) for men and 60 to 64 Years (16 | 11.7%) for women.
| Age Bracket | Male | Female |
| Under 5 Years | 14 (9.9%) | 2 (1.5%) |
| 5 to 9 Years | 12 (8.5%) | 4 (2.9%) |
| 10 to 14 Years | 10 (7.0%) | 7 (5.1%) |
| 15 to 19 Years | 3 (2.1%) | 3 (2.2%) |
| 20 to 24 Years | 19 (13.4%) | 0 (0.0%) |
| 25 to 29 Years | 3 (2.1%) | 14 (10.2%) |
| 30 to 34 Years | 9 (6.3%) | 7 (5.1%) |
| 35 to 39 Years | 0 (0.0%) | 7 (5.1%) |
| 40 to 44 Years | 0 (0.0%) | 10 (7.3%) |
| 45 to 49 Years | 3 (2.1%) | 9 (6.6%) |
| 50 to 54 Years | 21 (14.8%) | 13 (9.5%) |
| 55 to 59 Years | 2 (1.4%) | 7 (5.1%) |
| 60 to 64 Years | 18 (12.7%) | 16 (11.7%) |
| 65 to 69 Years | 15 (10.6%) | 9 (6.6%) |
| 70 to 74 Years | 5 (3.5%) | 13 (9.5%) |
| 75 to 79 Years | 0 (0.0%) | 7 (5.1%) |
| 80 to 84 Years | 6 (4.2%) | 3 (2.2%) |
| 85 Years and over | 2 (1.4%) | 6 (4.4%) |
| Total | 142 (100.0%) | 137 (100.0%) |
Families and Households in Scottsville
Median Family Size in Scottsville
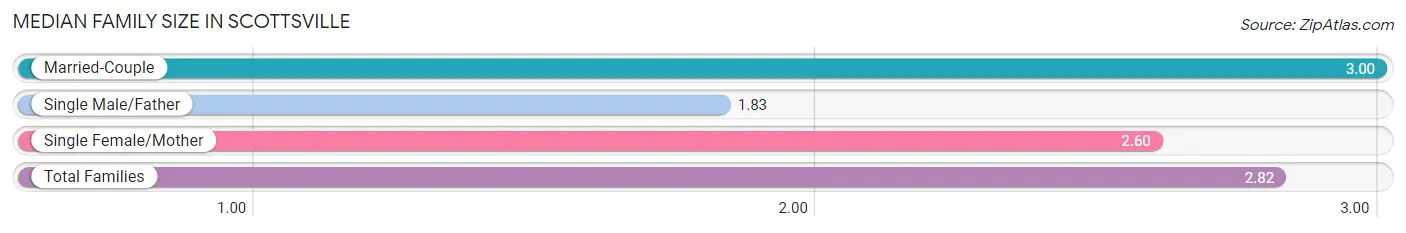
The median family size in Scottsville is 2.82 persons per family, with married-couple families (57 | 68.7%) accounting for the largest median family size of 3 persons per family. On the other hand, single male/father families (6 | 7.2%) represent the smallest median family size with 1.83 persons per family.
| Family Type | # Families | Family Size |
| Married-Couple | 57 (68.7%) | 3.00 |
| Single Male/Father | 6 (7.2%) | 1.83 |
| Single Female/Mother | 20 (24.1%) | 2.60 |
| Total Families | 83 (100.0%) | 2.82 |
Median Household Size in Scottsville
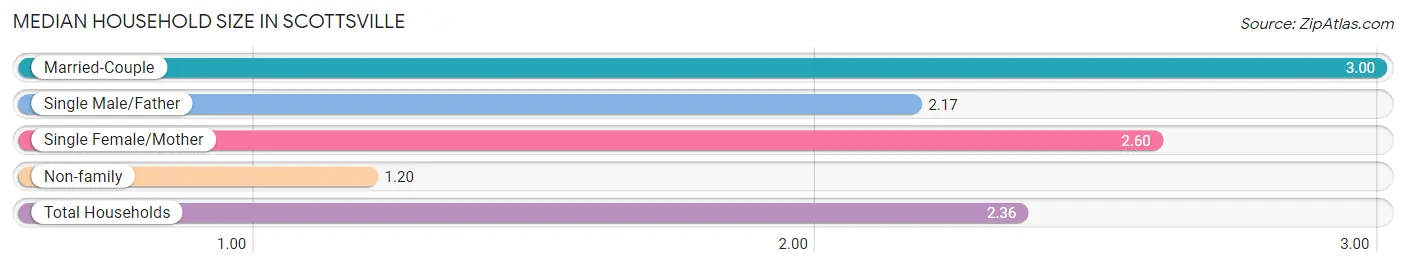
The median household size in Scottsville is 2.36 persons per household, with married-couple households (57 | 48.3%) accounting for the largest median household size of 3 persons per household. non-family households (35 | 29.7%) represent the smallest median household size with 1.20 persons per household.
| Household Type | # Households | Household Size |
| Married-Couple | 57 (48.3%) | 3.00 |
| Single Male/Father | 6 (5.1%) | 2.17 |
| Single Female/Mother | 20 (17.0%) | 2.60 |
| Non-family | 35 (29.7%) | 1.20 |
| Total Households | 118 (100.0%) | 2.36 |
Household Size by Marriage Status in Scottsville
Out of a total of 118 households in Scottsville, 83 (70.3%) are family households, while 35 (29.7%) are nonfamily households. The most numerous type of family households are 2-person households, comprising 54, and the most common type of nonfamily households are 1-person households, comprising 33.
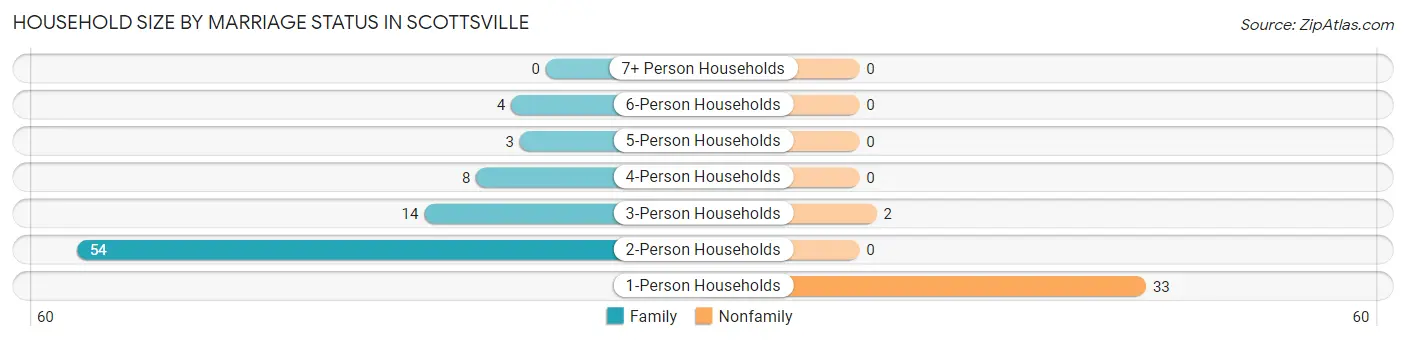
| Household Size | Family Households | Nonfamily Households |
| 1-Person Households | - | 33 (28.0%) |
| 2-Person Households | 54 (45.8%) | 0 (0.0%) |
| 3-Person Households | 14 (11.9%) | 2 (1.7%) |
| 4-Person Households | 8 (6.8%) | 0 (0.0%) |
| 5-Person Households | 3 (2.5%) | 0 (0.0%) |
| 6-Person Households | 4 (3.4%) | 0 (0.0%) |
| 7+ Person Households | 0 (0.0%) | 0 (0.0%) |
| Total | 83 (70.3%) | 35 (29.7%) |
Female Fertility in Scottsville
Fertility by Age in Scottsville
Average fertility rate in Scottsville is 39.0 births per 1,000 women. Women in the age bracket of 20 to 34 years have the highest fertility rate with 95.0 births per 1,000 women. Women in the age bracket of 20 to 34 years acount for 100.0% of all women with births.
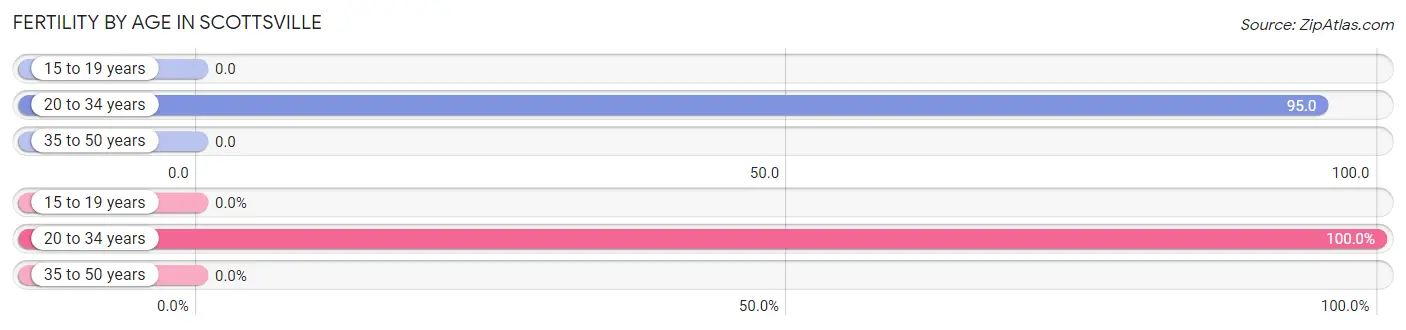
| Age Bracket | Women with Births | Births / 1,000 Women |
| 15 to 19 years | 0 (0.0%) | 0.0 |
| 20 to 34 years | 2 (100.0%) | 95.0 |
| 35 to 50 years | 0 (0.0%) | 0.0 |
| Total | 2 (100.0%) | 39.0 |
Fertility by Age by Marriage Status in Scottsville
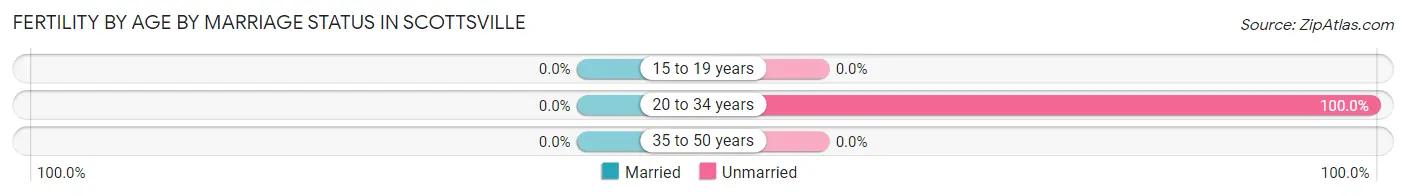
| Age Bracket | Married | Unmarried |
| 15 to 19 years | 0 (0.0%) | 0 (0.0%) |
| 20 to 34 years | 0 (0.0%) | 2 (100.0%) |
| 35 to 50 years | 0 (0.0%) | 0 (0.0%) |
| Total | 0 (0.0%) | 2 (100.0%) |
Fertility by Education in Scottsville
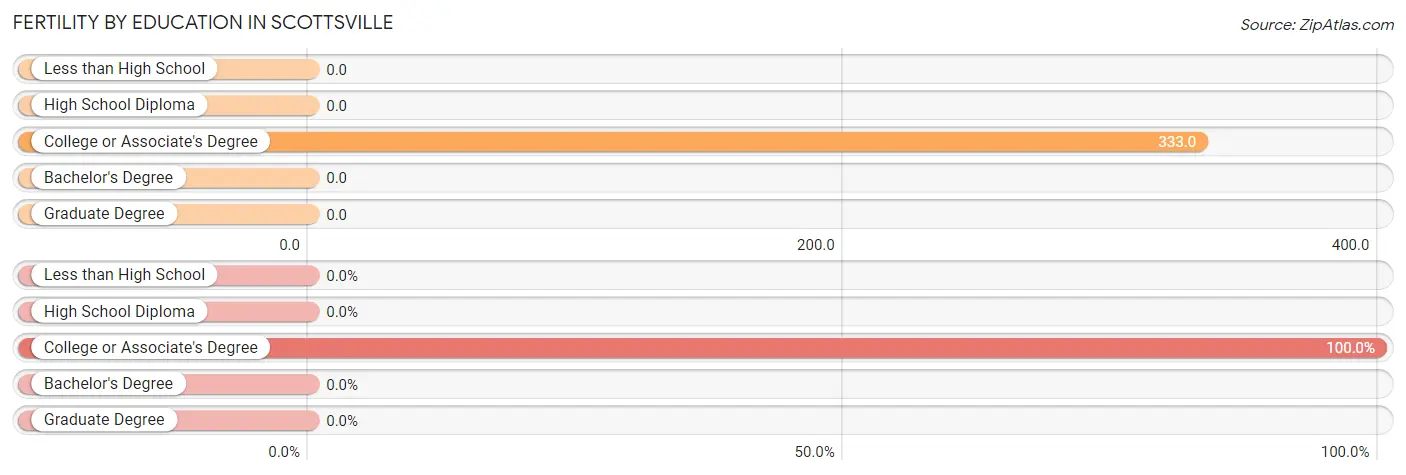
| Educational Attainment | Women with Births | Births / 1,000 Women |
| Less than High School | 0 (0.0%) | 0.0 |
| High School Diploma | 0 (0.0%) | 0.0 |
| College or Associate's Degree | 2 (100.0%) | 333.0 |
| Bachelor's Degree | 0 (0.0%) | 0.0 |
| Graduate Degree | 0 (0.0%) | 0.0 |
| Total | 2 (100.0%) | 39.0 |
Fertility by Education by Marriage Status in Scottsville
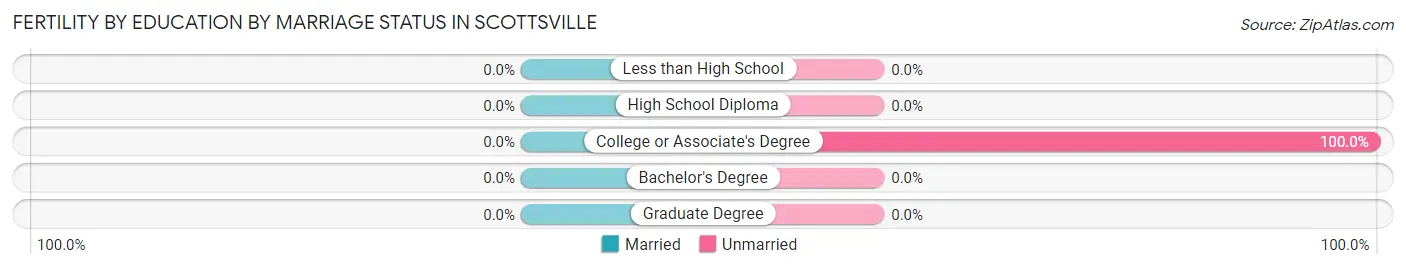
| Educational Attainment | Married | Unmarried |
| Less than High School | 0 (0.0%) | 0 (0.0%) |
| High School Diploma | 0 (0.0%) | 0 (0.0%) |
| College or Associate's Degree | 0 (0.0%) | 2 (100.0%) |
| Bachelor's Degree | 0 (0.0%) | 0 (0.0%) |
| Graduate Degree | 0 (0.0%) | 0 (0.0%) |
| Total | 0 (0.0%) | 2 (100.0%) |
Employment Characteristics in Scottsville
Employment by Class of Employer in Scottsville
Among the 130 employed individuals in Scottsville, private company employees (91 | 70.0%), local government employees (15 | 11.5%), and self-employed (incorporated) (9 | 6.9%) make up the most common classes of employment.
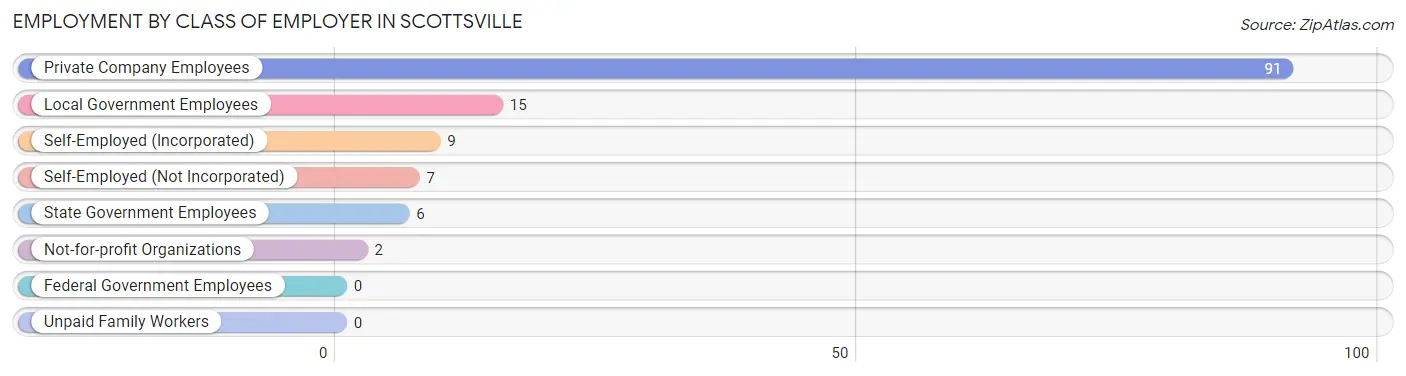
| Employer Class | # Employees | % Employees |
| Private Company Employees | 91 | 70.0% |
| Self-Employed (Incorporated) | 9 | 6.9% |
| Self-Employed (Not Incorporated) | 7 | 5.4% |
| Not-for-profit Organizations | 2 | 1.5% |
| Local Government Employees | 15 | 11.5% |
| State Government Employees | 6 | 4.6% |
| Federal Government Employees | 0 | 0.0% |
| Unpaid Family Workers | 0 | 0.0% |
| Total | 130 | 100.0% |
Employment Status by Age in Scottsville
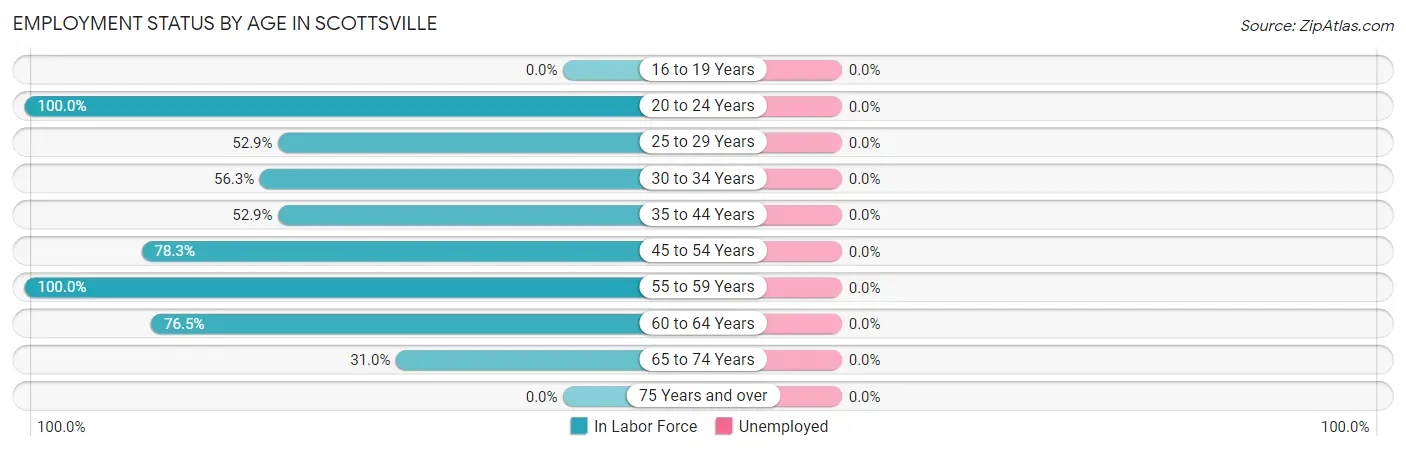
| Age Bracket | In Labor Force | Unemployed |
| 16 to 19 Years | 0 (0.0%) | 0 (0.0%) |
| 20 to 24 Years | 19 (100.0%) | 0 (0.0%) |
| 25 to 29 Years | 9 (52.9%) | 0 (0.0%) |
| 30 to 34 Years | 9 (56.3%) | 0 (0.0%) |
| 35 to 44 Years | 9 (52.9%) | 0 (0.0%) |
| 45 to 54 Years | 36 (78.3%) | 0 (0.0%) |
| 55 to 59 Years | 9 (100.0%) | 0 (0.0%) |
| 60 to 64 Years | 26 (76.5%) | 0 (0.0%) |
| 65 to 74 Years | 13 (31.0%) | 0 (0.0%) |
| 75 Years and over | 0 (0.0%) | 0 (0.0%) |
| Total | 130 (57.3%) | 0 (0.0%) |
Employment Status by Educational Attainment in Scottsville
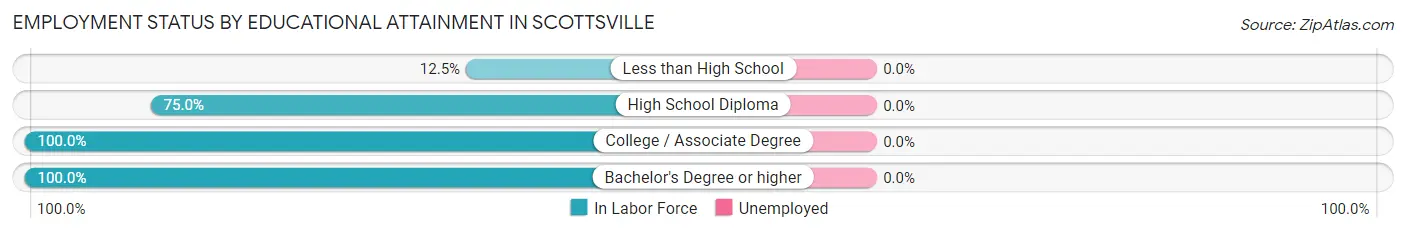
| Educational Attainment | In Labor Force | Unemployed |
| Less than High School | 4 (12.5%) | 0 (0.0%) |
| High School Diploma | 39 (75.0%) | 0 (0.0%) |
| College / Associate Degree | 42 (100.0%) | 0 (0.0%) |
| Bachelor's Degree or higher | 13 (100.0%) | 0 (0.0%) |
| Total | 98 (70.5%) | 0 (0.0%) |
Employment Occupations by Sex in Scottsville
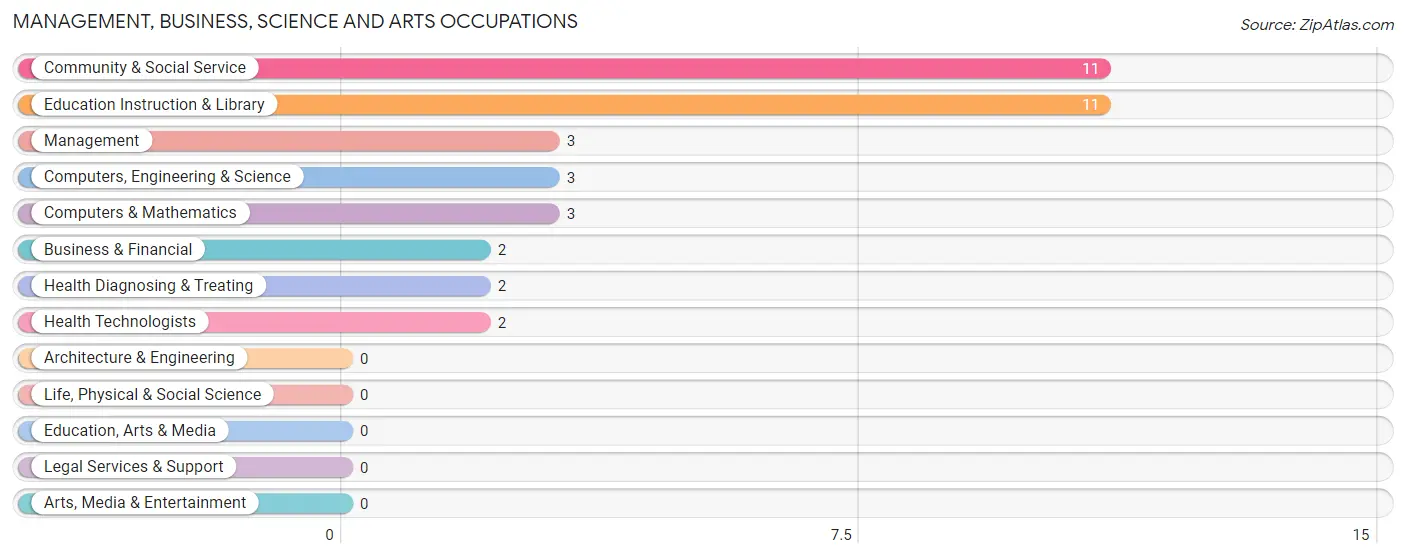
Management, Business, Science and Arts Occupations
The most common Management, Business, Science and Arts occupations in Scottsville are Community & Social Service (11 | 8.5%), Education Instruction & Library (11 | 8.5%), Management (3 | 2.3%), Computers, Engineering & Science (3 | 2.3%), and Computers & Mathematics (3 | 2.3%).
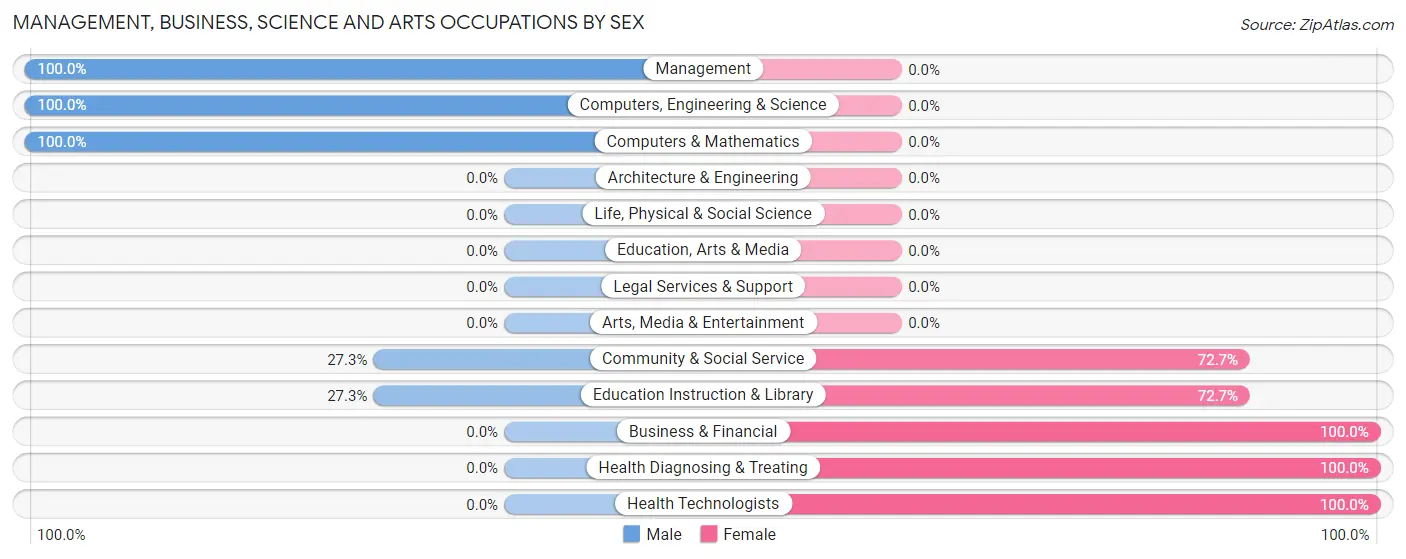
Management, Business, Science and Arts Occupations by Sex
Within the Management, Business, Science and Arts occupations in Scottsville, the most male-oriented occupations are Management (100.0%), Computers, Engineering & Science (100.0%), and Computers & Mathematics (100.0%), while the most female-oriented occupations are Business & Financial (100.0%), Health Diagnosing & Treating (100.0%), and Health Technologists (100.0%).
| Occupation | Male | Female |
| Management | 3 (100.0%) | 0 (0.0%) |
| Business & Financial | 0 (0.0%) | 2 (100.0%) |
| Computers, Engineering & Science | 3 (100.0%) | 0 (0.0%) |
| Computers & Mathematics | 3 (100.0%) | 0 (0.0%) |
| Architecture & Engineering | 0 (0.0%) | 0 (0.0%) |
| Life, Physical & Social Science | 0 (0.0%) | 0 (0.0%) |
| Community & Social Service | 3 (27.3%) | 8 (72.7%) |
| Education, Arts & Media | 0 (0.0%) | 0 (0.0%) |
| Legal Services & Support | 0 (0.0%) | 0 (0.0%) |
| Education Instruction & Library | 3 (27.3%) | 8 (72.7%) |
| Arts, Media & Entertainment | 0 (0.0%) | 0 (0.0%) |
| Health Diagnosing & Treating | 0 (0.0%) | 2 (100.0%) |
| Health Technologists | 0 (0.0%) | 2 (100.0%) |
| Total (Category) | 9 (42.9%) | 12 (57.1%) |
| Total (Overall) | 74 (56.9%) | 56 (43.1%) |
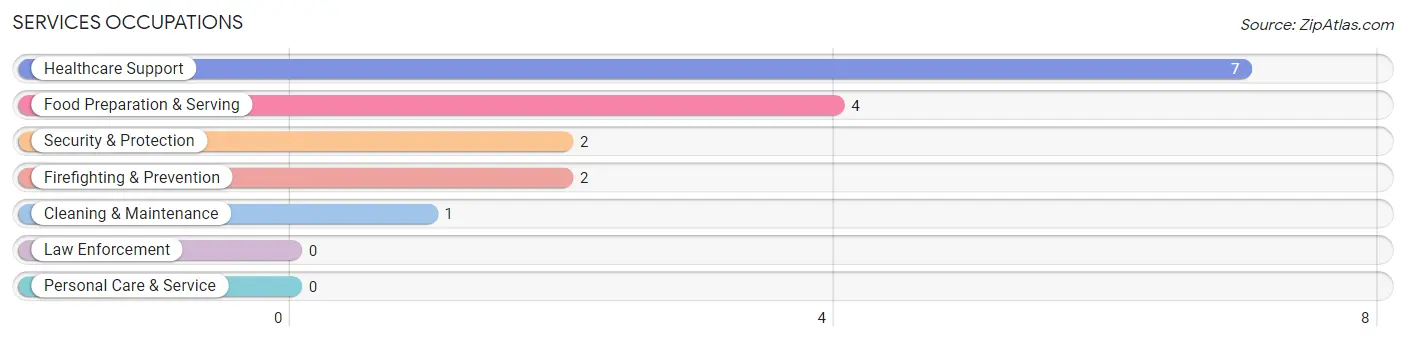
Services Occupations
The most common Services occupations in Scottsville are Healthcare Support (7 | 5.4%), Food Preparation & Serving (4 | 3.1%), Security & Protection (2 | 1.5%), Firefighting & Prevention (2 | 1.5%), and Cleaning & Maintenance (1 | 0.8%).
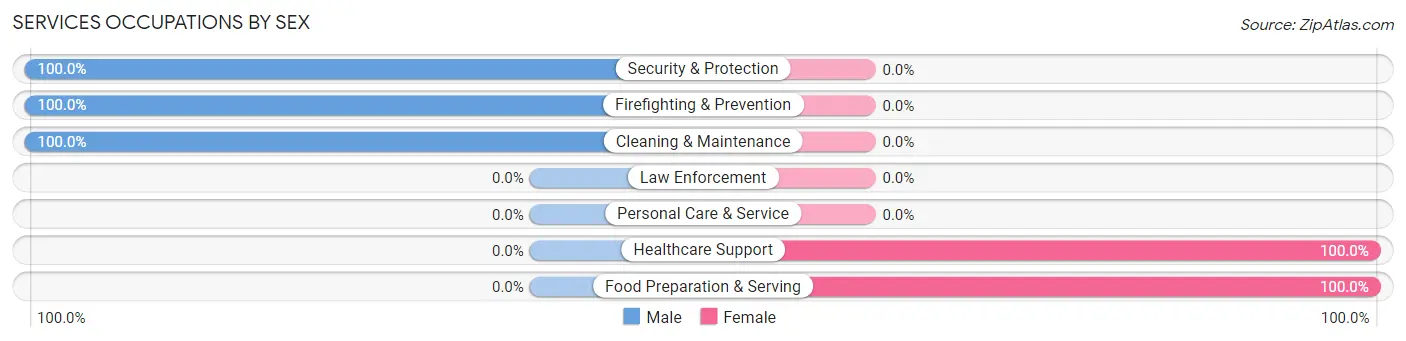
Services Occupations by Sex
Within the Services occupations in Scottsville, the most male-oriented occupations are Security & Protection (100.0%), Firefighting & Prevention (100.0%), and Cleaning & Maintenance (100.0%), while the most female-oriented occupations are Healthcare Support (100.0%), and Food Preparation & Serving (100.0%).
| Occupation | Male | Female |
| Healthcare Support | 0 (0.0%) | 7 (100.0%) |
| Security & Protection | 2 (100.0%) | 0 (0.0%) |
| Firefighting & Prevention | 2 (100.0%) | 0 (0.0%) |
| Law Enforcement | 0 (0.0%) | 0 (0.0%) |
| Food Preparation & Serving | 0 (0.0%) | 4 (100.0%) |
| Cleaning & Maintenance | 1 (100.0%) | 0 (0.0%) |
| Personal Care & Service | 0 (0.0%) | 0 (0.0%) |
| Total (Category) | 3 (21.4%) | 11 (78.6%) |
| Total (Overall) | 74 (56.9%) | 56 (43.1%) |
Sales and Office Occupations
The most common Sales and Office occupations in Scottsville are Sales & Related (43 | 33.1%), and Office & Administration (19 | 14.6%).
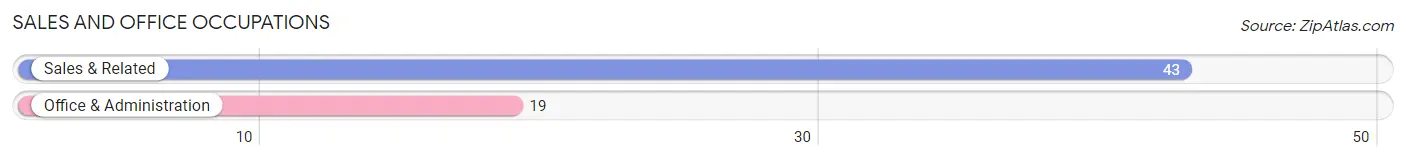
Sales and Office Occupations by Sex
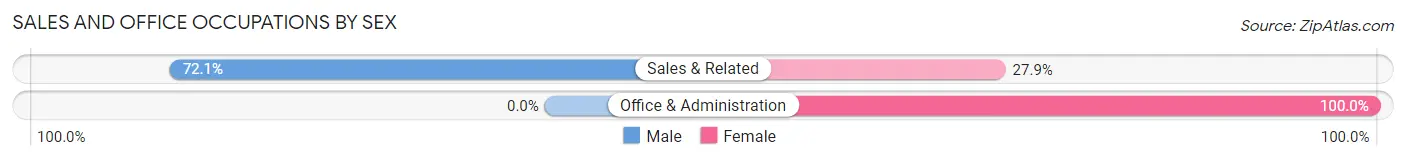
| Occupation | Male | Female |
| Sales & Related | 31 (72.1%) | 12 (27.9%) |
| Office & Administration | 0 (0.0%) | 19 (100.0%) |
| Total (Category) | 31 (50.0%) | 31 (50.0%) |
| Total (Overall) | 74 (56.9%) | 56 (43.1%) |
Natural Resources, Construction and Maintenance Occupations
The most common Natural Resources, Construction and Maintenance occupations in Scottsville are Construction & Extraction (11 | 8.5%), and Installation, Maintenance & Repair (3 | 2.3%).
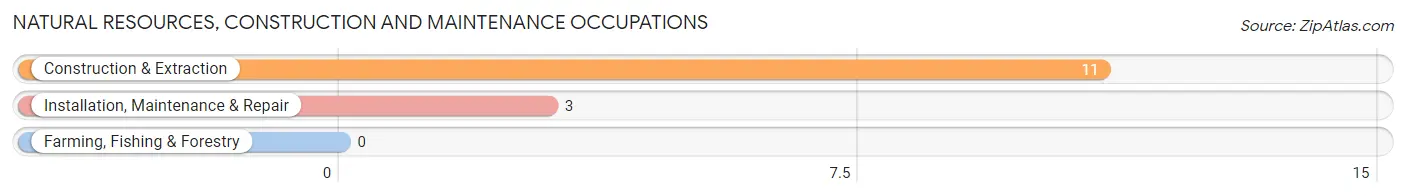
Natural Resources, Construction and Maintenance Occupations by Sex
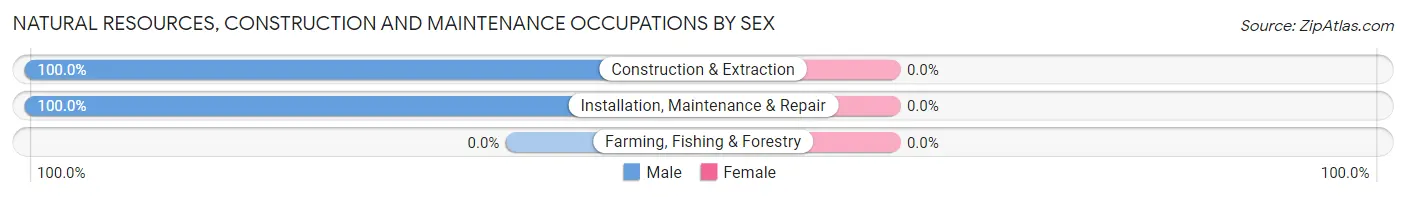
| Occupation | Male | Female |
| Farming, Fishing & Forestry | 0 (0.0%) | 0 (0.0%) |
| Construction & Extraction | 11 (100.0%) | 0 (0.0%) |
| Installation, Maintenance & Repair | 3 (100.0%) | 0 (0.0%) |
| Total (Category) | 14 (100.0%) | 0 (0.0%) |
| Total (Overall) | 74 (56.9%) | 56 (43.1%) |
Production, Transportation and Moving Occupations
The most common Production, Transportation and Moving occupations in Scottsville are Production (11 | 8.5%), Transportation (4 | 3.1%), and Material Moving (4 | 3.1%).
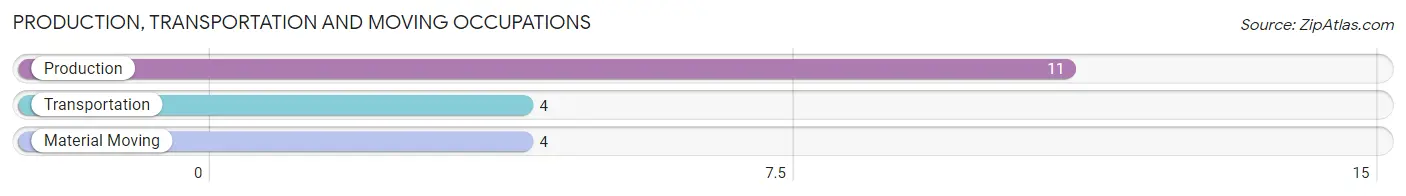
Production, Transportation and Moving Occupations by Sex
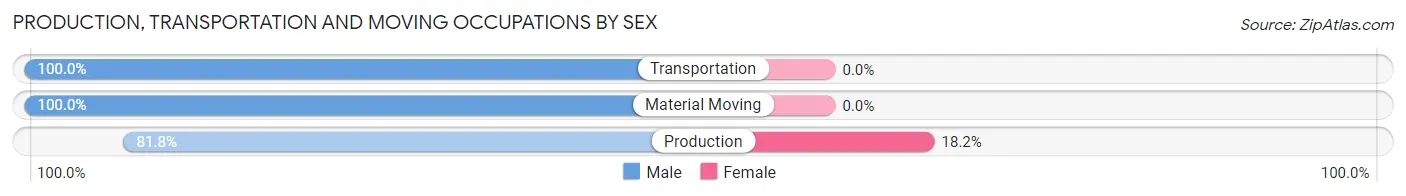
| Occupation | Male | Female |
| Production | 9 (81.8%) | 2 (18.2%) |
| Transportation | 4 (100.0%) | 0 (0.0%) |
| Material Moving | 4 (100.0%) | 0 (0.0%) |
| Total (Category) | 17 (89.5%) | 2 (10.5%) |
| Total (Overall) | 74 (56.9%) | 56 (43.1%) |
Employment Industries by Sex in Scottsville
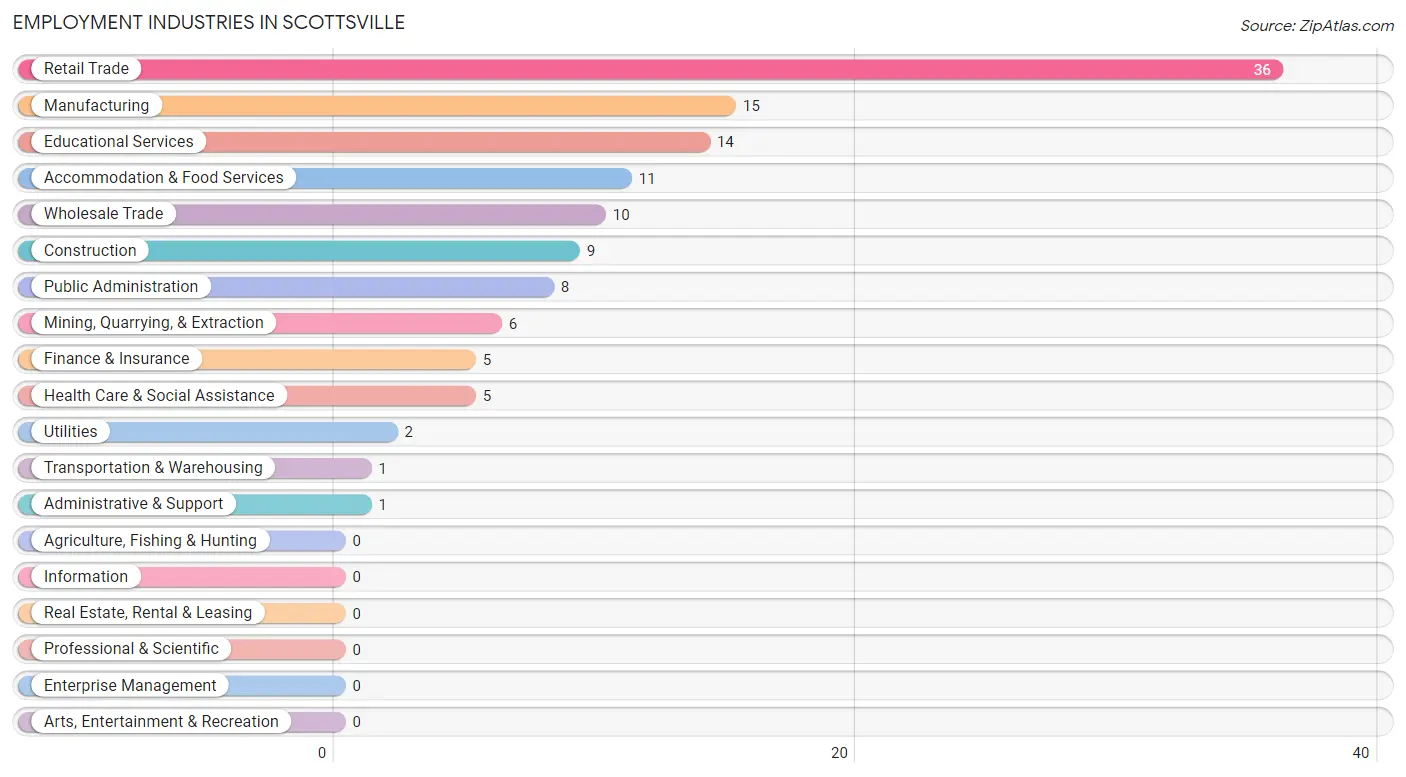
Employment Industries in Scottsville
The major employment industries in Scottsville include Retail Trade (36 | 27.7%), Manufacturing (15 | 11.5%), Educational Services (14 | 10.8%), Accommodation & Food Services (11 | 8.5%), and Wholesale Trade (10 | 7.7%).
Employment Industries by Sex in Scottsville
The Scottsville industries that see more men than women are Mining, Quarrying, & Extraction (100.0%), Construction (100.0%), and Transportation & Warehousing (100.0%), whereas the industries that tend to have a higher number of women are Finance & Insurance (100.0%), Accommodation & Food Services (100.0%), and Educational Services (78.6%).
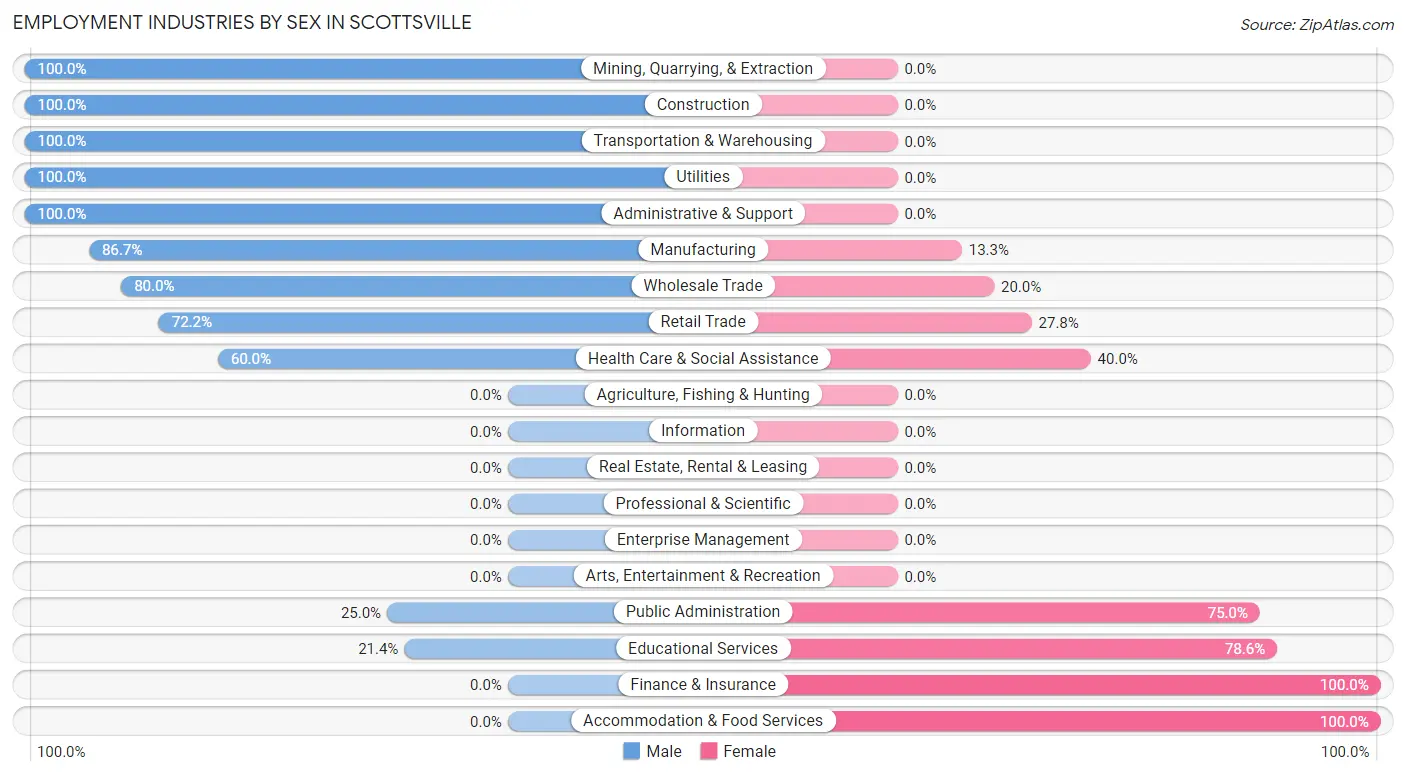
| Industry | Male | Female |
| Agriculture, Fishing & Hunting | 0 (0.0%) | 0 (0.0%) |
| Mining, Quarrying, & Extraction | 6 (100.0%) | 0 (0.0%) |
| Construction | 9 (100.0%) | 0 (0.0%) |
| Manufacturing | 13 (86.7%) | 2 (13.3%) |
| Wholesale Trade | 8 (80.0%) | 2 (20.0%) |
| Retail Trade | 26 (72.2%) | 10 (27.8%) |
| Transportation & Warehousing | 1 (100.0%) | 0 (0.0%) |
| Utilities | 2 (100.0%) | 0 (0.0%) |
| Information | 0 (0.0%) | 0 (0.0%) |
| Finance & Insurance | 0 (0.0%) | 5 (100.0%) |
| Real Estate, Rental & Leasing | 0 (0.0%) | 0 (0.0%) |
| Professional & Scientific | 0 (0.0%) | 0 (0.0%) |
| Enterprise Management | 0 (0.0%) | 0 (0.0%) |
| Administrative & Support | 1 (100.0%) | 0 (0.0%) |
| Educational Services | 3 (21.4%) | 11 (78.6%) |
| Health Care & Social Assistance | 3 (60.0%) | 2 (40.0%) |
| Arts, Entertainment & Recreation | 0 (0.0%) | 0 (0.0%) |
| Accommodation & Food Services | 0 (0.0%) | 11 (100.0%) |
| Public Administration | 2 (25.0%) | 6 (75.0%) |
| Total | 74 (56.9%) | 56 (43.1%) |
Education in Scottsville
School Enrollment in Scottsville
The most common levels of schooling among the 39 students in Scottsville are elementary school (16 | 41.0%), kindergarten (10 | 25.6%), and middle school (7 | 17.9%).
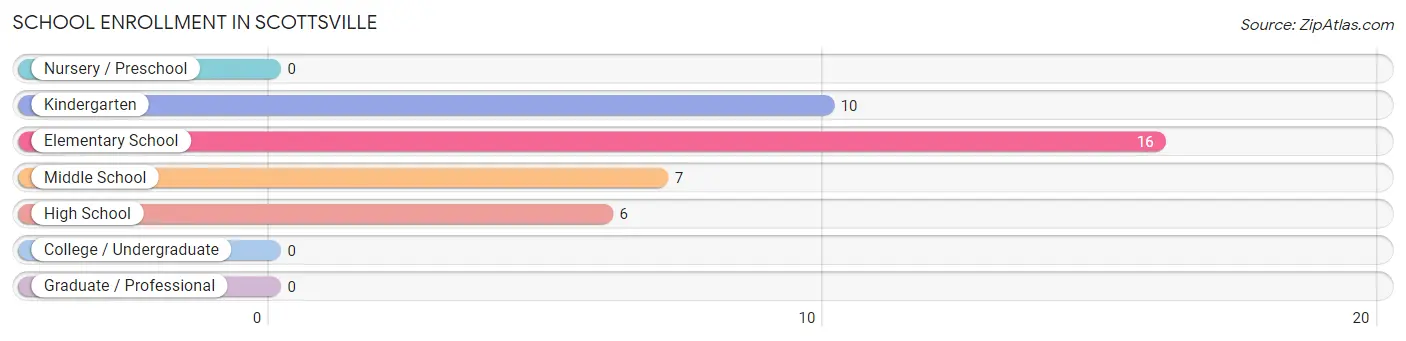
| School Level | # Students | % Students |
| Nursery / Preschool | 0 | 0.0% |
| Kindergarten | 10 | 25.6% |
| Elementary School | 16 | 41.0% |
| Middle School | 7 | 17.9% |
| High School | 6 | 15.4% |
| College / Undergraduate | 0 | 0.0% |
| Graduate / Professional | 0 | 0.0% |
| Total | 39 | 100.0% |
School Enrollment by Age by Funding Source in Scottsville
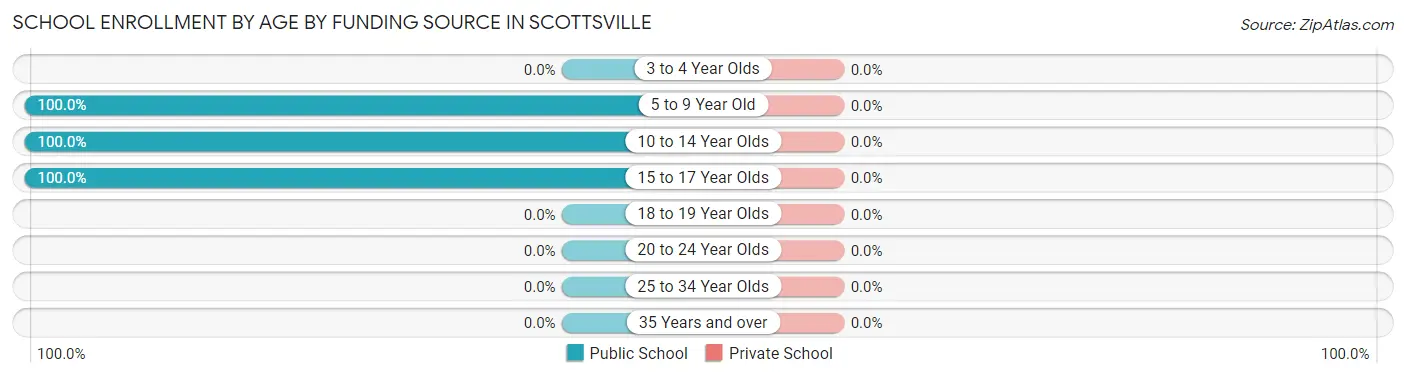
| Age Bracket | Public School | Private School |
| 3 to 4 Year Olds | 0 (0.0%) | 0 (0.0%) |
| 5 to 9 Year Old | 16 (100.0%) | 0 (0.0%) |
| 10 to 14 Year Olds | 17 (100.0%) | 0 (0.0%) |
| 15 to 17 Year Olds | 6 (100.0%) | 0 (0.0%) |
| 18 to 19 Year Olds | 0 (0.0%) | 0 (0.0%) |
| 20 to 24 Year Olds | 0 (0.0%) | 0 (0.0%) |
| 25 to 34 Year Olds | 0 (0.0%) | 0 (0.0%) |
| 35 Years and over | 0 (0.0%) | 0 (0.0%) |
| Total | 39 (100.0%) | 0 (0.0%) |
Educational Attainment by Field of Study in Scottsville
Business (13 | 54.2%), education (6 | 25.0%), bio, nature & agricultural (2 | 8.3%), arts & humanities (2 | 8.3%), and psychology (1 | 4.2%) are the most common fields of study among 24 individuals in Scottsville who have obtained a bachelor's degree or higher.
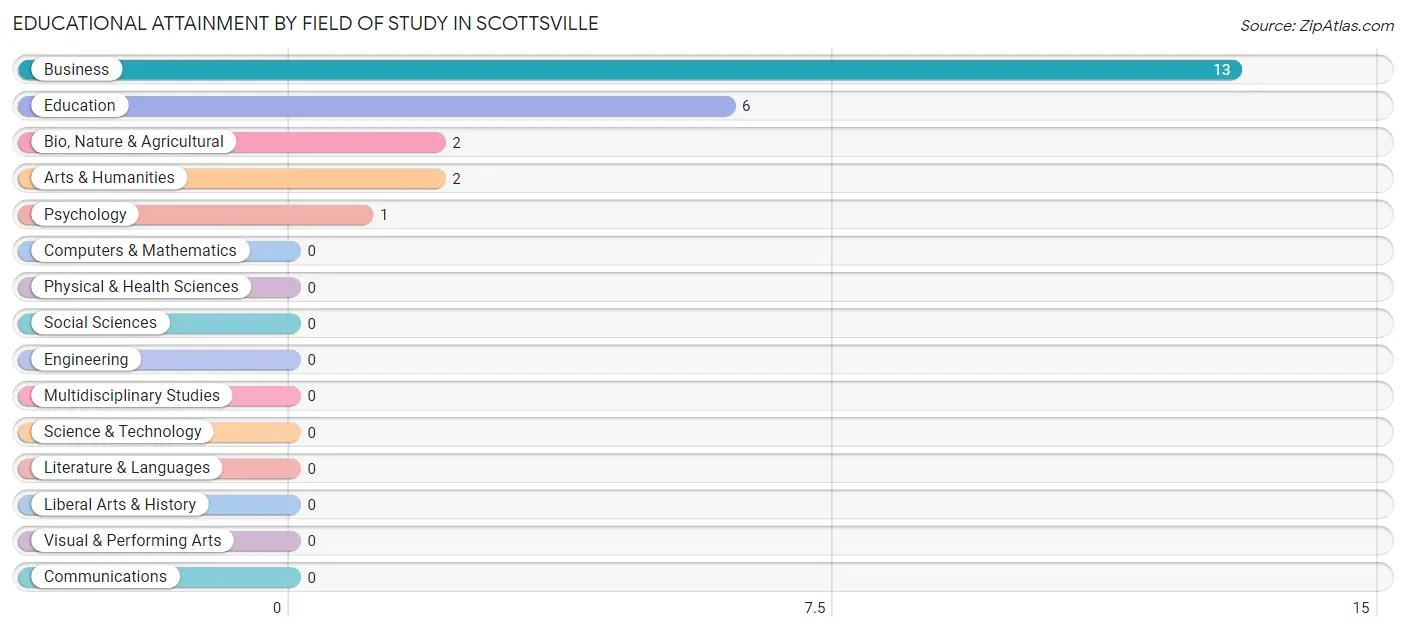
| Field of Study | # Graduates | % Graduates |
| Computers & Mathematics | 0 | 0.0% |
| Bio, Nature & Agricultural | 2 | 8.3% |
| Physical & Health Sciences | 0 | 0.0% |
| Psychology | 1 | 4.2% |
| Social Sciences | 0 | 0.0% |
| Engineering | 0 | 0.0% |
| Multidisciplinary Studies | 0 | 0.0% |
| Science & Technology | 0 | 0.0% |
| Business | 13 | 54.2% |
| Education | 6 | 25.0% |
| Literature & Languages | 0 | 0.0% |
| Liberal Arts & History | 0 | 0.0% |
| Visual & Performing Arts | 0 | 0.0% |
| Communications | 0 | 0.0% |
| Arts & Humanities | 2 | 8.3% |
| Total | 24 | 100.0% |
Transportation & Commute in Scottsville
Vehicle Availability by Sex in Scottsville
The most prevalent vehicle ownership categories in Scottsville are males with 2 vehicles (45, accounting for 60.8%) and females with 2 vehicles (26, making up 80.4%).
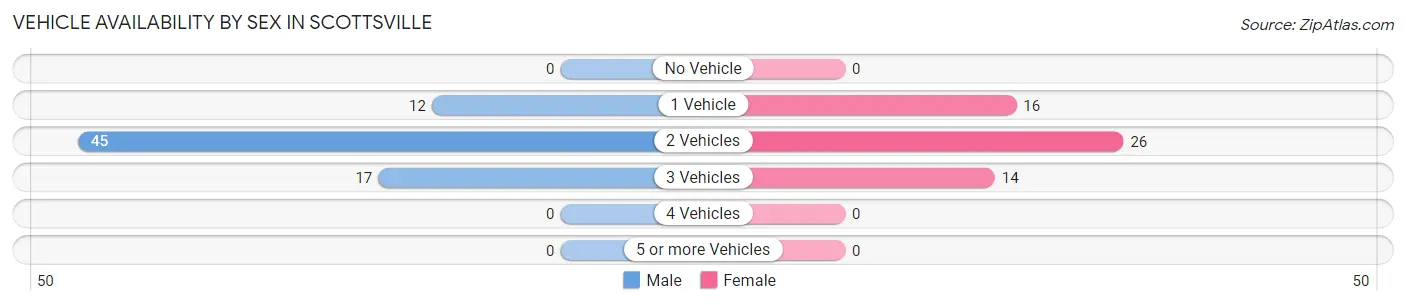
| Vehicles Available | Male | Female |
| No Vehicle | 0 (0.0%) | 0 (0.0%) |
| 1 Vehicle | 12 (16.2%) | 16 (28.6%) |
| 2 Vehicles | 45 (60.8%) | 26 (46.4%) |
| 3 Vehicles | 17 (23.0%) | 14 (25.0%) |
| 4 Vehicles | 0 (0.0%) | 0 (0.0%) |
| 5 or more Vehicles | 0 (0.0%) | 0 (0.0%) |
| Total | 74 (100.0%) | 56 (100.0%) |
Commute Time in Scottsville
The most frequently occuring commute durations in Scottsville are 15 to 19 minutes (40 commuters, 31.2%), 10 to 14 minutes (26 commuters, 20.3%), and 30 to 34 minutes (15 commuters, 11.7%).

| Commute Time | # Commuters | % Commuters |
| Less than 5 Minutes | 2 | 1.6% |
| 5 to 9 Minutes | 14 | 10.9% |
| 10 to 14 Minutes | 26 | 20.3% |
| 15 to 19 Minutes | 40 | 31.2% |
| 20 to 24 Minutes | 9 | 7.0% |
| 25 to 29 Minutes | 9 | 7.0% |
| 30 to 34 Minutes | 15 | 11.7% |
| 35 to 39 Minutes | 0 | 0.0% |
| 40 to 44 Minutes | 6 | 4.7% |
| 45 to 59 Minutes | 3 | 2.3% |
| 60 to 89 Minutes | 4 | 3.1% |
| 90 or more Minutes | 0 | 0.0% |
Commute Time by Sex in Scottsville
The most common commute times in Scottsville are 15 to 19 minutes (29 commuters, 39.2%) for males and 10 to 14 minutes (16 commuters, 29.6%) for females.
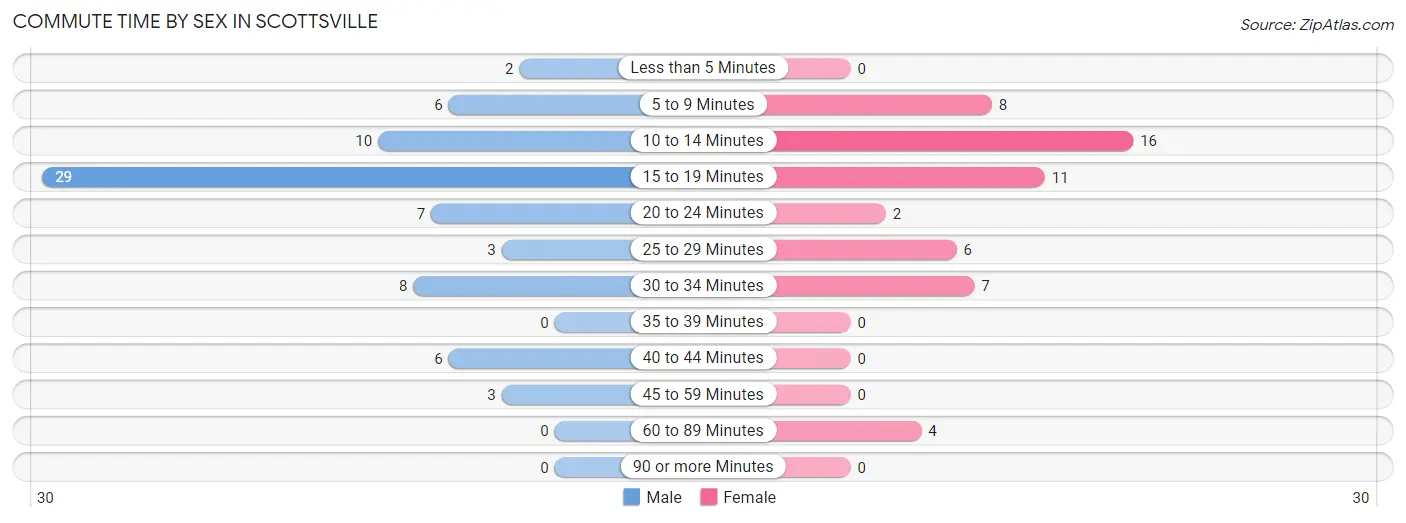
| Commute Time | Male | Female |
| Less than 5 Minutes | 2 (2.7%) | 0 (0.0%) |
| 5 to 9 Minutes | 6 (8.1%) | 8 (14.8%) |
| 10 to 14 Minutes | 10 (13.5%) | 16 (29.6%) |
| 15 to 19 Minutes | 29 (39.2%) | 11 (20.4%) |
| 20 to 24 Minutes | 7 (9.5%) | 2 (3.7%) |
| 25 to 29 Minutes | 3 (4.1%) | 6 (11.1%) |
| 30 to 34 Minutes | 8 (10.8%) | 7 (13.0%) |
| 35 to 39 Minutes | 0 (0.0%) | 0 (0.0%) |
| 40 to 44 Minutes | 6 (8.1%) | 0 (0.0%) |
| 45 to 59 Minutes | 3 (4.1%) | 0 (0.0%) |
| 60 to 89 Minutes | 0 (0.0%) | 4 (7.4%) |
| 90 or more Minutes | 0 (0.0%) | 0 (0.0%) |
Time of Departure to Work by Sex in Scottsville
The most frequent times of departure to work in Scottsville are 8:30 AM to 8:59 AM (19, 25.7%) for males and 6:30 AM to 6:59 AM (14, 25.9%) for females.
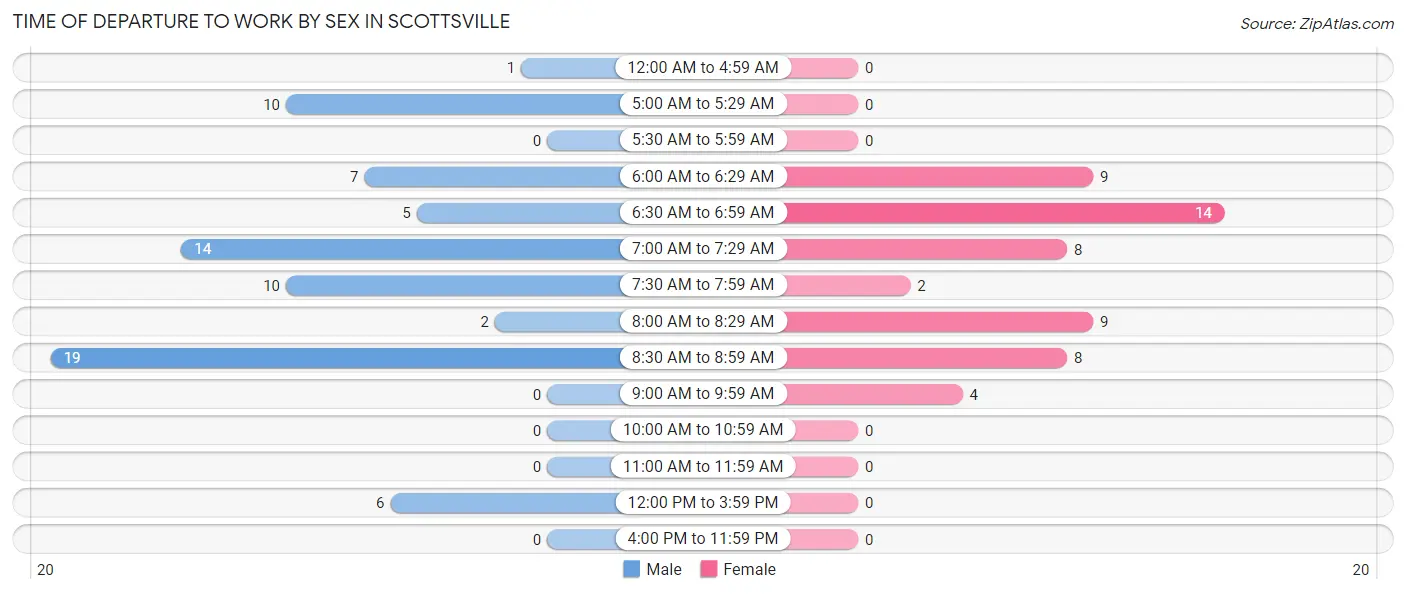
| Time of Departure | Male | Female |
| 12:00 AM to 4:59 AM | 1 (1.3%) | 0 (0.0%) |
| 5:00 AM to 5:29 AM | 10 (13.5%) | 0 (0.0%) |
| 5:30 AM to 5:59 AM | 0 (0.0%) | 0 (0.0%) |
| 6:00 AM to 6:29 AM | 7 (9.5%) | 9 (16.7%) |
| 6:30 AM to 6:59 AM | 5 (6.8%) | 14 (25.9%) |
| 7:00 AM to 7:29 AM | 14 (18.9%) | 8 (14.8%) |
| 7:30 AM to 7:59 AM | 10 (13.5%) | 2 (3.7%) |
| 8:00 AM to 8:29 AM | 2 (2.7%) | 9 (16.7%) |
| 8:30 AM to 8:59 AM | 19 (25.7%) | 8 (14.8%) |
| 9:00 AM to 9:59 AM | 0 (0.0%) | 4 (7.4%) |
| 10:00 AM to 10:59 AM | 0 (0.0%) | 0 (0.0%) |
| 11:00 AM to 11:59 AM | 0 (0.0%) | 0 (0.0%) |
| 12:00 PM to 3:59 PM | 6 (8.1%) | 0 (0.0%) |
| 4:00 PM to 11:59 PM | 0 (0.0%) | 0 (0.0%) |
| Total | 74 (100.0%) | 54 (100.0%) |
Housing Occupancy in Scottsville
Occupancy by Ownership in Scottsville
Of the total 118 dwellings in Scottsville, owner-occupied units account for 109 (92.4%), while renter-occupied units make up 9 (7.6%).
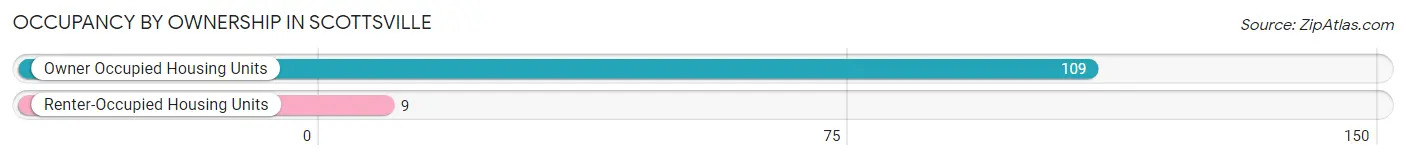
| Occupancy | # Housing Units | % Housing Units |
| Owner Occupied Housing Units | 109 | 92.4% |
| Renter-Occupied Housing Units | 9 | 7.6% |
| Total Occupied Housing Units | 118 | 100.0% |
Occupancy by Household Size in Scottsville
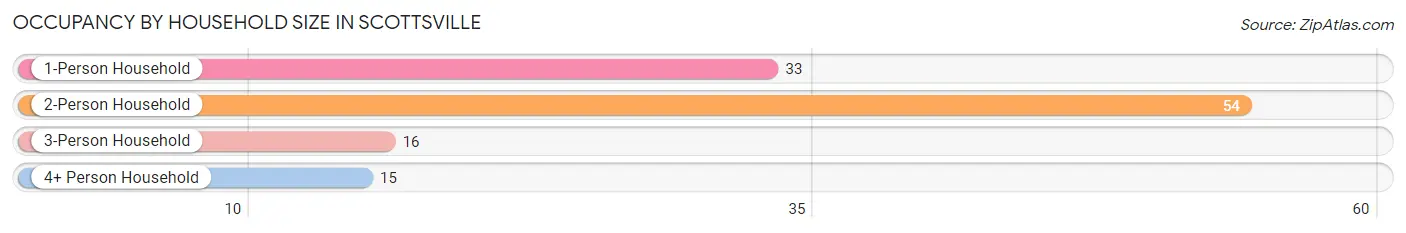
| Household Size | # Housing Units | % Housing Units |
| 1-Person Household | 33 | 28.0% |
| 2-Person Household | 54 | 45.8% |
| 3-Person Household | 16 | 13.6% |
| 4+ Person Household | 15 | 12.7% |
| Total Housing Units | 118 | 100.0% |
Occupancy by Ownership by Household Size in Scottsville
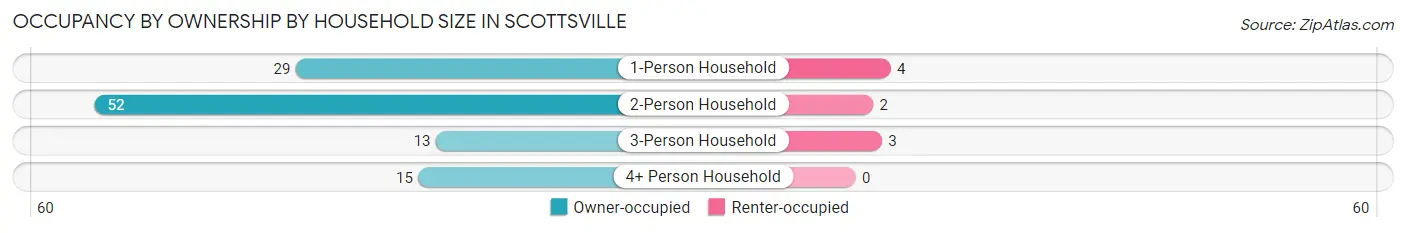
| Household Size | Owner-occupied | Renter-occupied |
| 1-Person Household | 29 (87.9%) | 4 (12.1%) |
| 2-Person Household | 52 (96.3%) | 2 (3.7%) |
| 3-Person Household | 13 (81.2%) | 3 (18.8%) |
| 4+ Person Household | 15 (100.0%) | 0 (0.0%) |
| Total Housing Units | 109 (92.4%) | 9 (7.6%) |
Occupancy by Educational Attainment in Scottsville
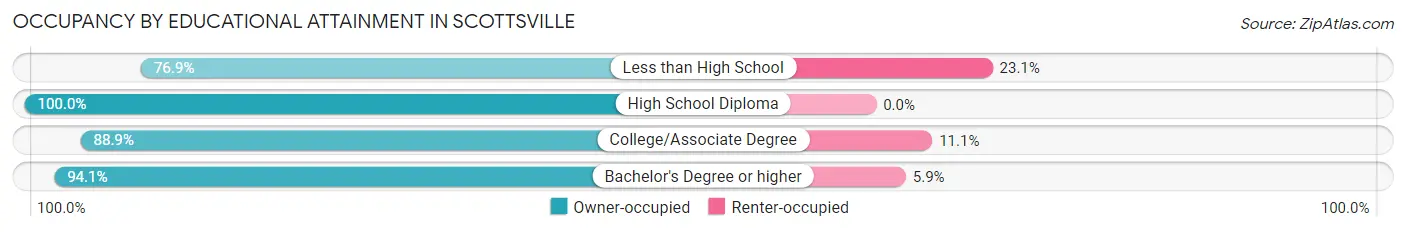
| Household Size | Owner-occupied | Renter-occupied |
| Less than High School | 10 (76.9%) | 3 (23.1%) |
| High School Diploma | 43 (100.0%) | 0 (0.0%) |
| College/Associate Degree | 40 (88.9%) | 5 (11.1%) |
| Bachelor's Degree or higher | 16 (94.1%) | 1 (5.9%) |
Occupancy by Age of Householder in Scottsville
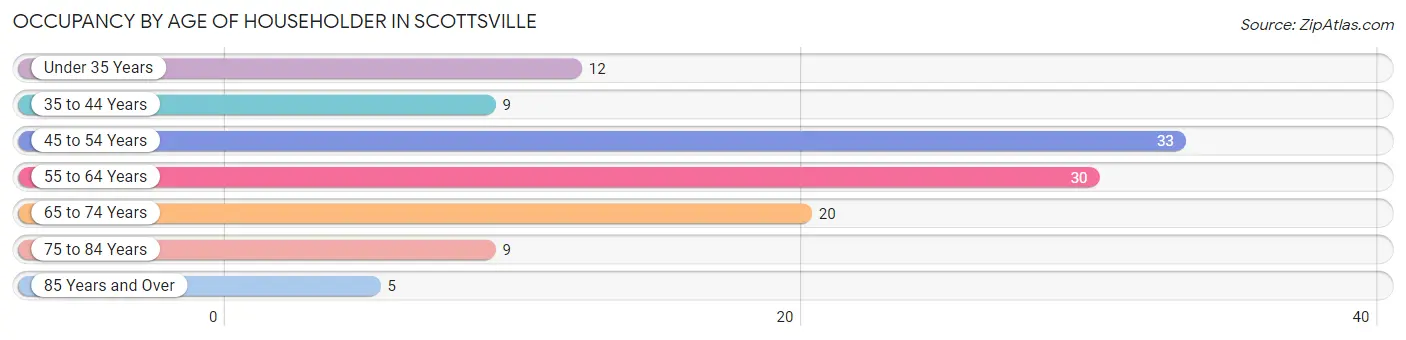
| Age Bracket | # Households | % Households |
| Under 35 Years | 12 | 10.2% |
| 35 to 44 Years | 9 | 7.6% |
| 45 to 54 Years | 33 | 28.0% |
| 55 to 64 Years | 30 | 25.4% |
| 65 to 74 Years | 20 | 17.0% |
| 75 to 84 Years | 9 | 7.6% |
| 85 Years and Over | 5 | 4.2% |
| Total | 118 | 100.0% |
Housing Finances in Scottsville
Median Income by Occupancy in Scottsville
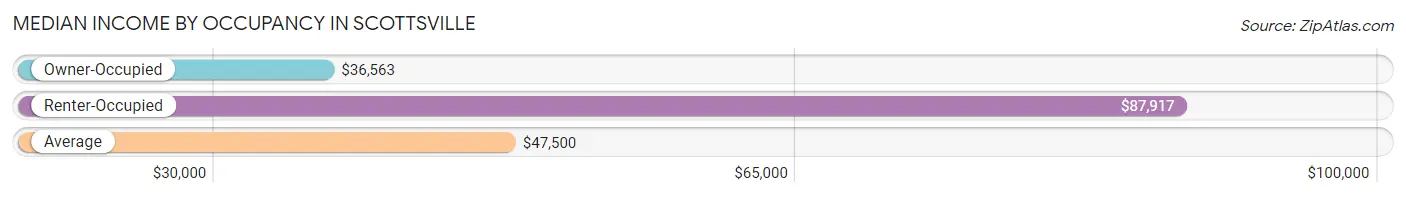
| Occupancy Type | # Households | Median Income |
| Owner-Occupied | 109 (92.4%) | $36,563 |
| Renter-Occupied | 9 (7.6%) | $87,917 |
| Average | 118 (100.0%) | $47,500 |
Occupancy by Householder Income Bracket in Scottsville
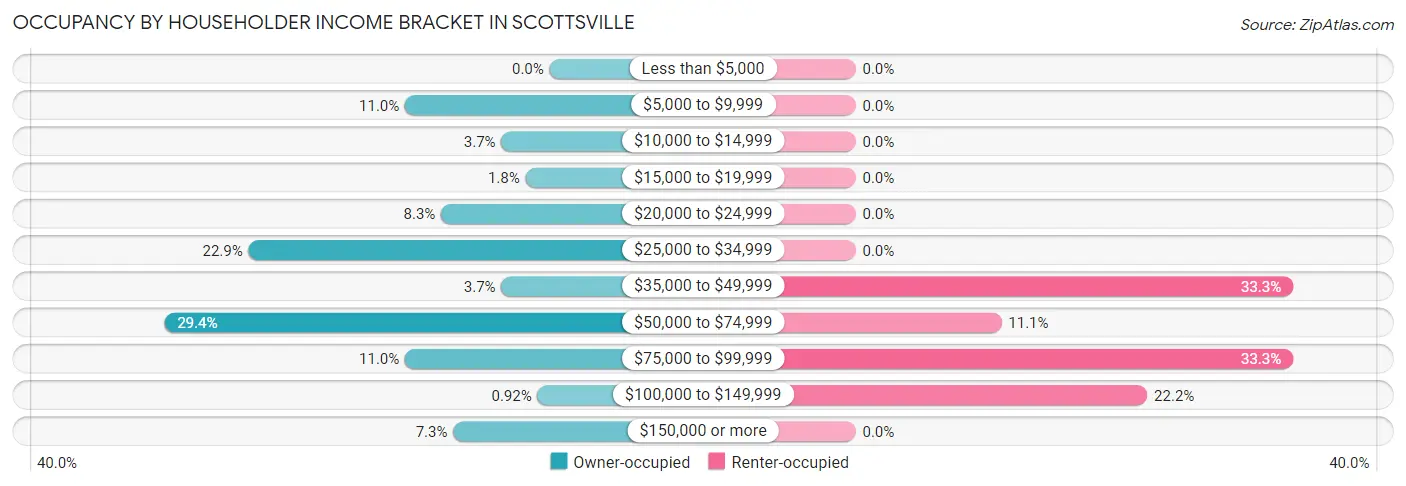
| Income Bracket | Owner-occupied | Renter-occupied |
| Less than $5,000 | 0 (0.0%) | 0 (0.0%) |
| $5,000 to $9,999 | 12 (11.0%) | 0 (0.0%) |
| $10,000 to $14,999 | 4 (3.7%) | 0 (0.0%) |
| $15,000 to $19,999 | 2 (1.8%) | 0 (0.0%) |
| $20,000 to $24,999 | 9 (8.3%) | 0 (0.0%) |
| $25,000 to $34,999 | 25 (22.9%) | 0 (0.0%) |
| $35,000 to $49,999 | 4 (3.7%) | 3 (33.3%) |
| $50,000 to $74,999 | 32 (29.4%) | 1 (11.1%) |
| $75,000 to $99,999 | 12 (11.0%) | 3 (33.3%) |
| $100,000 to $149,999 | 1 (0.9%) | 2 (22.2%) |
| $150,000 or more | 8 (7.3%) | 0 (0.0%) |
| Total | 109 (100.0%) | 9 (100.0%) |
Monthly Housing Cost Tiers in Scottsville
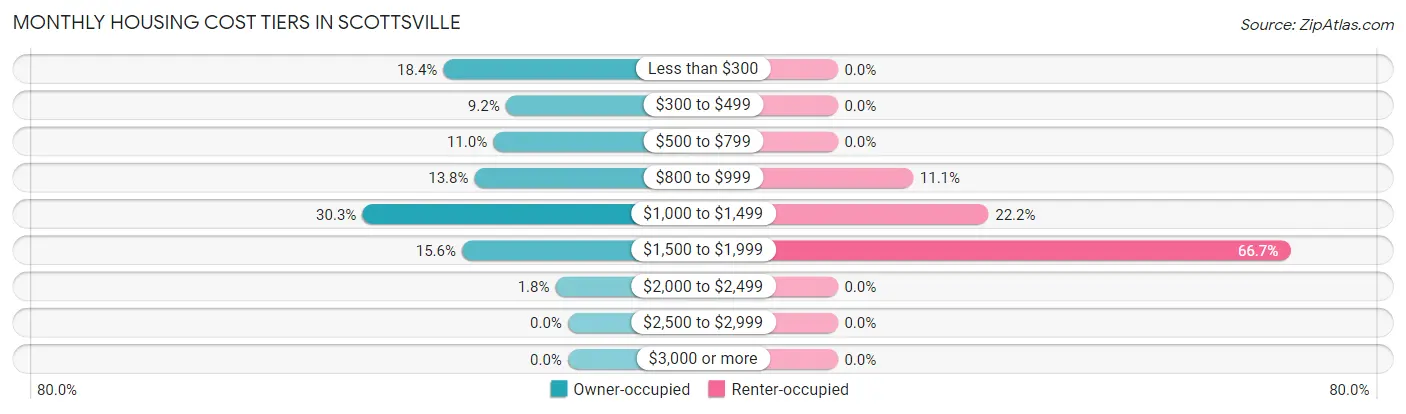
| Monthly Cost | Owner-occupied | Renter-occupied |
| Less than $300 | 20 (18.3%) | 0 (0.0%) |
| $300 to $499 | 10 (9.2%) | 0 (0.0%) |
| $500 to $799 | 12 (11.0%) | 0 (0.0%) |
| $800 to $999 | 15 (13.8%) | 1 (11.1%) |
| $1,000 to $1,499 | 33 (30.3%) | 2 (22.2%) |
| $1,500 to $1,999 | 17 (15.6%) | 6 (66.7%) |
| $2,000 to $2,499 | 2 (1.8%) | 0 (0.0%) |
| $2,500 to $2,999 | 0 (0.0%) | 0 (0.0%) |
| $3,000 or more | 0 (0.0%) | 0 (0.0%) |
| Total | 109 (100.0%) | 9 (100.0%) |
Physical Housing Characteristics in Scottsville
Housing Structures in Scottsville
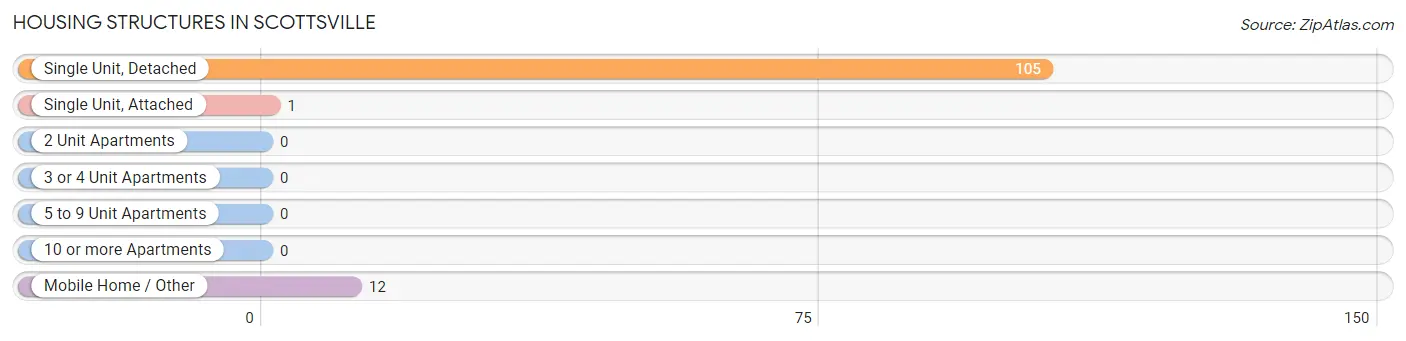
| Structure Type | # Housing Units | % Housing Units |
| Single Unit, Detached | 105 | 89.0% |
| Single Unit, Attached | 1 | 0.9% |
| 2 Unit Apartments | 0 | 0.0% |
| 3 or 4 Unit Apartments | 0 | 0.0% |
| 5 to 9 Unit Apartments | 0 | 0.0% |
| 10 or more Apartments | 0 | 0.0% |
| Mobile Home / Other | 12 | 10.2% |
| Total | 118 | 100.0% |
Housing Structures by Occupancy in Scottsville
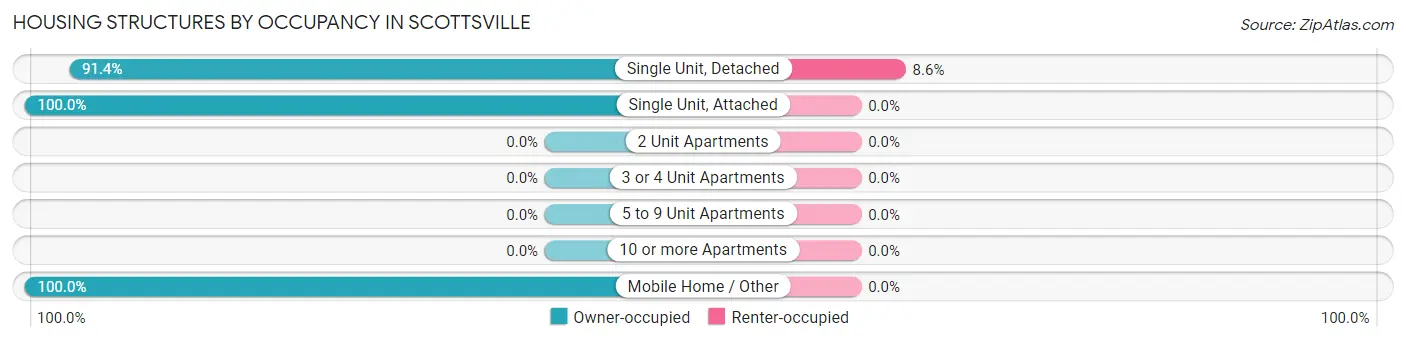
| Structure Type | Owner-occupied | Renter-occupied |
| Single Unit, Detached | 96 (91.4%) | 9 (8.6%) |
| Single Unit, Attached | 1 (100.0%) | 0 (0.0%) |
| 2 Unit Apartments | 0 (0.0%) | 0 (0.0%) |
| 3 or 4 Unit Apartments | 0 (0.0%) | 0 (0.0%) |
| 5 to 9 Unit Apartments | 0 (0.0%) | 0 (0.0%) |
| 10 or more Apartments | 0 (0.0%) | 0 (0.0%) |
| Mobile Home / Other | 12 (100.0%) | 0 (0.0%) |
| Total | 109 (92.4%) | 9 (7.6%) |
Housing Structures by Number of Rooms in Scottsville
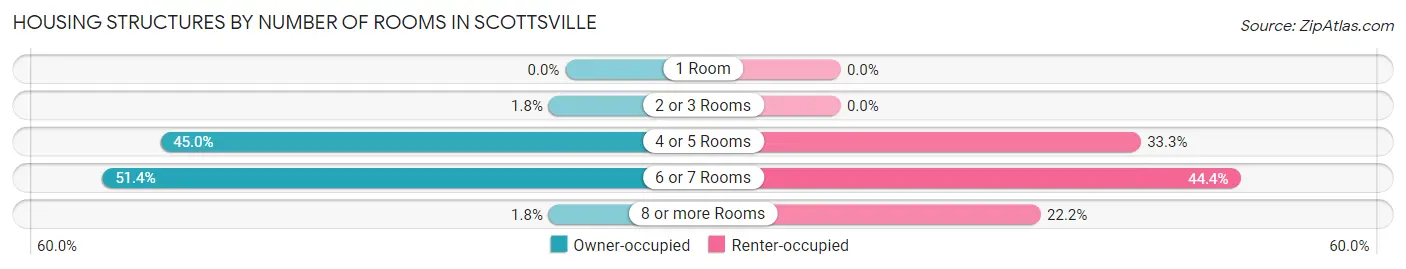
| Number of Rooms | Owner-occupied | Renter-occupied |
| 1 Room | 0 (0.0%) | 0 (0.0%) |
| 2 or 3 Rooms | 2 (1.8%) | 0 (0.0%) |
| 4 or 5 Rooms | 49 (45.0%) | 3 (33.3%) |
| 6 or 7 Rooms | 56 (51.4%) | 4 (44.4%) |
| 8 or more Rooms | 2 (1.8%) | 2 (22.2%) |
| Total | 109 (100.0%) | 9 (100.0%) |
Housing Structure by Heating Type in Scottsville
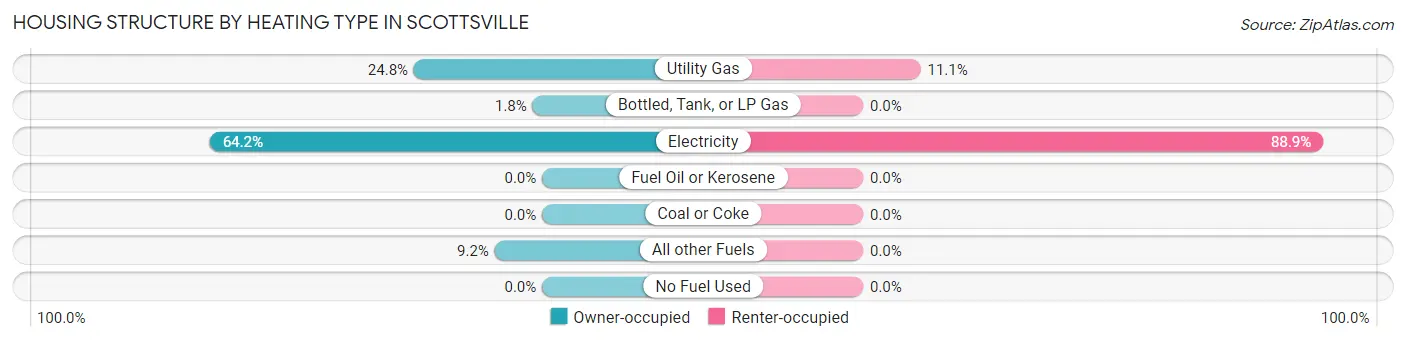
| Heating Type | Owner-occupied | Renter-occupied |
| Utility Gas | 27 (24.8%) | 1 (11.1%) |
| Bottled, Tank, or LP Gas | 2 (1.8%) | 0 (0.0%) |
| Electricity | 70 (64.2%) | 8 (88.9%) |
| Fuel Oil or Kerosene | 0 (0.0%) | 0 (0.0%) |
| Coal or Coke | 0 (0.0%) | 0 (0.0%) |
| All other Fuels | 10 (9.2%) | 0 (0.0%) |
| No Fuel Used | 0 (0.0%) | 0 (0.0%) |
| Total | 109 (100.0%) | 9 (100.0%) |
Household Vehicle Usage in Scottsville
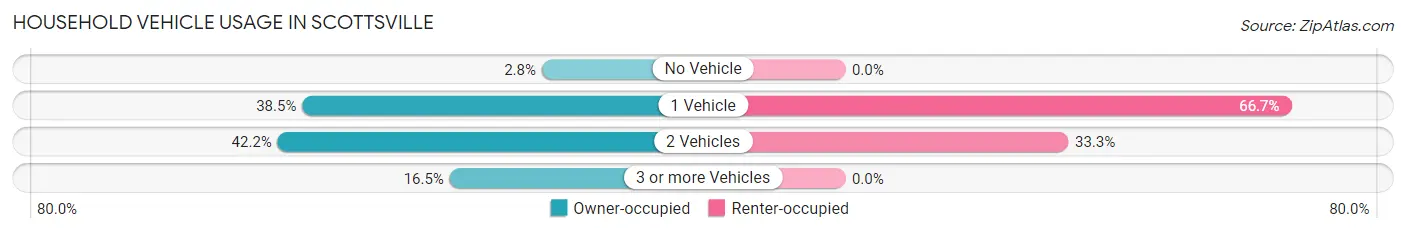
| Vehicles per Household | Owner-occupied | Renter-occupied |
| No Vehicle | 3 (2.8%) | 0 (0.0%) |
| 1 Vehicle | 42 (38.5%) | 6 (66.7%) |
| 2 Vehicles | 46 (42.2%) | 3 (33.3%) |
| 3 or more Vehicles | 18 (16.5%) | 0 (0.0%) |
| Total | 109 (100.0%) | 9 (100.0%) |
Real Estate & Mortgages in Scottsville
Real Estate and Mortgage Overview in Scottsville
| Characteristic | Without Mortgage | With Mortgage |
| Housing Units | 51 | 58 |
| Median Property Value | $118,800 | $182,100 |
| Median Household Income | $34,732 | $5 |
| Monthly Housing Costs | $444 | $0 |
| Real Estate Taxes | $1,045 | $7 |
Property Value by Mortgage Status in Scottsville
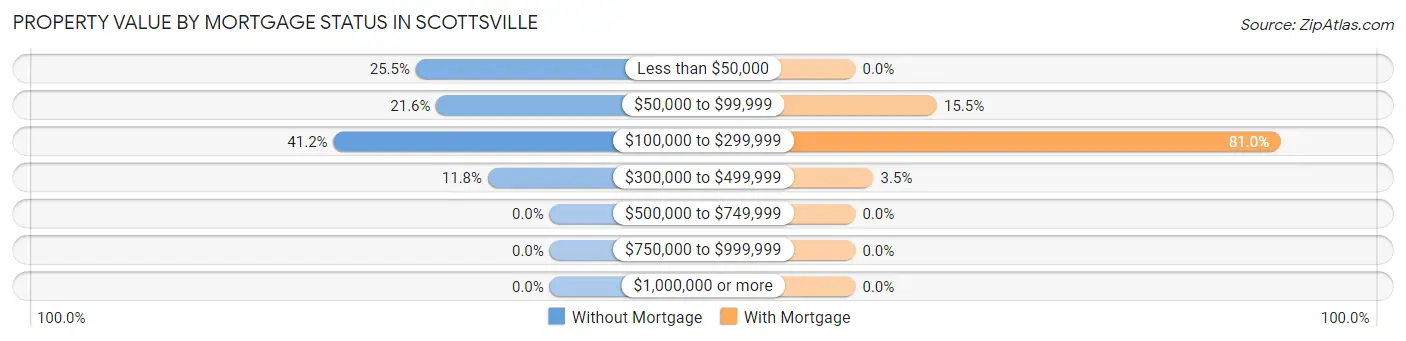
| Property Value | Without Mortgage | With Mortgage |
| Less than $50,000 | 13 (25.5%) | 0 (0.0%) |
| $50,000 to $99,999 | 11 (21.6%) | 9 (15.5%) |
| $100,000 to $299,999 | 21 (41.2%) | 47 (81.0%) |
| $300,000 to $499,999 | 6 (11.8%) | 2 (3.5%) |
| $500,000 to $749,999 | 0 (0.0%) | 0 (0.0%) |
| $750,000 to $999,999 | 0 (0.0%) | 0 (0.0%) |
| $1,000,000 or more | 0 (0.0%) | 0 (0.0%) |
| Total | 51 (100.0%) | 58 (100.0%) |
Household Income by Mortgage Status in Scottsville
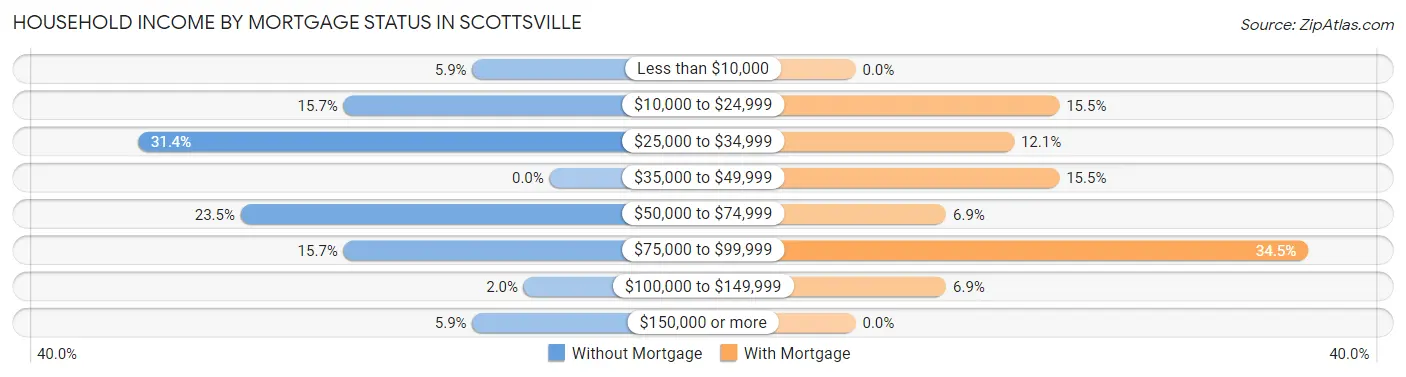
| Household Income | Without Mortgage | With Mortgage |
| Less than $10,000 | 3 (5.9%) | 0 (0.0%) |
| $10,000 to $24,999 | 8 (15.7%) | 9 (15.5%) |
| $25,000 to $34,999 | 16 (31.4%) | 7 (12.1%) |
| $35,000 to $49,999 | 0 (0.0%) | 9 (15.5%) |
| $50,000 to $74,999 | 12 (23.5%) | 4 (6.9%) |
| $75,000 to $99,999 | 8 (15.7%) | 20 (34.5%) |
| $100,000 to $149,999 | 1 (2.0%) | 4 (6.9%) |
| $150,000 or more | 3 (5.9%) | 0 (0.0%) |
| Total | 51 (100.0%) | 58 (100.0%) |
Property Value to Household Income Ratio in Scottsville
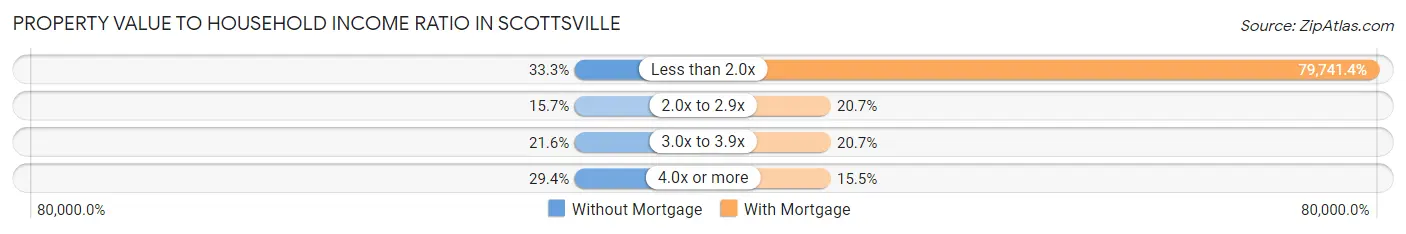
| Value-to-Income Ratio | Without Mortgage | With Mortgage |
| Less than 2.0x | 17 (33.3%) | 46,250 (79,741.4%) |
| 2.0x to 2.9x | 8 (15.7%) | 12 (20.7%) |
| 3.0x to 3.9x | 11 (21.6%) | 12 (20.7%) |
| 4.0x or more | 15 (29.4%) | 9 (15.5%) |
| Total | 51 (100.0%) | 58 (100.0%) |
Real Estate Taxes by Mortgage Status in Scottsville
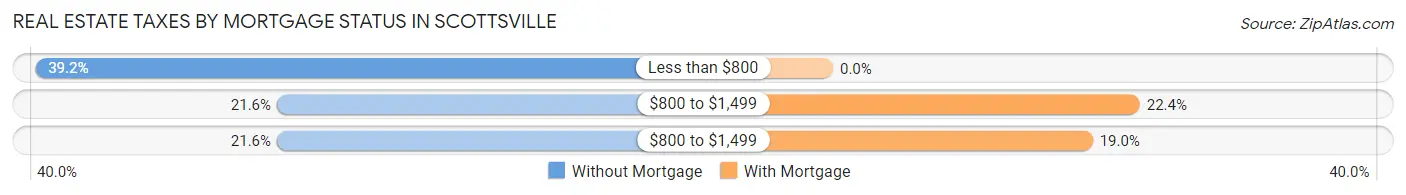
| Property Taxes | Without Mortgage | With Mortgage |
| Less than $800 | 20 (39.2%) | 0 (0.0%) |
| $800 to $1,499 | 11 (21.6%) | 13 (22.4%) |
| $800 to $1,499 | 11 (21.6%) | 11 (19.0%) |
| Total | 51 (100.0%) | 58 (100.0%) |
Health & Disability in Scottsville
Health Insurance Coverage by Age in Scottsville
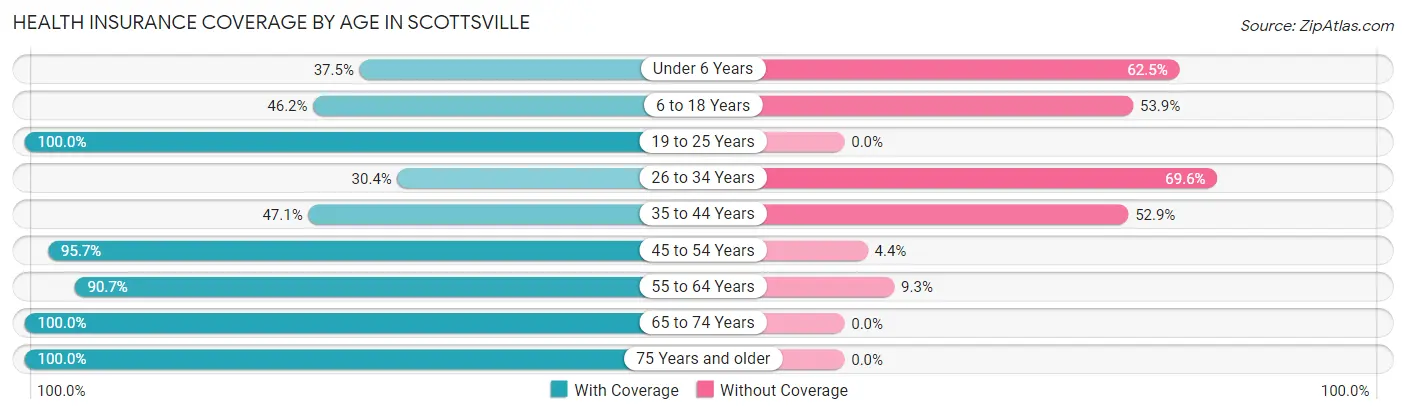
| Age Bracket | With Coverage | Without Coverage |
| Under 6 Years | 6 (37.5%) | 10 (62.5%) |
| 6 to 18 Years | 18 (46.2%) | 21 (53.8%) |
| 19 to 25 Years | 29 (100.0%) | 0 (0.0%) |
| 26 to 34 Years | 7 (30.4%) | 16 (69.6%) |
| 35 to 44 Years | 8 (47.1%) | 9 (52.9%) |
| 45 to 54 Years | 44 (95.7%) | 2 (4.3%) |
| 55 to 64 Years | 39 (90.7%) | 4 (9.3%) |
| 65 to 74 Years | 42 (100.0%) | 0 (0.0%) |
| 75 Years and older | 24 (100.0%) | 0 (0.0%) |
| Total | 217 (77.8%) | 62 (22.2%) |
Health Insurance Coverage by Citizenship Status in Scottsville
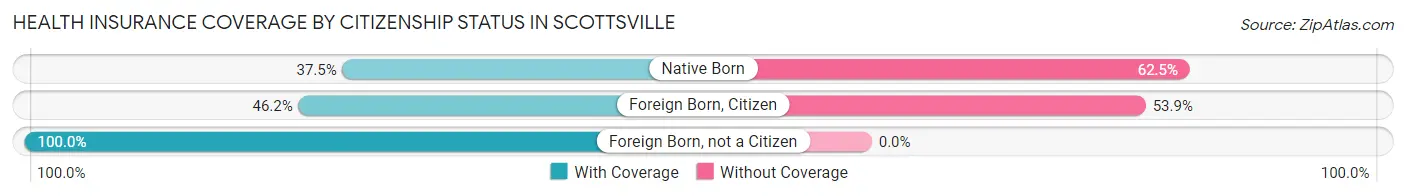
| Citizenship Status | With Coverage | Without Coverage |
| Native Born | 6 (37.5%) | 10 (62.5%) |
| Foreign Born, Citizen | 18 (46.2%) | 21 (53.8%) |
| Foreign Born, not a Citizen | 29 (100.0%) | 0 (0.0%) |
Health Insurance Coverage by Household Income in Scottsville
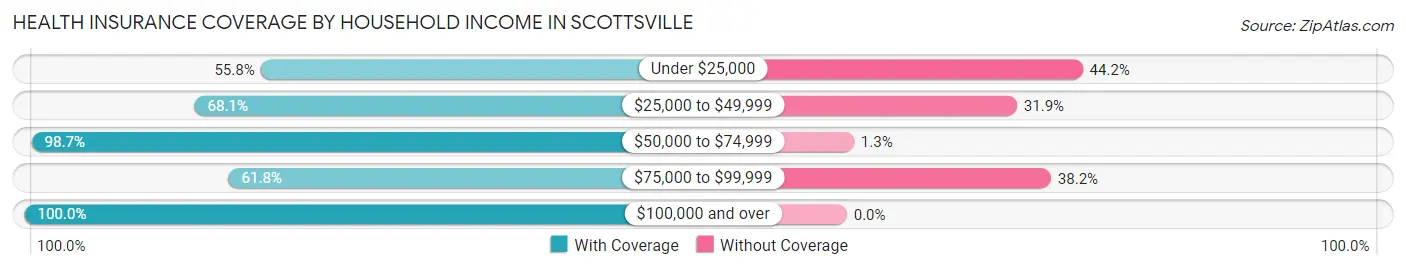
| Household Income | With Coverage | Without Coverage |
| Under $25,000 | 24 (55.8%) | 19 (44.2%) |
| $25,000 to $49,999 | 62 (68.1%) | 29 (31.9%) |
| $50,000 to $74,999 | 74 (98.7%) | 1 (1.3%) |
| $75,000 to $99,999 | 21 (61.8%) | 13 (38.2%) |
| $100,000 and over | 35 (100.0%) | 0 (0.0%) |
Public vs Private Health Insurance Coverage by Age in Scottsville
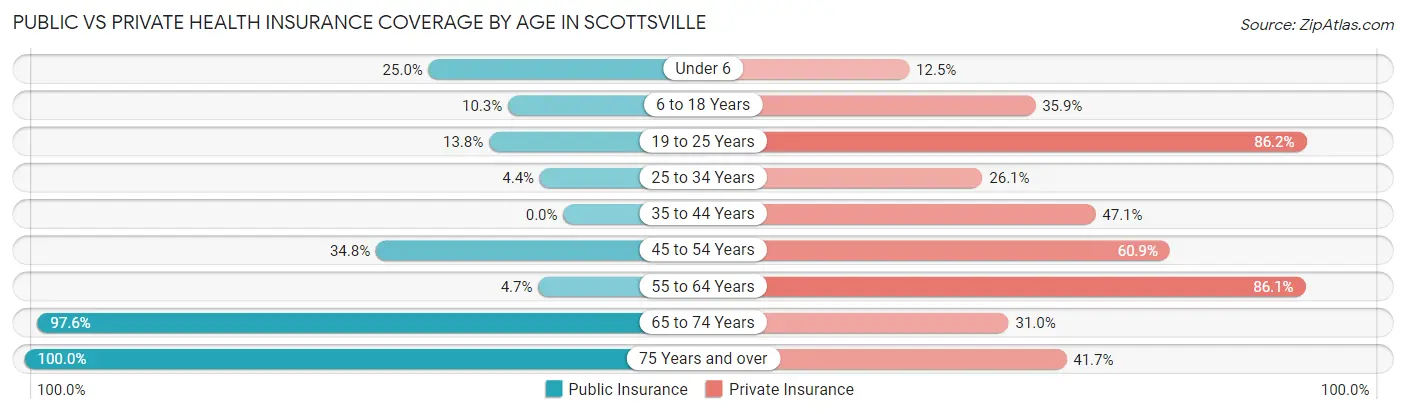
| Age Bracket | Public Insurance | Private Insurance |
| Under 6 | 4 (25.0%) | 2 (12.5%) |
| 6 to 18 Years | 4 (10.3%) | 14 (35.9%) |
| 19 to 25 Years | 4 (13.8%) | 25 (86.2%) |
| 25 to 34 Years | 1 (4.3%) | 6 (26.1%) |
| 35 to 44 Years | 0 (0.0%) | 8 (47.1%) |
| 45 to 54 Years | 16 (34.8%) | 28 (60.9%) |
| 55 to 64 Years | 2 (4.6%) | 37 (86.1%) |
| 65 to 74 Years | 41 (97.6%) | 13 (30.9%) |
| 75 Years and over | 24 (100.0%) | 10 (41.7%) |
| Total | 96 (34.4%) | 143 (51.2%) |
Disability Status by Sex by Age in Scottsville
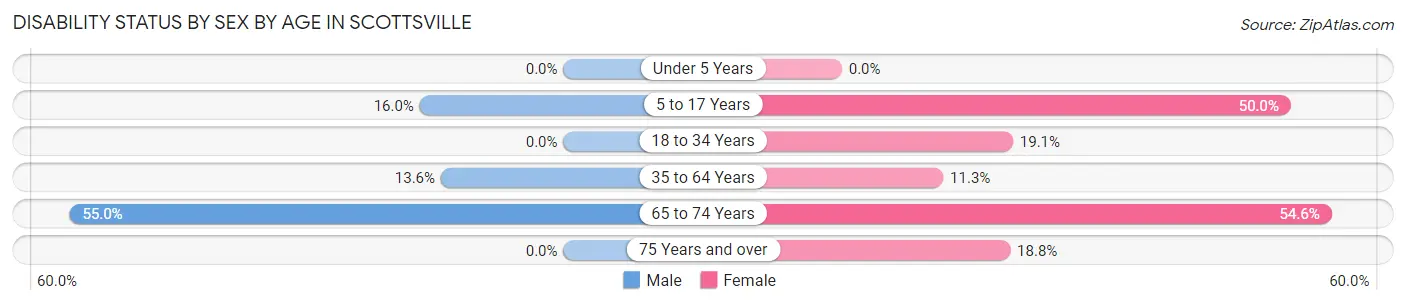
| Age Bracket | Male | Female |
| Under 5 Years | 0 (0.0%) | 0 (0.0%) |
| 5 to 17 Years | 4 (16.0%) | 7 (50.0%) |
| 18 to 34 Years | 0 (0.0%) | 4 (19.1%) |
| 35 to 64 Years | 6 (13.6%) | 7 (11.3%) |
| 65 to 74 Years | 11 (55.0%) | 12 (54.5%) |
| 75 Years and over | 0 (0.0%) | 3 (18.8%) |
Disability Class by Sex by Age in Scottsville
Disability Class: Hearing Difficulty
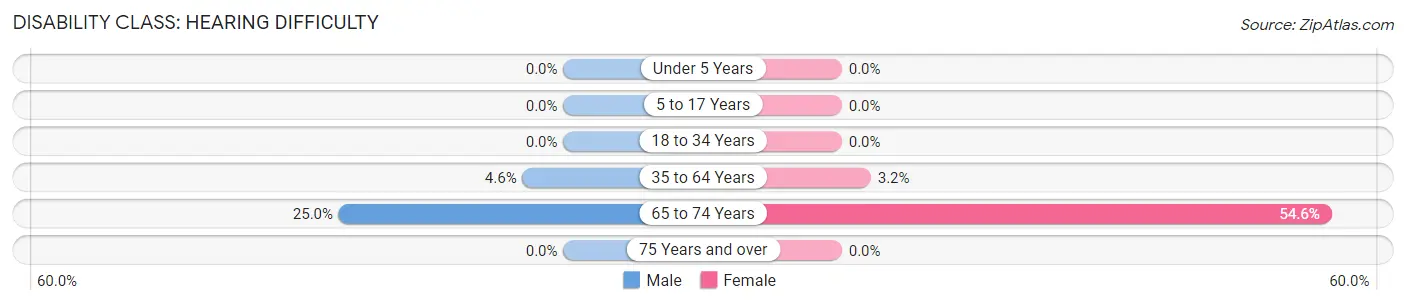
| Age Bracket | Male | Female |
| Under 5 Years | 0 (0.0%) | 0 (0.0%) |
| 5 to 17 Years | 0 (0.0%) | 0 (0.0%) |
| 18 to 34 Years | 0 (0.0%) | 0 (0.0%) |
| 35 to 64 Years | 2 (4.5%) | 2 (3.2%) |
| 65 to 74 Years | 5 (25.0%) | 12 (54.5%) |
| 75 Years and over | 0 (0.0%) | 0 (0.0%) |
Disability Class: Vision Difficulty
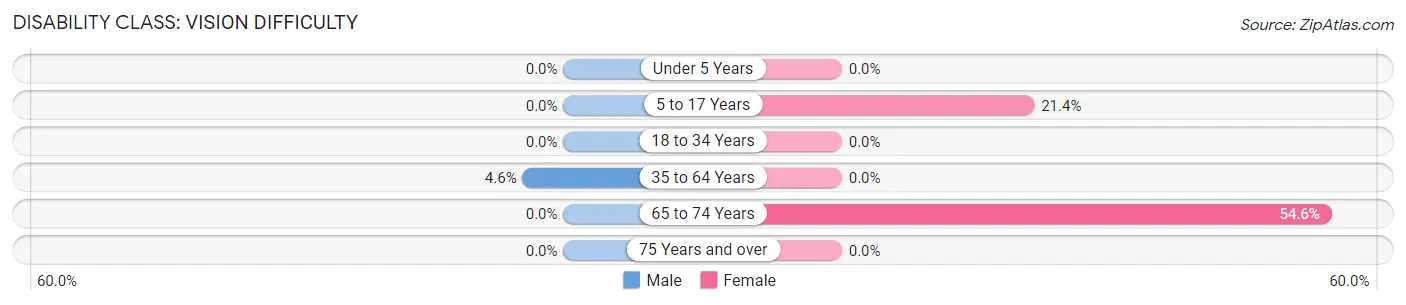
| Age Bracket | Male | Female |
| Under 5 Years | 0 (0.0%) | 0 (0.0%) |
| 5 to 17 Years | 0 (0.0%) | 3 (21.4%) |
| 18 to 34 Years | 0 (0.0%) | 0 (0.0%) |
| 35 to 64 Years | 2 (4.5%) | 0 (0.0%) |
| 65 to 74 Years | 0 (0.0%) | 12 (54.5%) |
| 75 Years and over | 0 (0.0%) | 0 (0.0%) |
Disability Class: Cognitive Difficulty
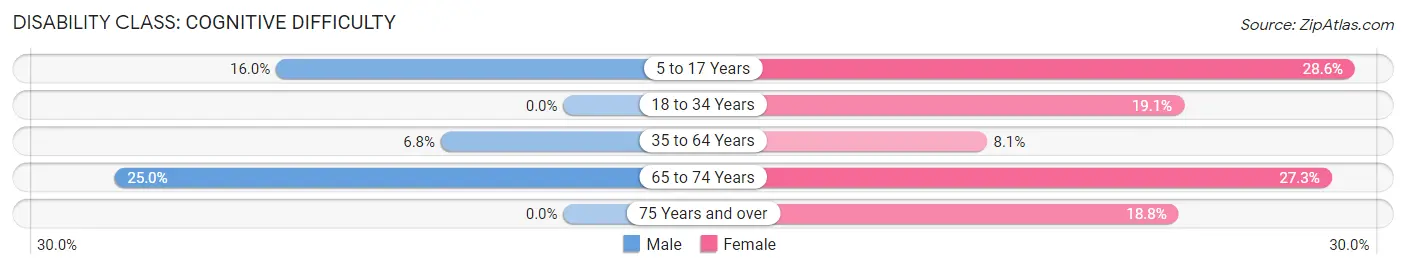
| Age Bracket | Male | Female |
| 5 to 17 Years | 4 (16.0%) | 4 (28.6%) |
| 18 to 34 Years | 0 (0.0%) | 4 (19.1%) |
| 35 to 64 Years | 3 (6.8%) | 5 (8.1%) |
| 65 to 74 Years | 5 (25.0%) | 6 (27.3%) |
| 75 Years and over | 0 (0.0%) | 3 (18.8%) |
Disability Class: Ambulatory Difficulty
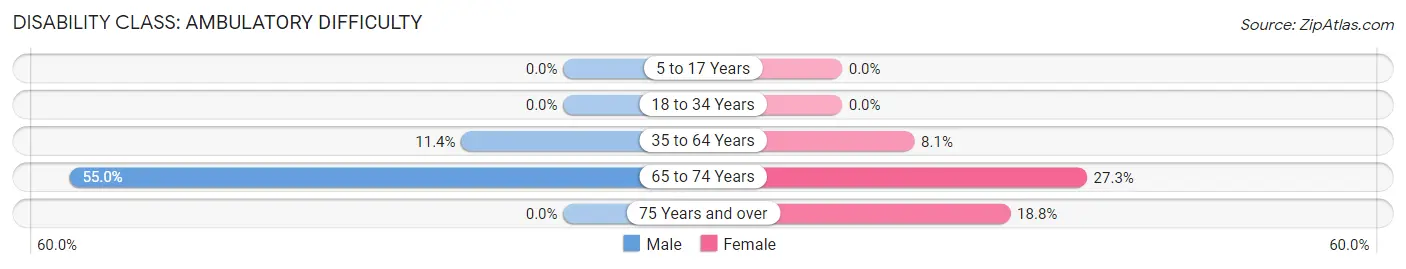
| Age Bracket | Male | Female |
| 5 to 17 Years | 0 (0.0%) | 0 (0.0%) |
| 18 to 34 Years | 0 (0.0%) | 0 (0.0%) |
| 35 to 64 Years | 5 (11.4%) | 5 (8.1%) |
| 65 to 74 Years | 11 (55.0%) | 6 (27.3%) |
| 75 Years and over | 0 (0.0%) | 3 (18.8%) |
Disability Class: Self-Care Difficulty
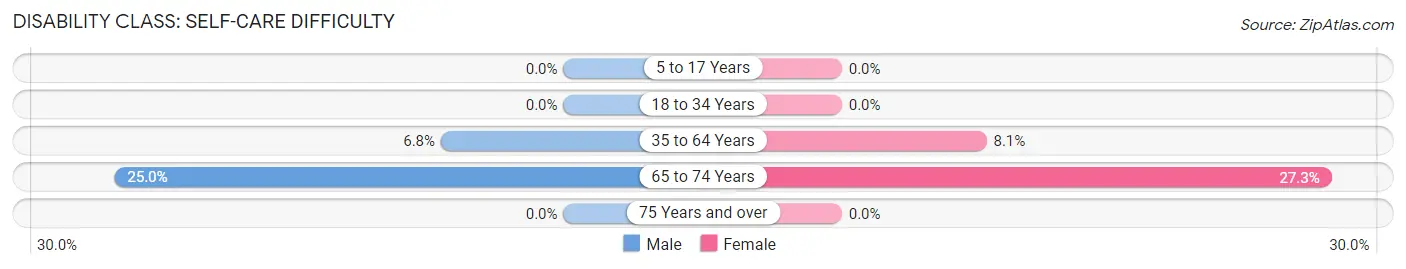
| Age Bracket | Male | Female |
| 5 to 17 Years | 0 (0.0%) | 0 (0.0%) |
| 18 to 34 Years | 0 (0.0%) | 0 (0.0%) |
| 35 to 64 Years | 3 (6.8%) | 5 (8.1%) |
| 65 to 74 Years | 5 (25.0%) | 6 (27.3%) |
| 75 Years and over | 0 (0.0%) | 0 (0.0%) |
Technology Access in Scottsville
Computing Device Access in Scottsville
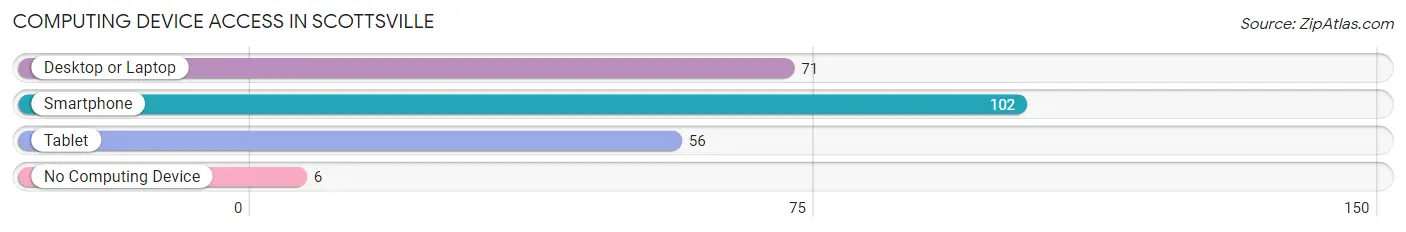
| Device Type | # Households | % Households |
| Desktop or Laptop | 71 | 60.2% |
| Smartphone | 102 | 86.4% |
| Tablet | 56 | 47.5% |
| No Computing Device | 6 | 5.1% |
| Total | 118 | 100.0% |
Internet Access in Scottsville
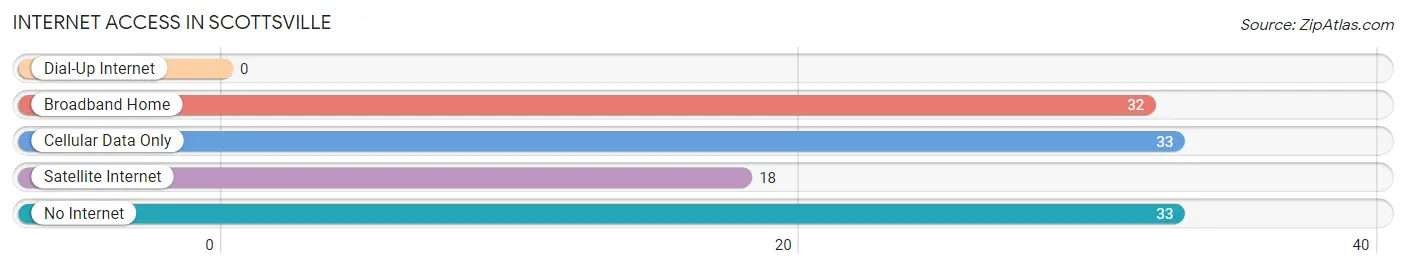
| Internet Type | # Households | % Households |
| Dial-Up Internet | 0 | 0.0% |
| Broadband Home | 32 | 27.1% |
| Cellular Data Only | 33 | 28.0% |
| Satellite Internet | 18 | 15.2% |
| No Internet | 33 | 28.0% |
| Total | 118 | 100.0% |
Scottsville Summary
Scottville, Texas is a small town located in the Texas Panhandle, in the county of Randall. It is situated on the banks of the Canadian River, and is home to a population of just over 1,000 people. The town was founded in 1876 by William Scott, who named it after himself.
History
The town of Scottsville was founded in 1876 by William Scott, who named it after himself. Scott was a rancher and farmer who had moved to the area from Missouri. He was the first settler in the area, and he built a small log cabin on the banks of the Canadian River. The town grew slowly, and by the early 1900s, it had a population of around 200 people.
The town was an important stop on the Santa Fe Trail, and it was also a major shipping point for cattle and other livestock. In the early 1900s, the town was home to several businesses, including a general store, a blacksmith shop, a livery stable, and a hotel.
In the 1920s, the town began to decline, as the railroad bypassed it and the Santa Fe Trail was no longer used. The population dropped to around 100 people, and the town was nearly abandoned. However, in the 1950s, the town began to experience a resurgence, as the oil and gas industry began to boom in the area. The population grew to around 500 people, and the town began to experience a period of growth and prosperity.
Geography
Scottsville is located in the Texas Panhandle, in the county of Randall. It is situated on the banks of the Canadian River, and is surrounded by rolling hills and prairies. The town is located about 25 miles south of Amarillo, and about 50 miles north of Lubbock.
The climate in Scottsville is semi-arid, with hot summers and mild winters. The average annual temperature is around 65 degrees Fahrenheit, and the average annual precipitation is around 17 inches.
Economy
The economy of Scottsville is largely based on agriculture and oil and gas production. The town is home to several large farms, and the surrounding area is known for its production of wheat, corn, and other crops. The town is also home to several oil and gas companies, and the local economy is heavily dependent on the oil and gas industry.
In addition to agriculture and oil and gas production, the town is also home to several small businesses, including restaurants, retail stores, and service providers. The town is also home to a small airport, which serves the local area.
Demographics
As of the 2010 census, the population of Scottsville was 1,072. The racial makeup of the town was 94.3% White, 0.7% African American, 0.3% Native American, 0.2% Asian, 0.1% Pacific Islander, 2.7% from other races, and 1.7% from two or more races. Hispanic or Latino of any race were 5.2% of the population.
The median household income in Scottsville was $37,500, and the median family income was $45,000. The per capita income was $19,000. About 11.3% of families and 14.2% of the population were below the poverty line, including 18.2% of those under age 18 and 8.3% of those age 65 or over.
Common Questions
What is Per Capita Income in Scottsville?
Per Capita income in Scottsville is $25,977.
What is the Median Family Income in Scottsville?
Median Family Income in Scottsville is $56,875.
What is the Median Household income in Scottsville?
Median Household Income in Scottsville is $47,500.
What is Income or Wage Gap in Scottsville?
Income or Wage Gap in Scottsville is 0.3%.
Women in Scottsville earn 99.7 cents for every dollar earned by a man.
What is Inequality or Gini Index in Scottsville?
Inequality or Gini Index in Scottsville is 0.43.
What is the Total Population of Scottsville?
Total Population of Scottsville is 279.
What is the Total Male Population of Scottsville?
Total Male Population of Scottsville is 142.
What is the Total Female Population of Scottsville?
Total Female Population of Scottsville is 137.
What is the Ratio of Males per 100 Females in Scottsville?
There are 103.65 Males per 100 Females in Scottsville.
What is the Ratio of Females per 100 Males in Scottsville?
There are 96.48 Females per 100 Males in Scottsville.
What is the Median Population Age in Scottsville?
Median Population Age in Scottsville is 50.9 Years.
What is the Average Family Size in Scottsville
Average Family Size in Scottsville is 2.8 People.
What is the Average Household Size in Scottsville
Average Household Size in Scottsville is 2.4 People.
How Large is the Labor Force in Scottsville?
There are 130 People in the Labor Forcein in Scottsville.
What is the Percentage of People in the Labor Force in Scottsville?
57.3% of People are in the Labor Force in Scottsville.