Huntingdon, TN Map & Demographics
Huntingdon Map
Huntingdon Overview
$24,846
PER CAPITA INCOME
$52,190
AVG FAMILY INCOME
$46,167
AVG HOUSEHOLD INCOME
0.0%
WAGE / INCOME GAP [ % ]
100.0¢/ $1
WAGE / INCOME GAP [ $ ]
0.47
INEQUALITY / GINI INDEX
4,384
TOTAL POPULATION
2,199
MALE POPULATION
2,185
FEMALE POPULATION
100.64
MALES / 100 FEMALES
99.36
FEMALES / 100 MALES
33.4
MEDIAN AGE
3.0
AVG FAMILY SIZE
2.4
AVG HOUSEHOLD SIZE
1,791
LABOR FORCE [ PEOPLE ]
53.3%
PERCENT IN LABOR FORCE
Huntingdon Zip Codes
Huntingdon Area Codes
Income in Huntingdon
Income Overview in Huntingdon
Per Capita Income in Huntingdon is $24,846, while median incomes of families and households are $52,190 and $46,167 respectively.
| Characteristic | Number | Measure |
| Per Capita Income | 4,384 | $24,846 |
| Median Family Income | 1,160 | $52,190 |
| Mean Family Income | 1,160 | $74,929 |
| Median Household Income | 1,708 | $46,167 |
| Mean Household Income | 1,708 | $59,556 |
| Income Deficit | 1,160 | $0 |
| Wage / Income Gap (%) | 4,384 | 0.02% |
| Wage / Income Gap ($) | 4,384 | 99.98¢ per $1 |
| Gini / Inequality Index | 4,384 | 0.47 |
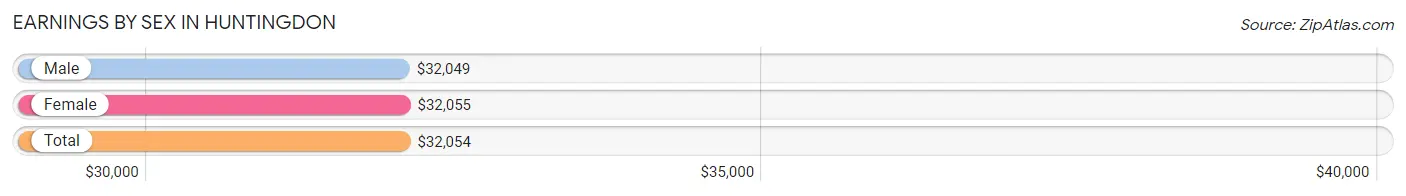
Earnings by Sex in Huntingdon
Average Earnings in Huntingdon are $32,054, $32,049 for men and $32,055 for women, a difference of 0.0%.
| Sex | Number | Average Earnings |
| Male | 1,038 (54.0%) | $32,049 |
| Female | 883 (46.0%) | $32,055 |
| Total | 1,921 (100.0%) | $32,054 |
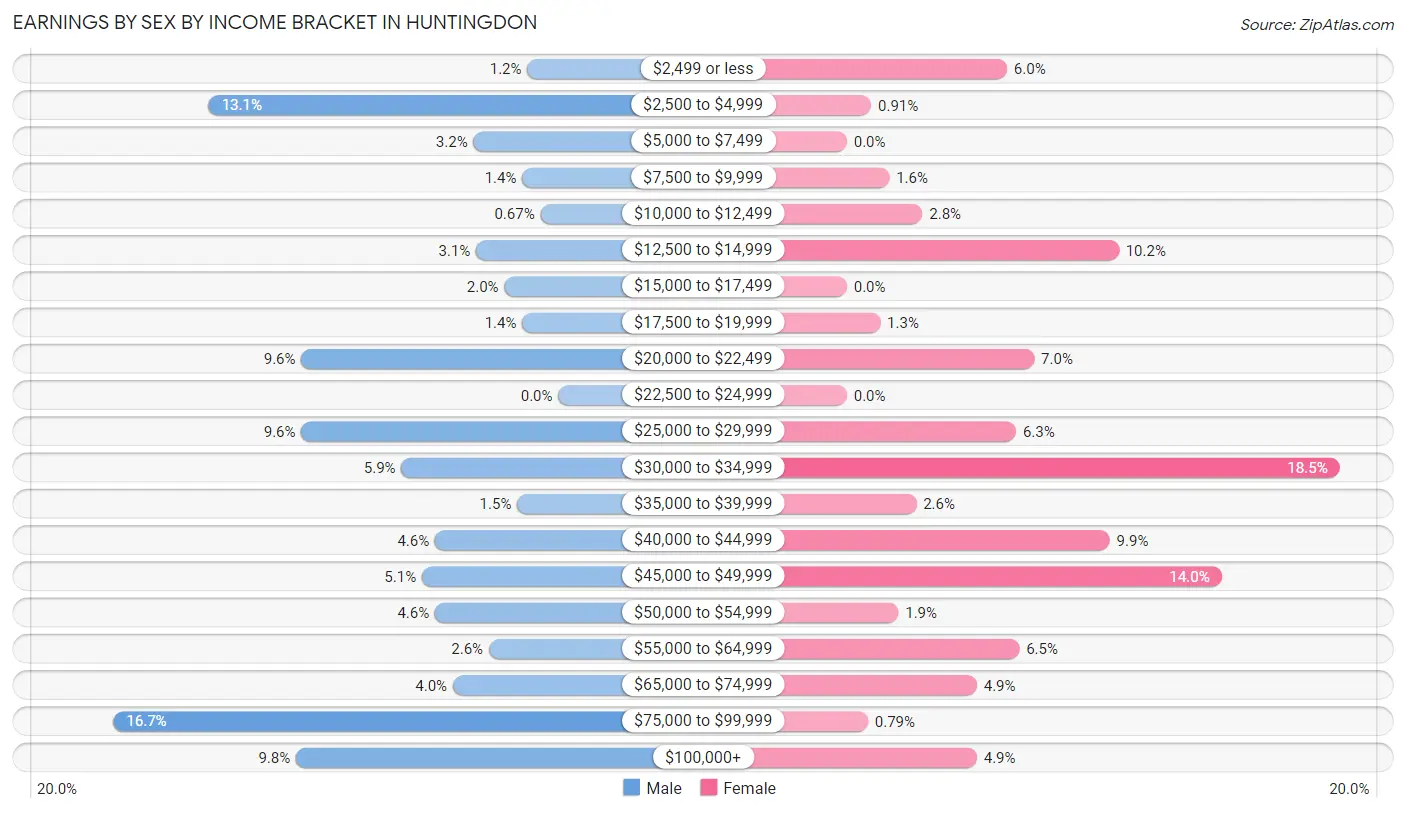
Earnings by Sex by Income Bracket in Huntingdon
The most common earnings brackets in Huntingdon are $75,000 to $99,999 for men (173 | 16.7%) and $30,000 to $34,999 for women (163 | 18.5%).
| Income | Male | Female |
| $2,499 or less | 12 (1.2%) | 53 (6.0%) |
| $2,500 to $4,999 | 136 (13.1%) | 8 (0.9%) |
| $5,000 to $7,499 | 33 (3.2%) | 0 (0.0%) |
| $7,500 to $9,999 | 14 (1.3%) | 14 (1.6%) |
| $10,000 to $12,499 | 7 (0.7%) | 25 (2.8%) |
| $12,500 to $14,999 | 32 (3.1%) | 90 (10.2%) |
| $15,000 to $17,499 | 21 (2.0%) | 0 (0.0%) |
| $17,500 to $19,999 | 14 (1.3%) | 11 (1.3%) |
| $20,000 to $22,499 | 100 (9.6%) | 62 (7.0%) |
| $22,500 to $24,999 | 0 (0.0%) | 0 (0.0%) |
| $25,000 to $29,999 | 100 (9.6%) | 56 (6.3%) |
| $30,000 to $34,999 | 61 (5.9%) | 163 (18.5%) |
| $35,000 to $39,999 | 16 (1.5%) | 23 (2.6%) |
| $40,000 to $44,999 | 48 (4.6%) | 87 (9.9%) |
| $45,000 to $49,999 | 53 (5.1%) | 124 (14.0%) |
| $50,000 to $54,999 | 48 (4.6%) | 17 (1.9%) |
| $55,000 to $64,999 | 27 (2.6%) | 57 (6.5%) |
| $65,000 to $74,999 | 41 (4.0%) | 43 (4.9%) |
| $75,000 to $99,999 | 173 (16.7%) | 7 (0.8%) |
| $100,000+ | 102 (9.8%) | 43 (4.9%) |
| Total | 1,038 (100.0%) | 883 (100.0%) |
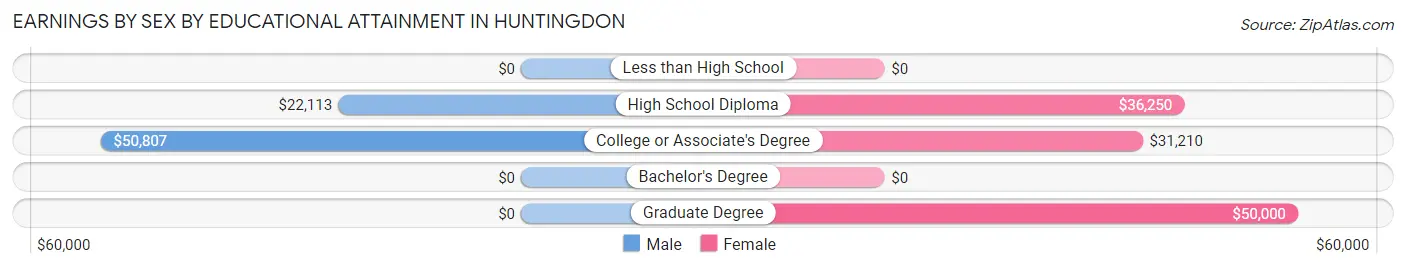
Earnings by Sex by Educational Attainment in Huntingdon
Average earnings in Huntingdon are $30,881 for men and $32,173 for women, a difference of 4.0%. Men with an educational attainment of college or associate's degree enjoy the highest average annual earnings of $50,807, while those with high school diploma education earn the least with $22,113. Women with an educational attainment of graduate degree earn the most with the average annual earnings of $50,000, while those with college or associate's degree education have the smallest earnings of $31,210.
| Educational Attainment | Male Income | Female Income |
| Less than High School | - | - |
| High School Diploma | $22,113 | $36,250 |
| College or Associate's Degree | $50,807 | $31,210 |
| Bachelor's Degree | - | - |
| Graduate Degree | - | - |
| Total | $30,881 | $32,173 |
Family Income in Huntingdon
Family Income Brackets in Huntingdon
According to the Huntingdon family income data, there are 277 families falling into the $50,000 to $74,999 income range, which is the most common income bracket and makes up 23.9% of all families. Conversely, the less than $10,000 income bracket is the least frequent group with only 14 families (1.2%) belonging to this category.
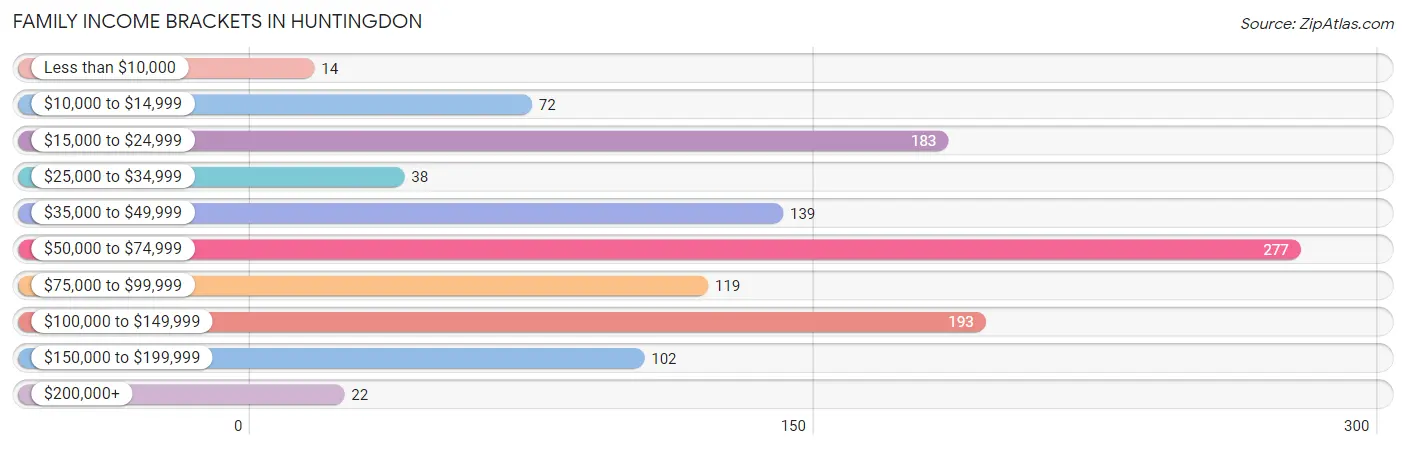
| Income Bracket | # Families | % Families |
| Less than $10,000 | 14 | 1.2% |
| $10,000 to $14,999 | 72 | 6.2% |
| $15,000 to $24,999 | 183 | 15.8% |
| $25,000 to $34,999 | 38 | 3.3% |
| $35,000 to $49,999 | 139 | 12.0% |
| $50,000 to $74,999 | 277 | 23.9% |
| $75,000 to $99,999 | 119 | 10.3% |
| $100,000 to $149,999 | 193 | 16.6% |
| $150,000 to $199,999 | 102 | 8.8% |
| $200,000+ | 22 | 1.9% |
Family Income by Famaliy Size in Huntingdon
4-person families (225 | 19.4%) account for the highest median family income in Huntingdon with $109,688 per family, while 2-person families (466 | 40.2%) have the highest median income of $28,138 per family member.
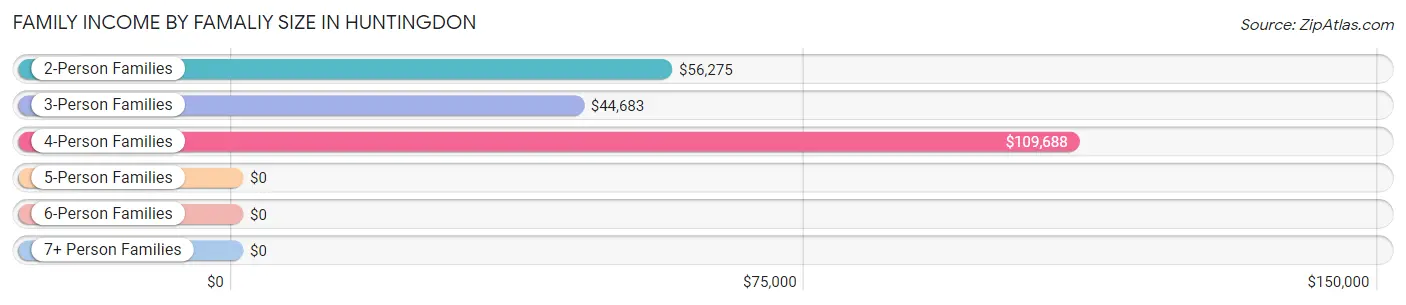
| Income Bracket | # Families | Median Income |
| 2-Person Families | 466 (40.2%) | $56,275 |
| 3-Person Families | 374 (32.2%) | $44,683 |
| 4-Person Families | 225 (19.4%) | $109,688 |
| 5-Person Families | 72 (6.2%) | $0 |
| 6-Person Families | 23 (2.0%) | $0 |
| 7+ Person Families | 0 (0.0%) | $0 |
| Total | 1,160 (100.0%) | $52,190 |
Family Income by Number of Earners in Huntingdon
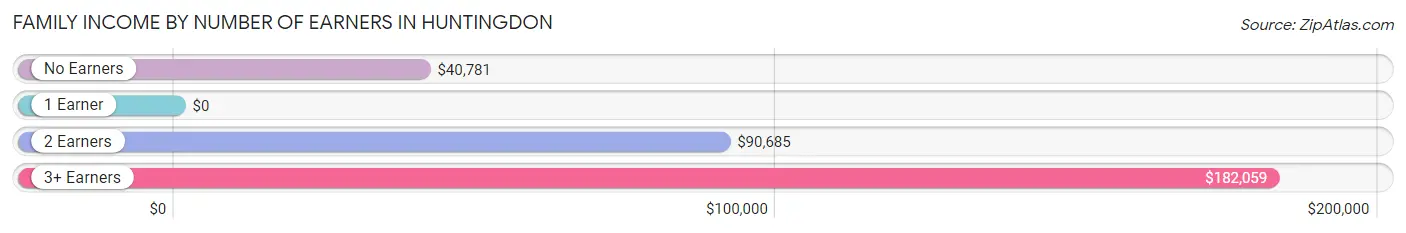
| Number of Earners | # Families | Median Income |
| No Earners | 236 (20.3%) | $40,781 |
| 1 Earner | 347 (29.9%) | $0 |
| 2 Earners | 501 (43.2%) | $90,685 |
| 3+ Earners | 76 (6.6%) | $182,059 |
| Total | 1,160 (100.0%) | $52,190 |
Household Income in Huntingdon
Household Income Brackets in Huntingdon
With 318 households falling in the category, the $50,000 to $74,999 income range is the most frequent in Huntingdon, accounting for 18.6% of all households. In contrast, only 22 households (1.3%) fall into the $200,000+ income bracket, making it the least populous group.
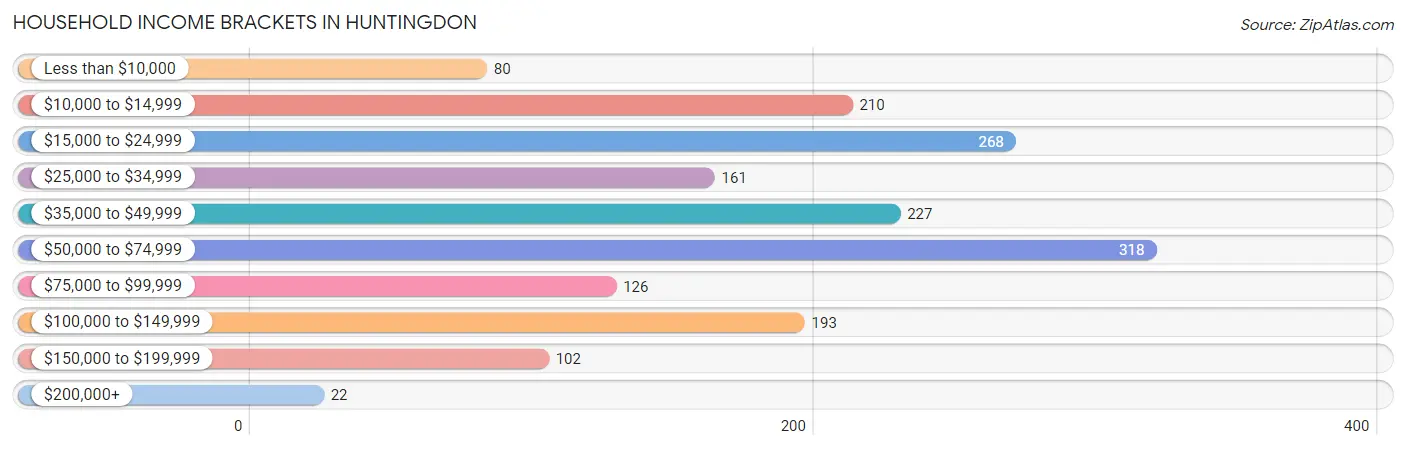
| Income Bracket | # Households | % Households |
| Less than $10,000 | 80 | 4.7% |
| $10,000 to $14,999 | 210 | 12.3% |
| $15,000 to $24,999 | 268 | 15.7% |
| $25,000 to $34,999 | 161 | 9.4% |
| $35,000 to $49,999 | 227 | 13.3% |
| $50,000 to $74,999 | 318 | 18.6% |
| $75,000 to $99,999 | 126 | 7.4% |
| $100,000 to $149,999 | 193 | 11.3% |
| $150,000 to $199,999 | 102 | 6.0% |
| $200,000+ | 22 | 1.3% |
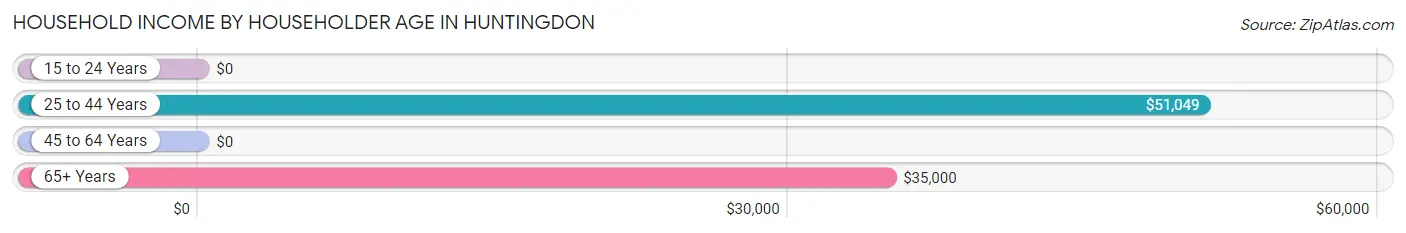
Household Income by Householder Age in Huntingdon
The median household income in Huntingdon is $46,167, with the highest median household income of $51,049 found in the 25 to 44 years age bracket for the primary householder. A total of 804 households (47.1%) fall into this category. Meanwhile, the 15 to 24 years age bracket for the primary householder has the lowest median household income of $0, with 16 households (0.9%) in this group.
| Income Bracket | # Households | Median Income |
| 15 to 24 Years | 16 (0.9%) | $0 |
| 25 to 44 Years | 804 (47.1%) | $51,049 |
| 45 to 64 Years | 428 (25.1%) | $0 |
| 65+ Years | 460 (26.9%) | $35,000 |
| Total | 1,708 (100.0%) | $46,167 |
Poverty in Huntingdon
Income Below Poverty by Sex and Age in Huntingdon
With 26.1% poverty level for males and 23.1% for females among the residents of Huntingdon, 12 to 14 year old males and 45 to 54 year old females are the most vulnerable to poverty, with 105 males (84.7%) and 107 females (64.5%) in their respective age groups living below the poverty level.
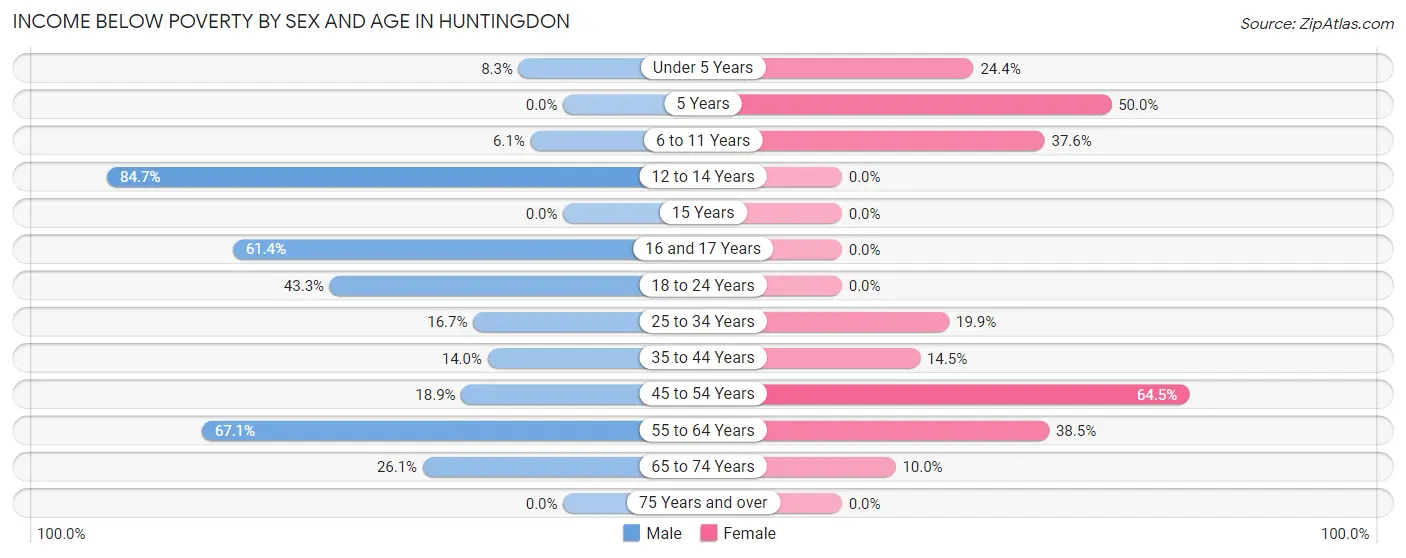
| Age Bracket | Male | Female |
| Under 5 Years | 11 (8.3%) | 44 (24.4%) |
| 5 Years | 0 (0.0%) | 20 (50.0%) |
| 6 to 11 Years | 15 (6.1%) | 73 (37.6%) |
| 12 to 14 Years | 105 (84.7%) | 0 (0.0%) |
| 15 Years | 0 (0.0%) | 0 (0.0%) |
| 16 and 17 Years | 54 (61.4%) | 0 (0.0%) |
| 18 to 24 Years | 65 (43.3%) | 0 (0.0%) |
| 25 to 34 Years | 72 (16.7%) | 99 (19.9%) |
| 35 to 44 Years | 30 (14.0%) | 28 (14.5%) |
| 45 to 54 Years | 35 (18.9%) | 107 (64.5%) |
| 55 to 64 Years | 106 (67.1%) | 90 (38.5%) |
| 65 to 74 Years | 43 (26.1%) | 24 (10.0%) |
| 75 Years and over | 0 (0.0%) | 0 (0.0%) |
| Total | 536 (26.1%) | 485 (23.1%) |
Income Above Poverty by Sex and Age in Huntingdon
According to the poverty statistics in Huntingdon, males aged 5 years and females aged 12 to 14 years are the age groups that are most secure financially, with 100.0% of males and 100.0% of females in these age groups living above the poverty line.
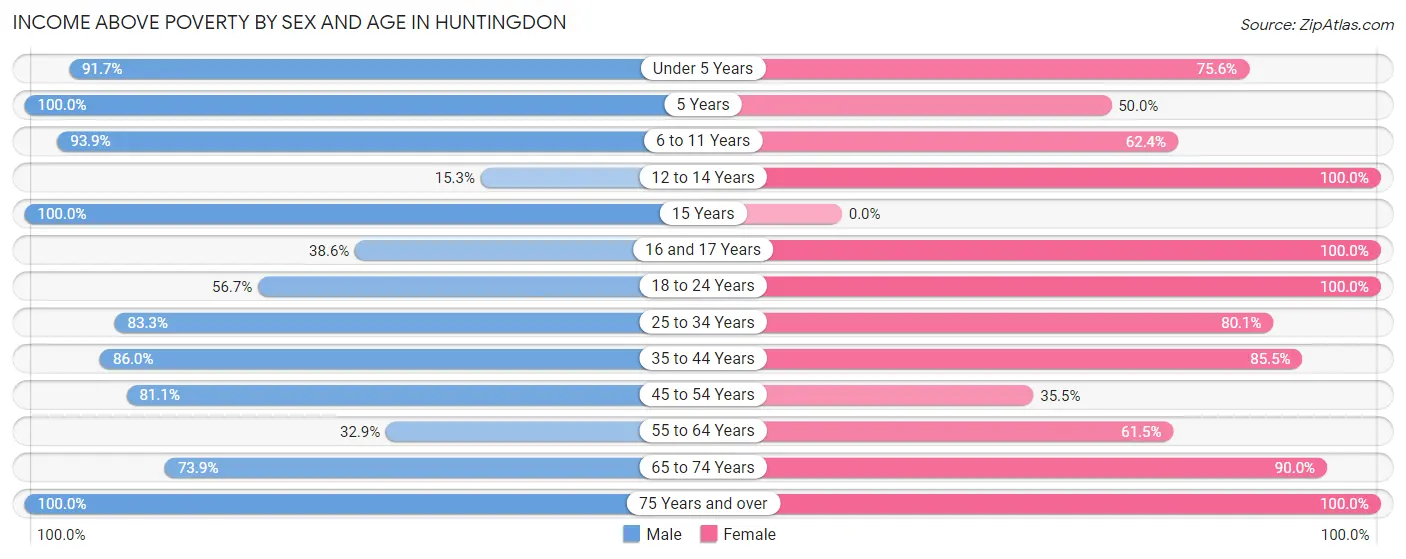
| Age Bracket | Male | Female |
| Under 5 Years | 122 (91.7%) | 136 (75.6%) |
| 5 Years | 17 (100.0%) | 20 (50.0%) |
| 6 to 11 Years | 232 (93.9%) | 121 (62.4%) |
| 12 to 14 Years | 19 (15.3%) | 44 (100.0%) |
| 15 Years | 44 (100.0%) | 0 (0.0%) |
| 16 and 17 Years | 34 (38.6%) | 40 (100.0%) |
| 18 to 24 Years | 85 (56.7%) | 112 (100.0%) |
| 25 to 34 Years | 359 (83.3%) | 398 (80.1%) |
| 35 to 44 Years | 184 (86.0%) | 165 (85.5%) |
| 45 to 54 Years | 150 (81.1%) | 59 (35.5%) |
| 55 to 64 Years | 52 (32.9%) | 144 (61.5%) |
| 65 to 74 Years | 122 (73.9%) | 217 (90.0%) |
| 75 Years and over | 101 (100.0%) | 159 (100.0%) |
| Total | 1,521 (73.9%) | 1,615 (76.9%) |
Income Below Poverty Among Married-Couple Families in Huntingdon
The poverty statistics for married-couple families in Huntingdon show that 20.2% or 186 of the total 920 families live below the poverty line. Families with 1 or 2 children have the highest poverty rate of 28.1%, comprising of 151 families. On the other hand, families with 3 or 4 children have the lowest poverty rate of 0.0%, which includes 0 families.
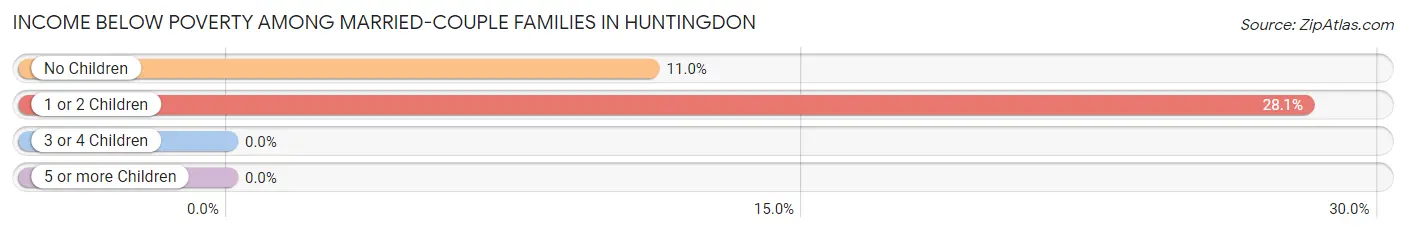
| Children | Above Poverty | Below Poverty |
| No Children | 283 (89.0%) | 35 (11.0%) |
| 1 or 2 Children | 386 (71.9%) | 151 (28.1%) |
| 3 or 4 Children | 65 (100.0%) | 0 (0.0%) |
| 5 or more Children | 0 (0.0%) | 0 (0.0%) |
| Total | 734 (79.8%) | 186 (20.2%) |
Income Below Poverty Among Single-Parent Households in Huntingdon
According to the poverty data in Huntingdon, 40.8% or 40 single-father households and 40.1% or 57 single-mother households are living below the poverty line. Among single-father households, those with no children have the highest poverty rate, with 40 households (81.6%) experiencing poverty. Likewise, among single-mother households, those with 1 or 2 children have the highest poverty rate, with 57 households (77.0%) falling below the poverty line.
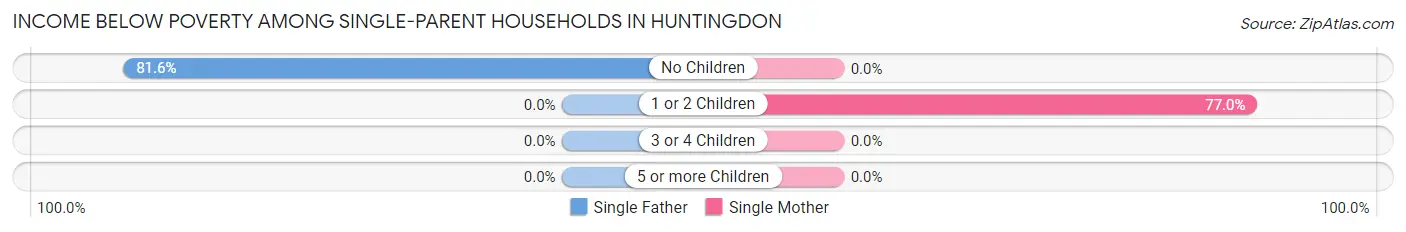
| Children | Single Father | Single Mother |
| No Children | 40 (81.6%) | 0 (0.0%) |
| 1 or 2 Children | 0 (0.0%) | 57 (77.0%) |
| 3 or 4 Children | 0 (0.0%) | 0 (0.0%) |
| 5 or more Children | 0 (0.0%) | 0 (0.0%) |
| Total | 40 (40.8%) | 57 (40.1%) |
Income Below Poverty Among Married-Couple vs Single-Parent Households in Huntingdon
The poverty data for Huntingdon shows that 186 of the married-couple family households (20.2%) and 97 of the single-parent households (40.4%) are living below the poverty level. Within the married-couple family households, those with 1 or 2 children have the highest poverty rate, with 151 households (28.1%) falling below the poverty line. Among the single-parent households, those with 1 or 2 children have the highest poverty rate, with 57 household (46.3%) living below poverty.
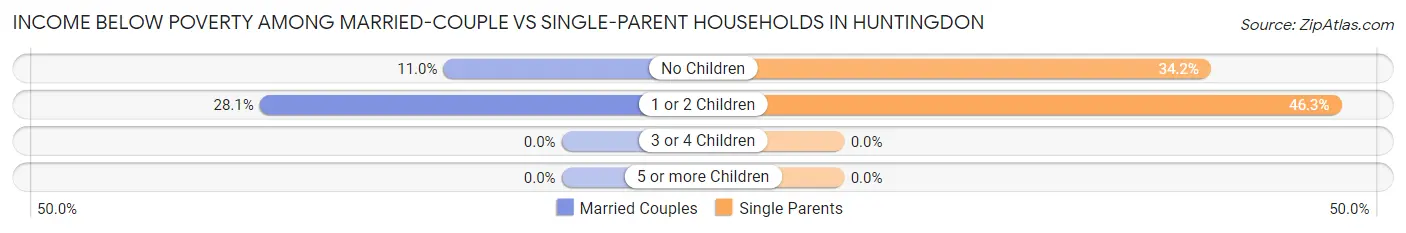
| Children | Married-Couple Families | Single-Parent Households |
| No Children | 35 (11.0%) | 40 (34.2%) |
| 1 or 2 Children | 151 (28.1%) | 57 (46.3%) |
| 3 or 4 Children | 0 (0.0%) | 0 (0.0%) |
| 5 or more Children | 0 (0.0%) | 0 (0.0%) |
| Total | 186 (20.2%) | 97 (40.4%) |
Race in Huntingdon
The most populous races in Huntingdon are White / Caucasian (3,446 | 78.6%), Black / African American (669 | 15.3%), and Two or more Races (263 | 6.0%).
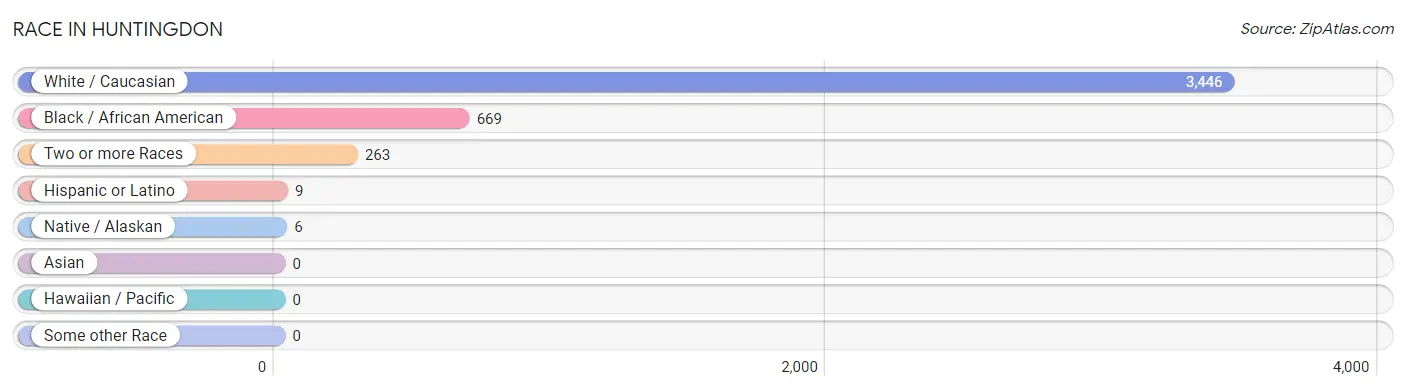
| Race | # Population | % Population |
| Asian | 0 | 0.0% |
| Black / African American | 669 | 15.3% |
| Hawaiian / Pacific | 0 | 0.0% |
| Hispanic or Latino | 9 | 0.2% |
| Native / Alaskan | 6 | 0.1% |
| White / Caucasian | 3,446 | 78.6% |
| Two or more Races | 263 | 6.0% |
| Some other Race | 0 | 0.0% |
| Total | 4,384 | 100.0% |
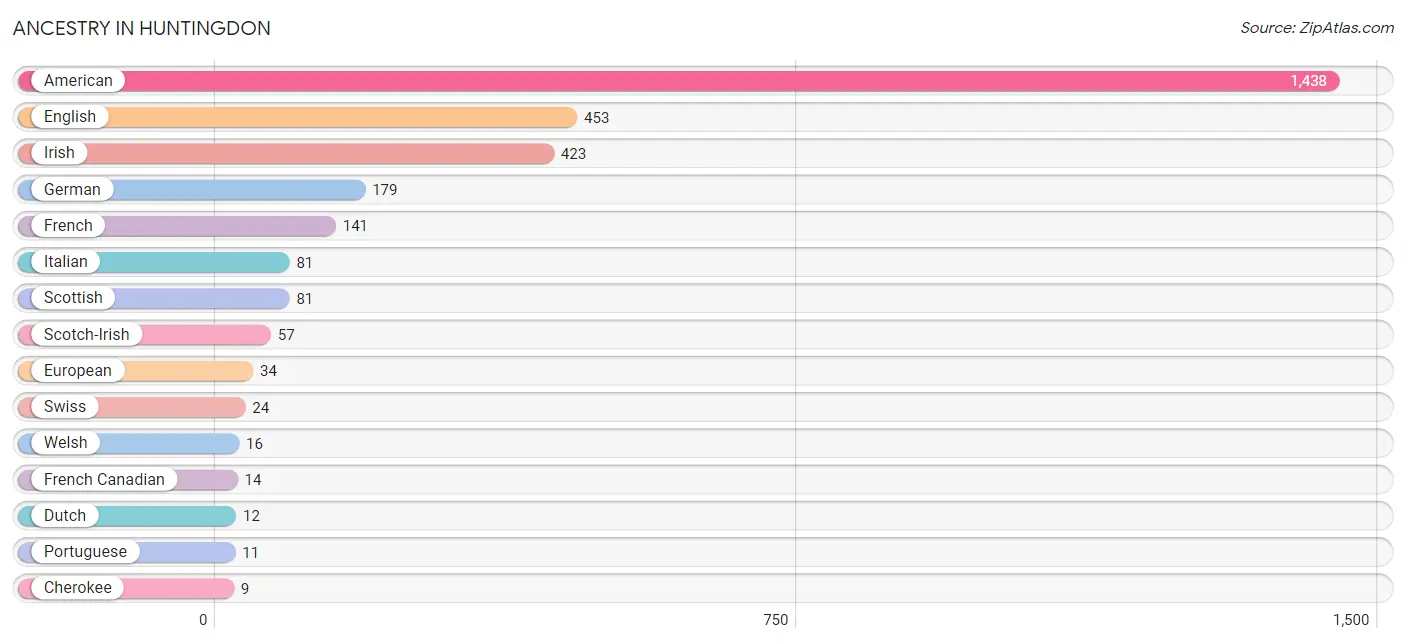
Ancestry in Huntingdon
The most populous ancestries reported in Huntingdon are American (1,438 | 32.8%), English (453 | 10.3%), Irish (423 | 9.7%), German (179 | 4.1%), and French (141 | 3.2%), together accounting for 60.1% of all Huntingdon residents.
| Ancestry | # Population | % Population |
| American | 1,438 | 32.8% |
| Central American | 3 | 0.1% |
| Cherokee | 9 | 0.2% |
| Chickasaw | 4 | 0.1% |
| Dutch | 12 | 0.3% |
| English | 453 | 10.3% |
| European | 34 | 0.8% |
| French | 141 | 3.2% |
| French Canadian | 14 | 0.3% |
| German | 179 | 4.1% |
| Guatemalan | 3 | 0.1% |
| Irish | 423 | 9.7% |
| Italian | 81 | 1.8% |
| Mexican | 6 | 0.1% |
| Portuguese | 11 | 0.3% |
| Scotch-Irish | 57 | 1.3% |
| Scottish | 81 | 1.8% |
| Swiss | 24 | 0.5% |
| Welsh | 16 | 0.4% | View All 19 Rows |
Immigrants in Huntingdon
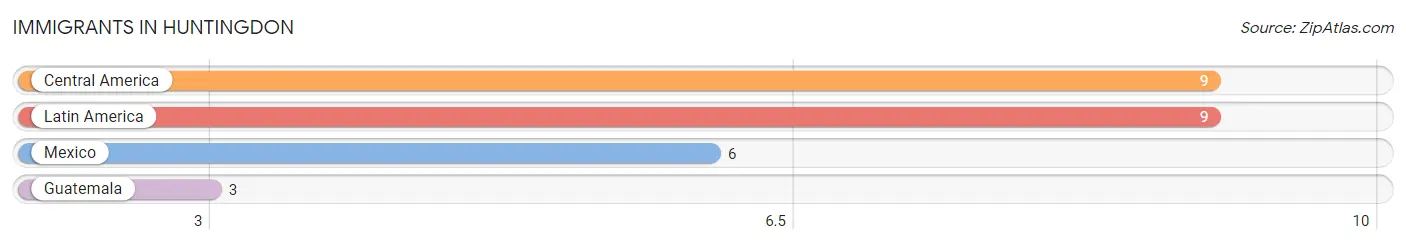
The most numerous immigrant groups reported in Huntingdon came from Central America (9 | 0.2%), Latin America (9 | 0.2%), Mexico (6 | 0.1%), and Guatemala (3 | 0.1%), together accounting for 0.6% of all Huntingdon residents.
| Immigration Origin | # Population | % Population |
| Central America | 9 | 0.2% |
| Guatemala | 3 | 0.1% |
| Latin America | 9 | 0.2% |
| Mexico | 6 | 0.1% | View All 4 Rows |
Sex and Age in Huntingdon
Sex and Age in Huntingdon
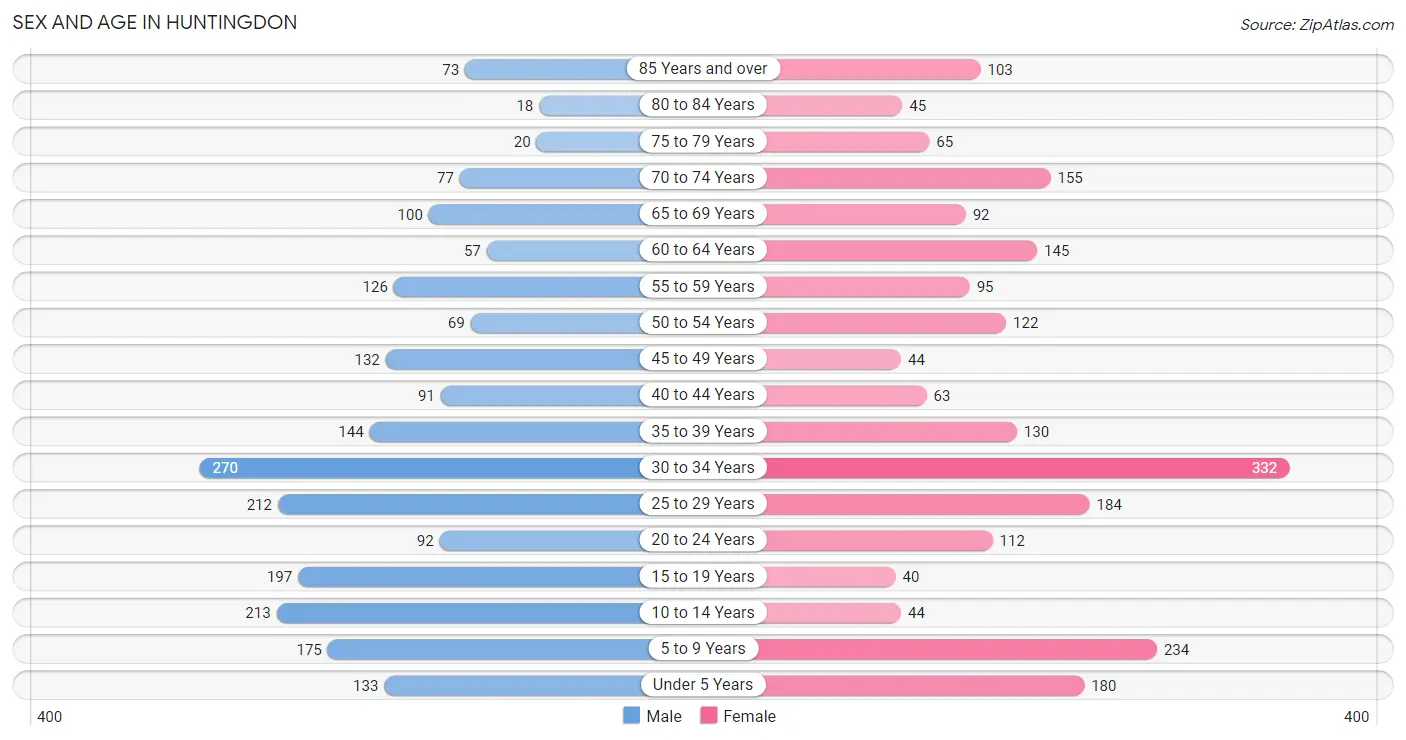
The most populous age groups in Huntingdon are 30 to 34 Years (270 | 12.3%) for men and 30 to 34 Years (332 | 15.2%) for women.
| Age Bracket | Male | Female |
| Under 5 Years | 133 (6.0%) | 180 (8.2%) |
| 5 to 9 Years | 175 (8.0%) | 234 (10.7%) |
| 10 to 14 Years | 213 (9.7%) | 44 (2.0%) |
| 15 to 19 Years | 197 (9.0%) | 40 (1.8%) |
| 20 to 24 Years | 92 (4.2%) | 112 (5.1%) |
| 25 to 29 Years | 212 (9.6%) | 184 (8.4%) |
| 30 to 34 Years | 270 (12.3%) | 332 (15.2%) |
| 35 to 39 Years | 144 (6.6%) | 130 (5.9%) |
| 40 to 44 Years | 91 (4.1%) | 63 (2.9%) |
| 45 to 49 Years | 132 (6.0%) | 44 (2.0%) |
| 50 to 54 Years | 69 (3.1%) | 122 (5.6%) |
| 55 to 59 Years | 126 (5.7%) | 95 (4.3%) |
| 60 to 64 Years | 57 (2.6%) | 145 (6.6%) |
| 65 to 69 Years | 100 (4.5%) | 92 (4.2%) |
| 70 to 74 Years | 77 (3.5%) | 155 (7.1%) |
| 75 to 79 Years | 20 (0.9%) | 65 (3.0%) |
| 80 to 84 Years | 18 (0.8%) | 45 (2.1%) |
| 85 Years and over | 73 (3.3%) | 103 (4.7%) |
| Total | 2,199 (100.0%) | 2,185 (100.0%) |
Families and Households in Huntingdon
Median Family Size in Huntingdon
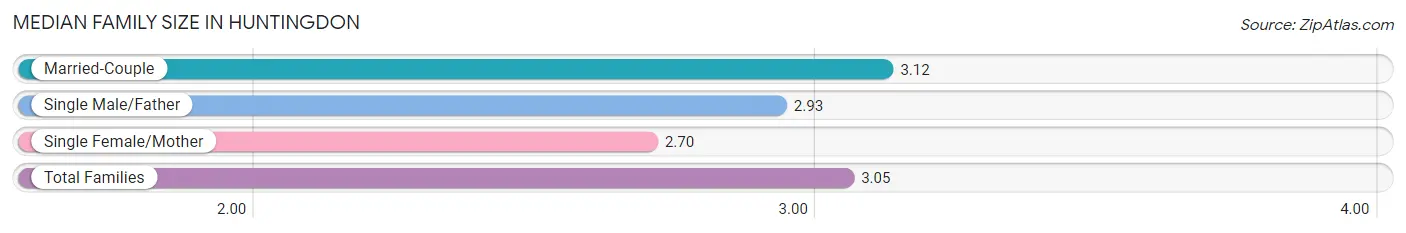
The median family size in Huntingdon is 3.05 persons per family, with married-couple families (920 | 79.3%) accounting for the largest median family size of 3.12 persons per family. On the other hand, single female/mother families (142 | 12.2%) represent the smallest median family size with 2.70 persons per family.
| Family Type | # Families | Family Size |
| Married-Couple | 920 (79.3%) | 3.12 |
| Single Male/Father | 98 (8.5%) | 2.93 |
| Single Female/Mother | 142 (12.2%) | 2.70 |
| Total Families | 1,160 (100.0%) | 3.05 |
Median Household Size in Huntingdon
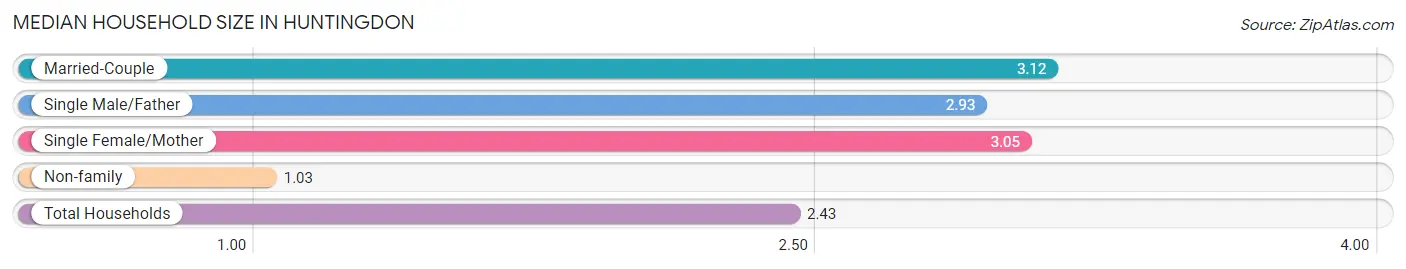
The median household size in Huntingdon is 2.43 persons per household, with married-couple households (920 | 53.9%) accounting for the largest median household size of 3.12 persons per household. non-family households (548 | 32.1%) represent the smallest median household size with 1.03 persons per household.
| Household Type | # Households | Household Size |
| Married-Couple | 920 (53.9%) | 3.12 |
| Single Male/Father | 98 (5.7%) | 2.93 |
| Single Female/Mother | 142 (8.3%) | 3.05 |
| Non-family | 548 (32.1%) | 1.03 |
| Total Households | 1,708 (100.0%) | 2.43 |
Household Size by Marriage Status in Huntingdon
Out of a total of 1,708 households in Huntingdon, 1,160 (67.9%) are family households, while 548 (32.1%) are nonfamily households. The most numerous type of family households are 2-person households, comprising 423, and the most common type of nonfamily households are 1-person households, comprising 530.
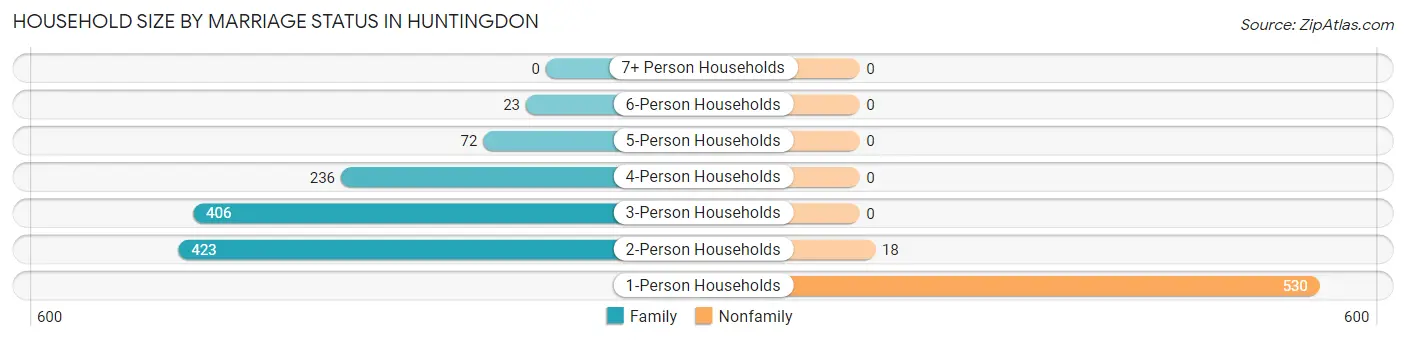
| Household Size | Family Households | Nonfamily Households |
| 1-Person Households | - | 530 (31.0%) |
| 2-Person Households | 423 (24.8%) | 18 (1.1%) |
| 3-Person Households | 406 (23.8%) | 0 (0.0%) |
| 4-Person Households | 236 (13.8%) | 0 (0.0%) |
| 5-Person Households | 72 (4.2%) | 0 (0.0%) |
| 6-Person Households | 23 (1.3%) | 0 (0.0%) |
| 7+ Person Households | 0 (0.0%) | 0 (0.0%) |
| Total | 1,160 (67.9%) | 548 (32.1%) |
Female Fertility in Huntingdon
Fertility by Age in Huntingdon
Average fertility rate in Huntingdon is 85.0 births per 1,000 women. Women in the age bracket of 20 to 34 years have the highest fertility rate with 123.0 births per 1,000 women. Women in the age bracket of 20 to 34 years acount for 100.0% of all women with births.
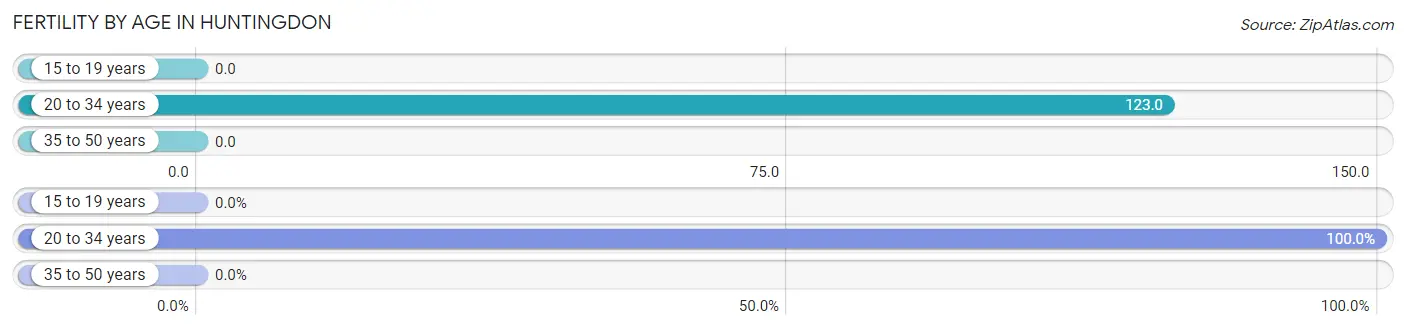
| Age Bracket | Women with Births | Births / 1,000 Women |
| 15 to 19 years | 0 (0.0%) | 0.0 |
| 20 to 34 years | 77 (100.0%) | 123.0 |
| 35 to 50 years | 0 (0.0%) | 0.0 |
| Total | 77 (100.0%) | 85.0 |
Fertility by Age by Marriage Status in Huntingdon
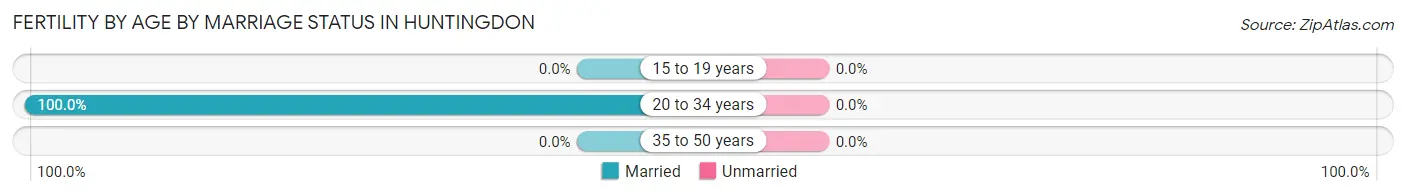
| Age Bracket | Married | Unmarried |
| 15 to 19 years | 0 (0.0%) | 0 (0.0%) |
| 20 to 34 years | 77 (100.0%) | 0 (0.0%) |
| 35 to 50 years | 0 (0.0%) | 0 (0.0%) |
| Total | 77 (100.0%) | 0 (0.0%) |
Fertility by Education in Huntingdon
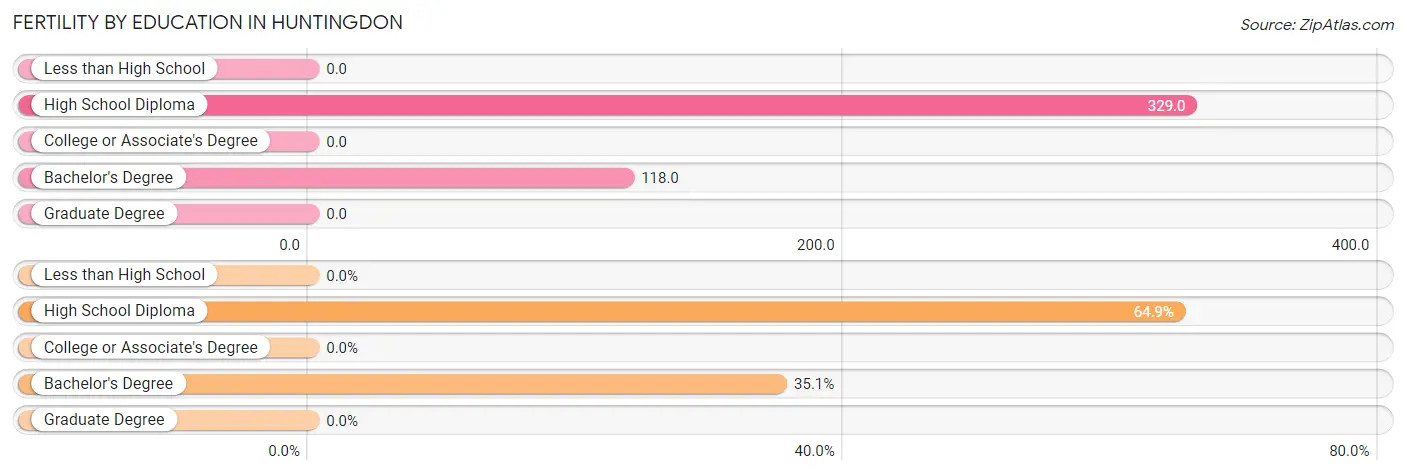
| Educational Attainment | Women with Births | Births / 1,000 Women |
| Less than High School | 0 (0.0%) | 0.0 |
| High School Diploma | 50 (64.9%) | 329.0 |
| College or Associate's Degree | 0 (0.0%) | 0.0 |
| Bachelor's Degree | 27 (35.1%) | 118.0 |
| Graduate Degree | 0 (0.0%) | 0.0 |
| Total | 77 (100.0%) | 85.0 |
Fertility by Education by Marriage Status in Huntingdon
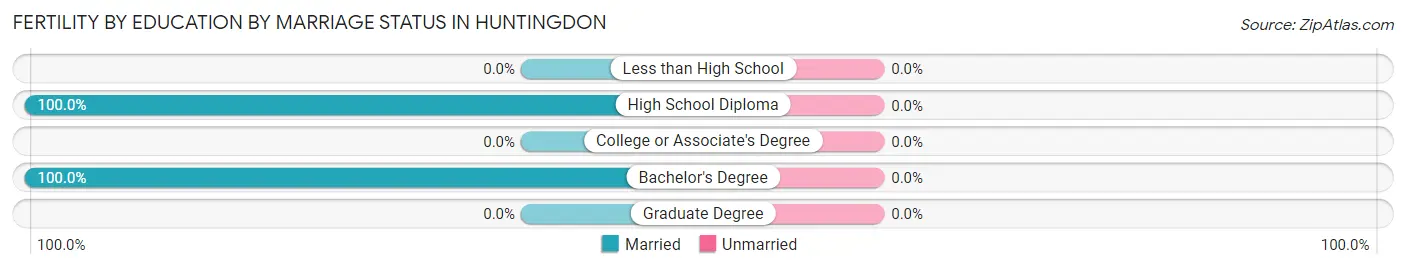
| Educational Attainment | Married | Unmarried |
| Less than High School | 0 (0.0%) | 0 (0.0%) |
| High School Diploma | 50 (100.0%) | 0 (0.0%) |
| College or Associate's Degree | 0 (0.0%) | 0 (0.0%) |
| Bachelor's Degree | 27 (100.0%) | 0 (0.0%) |
| Graduate Degree | 0 (0.0%) | 0 (0.0%) |
| Total | 77 (100.0%) | 0 (0.0%) |
Employment Characteristics in Huntingdon
Employment by Class of Employer in Huntingdon
Among the 1,759 employed individuals in Huntingdon, private company employees (924 | 52.5%), self-employed (not incorporated) (262 | 14.9%), and state government employees (259 | 14.7%) make up the most common classes of employment.
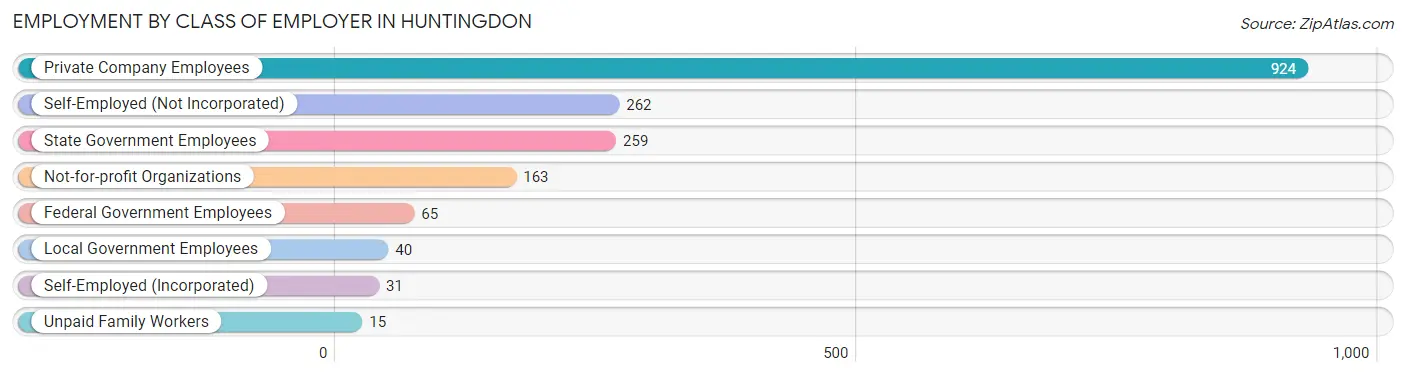
| Employer Class | # Employees | % Employees |
| Private Company Employees | 924 | 52.5% |
| Self-Employed (Incorporated) | 31 | 1.8% |
| Self-Employed (Not Incorporated) | 262 | 14.9% |
| Not-for-profit Organizations | 163 | 9.3% |
| Local Government Employees | 40 | 2.3% |
| State Government Employees | 259 | 14.7% |
| Federal Government Employees | 65 | 3.7% |
| Unpaid Family Workers | 15 | 0.9% |
| Total | 1,759 | 100.0% |
Employment Status by Age in Huntingdon
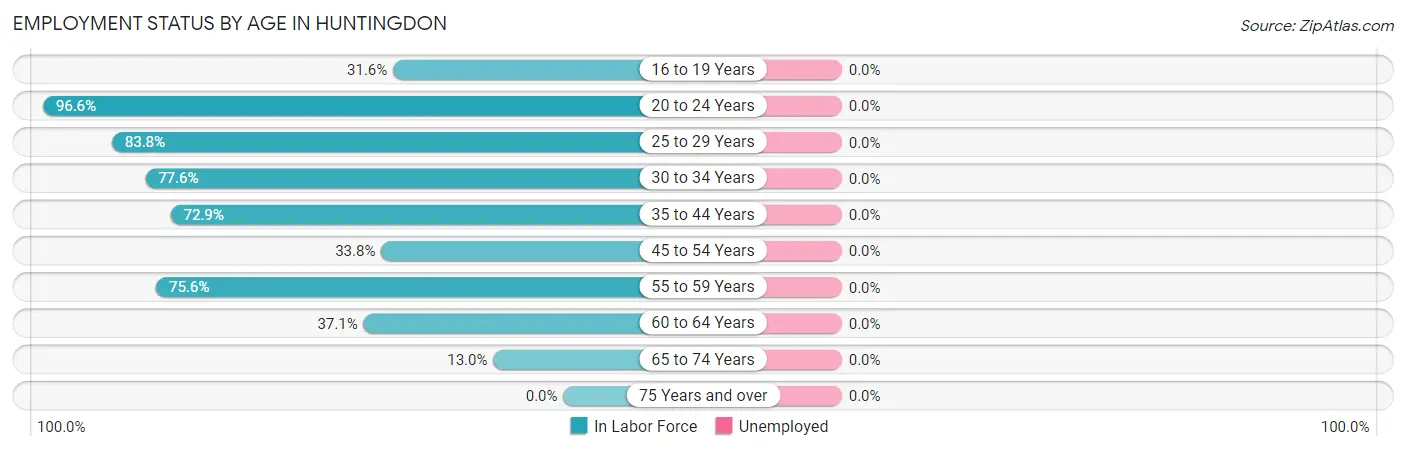
| Age Bracket | In Labor Force | Unemployed |
| 16 to 19 Years | 61 (31.6%) | 0 (0.0%) |
| 20 to 24 Years | 197 (96.6%) | 0 (0.0%) |
| 25 to 29 Years | 332 (83.8%) | 0 (0.0%) |
| 30 to 34 Years | 467 (77.6%) | 0 (0.0%) |
| 35 to 44 Years | 312 (72.9%) | 0 (0.0%) |
| 45 to 54 Years | 124 (33.8%) | 0 (0.0%) |
| 55 to 59 Years | 167 (75.6%) | 0 (0.0%) |
| 60 to 64 Years | 75 (37.1%) | 0 (0.0%) |
| 65 to 74 Years | 55 (13.0%) | 0 (0.0%) |
| 75 Years and over | 0 (0.0%) | 0 (0.0%) |
| Total | 1,791 (53.3%) | 0 (0.0%) |
Employment Status by Educational Attainment in Huntingdon
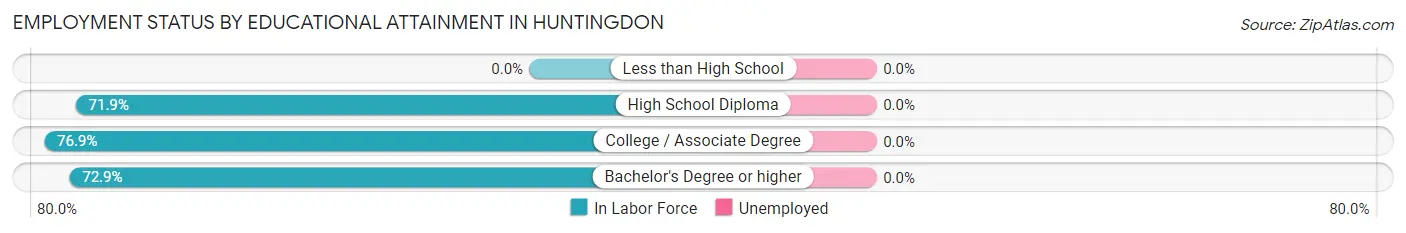
| Educational Attainment | In Labor Force | Unemployed |
| Less than High School | 0 (0.0%) | 0 (0.0%) |
| High School Diploma | 499 (71.9%) | 0 (0.0%) |
| College / Associate Degree | 517 (76.9%) | 0 (0.0%) |
| Bachelor's Degree or higher | 461 (72.9%) | 0 (0.0%) |
| Total | 1,478 (66.7%) | 0 (0.0%) |
Employment Occupations by Sex in Huntingdon
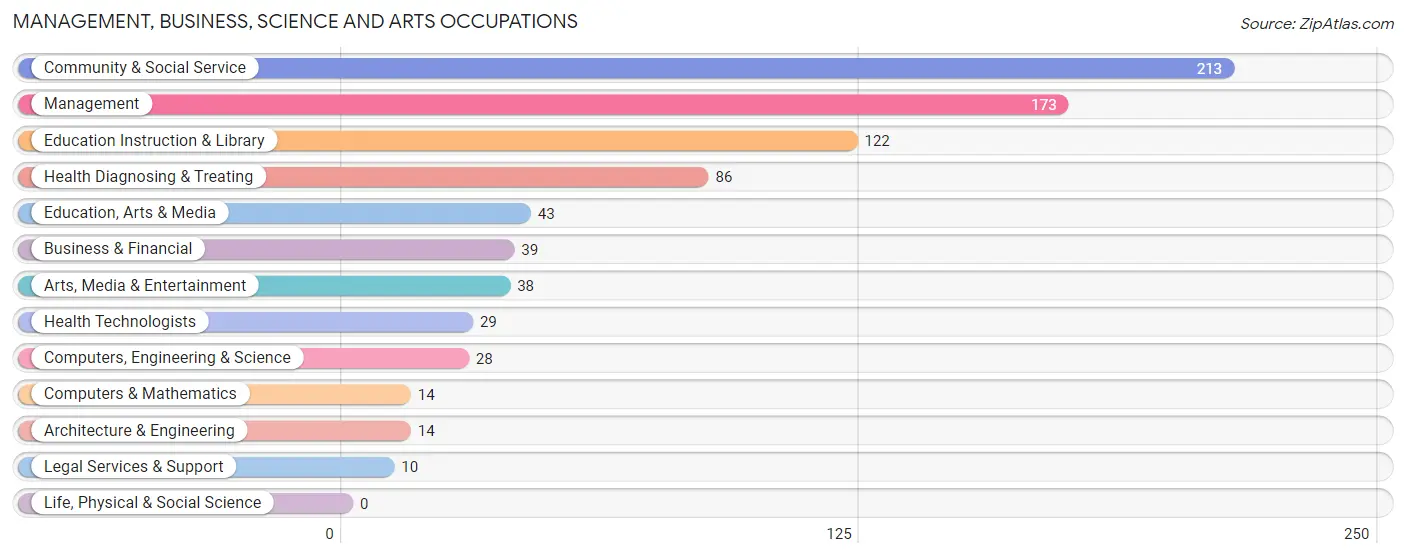
Management, Business, Science and Arts Occupations
The most common Management, Business, Science and Arts occupations in Huntingdon are Community & Social Service (213 | 12.0%), Management (173 | 9.7%), Education Instruction & Library (122 | 6.9%), Health Diagnosing & Treating (86 | 4.8%), and Education, Arts & Media (43 | 2.4%).
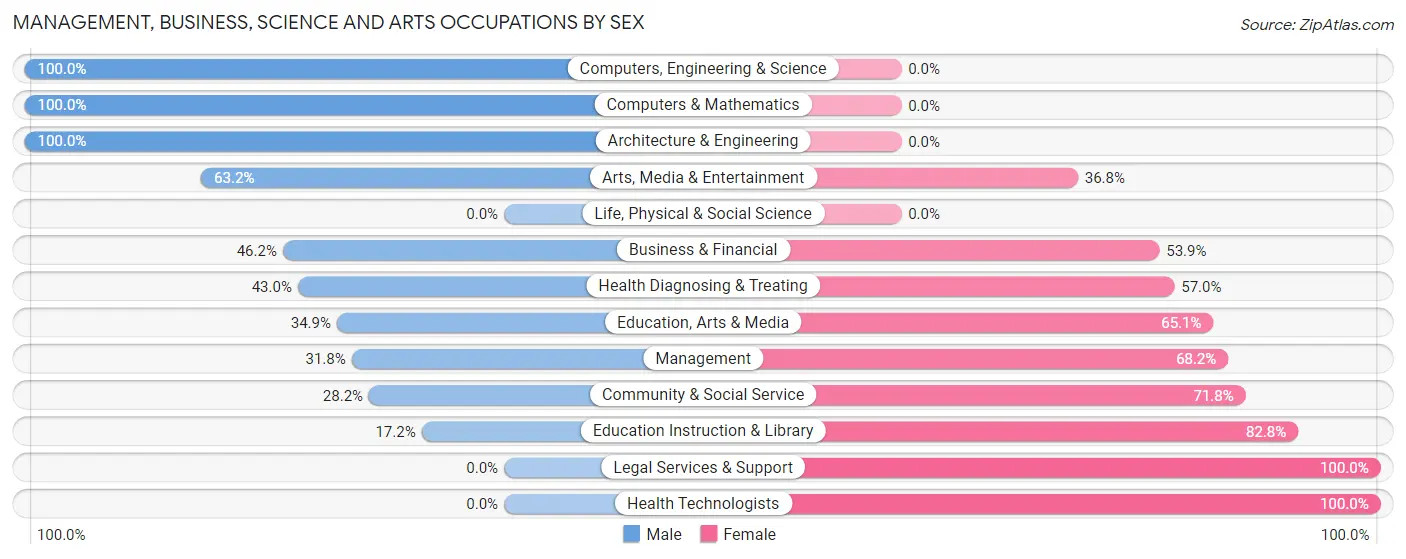
Management, Business, Science and Arts Occupations by Sex
Within the Management, Business, Science and Arts occupations in Huntingdon, the most male-oriented occupations are Computers, Engineering & Science (100.0%), Computers & Mathematics (100.0%), and Architecture & Engineering (100.0%), while the most female-oriented occupations are Legal Services & Support (100.0%), Health Technologists (100.0%), and Education Instruction & Library (82.8%).
| Occupation | Male | Female |
| Management | 55 (31.8%) | 118 (68.2%) |
| Business & Financial | 18 (46.2%) | 21 (53.8%) |
| Computers, Engineering & Science | 28 (100.0%) | 0 (0.0%) |
| Computers & Mathematics | 14 (100.0%) | 0 (0.0%) |
| Architecture & Engineering | 14 (100.0%) | 0 (0.0%) |
| Life, Physical & Social Science | 0 (0.0%) | 0 (0.0%) |
| Community & Social Service | 60 (28.2%) | 153 (71.8%) |
| Education, Arts & Media | 15 (34.9%) | 28 (65.1%) |
| Legal Services & Support | 0 (0.0%) | 10 (100.0%) |
| Education Instruction & Library | 21 (17.2%) | 101 (82.8%) |
| Arts, Media & Entertainment | 24 (63.2%) | 14 (36.8%) |
| Health Diagnosing & Treating | 37 (43.0%) | 49 (57.0%) |
| Health Technologists | 0 (0.0%) | 29 (100.0%) |
| Total (Category) | 198 (36.7%) | 341 (63.3%) |
| Total (Overall) | 922 (51.9%) | 856 (48.1%) |
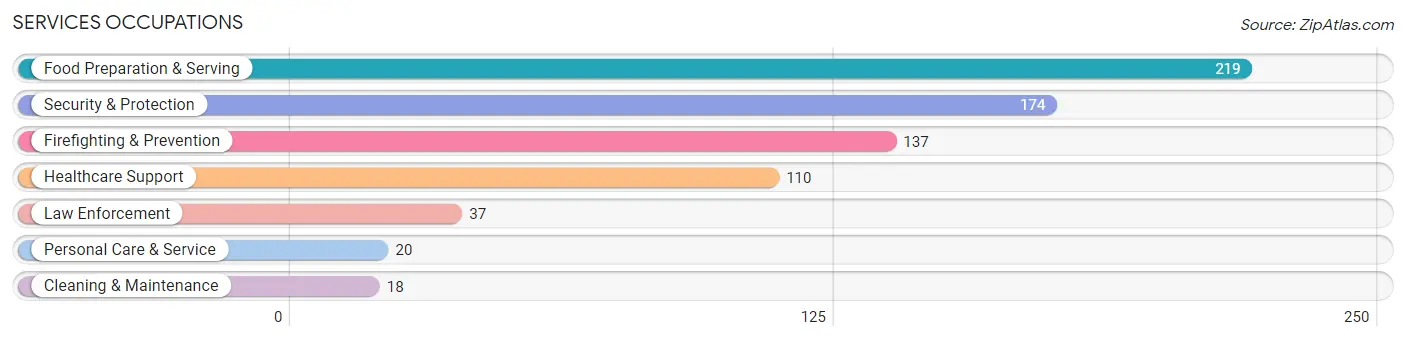
Services Occupations
The most common Services occupations in Huntingdon are Food Preparation & Serving (219 | 12.3%), Security & Protection (174 | 9.8%), Firefighting & Prevention (137 | 7.7%), Healthcare Support (110 | 6.2%), and Law Enforcement (37 | 2.1%).
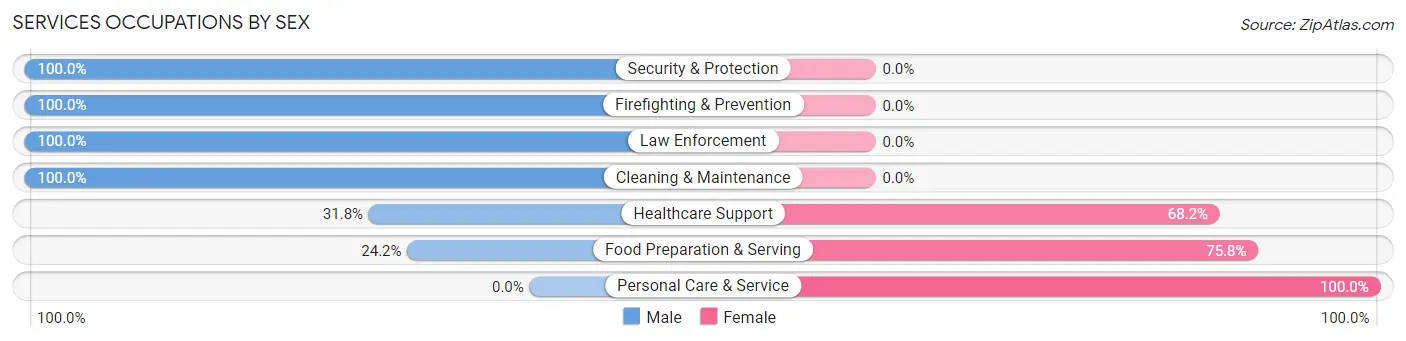
Services Occupations by Sex
Within the Services occupations in Huntingdon, the most male-oriented occupations are Security & Protection (100.0%), Firefighting & Prevention (100.0%), and Law Enforcement (100.0%), while the most female-oriented occupations are Personal Care & Service (100.0%), Food Preparation & Serving (75.8%), and Healthcare Support (68.2%).
| Occupation | Male | Female |
| Healthcare Support | 35 (31.8%) | 75 (68.2%) |
| Security & Protection | 174 (100.0%) | 0 (0.0%) |
| Firefighting & Prevention | 137 (100.0%) | 0 (0.0%) |
| Law Enforcement | 37 (100.0%) | 0 (0.0%) |
| Food Preparation & Serving | 53 (24.2%) | 166 (75.8%) |
| Cleaning & Maintenance | 18 (100.0%) | 0 (0.0%) |
| Personal Care & Service | 0 (0.0%) | 20 (100.0%) |
| Total (Category) | 280 (51.8%) | 261 (48.2%) |
| Total (Overall) | 922 (51.9%) | 856 (48.1%) |
Sales and Office Occupations
The most common Sales and Office occupations in Huntingdon are Office & Administration (229 | 12.9%), and Sales & Related (53 | 3.0%).
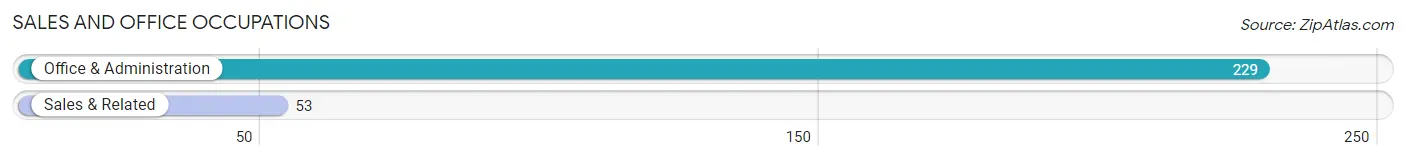
Sales and Office Occupations by Sex
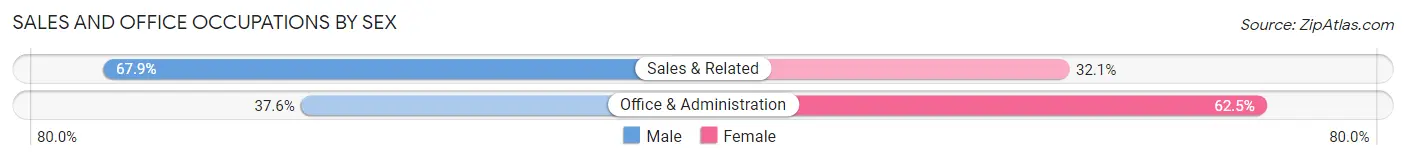
| Occupation | Male | Female |
| Sales & Related | 36 (67.9%) | 17 (32.1%) |
| Office & Administration | 86 (37.6%) | 143 (62.5%) |
| Total (Category) | 122 (43.3%) | 160 (56.7%) |
| Total (Overall) | 922 (51.9%) | 856 (48.1%) |
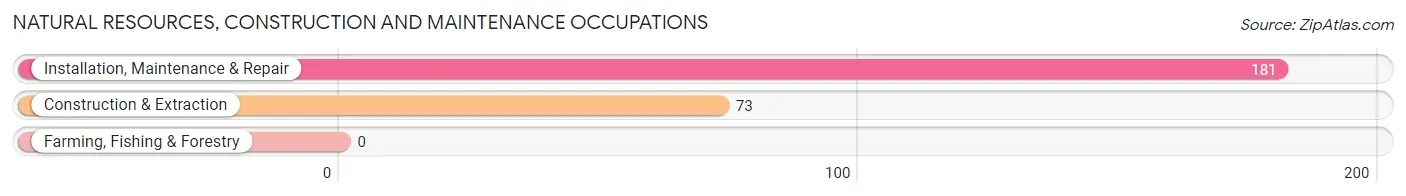
Natural Resources, Construction and Maintenance Occupations
The most common Natural Resources, Construction and Maintenance occupations in Huntingdon are Installation, Maintenance & Repair (181 | 10.2%), and Construction & Extraction (73 | 4.1%).
Natural Resources, Construction and Maintenance Occupations by Sex
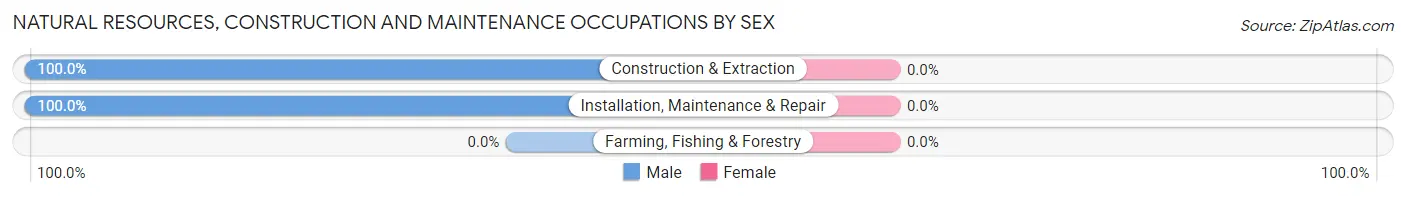
| Occupation | Male | Female |
| Farming, Fishing & Forestry | 0 (0.0%) | 0 (0.0%) |
| Construction & Extraction | 73 (100.0%) | 0 (0.0%) |
| Installation, Maintenance & Repair | 181 (100.0%) | 0 (0.0%) |
| Total (Category) | 254 (100.0%) | 0 (0.0%) |
| Total (Overall) | 922 (51.9%) | 856 (48.1%) |
Production, Transportation and Moving Occupations
The most common Production, Transportation and Moving occupations in Huntingdon are Production (100 | 5.6%), Material Moving (53 | 3.0%), and Transportation (9 | 0.5%).
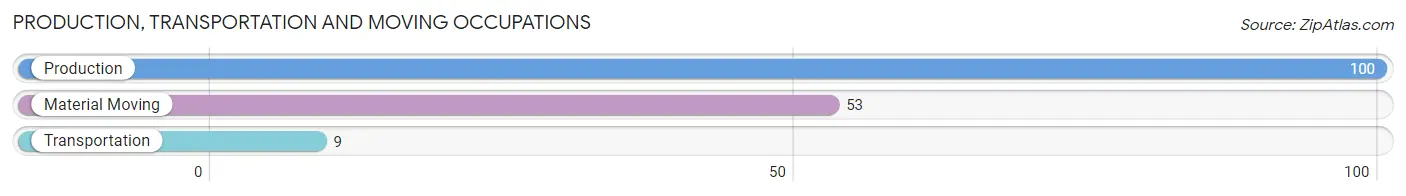
Production, Transportation and Moving Occupations by Sex
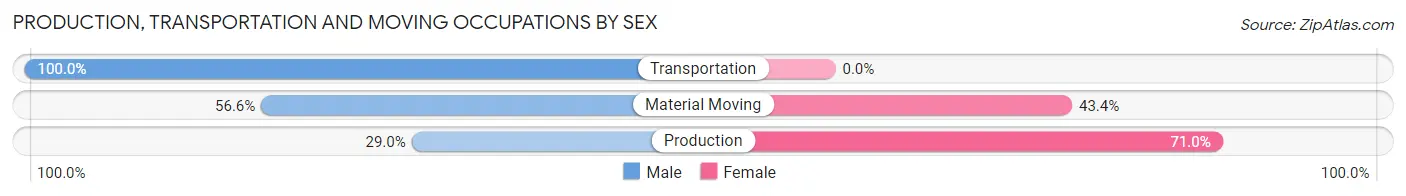
| Occupation | Male | Female |
| Production | 29 (29.0%) | 71 (71.0%) |
| Transportation | 9 (100.0%) | 0 (0.0%) |
| Material Moving | 30 (56.6%) | 23 (43.4%) |
| Total (Category) | 68 (42.0%) | 94 (58.0%) |
| Total (Overall) | 922 (51.9%) | 856 (48.1%) |
Employment Industries by Sex in Huntingdon
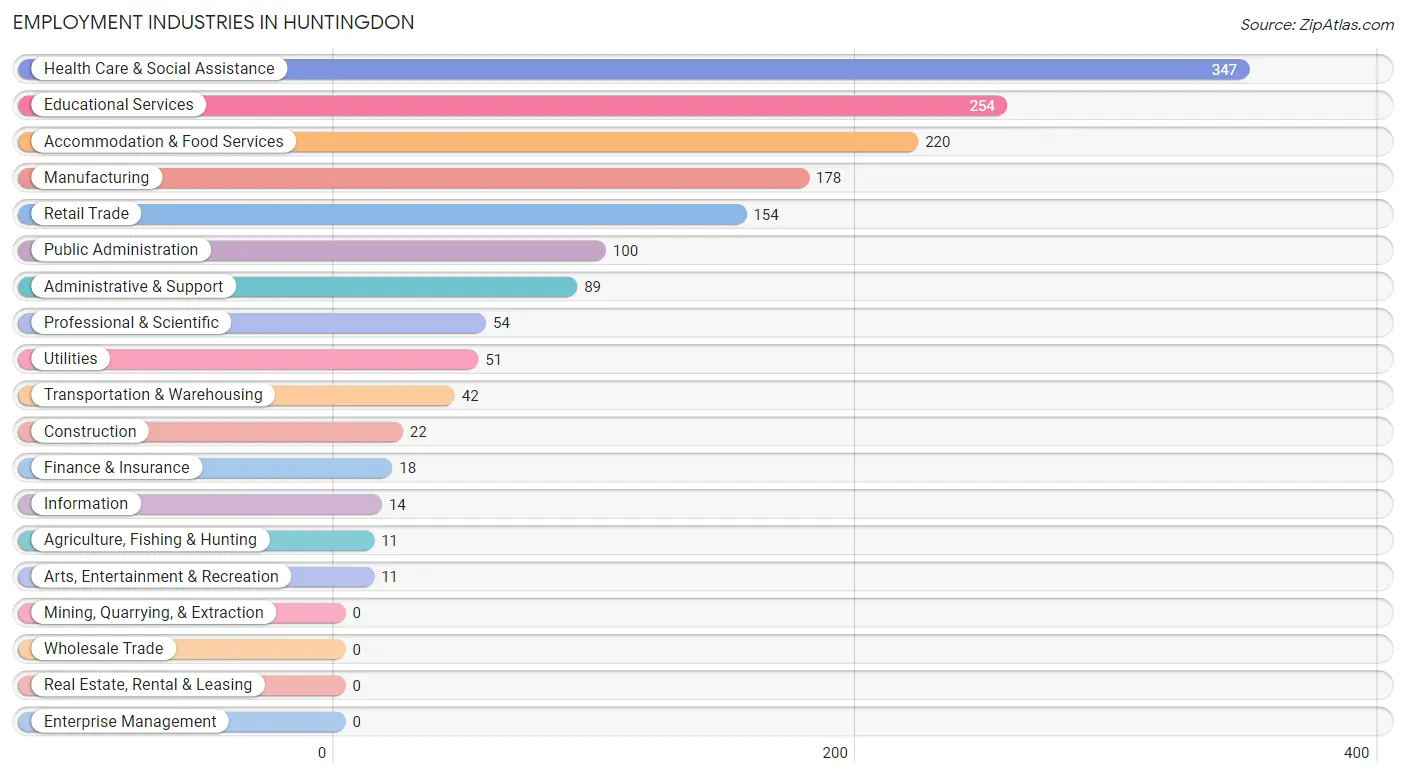
Employment Industries in Huntingdon
The major employment industries in Huntingdon include Health Care & Social Assistance (347 | 19.5%), Educational Services (254 | 14.3%), Accommodation & Food Services (220 | 12.4%), Manufacturing (178 | 10.0%), and Retail Trade (154 | 8.7%).
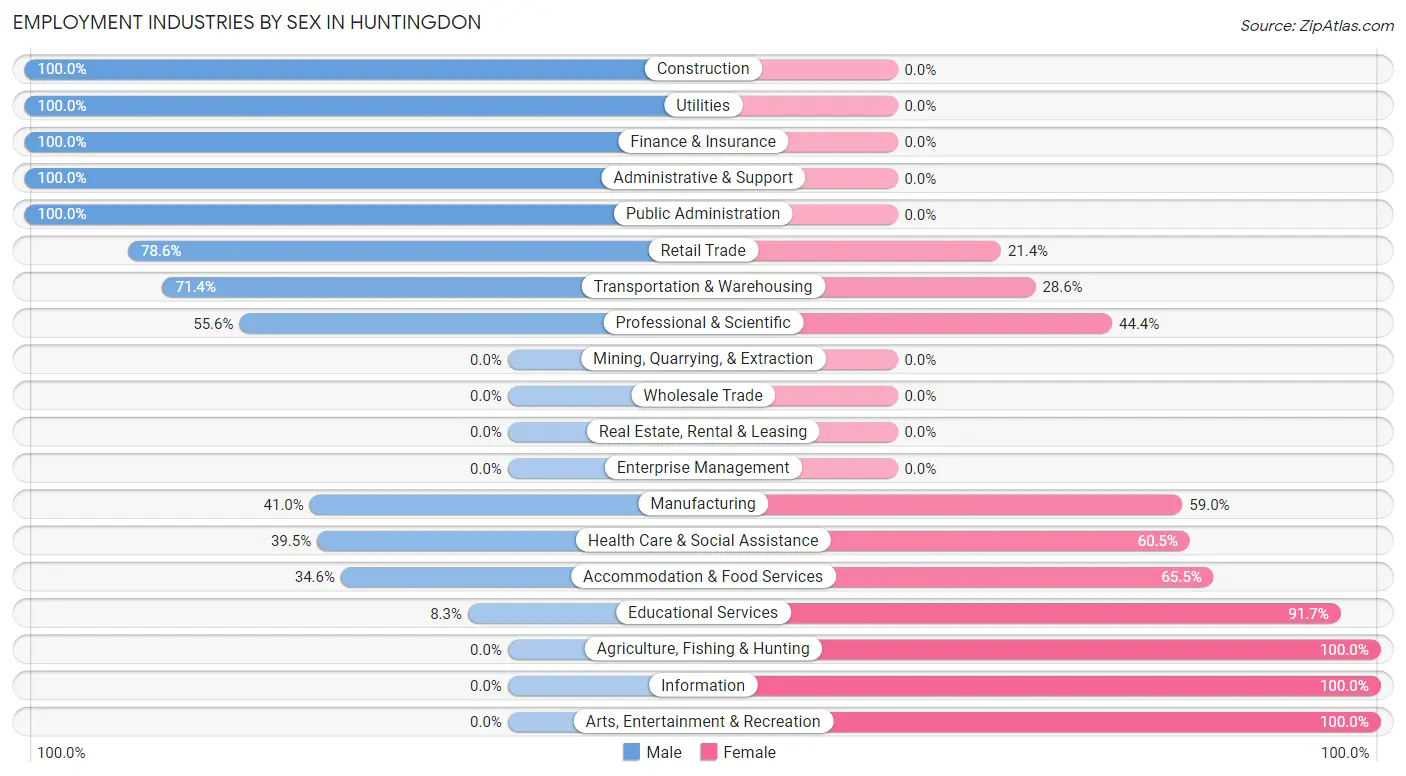
Employment Industries by Sex in Huntingdon
The Huntingdon industries that see more men than women are Construction (100.0%), Utilities (100.0%), and Finance & Insurance (100.0%), whereas the industries that tend to have a higher number of women are Agriculture, Fishing & Hunting (100.0%), Information (100.0%), and Arts, Entertainment & Recreation (100.0%).
| Industry | Male | Female |
| Agriculture, Fishing & Hunting | 0 (0.0%) | 11 (100.0%) |
| Mining, Quarrying, & Extraction | 0 (0.0%) | 0 (0.0%) |
| Construction | 22 (100.0%) | 0 (0.0%) |
| Manufacturing | 73 (41.0%) | 105 (59.0%) |
| Wholesale Trade | 0 (0.0%) | 0 (0.0%) |
| Retail Trade | 121 (78.6%) | 33 (21.4%) |
| Transportation & Warehousing | 30 (71.4%) | 12 (28.6%) |
| Utilities | 51 (100.0%) | 0 (0.0%) |
| Information | 0 (0.0%) | 14 (100.0%) |
| Finance & Insurance | 18 (100.0%) | 0 (0.0%) |
| Real Estate, Rental & Leasing | 0 (0.0%) | 0 (0.0%) |
| Professional & Scientific | 30 (55.6%) | 24 (44.4%) |
| Enterprise Management | 0 (0.0%) | 0 (0.0%) |
| Administrative & Support | 89 (100.0%) | 0 (0.0%) |
| Educational Services | 21 (8.3%) | 233 (91.7%) |
| Health Care & Social Assistance | 137 (39.5%) | 210 (60.5%) |
| Arts, Entertainment & Recreation | 0 (0.0%) | 11 (100.0%) |
| Accommodation & Food Services | 76 (34.5%) | 144 (65.4%) |
| Public Administration | 100 (100.0%) | 0 (0.0%) |
| Total | 922 (51.9%) | 856 (48.1%) |
Education in Huntingdon
School Enrollment in Huntingdon
The most common levels of schooling among the 1,173 students in Huntingdon are high school (342 | 29.2%), elementary school (324 | 27.6%), and college / undergraduate (160 | 13.6%).
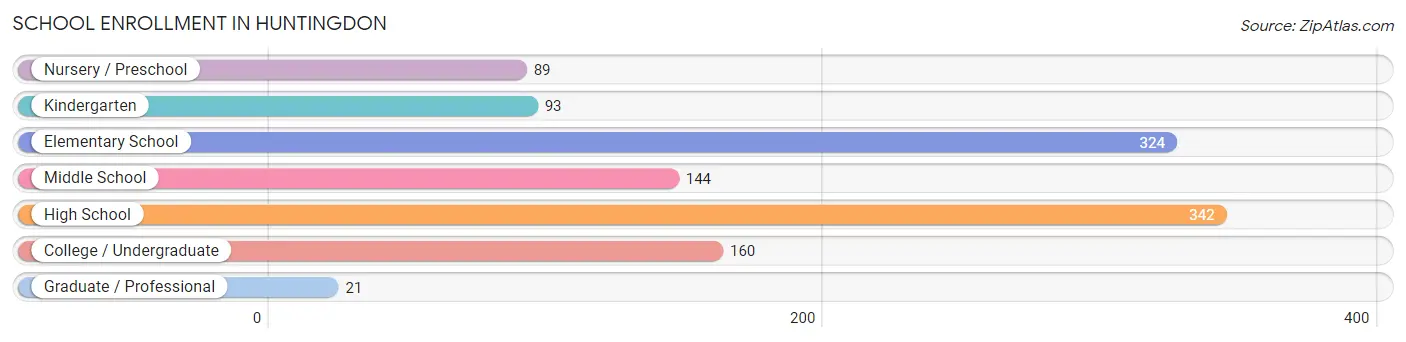
| School Level | # Students | % Students |
| Nursery / Preschool | 89 | 7.6% |
| Kindergarten | 93 | 7.9% |
| Elementary School | 324 | 27.6% |
| Middle School | 144 | 12.3% |
| High School | 342 | 29.2% |
| College / Undergraduate | 160 | 13.6% |
| Graduate / Professional | 21 | 1.8% |
| Total | 1,173 | 100.0% |
School Enrollment by Age by Funding Source in Huntingdon
Out of a total of 1,173 students who are enrolled in schools in Huntingdon, 205 (17.5%) attend a private institution, while the remaining 968 (82.5%) are enrolled in public schools. The age group of 18 to 19 year olds has the highest likelihood of being enrolled in private schools, with 65 (100.0% in the age bracket) enrolled. Conversely, the age group of 10 to 14 year olds has the lowest likelihood of being enrolled in a private school, with 257 (100.0% in the age bracket) attending a public institution.
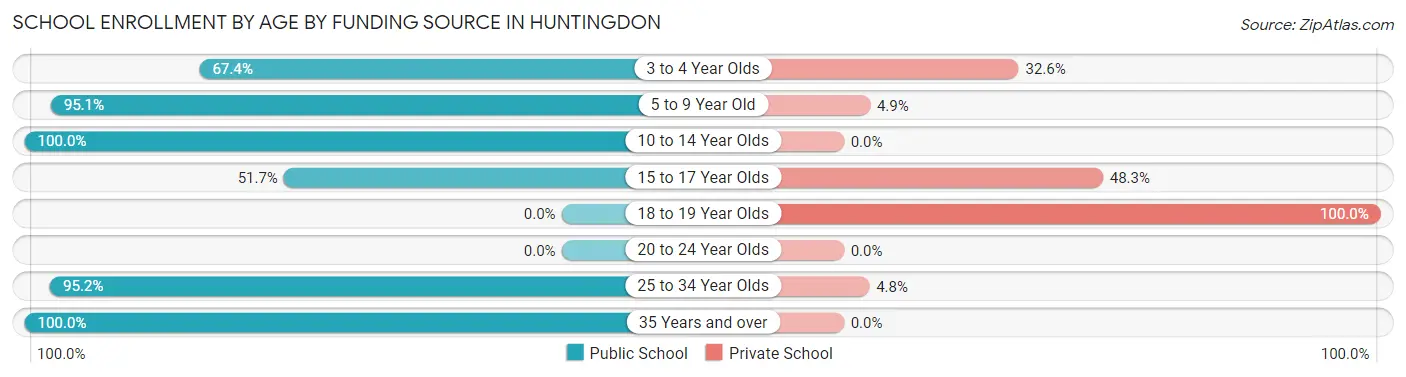
| Age Bracket | Public School | Private School |
| 3 to 4 Year Olds | 60 (67.4%) | 29 (32.6%) |
| 5 to 9 Year Old | 389 (95.1%) | 20 (4.9%) |
| 10 to 14 Year Olds | 257 (100.0%) | 0 (0.0%) |
| 15 to 17 Year Olds | 89 (51.7%) | 83 (48.3%) |
| 18 to 19 Year Olds | 0 (0.0%) | 65 (100.0%) |
| 20 to 24 Year Olds | 0 (0.0%) | 0 (0.0%) |
| 25 to 34 Year Olds | 160 (95.2%) | 8 (4.8%) |
| 35 Years and over | 13 (100.0%) | 0 (0.0%) |
| Total | 968 (82.5%) | 205 (17.5%) |
Educational Attainment by Field of Study in Huntingdon
Business (257 | 33.8%), social sciences (78 | 10.3%), visual & performing arts (74 | 9.7%), education (65 | 8.6%), and physical & health sciences (62 | 8.2%) are the most common fields of study among 760 individuals in Huntingdon who have obtained a bachelor's degree or higher.
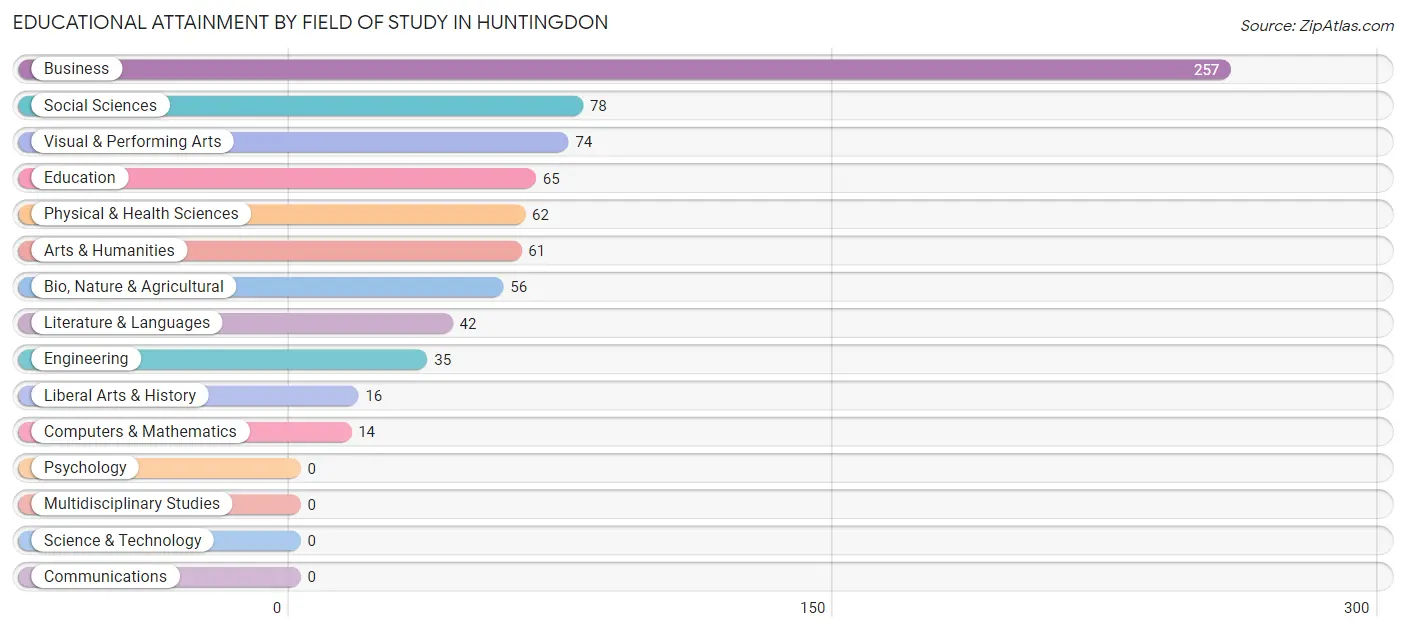
| Field of Study | # Graduates | % Graduates |
| Computers & Mathematics | 14 | 1.8% |
| Bio, Nature & Agricultural | 56 | 7.4% |
| Physical & Health Sciences | 62 | 8.2% |
| Psychology | 0 | 0.0% |
| Social Sciences | 78 | 10.3% |
| Engineering | 35 | 4.6% |
| Multidisciplinary Studies | 0 | 0.0% |
| Science & Technology | 0 | 0.0% |
| Business | 257 | 33.8% |
| Education | 65 | 8.6% |
| Literature & Languages | 42 | 5.5% |
| Liberal Arts & History | 16 | 2.1% |
| Visual & Performing Arts | 74 | 9.7% |
| Communications | 0 | 0.0% |
| Arts & Humanities | 61 | 8.0% |
| Total | 760 | 100.0% |
Transportation & Commute in Huntingdon
Vehicle Availability by Sex in Huntingdon
The most prevalent vehicle ownership categories in Huntingdon are males with 2 vehicles (367, accounting for 40.6%) and females with 2 vehicles (346, making up 42.9%).
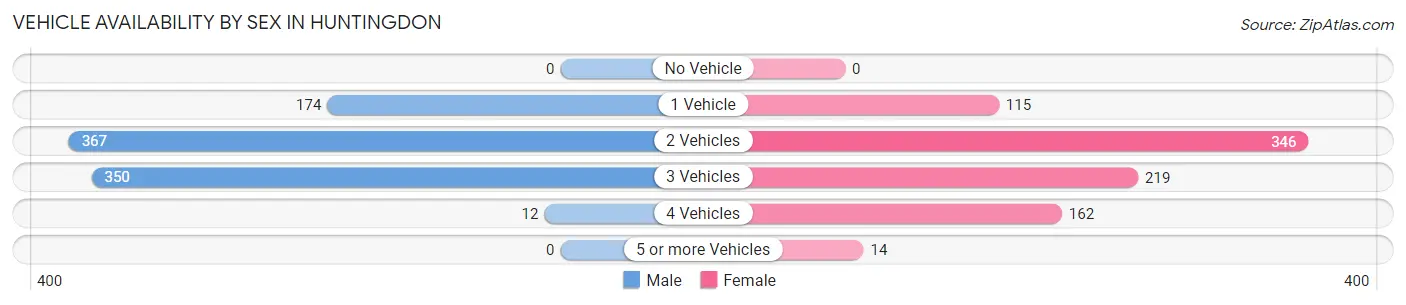
| Vehicles Available | Male | Female |
| No Vehicle | 0 (0.0%) | 0 (0.0%) |
| 1 Vehicle | 174 (19.3%) | 115 (13.4%) |
| 2 Vehicles | 367 (40.6%) | 346 (40.4%) |
| 3 Vehicles | 350 (38.8%) | 219 (25.6%) |
| 4 Vehicles | 12 (1.3%) | 162 (18.9%) |
| 5 or more Vehicles | 0 (0.0%) | 14 (1.6%) |
| Total | 903 (100.0%) | 856 (100.0%) |
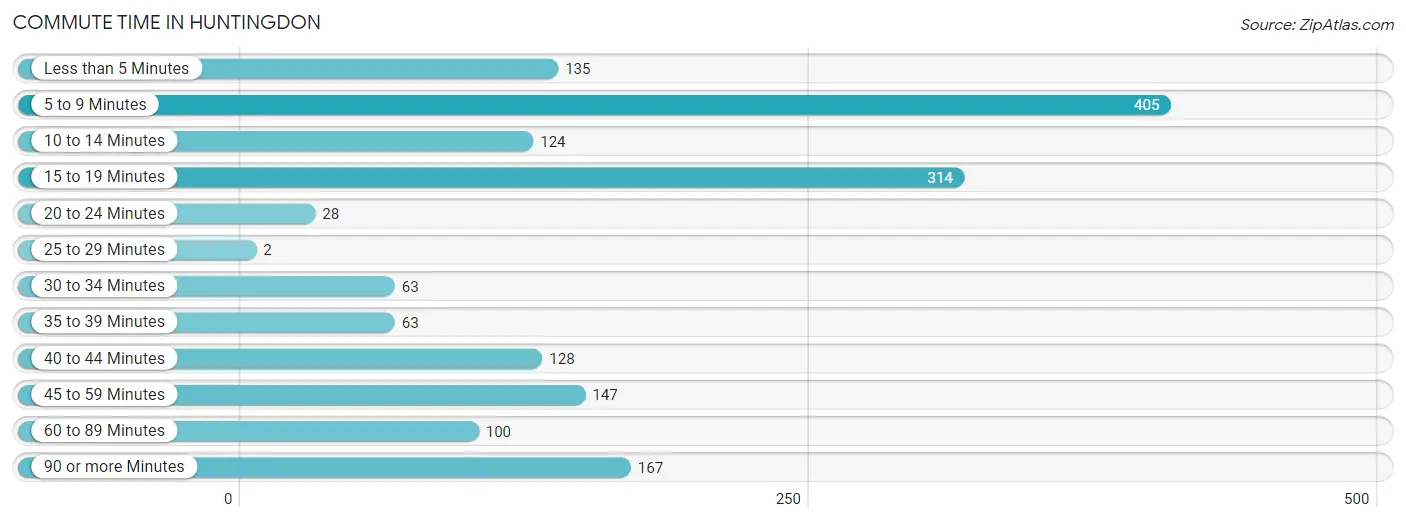
Commute Time in Huntingdon
The most frequently occuring commute durations in Huntingdon are 5 to 9 minutes (405 commuters, 24.2%), 15 to 19 minutes (314 commuters, 18.7%), and 90 or more minutes (167 commuters, 10.0%).
| Commute Time | # Commuters | % Commuters |
| Less than 5 Minutes | 135 | 8.1% |
| 5 to 9 Minutes | 405 | 24.2% |
| 10 to 14 Minutes | 124 | 7.4% |
| 15 to 19 Minutes | 314 | 18.7% |
| 20 to 24 Minutes | 28 | 1.7% |
| 25 to 29 Minutes | 2 | 0.1% |
| 30 to 34 Minutes | 63 | 3.8% |
| 35 to 39 Minutes | 63 | 3.8% |
| 40 to 44 Minutes | 128 | 7.6% |
| 45 to 59 Minutes | 147 | 8.8% |
| 60 to 89 Minutes | 100 | 6.0% |
| 90 or more Minutes | 167 | 10.0% |
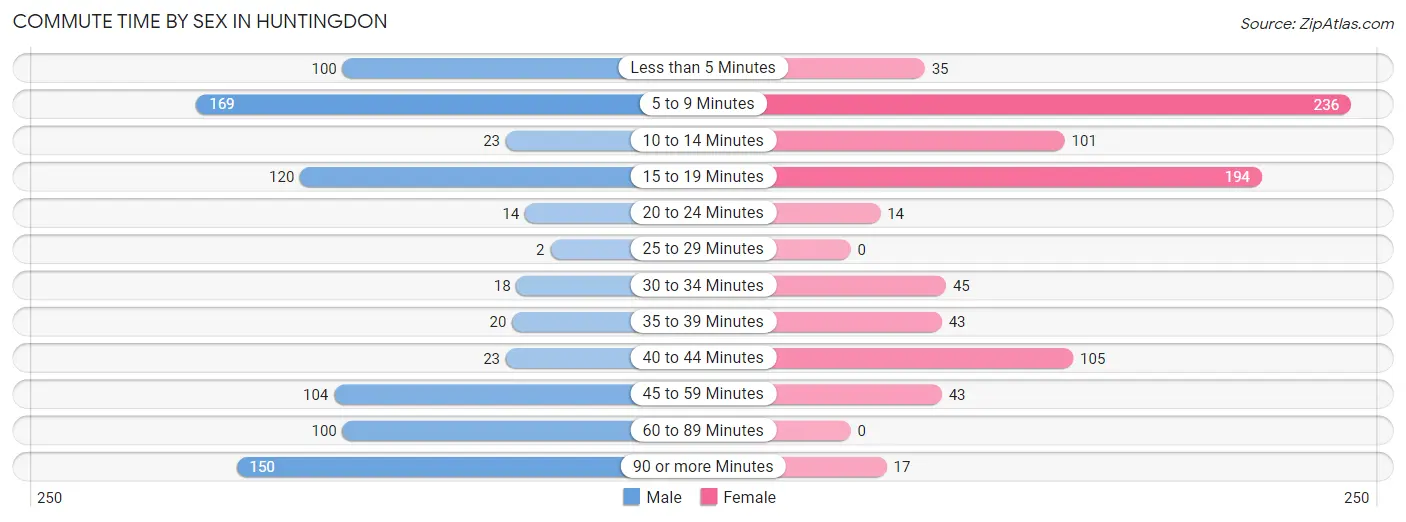
Commute Time by Sex in Huntingdon
The most common commute times in Huntingdon are 5 to 9 minutes (169 commuters, 20.1%) for males and 5 to 9 minutes (236 commuters, 28.3%) for females.
| Commute Time | Male | Female |
| Less than 5 Minutes | 100 (11.9%) | 35 (4.2%) |
| 5 to 9 Minutes | 169 (20.1%) | 236 (28.3%) |
| 10 to 14 Minutes | 23 (2.7%) | 101 (12.1%) |
| 15 to 19 Minutes | 120 (14.2%) | 194 (23.3%) |
| 20 to 24 Minutes | 14 (1.7%) | 14 (1.7%) |
| 25 to 29 Minutes | 2 (0.2%) | 0 (0.0%) |
| 30 to 34 Minutes | 18 (2.1%) | 45 (5.4%) |
| 35 to 39 Minutes | 20 (2.4%) | 43 (5.2%) |
| 40 to 44 Minutes | 23 (2.7%) | 105 (12.6%) |
| 45 to 59 Minutes | 104 (12.3%) | 43 (5.2%) |
| 60 to 89 Minutes | 100 (11.9%) | 0 (0.0%) |
| 90 or more Minutes | 150 (17.8%) | 17 (2.0%) |
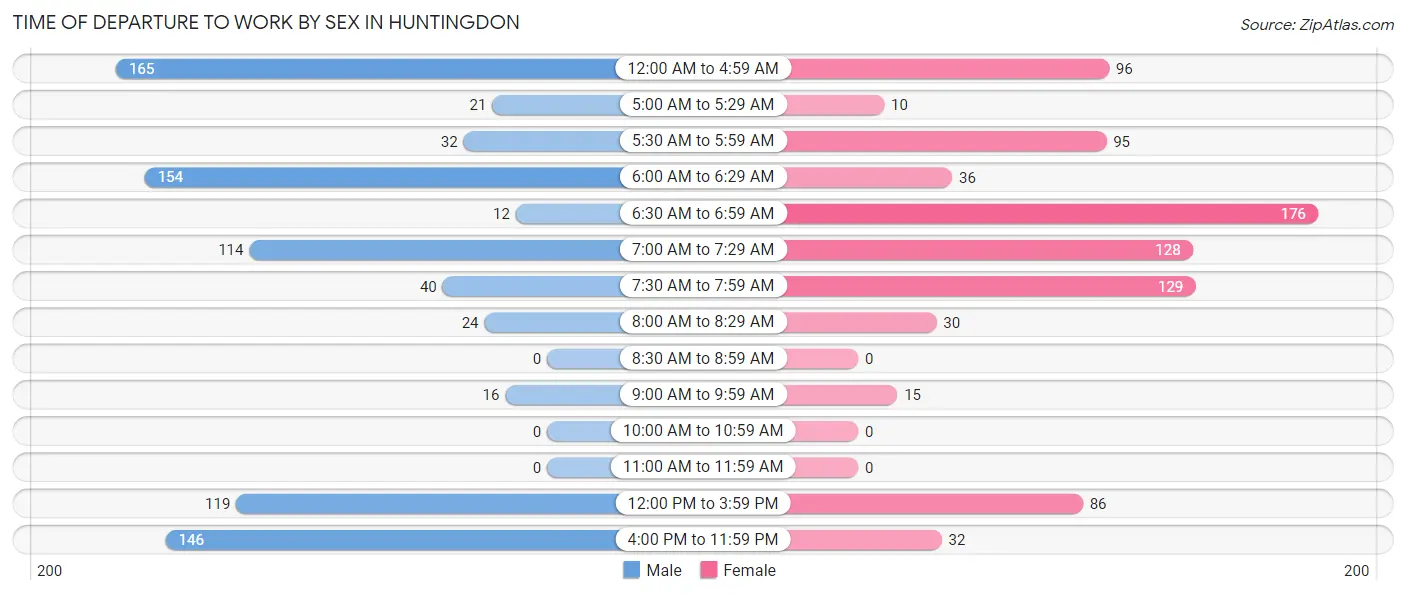
Time of Departure to Work by Sex in Huntingdon
The most frequent times of departure to work in Huntingdon are 12:00 AM to 4:59 AM (165, 19.6%) for males and 6:30 AM to 6:59 AM (176, 21.1%) for females.
| Time of Departure | Male | Female |
| 12:00 AM to 4:59 AM | 165 (19.6%) | 96 (11.5%) |
| 5:00 AM to 5:29 AM | 21 (2.5%) | 10 (1.2%) |
| 5:30 AM to 5:59 AM | 32 (3.8%) | 95 (11.4%) |
| 6:00 AM to 6:29 AM | 154 (18.3%) | 36 (4.3%) |
| 6:30 AM to 6:59 AM | 12 (1.4%) | 176 (21.1%) |
| 7:00 AM to 7:29 AM | 114 (13.5%) | 128 (15.4%) |
| 7:30 AM to 7:59 AM | 40 (4.7%) | 129 (15.5%) |
| 8:00 AM to 8:29 AM | 24 (2.9%) | 30 (3.6%) |
| 8:30 AM to 8:59 AM | 0 (0.0%) | 0 (0.0%) |
| 9:00 AM to 9:59 AM | 16 (1.9%) | 15 (1.8%) |
| 10:00 AM to 10:59 AM | 0 (0.0%) | 0 (0.0%) |
| 11:00 AM to 11:59 AM | 0 (0.0%) | 0 (0.0%) |
| 12:00 PM to 3:59 PM | 119 (14.1%) | 86 (10.3%) |
| 4:00 PM to 11:59 PM | 146 (17.3%) | 32 (3.8%) |
| Total | 843 (100.0%) | 833 (100.0%) |
Housing Occupancy in Huntingdon
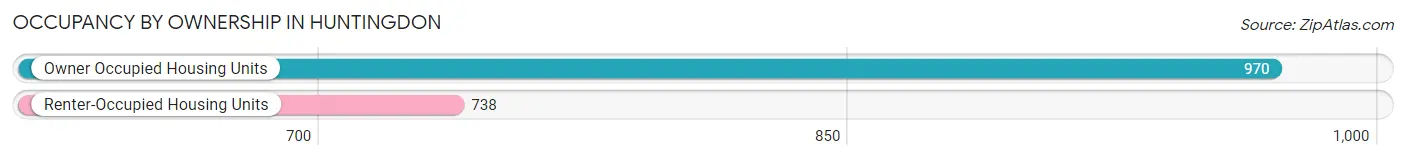
Occupancy by Ownership in Huntingdon
Of the total 1,708 dwellings in Huntingdon, owner-occupied units account for 970 (56.8%), while renter-occupied units make up 738 (43.2%).
| Occupancy | # Housing Units | % Housing Units |
| Owner Occupied Housing Units | 970 | 56.8% |
| Renter-Occupied Housing Units | 738 | 43.2% |
| Total Occupied Housing Units | 1,708 | 100.0% |
Occupancy by Household Size in Huntingdon
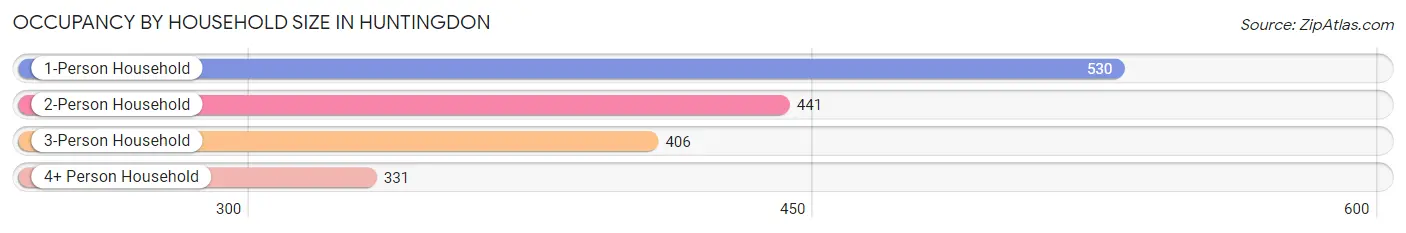
| Household Size | # Housing Units | % Housing Units |
| 1-Person Household | 530 | 31.0% |
| 2-Person Household | 441 | 25.8% |
| 3-Person Household | 406 | 23.8% |
| 4+ Person Household | 331 | 19.4% |
| Total Housing Units | 1,708 | 100.0% |
Occupancy by Ownership by Household Size in Huntingdon
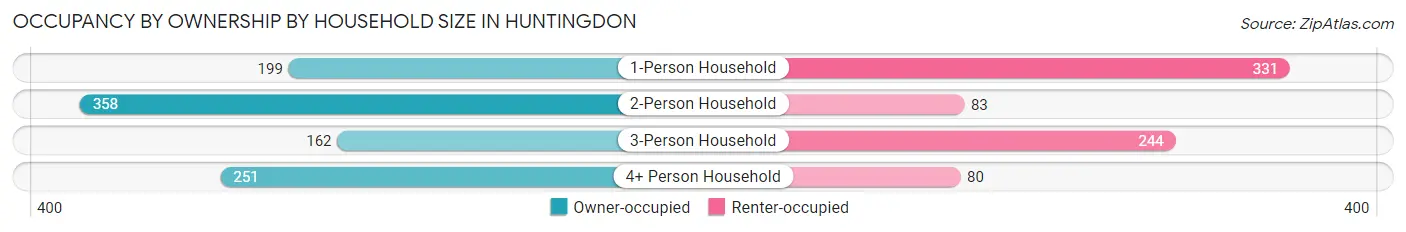
| Household Size | Owner-occupied | Renter-occupied |
| 1-Person Household | 199 (37.6%) | 331 (62.5%) |
| 2-Person Household | 358 (81.2%) | 83 (18.8%) |
| 3-Person Household | 162 (39.9%) | 244 (60.1%) |
| 4+ Person Household | 251 (75.8%) | 80 (24.2%) |
| Total Housing Units | 970 (56.8%) | 738 (43.2%) |
Occupancy by Educational Attainment in Huntingdon
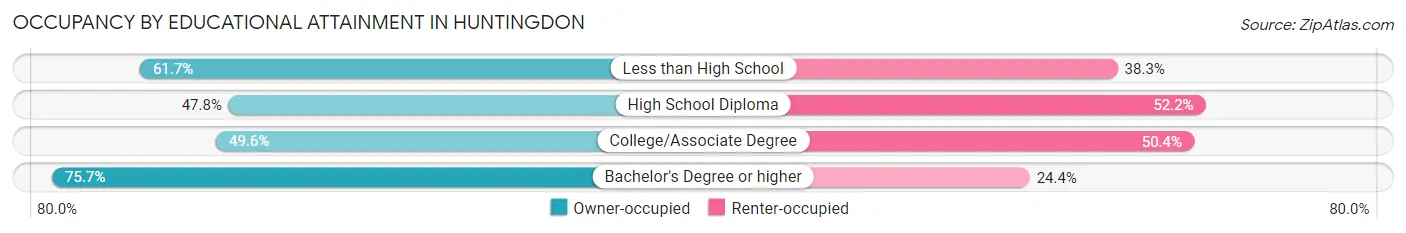
| Household Size | Owner-occupied | Renter-occupied |
| Less than High School | 116 (61.7%) | 72 (38.3%) |
| High School Diploma | 269 (47.8%) | 294 (52.2%) |
| College/Associate Degree | 265 (49.6%) | 269 (50.4%) |
| Bachelor's Degree or higher | 320 (75.6%) | 103 (24.3%) |
Occupancy by Age of Householder in Huntingdon
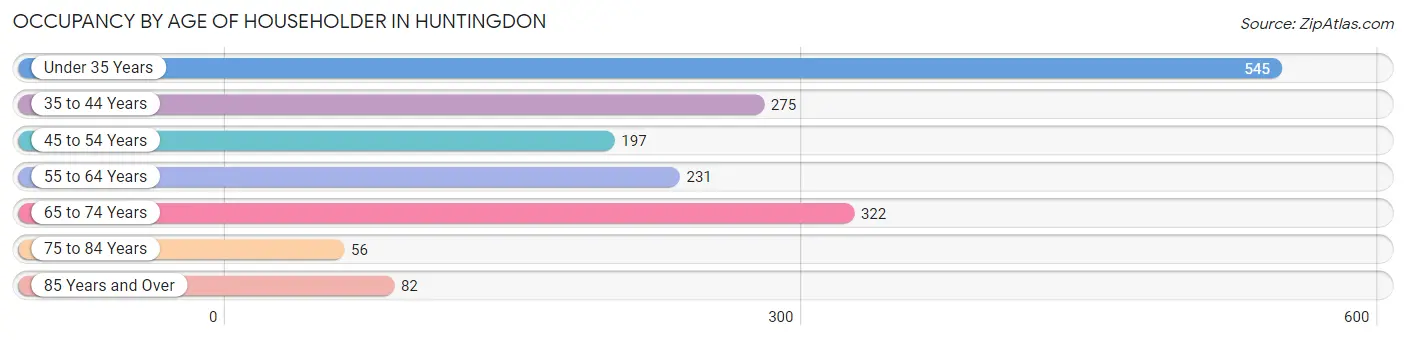
| Age Bracket | # Households | % Households |
| Under 35 Years | 545 | 31.9% |
| 35 to 44 Years | 275 | 16.1% |
| 45 to 54 Years | 197 | 11.5% |
| 55 to 64 Years | 231 | 13.5% |
| 65 to 74 Years | 322 | 18.9% |
| 75 to 84 Years | 56 | 3.3% |
| 85 Years and Over | 82 | 4.8% |
| Total | 1,708 | 100.0% |
Housing Finances in Huntingdon
Median Income by Occupancy in Huntingdon
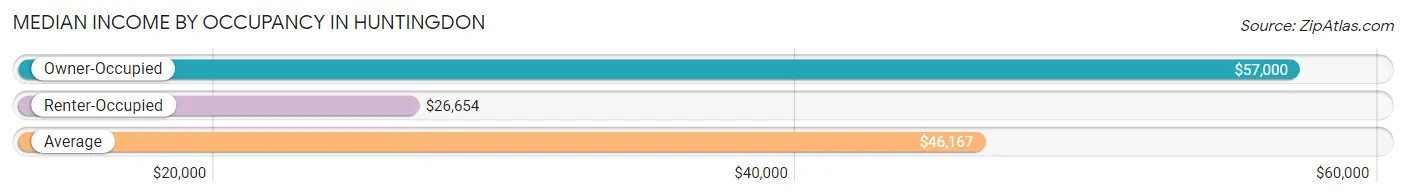
| Occupancy Type | # Households | Median Income |
| Owner-Occupied | 970 (56.8%) | $57,000 |
| Renter-Occupied | 738 (43.2%) | $26,654 |
| Average | 1,708 (100.0%) | $46,167 |
Occupancy by Householder Income Bracket in Huntingdon
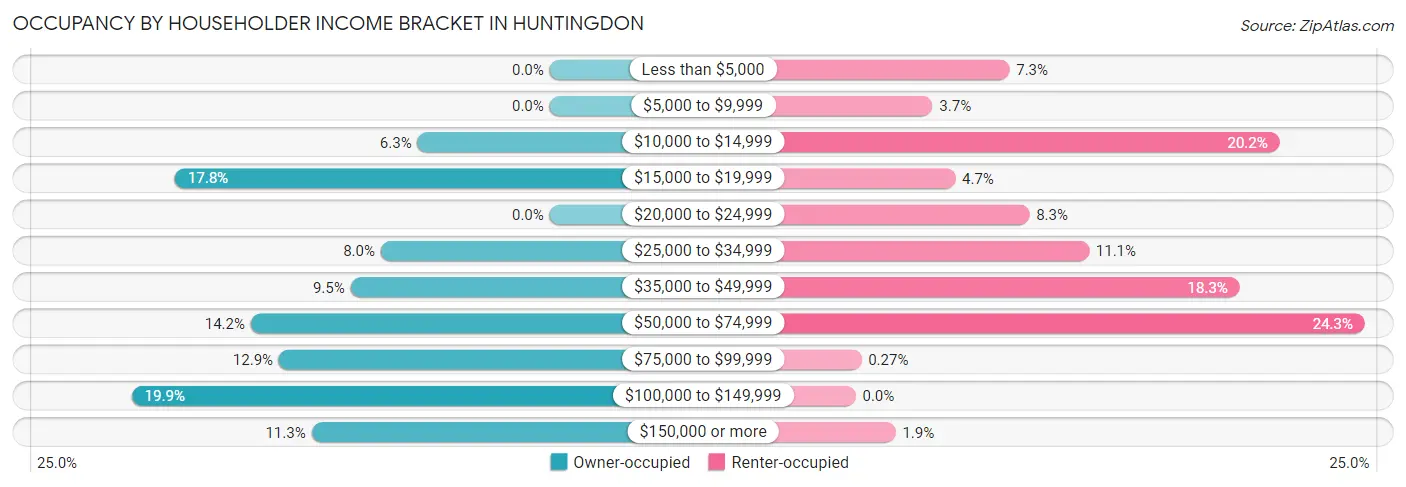
| Income Bracket | Owner-occupied | Renter-occupied |
| Less than $5,000 | 0 (0.0%) | 54 (7.3%) |
| $5,000 to $9,999 | 0 (0.0%) | 27 (3.7%) |
| $10,000 to $14,999 | 61 (6.3%) | 149 (20.2%) |
| $15,000 to $19,999 | 173 (17.8%) | 35 (4.7%) |
| $20,000 to $24,999 | 0 (0.0%) | 61 (8.3%) |
| $25,000 to $34,999 | 78 (8.0%) | 82 (11.1%) |
| $35,000 to $49,999 | 92 (9.5%) | 135 (18.3%) |
| $50,000 to $74,999 | 138 (14.2%) | 179 (24.2%) |
| $75,000 to $99,999 | 125 (12.9%) | 2 (0.3%) |
| $100,000 to $149,999 | 193 (19.9%) | 0 (0.0%) |
| $150,000 or more | 110 (11.3%) | 14 (1.9%) |
| Total | 970 (100.0%) | 738 (100.0%) |
Monthly Housing Cost Tiers in Huntingdon
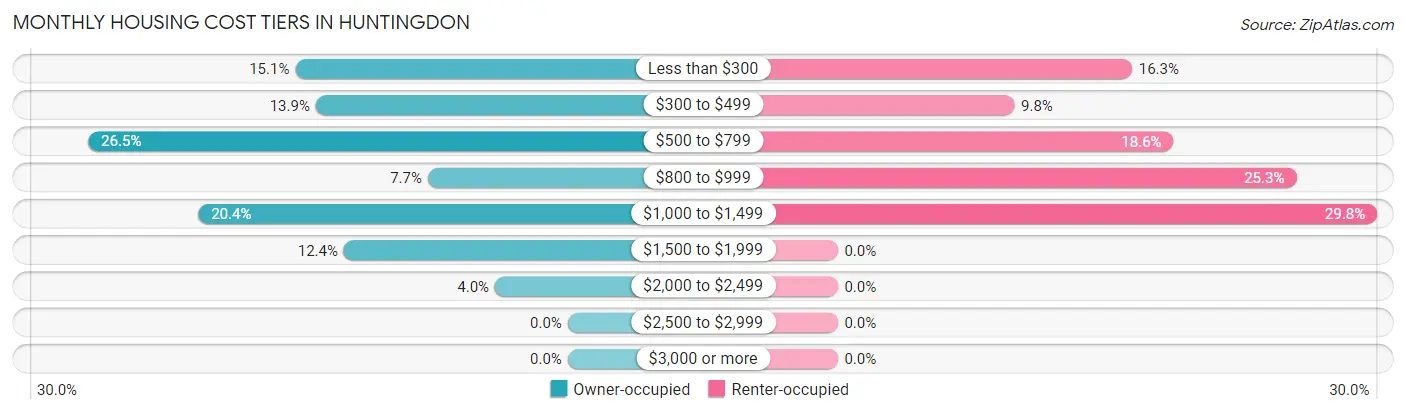
| Monthly Cost | Owner-occupied | Renter-occupied |
| Less than $300 | 146 (15.0%) | 120 (16.3%) |
| $300 to $499 | 135 (13.9%) | 72 (9.8%) |
| $500 to $799 | 257 (26.5%) | 137 (18.6%) |
| $800 to $999 | 75 (7.7%) | 187 (25.3%) |
| $1,000 to $1,499 | 198 (20.4%) | 220 (29.8%) |
| $1,500 to $1,999 | 120 (12.4%) | 0 (0.0%) |
| $2,000 to $2,499 | 39 (4.0%) | 0 (0.0%) |
| $2,500 to $2,999 | 0 (0.0%) | 0 (0.0%) |
| $3,000 or more | 0 (0.0%) | 0 (0.0%) |
| Total | 970 (100.0%) | 738 (100.0%) |
Physical Housing Characteristics in Huntingdon
Housing Structures in Huntingdon
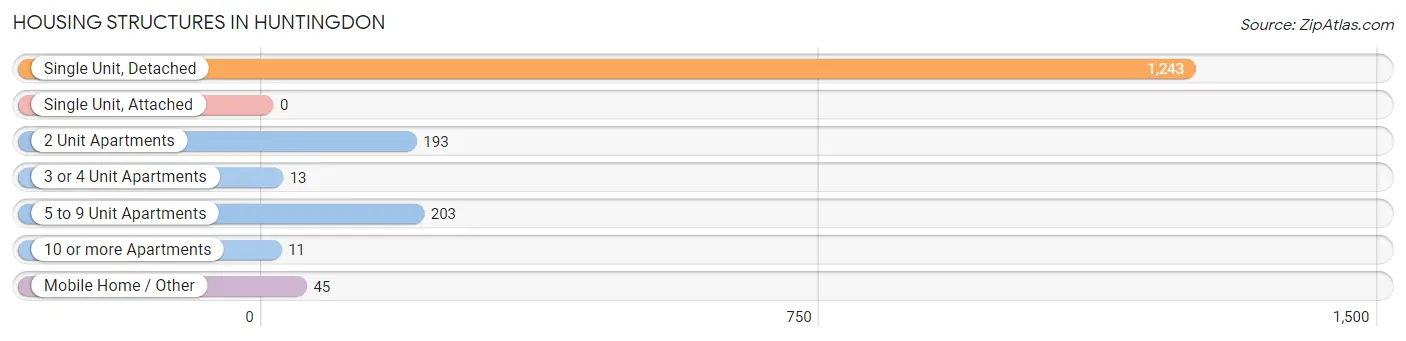
| Structure Type | # Housing Units | % Housing Units |
| Single Unit, Detached | 1,243 | 72.8% |
| Single Unit, Attached | 0 | 0.0% |
| 2 Unit Apartments | 193 | 11.3% |
| 3 or 4 Unit Apartments | 13 | 0.8% |
| 5 to 9 Unit Apartments | 203 | 11.9% |
| 10 or more Apartments | 11 | 0.6% |
| Mobile Home / Other | 45 | 2.6% |
| Total | 1,708 | 100.0% |
Housing Structures by Occupancy in Huntingdon
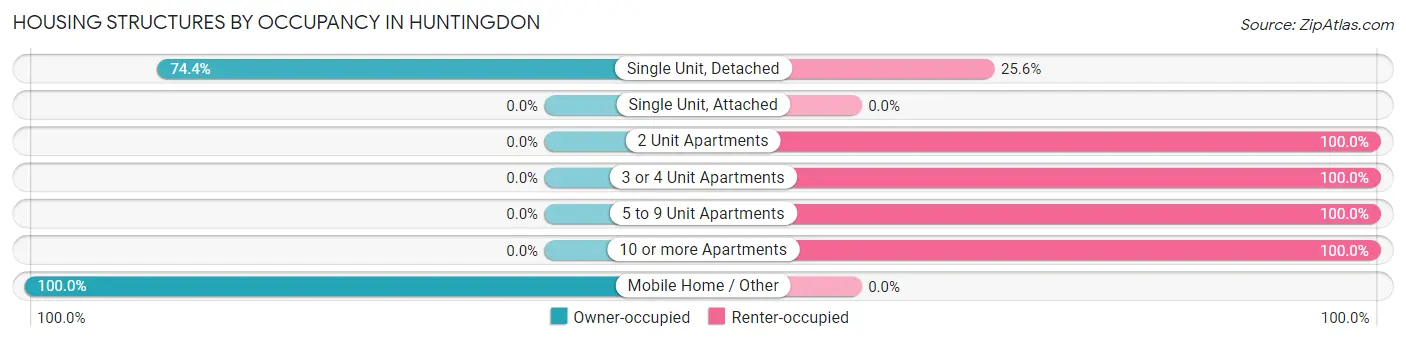
| Structure Type | Owner-occupied | Renter-occupied |
| Single Unit, Detached | 925 (74.4%) | 318 (25.6%) |
| Single Unit, Attached | 0 (0.0%) | 0 (0.0%) |
| 2 Unit Apartments | 0 (0.0%) | 193 (100.0%) |
| 3 or 4 Unit Apartments | 0 (0.0%) | 13 (100.0%) |
| 5 to 9 Unit Apartments | 0 (0.0%) | 203 (100.0%) |
| 10 or more Apartments | 0 (0.0%) | 11 (100.0%) |
| Mobile Home / Other | 45 (100.0%) | 0 (0.0%) |
| Total | 970 (56.8%) | 738 (43.2%) |
Housing Structures by Number of Rooms in Huntingdon
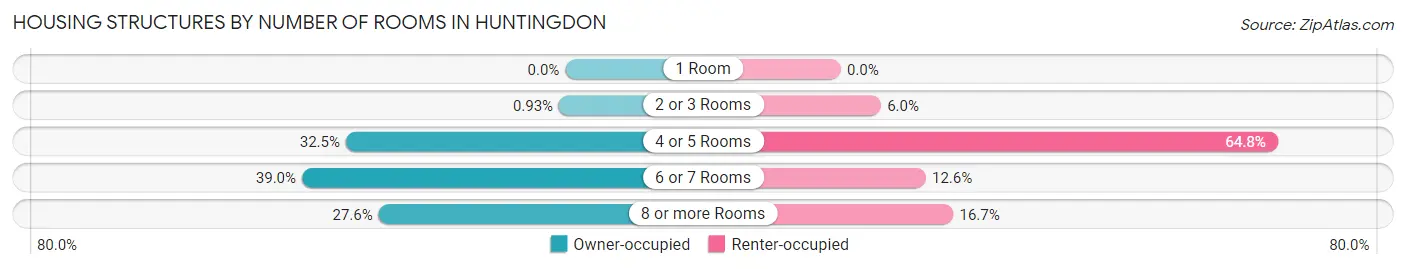
| Number of Rooms | Owner-occupied | Renter-occupied |
| 1 Room | 0 (0.0%) | 0 (0.0%) |
| 2 or 3 Rooms | 9 (0.9%) | 44 (6.0%) |
| 4 or 5 Rooms | 315 (32.5%) | 478 (64.8%) |
| 6 or 7 Rooms | 378 (39.0%) | 93 (12.6%) |
| 8 or more Rooms | 268 (27.6%) | 123 (16.7%) |
| Total | 970 (100.0%) | 738 (100.0%) |
Housing Structure by Heating Type in Huntingdon
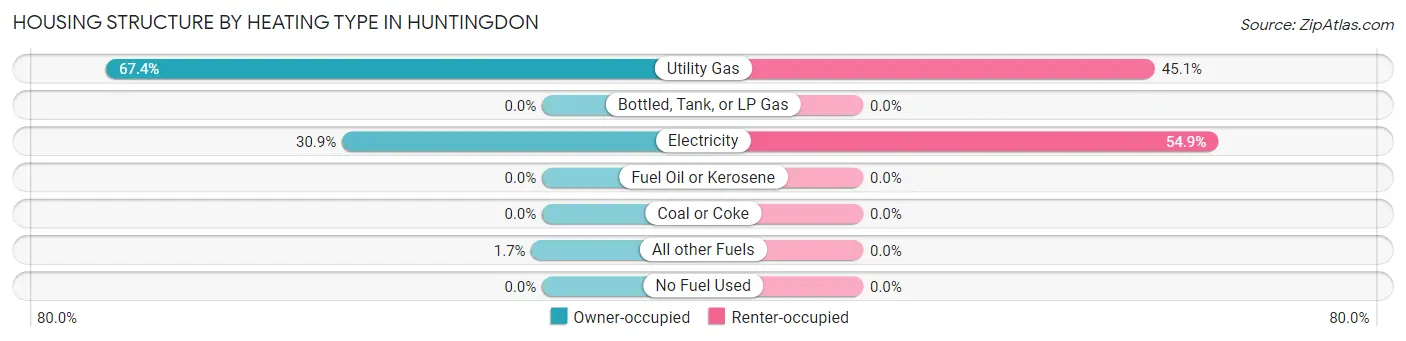
| Heating Type | Owner-occupied | Renter-occupied |
| Utility Gas | 654 (67.4%) | 333 (45.1%) |
| Bottled, Tank, or LP Gas | 0 (0.0%) | 0 (0.0%) |
| Electricity | 300 (30.9%) | 405 (54.9%) |
| Fuel Oil or Kerosene | 0 (0.0%) | 0 (0.0%) |
| Coal or Coke | 0 (0.0%) | 0 (0.0%) |
| All other Fuels | 16 (1.7%) | 0 (0.0%) |
| No Fuel Used | 0 (0.0%) | 0 (0.0%) |
| Total | 970 (100.0%) | 738 (100.0%) |
Household Vehicle Usage in Huntingdon
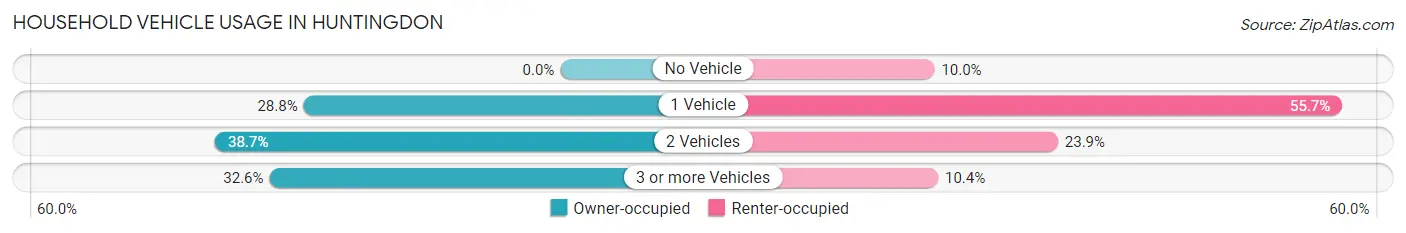
| Vehicles per Household | Owner-occupied | Renter-occupied |
| No Vehicle | 0 (0.0%) | 74 (10.0%) |
| 1 Vehicle | 279 (28.8%) | 411 (55.7%) |
| 2 Vehicles | 375 (38.7%) | 176 (23.8%) |
| 3 or more Vehicles | 316 (32.6%) | 77 (10.4%) |
| Total | 970 (100.0%) | 738 (100.0%) |
Real Estate & Mortgages in Huntingdon
Real Estate and Mortgage Overview in Huntingdon
| Characteristic | Without Mortgage | With Mortgage |
| Housing Units | 420 | 550 |
| Median Property Value | $79,900 | $168,500 |
| Median Household Income | $32,414 | $110 |
| Monthly Housing Costs | $353 | $0 |
| Real Estate Taxes | $973 | $87 |
Property Value by Mortgage Status in Huntingdon
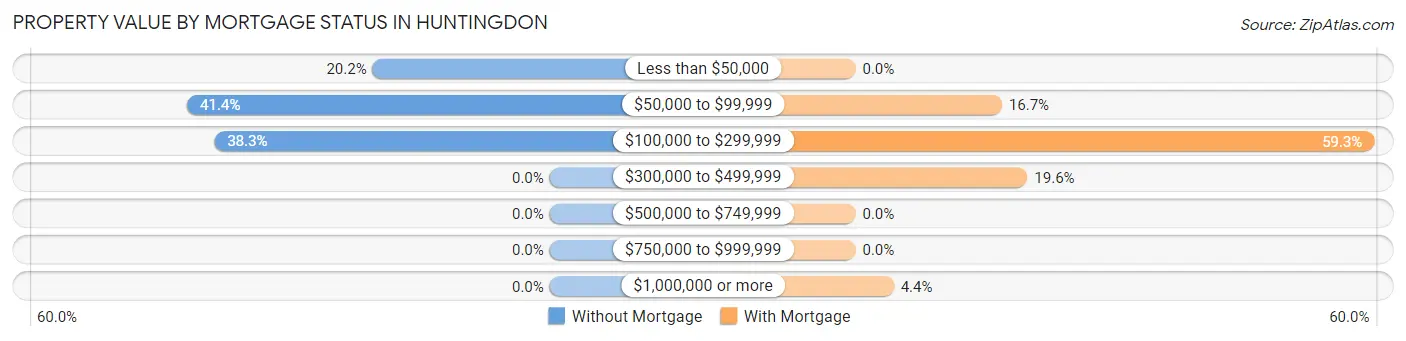
| Property Value | Without Mortgage | With Mortgage |
| Less than $50,000 | 85 (20.2%) | 0 (0.0%) |
| $50,000 to $99,999 | 174 (41.4%) | 92 (16.7%) |
| $100,000 to $299,999 | 161 (38.3%) | 326 (59.3%) |
| $300,000 to $499,999 | 0 (0.0%) | 108 (19.6%) |
| $500,000 to $749,999 | 0 (0.0%) | 0 (0.0%) |
| $750,000 to $999,999 | 0 (0.0%) | 0 (0.0%) |
| $1,000,000 or more | 0 (0.0%) | 24 (4.4%) |
| Total | 420 (100.0%) | 550 (100.0%) |
Household Income by Mortgage Status in Huntingdon
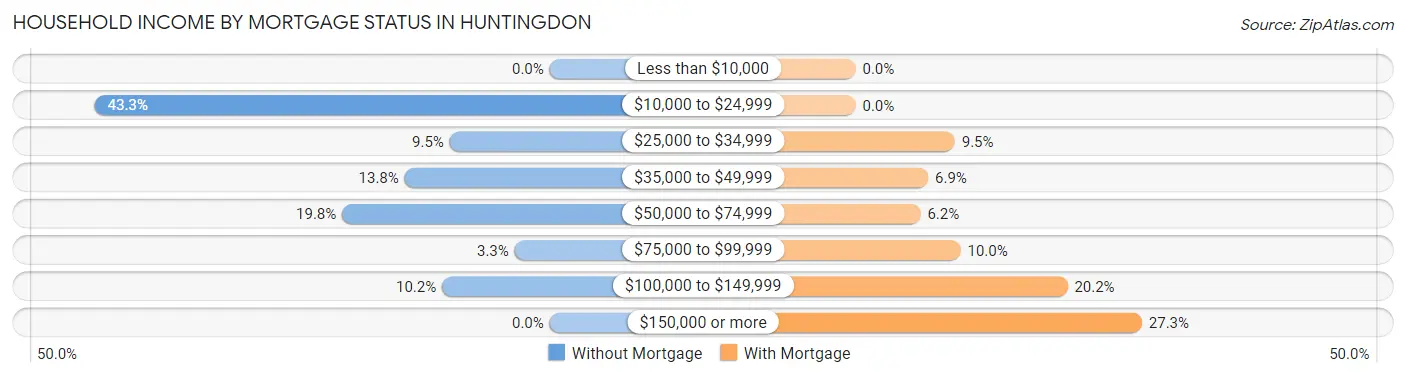
| Household Income | Without Mortgage | With Mortgage |
| Less than $10,000 | 0 (0.0%) | 0 (0.0%) |
| $10,000 to $24,999 | 182 (43.3%) | 0 (0.0%) |
| $25,000 to $34,999 | 40 (9.5%) | 52 (9.5%) |
| $35,000 to $49,999 | 58 (13.8%) | 38 (6.9%) |
| $50,000 to $74,999 | 83 (19.8%) | 34 (6.2%) |
| $75,000 to $99,999 | 14 (3.3%) | 55 (10.0%) |
| $100,000 to $149,999 | 43 (10.2%) | 111 (20.2%) |
| $150,000 or more | 0 (0.0%) | 150 (27.3%) |
| Total | 420 (100.0%) | 550 (100.0%) |
Property Value to Household Income Ratio in Huntingdon
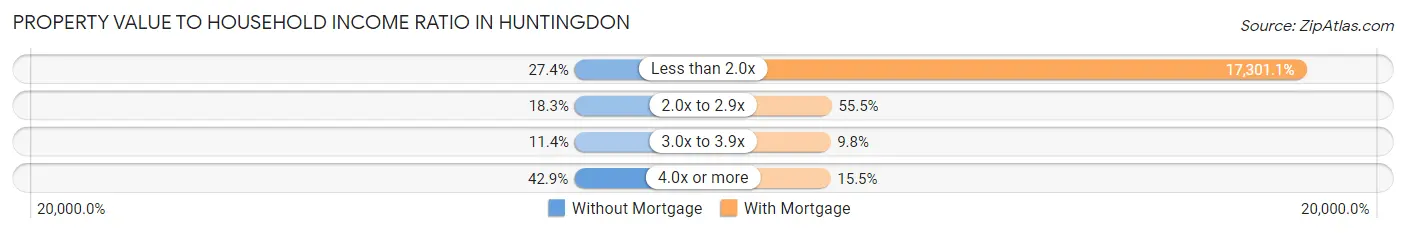
| Value-to-Income Ratio | Without Mortgage | With Mortgage |
| Less than 2.0x | 115 (27.4%) | 95,156 (17,301.1%) |
| 2.0x to 2.9x | 77 (18.3%) | 305 (55.4%) |
| 3.0x to 3.9x | 48 (11.4%) | 54 (9.8%) |
| 4.0x or more | 180 (42.9%) | 85 (15.4%) |
| Total | 420 (100.0%) | 550 (100.0%) |
Real Estate Taxes by Mortgage Status in Huntingdon
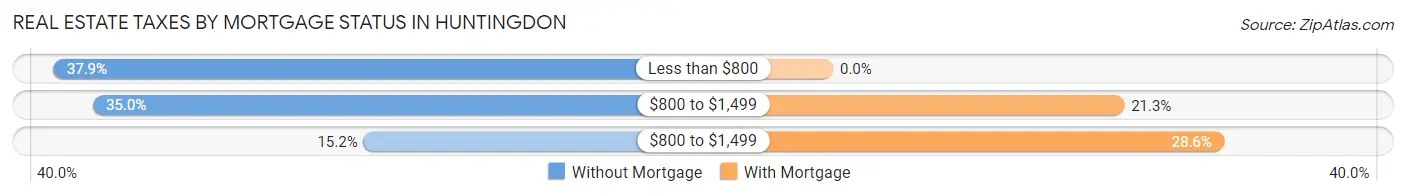
| Property Taxes | Without Mortgage | With Mortgage |
| Less than $800 | 159 (37.9%) | 0 (0.0%) |
| $800 to $1,499 | 147 (35.0%) | 117 (21.3%) |
| $800 to $1,499 | 64 (15.2%) | 157 (28.5%) |
| Total | 420 (100.0%) | 550 (100.0%) |
Health & Disability in Huntingdon
Health Insurance Coverage by Age in Huntingdon
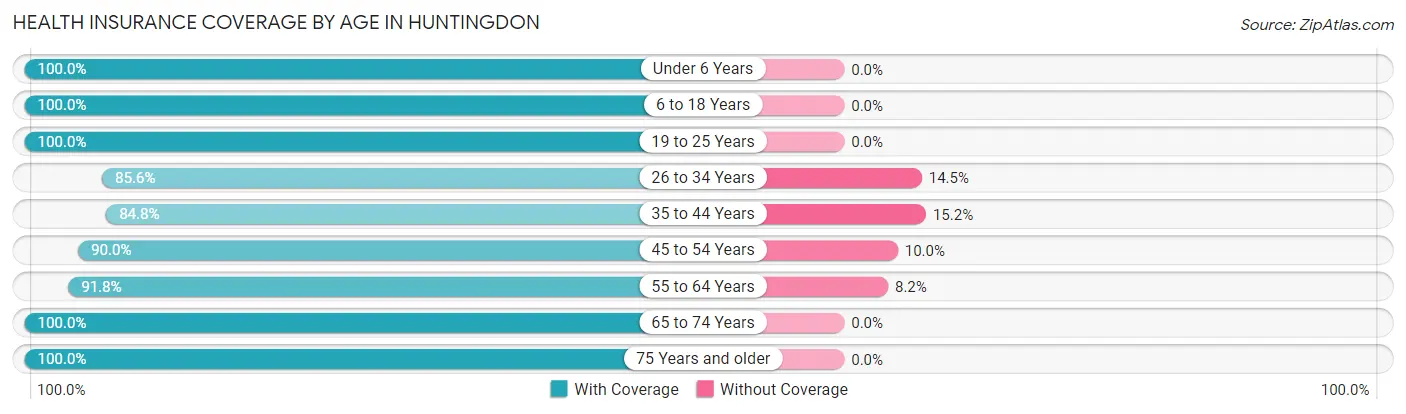
| Age Bracket | With Coverage | Without Coverage |
| Under 6 Years | 370 (100.0%) | 0 (0.0%) |
| 6 to 18 Years | 781 (100.0%) | 0 (0.0%) |
| 19 to 25 Years | 334 (100.0%) | 0 (0.0%) |
| 26 to 34 Years | 722 (85.6%) | 122 (14.4%) |
| 35 to 44 Years | 345 (84.8%) | 62 (15.2%) |
| 45 to 54 Years | 316 (90.0%) | 35 (10.0%) |
| 55 to 64 Years | 360 (91.8%) | 32 (8.2%) |
| 65 to 74 Years | 406 (100.0%) | 0 (0.0%) |
| 75 Years and older | 260 (100.0%) | 0 (0.0%) |
| Total | 3,894 (93.9%) | 251 (6.1%) |
Health Insurance Coverage by Citizenship Status in Huntingdon
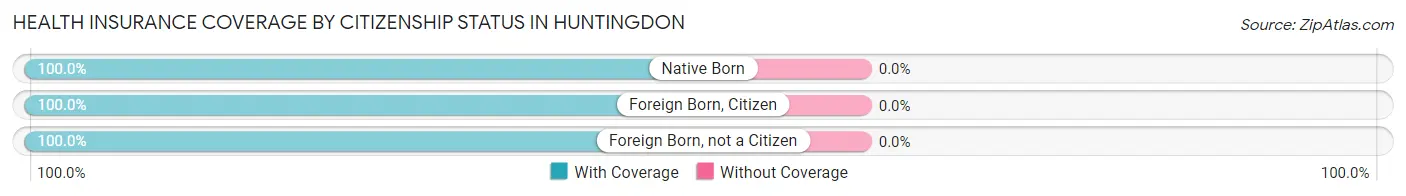
| Citizenship Status | With Coverage | Without Coverage |
| Native Born | 370 (100.0%) | 0 (0.0%) |
| Foreign Born, Citizen | 781 (100.0%) | 0 (0.0%) |
| Foreign Born, not a Citizen | 334 (100.0%) | 0 (0.0%) |
Health Insurance Coverage by Household Income in Huntingdon
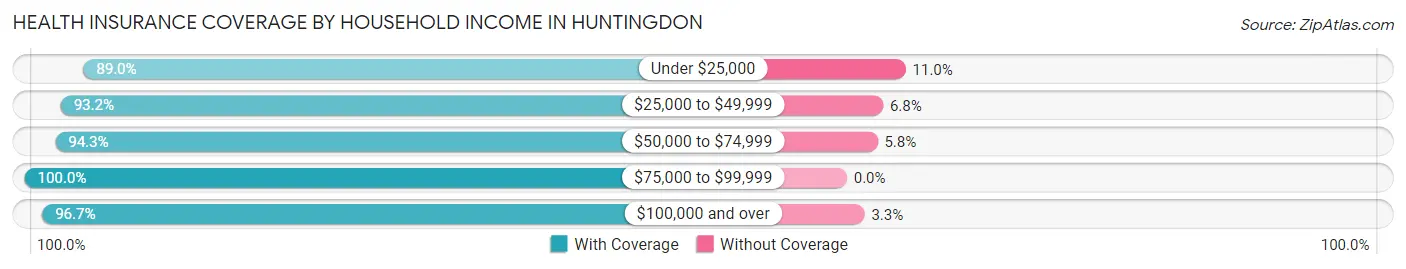
| Household Income | With Coverage | Without Coverage |
| Under $25,000 | 929 (89.0%) | 115 (11.0%) |
| $25,000 to $49,999 | 742 (93.2%) | 54 (6.8%) |
| $50,000 to $74,999 | 770 (94.3%) | 47 (5.8%) |
| $75,000 to $99,999 | 430 (100.0%) | 0 (0.0%) |
| $100,000 and over | 1,023 (96.7%) | 35 (3.3%) |
Public vs Private Health Insurance Coverage by Age in Huntingdon
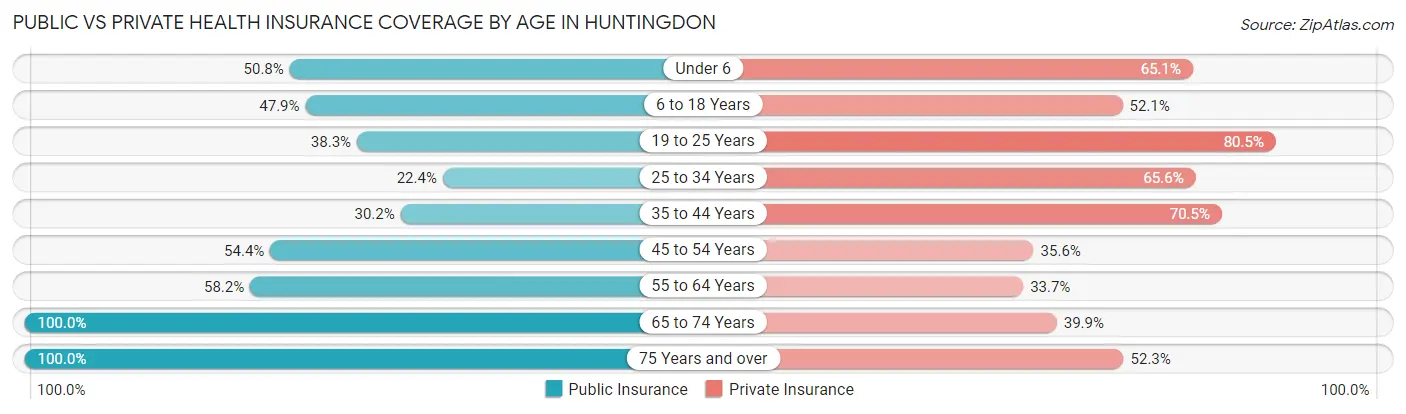
| Age Bracket | Public Insurance | Private Insurance |
| Under 6 | 188 (50.8%) | 241 (65.1%) |
| 6 to 18 Years | 374 (47.9%) | 407 (52.1%) |
| 19 to 25 Years | 128 (38.3%) | 269 (80.5%) |
| 25 to 34 Years | 189 (22.4%) | 554 (65.6%) |
| 35 to 44 Years | 123 (30.2%) | 287 (70.5%) |
| 45 to 54 Years | 191 (54.4%) | 125 (35.6%) |
| 55 to 64 Years | 228 (58.2%) | 132 (33.7%) |
| 65 to 74 Years | 406 (100.0%) | 162 (39.9%) |
| 75 Years and over | 260 (100.0%) | 136 (52.3%) |
| Total | 2,087 (50.3%) | 2,313 (55.8%) |
Disability Status by Sex by Age in Huntingdon
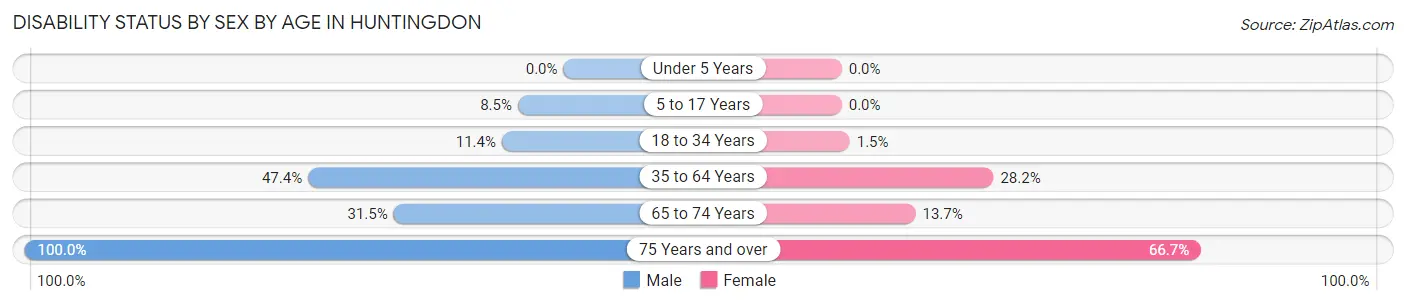
| Age Bracket | Male | Female |
| Under 5 Years | 0 (0.0%) | 0 (0.0%) |
| 5 to 17 Years | 44 (8.5%) | 0 (0.0%) |
| 18 to 34 Years | 65 (11.4%) | 9 (1.5%) |
| 35 to 64 Years | 264 (47.4%) | 167 (28.2%) |
| 65 to 74 Years | 52 (31.5%) | 33 (13.7%) |
| 75 Years and over | 101 (100.0%) | 106 (66.7%) |
Disability Class by Sex by Age in Huntingdon
Disability Class: Hearing Difficulty
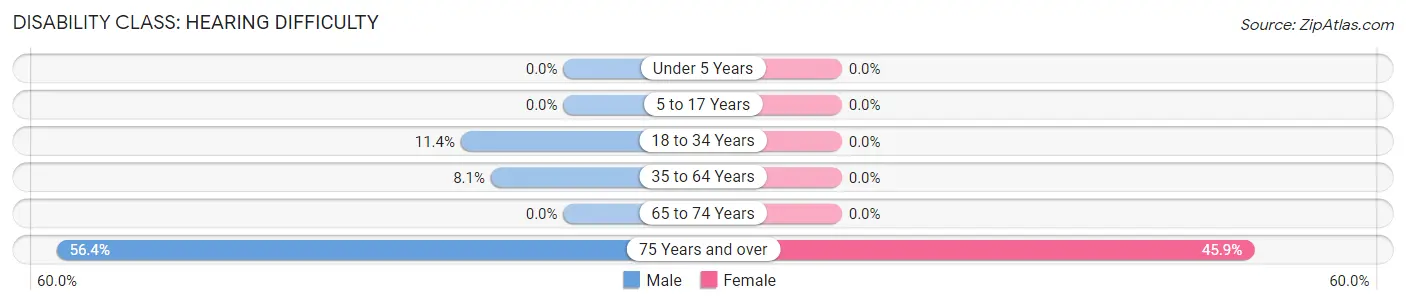
| Age Bracket | Male | Female |
| Under 5 Years | 0 (0.0%) | 0 (0.0%) |
| 5 to 17 Years | 0 (0.0%) | 0 (0.0%) |
| 18 to 34 Years | 65 (11.4%) | 0 (0.0%) |
| 35 to 64 Years | 45 (8.1%) | 0 (0.0%) |
| 65 to 74 Years | 0 (0.0%) | 0 (0.0%) |
| 75 Years and over | 57 (56.4%) | 73 (45.9%) |
Disability Class: Vision Difficulty
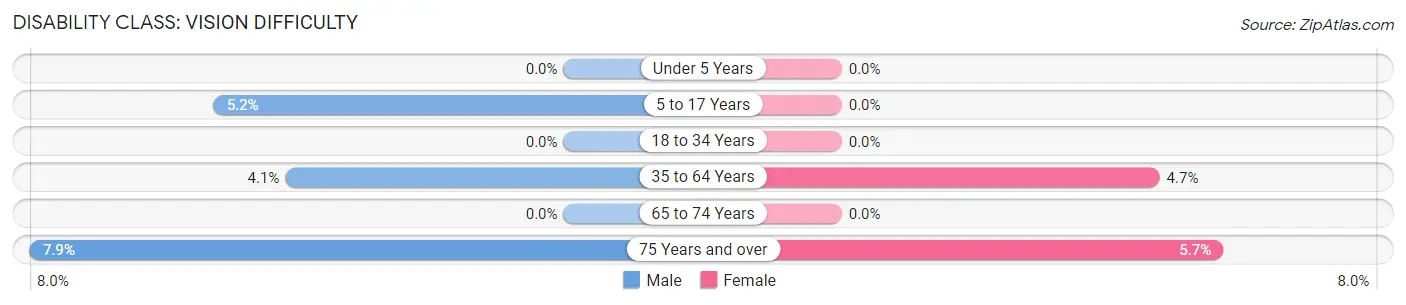
| Age Bracket | Male | Female |
| Under 5 Years | 0 (0.0%) | 0 (0.0%) |
| 5 to 17 Years | 27 (5.2%) | 0 (0.0%) |
| 18 to 34 Years | 0 (0.0%) | 0 (0.0%) |
| 35 to 64 Years | 23 (4.1%) | 28 (4.7%) |
| 65 to 74 Years | 0 (0.0%) | 0 (0.0%) |
| 75 Years and over | 8 (7.9%) | 9 (5.7%) |
Disability Class: Cognitive Difficulty
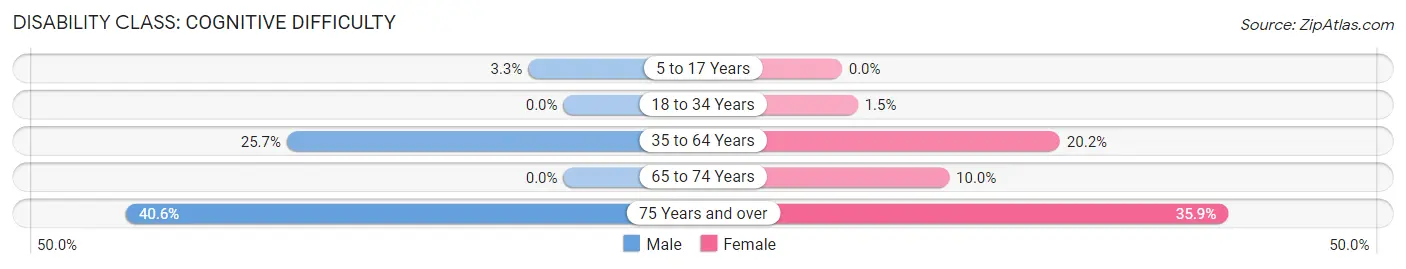
| Age Bracket | Male | Female |
| 5 to 17 Years | 17 (3.3%) | 0 (0.0%) |
| 18 to 34 Years | 0 (0.0%) | 9 (1.5%) |
| 35 to 64 Years | 143 (25.7%) | 120 (20.2%) |
| 65 to 74 Years | 0 (0.0%) | 24 (10.0%) |
| 75 Years and over | 41 (40.6%) | 57 (35.8%) |
Disability Class: Ambulatory Difficulty
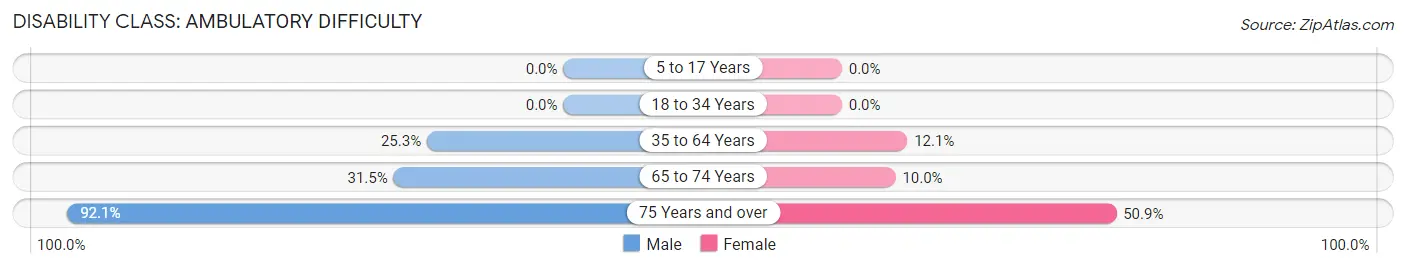
| Age Bracket | Male | Female |
| 5 to 17 Years | 0 (0.0%) | 0 (0.0%) |
| 18 to 34 Years | 0 (0.0%) | 0 (0.0%) |
| 35 to 64 Years | 141 (25.3%) | 72 (12.1%) |
| 65 to 74 Years | 52 (31.5%) | 24 (10.0%) |
| 75 Years and over | 93 (92.1%) | 81 (50.9%) |
Disability Class: Self-Care Difficulty
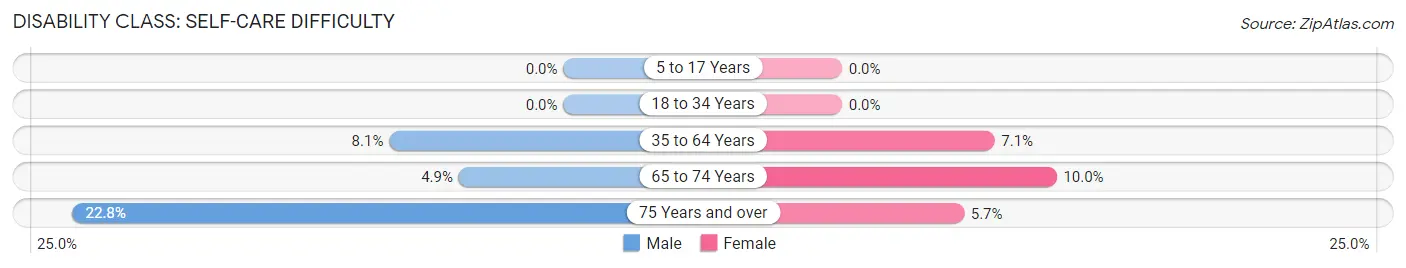
| Age Bracket | Male | Female |
| 5 to 17 Years | 0 (0.0%) | 0 (0.0%) |
| 18 to 34 Years | 0 (0.0%) | 0 (0.0%) |
| 35 to 64 Years | 45 (8.1%) | 42 (7.1%) |
| 65 to 74 Years | 8 (4.9%) | 24 (10.0%) |
| 75 Years and over | 23 (22.8%) | 9 (5.7%) |
Technology Access in Huntingdon
Computing Device Access in Huntingdon
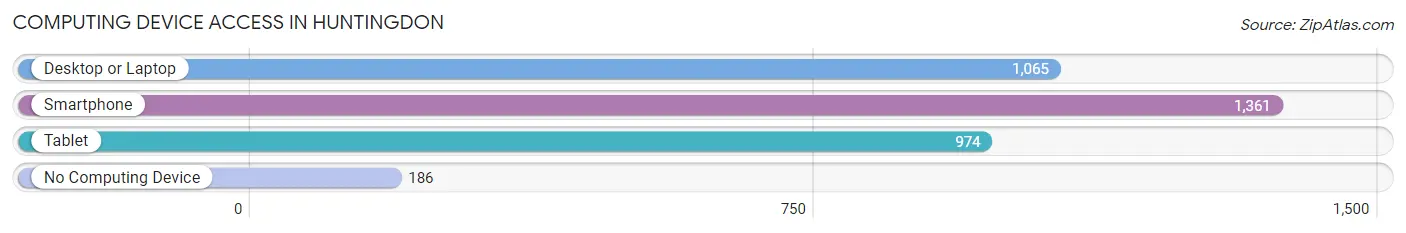
| Device Type | # Households | % Households |
| Desktop or Laptop | 1,065 | 62.4% |
| Smartphone | 1,361 | 79.7% |
| Tablet | 974 | 57.0% |
| No Computing Device | 186 | 10.9% |
| Total | 1,708 | 100.0% |
Internet Access in Huntingdon
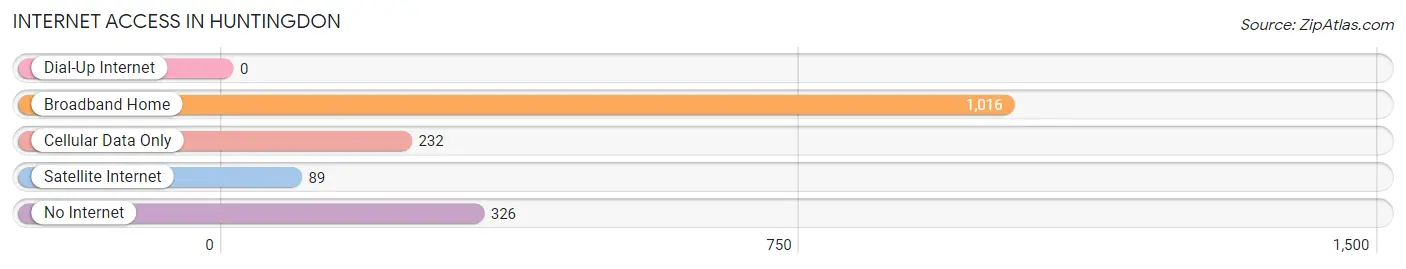
| Internet Type | # Households | % Households |
| Dial-Up Internet | 0 | 0.0% |
| Broadband Home | 1,016 | 59.5% |
| Cellular Data Only | 232 | 13.6% |
| Satellite Internet | 89 | 5.2% |
| No Internet | 326 | 19.1% |
| Total | 1,708 | 100.0% |
Huntingdon Summary
Huntingdon, Tennessee is a small town located in the northwest corner of the state, in the foothills of the Appalachian Mountains. It is the county seat of Carroll County and is situated along the banks of the Tennessee River. The town has a population of approximately 4,500 people and is known for its rural charm and friendly atmosphere.
History
Huntingdon was founded in 1820 by a group of settlers from North Carolina. The town was named after the town of Huntingdon in England. The town was originally a trading post and was the first county seat of Carroll County. In 1836, the town was incorporated and the first courthouse was built.
In the late 1800s, Huntingdon became a major railroad hub, with the Nashville, Chattanooga and St. Louis Railway running through the town. This allowed the town to become a major shipping center for the region. The railroad also brought new industry to the town, including a cotton mill and a furniture factory.
In the early 1900s, Huntingdon experienced a period of growth and prosperity. The town was home to several banks, a movie theater, and a variety of stores and businesses. The town also had a thriving music scene, with several local bands playing in the area.
Geography
Huntingdon is located in the northwest corner of Tennessee, in the foothills of the Appalachian Mountains. The town is situated along the banks of the Tennessee River and is surrounded by rolling hills and forests. The town is located about 50 miles from Nashville and is about a two-hour drive from Memphis.
The climate in Huntingdon is mild and humid, with hot summers and mild winters. The average temperature in the summer is around 80 degrees Fahrenheit and the average temperature in the winter is around 40 degrees Fahrenheit.
Economy
The economy of Huntingdon is largely based on agriculture and manufacturing. The town is home to several large farms, which produce a variety of crops, including corn, soybeans, and cotton. The town is also home to several manufacturing companies, which produce a variety of products, including furniture, clothing, and automotive parts.
The town is also home to several small businesses, including restaurants, shops, and other services. The town is also home to several tourist attractions, including the Carroll County Museum and the Huntingdon Historic District.
Demographics
As of the 2010 census, the population of Huntingdon was 4,521. The racial makeup of the town was 95.3% White, 1.7% African American, 0.3% Native American, 0.2% Asian, 0.1% Pacific Islander, and 2.4% from other races. The median household income in Huntingdon was $31,250, and the median family income was $37,500.
Huntingdon is a small town with a friendly atmosphere and a strong sense of community. The town is home to several churches, schools, and other organizations, which help to create a strong sense of community. The town is also home to several parks and recreational areas, which provide a variety of activities for residents and visitors alike.
Common Questions
What is Per Capita Income in Huntingdon?
Per Capita income in Huntingdon is $24,846.
What is the Median Family Income in Huntingdon?
Median Family Income in Huntingdon is $52,190.
What is the Median Household income in Huntingdon?
Median Household Income in Huntingdon is $46,167.
What is Income or Wage Gap in Huntingdon?
Income or Wage Gap in Huntingdon is 0.0%.
Women in Huntingdon earn 100.0 cents for every dollar earned by a man.
What is Inequality or Gini Index in Huntingdon?
Inequality or Gini Index in Huntingdon is 0.47.
What is the Total Population of Huntingdon?
Total Population of Huntingdon is 4,384.
What is the Total Male Population of Huntingdon?
Total Male Population of Huntingdon is 2,199.
What is the Total Female Population of Huntingdon?
Total Female Population of Huntingdon is 2,185.
What is the Ratio of Males per 100 Females in Huntingdon?
There are 100.64 Males per 100 Females in Huntingdon.
What is the Ratio of Females per 100 Males in Huntingdon?
There are 99.36 Females per 100 Males in Huntingdon.
What is the Median Population Age in Huntingdon?
Median Population Age in Huntingdon is 33.4 Years.
What is the Average Family Size in Huntingdon
Average Family Size in Huntingdon is 3.0 People.
What is the Average Household Size in Huntingdon
Average Household Size in Huntingdon is 2.4 People.
How Large is the Labor Force in Huntingdon?
There are 1,791 People in the Labor Forcein in Huntingdon.
What is the Percentage of People in the Labor Force in Huntingdon?
53.3% of People are in the Labor Force in Huntingdon.