North Kansas City, MO Map & Demographics
North Kansas City Map
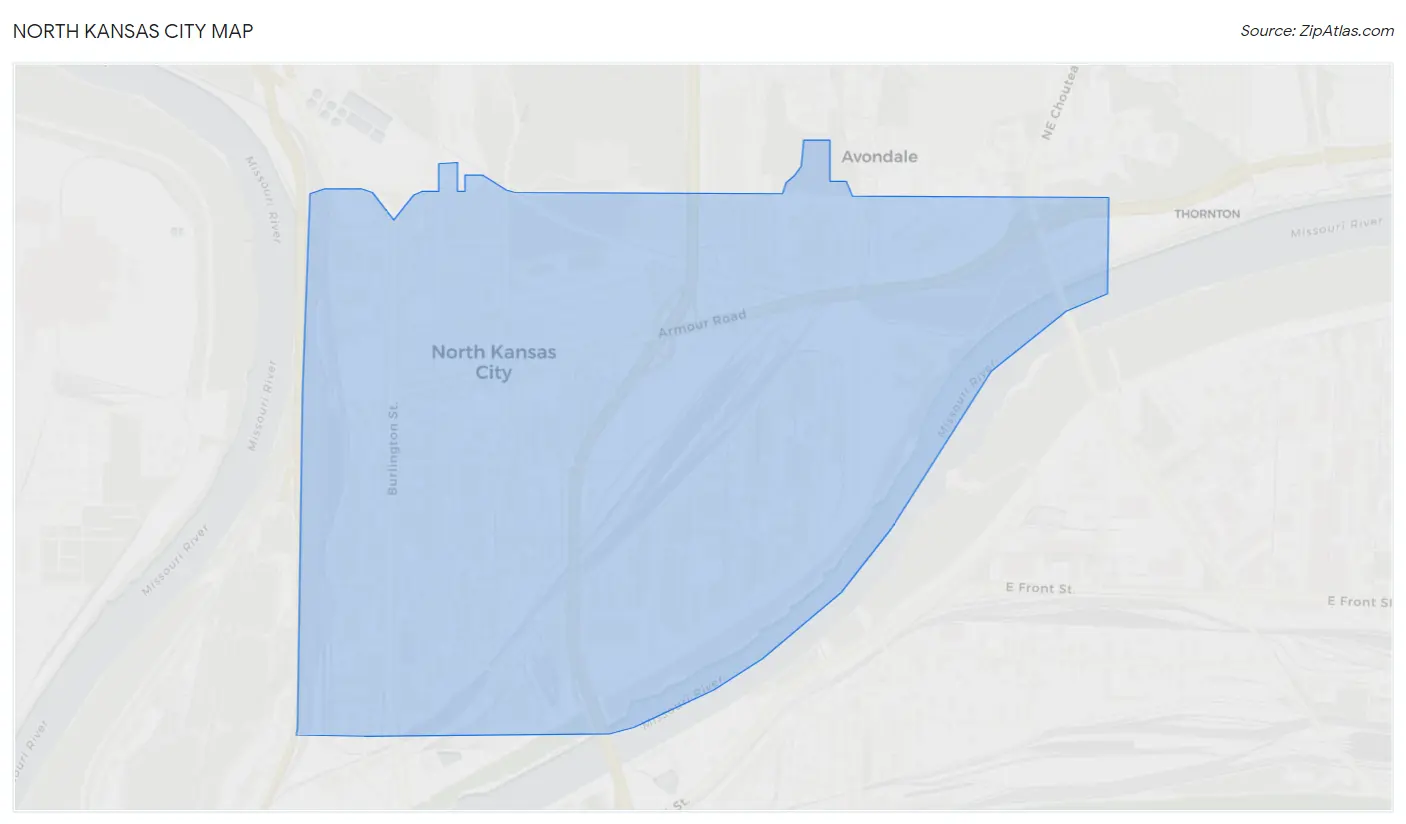
North Kansas City Overview
$37,725
PER CAPITA INCOME
$64,583
AVG FAMILY INCOME
$42,743
AVG HOUSEHOLD INCOME
0.4%
WAGE / INCOME GAP [ % ]
99.6¢/ $1
WAGE / INCOME GAP [ $ ]
0.40
INEQUALITY / GINI INDEX
4,553
TOTAL POPULATION
2,381
MALE POPULATION
2,172
FEMALE POPULATION
109.62
MALES / 100 FEMALES
91.22
FEMALES / 100 MALES
46.3
MEDIAN AGE
2.4
AVG FAMILY SIZE
1.7
AVG HOUSEHOLD SIZE
3,026
LABOR FORCE [ PEOPLE ]
74.2%
PERCENT IN LABOR FORCE
6.3%
UNEMPLOYMENT RATE
North Kansas City Area Codes
Income in North Kansas City
Income Overview in North Kansas City
Per Capita Income in North Kansas City is $37,725, while median incomes of families and households are $64,583 and $42,743 respectively.
| Characteristic | Number | Measure |
| Per Capita Income | 4,553 | $37,725 |
| Median Family Income | 917 | $64,583 |
| Mean Family Income | 917 | $79,668 |
| Median Household Income | 2,738 | $42,743 |
| Mean Household Income | 2,738 | $61,365 |
| Income Deficit | 917 | $0 |
| Wage / Income Gap (%) | 4,553 | 0.37% |
| Wage / Income Gap ($) | 4,553 | 99.63¢ per $1 |
| Gini / Inequality Index | 4,553 | 0.40 |
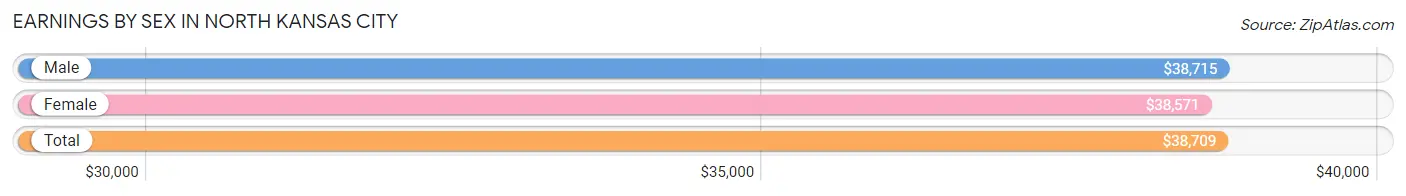
Earnings by Sex in North Kansas City
Average Earnings in North Kansas City are $38,709, $38,715 for men and $38,571 for women, a difference of 0.4%.
| Sex | Number | Average Earnings |
| Male | 1,596 (53.6%) | $38,715 |
| Female | 1,380 (46.4%) | $38,571 |
| Total | 2,976 (100.0%) | $38,709 |
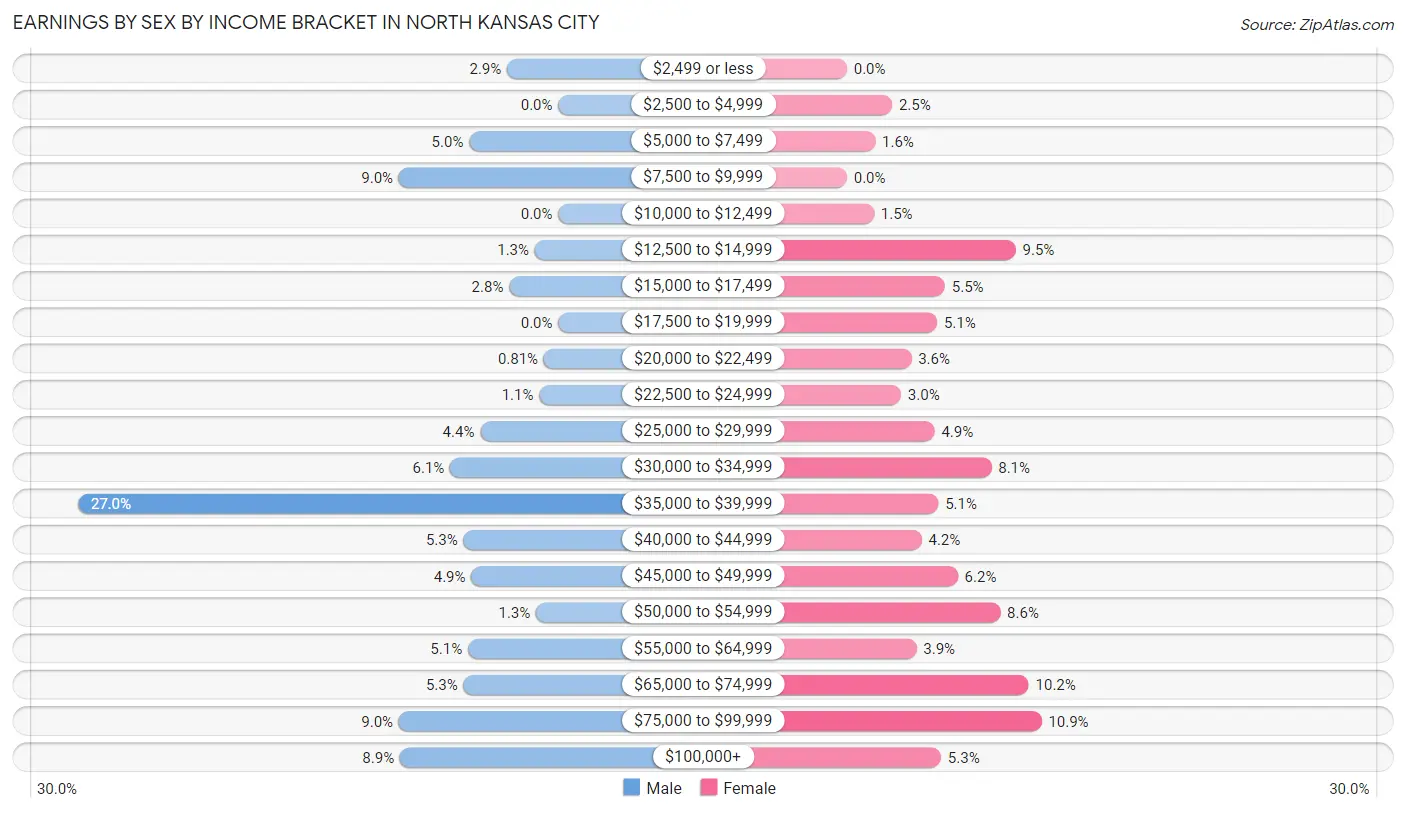
Earnings by Sex by Income Bracket in North Kansas City
The most common earnings brackets in North Kansas City are $35,000 to $39,999 for men (431 | 27.0%) and $75,000 to $99,999 for women (151 | 10.9%).
| Income | Male | Female |
| $2,499 or less | 46 (2.9%) | 0 (0.0%) |
| $2,500 to $4,999 | 0 (0.0%) | 35 (2.5%) |
| $5,000 to $7,499 | 80 (5.0%) | 22 (1.6%) |
| $7,500 to $9,999 | 143 (9.0%) | 0 (0.0%) |
| $10,000 to $12,499 | 0 (0.0%) | 21 (1.5%) |
| $12,500 to $14,999 | 21 (1.3%) | 131 (9.5%) |
| $15,000 to $17,499 | 44 (2.8%) | 76 (5.5%) |
| $17,500 to $19,999 | 0 (0.0%) | 70 (5.1%) |
| $20,000 to $22,499 | 13 (0.8%) | 50 (3.6%) |
| $22,500 to $24,999 | 17 (1.1%) | 42 (3.0%) |
| $25,000 to $29,999 | 70 (4.4%) | 68 (4.9%) |
| $30,000 to $34,999 | 97 (6.1%) | 112 (8.1%) |
| $35,000 to $39,999 | 431 (27.0%) | 71 (5.1%) |
| $40,000 to $44,999 | 85 (5.3%) | 58 (4.2%) |
| $45,000 to $49,999 | 78 (4.9%) | 86 (6.2%) |
| $50,000 to $54,999 | 20 (1.3%) | 119 (8.6%) |
| $55,000 to $64,999 | 81 (5.1%) | 54 (3.9%) |
| $65,000 to $74,999 | 85 (5.3%) | 141 (10.2%) |
| $75,000 to $99,999 | 143 (9.0%) | 151 (10.9%) |
| $100,000+ | 142 (8.9%) | 73 (5.3%) |
| Total | 1,596 (100.0%) | 1,380 (100.0%) |
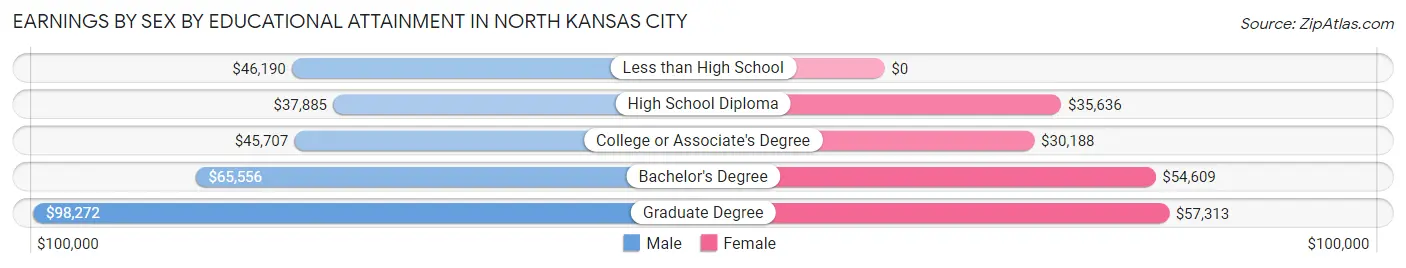
Earnings by Sex by Educational Attainment in North Kansas City
Average earnings in North Kansas City are $39,537 for men and $45,477 for women, a difference of 13.1%. Men with an educational attainment of graduate degree enjoy the highest average annual earnings of $98,272, while those with high school diploma education earn the least with $37,885. Women with an educational attainment of graduate degree earn the most with the average annual earnings of $57,313, while those with college or associate's degree education have the smallest earnings of $30,188.
| Educational Attainment | Male Income | Female Income |
| Less than High School | $46,190 | $0 |
| High School Diploma | $37,885 | $35,636 |
| College or Associate's Degree | $45,707 | $30,188 |
| Bachelor's Degree | $65,556 | $54,609 |
| Graduate Degree | $98,272 | $57,313 |
| Total | $39,537 | $45,477 |
Family Income in North Kansas City
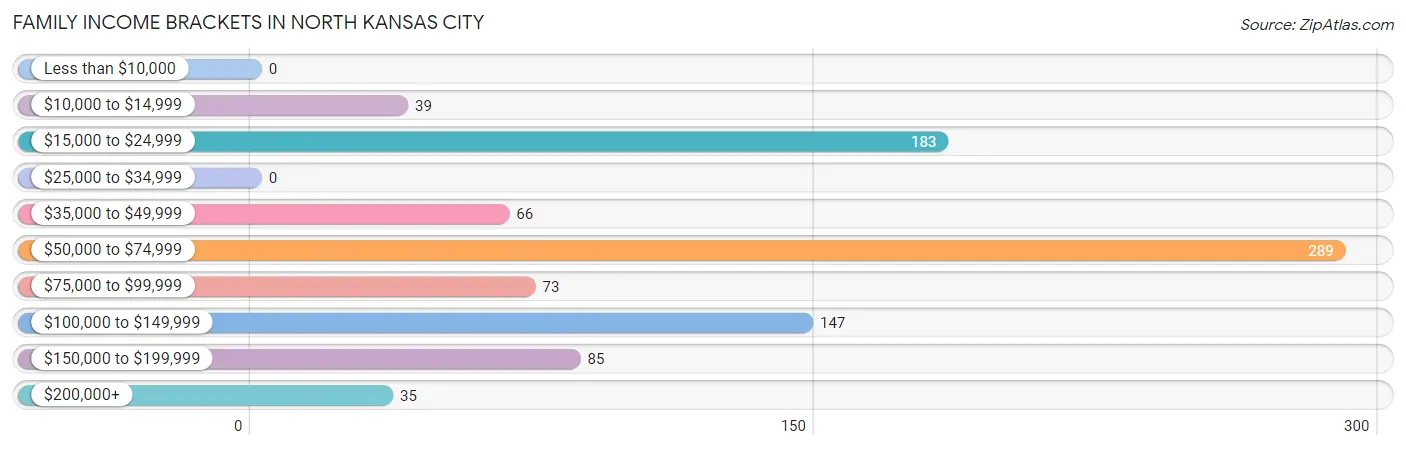
Family Income Brackets in North Kansas City
According to the North Kansas City family income data, there are 289 families falling into the $50,000 to $74,999 income range, which is the most common income bracket and makes up 31.5% of all families.
| Income Bracket | # Families | % Families |
| Less than $10,000 | 0 | 0.0% |
| $10,000 to $14,999 | 39 | 4.3% |
| $15,000 to $24,999 | 183 | 20.0% |
| $25,000 to $34,999 | 0 | 0.0% |
| $35,000 to $49,999 | 66 | 7.2% |
| $50,000 to $74,999 | 289 | 31.5% |
| $75,000 to $99,999 | 73 | 8.0% |
| $100,000 to $149,999 | 147 | 16.0% |
| $150,000 to $199,999 | 85 | 9.3% |
| $200,000+ | 35 | 3.8% |
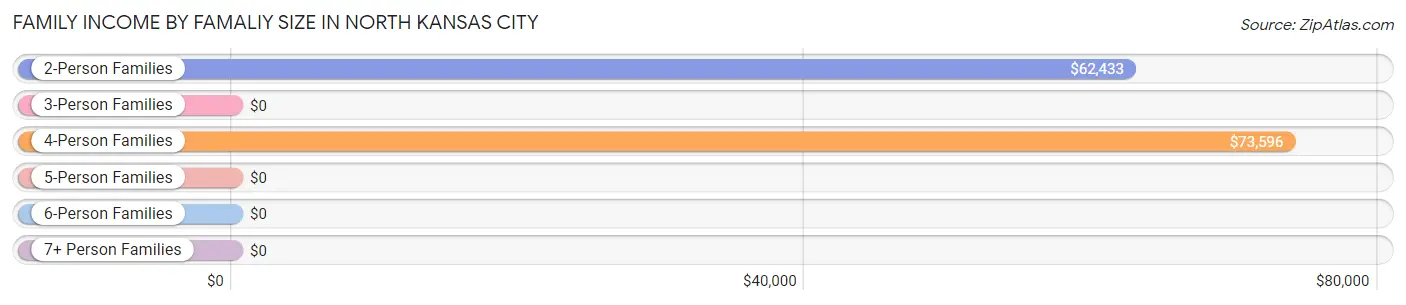
Family Income by Famaliy Size in North Kansas City
4-person families (149 | 16.3%) account for the highest median family income in North Kansas City with $73,596 per family, while 2-person families (700 | 76.3%) have the highest median income of $31,216 per family member.
| Income Bracket | # Families | Median Income |
| 2-Person Families | 700 (76.3%) | $62,433 |
| 3-Person Families | 55 (6.0%) | $0 |
| 4-Person Families | 149 (16.3%) | $73,596 |
| 5-Person Families | 13 (1.4%) | $0 |
| 6-Person Families | 0 (0.0%) | $0 |
| 7+ Person Families | 0 (0.0%) | $0 |
| Total | 917 (100.0%) | $64,583 |
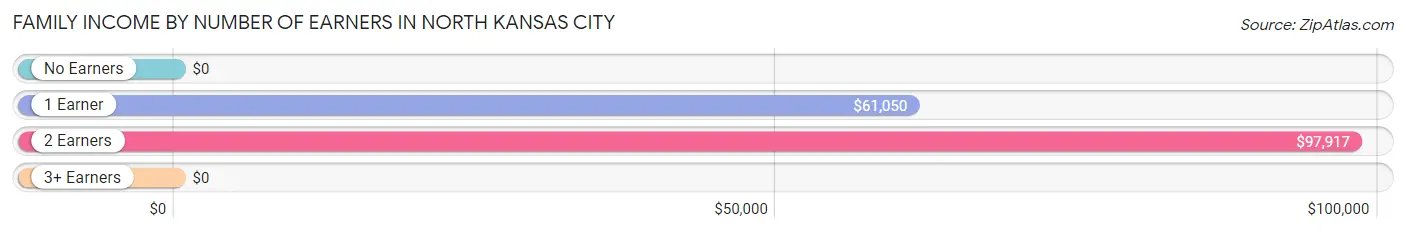
Family Income by Number of Earners in North Kansas City
| Number of Earners | # Families | Median Income |
| No Earners | 77 (8.4%) | $0 |
| 1 Earner | 533 (58.1%) | $61,050 |
| 2 Earners | 289 (31.5%) | $97,917 |
| 3+ Earners | 18 (2.0%) | $0 |
| Total | 917 (100.0%) | $64,583 |
Household Income in North Kansas City
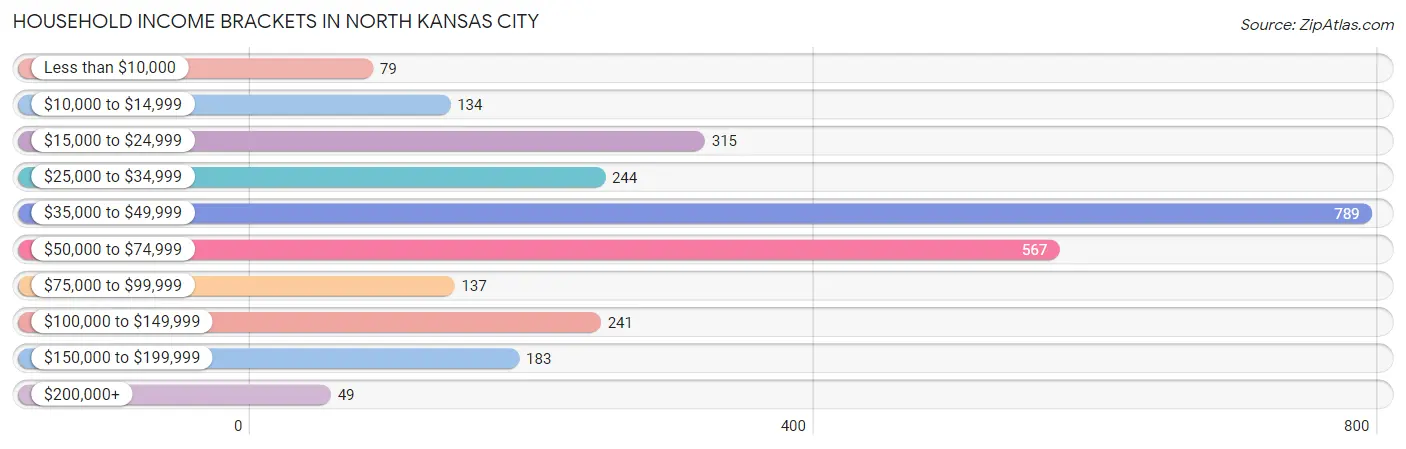
Household Income Brackets in North Kansas City
With 789 households falling in the category, the $35,000 to $49,999 income range is the most frequent in North Kansas City, accounting for 28.8% of all households. In contrast, only 49 households (1.8%) fall into the $200,000+ income bracket, making it the least populous group.
| Income Bracket | # Households | % Households |
| Less than $10,000 | 79 | 2.9% |
| $10,000 to $14,999 | 134 | 4.9% |
| $15,000 to $24,999 | 315 | 11.5% |
| $25,000 to $34,999 | 244 | 8.9% |
| $35,000 to $49,999 | 789 | 28.8% |
| $50,000 to $74,999 | 567 | 20.7% |
| $75,000 to $99,999 | 137 | 5.0% |
| $100,000 to $149,999 | 241 | 8.8% |
| $150,000 to $199,999 | 183 | 6.7% |
| $200,000+ | 49 | 1.8% |
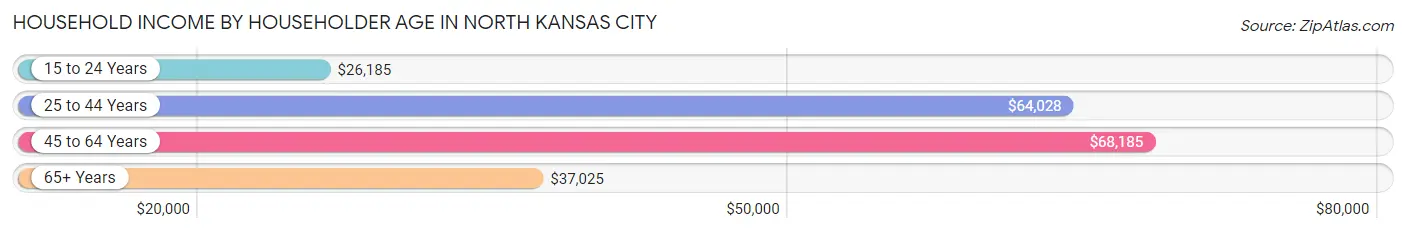
Household Income by Householder Age in North Kansas City
The median household income in North Kansas City is $42,743, with the highest median household income of $68,185 found in the 45 to 64 years age bracket for the primary householder. A total of 685 households (25.0%) fall into this category. Meanwhile, the 15 to 24 years age bracket for the primary householder has the lowest median household income of $26,185, with 171 households (6.2%) in this group.
| Income Bracket | # Households | Median Income |
| 15 to 24 Years | 171 (6.2%) | $26,185 |
| 25 to 44 Years | 810 (29.6%) | $64,028 |
| 45 to 64 Years | 685 (25.0%) | $68,185 |
| 65+ Years | 1,072 (39.2%) | $37,025 |
| Total | 2,738 (100.0%) | $42,743 |
Poverty in North Kansas City
Income Below Poverty by Sex and Age in North Kansas City
With 12.3% poverty level for males and 8.8% for females among the residents of North Kansas City, 18 to 24 year old males and 35 to 44 year old females are the most vulnerable to poverty, with 145 males (56.2%) and 76 females (30.0%) in their respective age groups living below the poverty level.
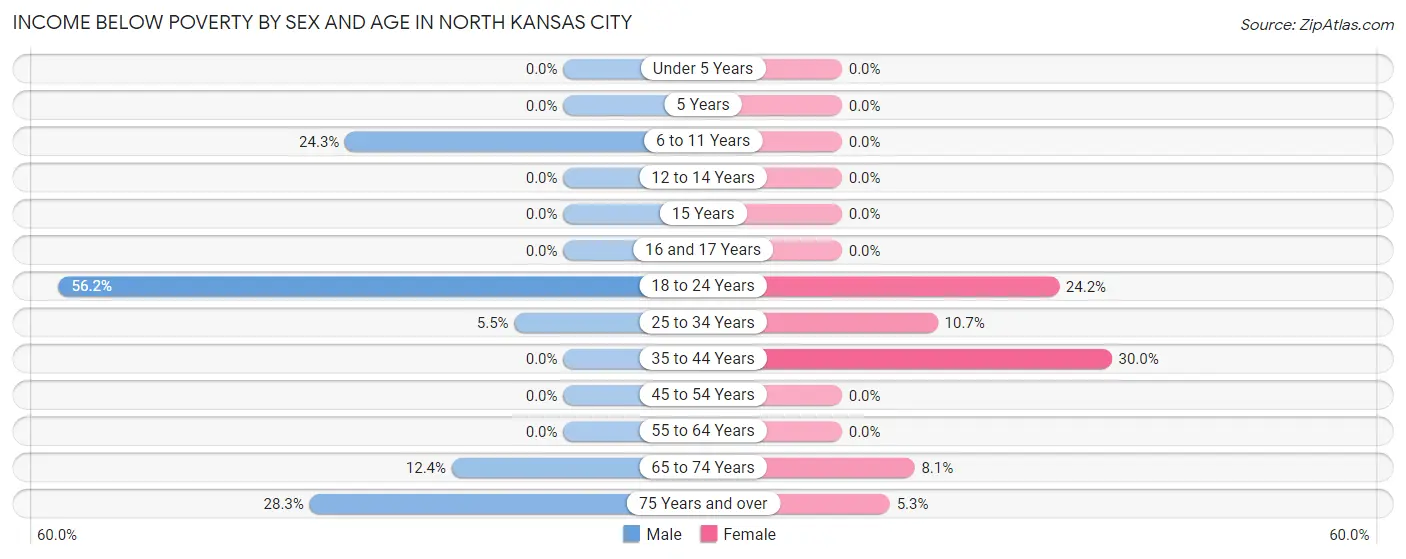
| Age Bracket | Male | Female |
| Under 5 Years | 0 (0.0%) | 0 (0.0%) |
| 5 Years | 0 (0.0%) | 0 (0.0%) |
| 6 to 11 Years | 26 (24.3%) | 0 (0.0%) |
| 12 to 14 Years | 0 (0.0%) | 0 (0.0%) |
| 15 Years | 0 (0.0%) | 0 (0.0%) |
| 16 and 17 Years | 0 (0.0%) | 0 (0.0%) |
| 18 to 24 Years | 145 (56.2%) | 37 (24.2%) |
| 25 to 34 Years | 26 (5.4%) | 38 (10.7%) |
| 35 to 44 Years | 0 (0.0%) | 76 (30.0%) |
| 45 to 54 Years | 0 (0.0%) | 0 (0.0%) |
| 55 to 64 Years | 0 (0.0%) | 0 (0.0%) |
| 65 to 74 Years | 58 (12.4%) | 22 (8.1%) |
| 75 Years and over | 39 (28.3%) | 19 (5.3%) |
| Total | 294 (12.3%) | 192 (8.8%) |
Income Above Poverty by Sex and Age in North Kansas City
According to the poverty statistics in North Kansas City, males aged under 5 years and females aged under 5 years are the age groups that are most secure financially, with 100.0% of males and 100.0% of females in these age groups living above the poverty line.
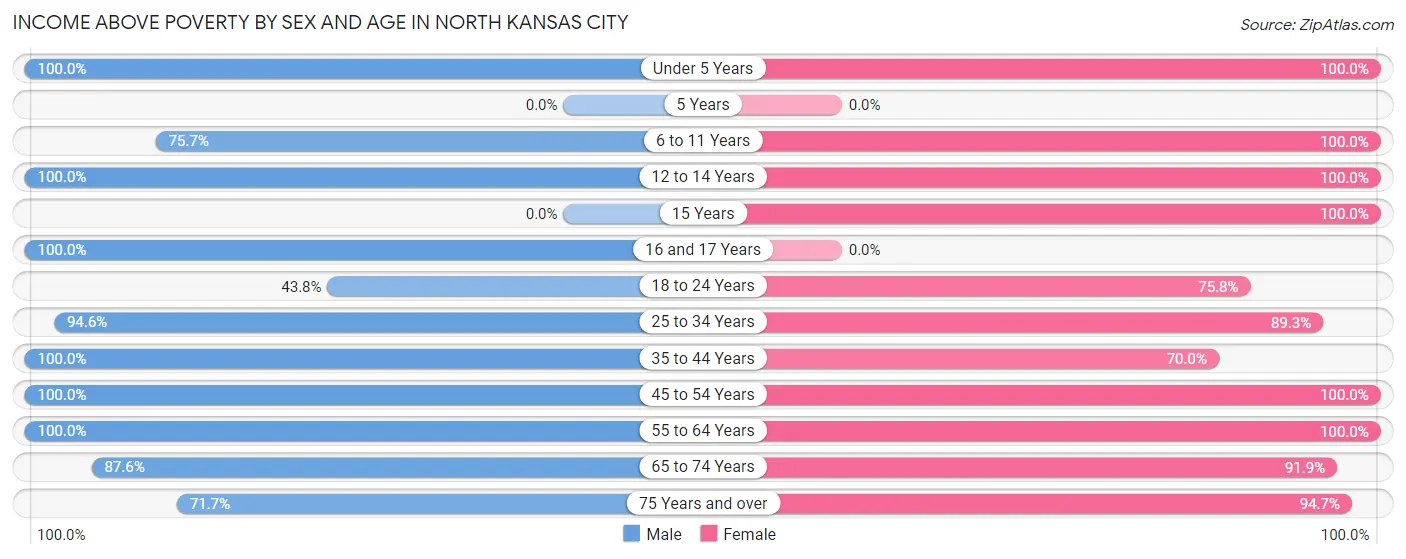
| Age Bracket | Male | Female |
| Under 5 Years | 38 (100.0%) | 37 (100.0%) |
| 5 Years | 0 (0.0%) | 0 (0.0%) |
| 6 to 11 Years | 81 (75.7%) | 107 (100.0%) |
| 12 to 14 Years | 100 (100.0%) | 3 (100.0%) |
| 15 Years | 0 (0.0%) | 83 (100.0%) |
| 16 and 17 Years | 80 (100.0%) | 0 (0.0%) |
| 18 to 24 Years | 113 (43.8%) | 116 (75.8%) |
| 25 to 34 Years | 451 (94.6%) | 318 (89.3%) |
| 35 to 44 Years | 170 (100.0%) | 177 (70.0%) |
| 45 to 54 Years | 395 (100.0%) | 291 (100.0%) |
| 55 to 64 Years | 151 (100.0%) | 261 (100.0%) |
| 65 to 74 Years | 409 (87.6%) | 250 (91.9%) |
| 75 Years and over | 99 (71.7%) | 337 (94.7%) |
| Total | 2,087 (87.6%) | 1,980 (91.2%) |
Income Below Poverty Among Married-Couple Families in North Kansas City
The poverty statistics for married-couple families in North Kansas City show that 9.8% or 39 of the total 400 families live below the poverty line. Families with no children have the highest poverty rate of 12.2%, comprising of 39 families. On the other hand, families with 1 or 2 children have the lowest poverty rate of 0.0%, which includes 0 families.
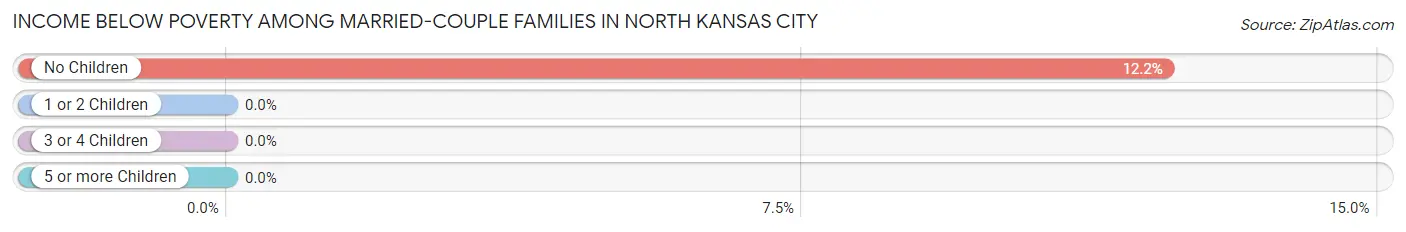
| Children | Above Poverty | Below Poverty |
| No Children | 280 (87.8%) | 39 (12.2%) |
| 1 or 2 Children | 68 (100.0%) | 0 (0.0%) |
| 3 or 4 Children | 13 (100.0%) | 0 (0.0%) |
| 5 or more Children | 0 (0.0%) | 0 (0.0%) |
| Total | 361 (90.2%) | 39 (9.8%) |
Income Below Poverty Among Single-Parent Households in North Kansas City
According to the poverty data in North Kansas City, 17.6% or 21 single-father households and 10.1% or 40 single-mother households are living below the poverty line. Among single-father households, those with no children have the highest poverty rate, with 21 households (26.6%) experiencing poverty. Likewise, among single-mother households, those with 1 or 2 children have the highest poverty rate, with 40 households (61.5%) falling below the poverty line.
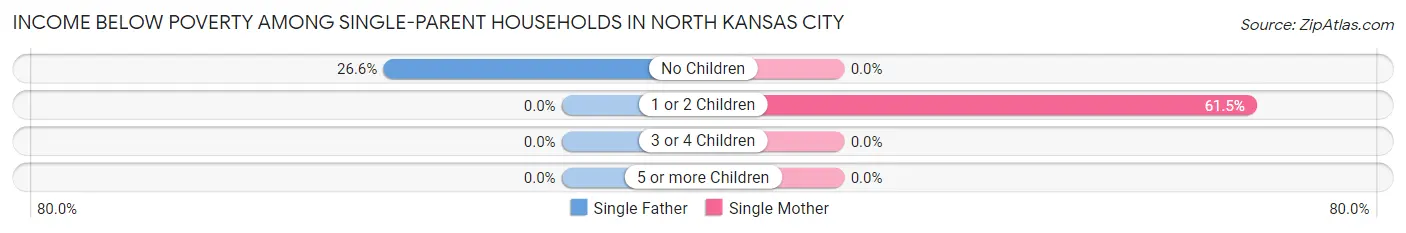
| Children | Single Father | Single Mother |
| No Children | 21 (26.6%) | 0 (0.0%) |
| 1 or 2 Children | 0 (0.0%) | 40 (61.5%) |
| 3 or 4 Children | 0 (0.0%) | 0 (0.0%) |
| 5 or more Children | 0 (0.0%) | 0 (0.0%) |
| Total | 21 (17.6%) | 40 (10.1%) |
Income Below Poverty Among Married-Couple vs Single-Parent Households in North Kansas City
The poverty data for North Kansas City shows that 39 of the married-couple family households (9.8%) and 61 of the single-parent households (11.8%) are living below the poverty level. Within the married-couple family households, those with no children have the highest poverty rate, with 39 households (12.2%) falling below the poverty line. Among the single-parent households, those with 1 or 2 children have the highest poverty rate, with 40 household (38.1%) living below poverty.
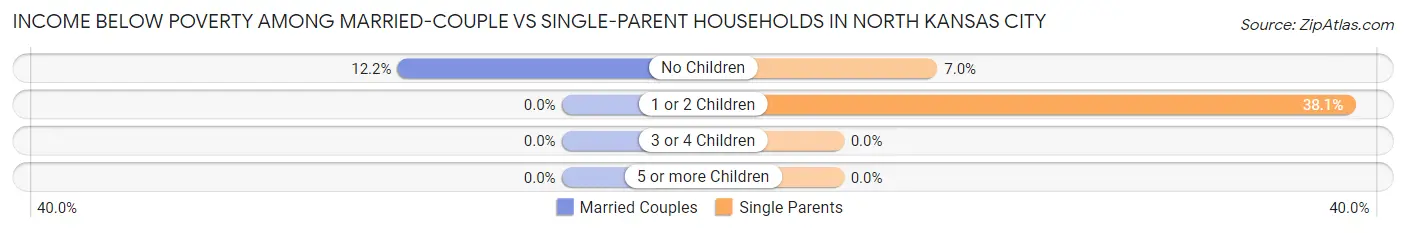
| Children | Married-Couple Families | Single-Parent Households |
| No Children | 39 (12.2%) | 21 (7.0%) |
| 1 or 2 Children | 0 (0.0%) | 40 (38.1%) |
| 3 or 4 Children | 0 (0.0%) | 0 (0.0%) |
| 5 or more Children | 0 (0.0%) | 0 (0.0%) |
| Total | 39 (9.8%) | 61 (11.8%) |
Race in North Kansas City
The most populous races in North Kansas City are White / Caucasian (3,277 | 72.0%), Two or more Races (567 | 12.4%), and Black / African American (527 | 11.6%).
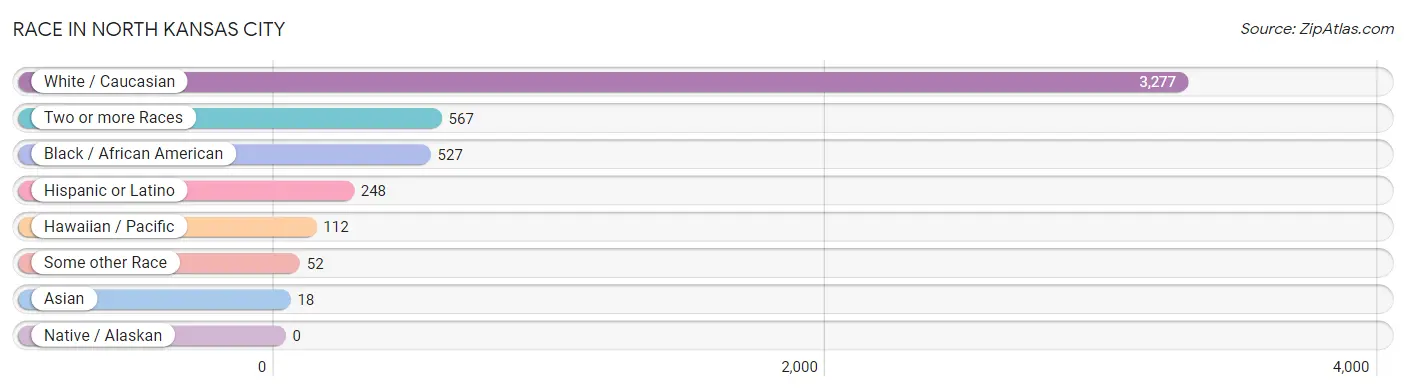
| Race | # Population | % Population |
| Asian | 18 | 0.4% |
| Black / African American | 527 | 11.6% |
| Hawaiian / Pacific | 112 | 2.5% |
| Hispanic or Latino | 248 | 5.4% |
| Native / Alaskan | 0 | 0.0% |
| White / Caucasian | 3,277 | 72.0% |
| Two or more Races | 567 | 12.4% |
| Some other Race | 52 | 1.1% |
| Total | 4,553 | 100.0% |
Ancestry in North Kansas City
The most populous ancestries reported in North Kansas City are German (667 | 14.6%), Irish (423 | 9.3%), English (370 | 8.1%), European (294 | 6.5%), and Italian (261 | 5.7%), together accounting for 44.3% of all North Kansas City residents.
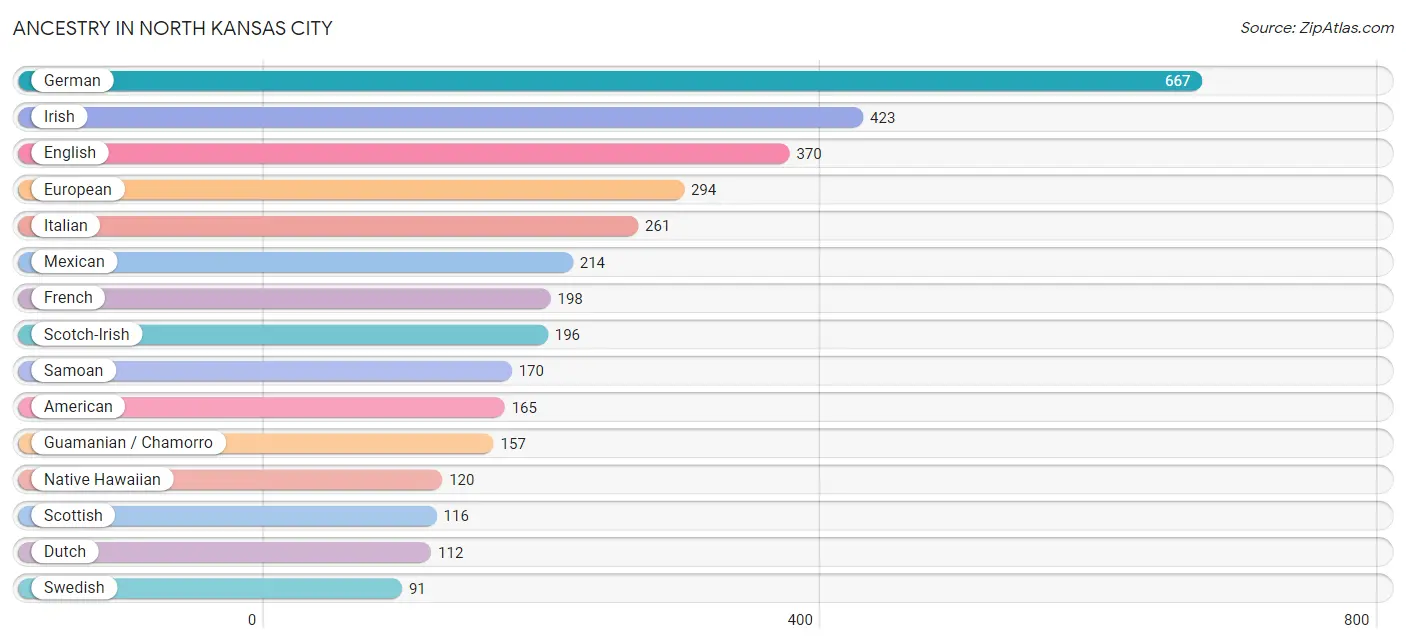
| Ancestry | # Population | % Population |
| African | 22 | 0.5% |
| American | 165 | 3.6% |
| Arab | 32 | 0.7% |
| Austrian | 20 | 0.4% |
| Bhutanese | 58 | 1.3% |
| Bolivian | 34 | 0.7% |
| British | 20 | 0.4% |
| Czech | 21 | 0.5% |
| Czechoslovakian | 22 | 0.5% |
| Dutch | 112 | 2.5% |
| English | 370 | 8.1% |
| European | 294 | 6.5% |
| Filipino | 18 | 0.4% |
| French | 198 | 4.3% |
| French Canadian | 10 | 0.2% |
| German | 667 | 14.6% |
| Guamanian / Chamorro | 157 | 3.5% |
| Iraqi | 15 | 0.3% |
| Irish | 423 | 9.3% |
| Italian | 261 | 5.7% |
| Korean | 76 | 1.7% |
| Lebanese | 17 | 0.4% |
| Mexican | 214 | 4.7% |
| Mexican American Indian | 23 | 0.5% |
| Native Hawaiian | 120 | 2.6% |
| Northern European | 42 | 0.9% |
| Norwegian | 75 | 1.7% |
| Polish | 35 | 0.8% |
| Romanian | 12 | 0.3% |
| Samoan | 170 | 3.7% |
| Scotch-Irish | 196 | 4.3% |
| Scottish | 116 | 2.5% |
| South American | 34 | 0.7% |
| Sri Lankan | 58 | 1.3% |
| Subsaharan African | 22 | 0.5% |
| Swedish | 91 | 2.0% |
| Thai | 58 | 1.3% |
| Welsh | 20 | 0.4% | View All 38 Rows |
Immigrants in North Kansas City
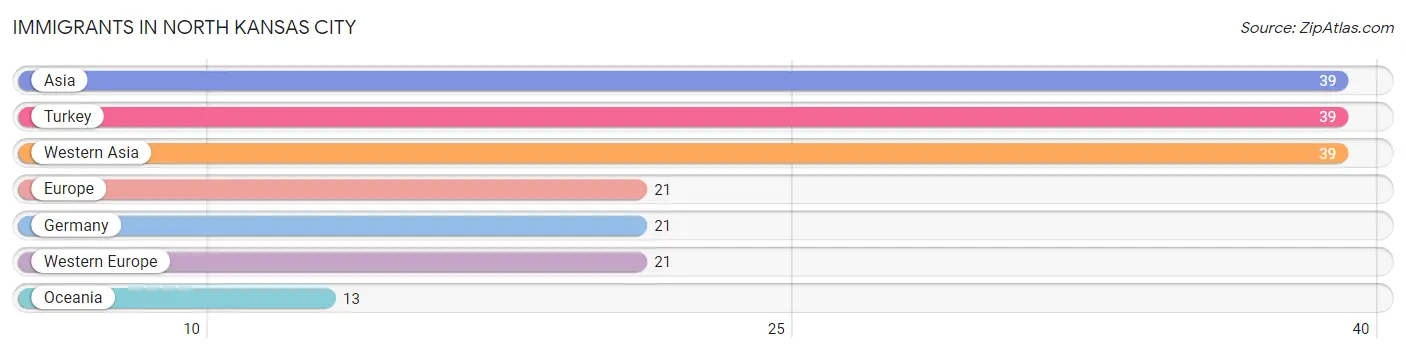
The most numerous immigrant groups reported in North Kansas City came from Asia (39 | 0.9%), Turkey (39 | 0.9%), Western Asia (39 | 0.9%), Europe (21 | 0.5%), and Germany (21 | 0.5%), together accounting for 3.5% of all North Kansas City residents.
| Immigration Origin | # Population | % Population |
| Asia | 39 | 0.9% |
| Europe | 21 | 0.5% |
| Germany | 21 | 0.5% |
| Oceania | 13 | 0.3% |
| Turkey | 39 | 0.9% |
| Western Asia | 39 | 0.9% |
| Western Europe | 21 | 0.5% | View All 7 Rows |
Sex and Age in North Kansas City
Sex and Age in North Kansas City
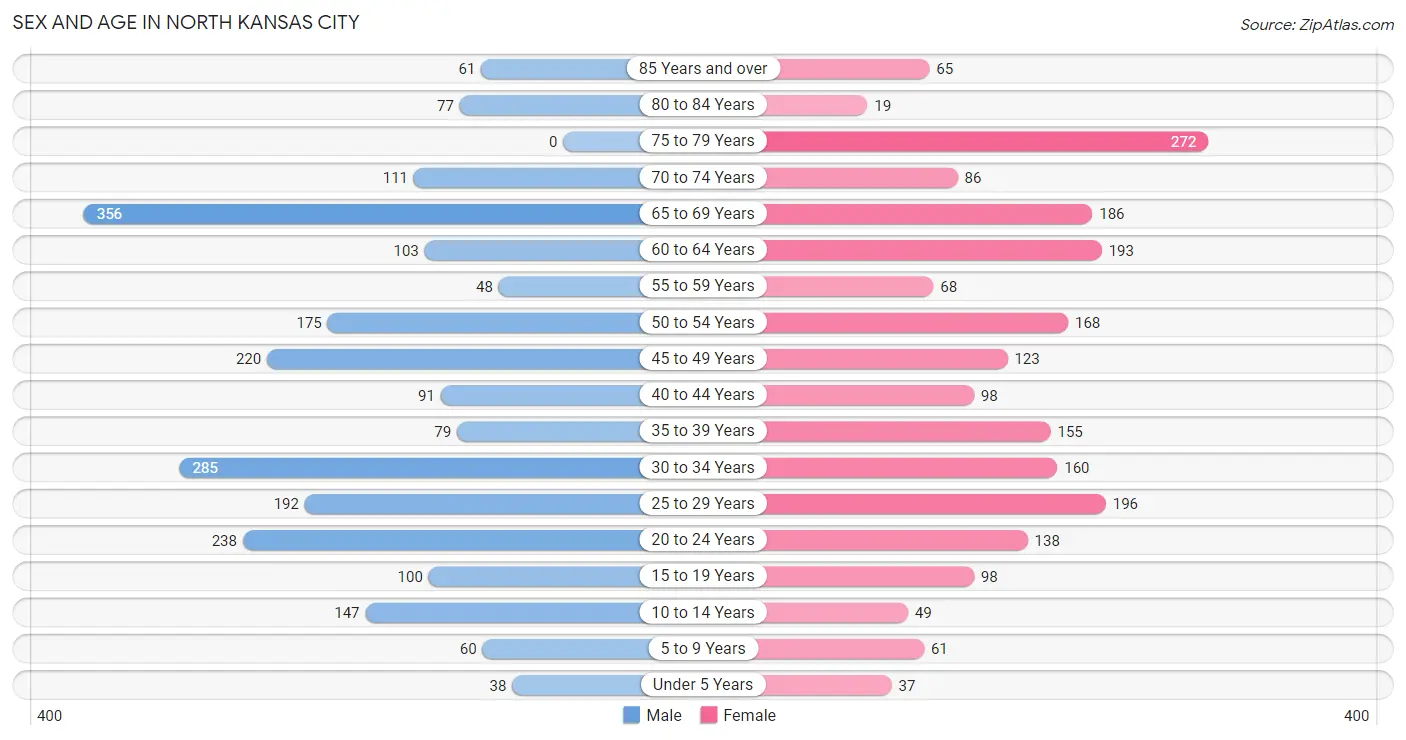
The most populous age groups in North Kansas City are 65 to 69 Years (356 | 14.9%) for men and 75 to 79 Years (272 | 12.5%) for women.
| Age Bracket | Male | Female |
| Under 5 Years | 38 (1.6%) | 37 (1.7%) |
| 5 to 9 Years | 60 (2.5%) | 61 (2.8%) |
| 10 to 14 Years | 147 (6.2%) | 49 (2.3%) |
| 15 to 19 Years | 100 (4.2%) | 98 (4.5%) |
| 20 to 24 Years | 238 (10.0%) | 138 (6.4%) |
| 25 to 29 Years | 192 (8.1%) | 196 (9.0%) |
| 30 to 34 Years | 285 (12.0%) | 160 (7.4%) |
| 35 to 39 Years | 79 (3.3%) | 155 (7.1%) |
| 40 to 44 Years | 91 (3.8%) | 98 (4.5%) |
| 45 to 49 Years | 220 (9.2%) | 123 (5.7%) |
| 50 to 54 Years | 175 (7.3%) | 168 (7.7%) |
| 55 to 59 Years | 48 (2.0%) | 68 (3.1%) |
| 60 to 64 Years | 103 (4.3%) | 193 (8.9%) |
| 65 to 69 Years | 356 (14.9%) | 186 (8.6%) |
| 70 to 74 Years | 111 (4.7%) | 86 (4.0%) |
| 75 to 79 Years | 0 (0.0%) | 272 (12.5%) |
| 80 to 84 Years | 77 (3.2%) | 19 (0.9%) |
| 85 Years and over | 61 (2.6%) | 65 (3.0%) |
| Total | 2,381 (100.0%) | 2,172 (100.0%) |
Families and Households in North Kansas City
Median Family Size in North Kansas City
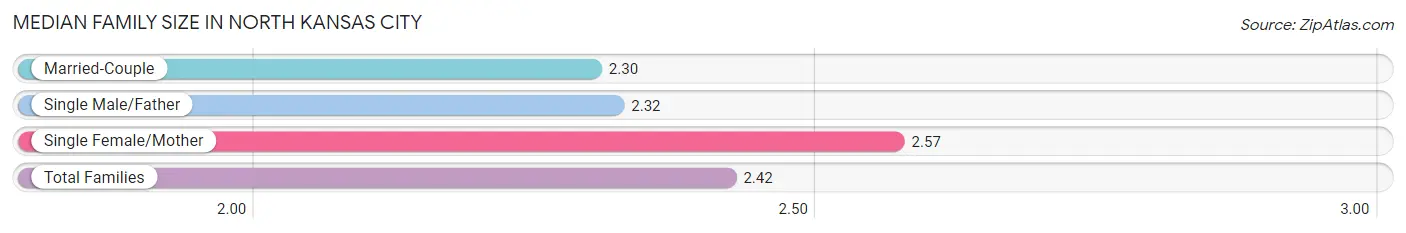
The median family size in North Kansas City is 2.42 persons per family, with single female/mother families (398 | 43.4%) accounting for the largest median family size of 2.57 persons per family. On the other hand, married-couple families (400 | 43.6%) represent the smallest median family size with 2.30 persons per family.
| Family Type | # Families | Family Size |
| Married-Couple | 400 (43.6%) | 2.30 |
| Single Male/Father | 119 (13.0%) | 2.32 |
| Single Female/Mother | 398 (43.4%) | 2.57 |
| Total Families | 917 (100.0%) | 2.42 |
Median Household Size in North Kansas City
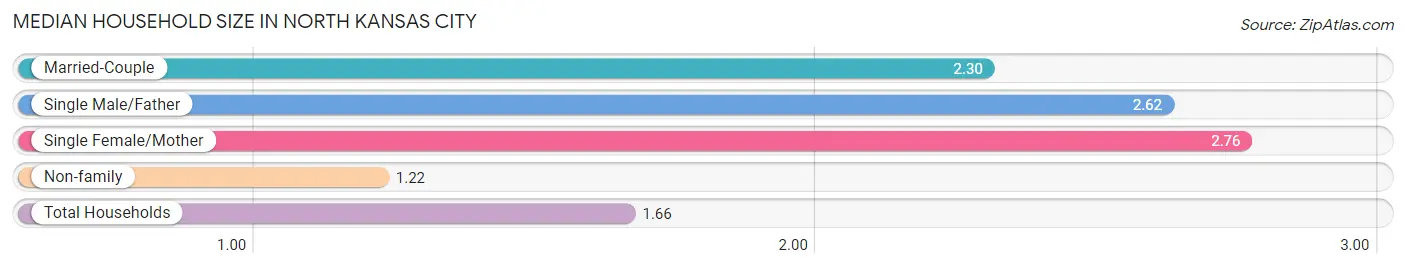
The median household size in North Kansas City is 1.66 persons per household, with single female/mother households (398 | 14.5%) accounting for the largest median household size of 2.76 persons per household. non-family households (1,821 | 66.5%) represent the smallest median household size with 1.22 persons per household.
| Household Type | # Households | Household Size |
| Married-Couple | 400 (14.6%) | 2.30 |
| Single Male/Father | 119 (4.3%) | 2.62 |
| Single Female/Mother | 398 (14.5%) | 2.76 |
| Non-family | 1,821 (66.5%) | 1.22 |
| Total Households | 2,738 (100.0%) | 1.66 |
Household Size by Marriage Status in North Kansas City
Out of a total of 2,738 households in North Kansas City, 917 (33.5%) are family households, while 1,821 (66.5%) are nonfamily households. The most numerous type of family households are 2-person households, comprising 636, and the most common type of nonfamily households are 1-person households, comprising 1,499.
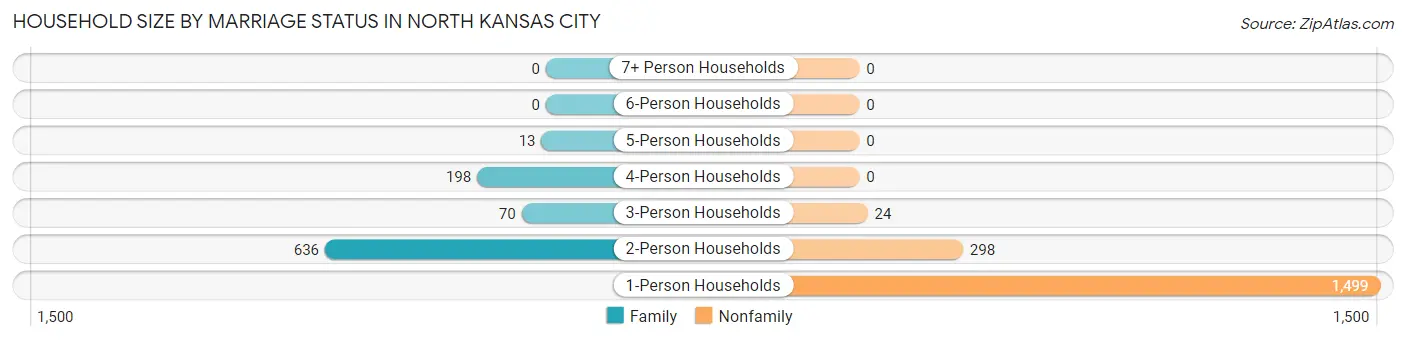
| Household Size | Family Households | Nonfamily Households |
| 1-Person Households | - | 1,499 (54.7%) |
| 2-Person Households | 636 (23.2%) | 298 (10.9%) |
| 3-Person Households | 70 (2.6%) | 24 (0.9%) |
| 4-Person Households | 198 (7.2%) | 0 (0.0%) |
| 5-Person Households | 13 (0.5%) | 0 (0.0%) |
| 6-Person Households | 0 (0.0%) | 0 (0.0%) |
| 7+ Person Households | 0 (0.0%) | 0 (0.0%) |
| Total | 917 (33.5%) | 1,821 (66.5%) |
Female Fertility in North Kansas City
Fertility by Age in North Kansas City
Average fertility rate in North Kansas City is 9.0 births per 1,000 women. Women in the age bracket of 35 to 50 years have the highest fertility rate with 21.0 births per 1,000 women. Women in the age bracket of 35 to 50 years acount for 100.0% of all women with births.
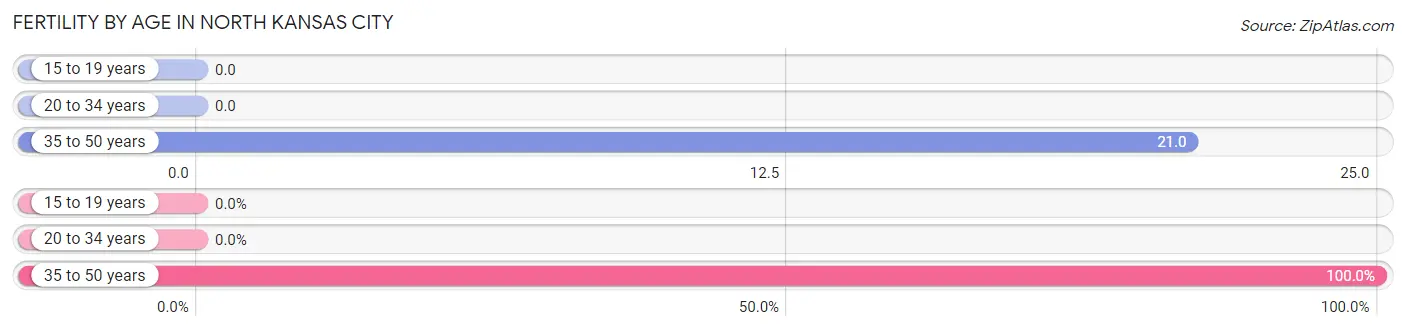
| Age Bracket | Women with Births | Births / 1,000 Women |
| 15 to 19 years | 0 (0.0%) | 0.0 |
| 20 to 34 years | 0 (0.0%) | 0.0 |
| 35 to 50 years | 10 (100.0%) | 21.0 |
| Total | 10 (100.0%) | 9.0 |
Fertility by Age by Marriage Status in North Kansas City
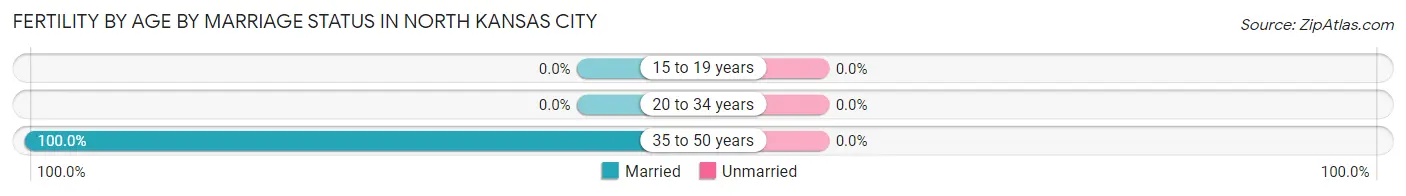
| Age Bracket | Married | Unmarried |
| 15 to 19 years | 0 (0.0%) | 0 (0.0%) |
| 20 to 34 years | 0 (0.0%) | 0 (0.0%) |
| 35 to 50 years | 10 (100.0%) | 0 (0.0%) |
| Total | 10 (100.0%) | 0 (0.0%) |
Fertility by Education in North Kansas City
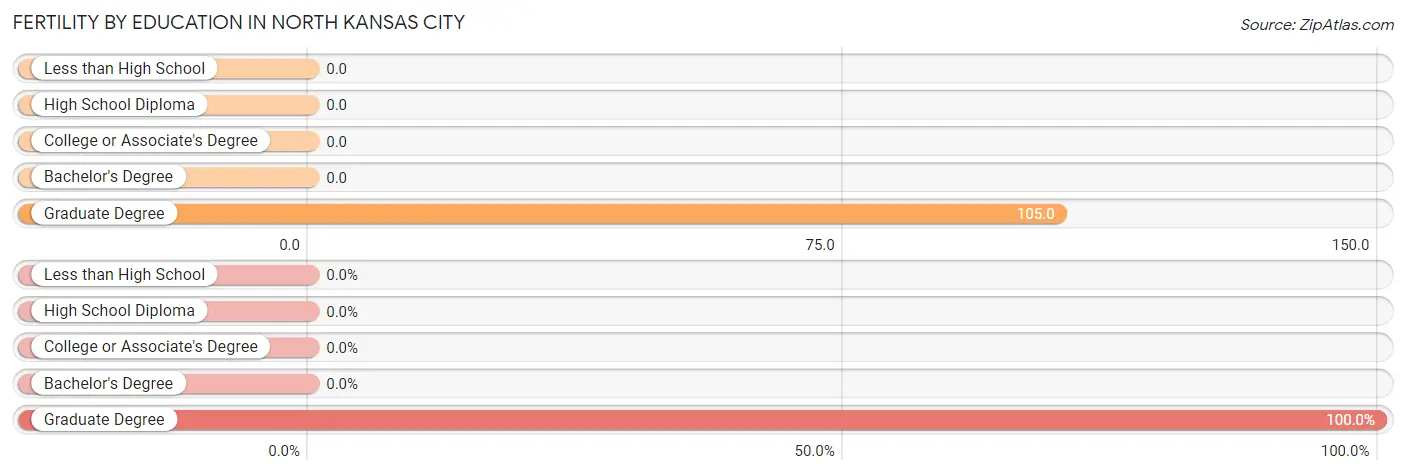
| Educational Attainment | Women with Births | Births / 1,000 Women |
| Less than High School | 0 (0.0%) | 0.0 |
| High School Diploma | 0 (0.0%) | 0.0 |
| College or Associate's Degree | 0 (0.0%) | 0.0 |
| Bachelor's Degree | 0 (0.0%) | 0.0 |
| Graduate Degree | 10 (100.0%) | 105.0 |
| Total | 10 (100.0%) | 9.0 |
Fertility by Education by Marriage Status in North Kansas City
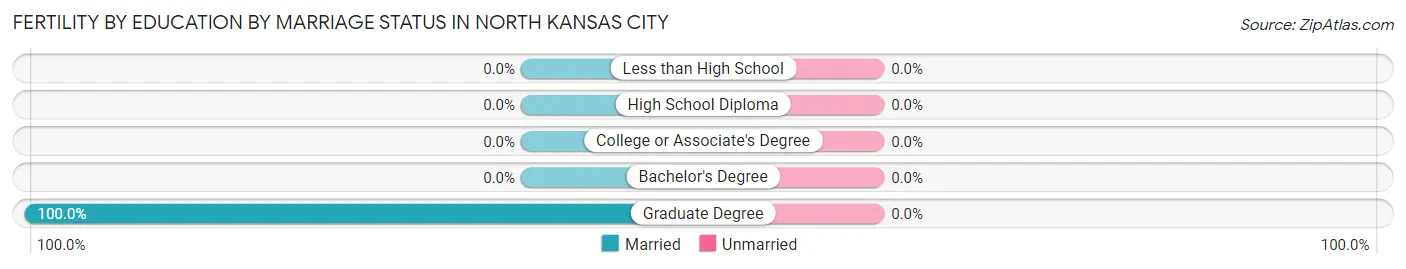
| Educational Attainment | Married | Unmarried |
| Less than High School | 0 (0.0%) | 0 (0.0%) |
| High School Diploma | 0 (0.0%) | 0 (0.0%) |
| College or Associate's Degree | 0 (0.0%) | 0 (0.0%) |
| Bachelor's Degree | 0 (0.0%) | 0 (0.0%) |
| Graduate Degree | 10 (100.0%) | 0 (0.0%) |
| Total | 10 (100.0%) | 0 (0.0%) |
Employment Characteristics in North Kansas City
Employment by Class of Employer in North Kansas City
Among the 2,728 employed individuals in North Kansas City, private company employees (1,850 | 67.8%), not-for-profit organizations (281 | 10.3%), and self-employed (not incorporated) (181 | 6.6%) make up the most common classes of employment.
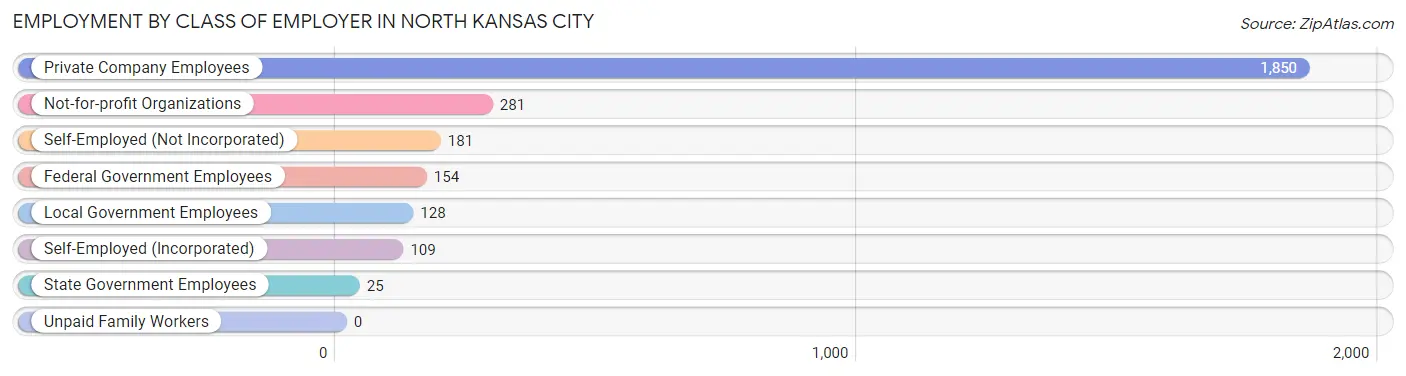
| Employer Class | # Employees | % Employees |
| Private Company Employees | 1,850 | 67.8% |
| Self-Employed (Incorporated) | 109 | 4.0% |
| Self-Employed (Not Incorporated) | 181 | 6.6% |
| Not-for-profit Organizations | 281 | 10.3% |
| Local Government Employees | 128 | 4.7% |
| State Government Employees | 25 | 0.9% |
| Federal Government Employees | 154 | 5.7% |
| Unpaid Family Workers | 0 | 0.0% |
| Total | 2,728 | 100.0% |
Employment Status by Age in North Kansas City
According to the labor force statistics for North Kansas City, out of the total population over 16 years of age (4,078), 74.2% or 3,026 individuals are in the labor force, with 6.3% or 191 of them unemployed. The age group with the highest labor force participation rate is 20 to 24 years, with 100.0% or 376 individuals in the labor force. Within the labor force, the 20 to 24 years age range has the highest percentage of unemployed individuals, with 27.7% or 104 of them being unemployed.
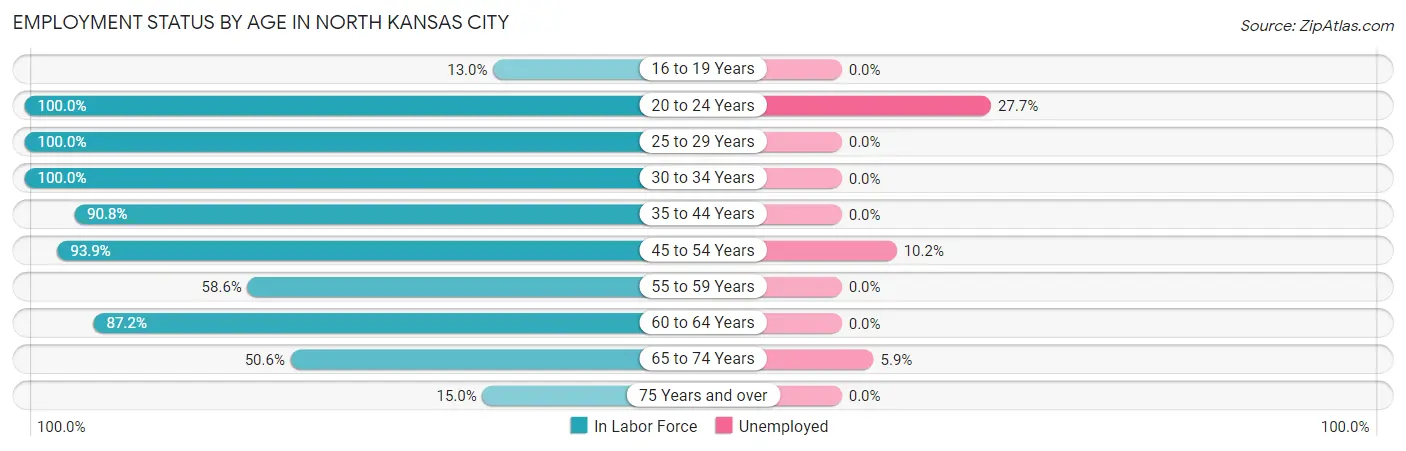
| Age Bracket | In Labor Force | Unemployed |
| 16 to 19 Years | 15 (13.0%) | 0 (0.0%) |
| 20 to 24 Years | 376 (100.0%) | 104 (27.7%) |
| 25 to 29 Years | 388 (100.0%) | 0 (0.0%) |
| 30 to 34 Years | 445 (100.0%) | 0 (0.0%) |
| 35 to 44 Years | 384 (90.8%) | 0 (0.0%) |
| 45 to 54 Years | 644 (93.9%) | 66 (10.2%) |
| 55 to 59 Years | 68 (58.6%) | 0 (0.0%) |
| 60 to 64 Years | 258 (87.2%) | 0 (0.0%) |
| 65 to 74 Years | 374 (50.6%) | 22 (5.9%) |
| 75 Years and over | 74 (15.0%) | 0 (0.0%) |
| Total | 3,026 (74.2%) | 191 (6.3%) |
Employment Status by Educational Attainment in North Kansas City
According to labor force statistics for North Kansas City, 92.9% of individuals (2,187) out of the total population between 25 and 64 years of age (2,354) are in the labor force, with 3.0% or 66 of them being unemployed. The group with the highest labor force participation rate are those with the educational attainment of less than high school, with 100.0% or 73 individuals in the labor force. Within the labor force, individuals with high school diploma education have the highest percentage of unemployment, with 11.2% or 66 of them being unemployed.
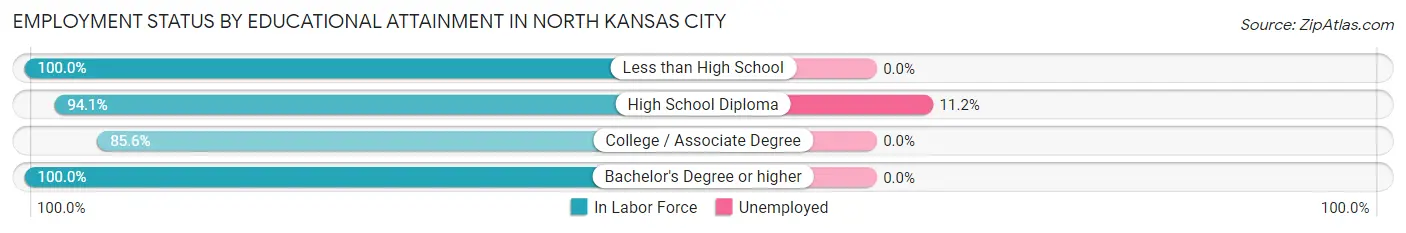
| Educational Attainment | In Labor Force | Unemployed |
| Less than High School | 73 (100.0%) | 0 (0.0%) |
| High School Diploma | 590 (94.1%) | 70 (11.2%) |
| College / Associate Degree | 773 (85.6%) | 0 (0.0%) |
| Bachelor's Degree or higher | 751 (100.0%) | 0 (0.0%) |
| Total | 2,187 (92.9%) | 71 (3.0%) |
Employment Occupations by Sex in North Kansas City
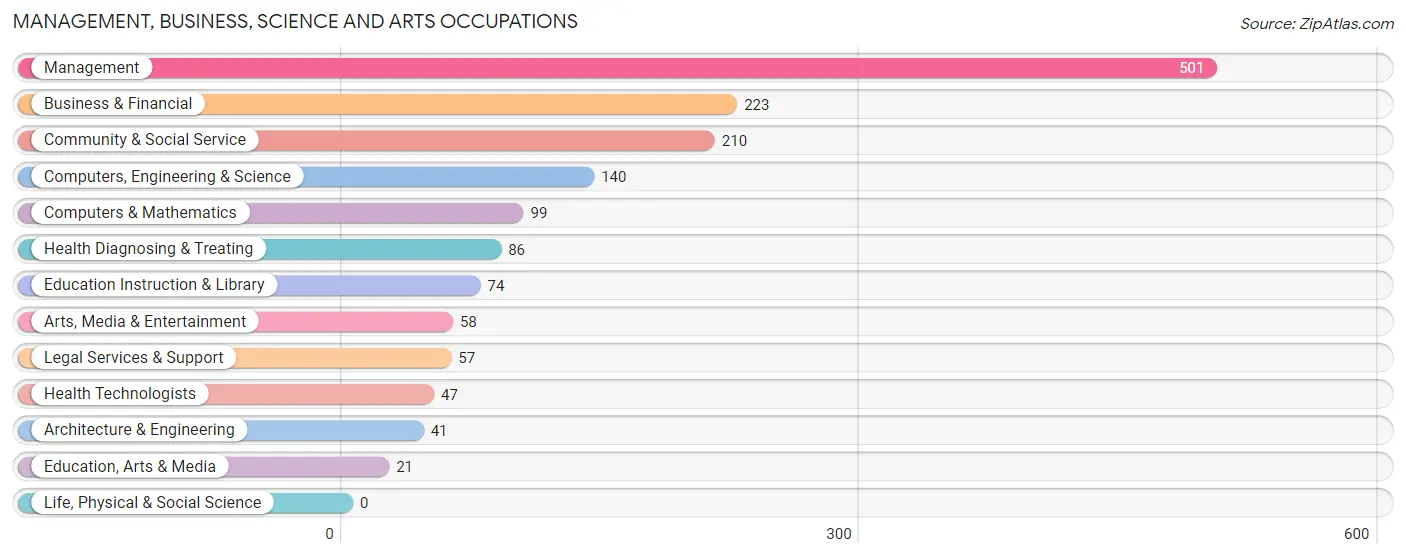
Management, Business, Science and Arts Occupations
The most common Management, Business, Science and Arts occupations in North Kansas City are Management (501 | 17.7%), Business & Financial (223 | 7.9%), Community & Social Service (210 | 7.4%), Computers, Engineering & Science (140 | 4.9%), and Computers & Mathematics (99 | 3.5%).
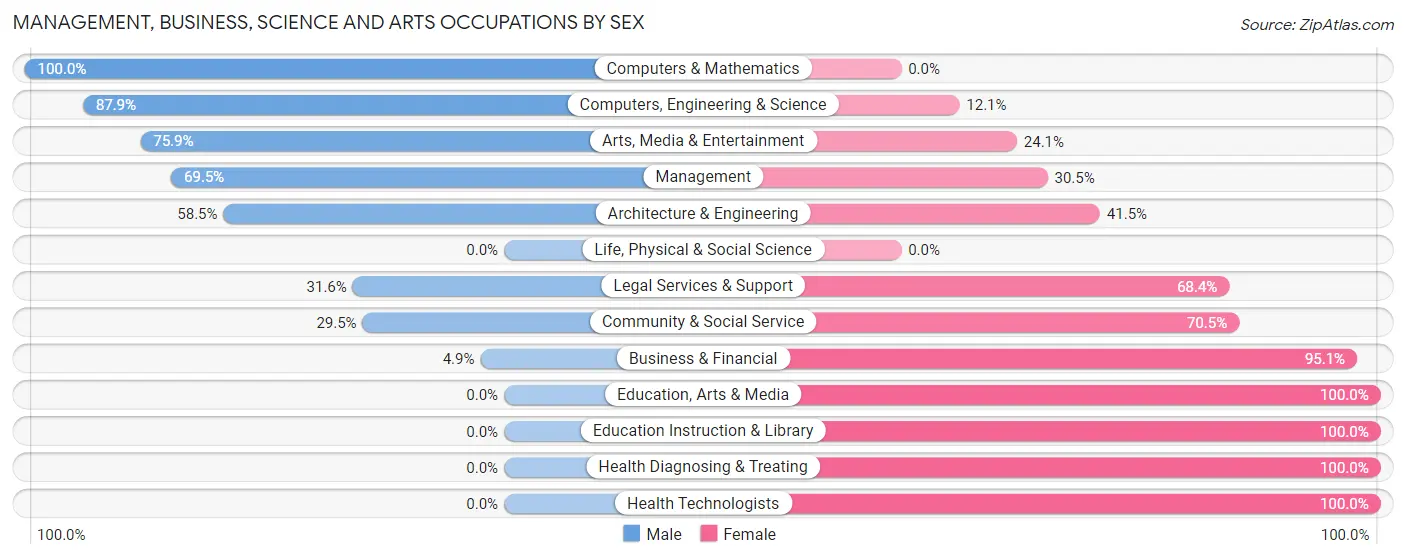
Management, Business, Science and Arts Occupations by Sex
Within the Management, Business, Science and Arts occupations in North Kansas City, the most male-oriented occupations are Computers & Mathematics (100.0%), Computers, Engineering & Science (87.9%), and Arts, Media & Entertainment (75.9%), while the most female-oriented occupations are Education, Arts & Media (100.0%), Education Instruction & Library (100.0%), and Health Diagnosing & Treating (100.0%).
| Occupation | Male | Female |
| Management | 348 (69.5%) | 153 (30.5%) |
| Business & Financial | 11 (4.9%) | 212 (95.1%) |
| Computers, Engineering & Science | 123 (87.9%) | 17 (12.1%) |
| Computers & Mathematics | 99 (100.0%) | 0 (0.0%) |
| Architecture & Engineering | 24 (58.5%) | 17 (41.5%) |
| Life, Physical & Social Science | 0 (0.0%) | 0 (0.0%) |
| Community & Social Service | 62 (29.5%) | 148 (70.5%) |
| Education, Arts & Media | 0 (0.0%) | 21 (100.0%) |
| Legal Services & Support | 18 (31.6%) | 39 (68.4%) |
| Education Instruction & Library | 0 (0.0%) | 74 (100.0%) |
| Arts, Media & Entertainment | 44 (75.9%) | 14 (24.1%) |
| Health Diagnosing & Treating | 0 (0.0%) | 86 (100.0%) |
| Health Technologists | 0 (0.0%) | 47 (100.0%) |
| Total (Category) | 544 (46.9%) | 616 (53.1%) |
| Total (Overall) | 1,472 (51.9%) | 1,362 (48.1%) |
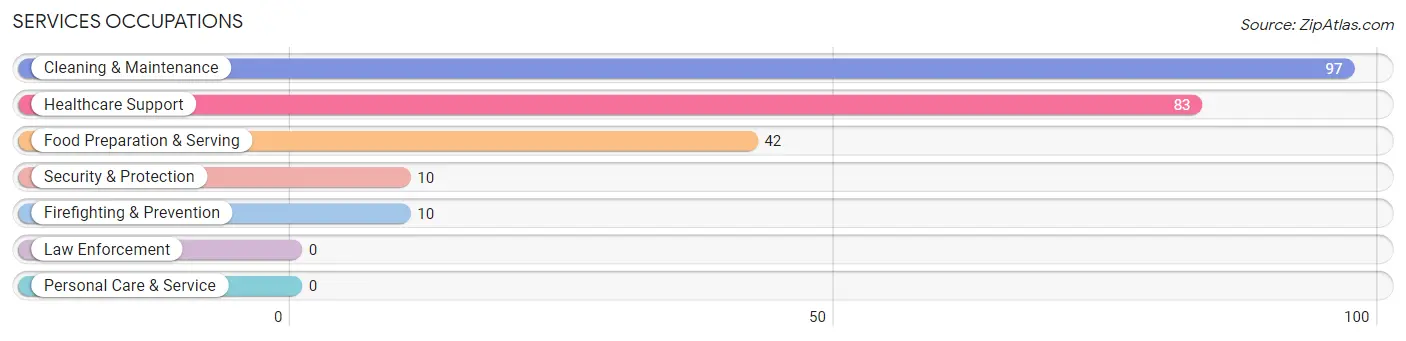
Services Occupations
The most common Services occupations in North Kansas City are Cleaning & Maintenance (97 | 3.4%), Healthcare Support (83 | 2.9%), Food Preparation & Serving (42 | 1.5%), Security & Protection (10 | 0.4%), and Firefighting & Prevention (10 | 0.4%).
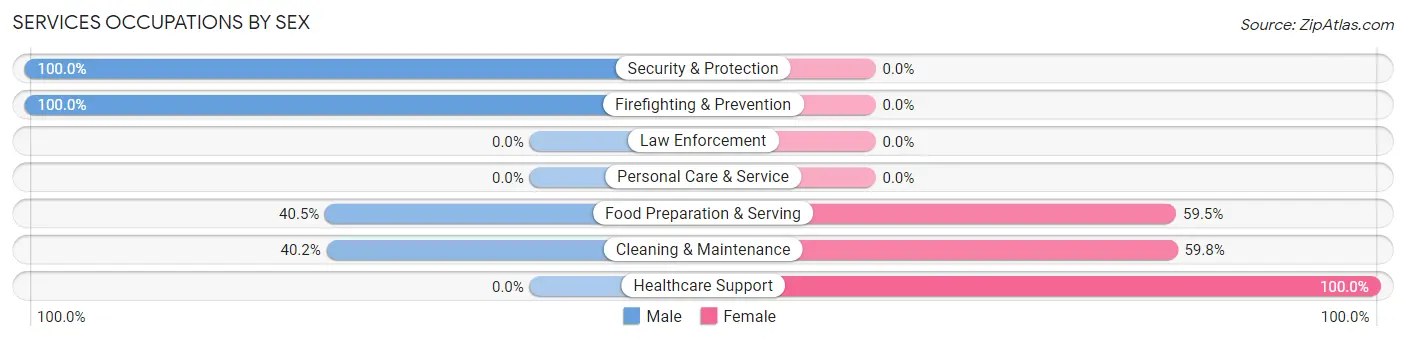
Services Occupations by Sex
Within the Services occupations in North Kansas City, the most male-oriented occupations are Security & Protection (100.0%), Firefighting & Prevention (100.0%), and Food Preparation & Serving (40.5%), while the most female-oriented occupations are Healthcare Support (100.0%), Cleaning & Maintenance (59.8%), and Food Preparation & Serving (59.5%).
| Occupation | Male | Female |
| Healthcare Support | 0 (0.0%) | 83 (100.0%) |
| Security & Protection | 10 (100.0%) | 0 (0.0%) |
| Firefighting & Prevention | 10 (100.0%) | 0 (0.0%) |
| Law Enforcement | 0 (0.0%) | 0 (0.0%) |
| Food Preparation & Serving | 17 (40.5%) | 25 (59.5%) |
| Cleaning & Maintenance | 39 (40.2%) | 58 (59.8%) |
| Personal Care & Service | 0 (0.0%) | 0 (0.0%) |
| Total (Category) | 66 (28.4%) | 166 (71.6%) |
| Total (Overall) | 1,472 (51.9%) | 1,362 (48.1%) |
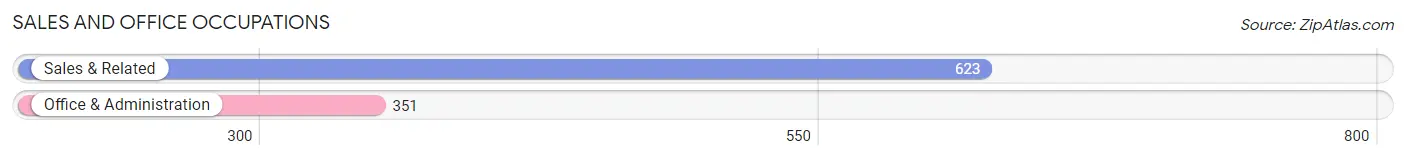
Sales and Office Occupations
The most common Sales and Office occupations in North Kansas City are Sales & Related (623 | 22.0%), and Office & Administration (351 | 12.4%).
Sales and Office Occupations by Sex
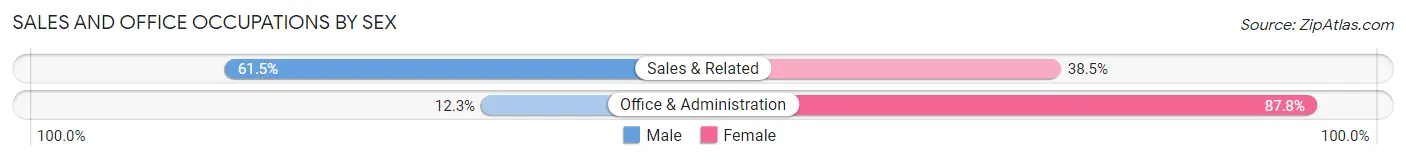
| Occupation | Male | Female |
| Sales & Related | 383 (61.5%) | 240 (38.5%) |
| Office & Administration | 43 (12.2%) | 308 (87.7%) |
| Total (Category) | 426 (43.7%) | 548 (56.3%) |
| Total (Overall) | 1,472 (51.9%) | 1,362 (48.1%) |
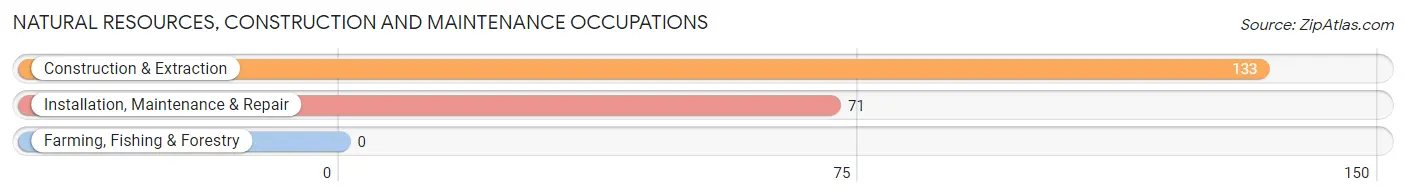
Natural Resources, Construction and Maintenance Occupations
The most common Natural Resources, Construction and Maintenance occupations in North Kansas City are Construction & Extraction (133 | 4.7%), and Installation, Maintenance & Repair (71 | 2.5%).
Natural Resources, Construction and Maintenance Occupations by Sex
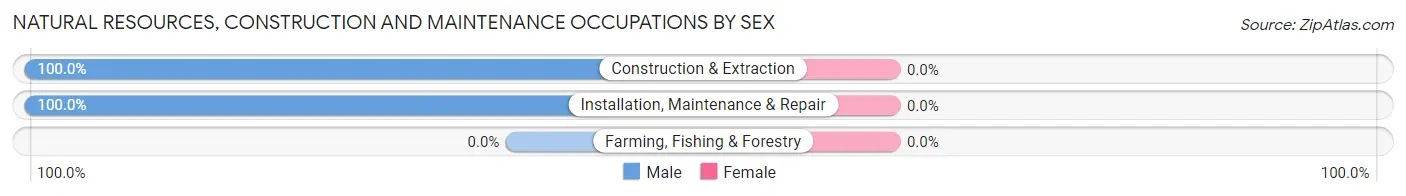
| Occupation | Male | Female |
| Farming, Fishing & Forestry | 0 (0.0%) | 0 (0.0%) |
| Construction & Extraction | 133 (100.0%) | 0 (0.0%) |
| Installation, Maintenance & Repair | 71 (100.0%) | 0 (0.0%) |
| Total (Category) | 204 (100.0%) | 0 (0.0%) |
| Total (Overall) | 1,472 (51.9%) | 1,362 (48.1%) |
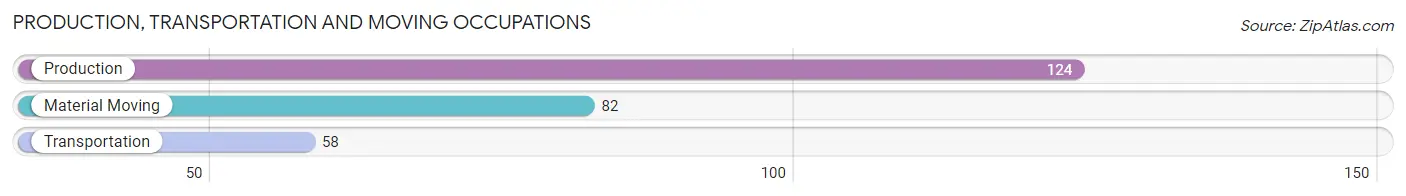
Production, Transportation and Moving Occupations
The most common Production, Transportation and Moving occupations in North Kansas City are Production (124 | 4.4%), Material Moving (82 | 2.9%), and Transportation (58 | 2.1%).
Production, Transportation and Moving Occupations by Sex
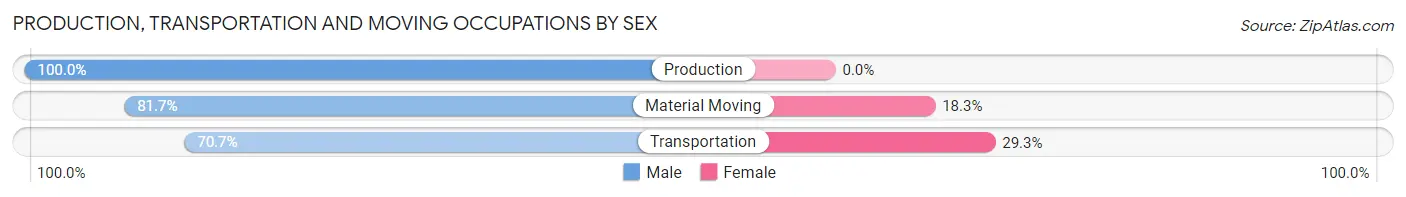
| Occupation | Male | Female |
| Production | 124 (100.0%) | 0 (0.0%) |
| Transportation | 41 (70.7%) | 17 (29.3%) |
| Material Moving | 67 (81.7%) | 15 (18.3%) |
| Total (Category) | 232 (87.9%) | 32 (12.1%) |
| Total (Overall) | 1,472 (51.9%) | 1,362 (48.1%) |
Employment Industries by Sex in North Kansas City
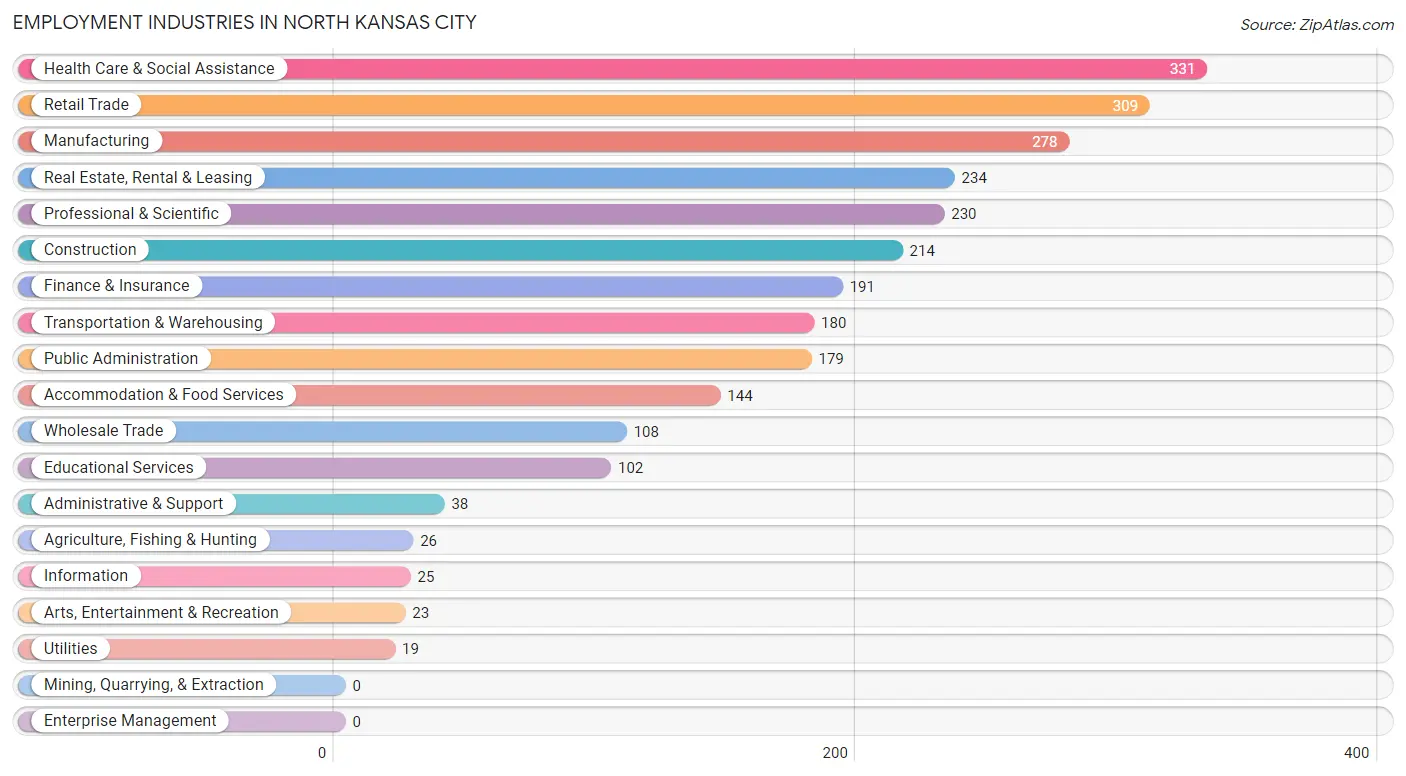
Employment Industries in North Kansas City
The major employment industries in North Kansas City include Health Care & Social Assistance (331 | 11.7%), Retail Trade (309 | 10.9%), Manufacturing (278 | 9.8%), Real Estate, Rental & Leasing (234 | 8.3%), and Professional & Scientific (230 | 8.1%).
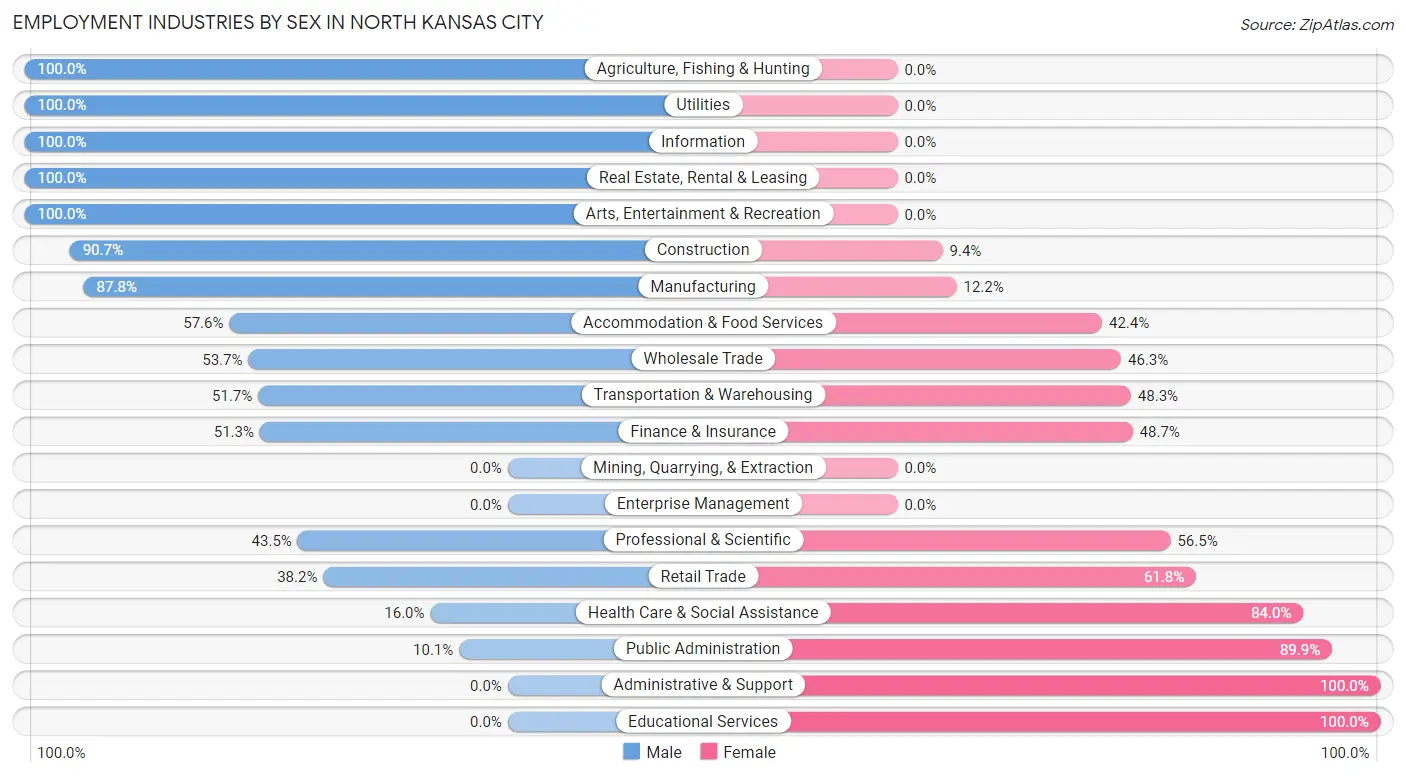
Employment Industries by Sex in North Kansas City
The North Kansas City industries that see more men than women are Agriculture, Fishing & Hunting (100.0%), Utilities (100.0%), and Information (100.0%), whereas the industries that tend to have a higher number of women are Administrative & Support (100.0%), Educational Services (100.0%), and Public Administration (89.9%).
| Industry | Male | Female |
| Agriculture, Fishing & Hunting | 26 (100.0%) | 0 (0.0%) |
| Mining, Quarrying, & Extraction | 0 (0.0%) | 0 (0.0%) |
| Construction | 194 (90.6%) | 20 (9.3%) |
| Manufacturing | 244 (87.8%) | 34 (12.2%) |
| Wholesale Trade | 58 (53.7%) | 50 (46.3%) |
| Retail Trade | 118 (38.2%) | 191 (61.8%) |
| Transportation & Warehousing | 93 (51.7%) | 87 (48.3%) |
| Utilities | 19 (100.0%) | 0 (0.0%) |
| Information | 25 (100.0%) | 0 (0.0%) |
| Finance & Insurance | 98 (51.3%) | 93 (48.7%) |
| Real Estate, Rental & Leasing | 234 (100.0%) | 0 (0.0%) |
| Professional & Scientific | 100 (43.5%) | 130 (56.5%) |
| Enterprise Management | 0 (0.0%) | 0 (0.0%) |
| Administrative & Support | 0 (0.0%) | 38 (100.0%) |
| Educational Services | 0 (0.0%) | 102 (100.0%) |
| Health Care & Social Assistance | 53 (16.0%) | 278 (84.0%) |
| Arts, Entertainment & Recreation | 23 (100.0%) | 0 (0.0%) |
| Accommodation & Food Services | 83 (57.6%) | 61 (42.4%) |
| Public Administration | 18 (10.1%) | 161 (89.9%) |
| Total | 1,472 (51.9%) | 1,362 (48.1%) |
Education in North Kansas City
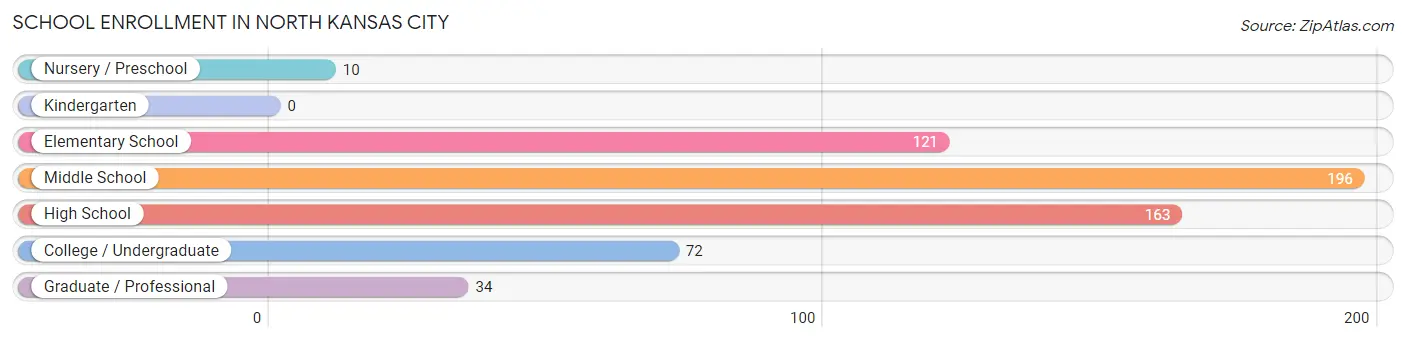
School Enrollment in North Kansas City
The most common levels of schooling among the 596 students in North Kansas City are middle school (196 | 32.9%), high school (163 | 27.4%), and elementary school (121 | 20.3%).
| School Level | # Students | % Students |
| Nursery / Preschool | 10 | 1.7% |
| Kindergarten | 0 | 0.0% |
| Elementary School | 121 | 20.3% |
| Middle School | 196 | 32.9% |
| High School | 163 | 27.4% |
| College / Undergraduate | 72 | 12.1% |
| Graduate / Professional | 34 | 5.7% |
| Total | 596 | 100.0% |
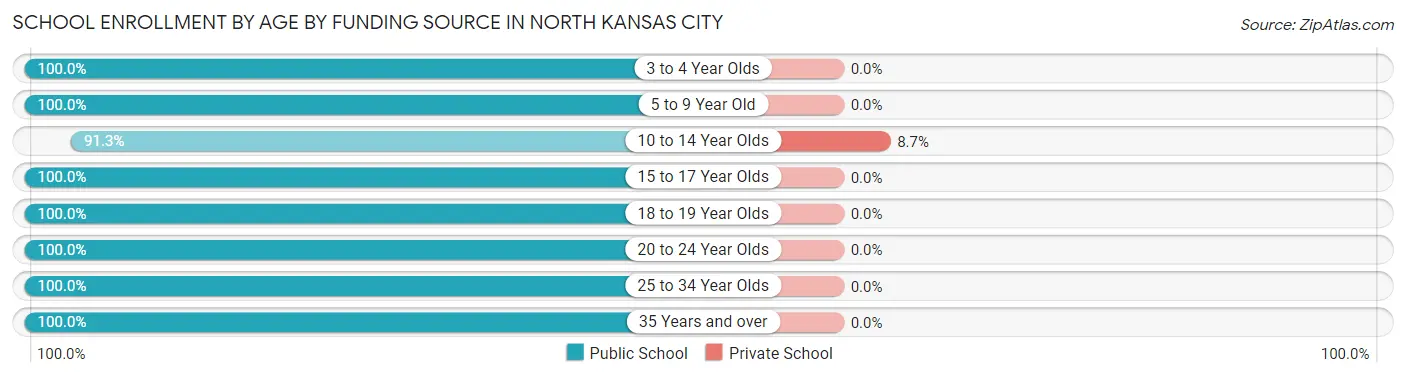
School Enrollment by Age by Funding Source in North Kansas City
Out of a total of 596 students who are enrolled in schools in North Kansas City, 17 (2.9%) attend a private institution, while the remaining 579 (97.1%) are enrolled in public schools. The age group of 10 to 14 year olds has the highest likelihood of being enrolled in private schools, with 17 (8.7% in the age bracket) enrolled. Conversely, the age group of 3 to 4 year olds has the lowest likelihood of being enrolled in a private school, with 10 (100.0% in the age bracket) attending a public institution.
| Age Bracket | Public School | Private School |
| 3 to 4 Year Olds | 10 (100.0%) | 0 (0.0%) |
| 5 to 9 Year Old | 121 (100.0%) | 0 (0.0%) |
| 10 to 14 Year Olds | 179 (91.3%) | 17 (8.7%) |
| 15 to 17 Year Olds | 163 (100.0%) | 0 (0.0%) |
| 18 to 19 Year Olds | 20 (100.0%) | 0 (0.0%) |
| 20 to 24 Year Olds | 38 (100.0%) | 0 (0.0%) |
| 25 to 34 Year Olds | 34 (100.0%) | 0 (0.0%) |
| 35 Years and over | 14 (100.0%) | 0 (0.0%) |
| Total | 579 (97.1%) | 17 (2.9%) |
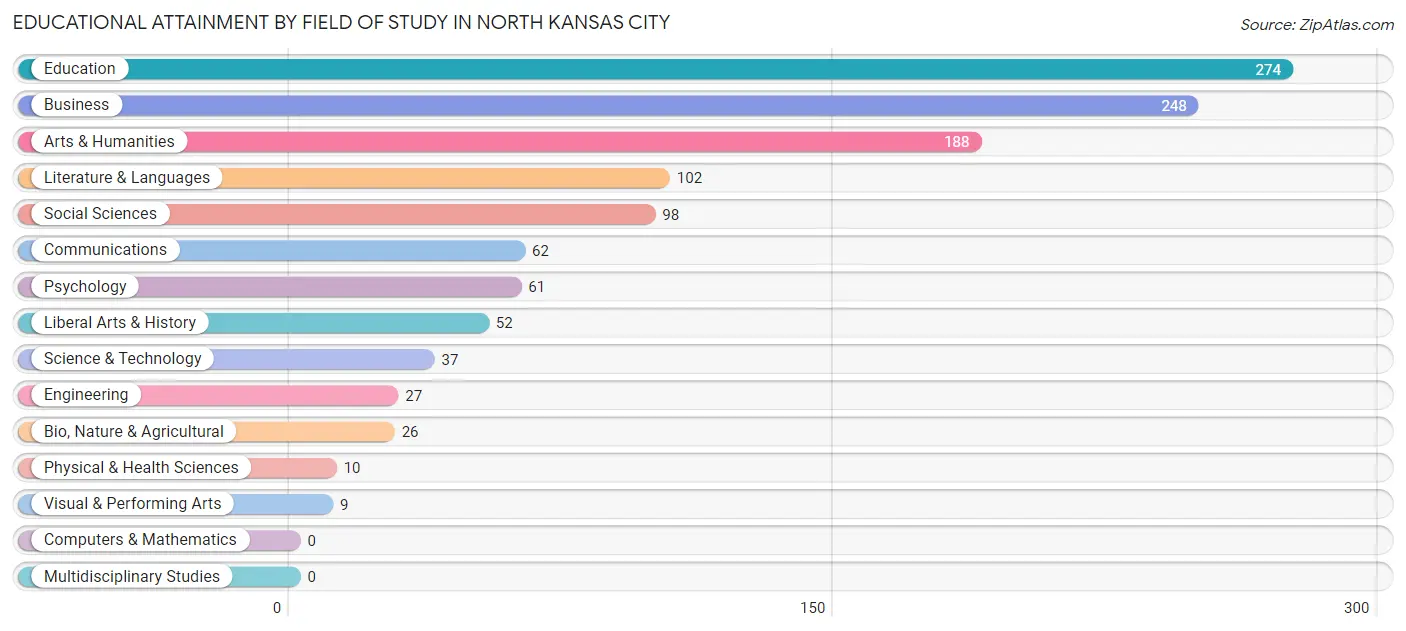
Educational Attainment by Field of Study in North Kansas City
Education (274 | 23.0%), business (248 | 20.8%), arts & humanities (188 | 15.8%), literature & languages (102 | 8.5%), and social sciences (98 | 8.2%) are the most common fields of study among 1,194 individuals in North Kansas City who have obtained a bachelor's degree or higher.
| Field of Study | # Graduates | % Graduates |
| Computers & Mathematics | 0 | 0.0% |
| Bio, Nature & Agricultural | 26 | 2.2% |
| Physical & Health Sciences | 10 | 0.8% |
| Psychology | 61 | 5.1% |
| Social Sciences | 98 | 8.2% |
| Engineering | 27 | 2.3% |
| Multidisciplinary Studies | 0 | 0.0% |
| Science & Technology | 37 | 3.1% |
| Business | 248 | 20.8% |
| Education | 274 | 23.0% |
| Literature & Languages | 102 | 8.5% |
| Liberal Arts & History | 52 | 4.4% |
| Visual & Performing Arts | 9 | 0.7% |
| Communications | 62 | 5.2% |
| Arts & Humanities | 188 | 15.8% |
| Total | 1,194 | 100.0% |
Transportation & Commute in North Kansas City
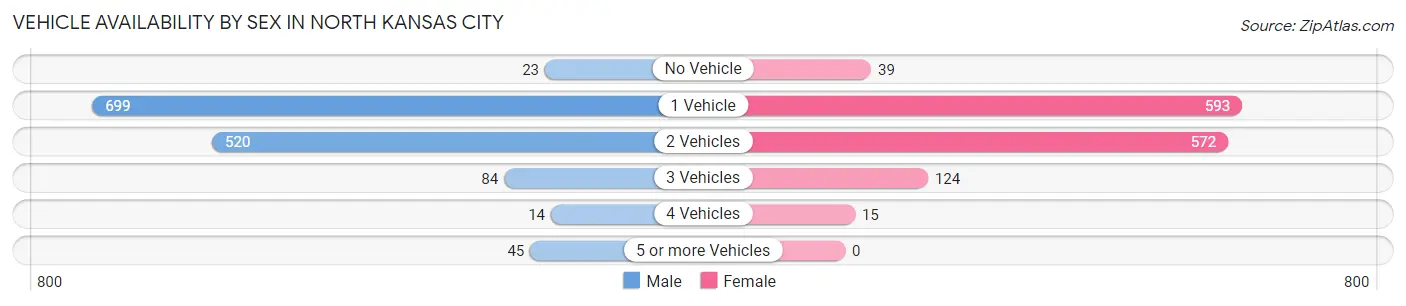
Vehicle Availability by Sex in North Kansas City
The most prevalent vehicle ownership categories in North Kansas City are males with 1 vehicle (699, accounting for 50.5%) and females with 1 vehicle (593, making up 52.0%).
| Vehicles Available | Male | Female |
| No Vehicle | 23 (1.7%) | 39 (2.9%) |
| 1 Vehicle | 699 (50.5%) | 593 (44.2%) |
| 2 Vehicles | 520 (37.6%) | 572 (42.6%) |
| 3 Vehicles | 84 (6.1%) | 124 (9.2%) |
| 4 Vehicles | 14 (1.0%) | 15 (1.1%) |
| 5 or more Vehicles | 45 (3.3%) | 0 (0.0%) |
| Total | 1,385 (100.0%) | 1,343 (100.0%) |
Commute Time in North Kansas City
The most frequently occuring commute durations in North Kansas City are 15 to 19 minutes (548 commuters, 22.0%), 10 to 14 minutes (489 commuters, 19.6%), and 5 to 9 minutes (388 commuters, 15.6%).
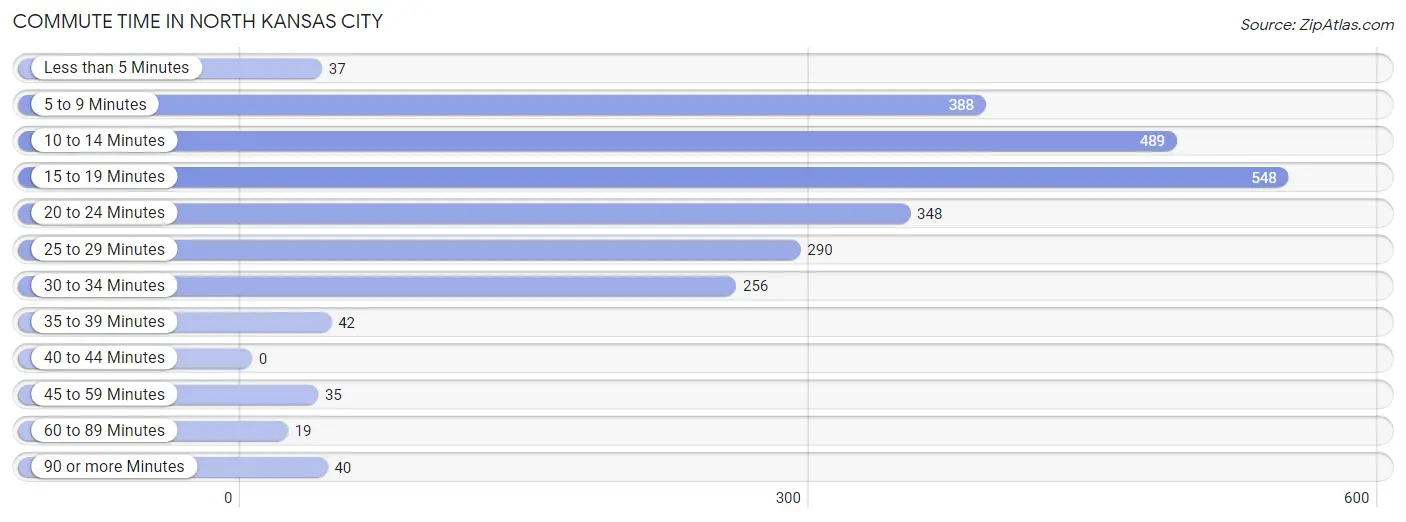
| Commute Time | # Commuters | % Commuters |
| Less than 5 Minutes | 37 | 1.5% |
| 5 to 9 Minutes | 388 | 15.6% |
| 10 to 14 Minutes | 489 | 19.6% |
| 15 to 19 Minutes | 548 | 22.0% |
| 20 to 24 Minutes | 348 | 14.0% |
| 25 to 29 Minutes | 290 | 11.6% |
| 30 to 34 Minutes | 256 | 10.3% |
| 35 to 39 Minutes | 42 | 1.7% |
| 40 to 44 Minutes | 0 | 0.0% |
| 45 to 59 Minutes | 35 | 1.4% |
| 60 to 89 Minutes | 19 | 0.8% |
| 90 or more Minutes | 40 | 1.6% |
Commute Time by Sex in North Kansas City
The most common commute times in North Kansas City are 25 to 29 minutes (280 commuters, 21.1%) for males and 10 to 14 minutes (382 commuters, 32.7%) for females.
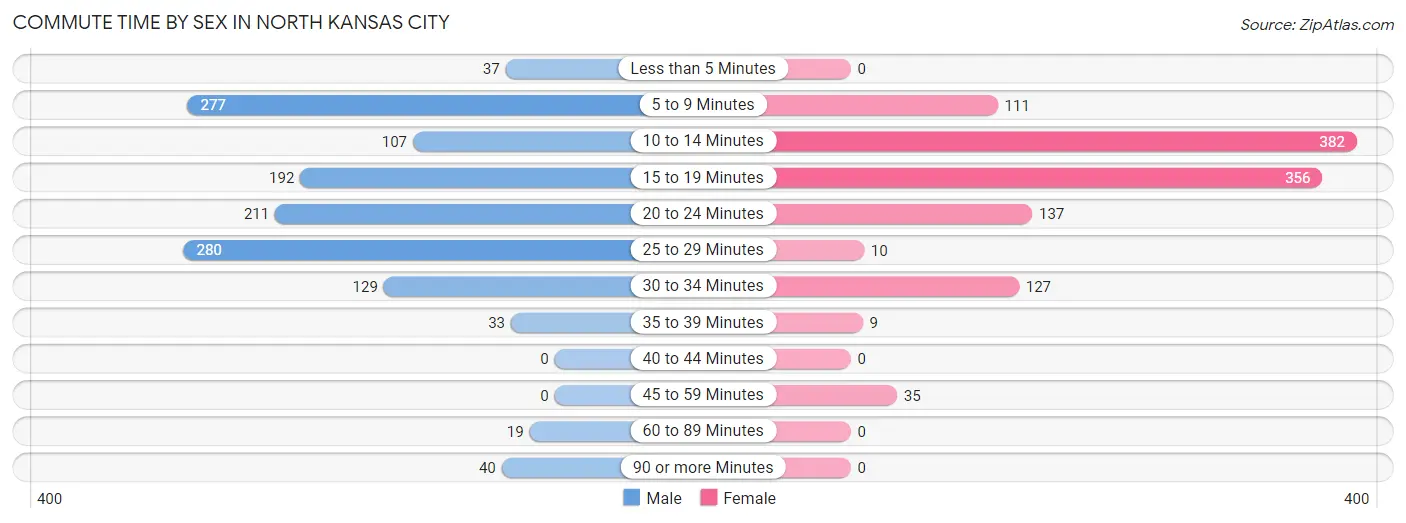
| Commute Time | Male | Female |
| Less than 5 Minutes | 37 (2.8%) | 0 (0.0%) |
| 5 to 9 Minutes | 277 (20.9%) | 111 (9.5%) |
| 10 to 14 Minutes | 107 (8.1%) | 382 (32.7%) |
| 15 to 19 Minutes | 192 (14.5%) | 356 (30.5%) |
| 20 to 24 Minutes | 211 (15.9%) | 137 (11.7%) |
| 25 to 29 Minutes | 280 (21.1%) | 10 (0.9%) |
| 30 to 34 Minutes | 129 (9.7%) | 127 (10.9%) |
| 35 to 39 Minutes | 33 (2.5%) | 9 (0.8%) |
| 40 to 44 Minutes | 0 (0.0%) | 0 (0.0%) |
| 45 to 59 Minutes | 0 (0.0%) | 35 (3.0%) |
| 60 to 89 Minutes | 19 (1.4%) | 0 (0.0%) |
| 90 or more Minutes | 40 (3.0%) | 0 (0.0%) |
Time of Departure to Work by Sex in North Kansas City
The most frequent times of departure to work in North Kansas City are 6:00 AM to 6:29 AM (297, 22.4%) for males and 7:00 AM to 7:29 AM (273, 23.4%) for females.
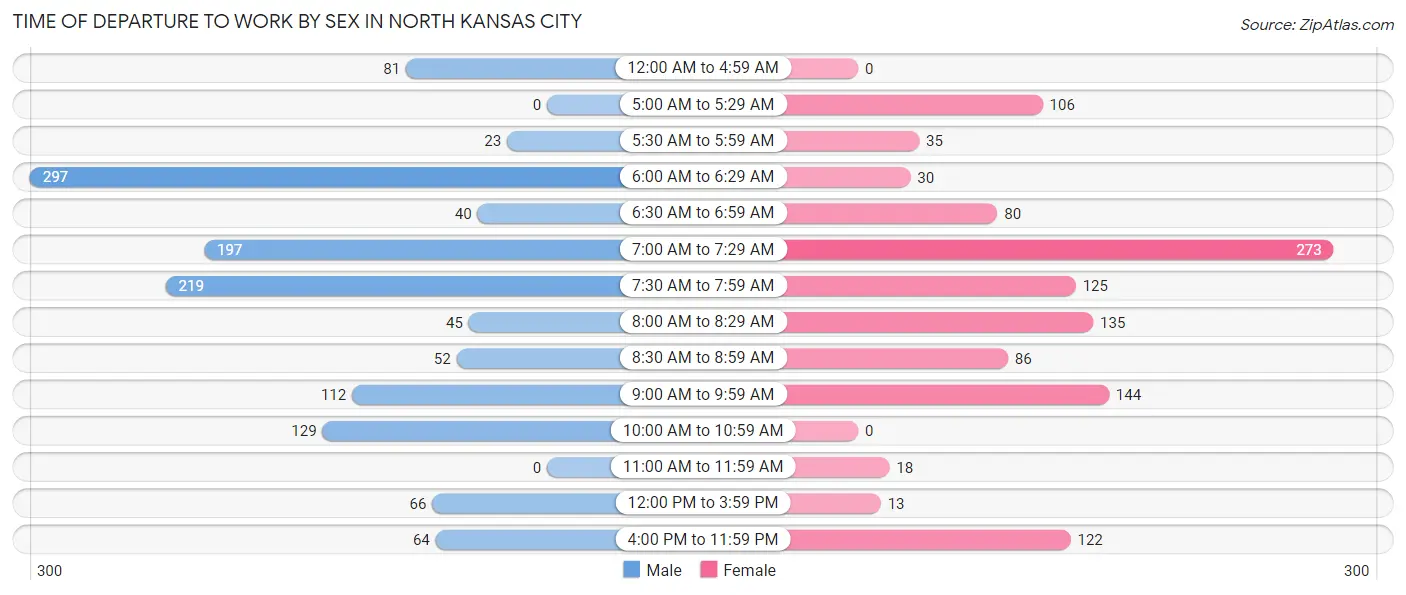
| Time of Departure | Male | Female |
| 12:00 AM to 4:59 AM | 81 (6.1%) | 0 (0.0%) |
| 5:00 AM to 5:29 AM | 0 (0.0%) | 106 (9.1%) |
| 5:30 AM to 5:59 AM | 23 (1.7%) | 35 (3.0%) |
| 6:00 AM to 6:29 AM | 297 (22.4%) | 30 (2.6%) |
| 6:30 AM to 6:59 AM | 40 (3.0%) | 80 (6.9%) |
| 7:00 AM to 7:29 AM | 197 (14.9%) | 273 (23.4%) |
| 7:30 AM to 7:59 AM | 219 (16.5%) | 125 (10.7%) |
| 8:00 AM to 8:29 AM | 45 (3.4%) | 135 (11.6%) |
| 8:30 AM to 8:59 AM | 52 (3.9%) | 86 (7.4%) |
| 9:00 AM to 9:59 AM | 112 (8.5%) | 144 (12.3%) |
| 10:00 AM to 10:59 AM | 129 (9.7%) | 0 (0.0%) |
| 11:00 AM to 11:59 AM | 0 (0.0%) | 18 (1.5%) |
| 12:00 PM to 3:59 PM | 66 (5.0%) | 13 (1.1%) |
| 4:00 PM to 11:59 PM | 64 (4.8%) | 122 (10.4%) |
| Total | 1,325 (100.0%) | 1,167 (100.0%) |
Housing Occupancy in North Kansas City
Occupancy by Ownership in North Kansas City
Of the total 2,738 dwellings in North Kansas City, owner-occupied units account for 812 (29.7%), while renter-occupied units make up 1,926 (70.3%).
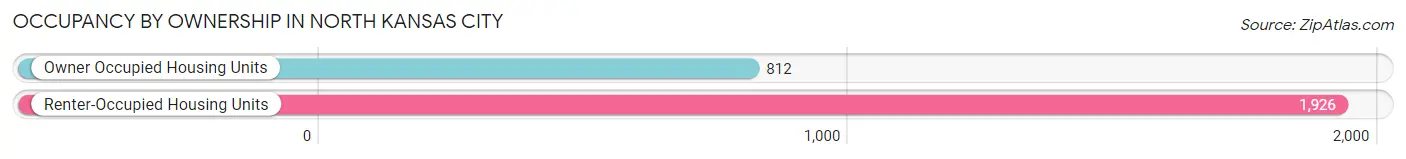
| Occupancy | # Housing Units | % Housing Units |
| Owner Occupied Housing Units | 812 | 29.7% |
| Renter-Occupied Housing Units | 1,926 | 70.3% |
| Total Occupied Housing Units | 2,738 | 100.0% |
Occupancy by Household Size in North Kansas City
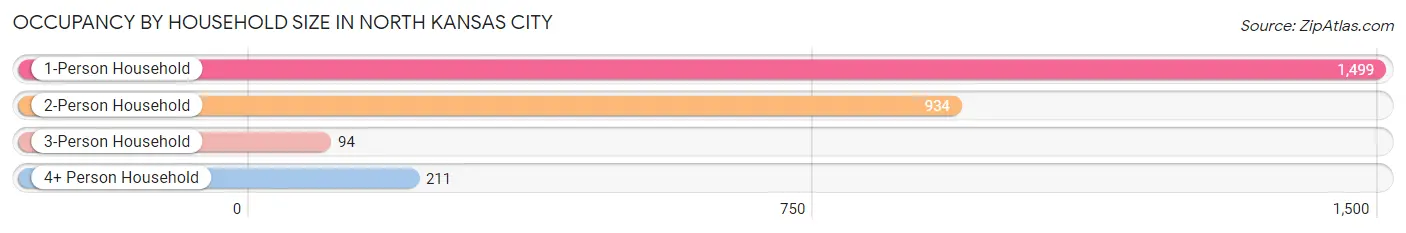
| Household Size | # Housing Units | % Housing Units |
| 1-Person Household | 1,499 | 54.7% |
| 2-Person Household | 934 | 34.1% |
| 3-Person Household | 94 | 3.4% |
| 4+ Person Household | 211 | 7.7% |
| Total Housing Units | 2,738 | 100.0% |
Occupancy by Ownership by Household Size in North Kansas City
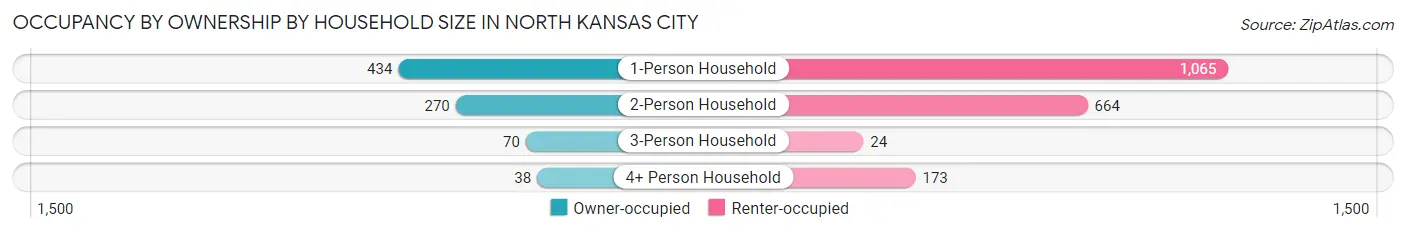
| Household Size | Owner-occupied | Renter-occupied |
| 1-Person Household | 434 (28.9%) | 1,065 (71.1%) |
| 2-Person Household | 270 (28.9%) | 664 (71.1%) |
| 3-Person Household | 70 (74.5%) | 24 (25.5%) |
| 4+ Person Household | 38 (18.0%) | 173 (82.0%) |
| Total Housing Units | 812 (29.7%) | 1,926 (70.3%) |
Occupancy by Educational Attainment in North Kansas City
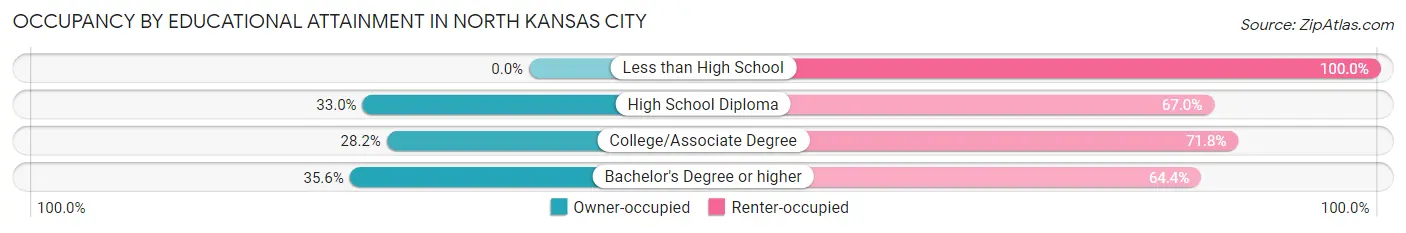
| Household Size | Owner-occupied | Renter-occupied |
| Less than High School | 0 (0.0%) | 202 (100.0%) |
| High School Diploma | 280 (33.0%) | 568 (67.0%) |
| College/Associate Degree | 263 (28.2%) | 669 (71.8%) |
| Bachelor's Degree or higher | 269 (35.6%) | 487 (64.4%) |
Occupancy by Age of Householder in North Kansas City
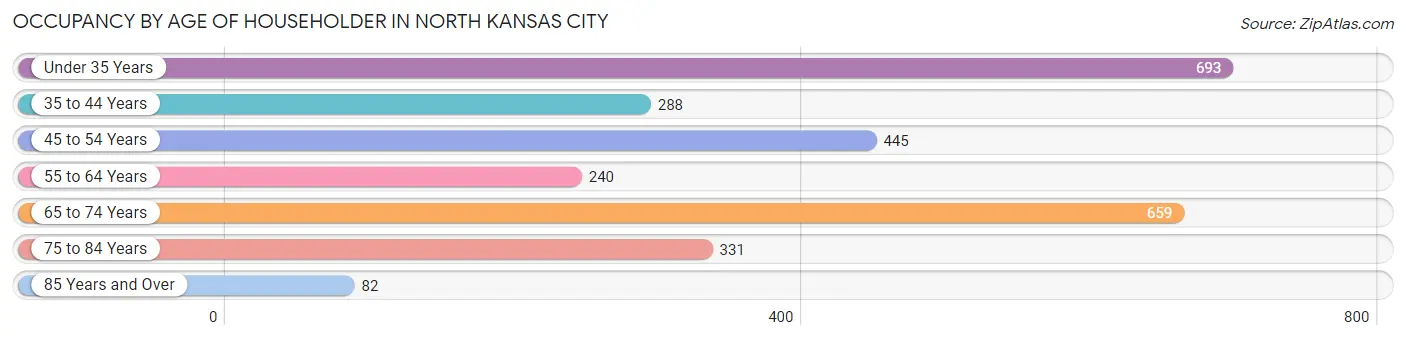
| Age Bracket | # Households | % Households |
| Under 35 Years | 693 | 25.3% |
| 35 to 44 Years | 288 | 10.5% |
| 45 to 54 Years | 445 | 16.3% |
| 55 to 64 Years | 240 | 8.8% |
| 65 to 74 Years | 659 | 24.1% |
| 75 to 84 Years | 331 | 12.1% |
| 85 Years and Over | 82 | 3.0% |
| Total | 2,738 | 100.0% |
Housing Finances in North Kansas City
Median Income by Occupancy in North Kansas City
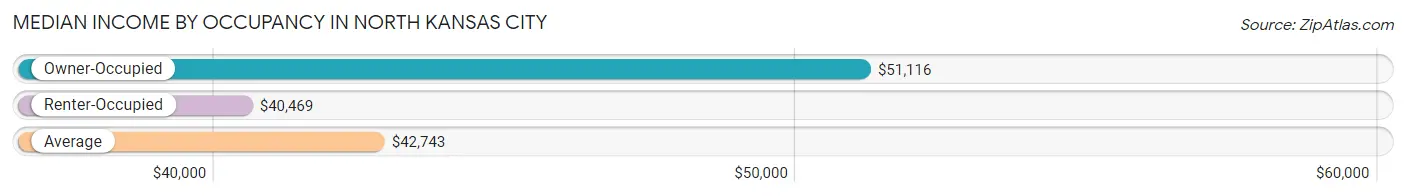
| Occupancy Type | # Households | Median Income |
| Owner-Occupied | 812 (29.7%) | $51,116 |
| Renter-Occupied | 1,926 (70.3%) | $40,469 |
| Average | 2,738 (100.0%) | $42,743 |
Occupancy by Householder Income Bracket in North Kansas City
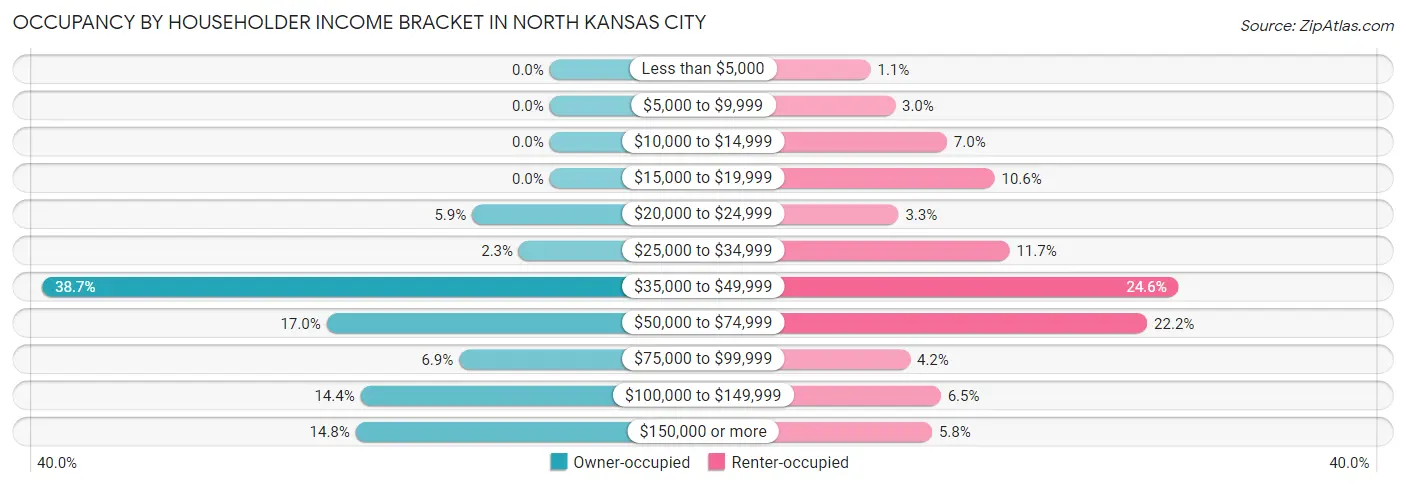
| Income Bracket | Owner-occupied | Renter-occupied |
| Less than $5,000 | 0 (0.0%) | 22 (1.1%) |
| $5,000 to $9,999 | 0 (0.0%) | 58 (3.0%) |
| $10,000 to $14,999 | 0 (0.0%) | 134 (7.0%) |
| $15,000 to $19,999 | 0 (0.0%) | 204 (10.6%) |
| $20,000 to $24,999 | 48 (5.9%) | 63 (3.3%) |
| $25,000 to $34,999 | 19 (2.3%) | 226 (11.7%) |
| $35,000 to $49,999 | 314 (38.7%) | 474 (24.6%) |
| $50,000 to $74,999 | 138 (17.0%) | 428 (22.2%) |
| $75,000 to $99,999 | 56 (6.9%) | 80 (4.2%) |
| $100,000 to $149,999 | 117 (14.4%) | 125 (6.5%) |
| $150,000 or more | 120 (14.8%) | 112 (5.8%) |
| Total | 812 (100.0%) | 1,926 (100.0%) |
Monthly Housing Cost Tiers in North Kansas City
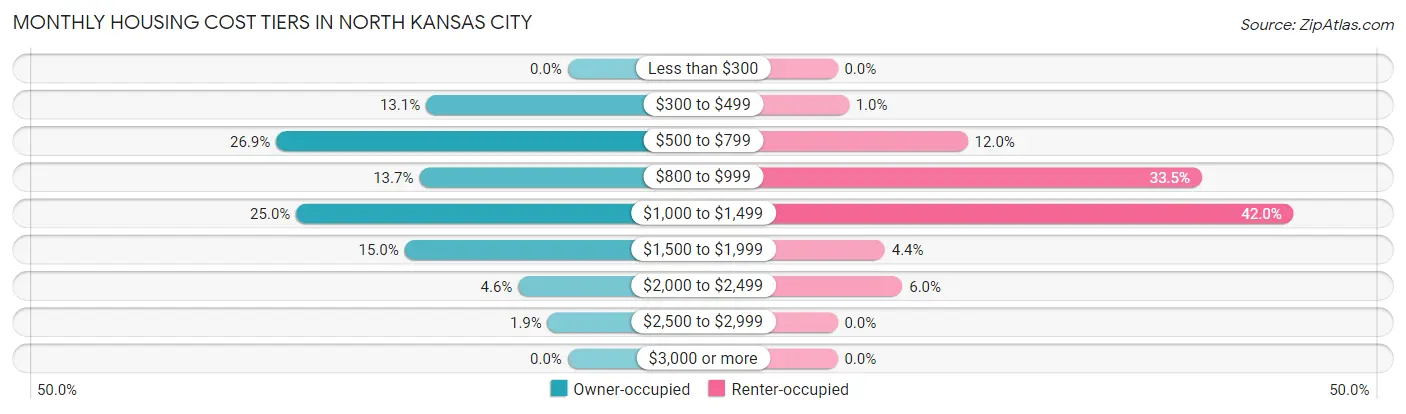
| Monthly Cost | Owner-occupied | Renter-occupied |
| Less than $300 | 0 (0.0%) | 0 (0.0%) |
| $300 to $499 | 106 (13.1%) | 20 (1.0%) |
| $500 to $799 | 218 (26.9%) | 231 (12.0%) |
| $800 to $999 | 111 (13.7%) | 646 (33.5%) |
| $1,000 to $1,499 | 203 (25.0%) | 809 (42.0%) |
| $1,500 to $1,999 | 122 (15.0%) | 84 (4.4%) |
| $2,000 to $2,499 | 37 (4.6%) | 115 (6.0%) |
| $2,500 to $2,999 | 15 (1.8%) | 0 (0.0%) |
| $3,000 or more | 0 (0.0%) | 0 (0.0%) |
| Total | 812 (100.0%) | 1,926 (100.0%) |
Physical Housing Characteristics in North Kansas City
Housing Structures in North Kansas City
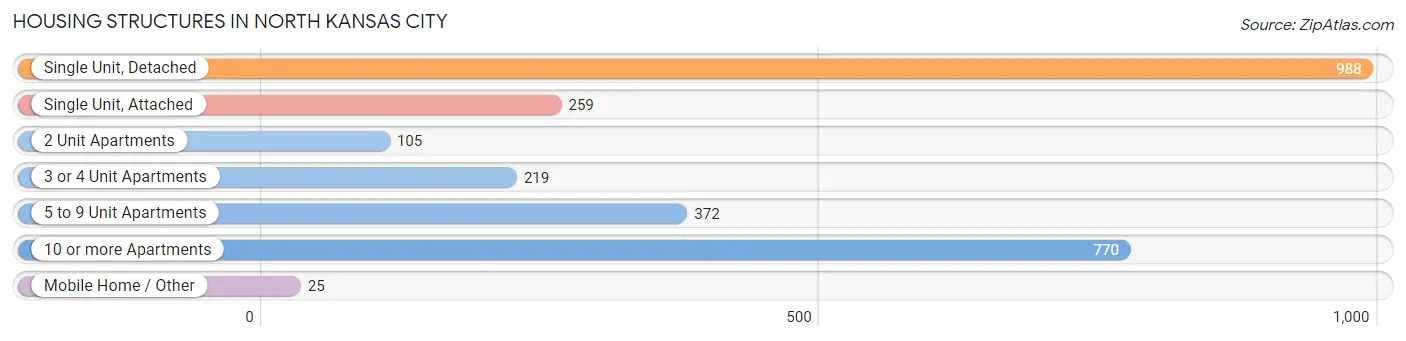
| Structure Type | # Housing Units | % Housing Units |
| Single Unit, Detached | 988 | 36.1% |
| Single Unit, Attached | 259 | 9.5% |
| 2 Unit Apartments | 105 | 3.8% |
| 3 or 4 Unit Apartments | 219 | 8.0% |
| 5 to 9 Unit Apartments | 372 | 13.6% |
| 10 or more Apartments | 770 | 28.1% |
| Mobile Home / Other | 25 | 0.9% |
| Total | 2,738 | 100.0% |
Housing Structures by Occupancy in North Kansas City
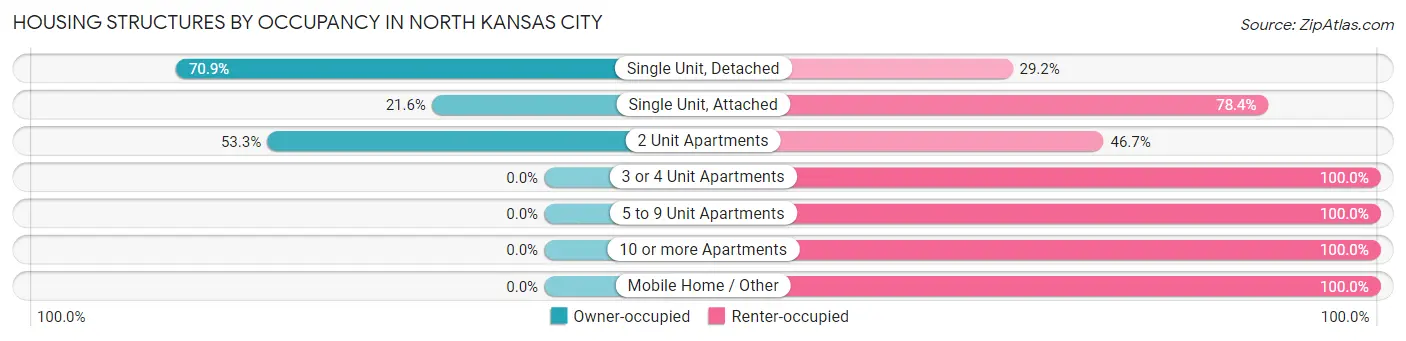
| Structure Type | Owner-occupied | Renter-occupied |
| Single Unit, Detached | 700 (70.9%) | 288 (29.1%) |
| Single Unit, Attached | 56 (21.6%) | 203 (78.4%) |
| 2 Unit Apartments | 56 (53.3%) | 49 (46.7%) |
| 3 or 4 Unit Apartments | 0 (0.0%) | 219 (100.0%) |
| 5 to 9 Unit Apartments | 0 (0.0%) | 372 (100.0%) |
| 10 or more Apartments | 0 (0.0%) | 770 (100.0%) |
| Mobile Home / Other | 0 (0.0%) | 25 (100.0%) |
| Total | 812 (29.7%) | 1,926 (70.3%) |
Housing Structures by Number of Rooms in North Kansas City
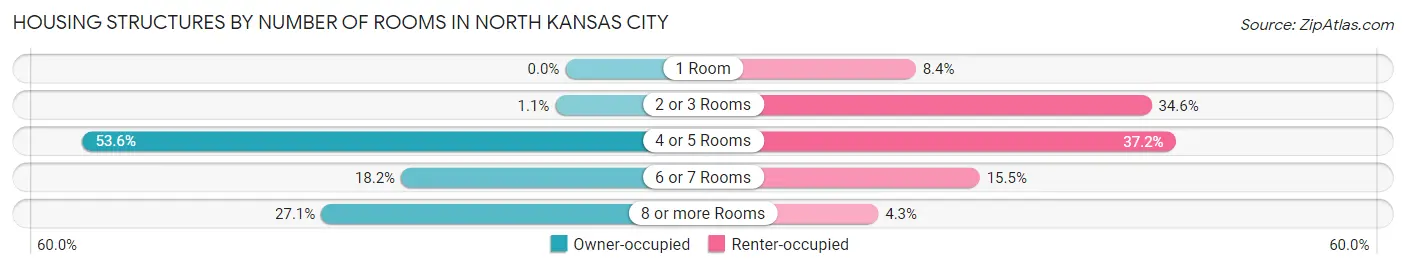
| Number of Rooms | Owner-occupied | Renter-occupied |
| 1 Room | 0 (0.0%) | 162 (8.4%) |
| 2 or 3 Rooms | 9 (1.1%) | 666 (34.6%) |
| 4 or 5 Rooms | 435 (53.6%) | 717 (37.2%) |
| 6 or 7 Rooms | 148 (18.2%) | 299 (15.5%) |
| 8 or more Rooms | 220 (27.1%) | 82 (4.3%) |
| Total | 812 (100.0%) | 1,926 (100.0%) |
Housing Structure by Heating Type in North Kansas City
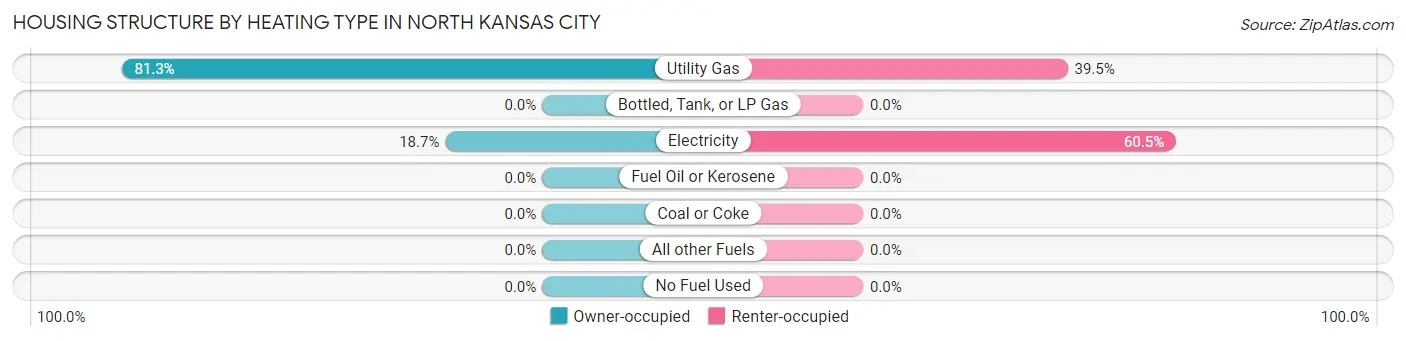
| Heating Type | Owner-occupied | Renter-occupied |
| Utility Gas | 660 (81.3%) | 761 (39.5%) |
| Bottled, Tank, or LP Gas | 0 (0.0%) | 0 (0.0%) |
| Electricity | 152 (18.7%) | 1,165 (60.5%) |
| Fuel Oil or Kerosene | 0 (0.0%) | 0 (0.0%) |
| Coal or Coke | 0 (0.0%) | 0 (0.0%) |
| All other Fuels | 0 (0.0%) | 0 (0.0%) |
| No Fuel Used | 0 (0.0%) | 0 (0.0%) |
| Total | 812 (100.0%) | 1,926 (100.0%) |
Household Vehicle Usage in North Kansas City
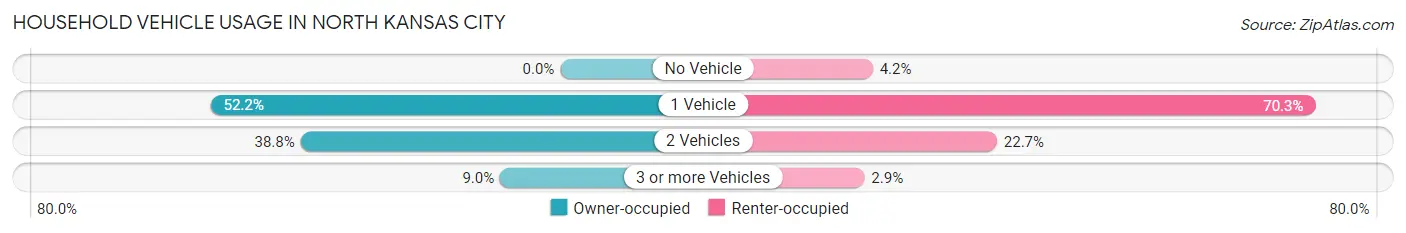
| Vehicles per Household | Owner-occupied | Renter-occupied |
| No Vehicle | 0 (0.0%) | 80 (4.2%) |
| 1 Vehicle | 424 (52.2%) | 1,353 (70.3%) |
| 2 Vehicles | 315 (38.8%) | 437 (22.7%) |
| 3 or more Vehicles | 73 (9.0%) | 56 (2.9%) |
| Total | 812 (100.0%) | 1,926 (100.0%) |
Real Estate & Mortgages in North Kansas City
Real Estate and Mortgage Overview in North Kansas City
| Characteristic | Without Mortgage | With Mortgage |
| Housing Units | 360 | 452 |
| Median Property Value | $167,500 | $222,200 |
| Median Household Income | $38,819 | $101 |
| Monthly Housing Costs | $537 | $0 |
| Real Estate Taxes | $1,755 | $0 |
Property Value by Mortgage Status in North Kansas City
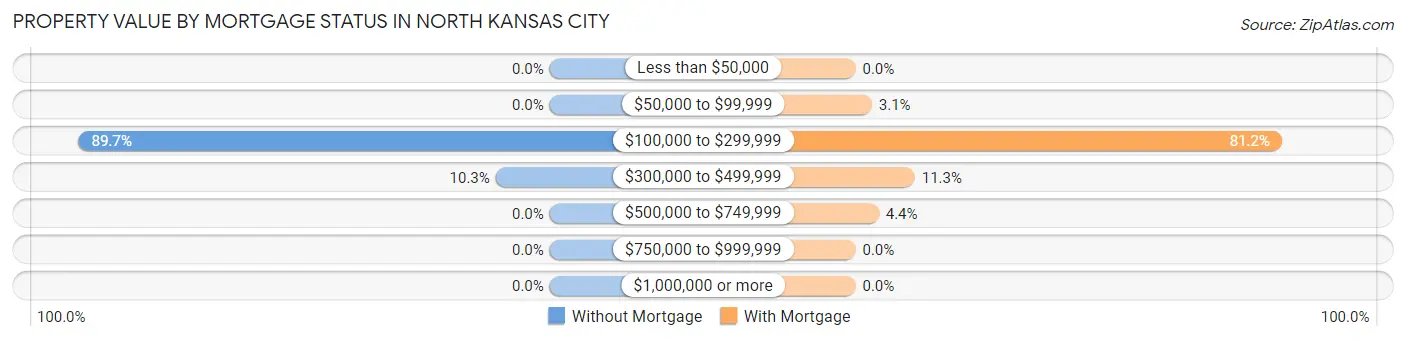
| Property Value | Without Mortgage | With Mortgage |
| Less than $50,000 | 0 (0.0%) | 0 (0.0%) |
| $50,000 to $99,999 | 0 (0.0%) | 14 (3.1%) |
| $100,000 to $299,999 | 323 (89.7%) | 367 (81.2%) |
| $300,000 to $499,999 | 37 (10.3%) | 51 (11.3%) |
| $500,000 to $749,999 | 0 (0.0%) | 20 (4.4%) |
| $750,000 to $999,999 | 0 (0.0%) | 0 (0.0%) |
| $1,000,000 or more | 0 (0.0%) | 0 (0.0%) |
| Total | 360 (100.0%) | 452 (100.0%) |
Household Income by Mortgage Status in North Kansas City
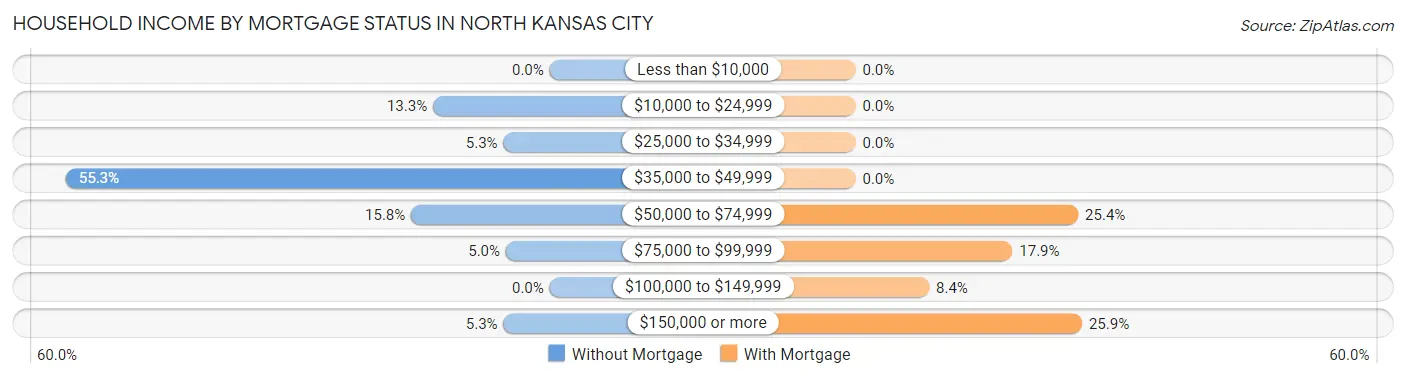
| Household Income | Without Mortgage | With Mortgage |
| Less than $10,000 | 0 (0.0%) | 0 (0.0%) |
| $10,000 to $24,999 | 48 (13.3%) | 0 (0.0%) |
| $25,000 to $34,999 | 19 (5.3%) | 0 (0.0%) |
| $35,000 to $49,999 | 199 (55.3%) | 0 (0.0%) |
| $50,000 to $74,999 | 57 (15.8%) | 115 (25.4%) |
| $75,000 to $99,999 | 18 (5.0%) | 81 (17.9%) |
| $100,000 to $149,999 | 0 (0.0%) | 38 (8.4%) |
| $150,000 or more | 19 (5.3%) | 117 (25.9%) |
| Total | 360 (100.0%) | 452 (100.0%) |
Property Value to Household Income Ratio in North Kansas City
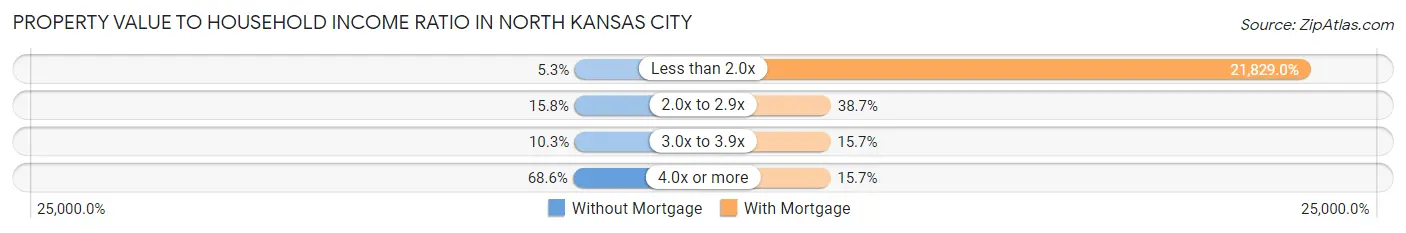
| Value-to-Income Ratio | Without Mortgage | With Mortgage |
| Less than 2.0x | 19 (5.3%) | 98,667 (21,829.0%) |
| 2.0x to 2.9x | 57 (15.8%) | 175 (38.7%) |
| 3.0x to 3.9x | 37 (10.3%) | 71 (15.7%) |
| 4.0x or more | 247 (68.6%) | 71 (15.7%) |
| Total | 360 (100.0%) | 452 (100.0%) |
Real Estate Taxes by Mortgage Status in North Kansas City
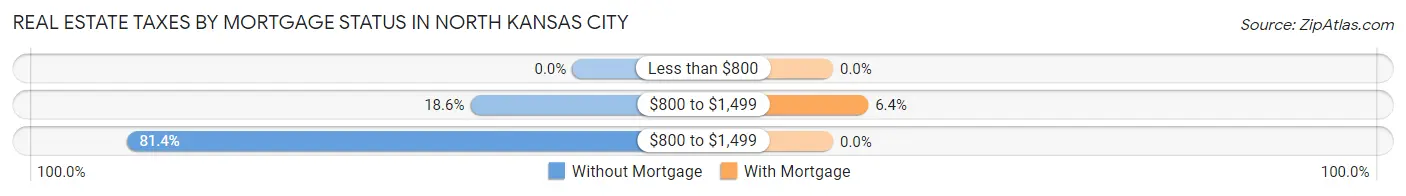
| Property Taxes | Without Mortgage | With Mortgage |
| Less than $800 | 0 (0.0%) | 0 (0.0%) |
| $800 to $1,499 | 67 (18.6%) | 29 (6.4%) |
| $800 to $1,499 | 293 (81.4%) | 0 (0.0%) |
| Total | 360 (100.0%) | 452 (100.0%) |
Health & Disability in North Kansas City
Health Insurance Coverage by Age in North Kansas City
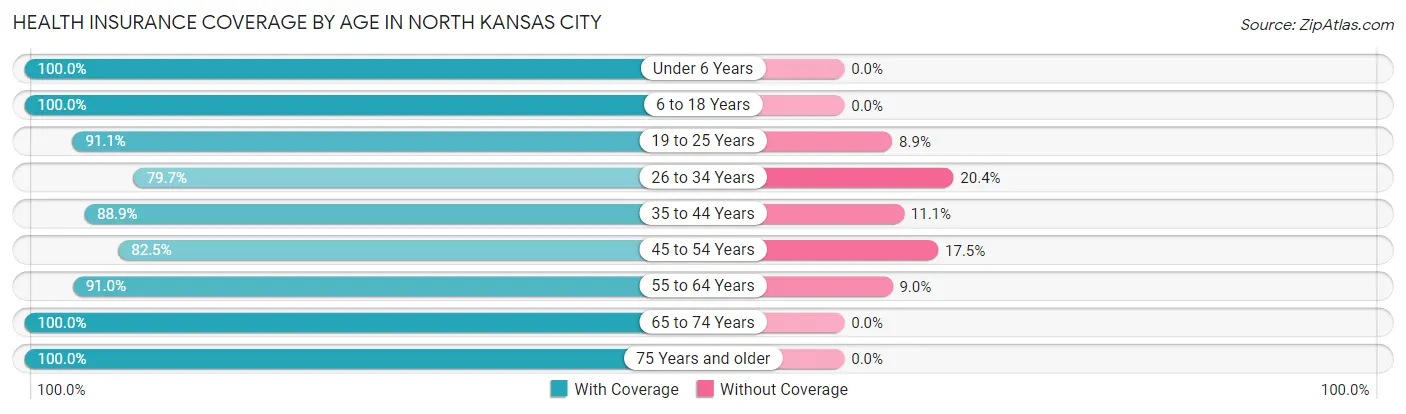
| Age Bracket | With Coverage | Without Coverage |
| Under 6 Years | 75 (100.0%) | 0 (0.0%) |
| 6 to 18 Years | 480 (100.0%) | 0 (0.0%) |
| 19 to 25 Years | 408 (91.1%) | 40 (8.9%) |
| 26 to 34 Years | 634 (79.6%) | 162 (20.3%) |
| 35 to 44 Years | 376 (88.9%) | 47 (11.1%) |
| 45 to 54 Years | 566 (82.5%) | 120 (17.5%) |
| 55 to 64 Years | 375 (91.0%) | 37 (9.0%) |
| 65 to 74 Years | 739 (100.0%) | 0 (0.0%) |
| 75 Years and older | 494 (100.0%) | 0 (0.0%) |
| Total | 4,147 (91.1%) | 406 (8.9%) |
Health Insurance Coverage by Citizenship Status in North Kansas City
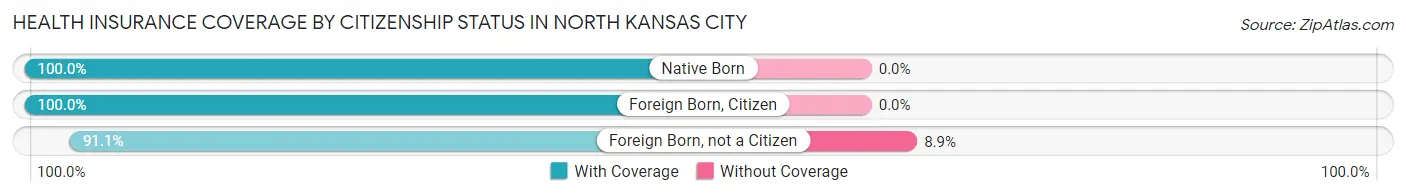
| Citizenship Status | With Coverage | Without Coverage |
| Native Born | 75 (100.0%) | 0 (0.0%) |
| Foreign Born, Citizen | 480 (100.0%) | 0 (0.0%) |
| Foreign Born, not a Citizen | 408 (91.1%) | 40 (8.9%) |
Health Insurance Coverage by Household Income in North Kansas City
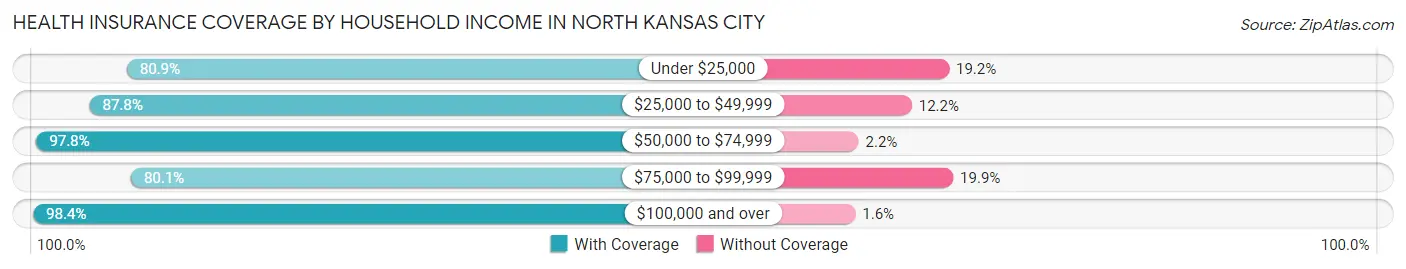
| Household Income | With Coverage | Without Coverage |
| Under $25,000 | 608 (80.8%) | 144 (19.2%) |
| $25,000 to $49,999 | 1,182 (87.8%) | 164 (12.2%) |
| $50,000 to $74,999 | 1,019 (97.8%) | 23 (2.2%) |
| $75,000 to $99,999 | 229 (80.1%) | 57 (19.9%) |
| $100,000 and over | 1,109 (98.4%) | 18 (1.6%) |
Public vs Private Health Insurance Coverage by Age in North Kansas City
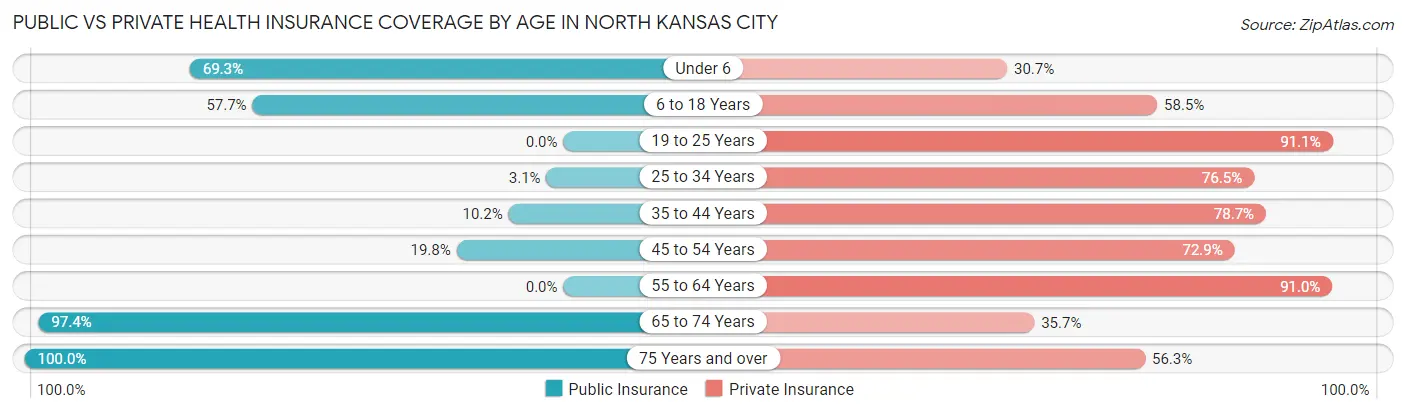
| Age Bracket | Public Insurance | Private Insurance |
| Under 6 | 52 (69.3%) | 23 (30.7%) |
| 6 to 18 Years | 277 (57.7%) | 281 (58.5%) |
| 19 to 25 Years | 0 (0.0%) | 408 (91.1%) |
| 25 to 34 Years | 25 (3.1%) | 609 (76.5%) |
| 35 to 44 Years | 43 (10.2%) | 333 (78.7%) |
| 45 to 54 Years | 136 (19.8%) | 500 (72.9%) |
| 55 to 64 Years | 0 (0.0%) | 375 (91.0%) |
| 65 to 74 Years | 720 (97.4%) | 264 (35.7%) |
| 75 Years and over | 494 (100.0%) | 278 (56.3%) |
| Total | 1,747 (38.4%) | 3,071 (67.4%) |
Disability Status by Sex by Age in North Kansas City
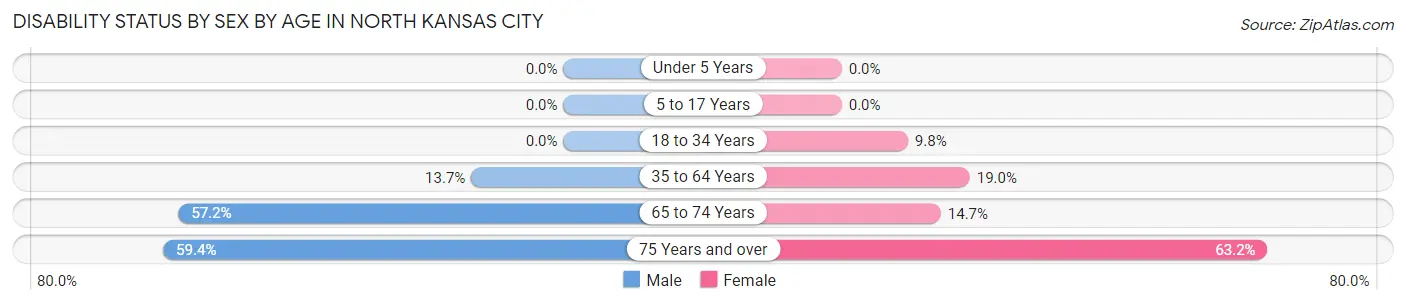
| Age Bracket | Male | Female |
| Under 5 Years | 0 (0.0%) | 0 (0.0%) |
| 5 to 17 Years | 0 (0.0%) | 0 (0.0%) |
| 18 to 34 Years | 0 (0.0%) | 50 (9.8%) |
| 35 to 64 Years | 98 (13.7%) | 153 (19.0%) |
| 65 to 74 Years | 267 (57.2%) | 40 (14.7%) |
| 75 Years and over | 82 (59.4%) | 225 (63.2%) |
Disability Class by Sex by Age in North Kansas City
Disability Class: Hearing Difficulty
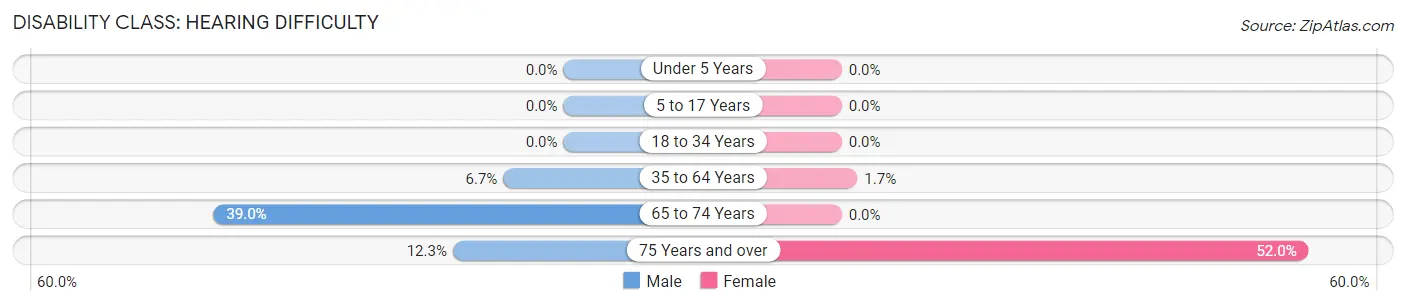
| Age Bracket | Male | Female |
| Under 5 Years | 0 (0.0%) | 0 (0.0%) |
| 5 to 17 Years | 0 (0.0%) | 0 (0.0%) |
| 18 to 34 Years | 0 (0.0%) | 0 (0.0%) |
| 35 to 64 Years | 48 (6.7%) | 14 (1.7%) |
| 65 to 74 Years | 182 (39.0%) | 0 (0.0%) |
| 75 Years and over | 17 (12.3%) | 185 (52.0%) |
Disability Class: Vision Difficulty
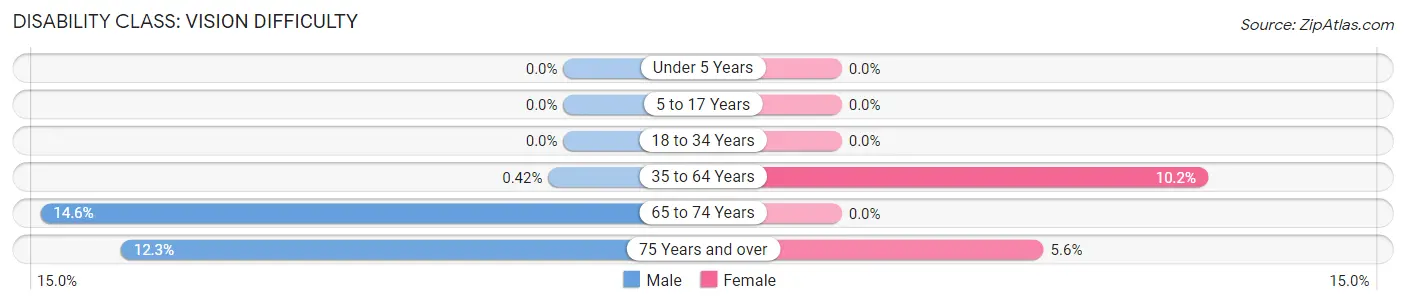
| Age Bracket | Male | Female |
| Under 5 Years | 0 (0.0%) | 0 (0.0%) |
| 5 to 17 Years | 0 (0.0%) | 0 (0.0%) |
| 18 to 34 Years | 0 (0.0%) | 0 (0.0%) |
| 35 to 64 Years | 3 (0.4%) | 82 (10.2%) |
| 65 to 74 Years | 68 (14.6%) | 0 (0.0%) |
| 75 Years and over | 17 (12.3%) | 20 (5.6%) |
Disability Class: Cognitive Difficulty
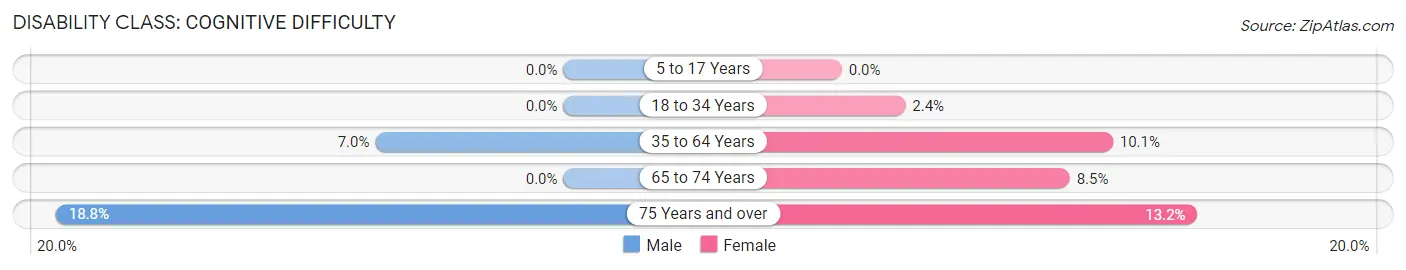
| Age Bracket | Male | Female |
| 5 to 17 Years | 0 (0.0%) | 0 (0.0%) |
| 18 to 34 Years | 0 (0.0%) | 12 (2.4%) |
| 35 to 64 Years | 50 (7.0%) | 81 (10.1%) |
| 65 to 74 Years | 0 (0.0%) | 23 (8.5%) |
| 75 Years and over | 26 (18.8%) | 47 (13.2%) |
Disability Class: Ambulatory Difficulty
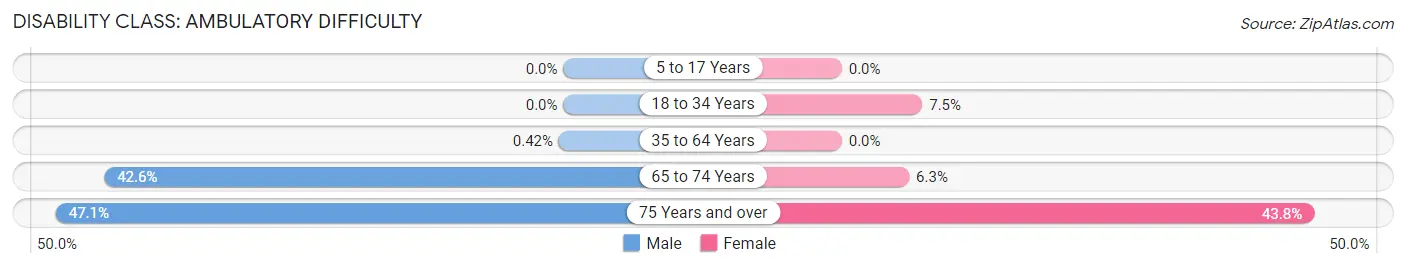
| Age Bracket | Male | Female |
| 5 to 17 Years | 0 (0.0%) | 0 (0.0%) |
| 18 to 34 Years | 0 (0.0%) | 38 (7.5%) |
| 35 to 64 Years | 3 (0.4%) | 0 (0.0%) |
| 65 to 74 Years | 199 (42.6%) | 17 (6.2%) |
| 75 Years and over | 65 (47.1%) | 156 (43.8%) |
Disability Class: Self-Care Difficulty
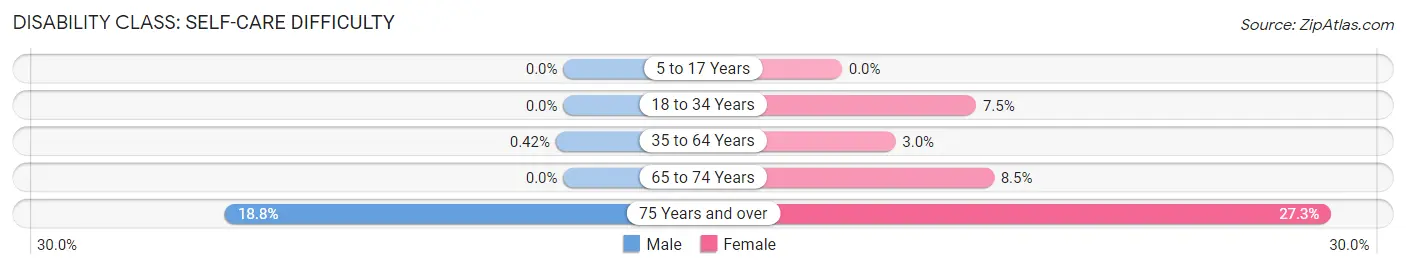
| Age Bracket | Male | Female |
| 5 to 17 Years | 0 (0.0%) | 0 (0.0%) |
| 18 to 34 Years | 0 (0.0%) | 38 (7.5%) |
| 35 to 64 Years | 3 (0.4%) | 24 (3.0%) |
| 65 to 74 Years | 0 (0.0%) | 23 (8.5%) |
| 75 Years and over | 26 (18.8%) | 97 (27.3%) |
Technology Access in North Kansas City
Computing Device Access in North Kansas City
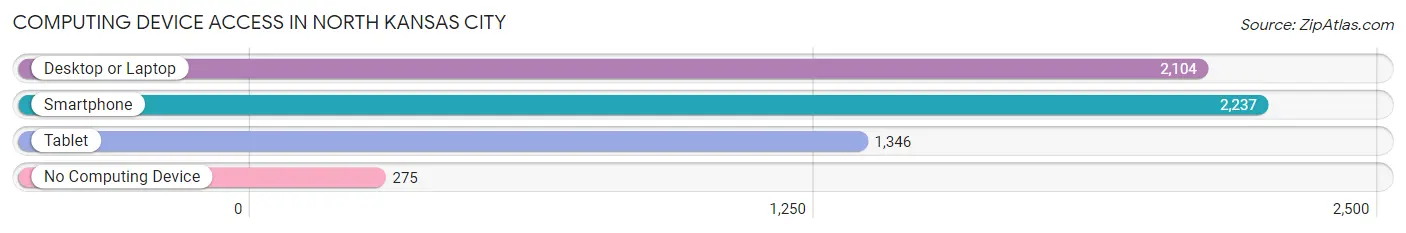
| Device Type | # Households | % Households |
| Desktop or Laptop | 2,104 | 76.8% |
| Smartphone | 2,237 | 81.7% |
| Tablet | 1,346 | 49.2% |
| No Computing Device | 275 | 10.0% |
| Total | 2,738 | 100.0% |
Internet Access in North Kansas City
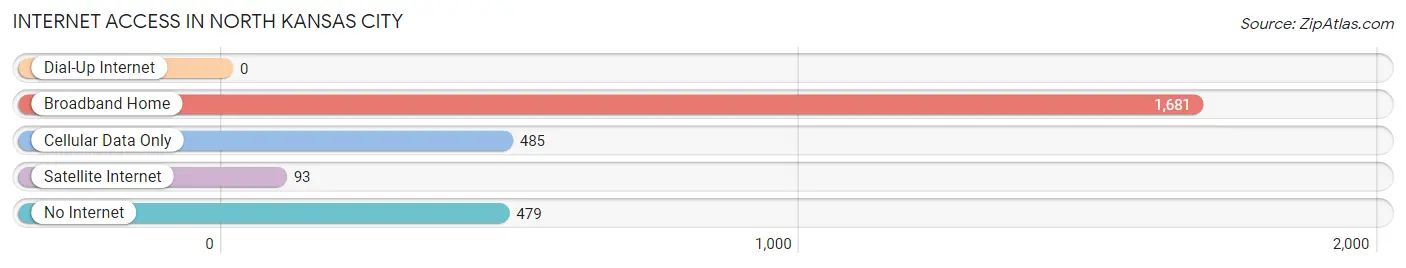
| Internet Type | # Households | % Households |
| Dial-Up Internet | 0 | 0.0% |
| Broadband Home | 1,681 | 61.4% |
| Cellular Data Only | 485 | 17.7% |
| Satellite Internet | 93 | 3.4% |
| No Internet | 479 | 17.5% |
| Total | 2,738 | 100.0% |
North Kansas City Summary
Kansas City, Missouri is a city located in the western part of the state of Missouri, in the United States. It is the largest city in the state and the 37th largest city in the country. It is the anchor city of the Kansas City metropolitan area, which straddles the Kansas-Missouri border. The city is situated at the confluence of the Missouri and Kansas rivers, and is known for its jazz and blues music, its barbecue, and its fountains.
History
Kansas City was founded in 1838 as the Town of Kansas, and was incorporated as a city in 1850. The city was named after the Kansas River, which flows through it. The city grew rapidly in the late 19th century, becoming a major transportation hub and a center of industry. It was the site of the Battle of Westport in 1864, which was a major victory for the Union forces in the Civil War.
In the early 20th century, Kansas City became a major center of jazz and blues music, and was home to many influential musicians, including Charlie Parker, Count Basie, and Big Joe Turner. The city was also the birthplace of the Kansas City-style barbecue, which is now popular throughout the United States.
Geography
Kansas City is located in the western part of Missouri, at the confluence of the Missouri and Kansas rivers. It is situated in Jackson County, and is bordered by the cities of Independence, Raytown, and Lee's Summit. The city covers an area of 319 square miles, and has an elevation of 860 feet.
The climate of Kansas City is humid continental, with hot, humid summers and cold, dry winters. The average annual temperature is 54°F, and the average annual precipitation is 39.5 inches.
Economy
Kansas City is a major economic center in the Midwest. The city is home to several Fortune 500 companies, including Sprint, H&R Block, and Hallmark Cards. It is also a major center for the transportation and logistics industries, and is home to several major railroads and trucking companies.
The city is also a major center for the healthcare industry, with several major hospitals and medical centers. It is also home to several universities and colleges, including the University of Missouri-Kansas City, Rockhurst University, and the Kansas City Art Institute.
Demographics
As of the 2010 census, Kansas City had a population of 459,787. The racial makeup of the city was 57.2% White, 30.2% African American, 0.4% Native American, 2.7% Asian, 0.1% Pacific Islander, 6.3% from other races, and 3.1% from two or more races. Hispanic or Latino of any race were 11.2% of the population.
The median household income in Kansas City was $41,939, and the median family income was $50,821. The per capita income was $25,945. About 17.2% of the population was below the poverty line.
Common Questions
What is Per Capita Income in North Kansas City?
Per Capita income in North Kansas City is $37,725.
What is the Median Family Income in North Kansas City?
Median Family Income in North Kansas City is $64,583.
What is the Median Household income in North Kansas City?
Median Household Income in North Kansas City is $42,743.
What is Income or Wage Gap in North Kansas City?
Income or Wage Gap in North Kansas City is 0.4%.
Women in North Kansas City earn 99.6 cents for every dollar earned by a man.
What is Inequality or Gini Index in North Kansas City?
Inequality or Gini Index in North Kansas City is 0.40.
What is the Total Population of North Kansas City?
Total Population of North Kansas City is 4,553.
What is the Total Male Population of North Kansas City?
Total Male Population of North Kansas City is 2,381.
What is the Total Female Population of North Kansas City?
Total Female Population of North Kansas City is 2,172.
What is the Ratio of Males per 100 Females in North Kansas City?
There are 109.62 Males per 100 Females in North Kansas City.
What is the Ratio of Females per 100 Males in North Kansas City?
There are 91.22 Females per 100 Males in North Kansas City.
What is the Median Population Age in North Kansas City?
Median Population Age in North Kansas City is 46.3 Years.
What is the Average Family Size in North Kansas City
Average Family Size in North Kansas City is 2.4 People.
What is the Average Household Size in North Kansas City
Average Household Size in North Kansas City is 1.7 People.
How Large is the Labor Force in North Kansas City?
There are 3,026 People in the Labor Forcein in North Kansas City.
What is the Percentage of People in the Labor Force in North Kansas City?
74.2% of People are in the Labor Force in North Kansas City.
What is the Unemployment Rate in North Kansas City?
Unemployment Rate in North Kansas City is 6.3%.