Cumming, GA Map & Demographics
Cumming Map
Cumming Overview
$36,478
PER CAPITA INCOME
$99,252
AVG FAMILY INCOME
$71,855
AVG HOUSEHOLD INCOME
0.4%
WAGE / INCOME GAP [ % ]
99.6¢/ $1
WAGE / INCOME GAP [ $ ]
0.48
INEQUALITY / GINI INDEX
7,371
TOTAL POPULATION
3,541
MALE POPULATION
3,830
FEMALE POPULATION
92.45
MALES / 100 FEMALES
108.16
FEMALES / 100 MALES
40.9
MEDIAN AGE
3.1
AVG FAMILY SIZE
2.5
AVG HOUSEHOLD SIZE
3,674
LABOR FORCE [ PEOPLE ]
58.4%
PERCENT IN LABOR FORCE
4.8%
UNEMPLOYMENT RATE
Income in Cumming
Income Overview in Cumming
Per Capita Income in Cumming is $36,478, while median incomes of families and households are $99,252 and $71,855 respectively.
| Characteristic | Number | Measure |
| Per Capita Income | 7,371 | $36,478 |
| Median Family Income | 1,691 | $99,252 |
| Mean Family Income | 1,691 | $116,431 |
| Median Household Income | 2,708 | $71,855 |
| Mean Household Income | 2,708 | $93,178 |
| Income Deficit | 1,691 | $0 |
| Wage / Income Gap (%) | 7,371 | 0.37% |
| Wage / Income Gap ($) | 7,371 | 99.63¢ per $1 |
| Gini / Inequality Index | 7,371 | 0.48 |
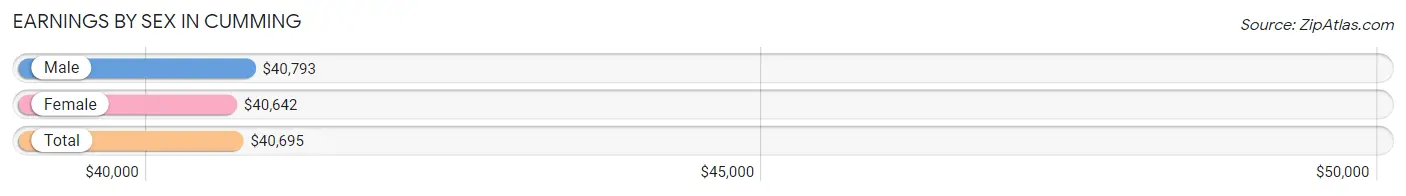
Earnings by Sex in Cumming
Average Earnings in Cumming are $40,695, $40,793 for men and $40,642 for women, a difference of 0.4%.
| Sex | Number | Average Earnings |
| Male | 2,042 (51.8%) | $40,793 |
| Female | 1,903 (48.2%) | $40,642 |
| Total | 3,945 (100.0%) | $40,695 |
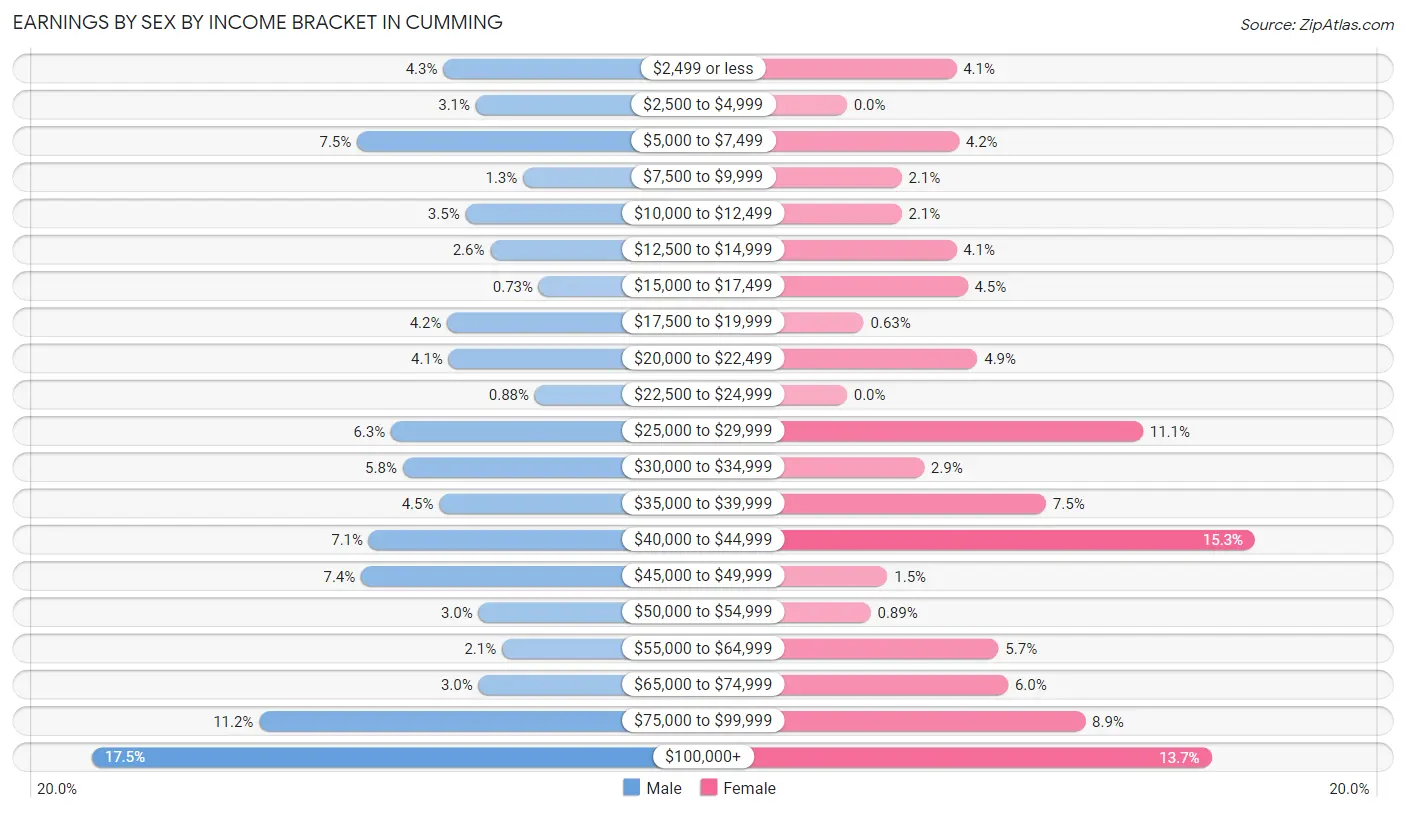
Earnings by Sex by Income Bracket in Cumming
The most common earnings brackets in Cumming are $100,000+ for men (357 | 17.5%) and $40,000 to $44,999 for women (291 | 15.3%).
| Income | Male | Female |
| $2,499 or less | 88 (4.3%) | 78 (4.1%) |
| $2,500 to $4,999 | 63 (3.1%) | 0 (0.0%) |
| $5,000 to $7,499 | 154 (7.5%) | 80 (4.2%) |
| $7,500 to $9,999 | 27 (1.3%) | 39 (2.1%) |
| $10,000 to $12,499 | 71 (3.5%) | 39 (2.1%) |
| $12,500 to $14,999 | 52 (2.5%) | 78 (4.1%) |
| $15,000 to $17,499 | 15 (0.7%) | 86 (4.5%) |
| $17,500 to $19,999 | 85 (4.2%) | 12 (0.6%) |
| $20,000 to $22,499 | 84 (4.1%) | 93 (4.9%) |
| $22,500 to $24,999 | 18 (0.9%) | 0 (0.0%) |
| $25,000 to $29,999 | 128 (6.3%) | 211 (11.1%) |
| $30,000 to $34,999 | 119 (5.8%) | 55 (2.9%) |
| $35,000 to $39,999 | 91 (4.5%) | 142 (7.5%) |
| $40,000 to $44,999 | 145 (7.1%) | 291 (15.3%) |
| $45,000 to $49,999 | 151 (7.4%) | 29 (1.5%) |
| $50,000 to $54,999 | 61 (3.0%) | 17 (0.9%) |
| $55,000 to $64,999 | 43 (2.1%) | 108 (5.7%) |
| $65,000 to $74,999 | 61 (3.0%) | 115 (6.0%) |
| $75,000 to $99,999 | 229 (11.2%) | 170 (8.9%) |
| $100,000+ | 357 (17.5%) | 260 (13.7%) |
| Total | 2,042 (100.0%) | 1,903 (100.0%) |
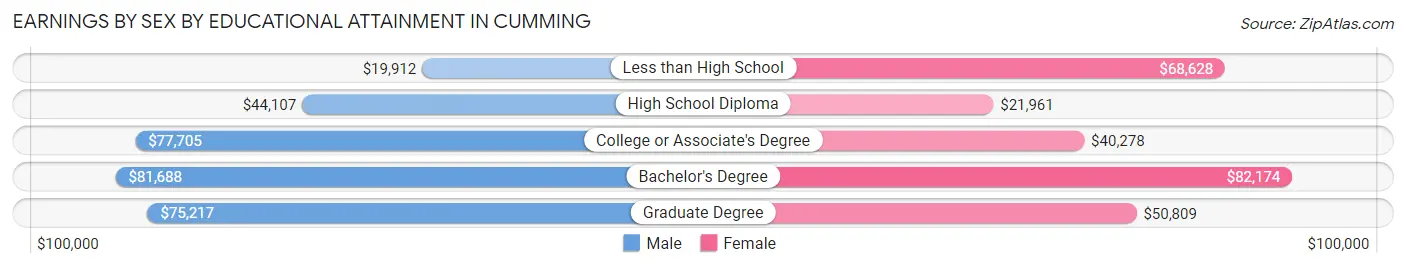
Earnings by Sex by Educational Attainment in Cumming
Average earnings in Cumming are $46,074 for men and $50,000 for women, a difference of 7.9%. Men with an educational attainment of bachelor's degree enjoy the highest average annual earnings of $81,688, while those with less than high school education earn the least with $19,912. Women with an educational attainment of bachelor's degree earn the most with the average annual earnings of $82,174, while those with high school diploma education have the smallest earnings of $21,961.
| Educational Attainment | Male Income | Female Income |
| Less than High School | $19,912 | $68,628 |
| High School Diploma | $44,107 | $21,961 |
| College or Associate's Degree | $77,705 | $40,278 |
| Bachelor's Degree | $81,688 | $82,174 |
| Graduate Degree | $75,217 | $50,809 |
| Total | $46,074 | $50,000 |
Family Income in Cumming
Family Income Brackets in Cumming
According to the Cumming family income data, there are 419 families falling into the $100,000 to $149,999 income range, which is the most common income bracket and makes up 24.8% of all families. Conversely, the $10,000 to $14,999 income bracket is the least frequent group with only 8 families (0.5%) belonging to this category.
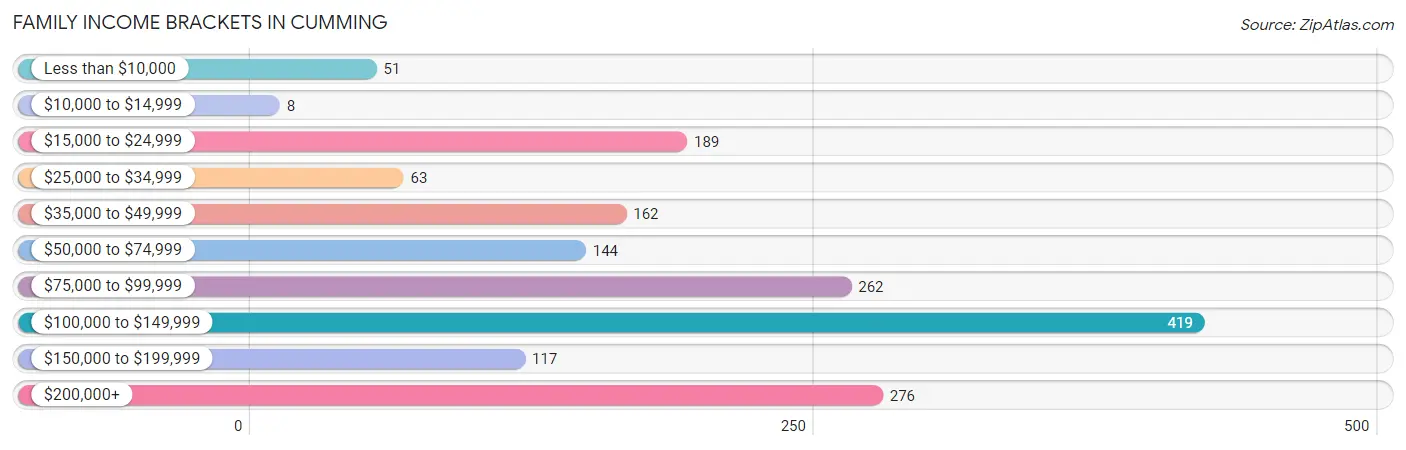
| Income Bracket | # Families | % Families |
| Less than $10,000 | 51 | 3.0% |
| $10,000 to $14,999 | 8 | 0.5% |
| $15,000 to $24,999 | 189 | 11.2% |
| $25,000 to $34,999 | 63 | 3.7% |
| $35,000 to $49,999 | 162 | 9.6% |
| $50,000 to $74,999 | 144 | 8.5% |
| $75,000 to $99,999 | 262 | 15.5% |
| $100,000 to $149,999 | 419 | 24.8% |
| $150,000 to $199,999 | 117 | 6.9% |
| $200,000+ | 276 | 16.3% |
Family Income by Famaliy Size in Cumming
3-person families (480 | 28.4%) account for the highest median family income in Cumming with $130,343 per family, while 3-person families (480 | 28.4%) have the highest median income of $43,448 per family member.
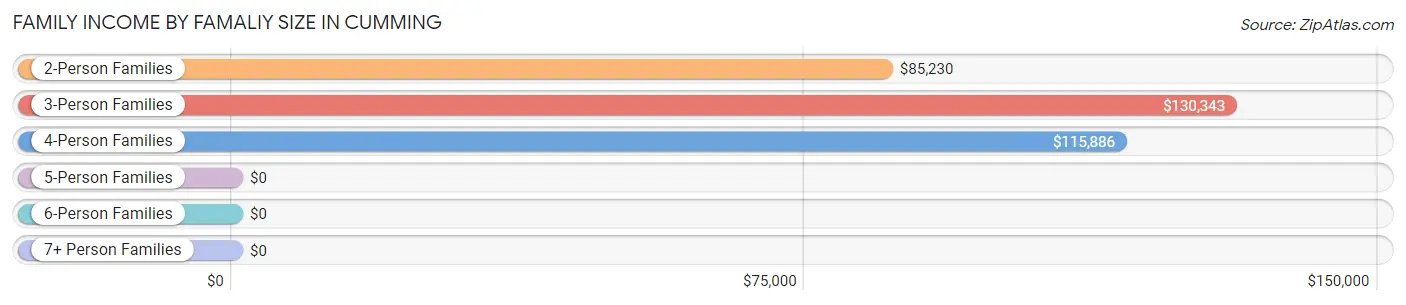
| Income Bracket | # Families | Median Income |
| 2-Person Families | 895 (52.9%) | $85,230 |
| 3-Person Families | 480 (28.4%) | $130,343 |
| 4-Person Families | 221 (13.1%) | $115,886 |
| 5-Person Families | 25 (1.5%) | $0 |
| 6-Person Families | 35 (2.1%) | $0 |
| 7+ Person Families | 35 (2.1%) | $0 |
| Total | 1,691 (100.0%) | $99,252 |
Family Income by Number of Earners in Cumming
The median family income in Cumming is $99,252, with families comprising 2 earners (744) having the highest median family income of $133,900, while families with 1 earner (432) have the lowest median family income of $43,828, accounting for 44.0% and 25.6% of families, respectively.
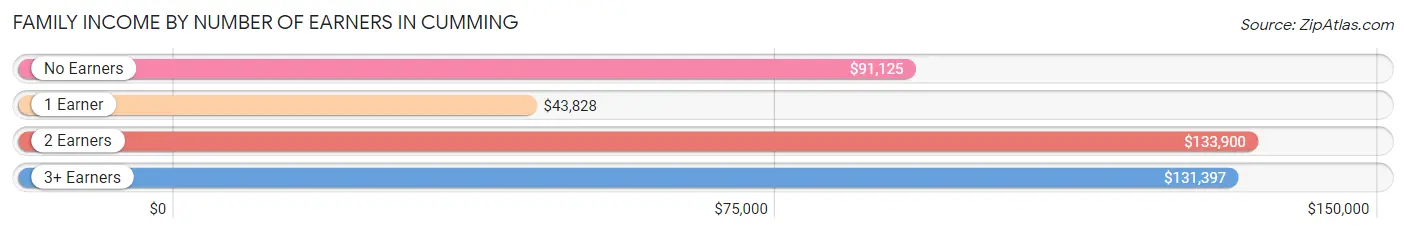
| Number of Earners | # Families | Median Income |
| No Earners | 253 (15.0%) | $91,125 |
| 1 Earner | 432 (25.6%) | $43,828 |
| 2 Earners | 744 (44.0%) | $133,900 |
| 3+ Earners | 262 (15.5%) | $131,397 |
| Total | 1,691 (100.0%) | $99,252 |
Household Income in Cumming
Household Income Brackets in Cumming
With 479 households falling in the category, the $100,000 to $149,999 income range is the most frequent in Cumming, accounting for 17.7% of all households. In contrast, only 111 households (4.1%) fall into the less than $10,000 income bracket, making it the least populous group.
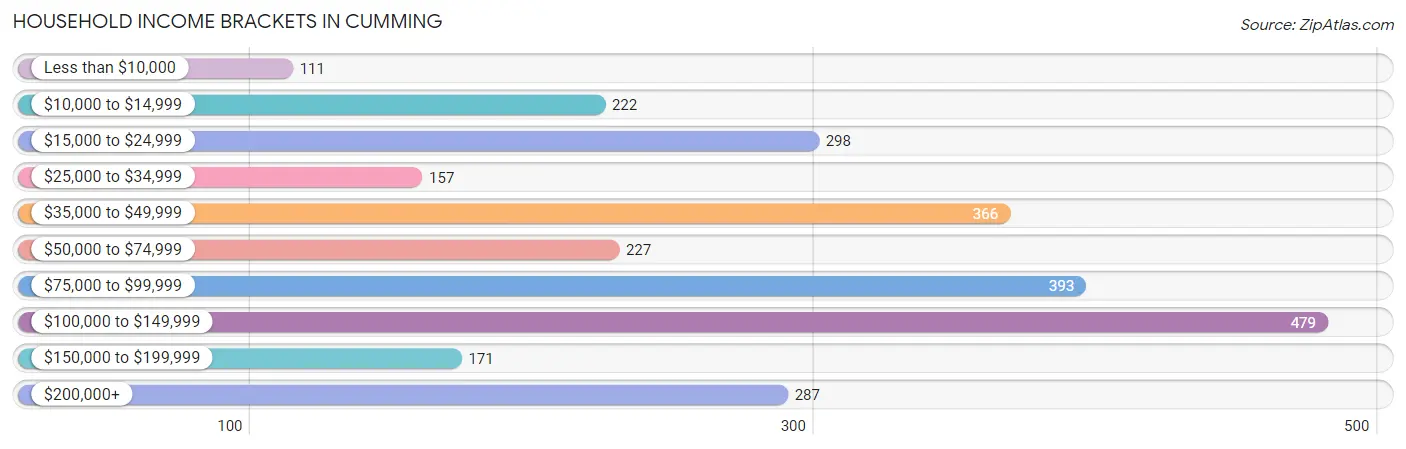
| Income Bracket | # Households | % Households |
| Less than $10,000 | 111 | 4.1% |
| $10,000 to $14,999 | 222 | 8.2% |
| $15,000 to $24,999 | 298 | 11.0% |
| $25,000 to $34,999 | 157 | 5.8% |
| $35,000 to $49,999 | 366 | 13.5% |
| $50,000 to $74,999 | 227 | 8.4% |
| $75,000 to $99,999 | 393 | 14.5% |
| $100,000 to $149,999 | 479 | 17.7% |
| $150,000 to $199,999 | 171 | 6.3% |
| $200,000+ | 287 | 10.6% |
Household Income by Householder Age in Cumming
The median household income in Cumming is $71,855, with the highest median household income of $97,742 found in the 45 to 64 years age bracket for the primary householder. A total of 1,016 households (37.5%) fall into this category. Meanwhile, the 15 to 24 years age bracket for the primary householder has the lowest median household income of $0, with 170 households (6.3%) in this group.
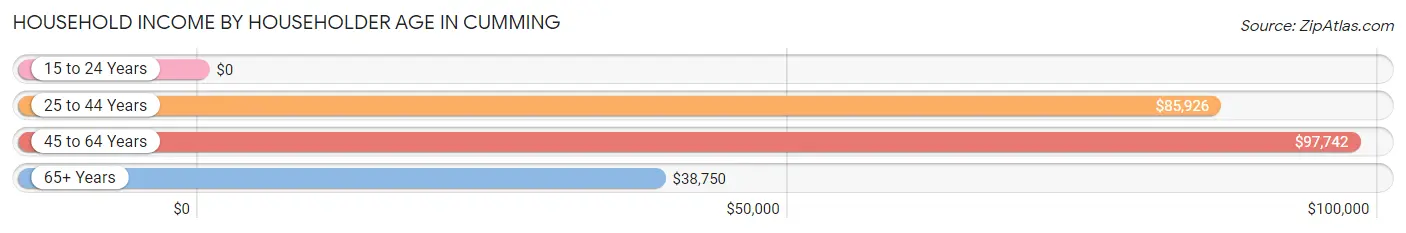
| Income Bracket | # Households | Median Income |
| 15 to 24 Years | 170 (6.3%) | $0 |
| 25 to 44 Years | 644 (23.8%) | $85,926 |
| 45 to 64 Years | 1,016 (37.5%) | $97,742 |
| 65+ Years | 878 (32.4%) | $38,750 |
| Total | 2,708 (100.0%) | $71,855 |
Poverty in Cumming
Income Below Poverty by Sex and Age in Cumming
With 18.1% poverty level for males and 18.6% for females among the residents of Cumming, 15 year old males and 12 to 14 year old females are the most vulnerable to poverty, with 24 males (100.0%) and 50 females (35.5%) in their respective age groups living below the poverty level.
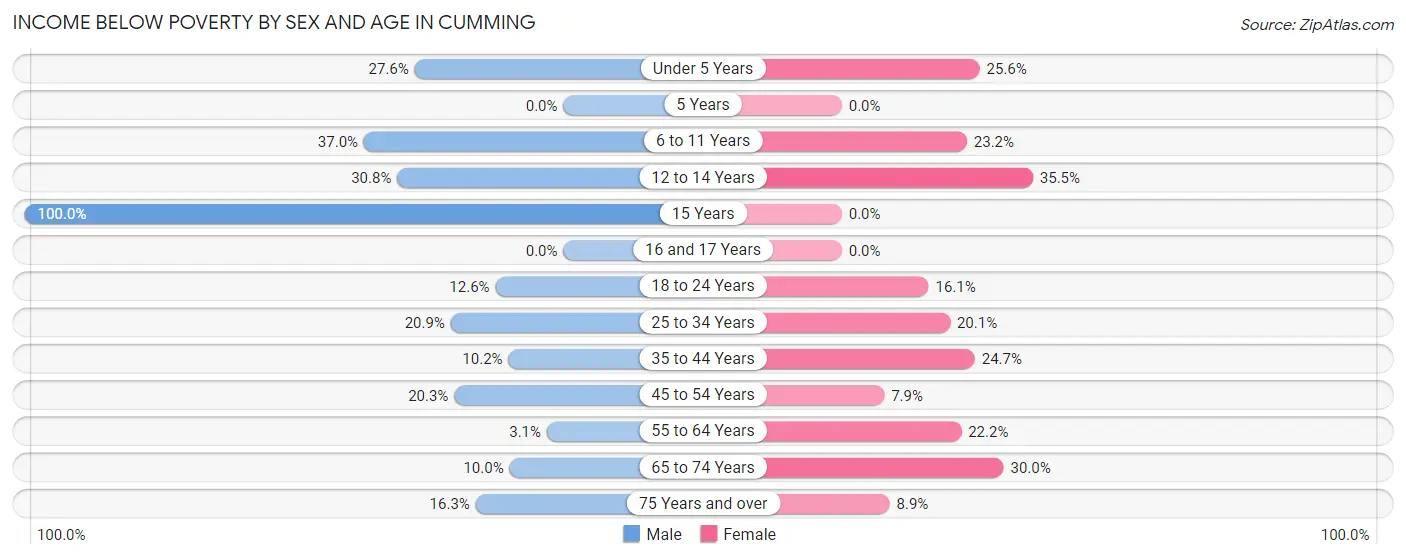
| Age Bracket | Male | Female |
| Under 5 Years | 82 (27.6%) | 22 (25.6%) |
| 5 Years | 0 (0.0%) | 0 (0.0%) |
| 6 to 11 Years | 87 (37.0%) | 13 (23.2%) |
| 12 to 14 Years | 41 (30.8%) | 50 (35.5%) |
| 15 Years | 24 (100.0%) | 0 (0.0%) |
| 16 and 17 Years | 0 (0.0%) | 0 (0.0%) |
| 18 to 24 Years | 58 (12.6%) | 111 (16.1%) |
| 25 to 34 Years | 97 (20.9%) | 48 (20.1%) |
| 35 to 44 Years | 46 (10.2%) | 101 (24.7%) |
| 45 to 54 Years | 78 (20.3%) | 38 (7.9%) |
| 55 to 64 Years | 11 (3.1%) | 102 (22.2%) |
| 65 to 74 Years | 8 (10.0%) | 145 (30.0%) |
| 75 Years and over | 42 (16.3%) | 47 (8.9%) |
| Total | 574 (18.1%) | 677 (18.6%) |
Income Above Poverty by Sex and Age in Cumming
According to the poverty statistics in Cumming, males aged 16 and 17 years and females aged 5 years are the age groups that are most secure financially, with 100.0% of males and 100.0% of females in these age groups living above the poverty line.
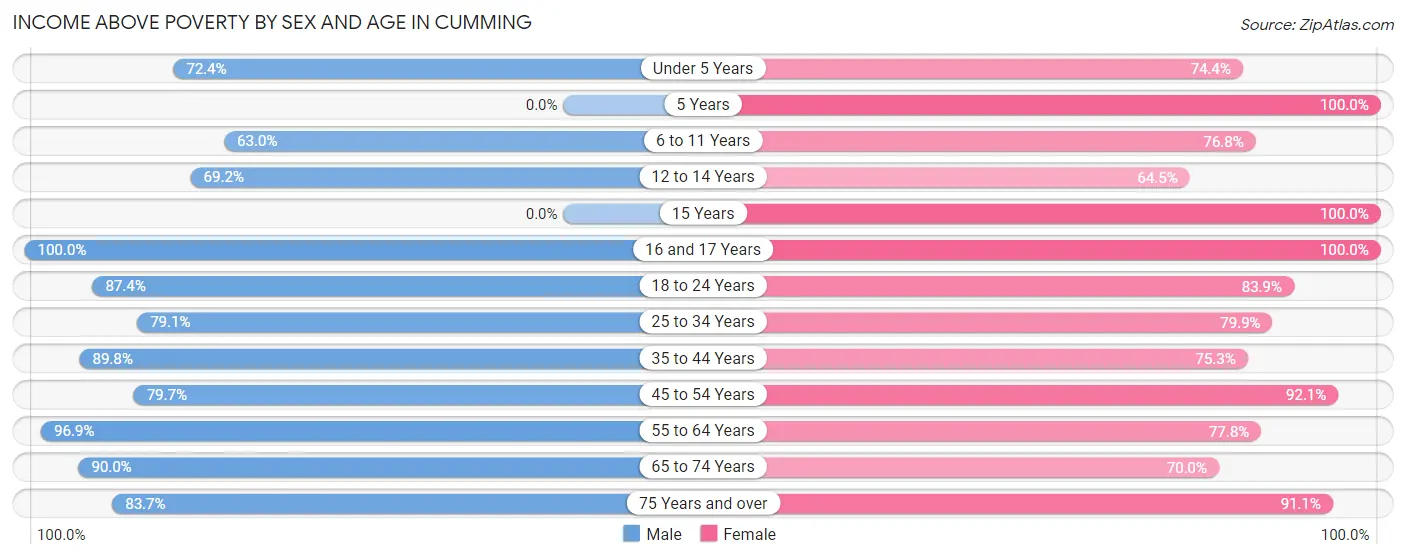
| Age Bracket | Male | Female |
| Under 5 Years | 215 (72.4%) | 64 (74.4%) |
| 5 Years | 0 (0.0%) | 17 (100.0%) |
| 6 to 11 Years | 148 (63.0%) | 43 (76.8%) |
| 12 to 14 Years | 92 (69.2%) | 91 (64.5%) |
| 15 Years | 0 (0.0%) | 41 (100.0%) |
| 16 and 17 Years | 33 (100.0%) | 10 (100.0%) |
| 18 to 24 Years | 402 (87.4%) | 578 (83.9%) |
| 25 to 34 Years | 367 (79.1%) | 191 (79.9%) |
| 35 to 44 Years | 405 (89.8%) | 308 (75.3%) |
| 45 to 54 Years | 307 (79.7%) | 444 (92.1%) |
| 55 to 64 Years | 348 (96.9%) | 358 (77.8%) |
| 65 to 74 Years | 72 (90.0%) | 338 (70.0%) |
| 75 Years and over | 216 (83.7%) | 483 (91.1%) |
| Total | 2,605 (81.9%) | 2,966 (81.4%) |
Income Below Poverty Among Married-Couple Families in Cumming
The poverty statistics for married-couple families in Cumming show that 2.4% or 27 of the total 1,127 families live below the poverty line. Families with 1 or 2 children have the highest poverty rate of 6.6%, comprising of 19 families. On the other hand, families with 3 or 4 children have the lowest poverty rate of 0.0%, which includes 0 families.
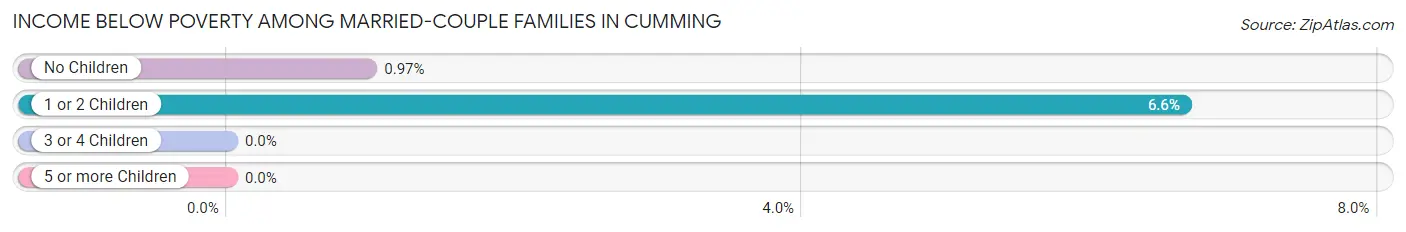
| Children | Above Poverty | Below Poverty |
| No Children | 817 (99.0%) | 8 (1.0%) |
| 1 or 2 Children | 267 (93.4%) | 19 (6.6%) |
| 3 or 4 Children | 16 (100.0%) | 0 (0.0%) |
| 5 or more Children | 0 (0.0%) | 0 (0.0%) |
| Total | 1,100 (97.6%) | 27 (2.4%) |
Income Below Poverty Among Single-Parent Households in Cumming
According to the poverty data in Cumming, 11.9% or 10 single-father households and 35.0% or 168 single-mother households are living below the poverty line. Among single-father households, those with no children have the highest poverty rate, with 10 households (45.5%) experiencing poverty. Likewise, among single-mother households, those with 3 or 4 children have the highest poverty rate, with 39 households (100.0%) falling below the poverty line.
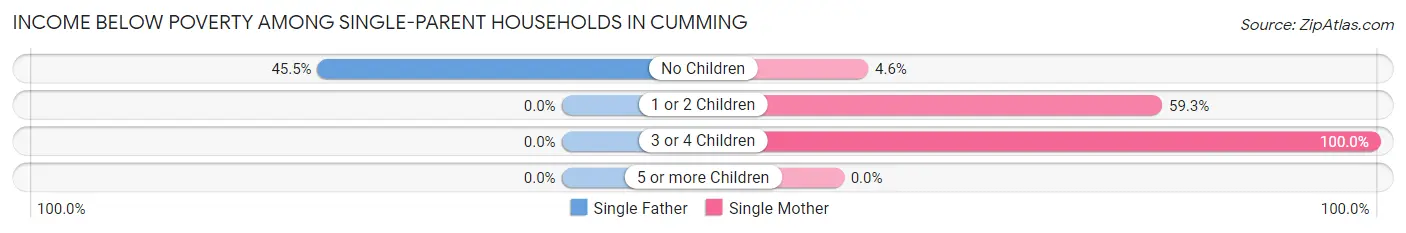
| Children | Single Father | Single Mother |
| No Children | 10 (45.5%) | 11 (4.5%) |
| 1 or 2 Children | 0 (0.0%) | 118 (59.3%) |
| 3 or 4 Children | 0 (0.0%) | 39 (100.0%) |
| 5 or more Children | 0 (0.0%) | 0 (0.0%) |
| Total | 10 (11.9%) | 168 (35.0%) |
Income Below Poverty Among Married-Couple vs Single-Parent Households in Cumming
The poverty data for Cumming shows that 27 of the married-couple family households (2.4%) and 178 of the single-parent households (31.6%) are living below the poverty level. Within the married-couple family households, those with 1 or 2 children have the highest poverty rate, with 19 households (6.6%) falling below the poverty line. Among the single-parent households, those with 3 or 4 children have the highest poverty rate, with 39 household (100.0%) living below poverty.
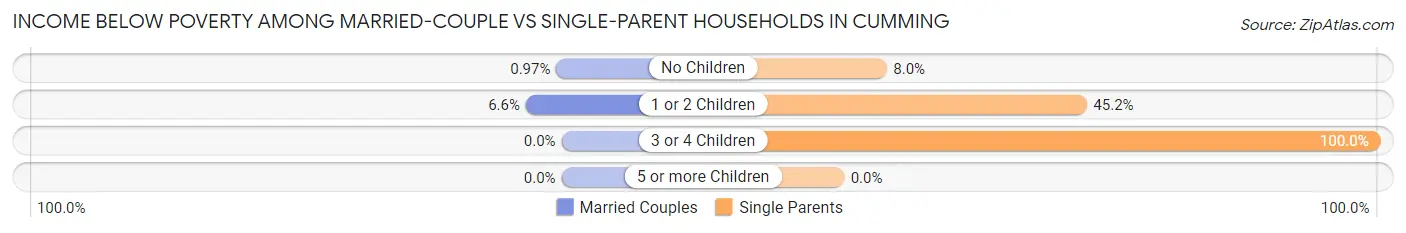
| Children | Married-Couple Families | Single-Parent Households |
| No Children | 8 (1.0%) | 21 (8.0%) |
| 1 or 2 Children | 19 (6.6%) | 118 (45.2%) |
| 3 or 4 Children | 0 (0.0%) | 39 (100.0%) |
| 5 or more Children | 0 (0.0%) | 0 (0.0%) |
| Total | 27 (2.4%) | 178 (31.6%) |
Race in Cumming
The most populous races in Cumming are White / Caucasian (5,494 | 74.5%), Hispanic or Latino (981 | 13.3%), and Black / African American (598 | 8.1%).
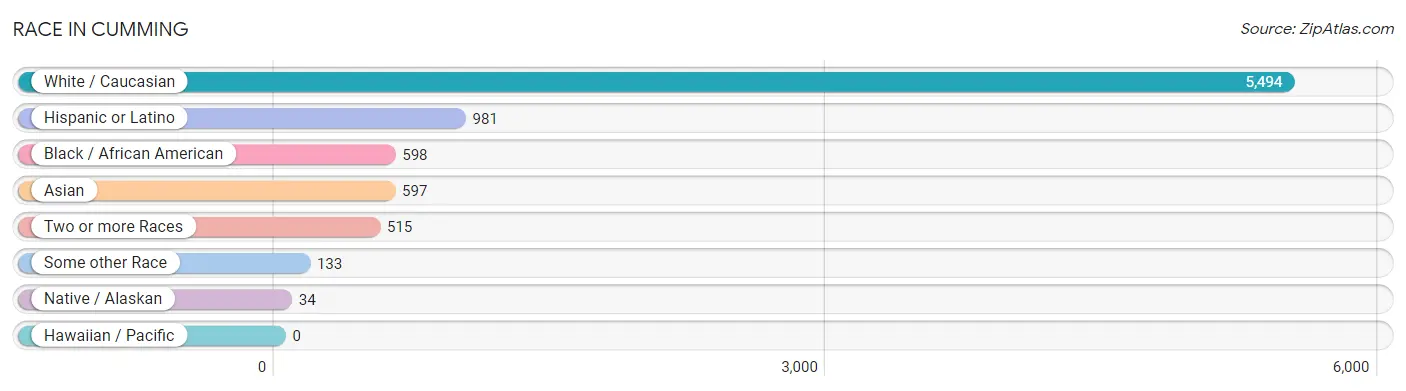
| Race | # Population | % Population |
| Asian | 597 | 8.1% |
| Black / African American | 598 | 8.1% |
| Hawaiian / Pacific | 0 | 0.0% |
| Hispanic or Latino | 981 | 13.3% |
| Native / Alaskan | 34 | 0.5% |
| White / Caucasian | 5,494 | 74.5% |
| Two or more Races | 515 | 7.0% |
| Some other Race | 133 | 1.8% |
| Total | 7,371 | 100.0% |
Ancestry in Cumming
The most populous ancestries reported in Cumming are German (979 | 13.3%), American (750 | 10.2%), English (725 | 9.8%), Mexican (686 | 9.3%), and Irish (636 | 8.6%), together accounting for 51.2% of all Cumming residents.
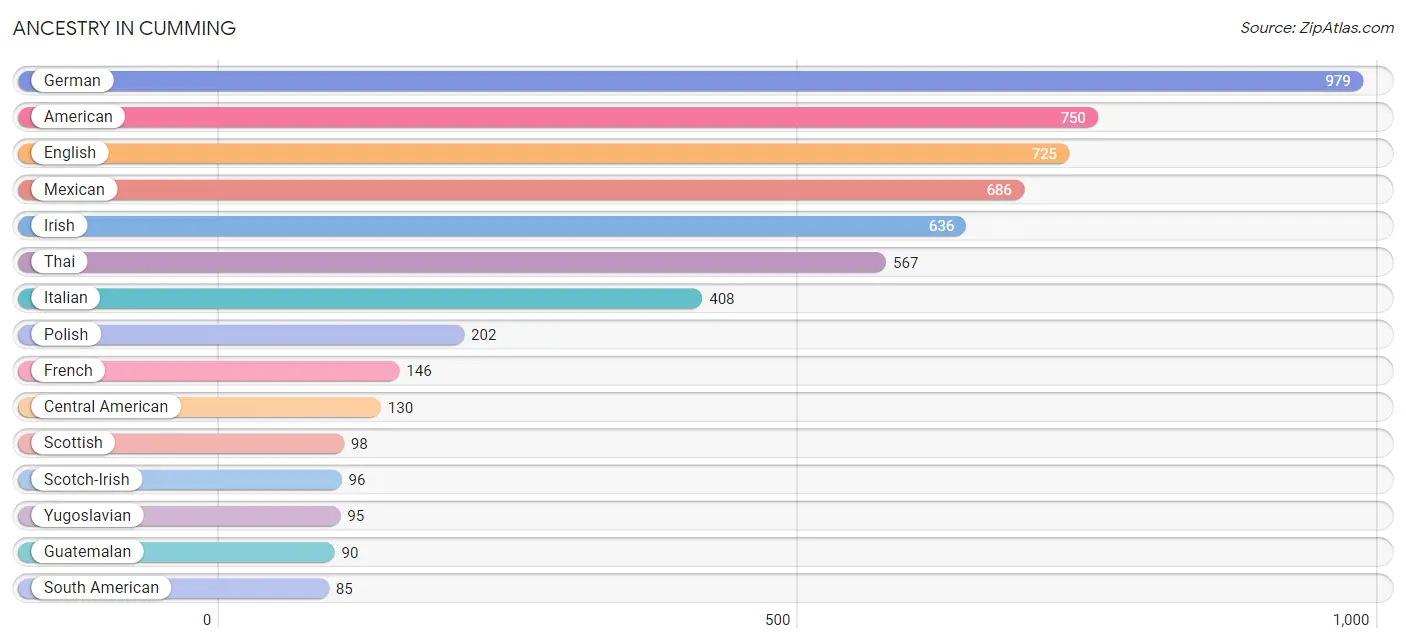
| Ancestry | # Population | % Population |
| African | 41 | 0.6% |
| American | 750 | 10.2% |
| Arab | 55 | 0.7% |
| Argentinean | 17 | 0.2% |
| Austrian | 17 | 0.2% |
| Bhutanese | 11 | 0.2% |
| British | 46 | 0.6% |
| Burmese | 18 | 0.2% |
| Central American | 130 | 1.8% |
| Central American Indian | 79 | 1.1% |
| Cherokee | 11 | 0.2% |
| Choctaw | 7 | 0.1% |
| Colombian | 68 | 0.9% |
| Czech | 55 | 0.7% |
| Czechoslovakian | 16 | 0.2% |
| Danish | 30 | 0.4% |
| Dominican | 17 | 0.2% |
| Dutch | 29 | 0.4% |
| Egyptian | 8 | 0.1% |
| English | 725 | 9.8% |
| European | 73 | 1.0% |
| Finnish | 11 | 0.2% |
| French | 146 | 2.0% |
| French Canadian | 52 | 0.7% |
| German | 979 | 13.3% |
| Guatemalan | 90 | 1.2% |
| Haitian | 18 | 0.2% |
| Hungarian | 67 | 0.9% |
| Irish | 636 | 8.6% |
| Iroquois | 1 | 0.0% |
| Italian | 408 | 5.5% |
| Jamaican | 37 | 0.5% |
| Maltese | 4 | 0.1% |
| Mexican | 686 | 9.3% |
| Northern European | 29 | 0.4% |
| Norwegian | 12 | 0.2% |
| Polish | 202 | 2.7% |
| Portuguese | 42 | 0.6% |
| Puerto Rican | 38 | 0.5% |
| Russian | 16 | 0.2% |
| Salvadoran | 40 | 0.5% |
| Scandinavian | 34 | 0.5% |
| Scotch-Irish | 96 | 1.3% |
| Scottish | 98 | 1.3% |
| South American | 85 | 1.1% |
| Spaniard | 11 | 0.2% |
| Sri Lankan | 31 | 0.4% |
| Subsaharan African | 41 | 0.6% |
| Swedish | 23 | 0.3% |
| Swiss | 12 | 0.2% |
| Syrian | 36 | 0.5% |
| Thai | 567 | 7.7% |
| Ukrainian | 16 | 0.2% |
| Welsh | 62 | 0.8% |
| Yugoslavian | 95 | 1.3% | View All 55 Rows |
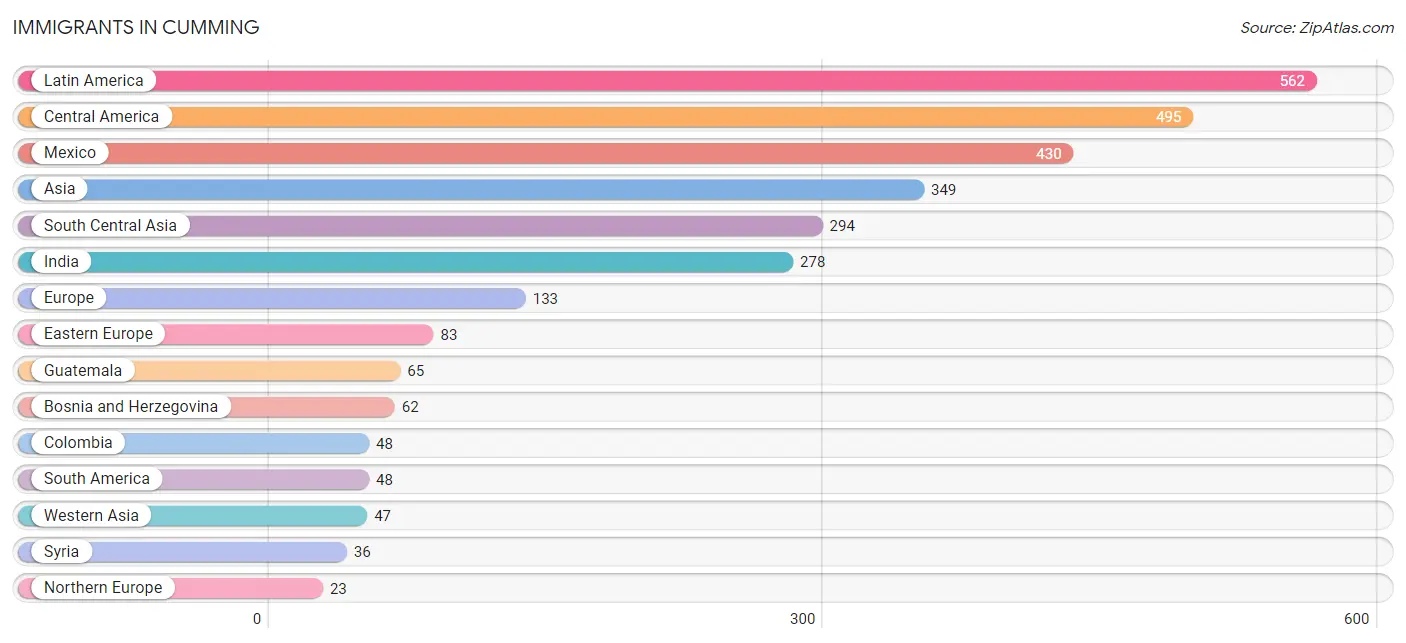
Immigrants in Cumming
The most numerous immigrant groups reported in Cumming came from Latin America (562 | 7.6%), Central America (495 | 6.7%), Mexico (430 | 5.8%), Asia (349 | 4.7%), and South Central Asia (294 | 4.0%), together accounting for 28.9% of all Cumming residents.
| Immigration Origin | # Population | % Population |
| Africa | 18 | 0.2% |
| Asia | 349 | 4.7% |
| Austria | 17 | 0.2% |
| Bosnia and Herzegovina | 62 | 0.8% |
| Caribbean | 19 | 0.3% |
| Central America | 495 | 6.7% |
| Colombia | 48 | 0.6% |
| Czechoslovakia | 5 | 0.1% |
| Eastern Asia | 8 | 0.1% |
| Eastern Europe | 83 | 1.1% |
| Egypt | 8 | 0.1% |
| Europe | 133 | 1.8% |
| Guatemala | 65 | 0.9% |
| India | 278 | 3.8% |
| Iraq | 11 | 0.2% |
| Italy | 10 | 0.1% |
| Jamaica | 19 | 0.3% |
| Kazakhstan | 16 | 0.2% |
| Korea | 8 | 0.1% |
| Latin America | 562 | 7.6% |
| Mexico | 430 | 5.8% |
| Northern Africa | 8 | 0.1% |
| Northern Europe | 23 | 0.3% |
| Norway | 12 | 0.2% |
| Russia | 16 | 0.2% |
| Senegal | 10 | 0.1% |
| South America | 48 | 0.6% |
| South Central Asia | 294 | 4.0% |
| Southern Europe | 10 | 0.1% |
| Syria | 36 | 0.5% |
| Western Africa | 10 | 0.1% |
| Western Asia | 47 | 0.6% |
| Western Europe | 17 | 0.2% | View All 33 Rows |
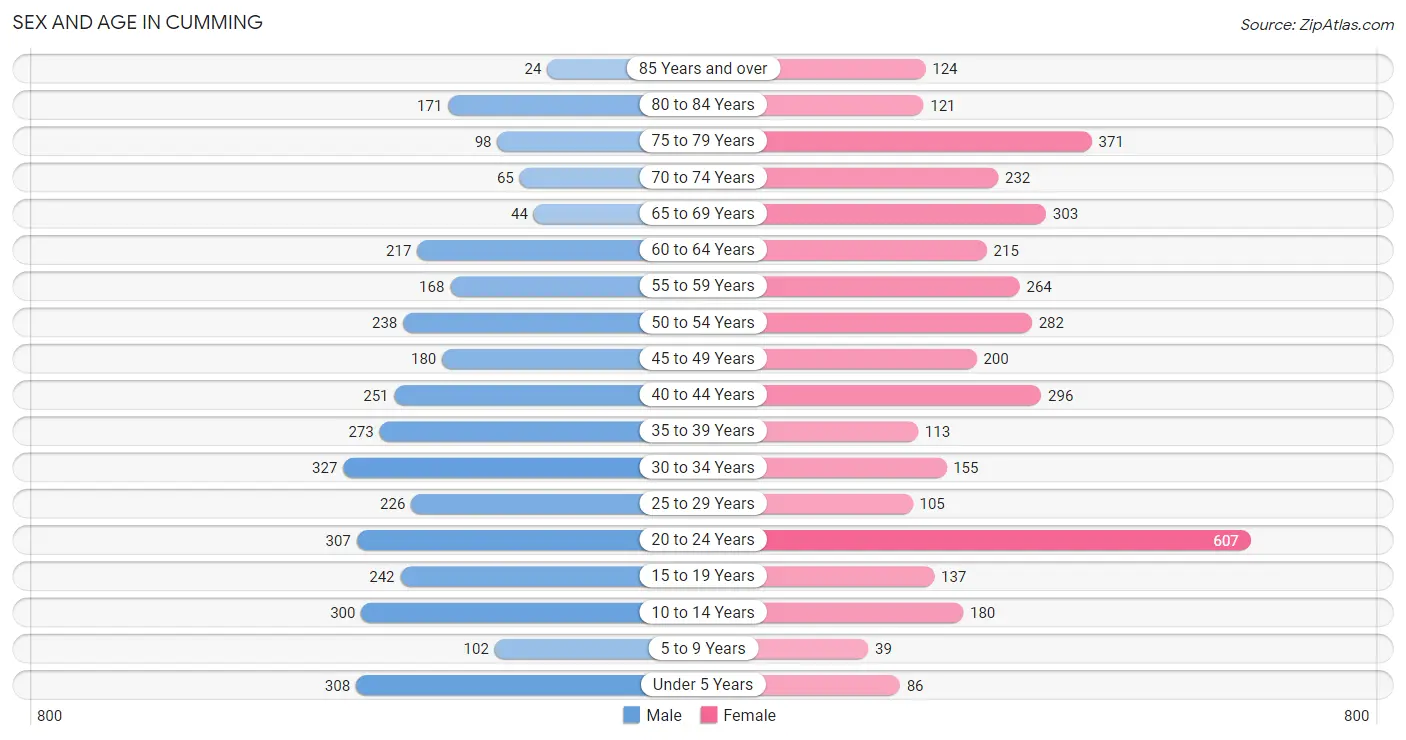
Sex and Age in Cumming
Sex and Age in Cumming
The most populous age groups in Cumming are 30 to 34 Years (327 | 9.2%) for men and 20 to 24 Years (607 | 15.9%) for women.
| Age Bracket | Male | Female |
| Under 5 Years | 308 (8.7%) | 86 (2.2%) |
| 5 to 9 Years | 102 (2.9%) | 39 (1.0%) |
| 10 to 14 Years | 300 (8.5%) | 180 (4.7%) |
| 15 to 19 Years | 242 (6.8%) | 137 (3.6%) |
| 20 to 24 Years | 307 (8.7%) | 607 (15.9%) |
| 25 to 29 Years | 226 (6.4%) | 105 (2.7%) |
| 30 to 34 Years | 327 (9.2%) | 155 (4.1%) |
| 35 to 39 Years | 273 (7.7%) | 113 (2.9%) |
| 40 to 44 Years | 251 (7.1%) | 296 (7.7%) |
| 45 to 49 Years | 180 (5.1%) | 200 (5.2%) |
| 50 to 54 Years | 238 (6.7%) | 282 (7.4%) |
| 55 to 59 Years | 168 (4.7%) | 264 (6.9%) |
| 60 to 64 Years | 217 (6.1%) | 215 (5.6%) |
| 65 to 69 Years | 44 (1.2%) | 303 (7.9%) |
| 70 to 74 Years | 65 (1.8%) | 232 (6.1%) |
| 75 to 79 Years | 98 (2.8%) | 371 (9.7%) |
| 80 to 84 Years | 171 (4.8%) | 121 (3.2%) |
| 85 Years and over | 24 (0.7%) | 124 (3.2%) |
| Total | 3,541 (100.0%) | 3,830 (100.0%) |
Families and Households in Cumming
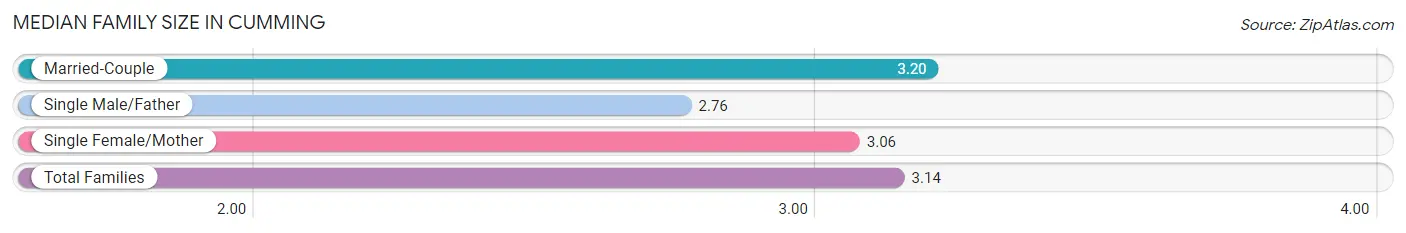
Median Family Size in Cumming
The median family size in Cumming is 3.14 persons per family, with married-couple families (1,127 | 66.6%) accounting for the largest median family size of 3.2 persons per family. On the other hand, single male/father families (84 | 5.0%) represent the smallest median family size with 2.76 persons per family.
| Family Type | # Families | Family Size |
| Married-Couple | 1,127 (66.6%) | 3.20 |
| Single Male/Father | 84 (5.0%) | 2.76 |
| Single Female/Mother | 480 (28.4%) | 3.06 |
| Total Families | 1,691 (100.0%) | 3.14 |
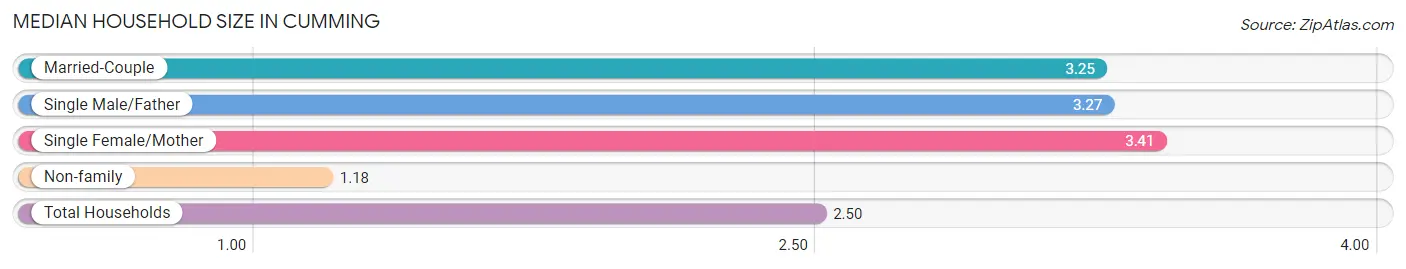
Median Household Size in Cumming
The median household size in Cumming is 2.50 persons per household, with single female/mother households (480 | 17.7%) accounting for the largest median household size of 3.41 persons per household. non-family households (1,017 | 37.6%) represent the smallest median household size with 1.18 persons per household.
| Household Type | # Households | Household Size |
| Married-Couple | 1,127 (41.6%) | 3.25 |
| Single Male/Father | 84 (3.1%) | 3.27 |
| Single Female/Mother | 480 (17.7%) | 3.41 |
| Non-family | 1,017 (37.6%) | 1.18 |
| Total Households | 2,708 (100.0%) | 2.50 |
Household Size by Marriage Status in Cumming
Out of a total of 2,708 households in Cumming, 1,691 (62.4%) are family households, while 1,017 (37.6%) are nonfamily households. The most numerous type of family households are 2-person households, comprising 805, and the most common type of nonfamily households are 1-person households, comprising 899.
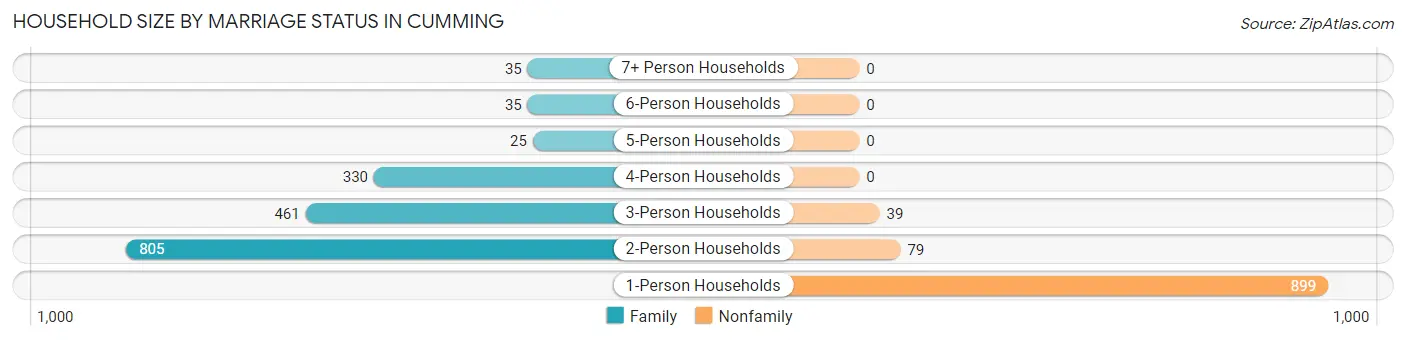
| Household Size | Family Households | Nonfamily Households |
| 1-Person Households | - | 899 (33.2%) |
| 2-Person Households | 805 (29.7%) | 79 (2.9%) |
| 3-Person Households | 461 (17.0%) | 39 (1.4%) |
| 4-Person Households | 330 (12.2%) | 0 (0.0%) |
| 5-Person Households | 25 (0.9%) | 0 (0.0%) |
| 6-Person Households | 35 (1.3%) | 0 (0.0%) |
| 7+ Person Households | 35 (1.3%) | 0 (0.0%) |
| Total | 1,691 (62.4%) | 1,017 (37.6%) |
Female Fertility in Cumming
Fertility by Age in Cumming
Average fertility rate in Cumming is 77.0 births per 1,000 women. Women in the age bracket of 20 to 34 years have the highest fertility rate with 123.0 births per 1,000 women. Women in the age bracket of 20 to 34 years acount for 84.9% of all women with births.
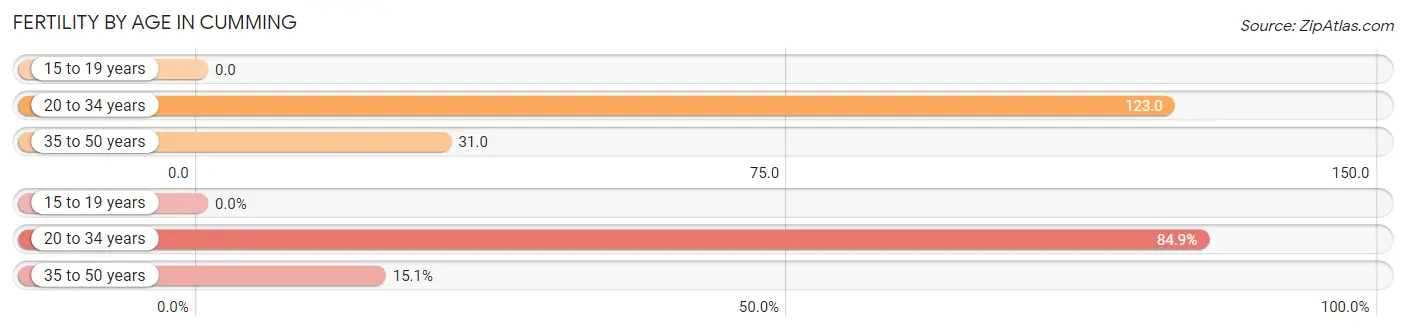
| Age Bracket | Women with Births | Births / 1,000 Women |
| 15 to 19 years | 0 (0.0%) | 0.0 |
| 20 to 34 years | 107 (84.9%) | 123.0 |
| 35 to 50 years | 19 (15.1%) | 31.0 |
| Total | 126 (100.0%) | 77.0 |
Fertility by Age by Marriage Status in Cumming
24.6% of women with births (126) in Cumming are married. The highest percentage of unmarried women with births falls into 20 to 34 years age bracket with 88.8% of them unmarried at the time of birth, while the lowest percentage of unmarried women with births belong to 35 to 50 years age bracket with 0.0% of them unmarried.
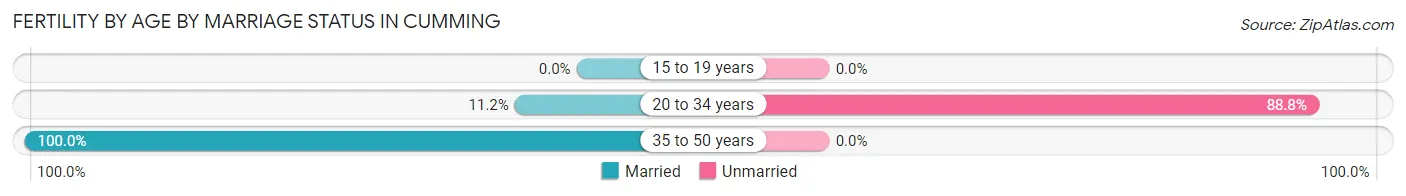
| Age Bracket | Married | Unmarried |
| 15 to 19 years | 0 (0.0%) | 0 (0.0%) |
| 20 to 34 years | 12 (11.2%) | 95 (88.8%) |
| 35 to 50 years | 19 (100.0%) | 0 (0.0%) |
| Total | 31 (24.6%) | 95 (75.4%) |
Fertility by Education in Cumming
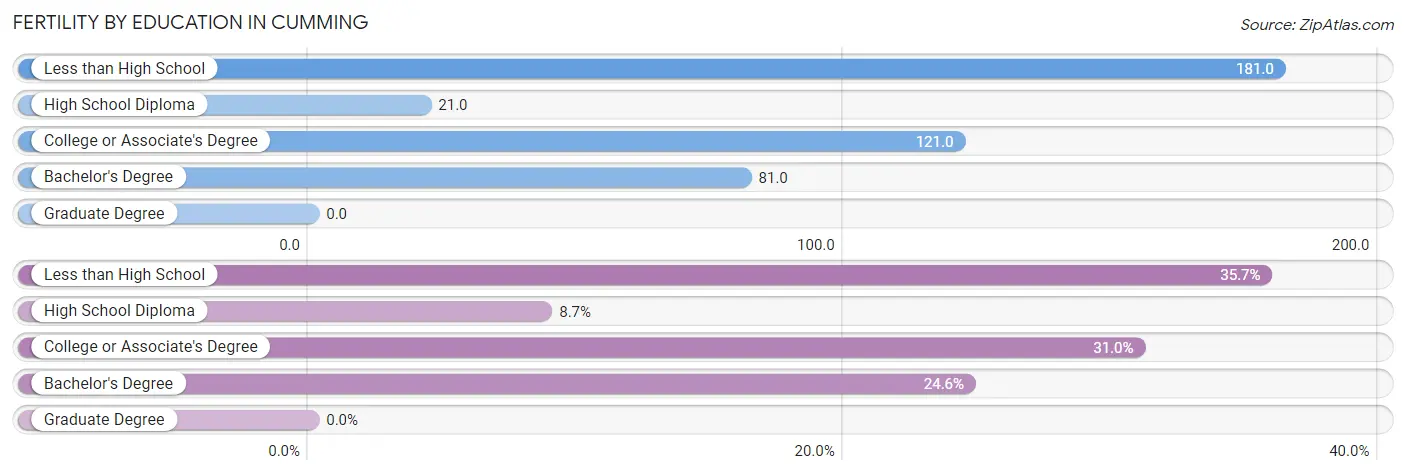
| Educational Attainment | Women with Births | Births / 1,000 Women |
| Less than High School | 45 (35.7%) | 181.0 |
| High School Diploma | 11 (8.7%) | 21.0 |
| College or Associate's Degree | 39 (30.9%) | 121.0 |
| Bachelor's Degree | 31 (24.6%) | 81.0 |
| Graduate Degree | 0 (0.0%) | 0.0 |
| Total | 126 (100.0%) | 77.0 |
Fertility by Education by Marriage Status in Cumming
75.4% of women with births in Cumming are unmarried. Women with the educational attainment of bachelor's degree are most likely to be married with 100.0% of them married at childbirth, while women with the educational attainment of less than high school are least likely to be married with 100.0% of them unmarried at childbirth.
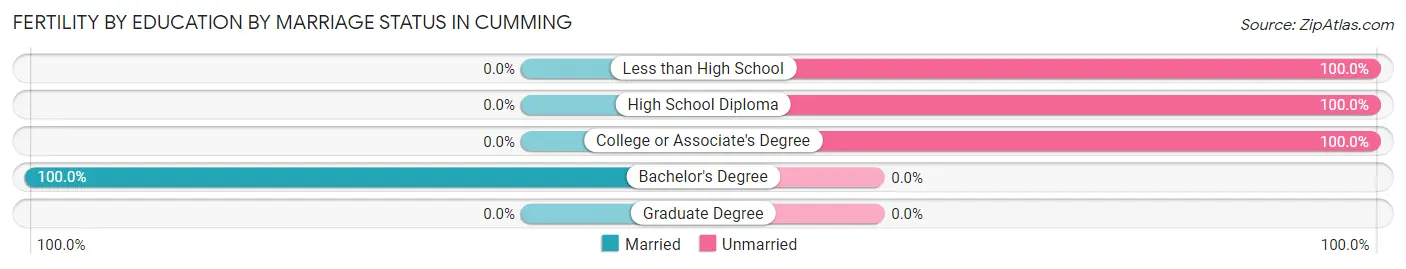
| Educational Attainment | Married | Unmarried |
| Less than High School | 0 (0.0%) | 45 (100.0%) |
| High School Diploma | 0 (0.0%) | 11 (100.0%) |
| College or Associate's Degree | 0 (0.0%) | 39 (100.0%) |
| Bachelor's Degree | 31 (100.0%) | 0 (0.0%) |
| Graduate Degree | 0 (0.0%) | 0 (0.0%) |
| Total | 31 (24.6%) | 95 (75.4%) |
Employment Characteristics in Cumming
Employment by Class of Employer in Cumming
Among the 3,496 employed individuals in Cumming, private company employees (2,422 | 69.3%), self-employed (not incorporated) (387 | 11.1%), and local government employees (269 | 7.7%) make up the most common classes of employment.
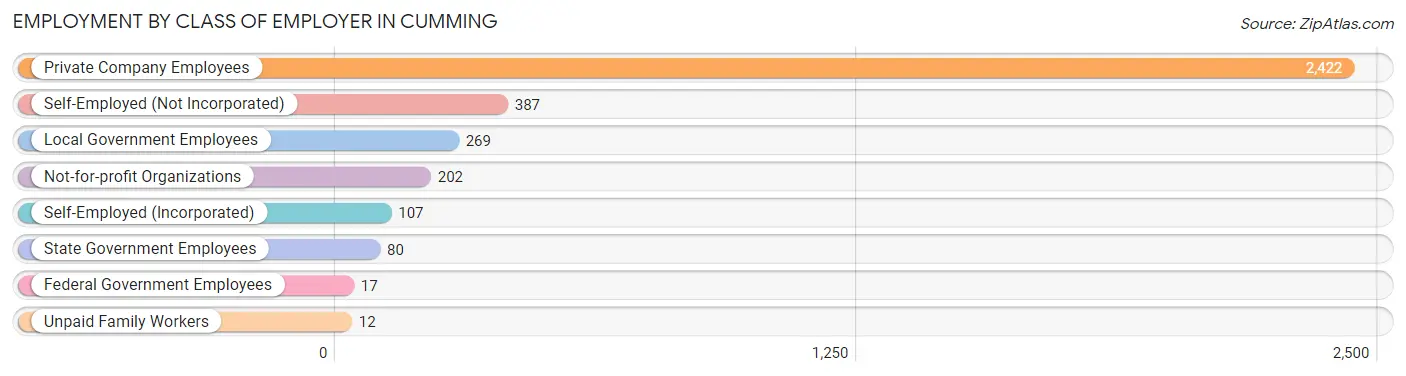
| Employer Class | # Employees | % Employees |
| Private Company Employees | 2,422 | 69.3% |
| Self-Employed (Incorporated) | 107 | 3.1% |
| Self-Employed (Not Incorporated) | 387 | 11.1% |
| Not-for-profit Organizations | 202 | 5.8% |
| Local Government Employees | 269 | 7.7% |
| State Government Employees | 80 | 2.3% |
| Federal Government Employees | 17 | 0.5% |
| Unpaid Family Workers | 12 | 0.3% |
| Total | 3,496 | 100.0% |
Employment Status by Age in Cumming
According to the labor force statistics for Cumming, out of the total population over 16 years of age (6,291), 58.4% or 3,674 individuals are in the labor force, with 4.8% or 176 of them unemployed. The age group with the highest labor force participation rate is 35 to 44 years, with 83.7% or 781 individuals in the labor force. Within the labor force, the 25 to 29 years age range has the highest percentage of unemployed individuals, with 18.2% or 46 of them being unemployed.
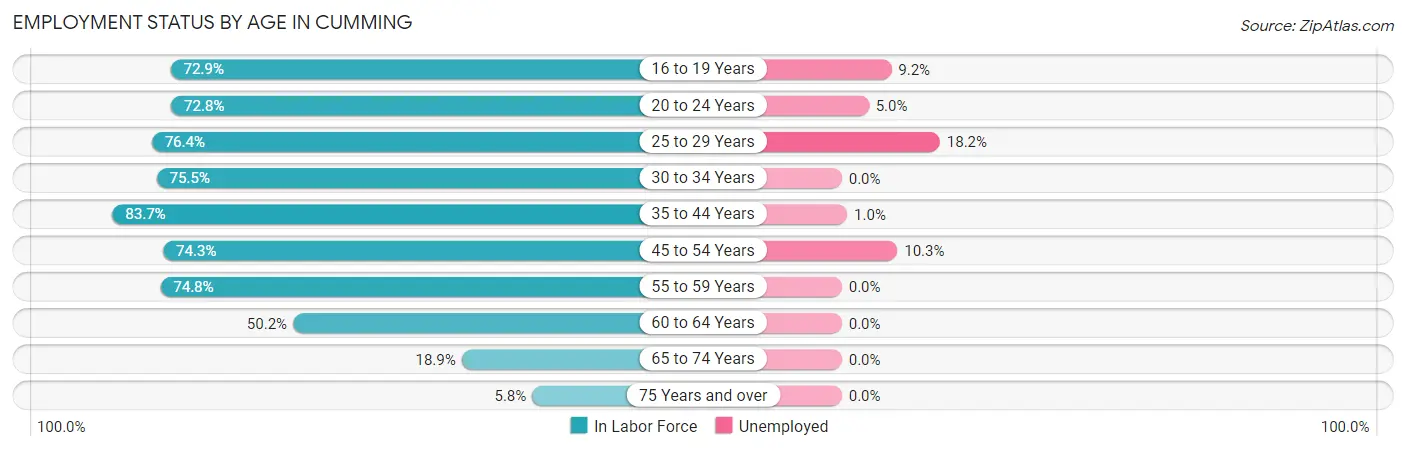
| Age Bracket | In Labor Force | Unemployed |
| 16 to 19 Years | 229 (72.9%) | 21 (9.2%) |
| 20 to 24 Years | 665 (72.8%) | 33 (5.0%) |
| 25 to 29 Years | 253 (76.4%) | 46 (18.2%) |
| 30 to 34 Years | 364 (75.5%) | 0 (0.0%) |
| 35 to 44 Years | 781 (83.7%) | 8 (1.0%) |
| 45 to 54 Years | 669 (74.3%) | 69 (10.3%) |
| 55 to 59 Years | 323 (74.8%) | 0 (0.0%) |
| 60 to 64 Years | 217 (50.2%) | 0 (0.0%) |
| 65 to 74 Years | 122 (18.9%) | 0 (0.0%) |
| 75 Years and over | 53 (5.8%) | 0 (0.0%) |
| Total | 3,674 (58.4%) | 176 (4.8%) |
Employment Status by Educational Attainment in Cumming
According to labor force statistics for Cumming, 74.3% of individuals (2,608) out of the total population between 25 and 64 years of age (3,510) are in the labor force, with 4.7% or 123 of them being unemployed. The group with the highest labor force participation rate are those with the educational attainment of bachelor's degree or higher, with 92.1% or 1,375 individuals in the labor force. Within the labor force, individuals with less than high school education have the highest percentage of unemployment, with 18.4% or 46 of them being unemployed.
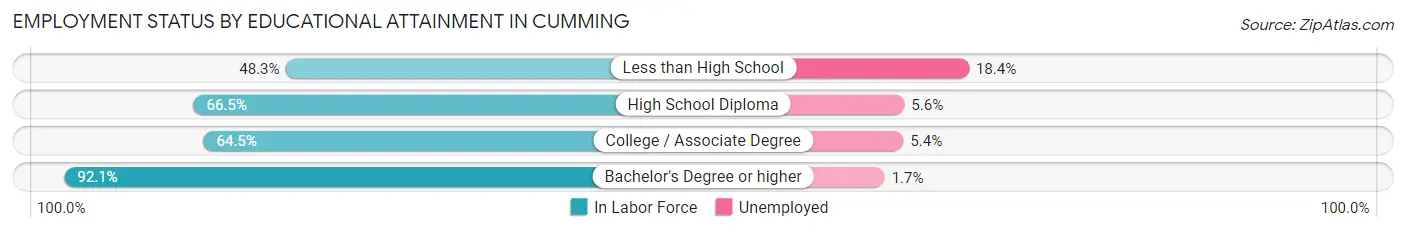
| Educational Attainment | In Labor Force | Unemployed |
| Less than High School | 250 (48.3%) | 95 (18.4%) |
| High School Diploma | 516 (66.5%) | 43 (5.6%) |
| College / Associate Degree | 466 (64.5%) | 39 (5.4%) |
| Bachelor's Degree or higher | 1,375 (92.1%) | 25 (1.7%) |
| Total | 2,608 (74.3%) | 165 (4.7%) |
Employment Occupations by Sex in Cumming
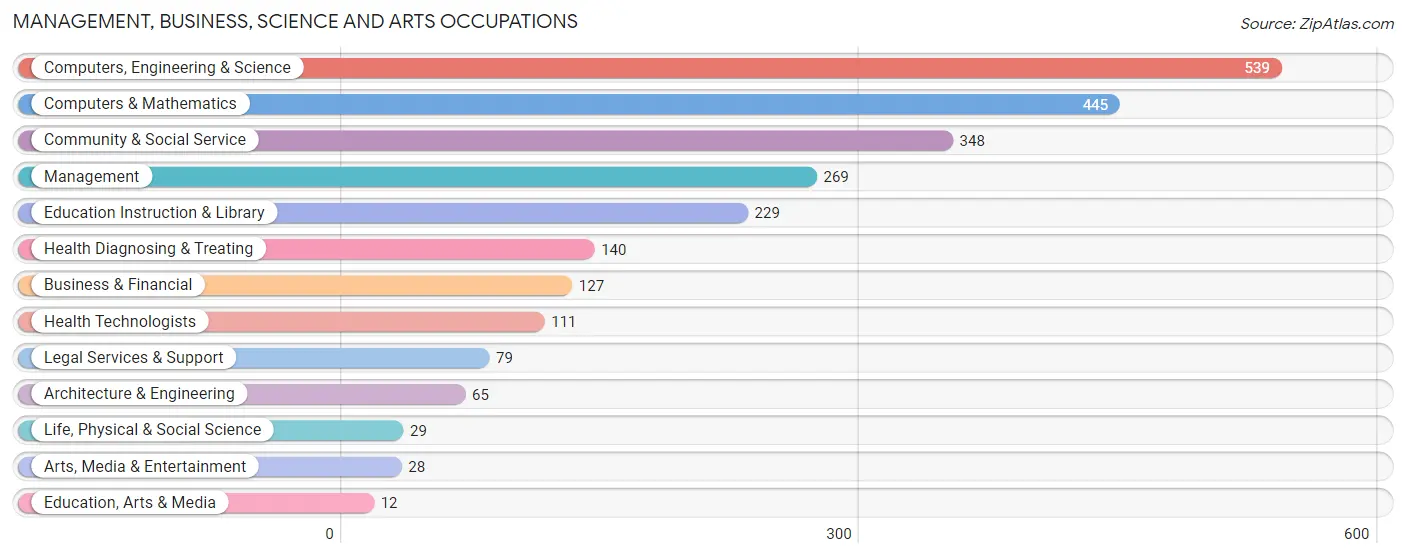
Management, Business, Science and Arts Occupations
The most common Management, Business, Science and Arts occupations in Cumming are Computers, Engineering & Science (539 | 15.4%), Computers & Mathematics (445 | 12.7%), Community & Social Service (348 | 10.0%), Management (269 | 7.7%), and Education Instruction & Library (229 | 6.5%).
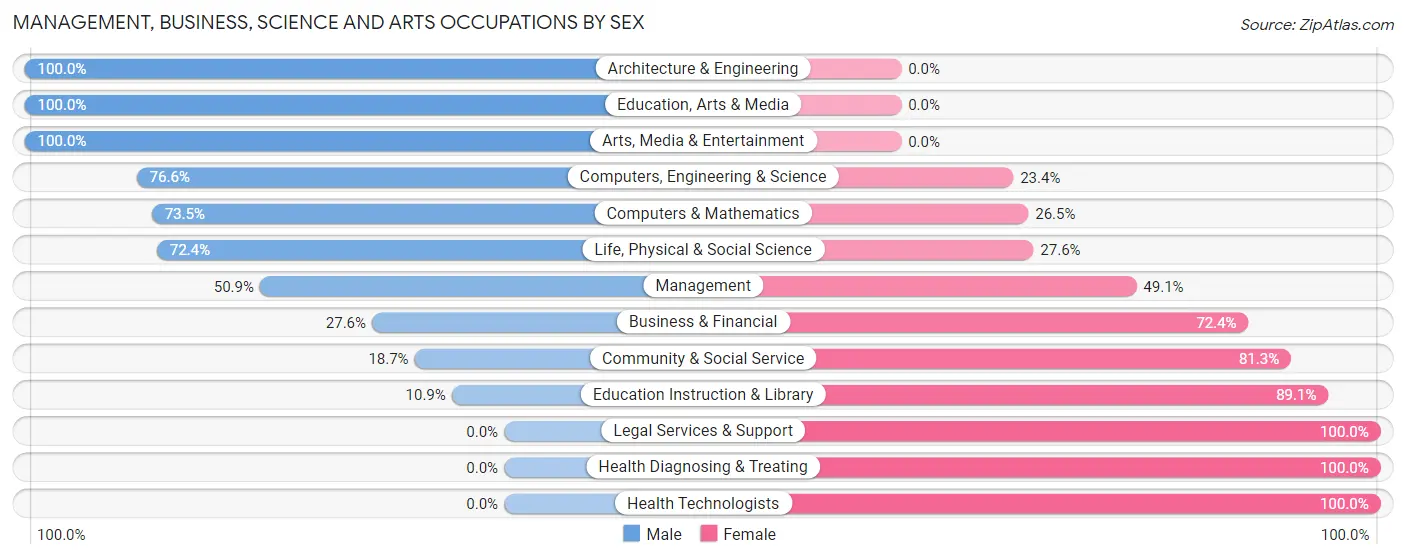
Management, Business, Science and Arts Occupations by Sex
Within the Management, Business, Science and Arts occupations in Cumming, the most male-oriented occupations are Architecture & Engineering (100.0%), Education, Arts & Media (100.0%), and Arts, Media & Entertainment (100.0%), while the most female-oriented occupations are Legal Services & Support (100.0%), Health Diagnosing & Treating (100.0%), and Health Technologists (100.0%).
| Occupation | Male | Female |
| Management | 137 (50.9%) | 132 (49.1%) |
| Business & Financial | 35 (27.6%) | 92 (72.4%) |
| Computers, Engineering & Science | 413 (76.6%) | 126 (23.4%) |
| Computers & Mathematics | 327 (73.5%) | 118 (26.5%) |
| Architecture & Engineering | 65 (100.0%) | 0 (0.0%) |
| Life, Physical & Social Science | 21 (72.4%) | 8 (27.6%) |
| Community & Social Service | 65 (18.7%) | 283 (81.3%) |
| Education, Arts & Media | 12 (100.0%) | 0 (0.0%) |
| Legal Services & Support | 0 (0.0%) | 79 (100.0%) |
| Education Instruction & Library | 25 (10.9%) | 204 (89.1%) |
| Arts, Media & Entertainment | 28 (100.0%) | 0 (0.0%) |
| Health Diagnosing & Treating | 0 (0.0%) | 140 (100.0%) |
| Health Technologists | 0 (0.0%) | 111 (100.0%) |
| Total (Category) | 650 (45.7%) | 773 (54.3%) |
| Total (Overall) | 1,755 (50.2%) | 1,744 (49.8%) |
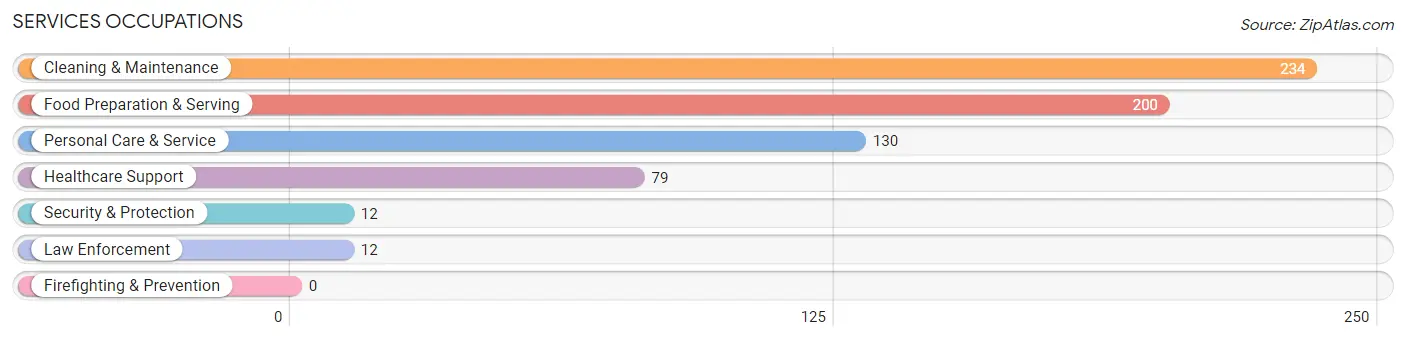
Services Occupations
The most common Services occupations in Cumming are Cleaning & Maintenance (234 | 6.7%), Food Preparation & Serving (200 | 5.7%), Personal Care & Service (130 | 3.7%), Healthcare Support (79 | 2.3%), and Security & Protection (12 | 0.3%).
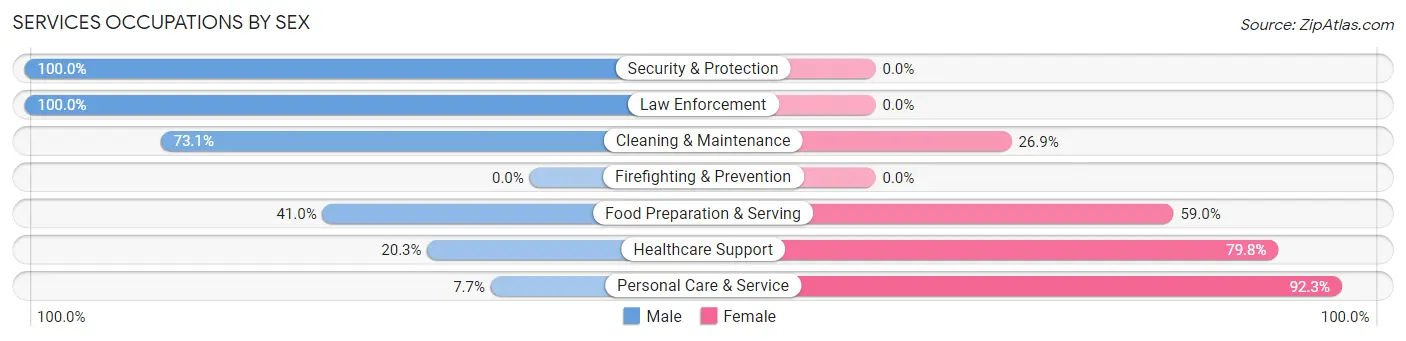
Services Occupations by Sex
Within the Services occupations in Cumming, the most male-oriented occupations are Security & Protection (100.0%), Law Enforcement (100.0%), and Cleaning & Maintenance (73.1%), while the most female-oriented occupations are Personal Care & Service (92.3%), Healthcare Support (79.7%), and Food Preparation & Serving (59.0%).
| Occupation | Male | Female |
| Healthcare Support | 16 (20.3%) | 63 (79.7%) |
| Security & Protection | 12 (100.0%) | 0 (0.0%) |
| Firefighting & Prevention | 0 (0.0%) | 0 (0.0%) |
| Law Enforcement | 12 (100.0%) | 0 (0.0%) |
| Food Preparation & Serving | 82 (41.0%) | 118 (59.0%) |
| Cleaning & Maintenance | 171 (73.1%) | 63 (26.9%) |
| Personal Care & Service | 10 (7.7%) | 120 (92.3%) |
| Total (Category) | 291 (44.4%) | 364 (55.6%) |
| Total (Overall) | 1,755 (50.2%) | 1,744 (49.8%) |
Sales and Office Occupations
The most common Sales and Office occupations in Cumming are Sales & Related (423 | 12.1%), and Office & Administration (342 | 9.8%).
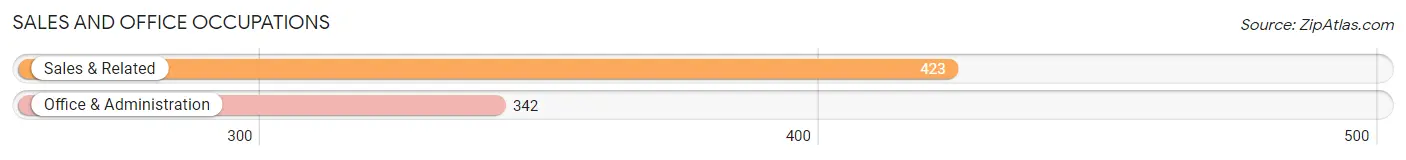
Sales and Office Occupations by Sex
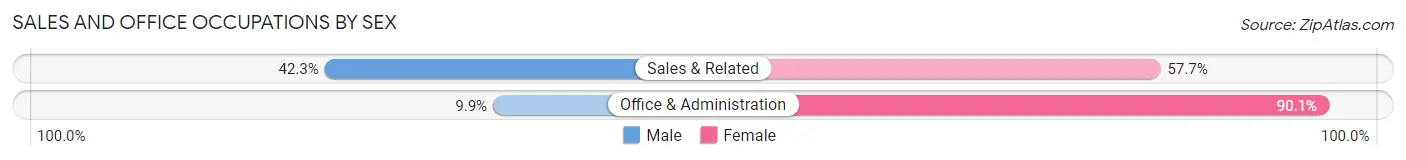
| Occupation | Male | Female |
| Sales & Related | 179 (42.3%) | 244 (57.7%) |
| Office & Administration | 34 (9.9%) | 308 (90.1%) |
| Total (Category) | 213 (27.8%) | 552 (72.2%) |
| Total (Overall) | 1,755 (50.2%) | 1,744 (49.8%) |
Natural Resources, Construction and Maintenance Occupations
The most common Natural Resources, Construction and Maintenance occupations in Cumming are Construction & Extraction (323 | 9.2%), Farming, Fishing & Forestry (33 | 0.9%), and Installation, Maintenance & Repair (28 | 0.8%).
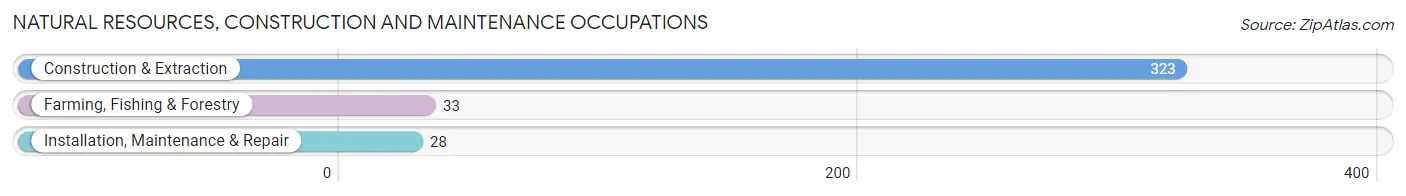
Natural Resources, Construction and Maintenance Occupations by Sex
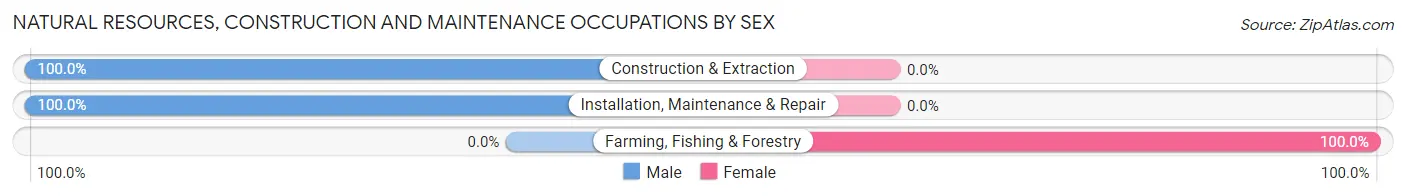
| Occupation | Male | Female |
| Farming, Fishing & Forestry | 0 (0.0%) | 33 (100.0%) |
| Construction & Extraction | 323 (100.0%) | 0 (0.0%) |
| Installation, Maintenance & Repair | 28 (100.0%) | 0 (0.0%) |
| Total (Category) | 351 (91.4%) | 33 (8.6%) |
| Total (Overall) | 1,755 (50.2%) | 1,744 (49.8%) |
Production, Transportation and Moving Occupations
The most common Production, Transportation and Moving occupations in Cumming are Production (162 | 4.6%), Material Moving (63 | 1.8%), and Transportation (47 | 1.3%).
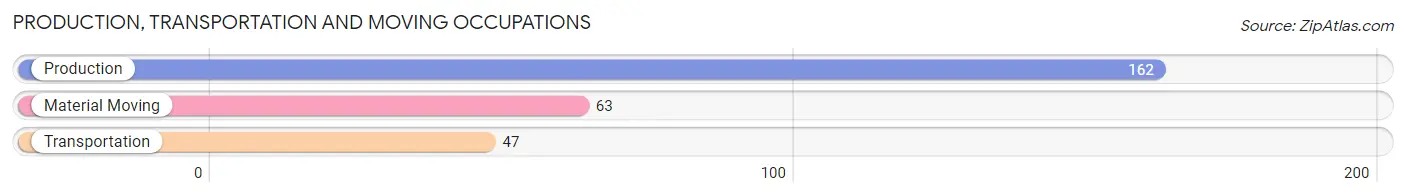
Production, Transportation and Moving Occupations by Sex
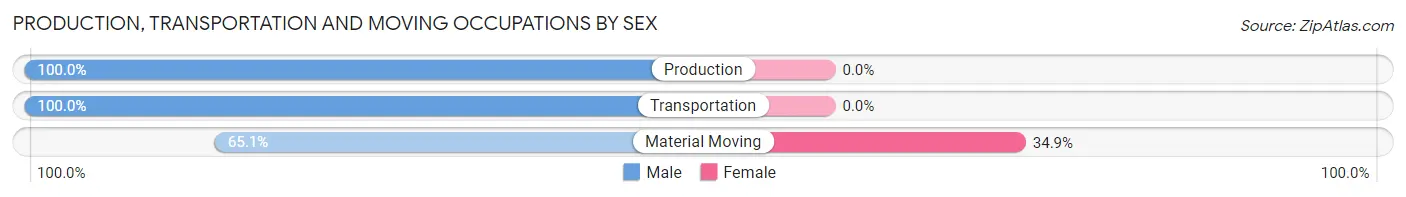
| Occupation | Male | Female |
| Production | 162 (100.0%) | 0 (0.0%) |
| Transportation | 47 (100.0%) | 0 (0.0%) |
| Material Moving | 41 (65.1%) | 22 (34.9%) |
| Total (Category) | 250 (91.9%) | 22 (8.1%) |
| Total (Overall) | 1,755 (50.2%) | 1,744 (49.8%) |
Employment Industries by Sex in Cumming
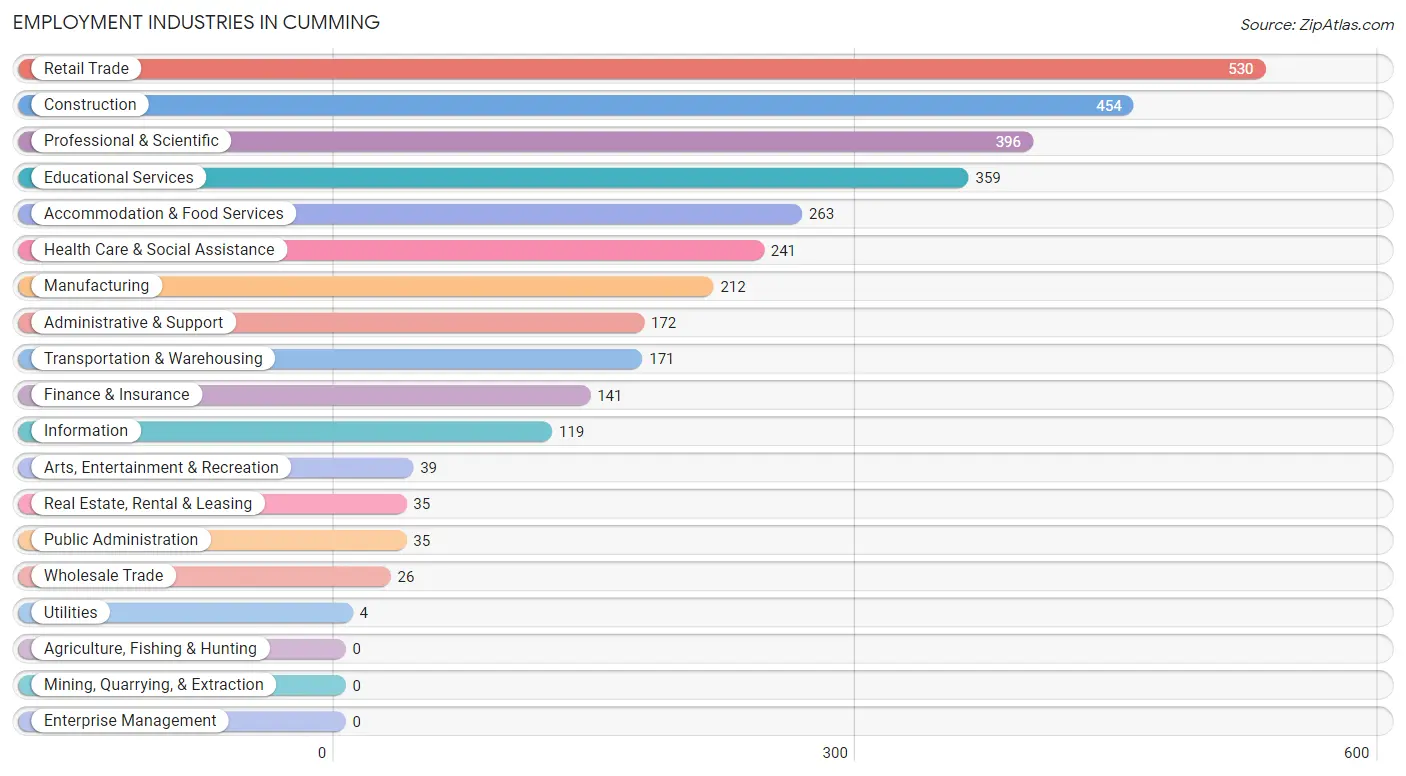
Employment Industries in Cumming
The major employment industries in Cumming include Retail Trade (530 | 15.1%), Construction (454 | 13.0%), Professional & Scientific (396 | 11.3%), Educational Services (359 | 10.3%), and Accommodation & Food Services (263 | 7.5%).
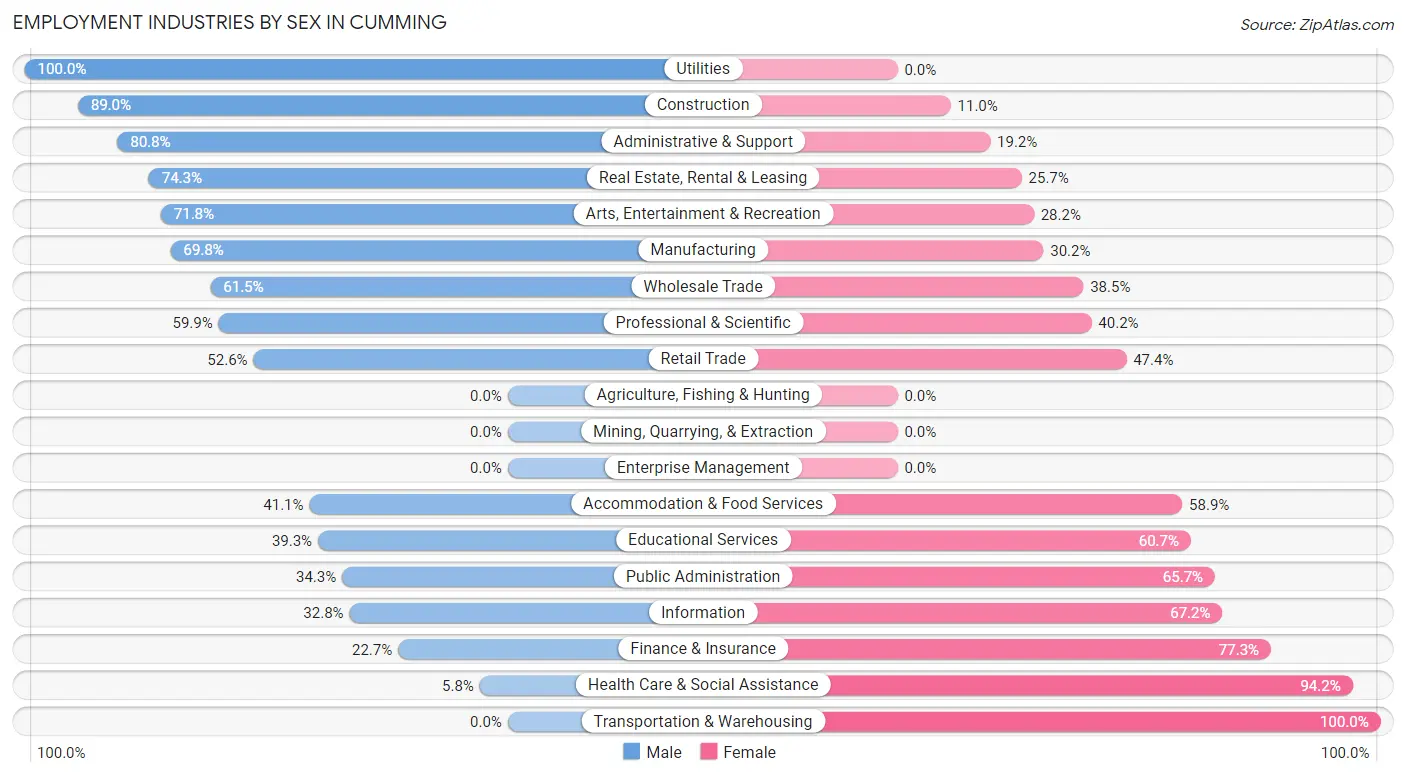
Employment Industries by Sex in Cumming
The Cumming industries that see more men than women are Utilities (100.0%), Construction (89.0%), and Administrative & Support (80.8%), whereas the industries that tend to have a higher number of women are Transportation & Warehousing (100.0%), Health Care & Social Assistance (94.2%), and Finance & Insurance (77.3%).
| Industry | Male | Female |
| Agriculture, Fishing & Hunting | 0 (0.0%) | 0 (0.0%) |
| Mining, Quarrying, & Extraction | 0 (0.0%) | 0 (0.0%) |
| Construction | 404 (89.0%) | 50 (11.0%) |
| Manufacturing | 148 (69.8%) | 64 (30.2%) |
| Wholesale Trade | 16 (61.5%) | 10 (38.5%) |
| Retail Trade | 279 (52.6%) | 251 (47.4%) |
| Transportation & Warehousing | 0 (0.0%) | 171 (100.0%) |
| Utilities | 4 (100.0%) | 0 (0.0%) |
| Information | 39 (32.8%) | 80 (67.2%) |
| Finance & Insurance | 32 (22.7%) | 109 (77.3%) |
| Real Estate, Rental & Leasing | 26 (74.3%) | 9 (25.7%) |
| Professional & Scientific | 237 (59.9%) | 159 (40.2%) |
| Enterprise Management | 0 (0.0%) | 0 (0.0%) |
| Administrative & Support | 139 (80.8%) | 33 (19.2%) |
| Educational Services | 141 (39.3%) | 218 (60.7%) |
| Health Care & Social Assistance | 14 (5.8%) | 227 (94.2%) |
| Arts, Entertainment & Recreation | 28 (71.8%) | 11 (28.2%) |
| Accommodation & Food Services | 108 (41.1%) | 155 (58.9%) |
| Public Administration | 12 (34.3%) | 23 (65.7%) |
| Total | 1,755 (50.2%) | 1,744 (49.8%) |
Education in Cumming
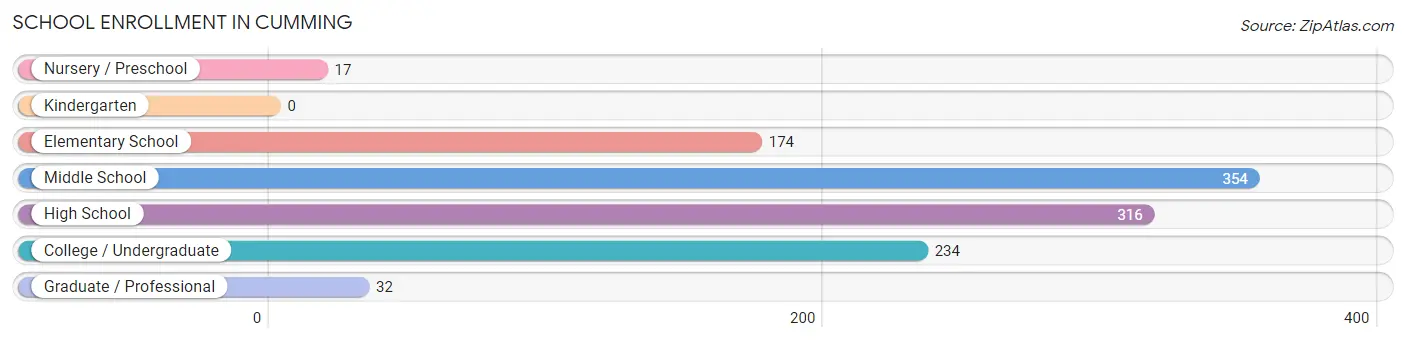
School Enrollment in Cumming
The most common levels of schooling among the 1,127 students in Cumming are middle school (354 | 31.4%), high school (316 | 28.0%), and college / undergraduate (234 | 20.8%).
| School Level | # Students | % Students |
| Nursery / Preschool | 17 | 1.5% |
| Kindergarten | 0 | 0.0% |
| Elementary School | 174 | 15.4% |
| Middle School | 354 | 31.4% |
| High School | 316 | 28.0% |
| College / Undergraduate | 234 | 20.8% |
| Graduate / Professional | 32 | 2.8% |
| Total | 1,127 | 100.0% |
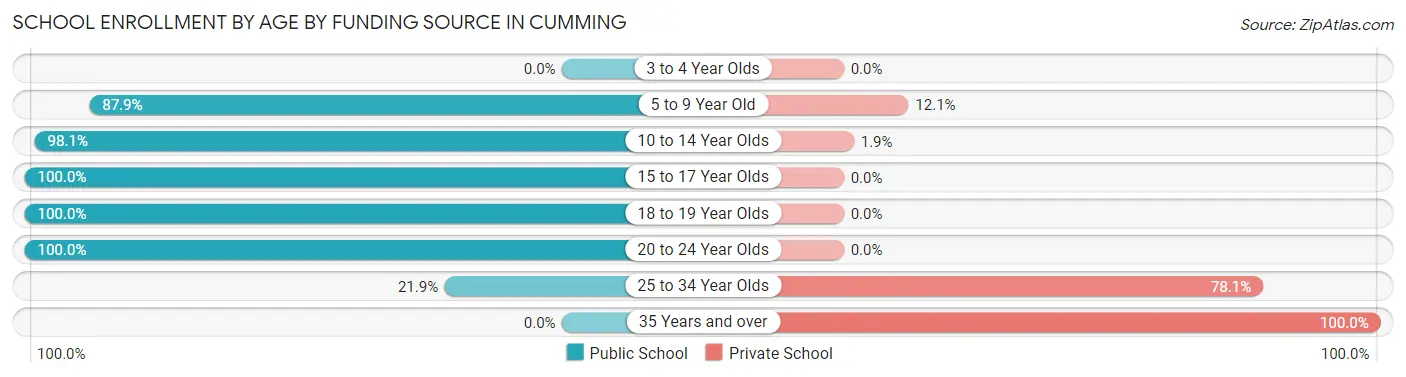
School Enrollment by Age by Funding Source in Cumming
Out of a total of 1,127 students who are enrolled in schools in Cumming, 62 (5.5%) attend a private institution, while the remaining 1,065 (94.5%) are enrolled in public schools. The age group of 35 years and over has the highest likelihood of being enrolled in private schools, with 11 (100.0% in the age bracket) enrolled. Conversely, the age group of 15 to 17 year olds has the lowest likelihood of being enrolled in a private school, with 111 (100.0% in the age bracket) attending a public institution.
| Age Bracket | Public School | Private School |
| 3 to 4 Year Olds | 0 (0.0%) | 0 (0.0%) |
| 5 to 9 Year Old | 124 (87.9%) | 17 (12.1%) |
| 10 to 14 Year Olds | 471 (98.1%) | 9 (1.9%) |
| 15 to 17 Year Olds | 111 (100.0%) | 0 (0.0%) |
| 18 to 19 Year Olds | 100 (100.0%) | 0 (0.0%) |
| 20 to 24 Year Olds | 252 (100.0%) | 0 (0.0%) |
| 25 to 34 Year Olds | 7 (21.9%) | 25 (78.1%) |
| 35 Years and over | 0 (0.0%) | 11 (100.0%) |
| Total | 1,065 (94.5%) | 62 (5.5%) |
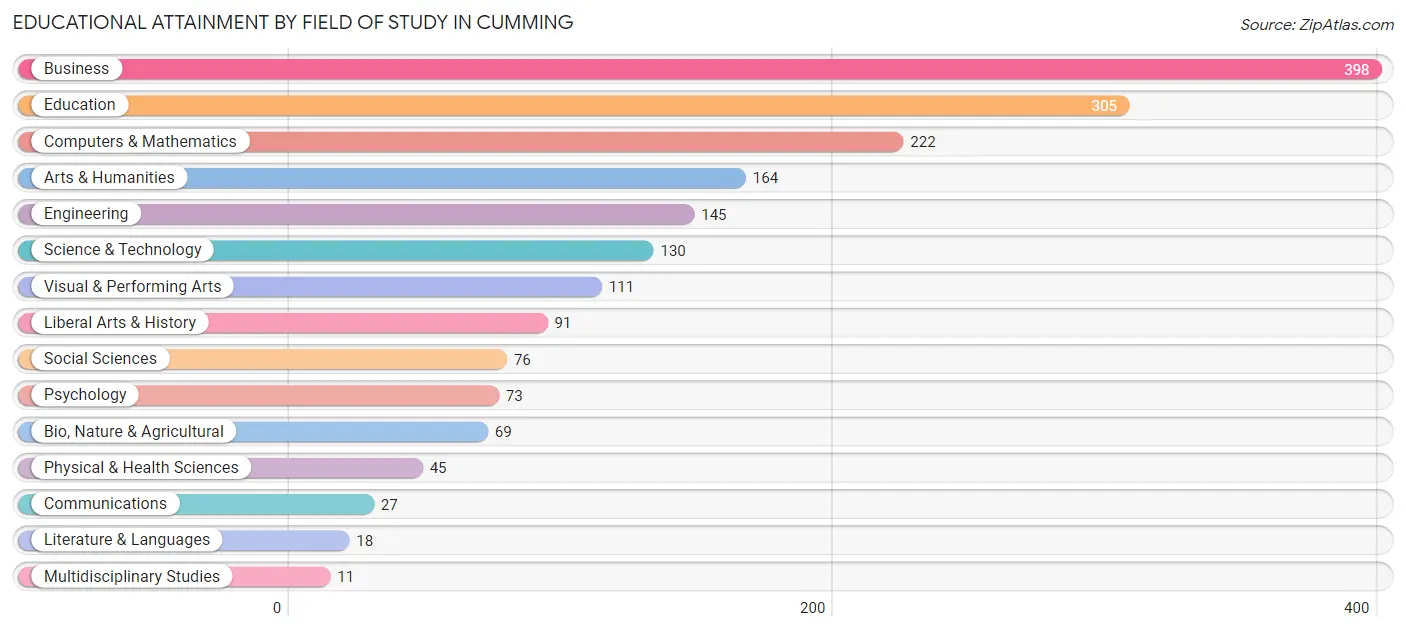
Educational Attainment by Field of Study in Cumming
Business (398 | 21.1%), education (305 | 16.2%), computers & mathematics (222 | 11.8%), arts & humanities (164 | 8.7%), and engineering (145 | 7.7%) are the most common fields of study among 1,885 individuals in Cumming who have obtained a bachelor's degree or higher.
| Field of Study | # Graduates | % Graduates |
| Computers & Mathematics | 222 | 11.8% |
| Bio, Nature & Agricultural | 69 | 3.7% |
| Physical & Health Sciences | 45 | 2.4% |
| Psychology | 73 | 3.9% |
| Social Sciences | 76 | 4.0% |
| Engineering | 145 | 7.7% |
| Multidisciplinary Studies | 11 | 0.6% |
| Science & Technology | 130 | 6.9% |
| Business | 398 | 21.1% |
| Education | 305 | 16.2% |
| Literature & Languages | 18 | 0.9% |
| Liberal Arts & History | 91 | 4.8% |
| Visual & Performing Arts | 111 | 5.9% |
| Communications | 27 | 1.4% |
| Arts & Humanities | 164 | 8.7% |
| Total | 1,885 | 100.0% |
Transportation & Commute in Cumming
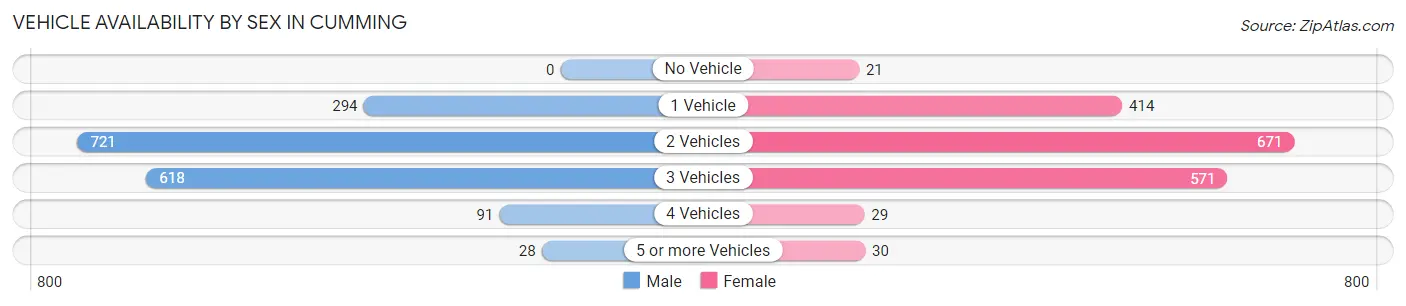
Vehicle Availability by Sex in Cumming
The most prevalent vehicle ownership categories in Cumming are males with 2 vehicles (721, accounting for 41.1%) and females with 2 vehicles (671, making up 41.5%).
| Vehicles Available | Male | Female |
| No Vehicle | 0 (0.0%) | 21 (1.2%) |
| 1 Vehicle | 294 (16.8%) | 414 (23.8%) |
| 2 Vehicles | 721 (41.1%) | 671 (38.7%) |
| 3 Vehicles | 618 (35.3%) | 571 (32.9%) |
| 4 Vehicles | 91 (5.2%) | 29 (1.7%) |
| 5 or more Vehicles | 28 (1.6%) | 30 (1.7%) |
| Total | 1,752 (100.0%) | 1,736 (100.0%) |
Commute Time in Cumming
The most frequently occuring commute durations in Cumming are 30 to 34 minutes (522 commuters, 17.5%), 15 to 19 minutes (425 commuters, 14.3%), and 20 to 24 minutes (373 commuters, 12.5%).
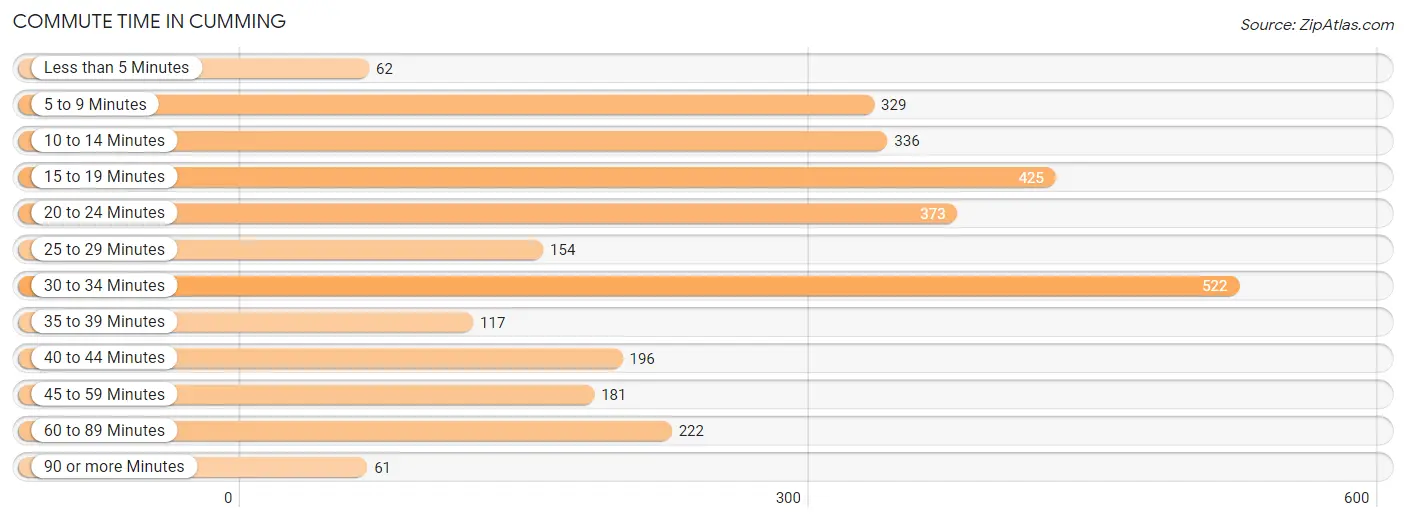
| Commute Time | # Commuters | % Commuters |
| Less than 5 Minutes | 62 | 2.1% |
| 5 to 9 Minutes | 329 | 11.1% |
| 10 to 14 Minutes | 336 | 11.3% |
| 15 to 19 Minutes | 425 | 14.3% |
| 20 to 24 Minutes | 373 | 12.5% |
| 25 to 29 Minutes | 154 | 5.2% |
| 30 to 34 Minutes | 522 | 17.5% |
| 35 to 39 Minutes | 117 | 3.9% |
| 40 to 44 Minutes | 196 | 6.6% |
| 45 to 59 Minutes | 181 | 6.1% |
| 60 to 89 Minutes | 222 | 7.4% |
| 90 or more Minutes | 61 | 2.1% |
Commute Time by Sex in Cumming
The most common commute times in Cumming are 15 to 19 minutes (277 commuters, 17.3%) for males and 30 to 34 minutes (282 commuters, 20.5%) for females.
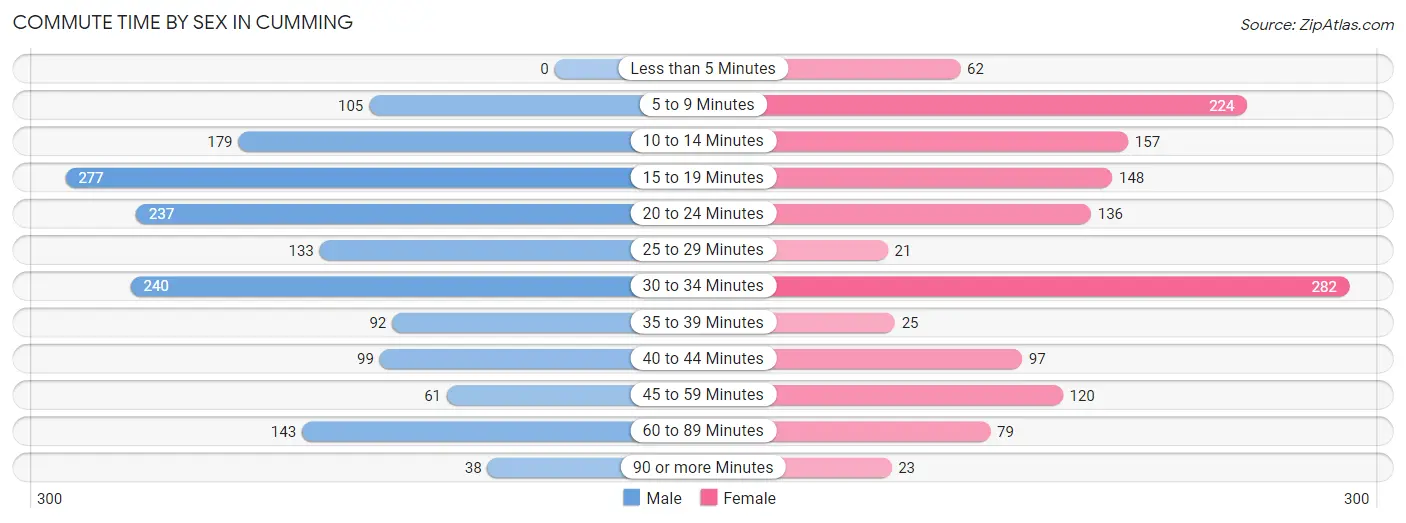
| Commute Time | Male | Female |
| Less than 5 Minutes | 0 (0.0%) | 62 (4.5%) |
| 5 to 9 Minutes | 105 (6.6%) | 224 (16.3%) |
| 10 to 14 Minutes | 179 (11.2%) | 157 (11.4%) |
| 15 to 19 Minutes | 277 (17.3%) | 148 (10.8%) |
| 20 to 24 Minutes | 237 (14.8%) | 136 (9.9%) |
| 25 to 29 Minutes | 133 (8.3%) | 21 (1.5%) |
| 30 to 34 Minutes | 240 (15.0%) | 282 (20.5%) |
| 35 to 39 Minutes | 92 (5.7%) | 25 (1.8%) |
| 40 to 44 Minutes | 99 (6.2%) | 97 (7.1%) |
| 45 to 59 Minutes | 61 (3.8%) | 120 (8.7%) |
| 60 to 89 Minutes | 143 (8.9%) | 79 (5.8%) |
| 90 or more Minutes | 38 (2.4%) | 23 (1.7%) |
Time of Departure to Work by Sex in Cumming
The most frequent times of departure to work in Cumming are 7:30 AM to 7:59 AM (344, 21.4%) for males and 7:30 AM to 7:59 AM (275, 20.0%) for females.
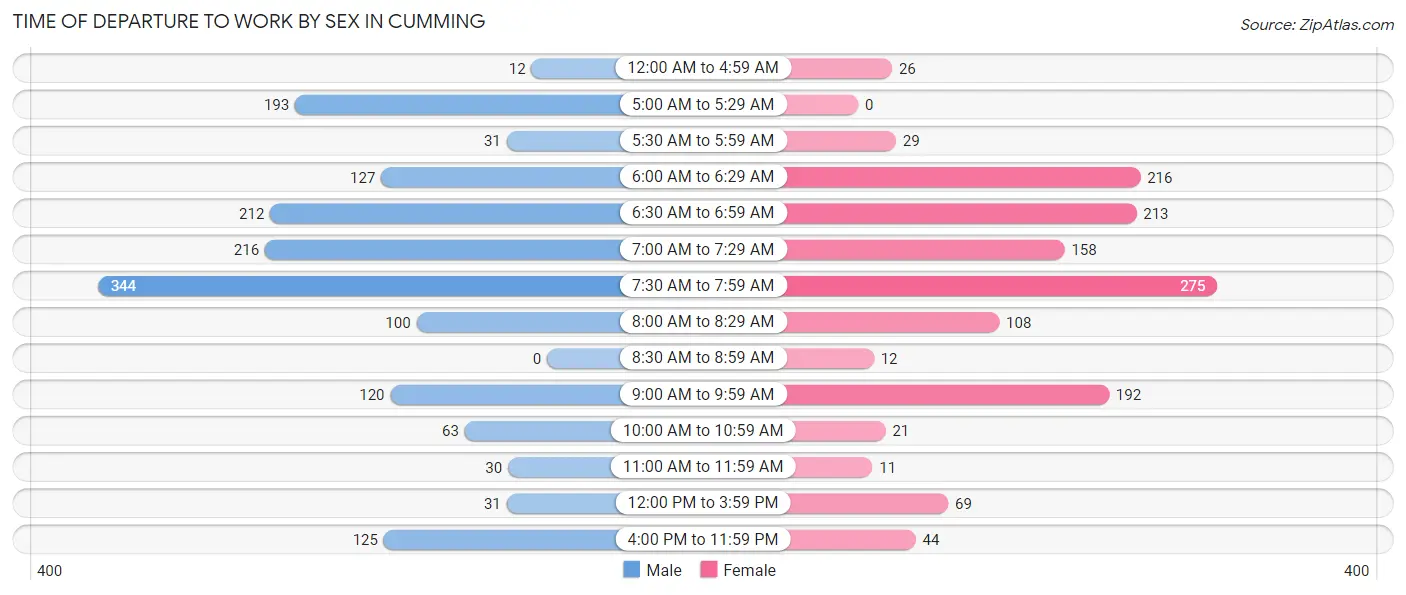
| Time of Departure | Male | Female |
| 12:00 AM to 4:59 AM | 12 (0.7%) | 26 (1.9%) |
| 5:00 AM to 5:29 AM | 193 (12.0%) | 0 (0.0%) |
| 5:30 AM to 5:59 AM | 31 (1.9%) | 29 (2.1%) |
| 6:00 AM to 6:29 AM | 127 (7.9%) | 216 (15.7%) |
| 6:30 AM to 6:59 AM | 212 (13.2%) | 213 (15.5%) |
| 7:00 AM to 7:29 AM | 216 (13.5%) | 158 (11.5%) |
| 7:30 AM to 7:59 AM | 344 (21.4%) | 275 (20.0%) |
| 8:00 AM to 8:29 AM | 100 (6.2%) | 108 (7.9%) |
| 8:30 AM to 8:59 AM | 0 (0.0%) | 12 (0.9%) |
| 9:00 AM to 9:59 AM | 120 (7.5%) | 192 (14.0%) |
| 10:00 AM to 10:59 AM | 63 (3.9%) | 21 (1.5%) |
| 11:00 AM to 11:59 AM | 30 (1.9%) | 11 (0.8%) |
| 12:00 PM to 3:59 PM | 31 (1.9%) | 69 (5.0%) |
| 4:00 PM to 11:59 PM | 125 (7.8%) | 44 (3.2%) |
| Total | 1,604 (100.0%) | 1,374 (100.0%) |
Housing Occupancy in Cumming
Occupancy by Ownership in Cumming
Of the total 2,708 dwellings in Cumming, owner-occupied units account for 1,249 (46.1%), while renter-occupied units make up 1,459 (53.9%).
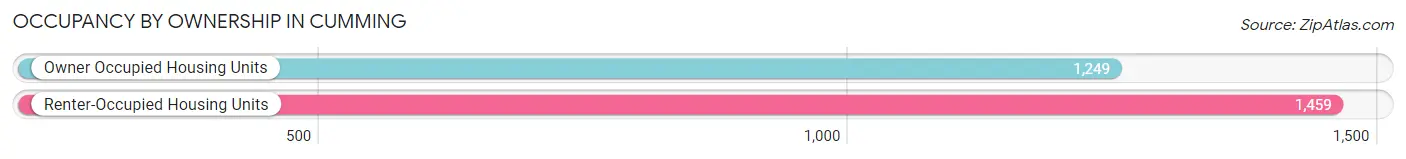
| Occupancy | # Housing Units | % Housing Units |
| Owner Occupied Housing Units | 1,249 | 46.1% |
| Renter-Occupied Housing Units | 1,459 | 53.9% |
| Total Occupied Housing Units | 2,708 | 100.0% |
Occupancy by Household Size in Cumming
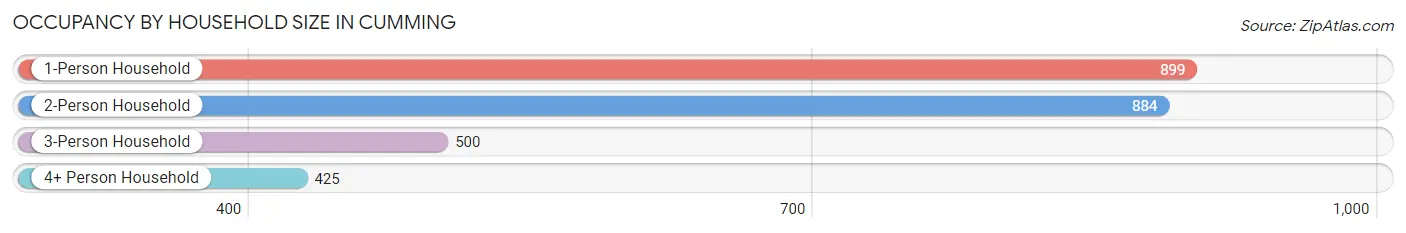
| Household Size | # Housing Units | % Housing Units |
| 1-Person Household | 899 | 33.2% |
| 2-Person Household | 884 | 32.6% |
| 3-Person Household | 500 | 18.5% |
| 4+ Person Household | 425 | 15.7% |
| Total Housing Units | 2,708 | 100.0% |
Occupancy by Ownership by Household Size in Cumming
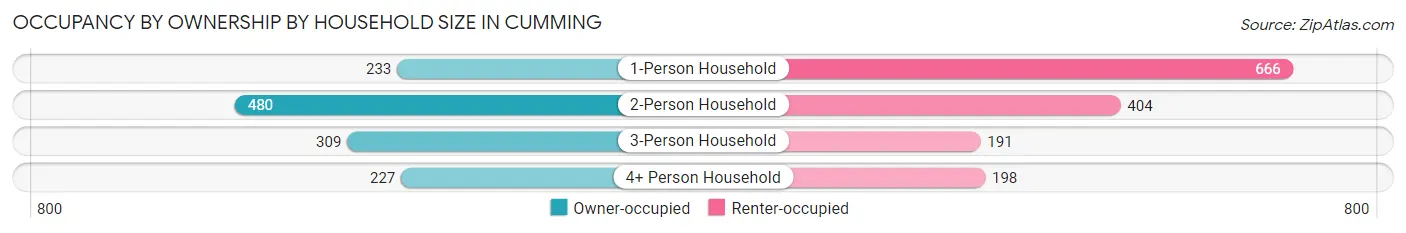
| Household Size | Owner-occupied | Renter-occupied |
| 1-Person Household | 233 (25.9%) | 666 (74.1%) |
| 2-Person Household | 480 (54.3%) | 404 (45.7%) |
| 3-Person Household | 309 (61.8%) | 191 (38.2%) |
| 4+ Person Household | 227 (53.4%) | 198 (46.6%) |
| Total Housing Units | 1,249 (46.1%) | 1,459 (53.9%) |
Occupancy by Educational Attainment in Cumming
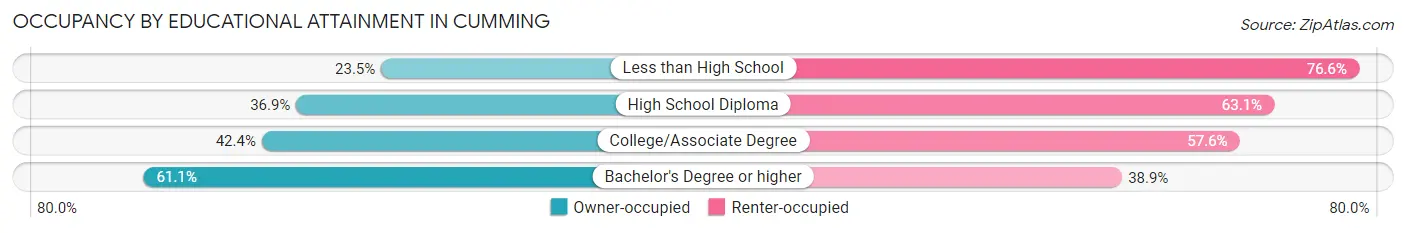
| Household Size | Owner-occupied | Renter-occupied |
| Less than High School | 72 (23.4%) | 235 (76.5%) |
| High School Diploma | 192 (36.9%) | 328 (63.1%) |
| College/Associate Degree | 373 (42.4%) | 507 (57.6%) |
| Bachelor's Degree or higher | 612 (61.1%) | 389 (38.9%) |
Occupancy by Age of Householder in Cumming
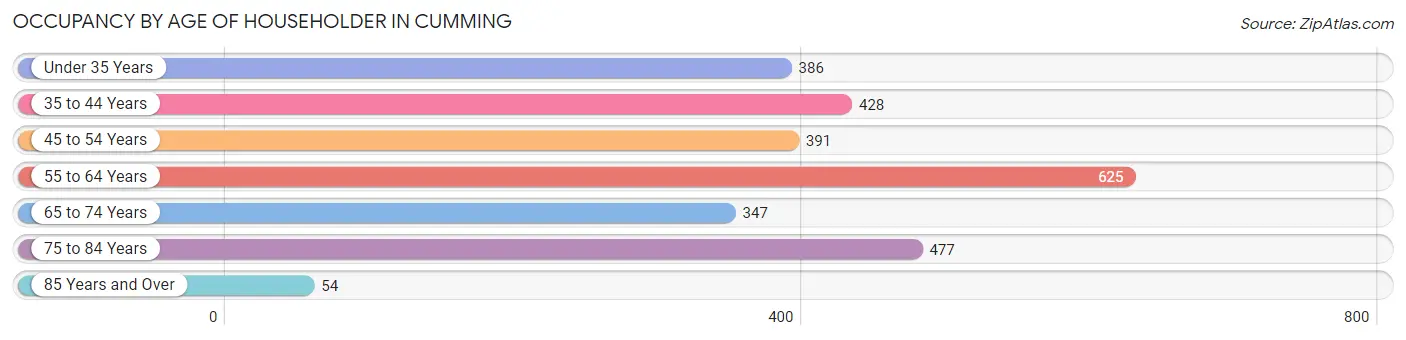
| Age Bracket | # Households | % Households |
| Under 35 Years | 386 | 14.2% |
| 35 to 44 Years | 428 | 15.8% |
| 45 to 54 Years | 391 | 14.4% |
| 55 to 64 Years | 625 | 23.1% |
| 65 to 74 Years | 347 | 12.8% |
| 75 to 84 Years | 477 | 17.6% |
| 85 Years and Over | 54 | 2.0% |
| Total | 2,708 | 100.0% |
Housing Finances in Cumming
Median Income by Occupancy in Cumming
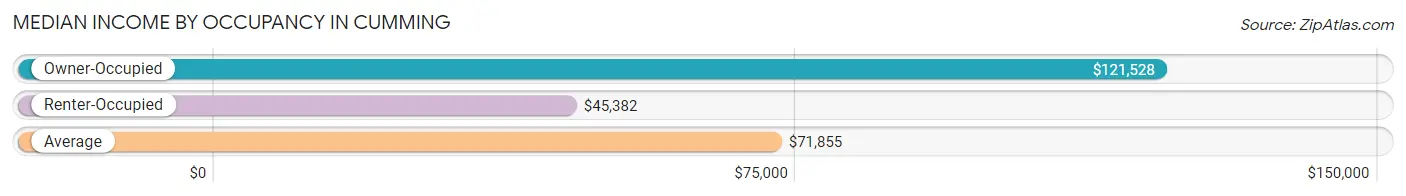
| Occupancy Type | # Households | Median Income |
| Owner-Occupied | 1,249 (46.1%) | $121,528 |
| Renter-Occupied | 1,459 (53.9%) | $45,382 |
| Average | 2,708 (100.0%) | $71,855 |
Occupancy by Householder Income Bracket in Cumming
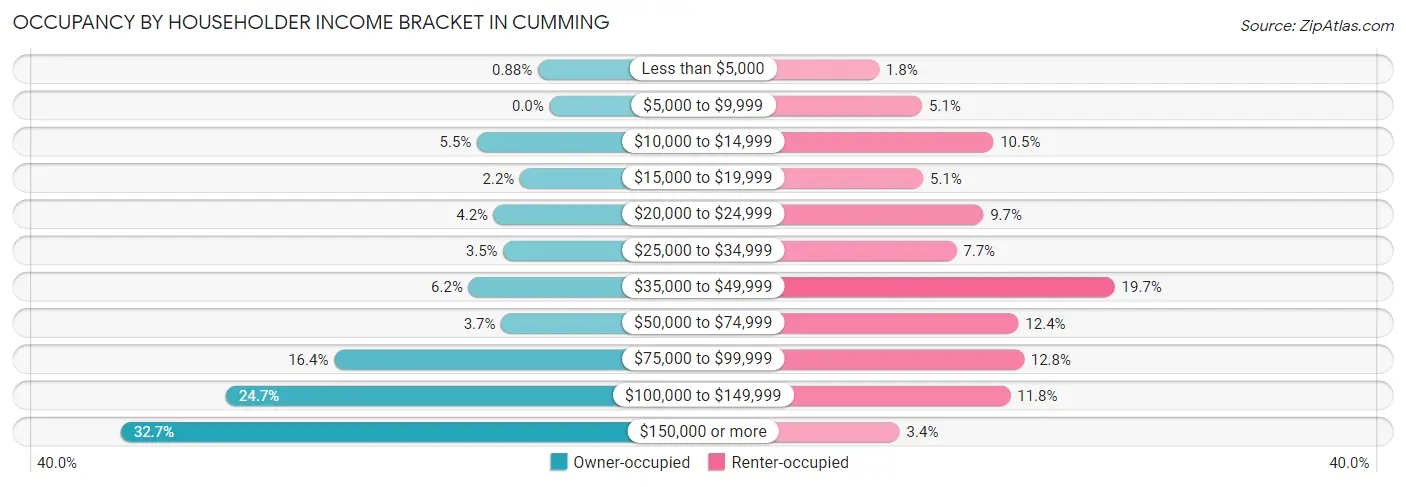
| Income Bracket | Owner-occupied | Renter-occupied |
| Less than $5,000 | 11 (0.9%) | 26 (1.8%) |
| $5,000 to $9,999 | 0 (0.0%) | 74 (5.1%) |
| $10,000 to $14,999 | 69 (5.5%) | 153 (10.5%) |
| $15,000 to $19,999 | 28 (2.2%) | 75 (5.1%) |
| $20,000 to $24,999 | 53 (4.2%) | 142 (9.7%) |
| $25,000 to $34,999 | 44 (3.5%) | 112 (7.7%) |
| $35,000 to $49,999 | 77 (6.2%) | 288 (19.7%) |
| $50,000 to $74,999 | 46 (3.7%) | 181 (12.4%) |
| $75,000 to $99,999 | 205 (16.4%) | 187 (12.8%) |
| $100,000 to $149,999 | 308 (24.7%) | 172 (11.8%) |
| $150,000 or more | 408 (32.7%) | 49 (3.4%) |
| Total | 1,249 (100.0%) | 1,459 (100.0%) |
Monthly Housing Cost Tiers in Cumming
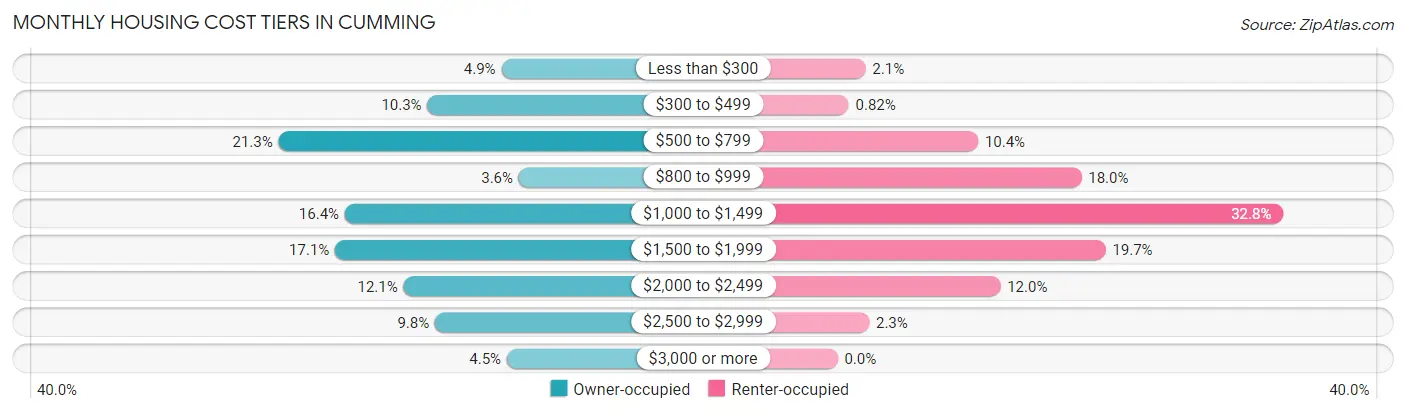
| Monthly Cost | Owner-occupied | Renter-occupied |
| Less than $300 | 61 (4.9%) | 30 (2.1%) |
| $300 to $499 | 129 (10.3%) | 12 (0.8%) |
| $500 to $799 | 266 (21.3%) | 151 (10.3%) |
| $800 to $999 | 45 (3.6%) | 262 (18.0%) |
| $1,000 to $1,499 | 205 (16.4%) | 479 (32.8%) |
| $1,500 to $1,999 | 214 (17.1%) | 288 (19.7%) |
| $2,000 to $2,499 | 151 (12.1%) | 175 (12.0%) |
| $2,500 to $2,999 | 122 (9.8%) | 34 (2.3%) |
| $3,000 or more | 56 (4.5%) | 0 (0.0%) |
| Total | 1,249 (100.0%) | 1,459 (100.0%) |
Physical Housing Characteristics in Cumming
Housing Structures in Cumming
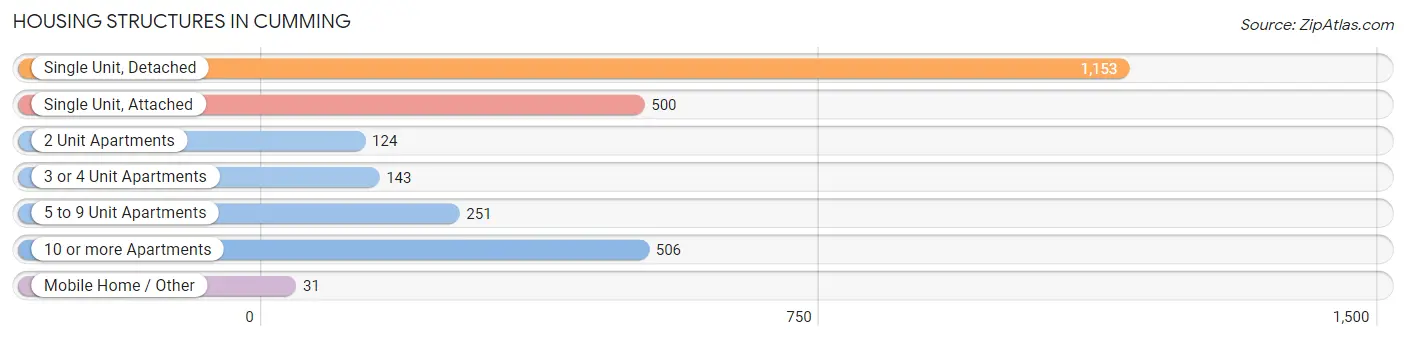
| Structure Type | # Housing Units | % Housing Units |
| Single Unit, Detached | 1,153 | 42.6% |
| Single Unit, Attached | 500 | 18.5% |
| 2 Unit Apartments | 124 | 4.6% |
| 3 or 4 Unit Apartments | 143 | 5.3% |
| 5 to 9 Unit Apartments | 251 | 9.3% |
| 10 or more Apartments | 506 | 18.7% |
| Mobile Home / Other | 31 | 1.1% |
| Total | 2,708 | 100.0% |
Housing Structures by Occupancy in Cumming
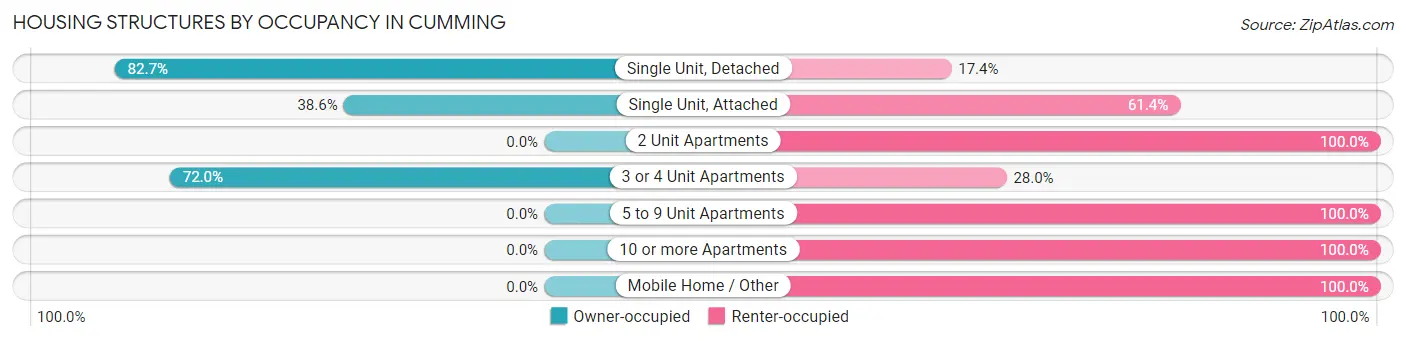
| Structure Type | Owner-occupied | Renter-occupied |
| Single Unit, Detached | 953 (82.7%) | 200 (17.3%) |
| Single Unit, Attached | 193 (38.6%) | 307 (61.4%) |
| 2 Unit Apartments | 0 (0.0%) | 124 (100.0%) |
| 3 or 4 Unit Apartments | 103 (72.0%) | 40 (28.0%) |
| 5 to 9 Unit Apartments | 0 (0.0%) | 251 (100.0%) |
| 10 or more Apartments | 0 (0.0%) | 506 (100.0%) |
| Mobile Home / Other | 0 (0.0%) | 31 (100.0%) |
| Total | 1,249 (46.1%) | 1,459 (53.9%) |
Housing Structures by Number of Rooms in Cumming
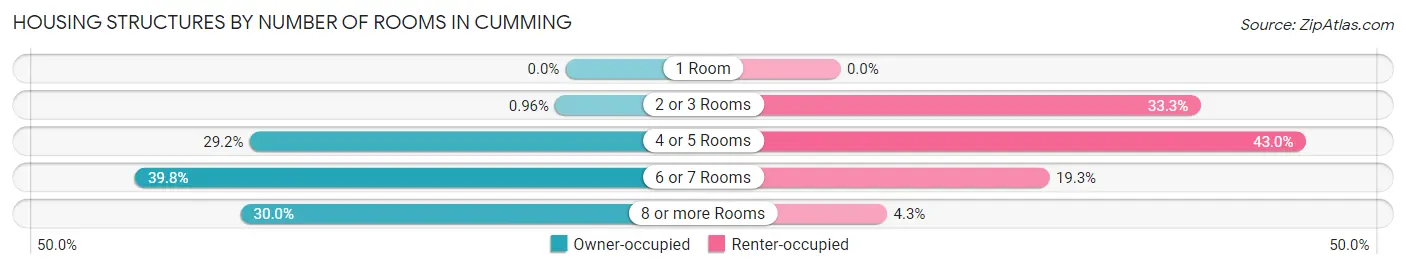
| Number of Rooms | Owner-occupied | Renter-occupied |
| 1 Room | 0 (0.0%) | 0 (0.0%) |
| 2 or 3 Rooms | 12 (1.0%) | 486 (33.3%) |
| 4 or 5 Rooms | 365 (29.2%) | 628 (43.0%) |
| 6 or 7 Rooms | 497 (39.8%) | 282 (19.3%) |
| 8 or more Rooms | 375 (30.0%) | 63 (4.3%) |
| Total | 1,249 (100.0%) | 1,459 (100.0%) |
Housing Structure by Heating Type in Cumming
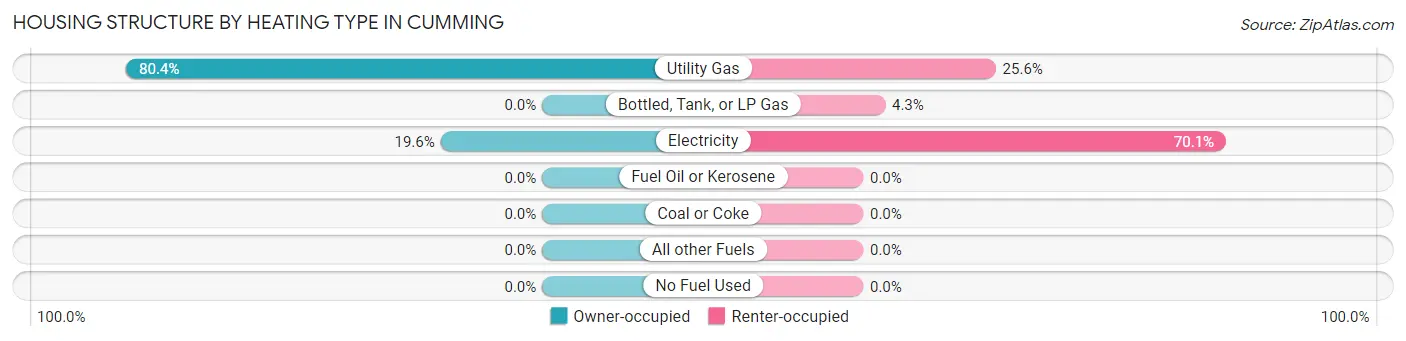
| Heating Type | Owner-occupied | Renter-occupied |
| Utility Gas | 1,004 (80.4%) | 374 (25.6%) |
| Bottled, Tank, or LP Gas | 0 (0.0%) | 62 (4.3%) |
| Electricity | 245 (19.6%) | 1,023 (70.1%) |
| Fuel Oil or Kerosene | 0 (0.0%) | 0 (0.0%) |
| Coal or Coke | 0 (0.0%) | 0 (0.0%) |
| All other Fuels | 0 (0.0%) | 0 (0.0%) |
| No Fuel Used | 0 (0.0%) | 0 (0.0%) |
| Total | 1,249 (100.0%) | 1,459 (100.0%) |
Household Vehicle Usage in Cumming
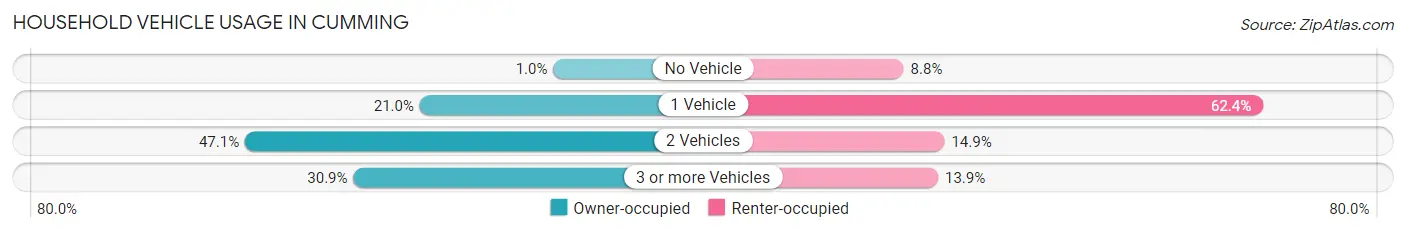
| Vehicles per Household | Owner-occupied | Renter-occupied |
| No Vehicle | 13 (1.0%) | 128 (8.8%) |
| 1 Vehicle | 262 (21.0%) | 911 (62.4%) |
| 2 Vehicles | 588 (47.1%) | 217 (14.9%) |
| 3 or more Vehicles | 386 (30.9%) | 203 (13.9%) |
| Total | 1,249 (100.0%) | 1,459 (100.0%) |
Real Estate & Mortgages in Cumming
Real Estate and Mortgage Overview in Cumming
| Characteristic | Without Mortgage | With Mortgage |
| Housing Units | 479 | 770 |
| Median Property Value | $306,200 | $358,600 |
| Median Household Income | - | - |
| Monthly Housing Costs | $614 | $56 |
| Real Estate Taxes | $2,003 | $0 |
Property Value by Mortgage Status in Cumming
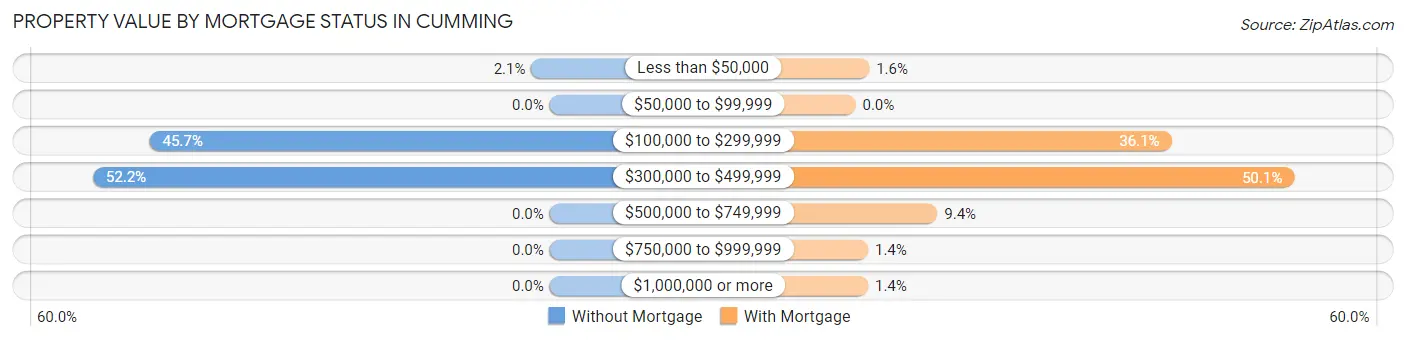
| Property Value | Without Mortgage | With Mortgage |
| Less than $50,000 | 10 (2.1%) | 12 (1.6%) |
| $50,000 to $99,999 | 0 (0.0%) | 0 (0.0%) |
| $100,000 to $299,999 | 219 (45.7%) | 278 (36.1%) |
| $300,000 to $499,999 | 250 (52.2%) | 386 (50.1%) |
| $500,000 to $749,999 | 0 (0.0%) | 72 (9.3%) |
| $750,000 to $999,999 | 0 (0.0%) | 11 (1.4%) |
| $1,000,000 or more | 0 (0.0%) | 11 (1.4%) |
| Total | 479 (100.0%) | 770 (100.0%) |
Household Income by Mortgage Status in Cumming
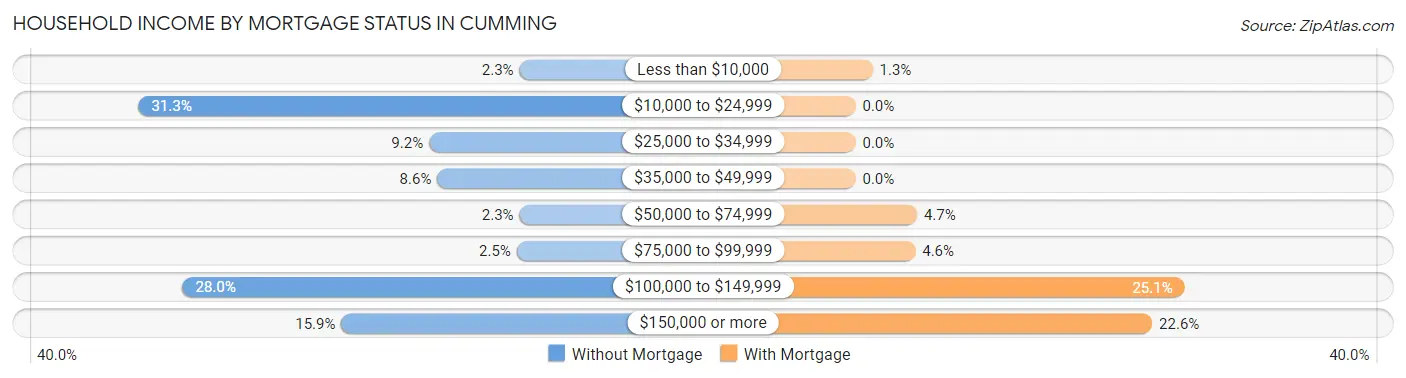
| Household Income | Without Mortgage | With Mortgage |
| Less than $10,000 | 11 (2.3%) | 10 (1.3%) |
| $10,000 to $24,999 | 150 (31.3%) | 0 (0.0%) |
| $25,000 to $34,999 | 44 (9.2%) | 0 (0.0%) |
| $35,000 to $49,999 | 41 (8.6%) | 0 (0.0%) |
| $50,000 to $74,999 | 11 (2.3%) | 36 (4.7%) |
| $75,000 to $99,999 | 12 (2.5%) | 35 (4.5%) |
| $100,000 to $149,999 | 134 (28.0%) | 193 (25.1%) |
| $150,000 or more | 76 (15.9%) | 174 (22.6%) |
| Total | 479 (100.0%) | 770 (100.0%) |
Property Value to Household Income Ratio in Cumming
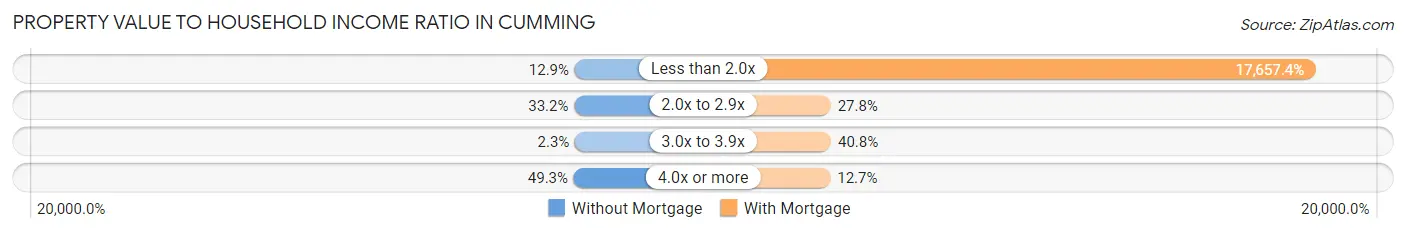
| Value-to-Income Ratio | Without Mortgage | With Mortgage |
| Less than 2.0x | 62 (12.9%) | 135,962 (17,657.4%) |
| 2.0x to 2.9x | 159 (33.2%) | 214 (27.8%) |
| 3.0x to 3.9x | 11 (2.3%) | 314 (40.8%) |
| 4.0x or more | 236 (49.3%) | 98 (12.7%) |
| Total | 479 (100.0%) | 770 (100.0%) |
Real Estate Taxes by Mortgage Status in Cumming
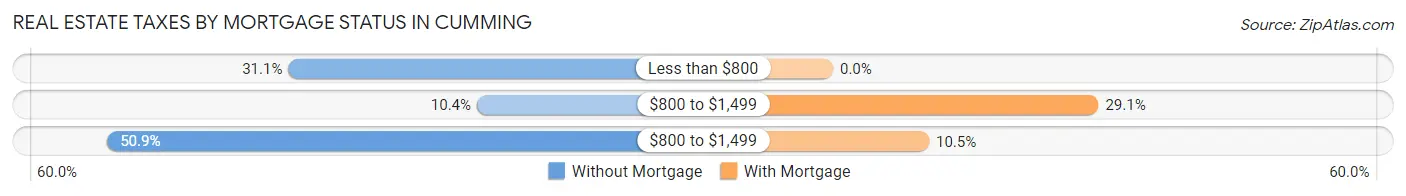
| Property Taxes | Without Mortgage | With Mortgage |
| Less than $800 | 149 (31.1%) | 0 (0.0%) |
| $800 to $1,499 | 50 (10.4%) | 224 (29.1%) |
| $800 to $1,499 | 244 (50.9%) | 81 (10.5%) |
| Total | 479 (100.0%) | 770 (100.0%) |
Health & Disability in Cumming
Health Insurance Coverage by Age in Cumming
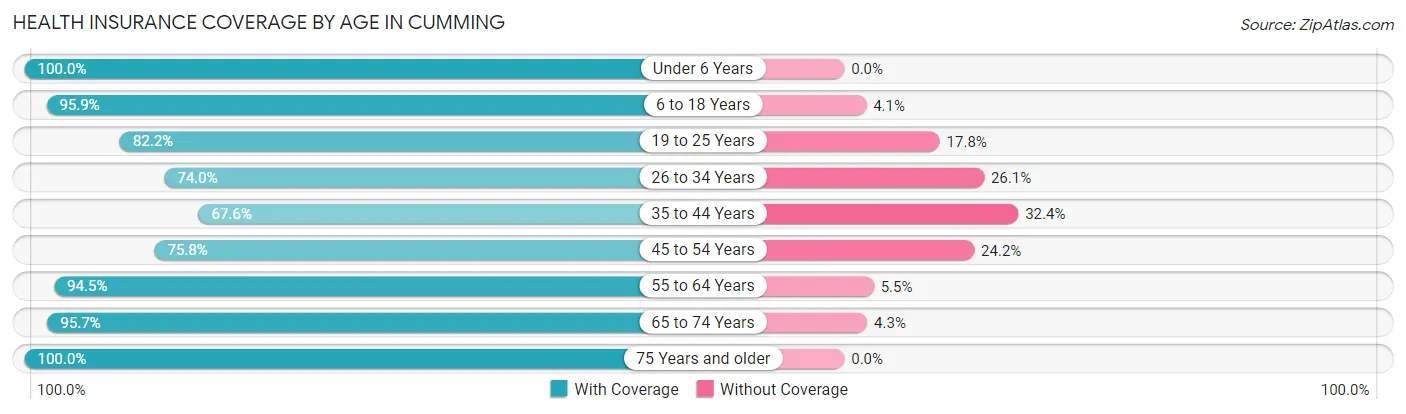
| Age Bracket | With Coverage | Without Coverage |
| Under 6 Years | 411 (100.0%) | 0 (0.0%) |
| 6 to 18 Years | 729 (95.9%) | 31 (4.1%) |
| 19 to 25 Years | 911 (82.2%) | 197 (17.8%) |
| 26 to 34 Years | 511 (74.0%) | 180 (26.1%) |
| 35 to 44 Years | 581 (67.6%) | 279 (32.4%) |
| 45 to 54 Years | 657 (75.8%) | 210 (24.2%) |
| 55 to 64 Years | 774 (94.5%) | 45 (5.5%) |
| 65 to 74 Years | 539 (95.7%) | 24 (4.3%) |
| 75 Years and older | 788 (100.0%) | 0 (0.0%) |
| Total | 5,901 (85.9%) | 966 (14.1%) |
Health Insurance Coverage by Citizenship Status in Cumming
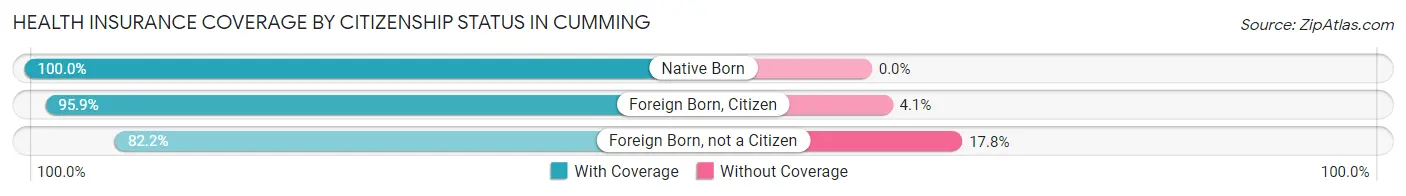
| Citizenship Status | With Coverage | Without Coverage |
| Native Born | 411 (100.0%) | 0 (0.0%) |
| Foreign Born, Citizen | 729 (95.9%) | 31 (4.1%) |
| Foreign Born, not a Citizen | 911 (82.2%) | 197 (17.8%) |
Health Insurance Coverage by Household Income in Cumming
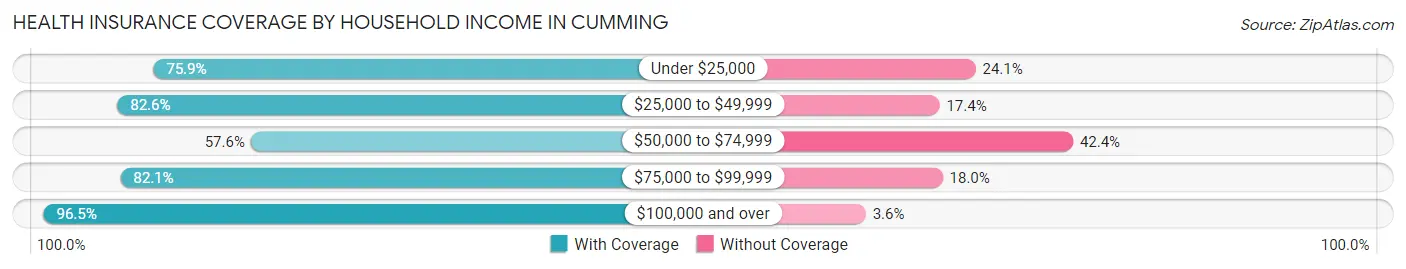
| Household Income | With Coverage | Without Coverage |
| Under $25,000 | 922 (75.9%) | 293 (24.1%) |
| $25,000 to $49,999 | 780 (82.6%) | 164 (17.4%) |
| $50,000 to $74,999 | 306 (57.6%) | 225 (42.4%) |
| $75,000 to $99,999 | 672 (82.1%) | 147 (17.9%) |
| $100,000 and over | 3,154 (96.5%) | 116 (3.5%) |
Public vs Private Health Insurance Coverage by Age in Cumming
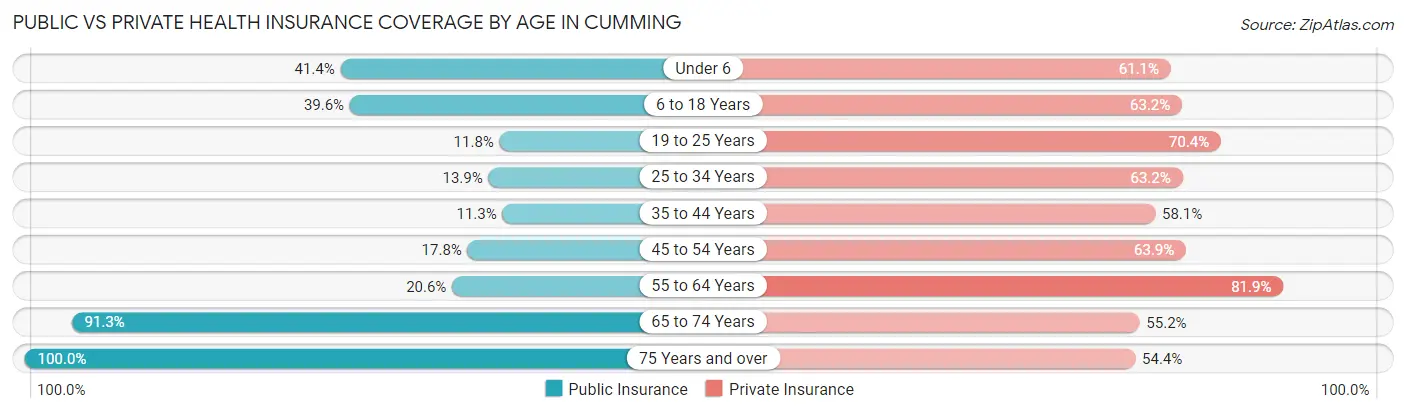
| Age Bracket | Public Insurance | Private Insurance |
| Under 6 | 170 (41.4%) | 251 (61.1%) |
| 6 to 18 Years | 301 (39.6%) | 480 (63.2%) |
| 19 to 25 Years | 131 (11.8%) | 780 (70.4%) |
| 25 to 34 Years | 96 (13.9%) | 437 (63.2%) |
| 35 to 44 Years | 97 (11.3%) | 500 (58.1%) |
| 45 to 54 Years | 154 (17.8%) | 554 (63.9%) |
| 55 to 64 Years | 169 (20.6%) | 671 (81.9%) |
| 65 to 74 Years | 514 (91.3%) | 311 (55.2%) |
| 75 Years and over | 788 (100.0%) | 429 (54.4%) |
| Total | 2,420 (35.2%) | 4,413 (64.3%) |
Disability Status by Sex by Age in Cumming
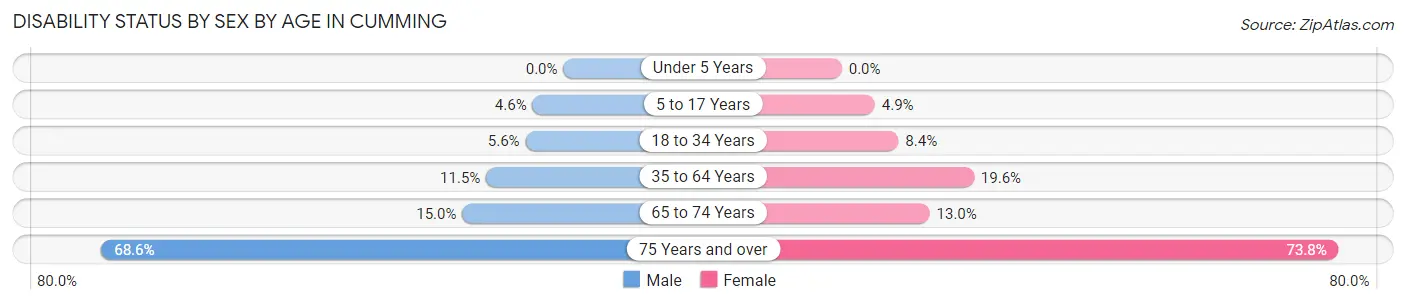
| Age Bracket | Male | Female |
| Under 5 Years | 0 (0.0%) | 0 (0.0%) |
| 5 to 17 Years | 21 (4.6%) | 13 (4.9%) |
| 18 to 34 Years | 52 (5.6%) | 78 (8.4%) |
| 35 to 64 Years | 137 (11.5%) | 265 (19.6%) |
| 65 to 74 Years | 12 (15.0%) | 63 (13.0%) |
| 75 Years and over | 177 (68.6%) | 391 (73.8%) |
Disability Class by Sex by Age in Cumming
Disability Class: Hearing Difficulty
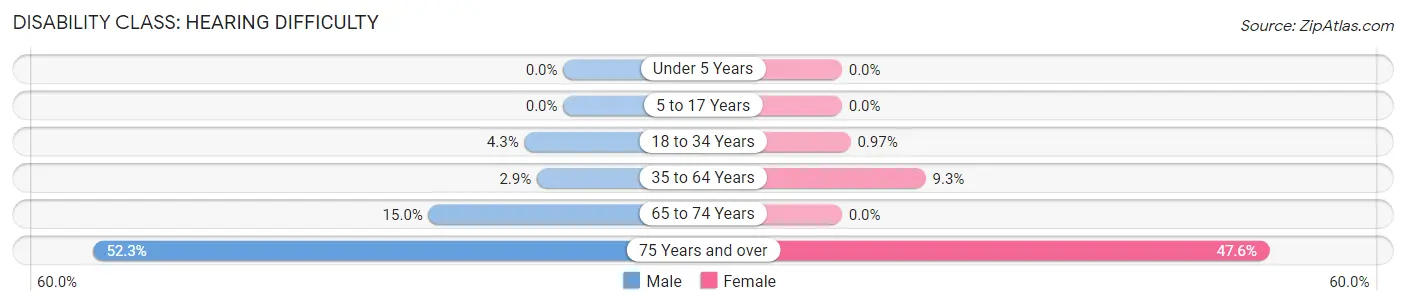
| Age Bracket | Male | Female |
| Under 5 Years | 0 (0.0%) | 0 (0.0%) |
| 5 to 17 Years | 0 (0.0%) | 0 (0.0%) |
| 18 to 34 Years | 40 (4.3%) | 9 (1.0%) |
| 35 to 64 Years | 35 (2.9%) | 126 (9.3%) |
| 65 to 74 Years | 12 (15.0%) | 0 (0.0%) |
| 75 Years and over | 135 (52.3%) | 252 (47.5%) |
Disability Class: Vision Difficulty
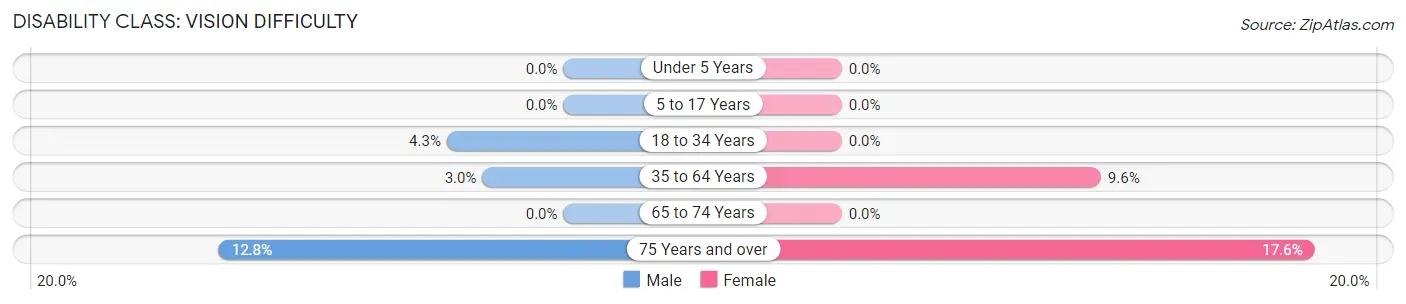
| Age Bracket | Male | Female |
| Under 5 Years | 0 (0.0%) | 0 (0.0%) |
| 5 to 17 Years | 0 (0.0%) | 0 (0.0%) |
| 18 to 34 Years | 40 (4.3%) | 0 (0.0%) |
| 35 to 64 Years | 36 (3.0%) | 130 (9.6%) |
| 65 to 74 Years | 0 (0.0%) | 0 (0.0%) |
| 75 Years and over | 33 (12.8%) | 93 (17.5%) |
Disability Class: Cognitive Difficulty
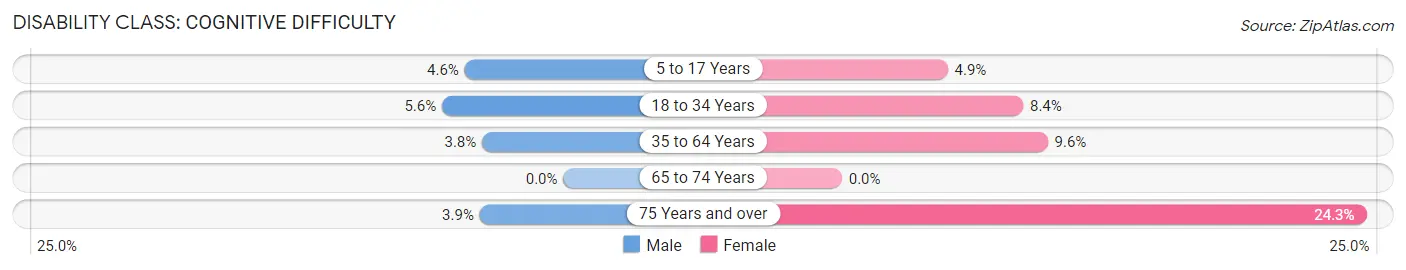
| Age Bracket | Male | Female |
| 5 to 17 Years | 21 (4.6%) | 13 (4.9%) |
| 18 to 34 Years | 52 (5.6%) | 78 (8.4%) |
| 35 to 64 Years | 45 (3.8%) | 129 (9.6%) |
| 65 to 74 Years | 0 (0.0%) | 0 (0.0%) |
| 75 Years and over | 10 (3.9%) | 129 (24.3%) |
Disability Class: Ambulatory Difficulty
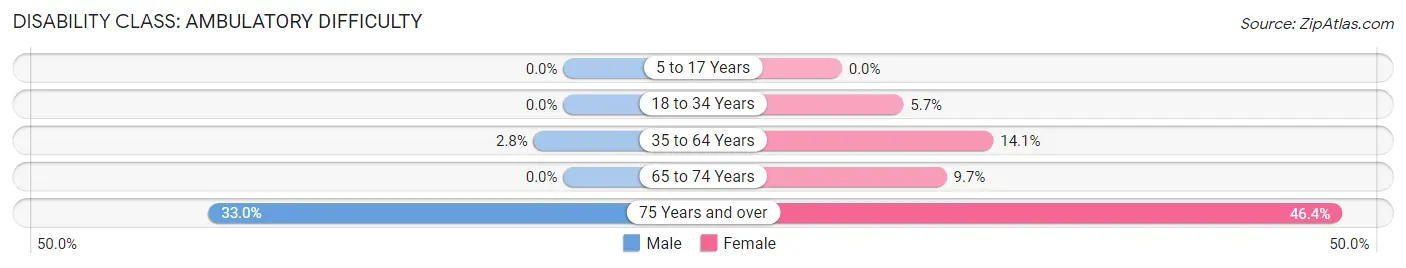
| Age Bracket | Male | Female |
| 5 to 17 Years | 0 (0.0%) | 0 (0.0%) |
| 18 to 34 Years | 0 (0.0%) | 53 (5.7%) |
| 35 to 64 Years | 33 (2.8%) | 190 (14.1%) |
| 65 to 74 Years | 0 (0.0%) | 47 (9.7%) |
| 75 Years and over | 85 (33.0%) | 246 (46.4%) |
Disability Class: Self-Care Difficulty
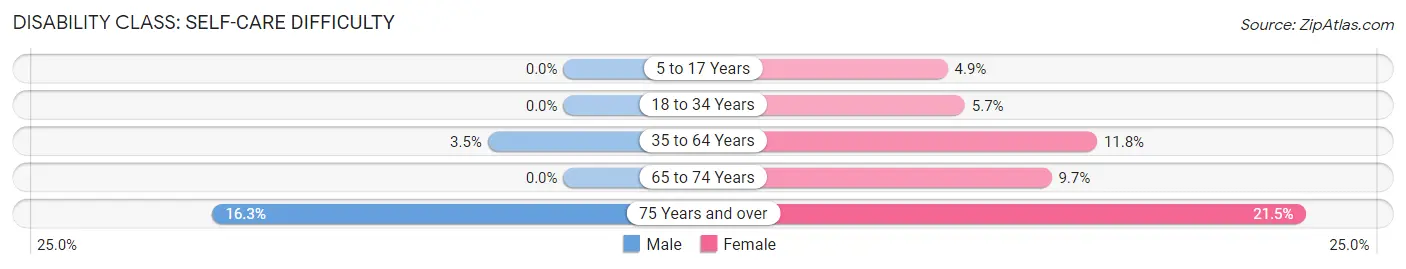
| Age Bracket | Male | Female |
| 5 to 17 Years | 0 (0.0%) | 13 (4.9%) |
| 18 to 34 Years | 0 (0.0%) | 53 (5.7%) |
| 35 to 64 Years | 42 (3.5%) | 160 (11.8%) |
| 65 to 74 Years | 0 (0.0%) | 47 (9.7%) |
| 75 Years and over | 42 (16.3%) | 114 (21.5%) |
Technology Access in Cumming
Computing Device Access in Cumming
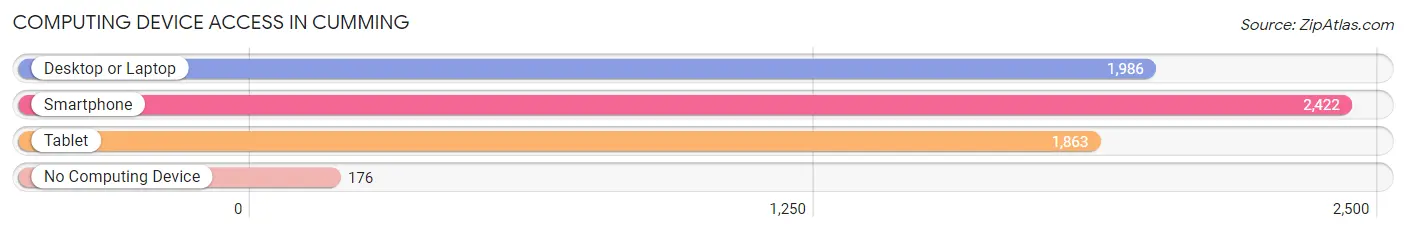
| Device Type | # Households | % Households |
| Desktop or Laptop | 1,986 | 73.3% |
| Smartphone | 2,422 | 89.4% |
| Tablet | 1,863 | 68.8% |
| No Computing Device | 176 | 6.5% |
| Total | 2,708 | 100.0% |
Internet Access in Cumming
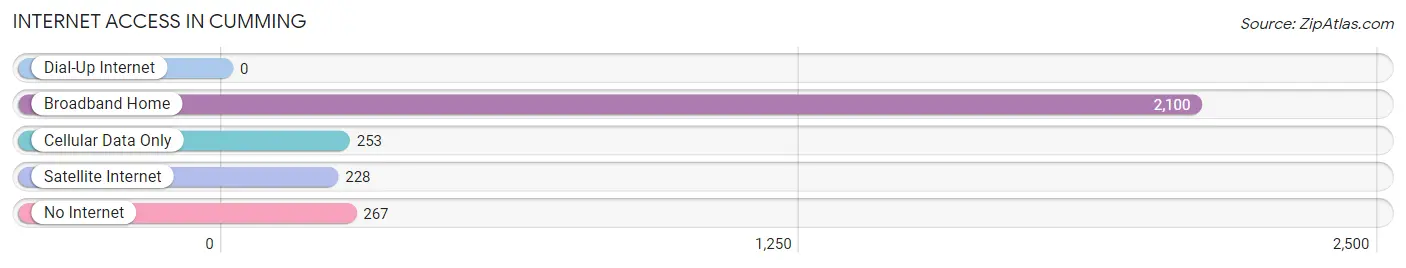
| Internet Type | # Households | % Households |
| Dial-Up Internet | 0 | 0.0% |
| Broadband Home | 2,100 | 77.5% |
| Cellular Data Only | 253 | 9.3% |
| Satellite Internet | 228 | 8.4% |
| No Internet | 267 | 9.9% |
| Total | 2,708 | 100.0% |
Cumming Summary
Cumming, Georgia is a city located in Forsyth County, Georgia, United States. It is a suburb of Atlanta and part of the Atlanta metropolitan area. The population was 5,430 at the 2010 census, making it one of the fastest growing cities in the state.
History
Cumming was founded in 1834 by William Cumming, a settler from England. The city was named after him. The city was originally called Vann's Valley, after a local Cherokee chief. The city was incorporated in 1845 and was the county seat of Forsyth County until 1871, when the county seat was moved to nearby Cumming.
Geography
Cumming is located in the foothills of the Blue Ridge Mountains, about 35 miles north of Atlanta. The city is situated in the center of Forsyth County, and is bordered by the cities of Alpharetta, Johns Creek, and Suwanee. The city is located along the Chattahoochee River, which provides recreational opportunities for residents.
Economy
Cumming is home to a variety of businesses, including retail, manufacturing, and healthcare. The city is home to several large employers, including Northside Hospital-Forsyth, Sawnee Electric Membership Corporation, and the Forsyth County Board of Education. The city is also home to several shopping centers, including The Collection at Forsyth, The Avenue Forsyth, and Cumming Marketplace.
Demographics
As of the 2010 census, there were 5,430 people, 2,072 households, and 1,521 families residing in the city. The population density was 1,717.3 people per square mile (662.2/km2). The racial makeup of the city was 87.2% White, 5.3% African American, 0.3% Native American, 3.2% Asian, 0.1% Pacific Islander, 1.7% from other races, and 2.4% from two or more races. Hispanic or Latino of any race were 5.3% of the population.
The median income for a household in the city was $60,938, and the median income for a family was $71,837. The per capita income for the city was $30,945. About 4.2% of families and 5.7% of the population were below the poverty line, including 7.2% of those under age 18 and 4.2% of those age 65 or over.
Cumming is a rapidly growing city, with a population that is expected to continue to increase in the coming years. The city is home to a diverse population, with a variety of businesses and recreational opportunities. With its close proximity to Atlanta, Cumming is an attractive option for those looking to live in a suburban setting while still having access to the amenities of a larger city.
Common Questions
What is Per Capita Income in Cumming?
Per Capita income in Cumming is $36,478.
What is the Median Family Income in Cumming?
Median Family Income in Cumming is $99,252.
What is the Median Household income in Cumming?
Median Household Income in Cumming is $71,855.
What is Income or Wage Gap in Cumming?
Income or Wage Gap in Cumming is 0.4%.
Women in Cumming earn 99.6 cents for every dollar earned by a man.
What is Inequality or Gini Index in Cumming?
Inequality or Gini Index in Cumming is 0.48.
What is the Total Population of Cumming?
Total Population of Cumming is 7,371.
What is the Total Male Population of Cumming?
Total Male Population of Cumming is 3,541.
What is the Total Female Population of Cumming?
Total Female Population of Cumming is 3,830.
What is the Ratio of Males per 100 Females in Cumming?
There are 92.45 Males per 100 Females in Cumming.
What is the Ratio of Females per 100 Males in Cumming?
There are 108.16 Females per 100 Males in Cumming.
What is the Median Population Age in Cumming?
Median Population Age in Cumming is 40.9 Years.
What is the Average Family Size in Cumming
Average Family Size in Cumming is 3.1 People.
What is the Average Household Size in Cumming
Average Household Size in Cumming is 2.5 People.
How Large is the Labor Force in Cumming?
There are 3,674 People in the Labor Forcein in Cumming.
What is the Percentage of People in the Labor Force in Cumming?
58.4% of People are in the Labor Force in Cumming.
What is the Unemployment Rate in Cumming?
Unemployment Rate in Cumming is 4.8%.