Bradford, AR Map & Demographics
Bradford Map
Bradford Overview
$19,858
PER CAPITA INCOME
$45,000
AVG FAMILY INCOME
$28,333
AVG HOUSEHOLD INCOME
0.3%
WAGE / INCOME GAP [ % ]
99.7¢/ $1
WAGE / INCOME GAP [ $ ]
0.52
INEQUALITY / GINI INDEX
553
TOTAL POPULATION
272
MALE POPULATION
281
FEMALE POPULATION
96.80
MALES / 100 FEMALES
103.31
FEMALES / 100 MALES
34.6
MEDIAN AGE
2.9
AVG FAMILY SIZE
2.4
AVG HOUSEHOLD SIZE
196
LABOR FORCE [ PEOPLE ]
48.0%
PERCENT IN LABOR FORCE
7.1%
UNEMPLOYMENT RATE
Bradford Zip Codes
Bradford Area Codes
Income in Bradford
Income Overview in Bradford
Per Capita Income in Bradford is $19,858, while median incomes of families and households are $45,000 and $28,333 respectively.
| Characteristic | Number | Measure |
| Per Capita Income | 553 | $19,858 |
| Median Family Income | 144 | $45,000 |
| Mean Family Income | 144 | $57,525 |
| Median Household Income | 232 | $28,333 |
| Mean Household Income | 232 | $45,891 |
| Income Deficit | 144 | $0 |
| Wage / Income Gap (%) | 553 | 0.28% |
| Wage / Income Gap ($) | 553 | 99.72¢ per $1 |
| Gini / Inequality Index | 553 | 0.52 |
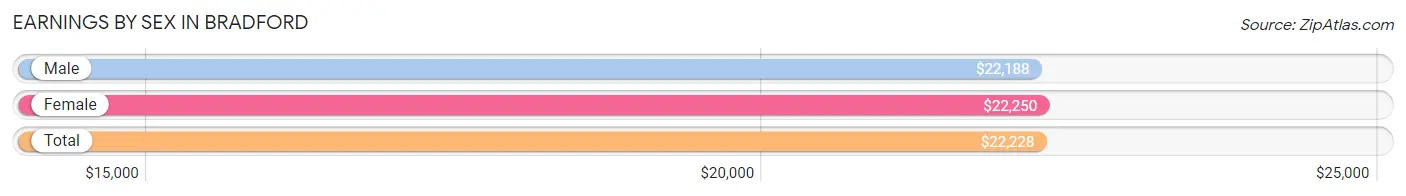
Earnings by Sex in Bradford
Average Earnings in Bradford are $22,228, $22,188 for men and $22,250 for women, a difference of 0.3%.
| Sex | Number | Average Earnings |
| Male | 102 (44.9%) | $22,188 |
| Female | 125 (55.1%) | $22,250 |
| Total | 227 (100.0%) | $22,228 |
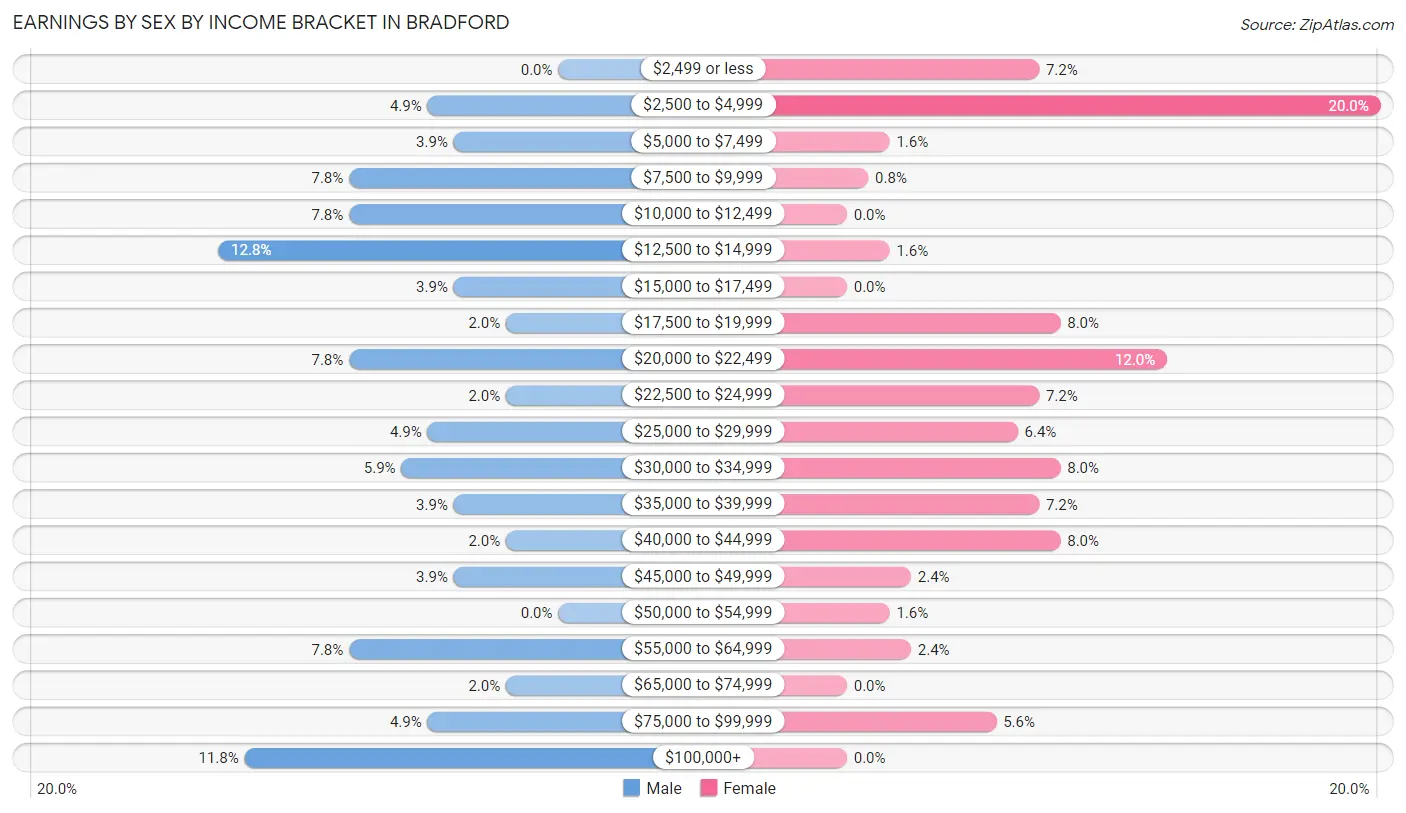
Earnings by Sex by Income Bracket in Bradford
The most common earnings brackets in Bradford are $12,500 to $14,999 for men (13 | 12.8%) and $2,500 to $4,999 for women (25 | 20.0%).
| Income | Male | Female |
| $2,499 or less | 0 (0.0%) | 9 (7.2%) |
| $2,500 to $4,999 | 5 (4.9%) | 25 (20.0%) |
| $5,000 to $7,499 | 4 (3.9%) | 2 (1.6%) |
| $7,500 to $9,999 | 8 (7.8%) | 1 (0.8%) |
| $10,000 to $12,499 | 8 (7.8%) | 0 (0.0%) |
| $12,500 to $14,999 | 13 (12.8%) | 2 (1.6%) |
| $15,000 to $17,499 | 4 (3.9%) | 0 (0.0%) |
| $17,500 to $19,999 | 2 (2.0%) | 10 (8.0%) |
| $20,000 to $22,499 | 8 (7.8%) | 15 (12.0%) |
| $22,500 to $24,999 | 2 (2.0%) | 9 (7.2%) |
| $25,000 to $29,999 | 5 (4.9%) | 8 (6.4%) |
| $30,000 to $34,999 | 6 (5.9%) | 10 (8.0%) |
| $35,000 to $39,999 | 4 (3.9%) | 9 (7.2%) |
| $40,000 to $44,999 | 2 (2.0%) | 10 (8.0%) |
| $45,000 to $49,999 | 4 (3.9%) | 3 (2.4%) |
| $50,000 to $54,999 | 0 (0.0%) | 2 (1.6%) |
| $55,000 to $64,999 | 8 (7.8%) | 3 (2.4%) |
| $65,000 to $74,999 | 2 (2.0%) | 0 (0.0%) |
| $75,000 to $99,999 | 5 (4.9%) | 7 (5.6%) |
| $100,000+ | 12 (11.8%) | 0 (0.0%) |
| Total | 102 (100.0%) | 125 (100.0%) |
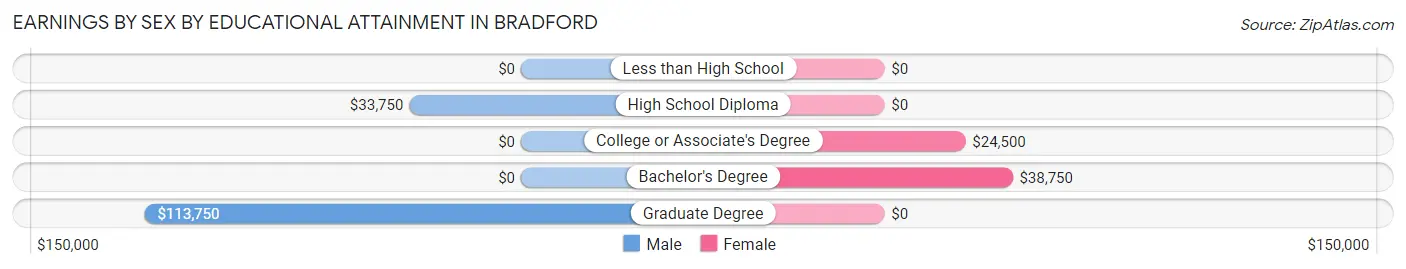
Earnings by Sex by Educational Attainment in Bradford
Average earnings in Bradford are $26,000 for men and $23,056 for women, a difference of 11.3%. Men with an educational attainment of graduate degree enjoy the highest average annual earnings of $113,750, while those with high school diploma education earn the least with $33,750. Women with an educational attainment of bachelor's degree earn the most with the average annual earnings of $38,750, while those with college or associate's degree education have the smallest earnings of $24,500.
| Educational Attainment | Male Income | Female Income |
| Less than High School | - | - |
| High School Diploma | $33,750 | $0 |
| College or Associate's Degree | - | - |
| Bachelor's Degree | - | - |
| Graduate Degree | $113,750 | $0 |
| Total | $26,000 | $23,056 |
Family Income in Bradford
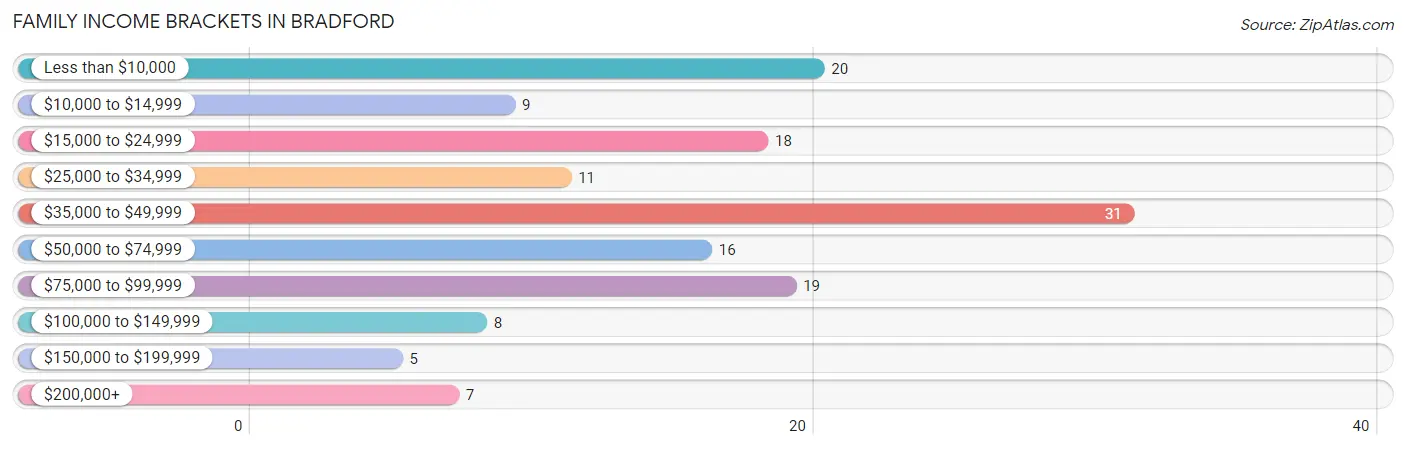
Family Income Brackets in Bradford
According to the Bradford family income data, there are 31 families falling into the $35,000 to $49,999 income range, which is the most common income bracket and makes up 21.5% of all families. Conversely, the $150,000 to $199,999 income bracket is the least frequent group with only 5 families (3.5%) belonging to this category.
| Income Bracket | # Families | % Families |
| Less than $10,000 | 20 | 13.9% |
| $10,000 to $14,999 | 9 | 6.3% |
| $15,000 to $24,999 | 18 | 12.5% |
| $25,000 to $34,999 | 11 | 7.6% |
| $35,000 to $49,999 | 31 | 21.5% |
| $50,000 to $74,999 | 16 | 11.1% |
| $75,000 to $99,999 | 19 | 13.2% |
| $100,000 to $149,999 | 8 | 5.6% |
| $150,000 to $199,999 | 5 | 3.5% |
| $200,000+ | 7 | 4.9% |
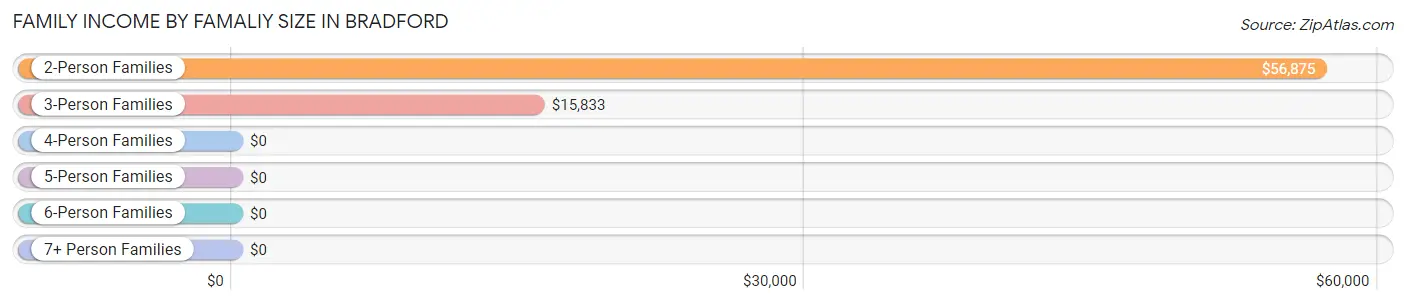
Family Income by Famaliy Size in Bradford
2-person families (65 | 45.1%) account for the highest median family income in Bradford with $56,875 per family, while 2-person families (65 | 45.1%) have the highest median income of $28,438 per family member.
| Income Bracket | # Families | Median Income |
| 2-Person Families | 65 (45.1%) | $56,875 |
| 3-Person Families | 52 (36.1%) | $15,833 |
| 4-Person Families | 7 (4.9%) | $0 |
| 5-Person Families | 6 (4.2%) | $0 |
| 6-Person Families | 11 (7.6%) | $0 |
| 7+ Person Families | 3 (2.1%) | $0 |
| Total | 144 (100.0%) | $45,000 |
Family Income by Number of Earners in Bradford
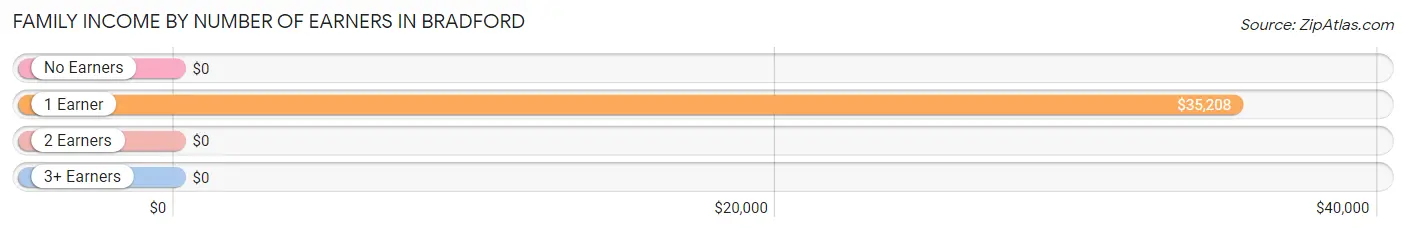
| Number of Earners | # Families | Median Income |
| No Earners | 27 (18.8%) | $0 |
| 1 Earner | 65 (45.1%) | $35,208 |
| 2 Earners | 39 (27.1%) | $0 |
| 3+ Earners | 13 (9.0%) | $0 |
| Total | 144 (100.0%) | $45,000 |
Household Income in Bradford
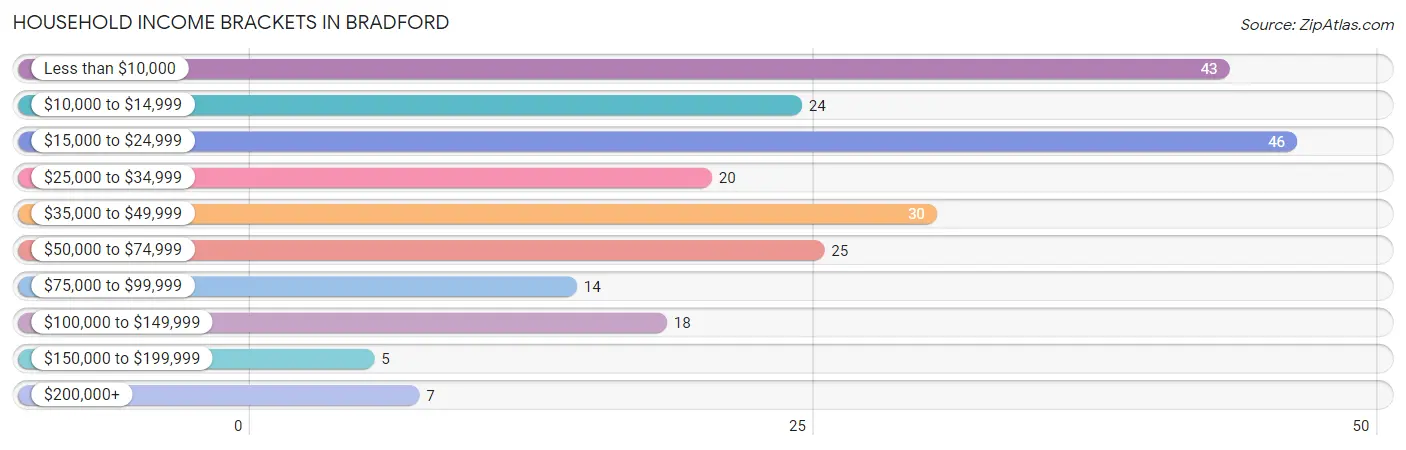
Household Income Brackets in Bradford
With 46 households falling in the category, the $15,000 to $24,999 income range is the most frequent in Bradford, accounting for 19.8% of all households. In contrast, only 5 households (2.2%) fall into the $150,000 to $199,999 income bracket, making it the least populous group.
| Income Bracket | # Households | % Households |
| Less than $10,000 | 43 | 18.5% |
| $10,000 to $14,999 | 24 | 10.3% |
| $15,000 to $24,999 | 46 | 19.8% |
| $25,000 to $34,999 | 20 | 8.6% |
| $35,000 to $49,999 | 30 | 12.9% |
| $50,000 to $74,999 | 25 | 10.8% |
| $75,000 to $99,999 | 14 | 6.0% |
| $100,000 to $149,999 | 18 | 7.8% |
| $150,000 to $199,999 | 5 | 2.2% |
| $200,000+ | 7 | 3.0% |
Household Income by Householder Age in Bradford
The median household income in Bradford is $28,333, with the highest median household income of $43,333 found in the 25 to 44 years age bracket for the primary householder. A total of 82 households (35.3%) fall into this category. Meanwhile, the 15 to 24 years age bracket for the primary householder has the lowest median household income of $0, with 10 households (4.3%) in this group.
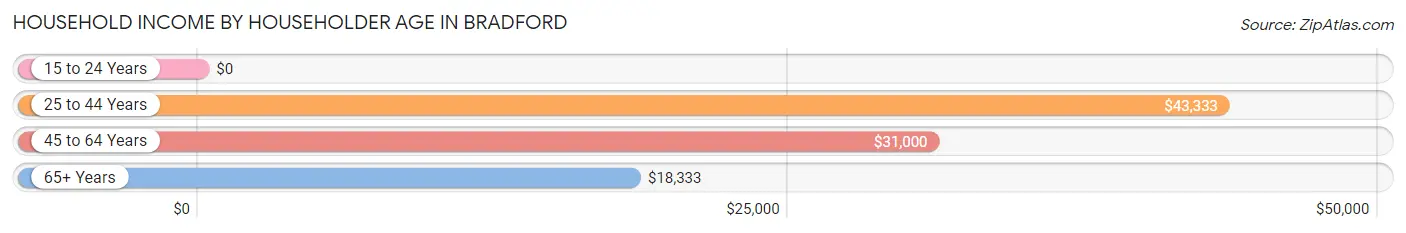
| Income Bracket | # Households | Median Income |
| 15 to 24 Years | 10 (4.3%) | $0 |
| 25 to 44 Years | 82 (35.3%) | $43,333 |
| 45 to 64 Years | 82 (35.3%) | $31,000 |
| 65+ Years | 58 (25.0%) | $18,333 |
| Total | 232 (100.0%) | $28,333 |
Poverty in Bradford
Income Below Poverty by Sex and Age in Bradford
With 24.3% poverty level for males and 40.9% for females among the residents of Bradford, 5 year old males and 12 to 14 year old females are the most vulnerable to poverty, with 13 males (76.5%) and 5 females (100.0%) in their respective age groups living below the poverty level.
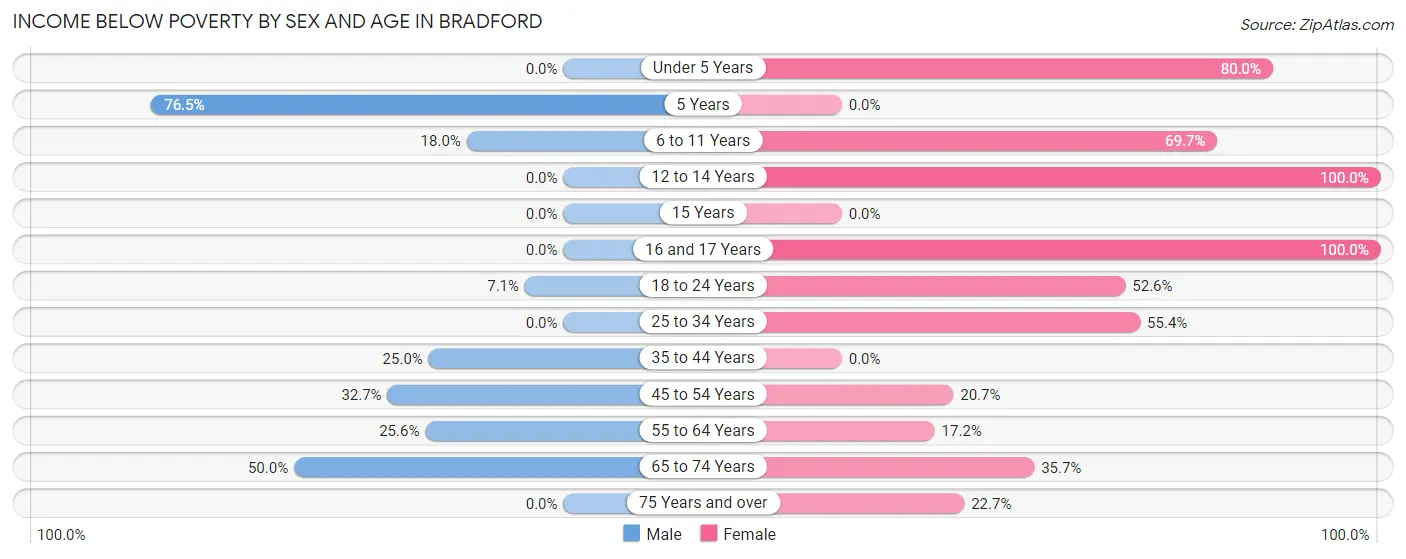
| Age Bracket | Male | Female |
| Under 5 Years | 0 (0.0%) | 12 (80.0%) |
| 5 Years | 13 (76.5%) | 0 (0.0%) |
| 6 to 11 Years | 7 (17.9%) | 23 (69.7%) |
| 12 to 14 Years | 0 (0.0%) | 5 (100.0%) |
| 15 Years | 0 (0.0%) | 0 (0.0%) |
| 16 and 17 Years | 0 (0.0%) | 3 (100.0%) |
| 18 to 24 Years | 1 (7.1%) | 10 (52.6%) |
| 25 to 34 Years | 0 (0.0%) | 36 (55.4%) |
| 35 to 44 Years | 5 (25.0%) | 0 (0.0%) |
| 45 to 54 Years | 16 (32.7%) | 6 (20.7%) |
| 55 to 64 Years | 10 (25.6%) | 5 (17.2%) |
| 65 to 74 Years | 14 (50.0%) | 10 (35.7%) |
| 75 Years and over | 0 (0.0%) | 5 (22.7%) |
| Total | 66 (24.3%) | 115 (40.9%) |
Income Above Poverty by Sex and Age in Bradford
According to the poverty statistics in Bradford, males aged under 5 years and females aged 5 years are the age groups that are most secure financially, with 100.0% of males and 100.0% of females in these age groups living above the poverty line.
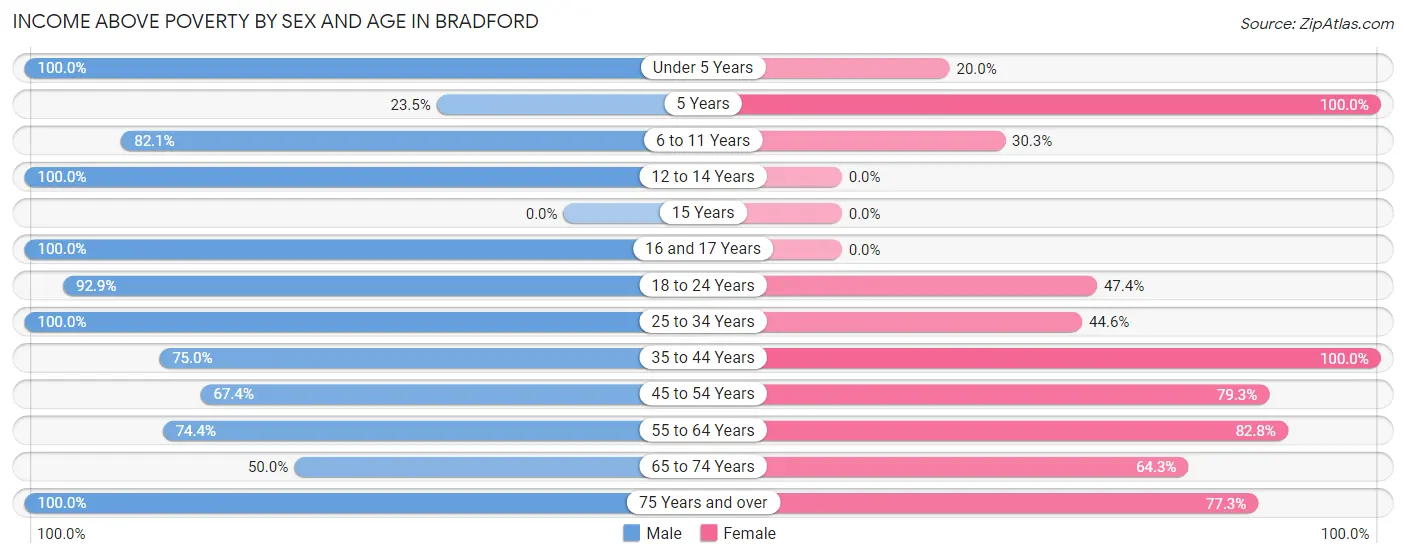
| Age Bracket | Male | Female |
| Under 5 Years | 9 (100.0%) | 3 (20.0%) |
| 5 Years | 4 (23.5%) | 8 (100.0%) |
| 6 to 11 Years | 32 (82.1%) | 10 (30.3%) |
| 12 to 14 Years | 19 (100.0%) | 0 (0.0%) |
| 15 Years | 0 (0.0%) | 0 (0.0%) |
| 16 and 17 Years | 5 (100.0%) | 0 (0.0%) |
| 18 to 24 Years | 13 (92.9%) | 9 (47.4%) |
| 25 to 34 Years | 31 (100.0%) | 29 (44.6%) |
| 35 to 44 Years | 15 (75.0%) | 25 (100.0%) |
| 45 to 54 Years | 33 (67.3%) | 23 (79.3%) |
| 55 to 64 Years | 29 (74.4%) | 24 (82.8%) |
| 65 to 74 Years | 14 (50.0%) | 18 (64.3%) |
| 75 Years and over | 2 (100.0%) | 17 (77.3%) |
| Total | 206 (75.7%) | 166 (59.1%) |
Income Below Poverty Among Married-Couple Families in Bradford
The poverty statistics for married-couple families in Bradford show that 4.3% or 3 of the total 70 families live below the poverty line. Families with no children have the highest poverty rate of 8.3%, comprising of 3 families. On the other hand, families with 1 or 2 children have the lowest poverty rate of 0.0%, which includes 0 families.
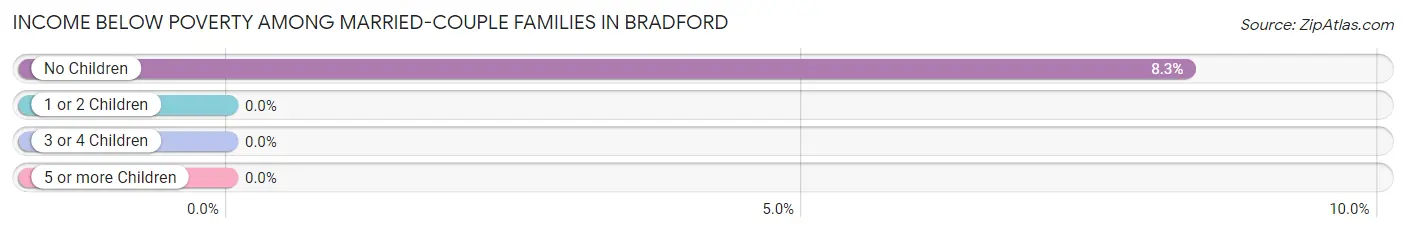
| Children | Above Poverty | Below Poverty |
| No Children | 33 (91.7%) | 3 (8.3%) |
| 1 or 2 Children | 22 (100.0%) | 0 (0.0%) |
| 3 or 4 Children | 12 (100.0%) | 0 (0.0%) |
| 5 or more Children | 0 (0.0%) | 0 (0.0%) |
| Total | 67 (95.7%) | 3 (4.3%) |
Income Below Poverty Among Single-Parent Households in Bradford
According to the poverty data in Bradford, 22.2% or 2 single-father households and 56.9% or 37 single-mother households are living below the poverty line. Among single-father households, those with 1 or 2 children have the highest poverty rate, with 2 households (100.0%) experiencing poverty. Likewise, among single-mother households, those with 1 or 2 children have the highest poverty rate, with 35 households (68.6%) falling below the poverty line.
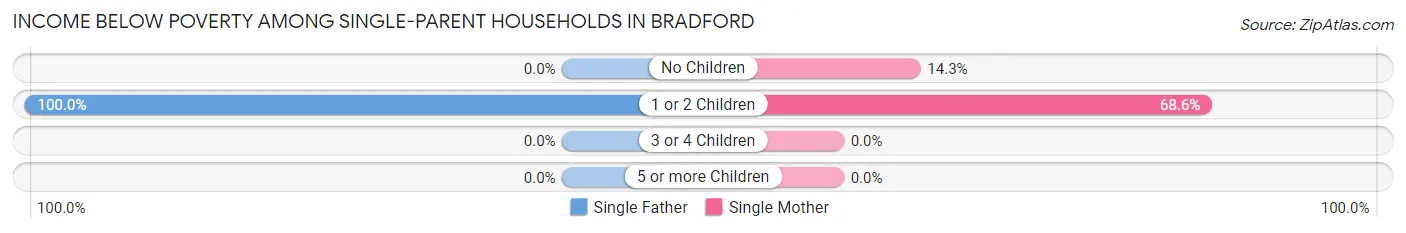
| Children | Single Father | Single Mother |
| No Children | 0 (0.0%) | 2 (14.3%) |
| 1 or 2 Children | 2 (100.0%) | 35 (68.6%) |
| 3 or 4 Children | 0 (0.0%) | 0 (0.0%) |
| 5 or more Children | 0 (0.0%) | 0 (0.0%) |
| Total | 2 (22.2%) | 37 (56.9%) |
Income Below Poverty Among Married-Couple vs Single-Parent Households in Bradford
The poverty data for Bradford shows that 3 of the married-couple family households (4.3%) and 39 of the single-parent households (52.7%) are living below the poverty level. Within the married-couple family households, those with no children have the highest poverty rate, with 3 households (8.3%) falling below the poverty line. Among the single-parent households, those with 1 or 2 children have the highest poverty rate, with 37 household (69.8%) living below poverty.
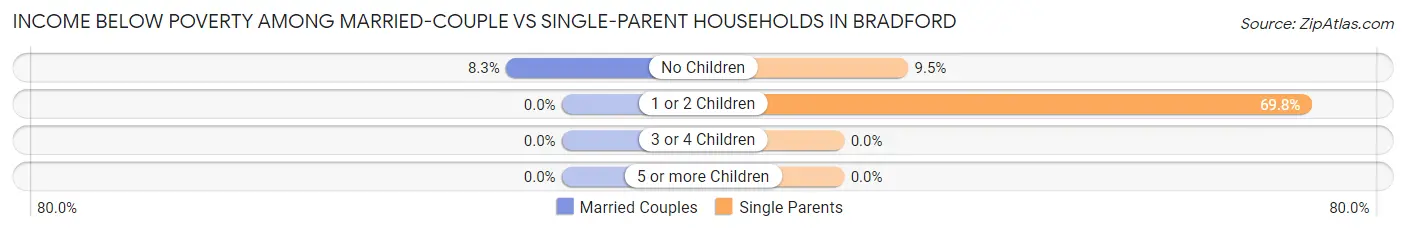
| Children | Married-Couple Families | Single-Parent Households |
| No Children | 3 (8.3%) | 2 (9.5%) |
| 1 or 2 Children | 0 (0.0%) | 37 (69.8%) |
| 3 or 4 Children | 0 (0.0%) | 0 (0.0%) |
| 5 or more Children | 0 (0.0%) | 0 (0.0%) |
| Total | 3 (4.3%) | 39 (52.7%) |
Race in Bradford
The most populous races in Bradford are White / Caucasian (515 | 93.1%), Two or more Races (28 | 5.1%), and Black / African American (7 | 1.3%).
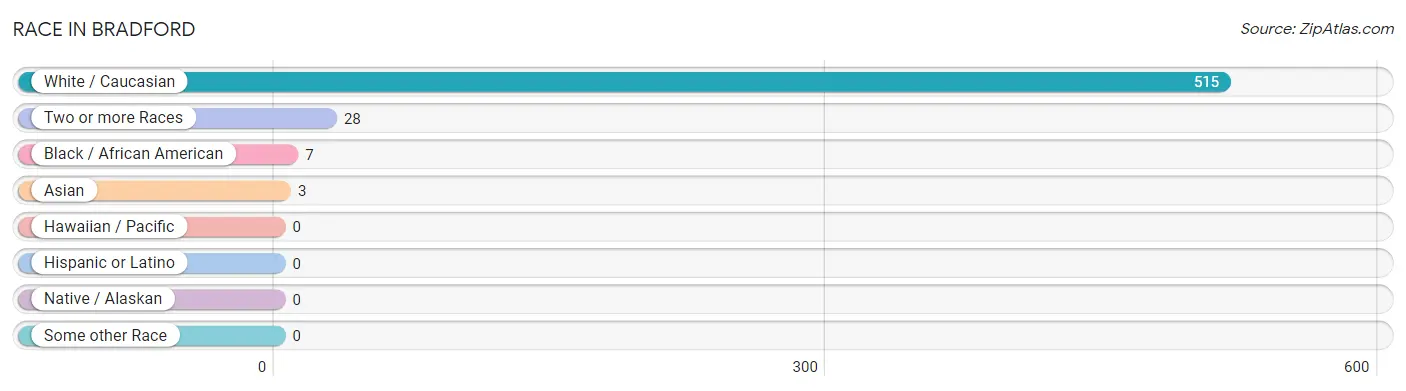
| Race | # Population | % Population |
| Asian | 3 | 0.5% |
| Black / African American | 7 | 1.3% |
| Hawaiian / Pacific | 0 | 0.0% |
| Hispanic or Latino | 0 | 0.0% |
| Native / Alaskan | 0 | 0.0% |
| White / Caucasian | 515 | 93.1% |
| Two or more Races | 28 | 5.1% |
| Some other Race | 0 | 0.0% |
| Total | 553 | 100.0% |
Ancestry in Bradford
The most populous ancestries reported in Bradford are Irish (58 | 10.5%), English (57 | 10.3%), German (39 | 7.0%), American (34 | 6.1%), and Scotch-Irish (23 | 4.2%), together accounting for 38.2% of all Bradford residents.
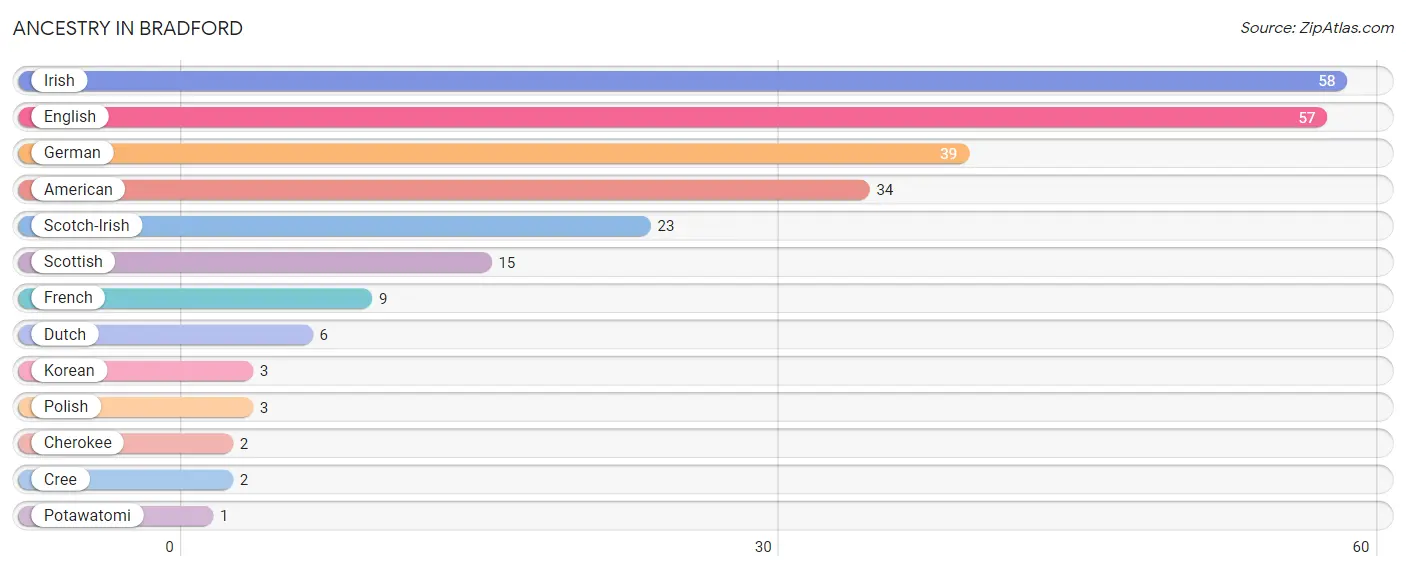
| Ancestry | # Population | % Population |
| American | 34 | 6.1% |
| Cherokee | 2 | 0.4% |
| Cree | 2 | 0.4% |
| Dutch | 6 | 1.1% |
| English | 57 | 10.3% |
| French | 9 | 1.6% |
| German | 39 | 7.0% |
| Irish | 58 | 10.5% |
| Korean | 3 | 0.5% |
| Polish | 3 | 0.5% |
| Potawatomi | 1 | 0.2% |
| Scotch-Irish | 23 | 4.2% |
| Scottish | 15 | 2.7% | View All 13 Rows |
Immigrants in Bradford
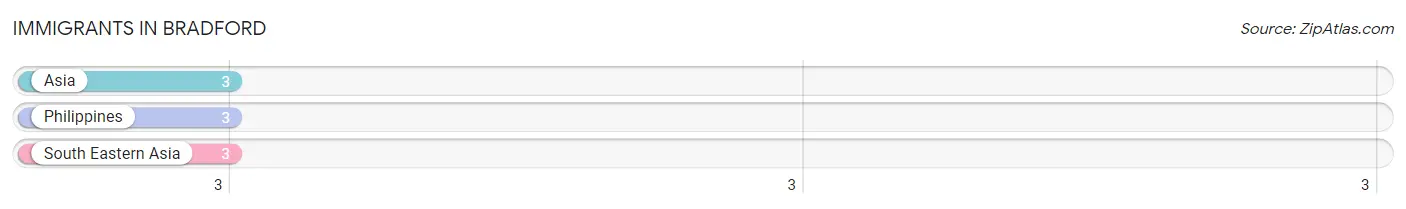
The most numerous immigrant groups reported in Bradford came from Asia (3 | 0.5%), Philippines (3 | 0.5%), and South Eastern Asia (3 | 0.5%), together accounting for 1.6% of all Bradford residents.
| Immigration Origin | # Population | % Population |
| Asia | 3 | 0.5% |
| Philippines | 3 | 0.5% |
| South Eastern Asia | 3 | 0.5% | View All 3 Rows |
Sex and Age in Bradford
Sex and Age in Bradford
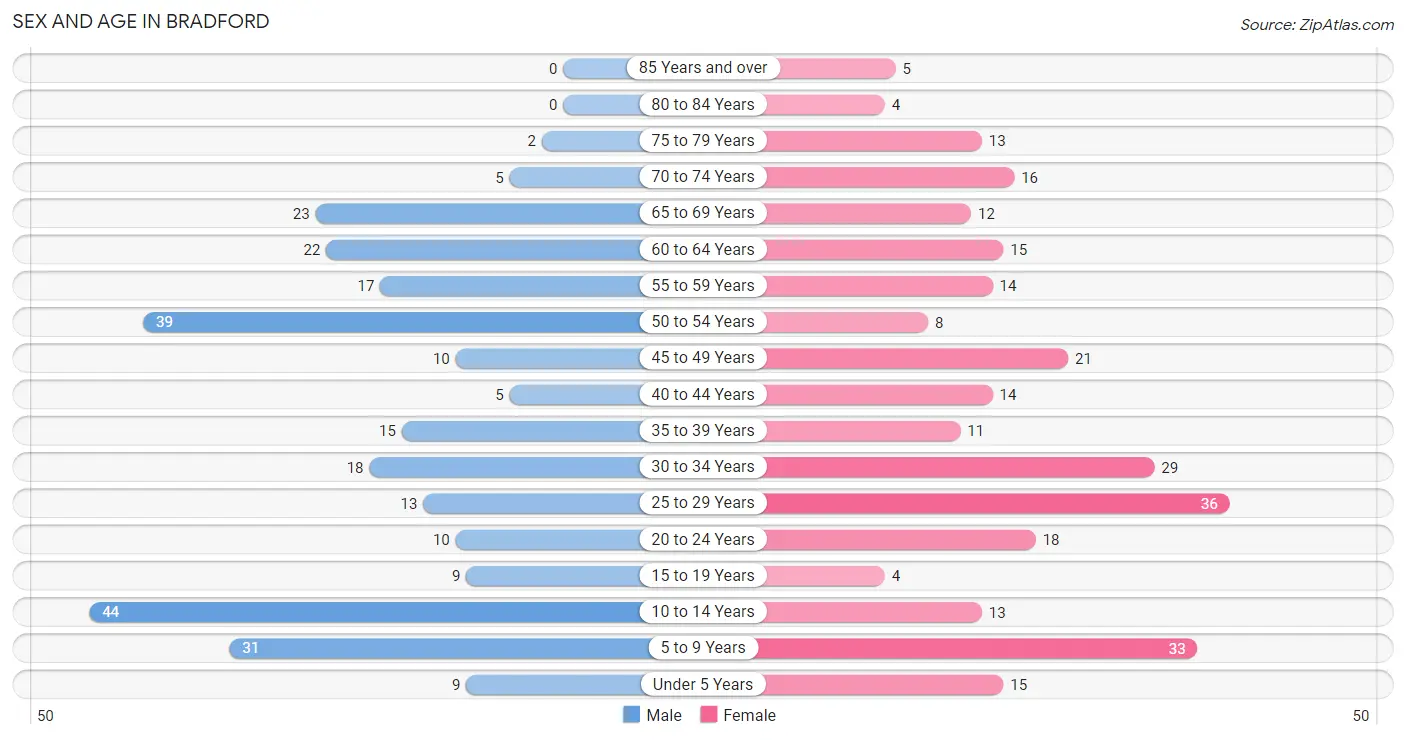
The most populous age groups in Bradford are 10 to 14 Years (44 | 16.2%) for men and 25 to 29 Years (36 | 12.8%) for women.
| Age Bracket | Male | Female |
| Under 5 Years | 9 (3.3%) | 15 (5.3%) |
| 5 to 9 Years | 31 (11.4%) | 33 (11.7%) |
| 10 to 14 Years | 44 (16.2%) | 13 (4.6%) |
| 15 to 19 Years | 9 (3.3%) | 4 (1.4%) |
| 20 to 24 Years | 10 (3.7%) | 18 (6.4%) |
| 25 to 29 Years | 13 (4.8%) | 36 (12.8%) |
| 30 to 34 Years | 18 (6.6%) | 29 (10.3%) |
| 35 to 39 Years | 15 (5.5%) | 11 (3.9%) |
| 40 to 44 Years | 5 (1.8%) | 14 (5.0%) |
| 45 to 49 Years | 10 (3.7%) | 21 (7.5%) |
| 50 to 54 Years | 39 (14.3%) | 8 (2.9%) |
| 55 to 59 Years | 17 (6.2%) | 14 (5.0%) |
| 60 to 64 Years | 22 (8.1%) | 15 (5.3%) |
| 65 to 69 Years | 23 (8.5%) | 12 (4.3%) |
| 70 to 74 Years | 5 (1.8%) | 16 (5.7%) |
| 75 to 79 Years | 2 (0.7%) | 13 (4.6%) |
| 80 to 84 Years | 0 (0.0%) | 4 (1.4%) |
| 85 Years and over | 0 (0.0%) | 5 (1.8%) |
| Total | 272 (100.0%) | 281 (100.0%) |
Families and Households in Bradford
Median Family Size in Bradford
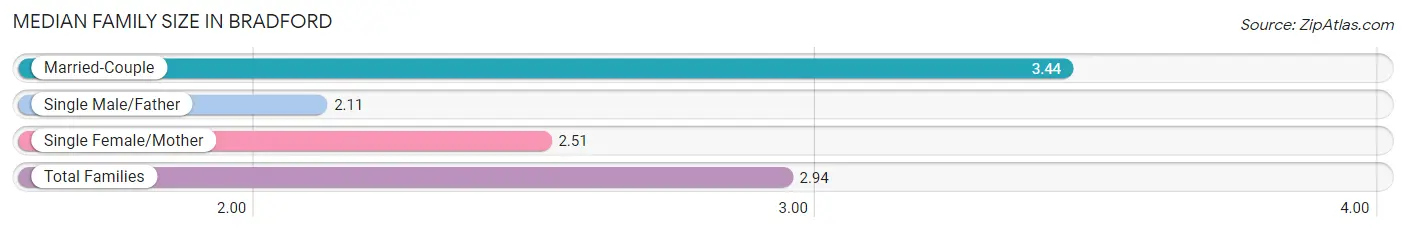
The median family size in Bradford is 2.94 persons per family, with married-couple families (70 | 48.6%) accounting for the largest median family size of 3.44 persons per family. On the other hand, single male/father families (9 | 6.2%) represent the smallest median family size with 2.11 persons per family.
| Family Type | # Families | Family Size |
| Married-Couple | 70 (48.6%) | 3.44 |
| Single Male/Father | 9 (6.2%) | 2.11 |
| Single Female/Mother | 65 (45.1%) | 2.51 |
| Total Families | 144 (100.0%) | 2.94 |
Median Household Size in Bradford
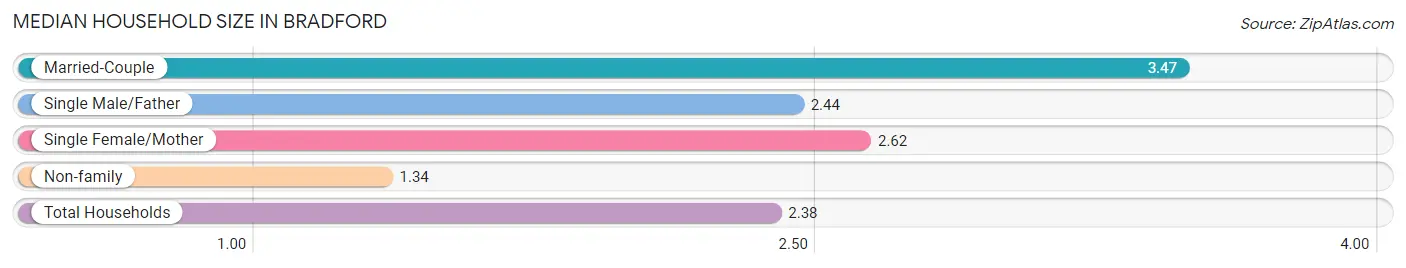
The median household size in Bradford is 2.38 persons per household, with married-couple households (70 | 30.2%) accounting for the largest median household size of 3.47 persons per household. non-family households (88 | 37.9%) represent the smallest median household size with 1.34 persons per household.
| Household Type | # Households | Household Size |
| Married-Couple | 70 (30.2%) | 3.47 |
| Single Male/Father | 9 (3.9%) | 2.44 |
| Single Female/Mother | 65 (28.0%) | 2.62 |
| Non-family | 88 (37.9%) | 1.34 |
| Total Households | 232 (100.0%) | 2.38 |
Household Size by Marriage Status in Bradford
Out of a total of 232 households in Bradford, 144 (62.1%) are family households, while 88 (37.9%) are nonfamily households. The most numerous type of family households are 3-person households, comprising 62, and the most common type of nonfamily households are 1-person households, comprising 73.
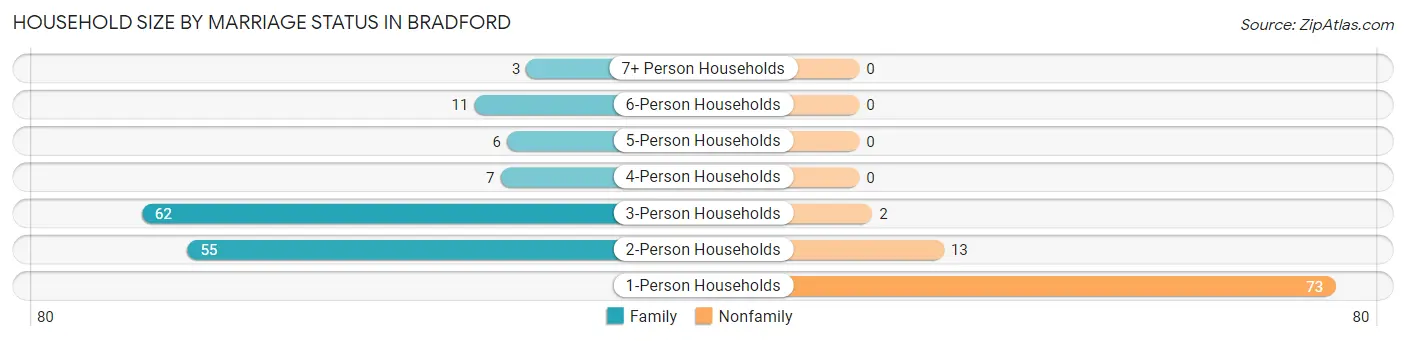
| Household Size | Family Households | Nonfamily Households |
| 1-Person Households | - | 73 (31.5%) |
| 2-Person Households | 55 (23.7%) | 13 (5.6%) |
| 3-Person Households | 62 (26.7%) | 2 (0.9%) |
| 4-Person Households | 7 (3.0%) | 0 (0.0%) |
| 5-Person Households | 6 (2.6%) | 0 (0.0%) |
| 6-Person Households | 11 (4.7%) | 0 (0.0%) |
| 7+ Person Households | 3 (1.3%) | 0 (0.0%) |
| Total | 144 (62.1%) | 88 (37.9%) |
Female Fertility in Bradford
Fertility by Age in Bradford
Average fertility rate in Bradford is 7.0 births per 1,000 women. Women in the age bracket of 20 to 34 years have the highest fertility rate with 12.0 births per 1,000 women. Women in the age bracket of 20 to 34 years acount for 100.0% of all women with births.
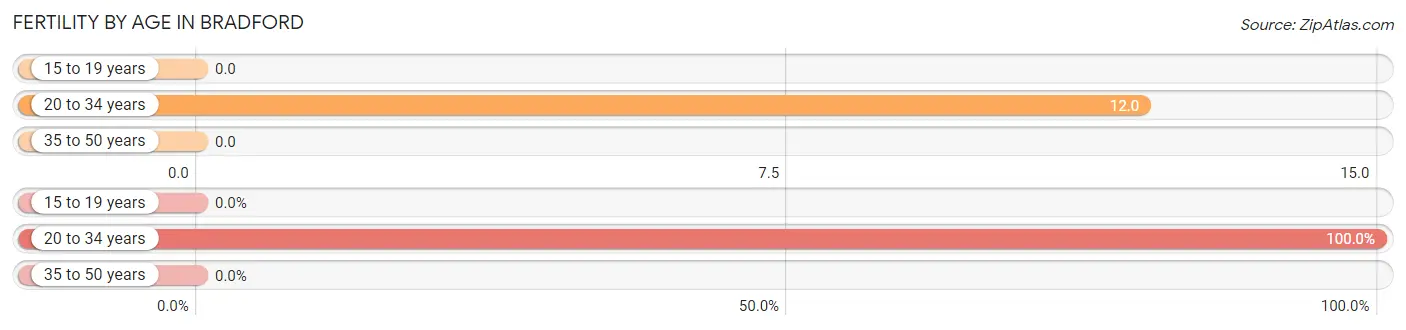
| Age Bracket | Women with Births | Births / 1,000 Women |
| 15 to 19 years | 0 (0.0%) | 0.0 |
| 20 to 34 years | 1 (100.0%) | 12.0 |
| 35 to 50 years | 0 (0.0%) | 0.0 |
| Total | 1 (100.0%) | 7.0 |
Fertility by Age by Marriage Status in Bradford
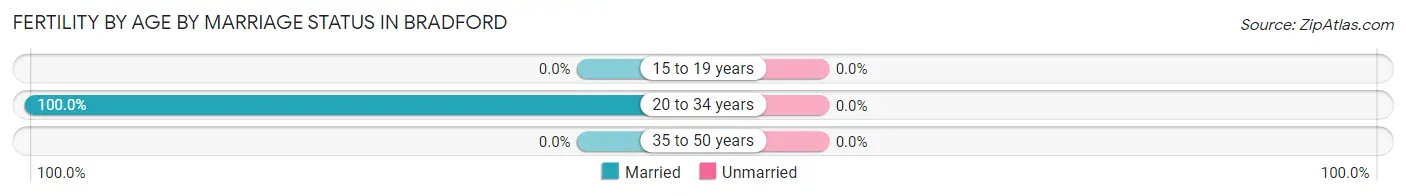
| Age Bracket | Married | Unmarried |
| 15 to 19 years | 0 (0.0%) | 0 (0.0%) |
| 20 to 34 years | 1 (100.0%) | 0 (0.0%) |
| 35 to 50 years | 0 (0.0%) | 0 (0.0%) |
| Total | 1 (100.0%) | 0 (0.0%) |
Fertility by Education in Bradford
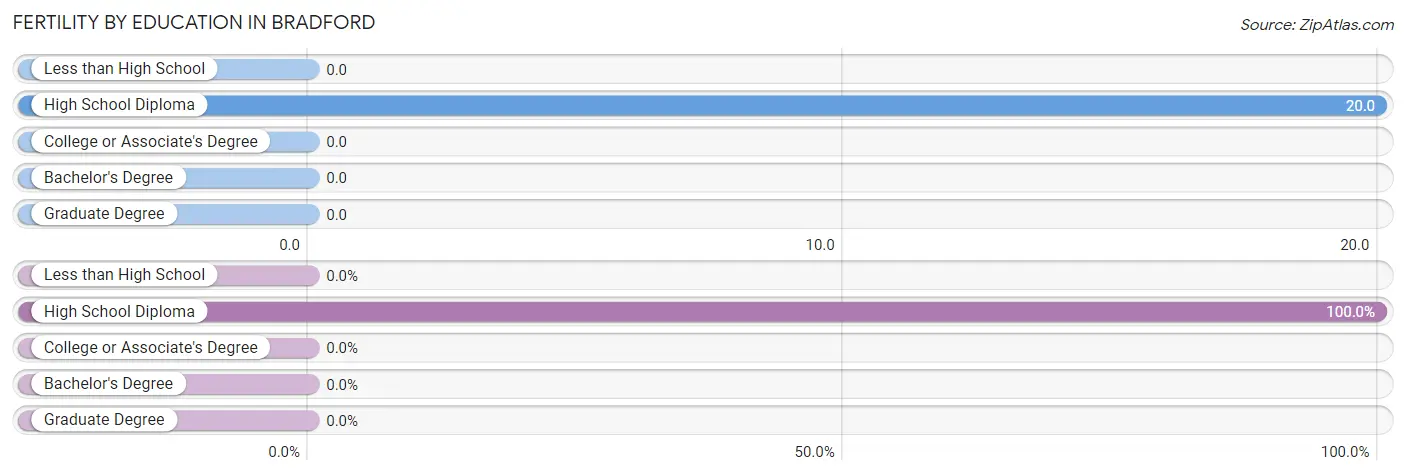
| Educational Attainment | Women with Births | Births / 1,000 Women |
| Less than High School | 0 (0.0%) | 0.0 |
| High School Diploma | 1 (100.0%) | 20.0 |
| College or Associate's Degree | 0 (0.0%) | 0.0 |
| Bachelor's Degree | 0 (0.0%) | 0.0 |
| Graduate Degree | 0 (0.0%) | 0.0 |
| Total | 1 (100.0%) | 7.0 |
Fertility by Education by Marriage Status in Bradford
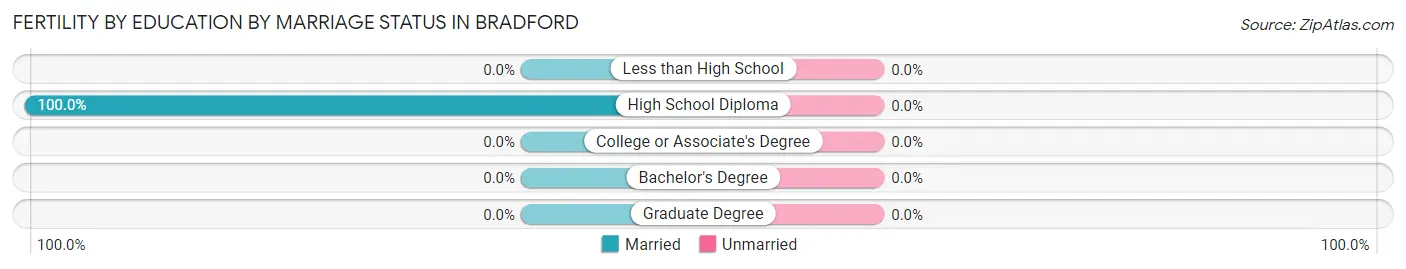
| Educational Attainment | Married | Unmarried |
| Less than High School | 0 (0.0%) | 0 (0.0%) |
| High School Diploma | 1 (100.0%) | 0 (0.0%) |
| College or Associate's Degree | 0 (0.0%) | 0 (0.0%) |
| Bachelor's Degree | 0 (0.0%) | 0 (0.0%) |
| Graduate Degree | 0 (0.0%) | 0 (0.0%) |
| Total | 1 (100.0%) | 0 (0.0%) |
Employment Characteristics in Bradford
Employment by Class of Employer in Bradford
Among the 180 employed individuals in Bradford, private company employees (107 | 59.4%), not-for-profit organizations (26 | 14.4%), and local government employees (18 | 10.0%) make up the most common classes of employment.
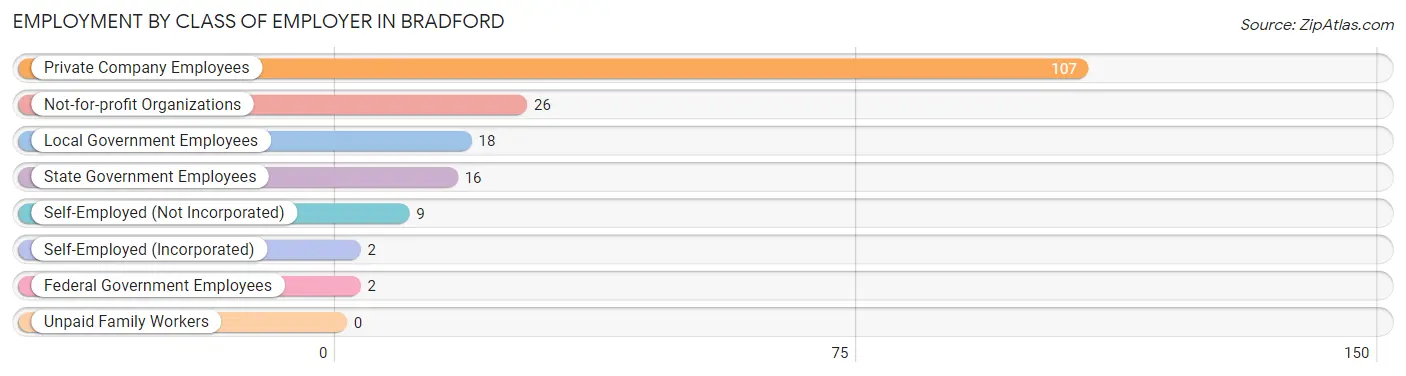
| Employer Class | # Employees | % Employees |
| Private Company Employees | 107 | 59.4% |
| Self-Employed (Incorporated) | 2 | 1.1% |
| Self-Employed (Not Incorporated) | 9 | 5.0% |
| Not-for-profit Organizations | 26 | 14.4% |
| Local Government Employees | 18 | 10.0% |
| State Government Employees | 16 | 8.9% |
| Federal Government Employees | 2 | 1.1% |
| Unpaid Family Workers | 0 | 0.0% |
| Total | 180 | 100.0% |
Employment Status by Age in Bradford
According to the labor force statistics for Bradford, out of the total population over 16 years of age (408), 48.0% or 196 individuals are in the labor force, with 7.1% or 14 of them unemployed. The age group with the highest labor force participation rate is 20 to 24 years, with 100.0% or 28 individuals in the labor force. Within the labor force, the 25 to 29 years age range has the highest percentage of unemployed individuals, with 25.0% or 9 of them being unemployed.
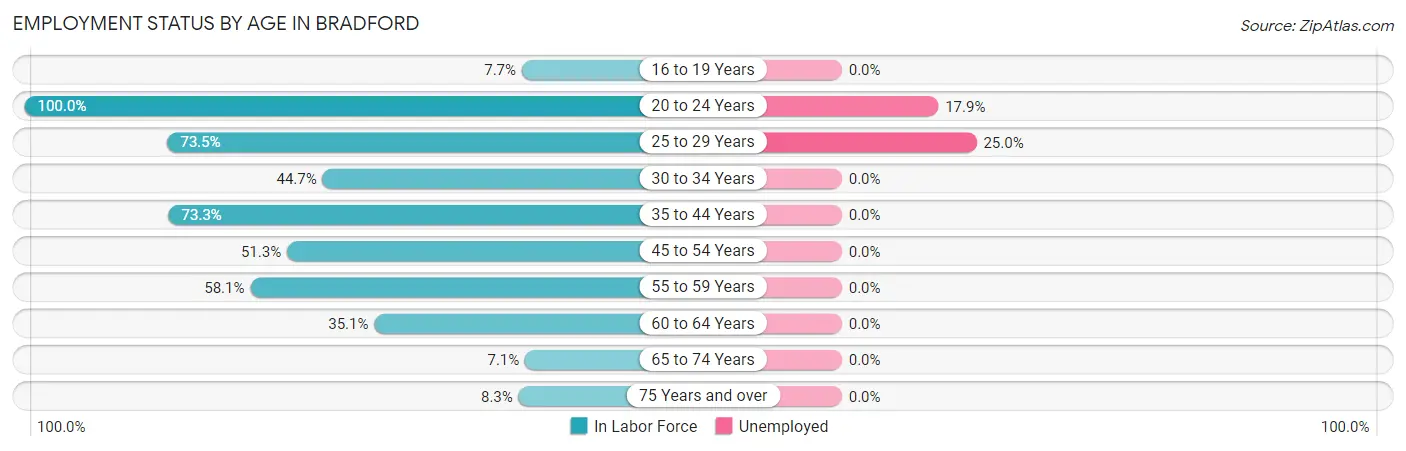
| Age Bracket | In Labor Force | Unemployed |
| 16 to 19 Years | 1 (7.7%) | 0 (0.0%) |
| 20 to 24 Years | 28 (100.0%) | 5 (17.9%) |
| 25 to 29 Years | 36 (73.5%) | 9 (25.0%) |
| 30 to 34 Years | 21 (44.7%) | 0 (0.0%) |
| 35 to 44 Years | 33 (73.3%) | 0 (0.0%) |
| 45 to 54 Years | 40 (51.3%) | 0 (0.0%) |
| 55 to 59 Years | 18 (58.1%) | 0 (0.0%) |
| 60 to 64 Years | 13 (35.1%) | 0 (0.0%) |
| 65 to 74 Years | 4 (7.1%) | 0 (0.0%) |
| 75 Years and over | 2 (8.3%) | 0 (0.0%) |
| Total | 196 (48.0%) | 14 (7.1%) |
Employment Status by Educational Attainment in Bradford
According to labor force statistics for Bradford, 56.1% of individuals (161) out of the total population between 25 and 64 years of age (287) are in the labor force, with 5.6% or 9 of them being unemployed. The group with the highest labor force participation rate are those with the educational attainment of bachelor's degree or higher, with 90.0% or 36 individuals in the labor force. Within the labor force, individuals with high school diploma education have the highest percentage of unemployment, with 17.0% or 9 of them being unemployed.
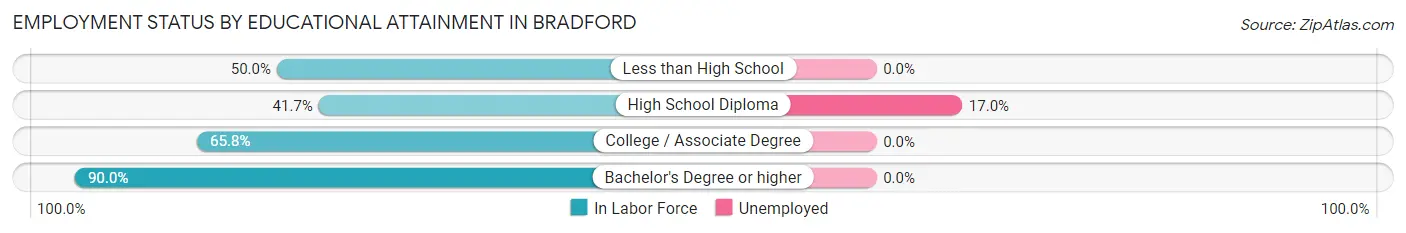
| Educational Attainment | In Labor Force | Unemployed |
| Less than High School | 22 (50.0%) | 0 (0.0%) |
| High School Diploma | 53 (41.7%) | 22 (17.0%) |
| College / Associate Degree | 50 (65.8%) | 0 (0.0%) |
| Bachelor's Degree or higher | 36 (90.0%) | 0 (0.0%) |
| Total | 161 (56.1%) | 16 (5.6%) |
Employment Occupations by Sex in Bradford
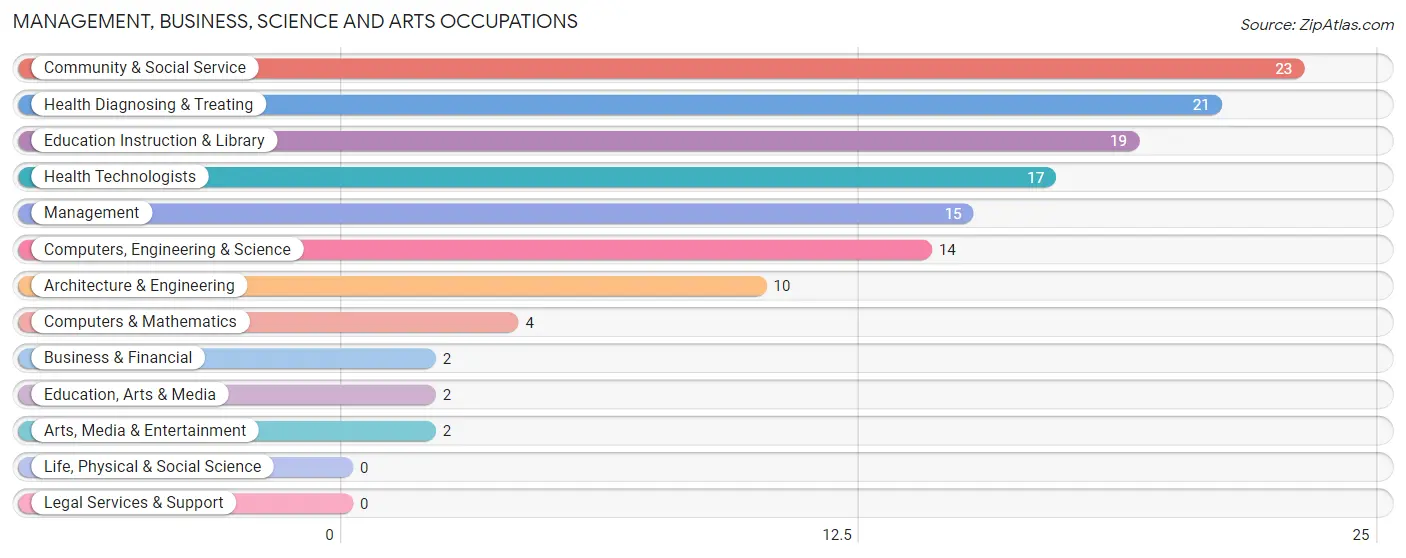
Management, Business, Science and Arts Occupations
The most common Management, Business, Science and Arts occupations in Bradford are Community & Social Service (23 | 12.6%), Health Diagnosing & Treating (21 | 11.5%), Education Instruction & Library (19 | 10.4%), Health Technologists (17 | 9.3%), and Management (15 | 8.2%).
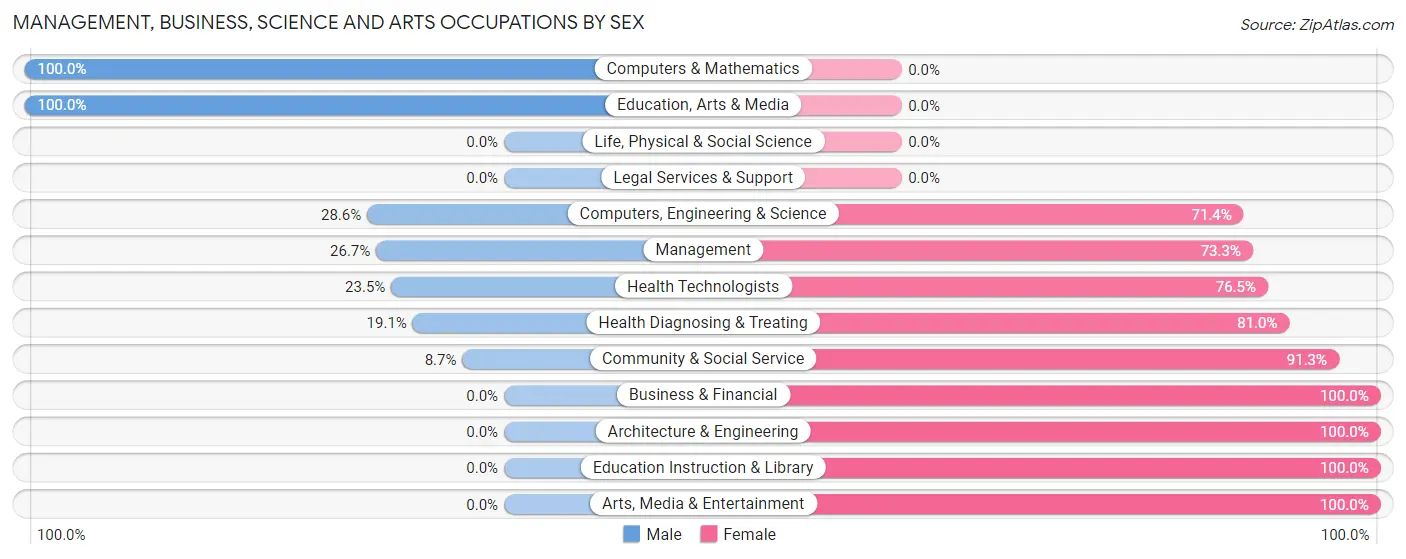
Management, Business, Science and Arts Occupations by Sex
Within the Management, Business, Science and Arts occupations in Bradford, the most male-oriented occupations are Computers & Mathematics (100.0%), Education, Arts & Media (100.0%), and Computers, Engineering & Science (28.6%), while the most female-oriented occupations are Business & Financial (100.0%), Architecture & Engineering (100.0%), and Education Instruction & Library (100.0%).
| Occupation | Male | Female |
| Management | 4 (26.7%) | 11 (73.3%) |
| Business & Financial | 0 (0.0%) | 2 (100.0%) |
| Computers, Engineering & Science | 4 (28.6%) | 10 (71.4%) |
| Computers & Mathematics | 4 (100.0%) | 0 (0.0%) |
| Architecture & Engineering | 0 (0.0%) | 10 (100.0%) |
| Life, Physical & Social Science | 0 (0.0%) | 0 (0.0%) |
| Community & Social Service | 2 (8.7%) | 21 (91.3%) |
| Education, Arts & Media | 2 (100.0%) | 0 (0.0%) |
| Legal Services & Support | 0 (0.0%) | 0 (0.0%) |
| Education Instruction & Library | 0 (0.0%) | 19 (100.0%) |
| Arts, Media & Entertainment | 0 (0.0%) | 2 (100.0%) |
| Health Diagnosing & Treating | 4 (19.1%) | 17 (80.9%) |
| Health Technologists | 4 (23.5%) | 13 (76.5%) |
| Total (Category) | 14 (18.7%) | 61 (81.3%) |
| Total (Overall) | 84 (46.2%) | 98 (53.8%) |
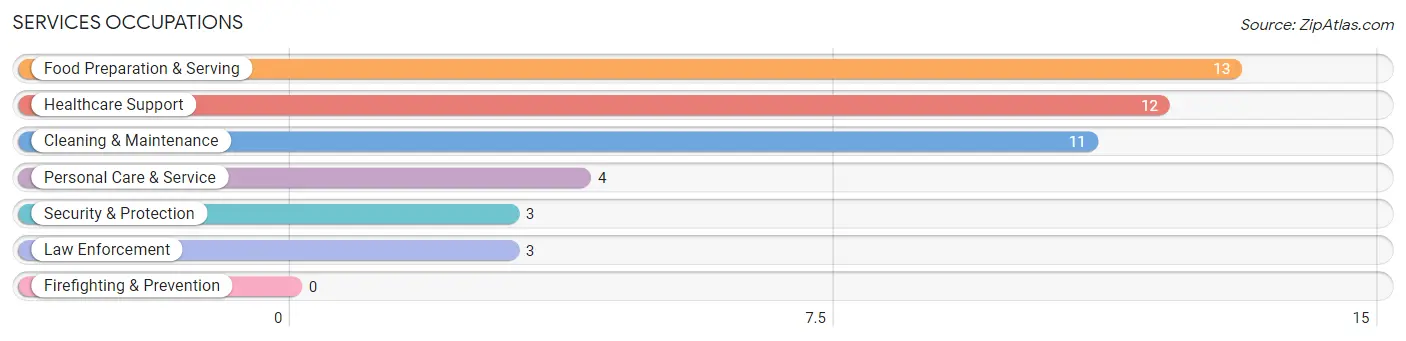
Services Occupations
The most common Services occupations in Bradford are Food Preparation & Serving (13 | 7.1%), Healthcare Support (12 | 6.6%), Cleaning & Maintenance (11 | 6.0%), Personal Care & Service (4 | 2.2%), and Security & Protection (3 | 1.7%).
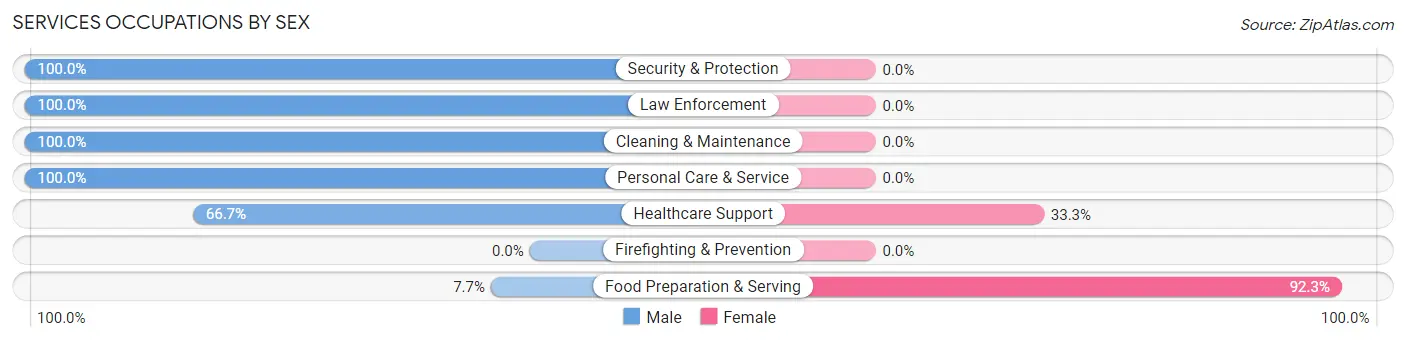
Services Occupations by Sex
Within the Services occupations in Bradford, the most male-oriented occupations are Security & Protection (100.0%), Law Enforcement (100.0%), and Cleaning & Maintenance (100.0%), while the most female-oriented occupations are Food Preparation & Serving (92.3%), and Healthcare Support (33.3%).
| Occupation | Male | Female |
| Healthcare Support | 8 (66.7%) | 4 (33.3%) |
| Security & Protection | 3 (100.0%) | 0 (0.0%) |
| Firefighting & Prevention | 0 (0.0%) | 0 (0.0%) |
| Law Enforcement | 3 (100.0%) | 0 (0.0%) |
| Food Preparation & Serving | 1 (7.7%) | 12 (92.3%) |
| Cleaning & Maintenance | 11 (100.0%) | 0 (0.0%) |
| Personal Care & Service | 4 (100.0%) | 0 (0.0%) |
| Total (Category) | 27 (62.8%) | 16 (37.2%) |
| Total (Overall) | 84 (46.2%) | 98 (53.8%) |
Sales and Office Occupations
The most common Sales and Office occupations in Bradford are Office & Administration (12 | 6.6%), and Sales & Related (10 | 5.5%).
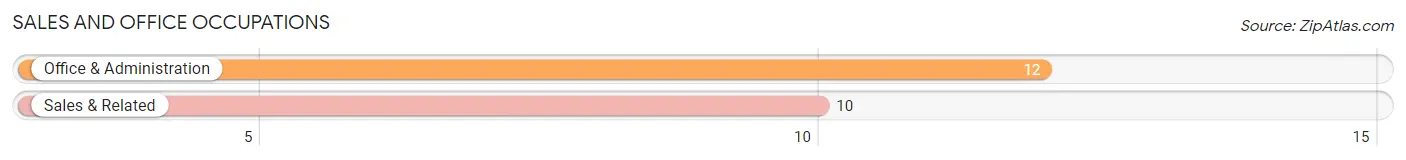
Sales and Office Occupations by Sex
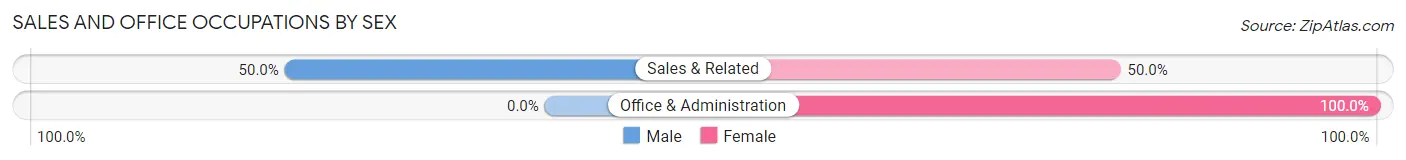
| Occupation | Male | Female |
| Sales & Related | 5 (50.0%) | 5 (50.0%) |
| Office & Administration | 0 (0.0%) | 12 (100.0%) |
| Total (Category) | 5 (22.7%) | 17 (77.3%) |
| Total (Overall) | 84 (46.2%) | 98 (53.8%) |
Natural Resources, Construction and Maintenance Occupations
The most common Natural Resources, Construction and Maintenance occupations in Bradford are , and Construction & Extraction (3 | 1.7%).
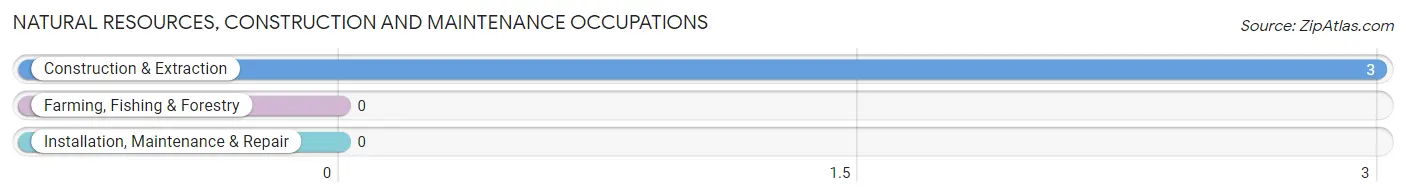
Natural Resources, Construction and Maintenance Occupations by Sex
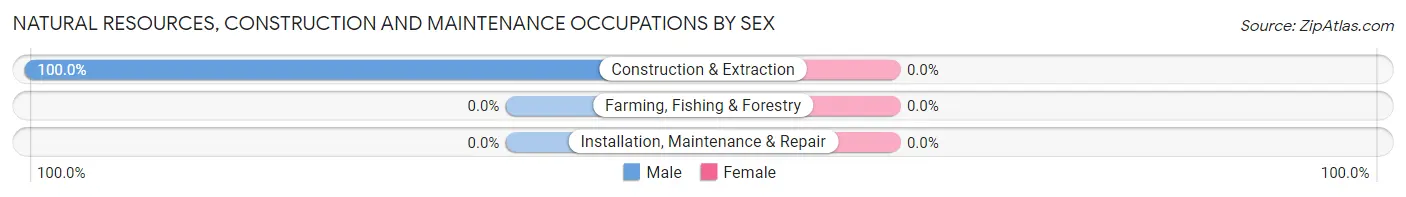
| Occupation | Male | Female |
| Farming, Fishing & Forestry | 0 (0.0%) | 0 (0.0%) |
| Construction & Extraction | 3 (100.0%) | 0 (0.0%) |
| Installation, Maintenance & Repair | 0 (0.0%) | 0 (0.0%) |
| Total (Category) | 3 (100.0%) | 0 (0.0%) |
| Total (Overall) | 84 (46.2%) | 98 (53.8%) |
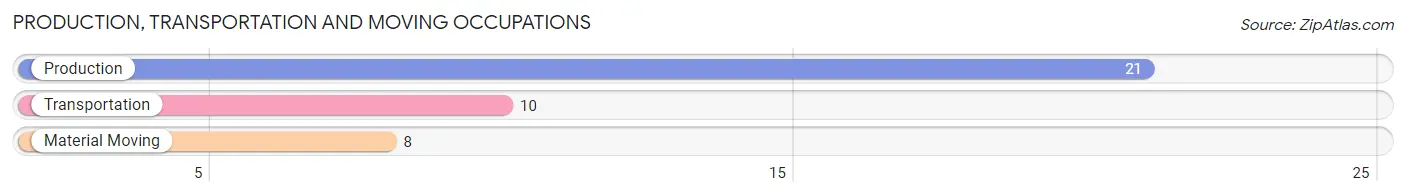
Production, Transportation and Moving Occupations
The most common Production, Transportation and Moving occupations in Bradford are Production (21 | 11.5%), Transportation (10 | 5.5%), and Material Moving (8 | 4.4%).
Production, Transportation and Moving Occupations by Sex
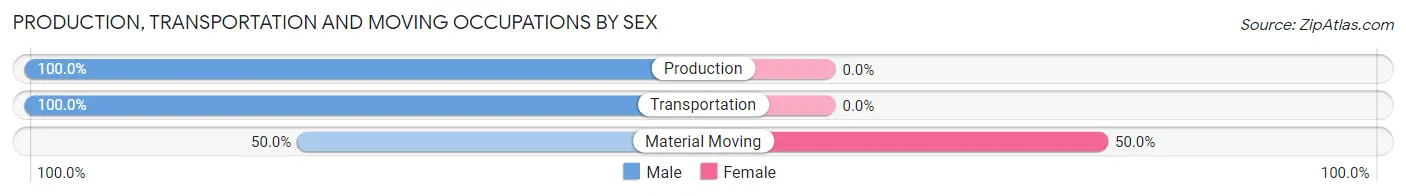
| Occupation | Male | Female |
| Production | 21 (100.0%) | 0 (0.0%) |
| Transportation | 10 (100.0%) | 0 (0.0%) |
| Material Moving | 4 (50.0%) | 4 (50.0%) |
| Total (Category) | 35 (89.7%) | 4 (10.3%) |
| Total (Overall) | 84 (46.2%) | 98 (53.8%) |
Employment Industries by Sex in Bradford
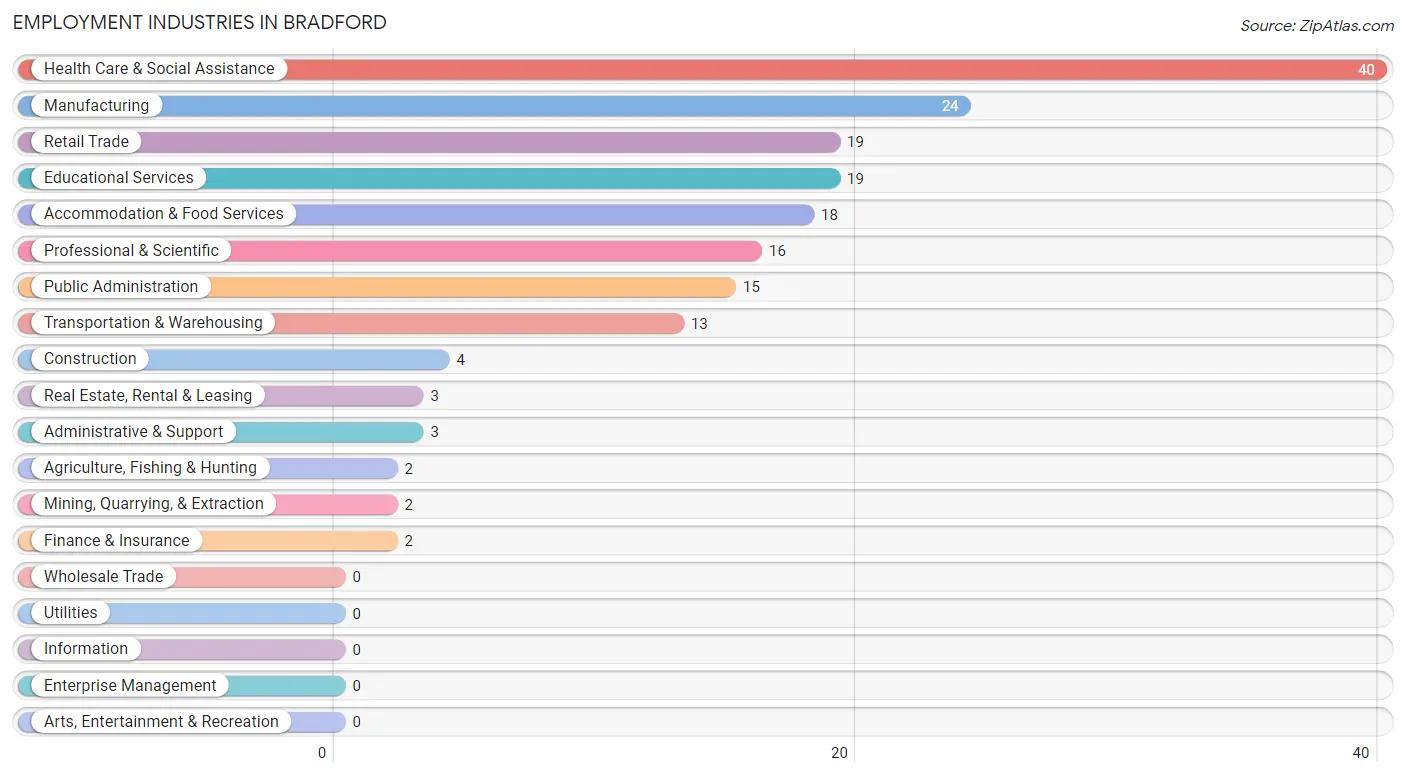
Employment Industries in Bradford
The major employment industries in Bradford include Health Care & Social Assistance (40 | 22.0%), Manufacturing (24 | 13.2%), Retail Trade (19 | 10.4%), Educational Services (19 | 10.4%), and Accommodation & Food Services (18 | 9.9%).
Employment Industries by Sex in Bradford
The Bradford industries that see more men than women are Agriculture, Fishing & Hunting (100.0%), Mining, Quarrying, & Extraction (100.0%), and Construction (100.0%), whereas the industries that tend to have a higher number of women are Finance & Insurance (100.0%), Real Estate, Rental & Leasing (100.0%), and Professional & Scientific (100.0%).
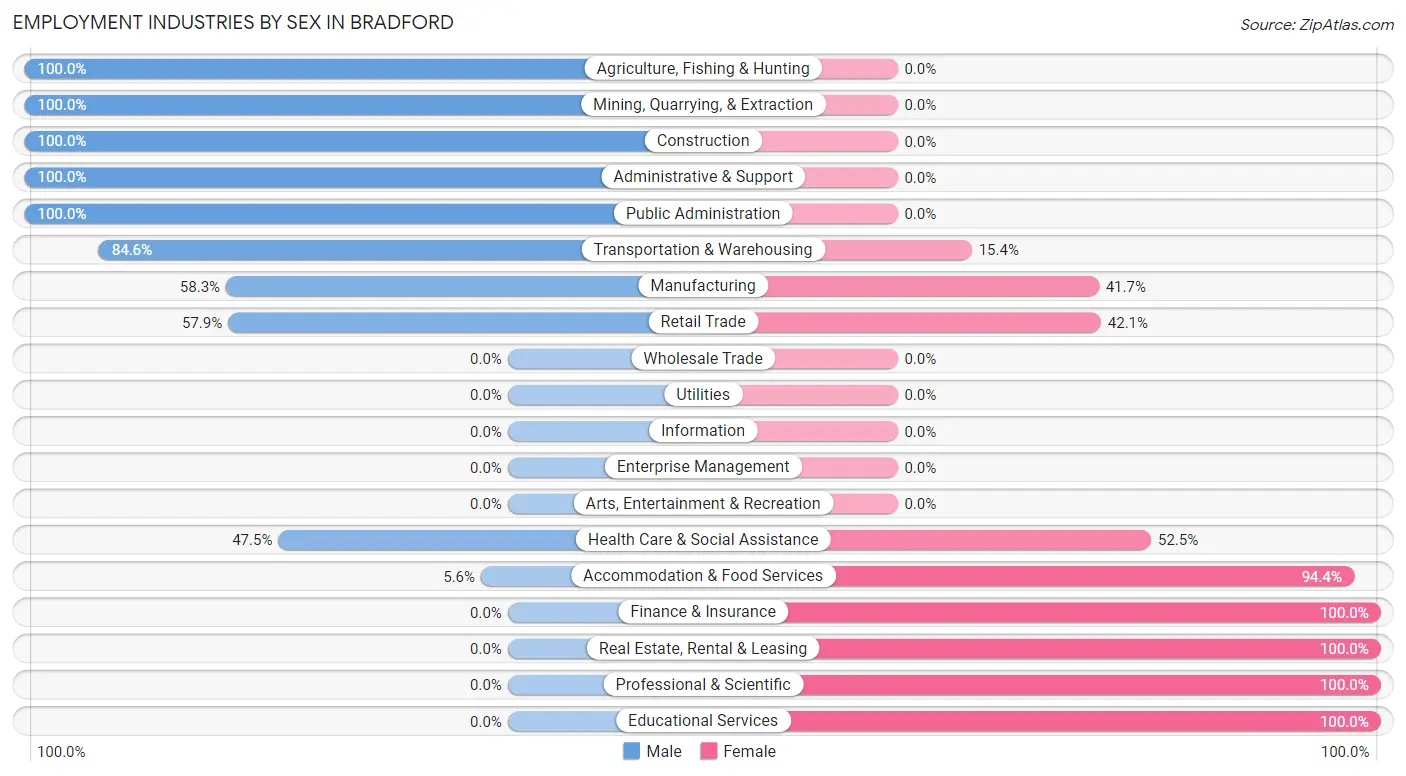
| Industry | Male | Female |
| Agriculture, Fishing & Hunting | 2 (100.0%) | 0 (0.0%) |
| Mining, Quarrying, & Extraction | 2 (100.0%) | 0 (0.0%) |
| Construction | 4 (100.0%) | 0 (0.0%) |
| Manufacturing | 14 (58.3%) | 10 (41.7%) |
| Wholesale Trade | 0 (0.0%) | 0 (0.0%) |
| Retail Trade | 11 (57.9%) | 8 (42.1%) |
| Transportation & Warehousing | 11 (84.6%) | 2 (15.4%) |
| Utilities | 0 (0.0%) | 0 (0.0%) |
| Information | 0 (0.0%) | 0 (0.0%) |
| Finance & Insurance | 0 (0.0%) | 2 (100.0%) |
| Real Estate, Rental & Leasing | 0 (0.0%) | 3 (100.0%) |
| Professional & Scientific | 0 (0.0%) | 16 (100.0%) |
| Enterprise Management | 0 (0.0%) | 0 (0.0%) |
| Administrative & Support | 3 (100.0%) | 0 (0.0%) |
| Educational Services | 0 (0.0%) | 19 (100.0%) |
| Health Care & Social Assistance | 19 (47.5%) | 21 (52.5%) |
| Arts, Entertainment & Recreation | 0 (0.0%) | 0 (0.0%) |
| Accommodation & Food Services | 1 (5.6%) | 17 (94.4%) |
| Public Administration | 15 (100.0%) | 0 (0.0%) |
| Total | 84 (46.2%) | 98 (53.8%) |
Education in Bradford
School Enrollment in Bradford
The most common levels of schooling among the 146 students in Bradford are elementary school (55 | 37.7%), middle school (44 | 30.1%), and kindergarten (16 | 11.0%).
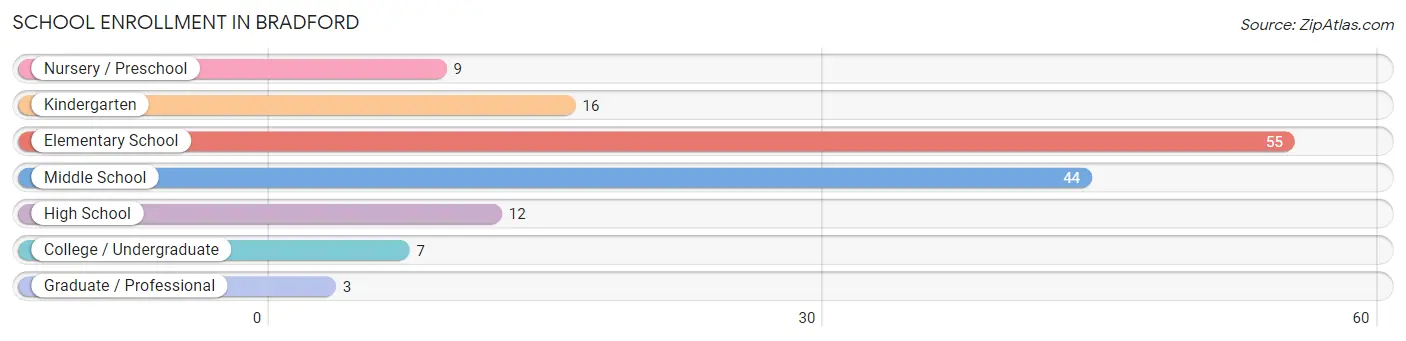
| School Level | # Students | % Students |
| Nursery / Preschool | 9 | 6.2% |
| Kindergarten | 16 | 11.0% |
| Elementary School | 55 | 37.7% |
| Middle School | 44 | 30.1% |
| High School | 12 | 8.2% |
| College / Undergraduate | 7 | 4.8% |
| Graduate / Professional | 3 | 2.1% |
| Total | 146 | 100.0% |
School Enrollment by Age by Funding Source in Bradford
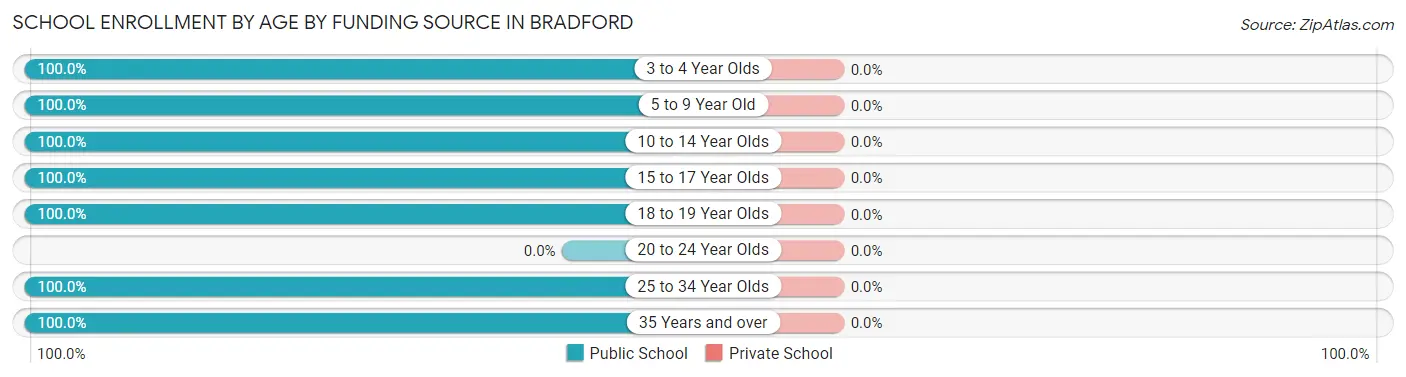
| Age Bracket | Public School | Private School |
| 3 to 4 Year Olds | 3 (100.0%) | 0 (0.0%) |
| 5 to 9 Year Old | 64 (100.0%) | 0 (0.0%) |
| 10 to 14 Year Olds | 57 (100.0%) | 0 (0.0%) |
| 15 to 17 Year Olds | 8 (100.0%) | 0 (0.0%) |
| 18 to 19 Year Olds | 4 (100.0%) | 0 (0.0%) |
| 20 to 24 Year Olds | 0 (0.0%) | 0 (0.0%) |
| 25 to 34 Year Olds | 6 (100.0%) | 0 (0.0%) |
| 35 Years and over | 4 (100.0%) | 0 (0.0%) |
| Total | 146 (100.0%) | 0 (0.0%) |
Educational Attainment by Field of Study in Bradford
Science & technology (17 | 33.3%), education (15 | 29.4%), computers & mathematics (8 | 15.7%), physical & health sciences (4 | 7.8%), and business (4 | 7.8%) are the most common fields of study among 51 individuals in Bradford who have obtained a bachelor's degree or higher.
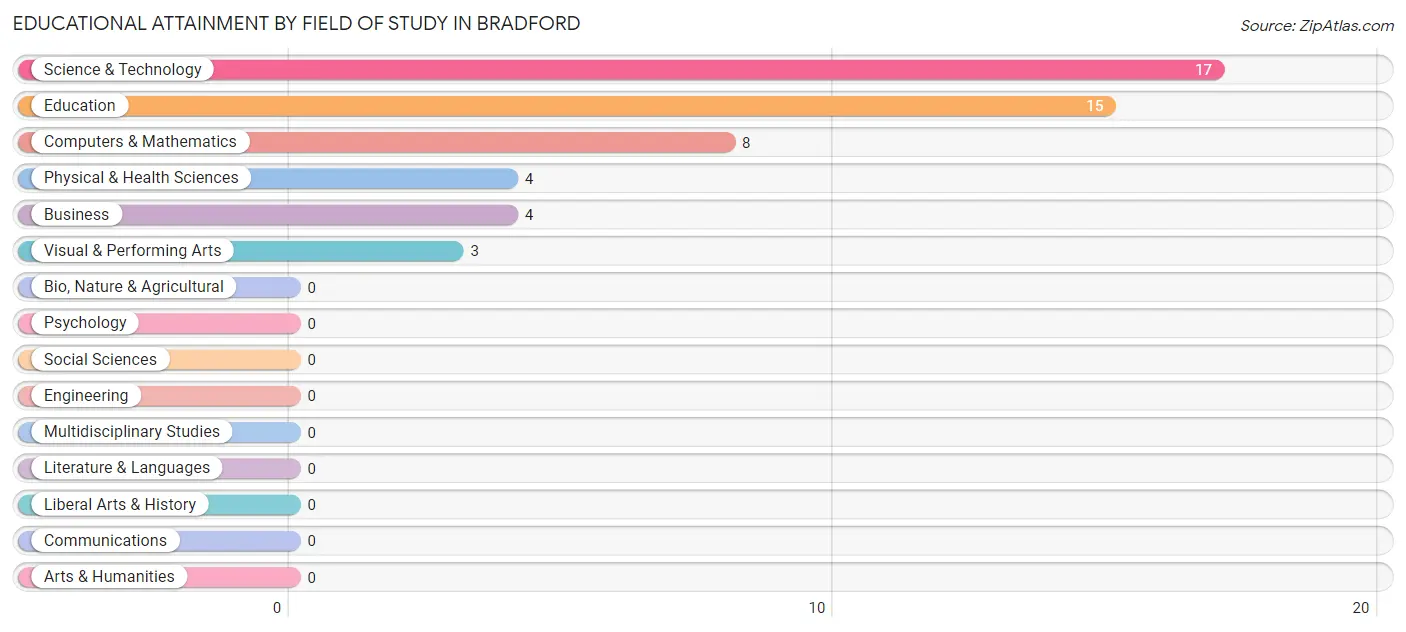
| Field of Study | # Graduates | % Graduates |
| Computers & Mathematics | 8 | 15.7% |
| Bio, Nature & Agricultural | 0 | 0.0% |
| Physical & Health Sciences | 4 | 7.8% |
| Psychology | 0 | 0.0% |
| Social Sciences | 0 | 0.0% |
| Engineering | 0 | 0.0% |
| Multidisciplinary Studies | 0 | 0.0% |
| Science & Technology | 17 | 33.3% |
| Business | 4 | 7.8% |
| Education | 15 | 29.4% |
| Literature & Languages | 0 | 0.0% |
| Liberal Arts & History | 0 | 0.0% |
| Visual & Performing Arts | 3 | 5.9% |
| Communications | 0 | 0.0% |
| Arts & Humanities | 0 | 0.0% |
| Total | 51 | 100.0% |
Transportation & Commute in Bradford
Vehicle Availability by Sex in Bradford
The most prevalent vehicle ownership categories in Bradford are males with 2 vehicles (36, accounting for 43.9%) and females with 2 vehicles (23, making up 36.7%).
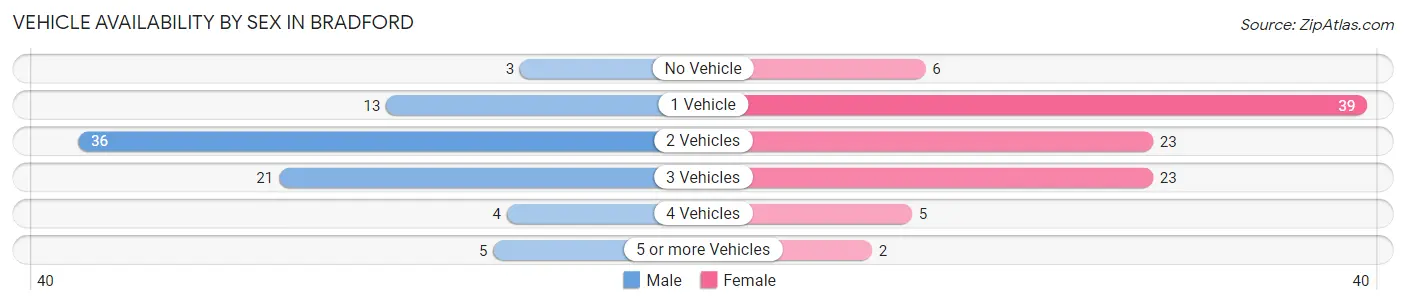
| Vehicles Available | Male | Female |
| No Vehicle | 3 (3.7%) | 6 (6.1%) |
| 1 Vehicle | 13 (15.9%) | 39 (39.8%) |
| 2 Vehicles | 36 (43.9%) | 23 (23.5%) |
| 3 Vehicles | 21 (25.6%) | 23 (23.5%) |
| 4 Vehicles | 4 (4.9%) | 5 (5.1%) |
| 5 or more Vehicles | 5 (6.1%) | 2 (2.0%) |
| Total | 82 (100.0%) | 98 (100.0%) |
Commute Time in Bradford
The most frequently occuring commute durations in Bradford are 20 to 24 minutes (49 commuters, 27.2%), 30 to 34 minutes (28 commuters, 15.6%), and 5 to 9 minutes (21 commuters, 11.7%).
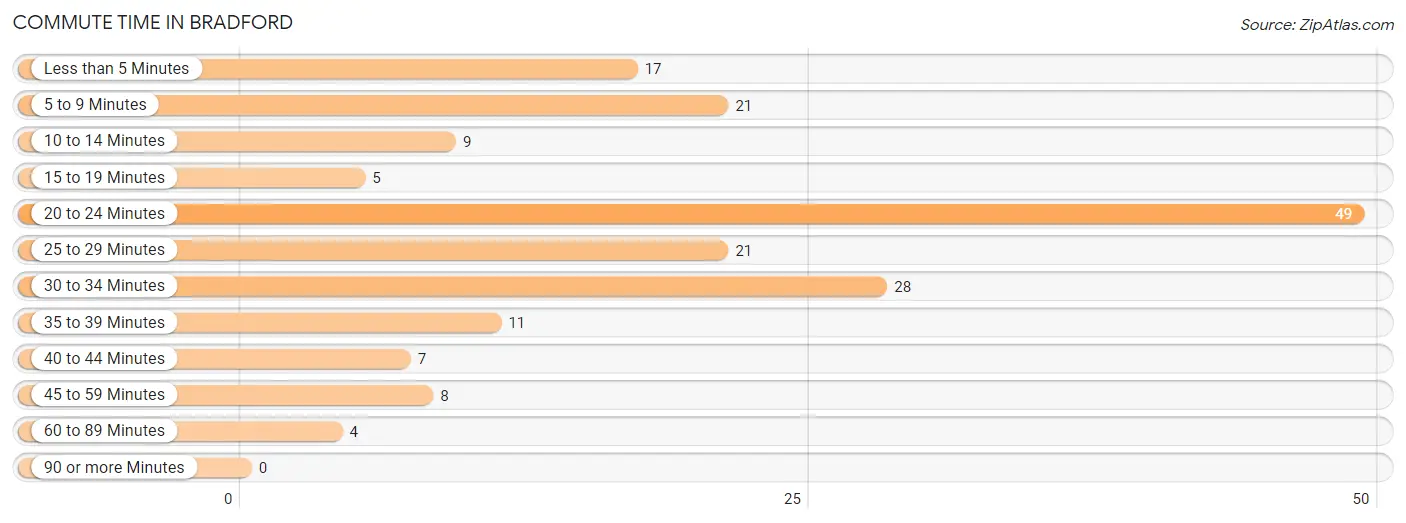
| Commute Time | # Commuters | % Commuters |
| Less than 5 Minutes | 17 | 9.4% |
| 5 to 9 Minutes | 21 | 11.7% |
| 10 to 14 Minutes | 9 | 5.0% |
| 15 to 19 Minutes | 5 | 2.8% |
| 20 to 24 Minutes | 49 | 27.2% |
| 25 to 29 Minutes | 21 | 11.7% |
| 30 to 34 Minutes | 28 | 15.6% |
| 35 to 39 Minutes | 11 | 6.1% |
| 40 to 44 Minutes | 7 | 3.9% |
| 45 to 59 Minutes | 8 | 4.4% |
| 60 to 89 Minutes | 4 | 2.2% |
| 90 or more Minutes | 0 | 0.0% |
Commute Time by Sex in Bradford
The most common commute times in Bradford are 20 to 24 minutes (18 commuters, 22.0%) for males and 20 to 24 minutes (31 commuters, 31.6%) for females.
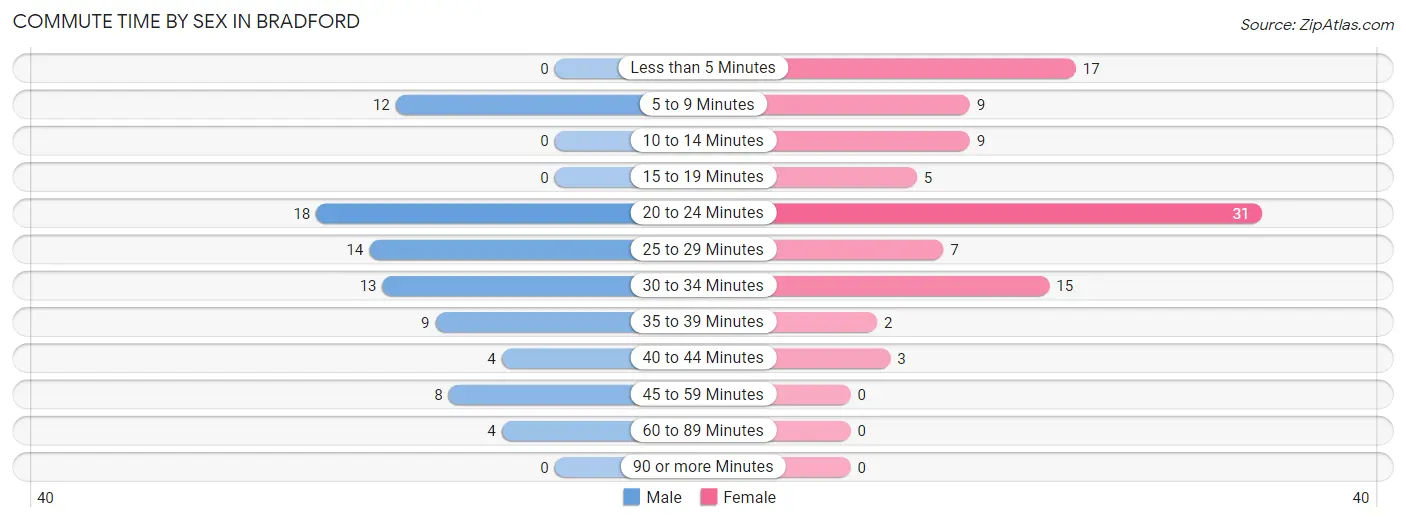
| Commute Time | Male | Female |
| Less than 5 Minutes | 0 (0.0%) | 17 (17.3%) |
| 5 to 9 Minutes | 12 (14.6%) | 9 (9.2%) |
| 10 to 14 Minutes | 0 (0.0%) | 9 (9.2%) |
| 15 to 19 Minutes | 0 (0.0%) | 5 (5.1%) |
| 20 to 24 Minutes | 18 (22.0%) | 31 (31.6%) |
| 25 to 29 Minutes | 14 (17.1%) | 7 (7.1%) |
| 30 to 34 Minutes | 13 (15.9%) | 15 (15.3%) |
| 35 to 39 Minutes | 9 (11.0%) | 2 (2.0%) |
| 40 to 44 Minutes | 4 (4.9%) | 3 (3.1%) |
| 45 to 59 Minutes | 8 (9.8%) | 0 (0.0%) |
| 60 to 89 Minutes | 4 (4.9%) | 0 (0.0%) |
| 90 or more Minutes | 0 (0.0%) | 0 (0.0%) |
Time of Departure to Work by Sex in Bradford
The most frequent times of departure to work in Bradford are 6:00 AM to 6:29 AM (22, 26.8%) for males and 7:30 AM to 7:59 AM (24, 24.5%) for females.
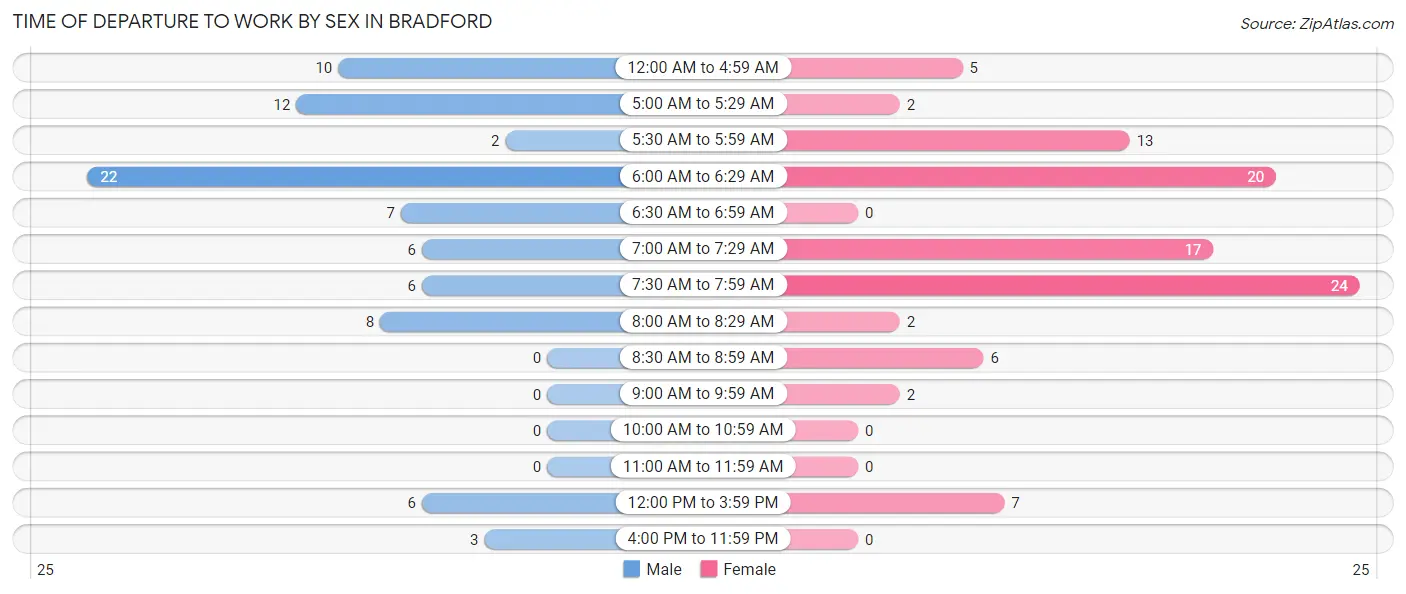
| Time of Departure | Male | Female |
| 12:00 AM to 4:59 AM | 10 (12.2%) | 5 (5.1%) |
| 5:00 AM to 5:29 AM | 12 (14.6%) | 2 (2.0%) |
| 5:30 AM to 5:59 AM | 2 (2.4%) | 13 (13.3%) |
| 6:00 AM to 6:29 AM | 22 (26.8%) | 20 (20.4%) |
| 6:30 AM to 6:59 AM | 7 (8.5%) | 0 (0.0%) |
| 7:00 AM to 7:29 AM | 6 (7.3%) | 17 (17.3%) |
| 7:30 AM to 7:59 AM | 6 (7.3%) | 24 (24.5%) |
| 8:00 AM to 8:29 AM | 8 (9.8%) | 2 (2.0%) |
| 8:30 AM to 8:59 AM | 0 (0.0%) | 6 (6.1%) |
| 9:00 AM to 9:59 AM | 0 (0.0%) | 2 (2.0%) |
| 10:00 AM to 10:59 AM | 0 (0.0%) | 0 (0.0%) |
| 11:00 AM to 11:59 AM | 0 (0.0%) | 0 (0.0%) |
| 12:00 PM to 3:59 PM | 6 (7.3%) | 7 (7.1%) |
| 4:00 PM to 11:59 PM | 3 (3.7%) | 0 (0.0%) |
| Total | 82 (100.0%) | 98 (100.0%) |
Housing Occupancy in Bradford
Occupancy by Ownership in Bradford
Of the total 232 dwellings in Bradford, owner-occupied units account for 124 (53.4%), while renter-occupied units make up 108 (46.6%).
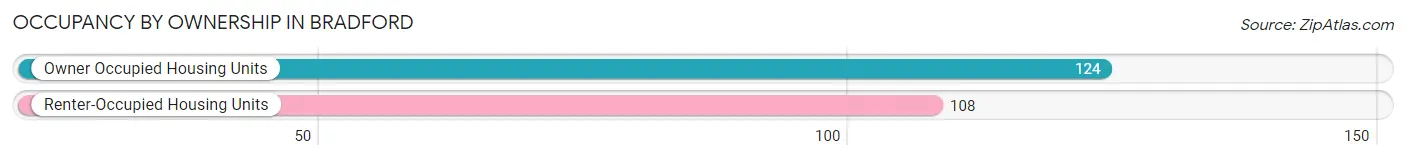
| Occupancy | # Housing Units | % Housing Units |
| Owner Occupied Housing Units | 124 | 53.4% |
| Renter-Occupied Housing Units | 108 | 46.6% |
| Total Occupied Housing Units | 232 | 100.0% |
Occupancy by Household Size in Bradford
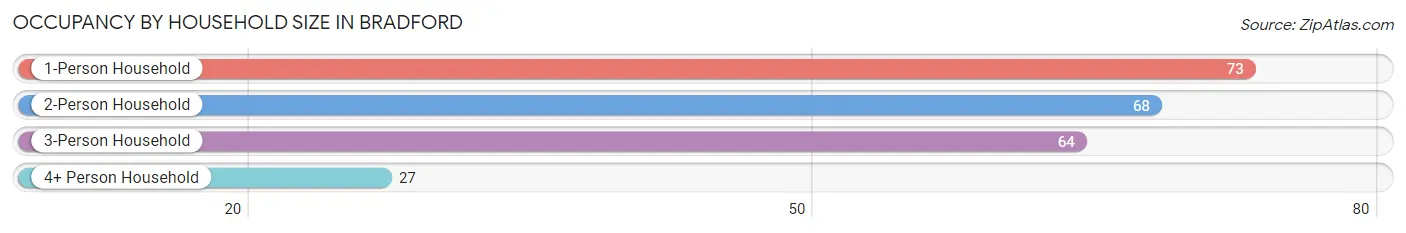
| Household Size | # Housing Units | % Housing Units |
| 1-Person Household | 73 | 31.5% |
| 2-Person Household | 68 | 29.3% |
| 3-Person Household | 64 | 27.6% |
| 4+ Person Household | 27 | 11.6% |
| Total Housing Units | 232 | 100.0% |
Occupancy by Ownership by Household Size in Bradford
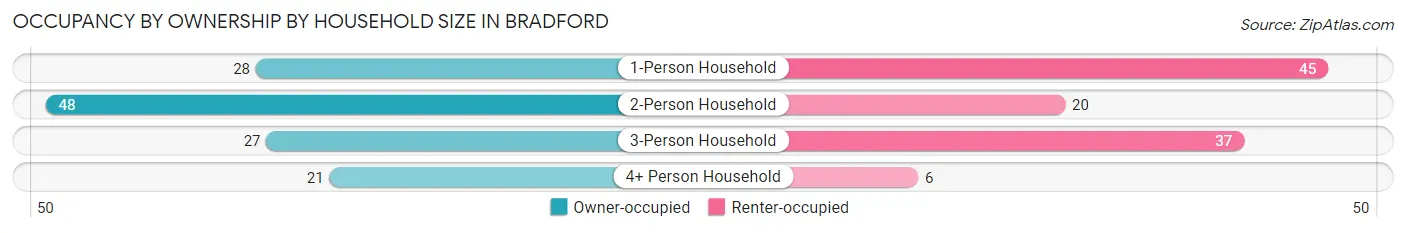
| Household Size | Owner-occupied | Renter-occupied |
| 1-Person Household | 28 (38.4%) | 45 (61.6%) |
| 2-Person Household | 48 (70.6%) | 20 (29.4%) |
| 3-Person Household | 27 (42.2%) | 37 (57.8%) |
| 4+ Person Household | 21 (77.8%) | 6 (22.2%) |
| Total Housing Units | 124 (53.4%) | 108 (46.6%) |
Occupancy by Educational Attainment in Bradford
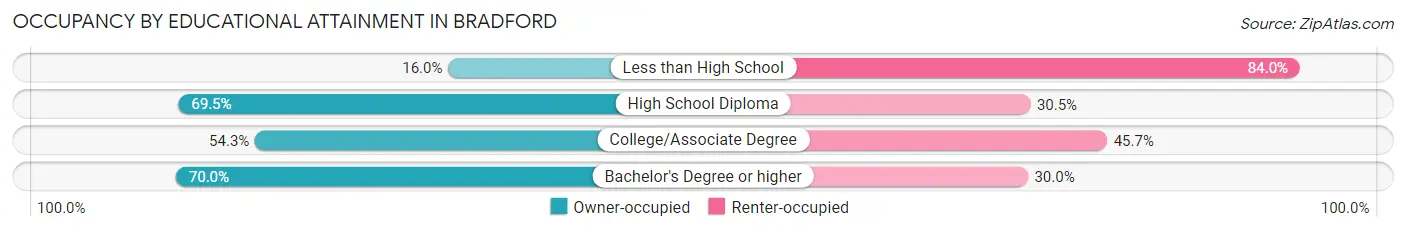
| Household Size | Owner-occupied | Renter-occupied |
| Less than High School | 8 (16.0%) | 42 (84.0%) |
| High School Diploma | 57 (69.5%) | 25 (30.5%) |
| College/Associate Degree | 38 (54.3%) | 32 (45.7%) |
| Bachelor's Degree or higher | 21 (70.0%) | 9 (30.0%) |
Occupancy by Age of Householder in Bradford
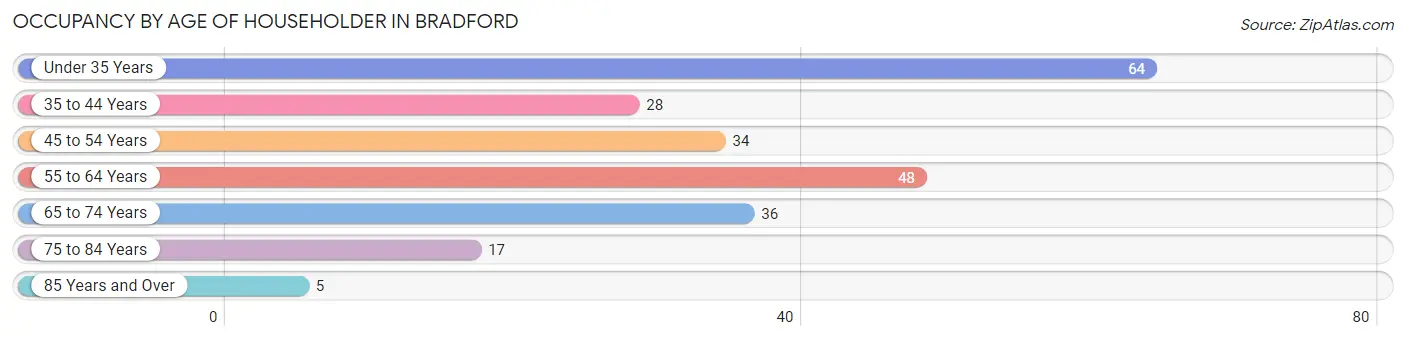
| Age Bracket | # Households | % Households |
| Under 35 Years | 64 | 27.6% |
| 35 to 44 Years | 28 | 12.1% |
| 45 to 54 Years | 34 | 14.7% |
| 55 to 64 Years | 48 | 20.7% |
| 65 to 74 Years | 36 | 15.5% |
| 75 to 84 Years | 17 | 7.3% |
| 85 Years and Over | 5 | 2.2% |
| Total | 232 | 100.0% |
Housing Finances in Bradford
Median Income by Occupancy in Bradford
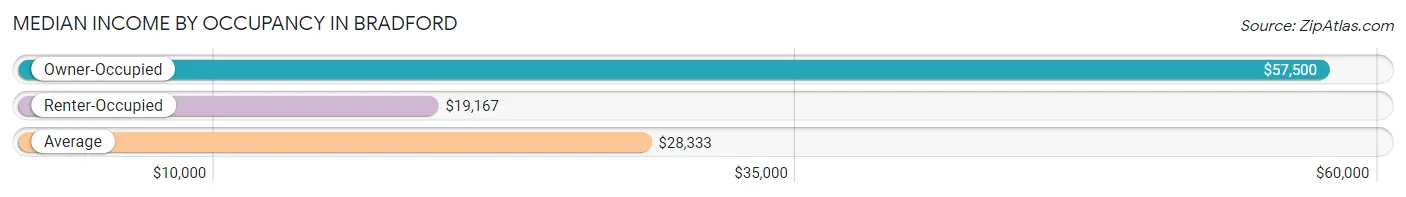
| Occupancy Type | # Households | Median Income |
| Owner-Occupied | 124 (53.4%) | $57,500 |
| Renter-Occupied | 108 (46.6%) | $19,167 |
| Average | 232 (100.0%) | $28,333 |
Occupancy by Householder Income Bracket in Bradford
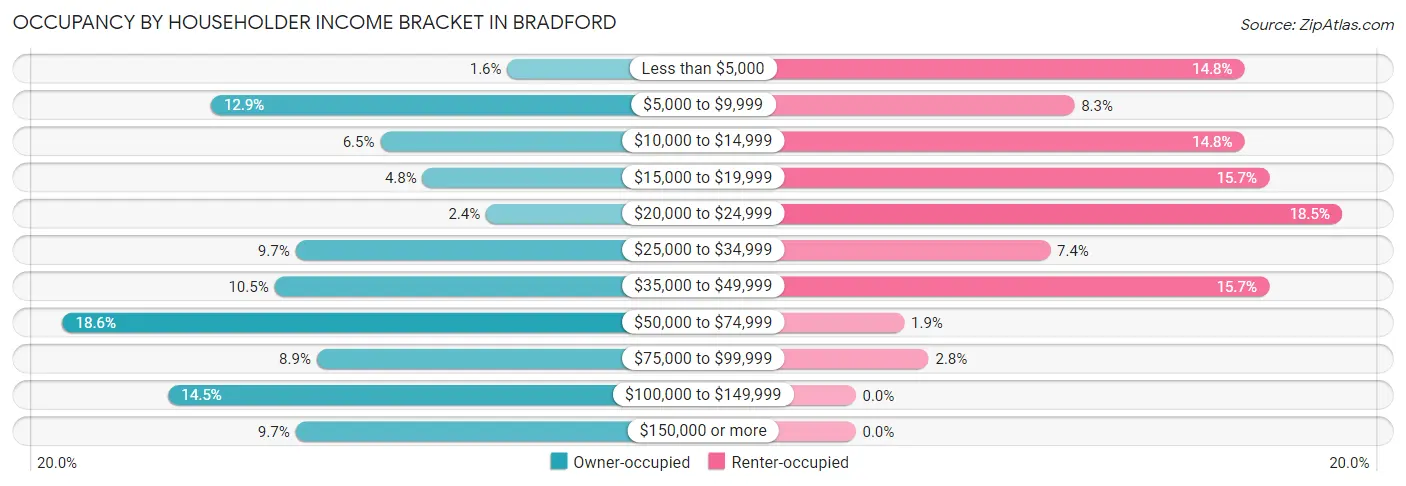
| Income Bracket | Owner-occupied | Renter-occupied |
| Less than $5,000 | 2 (1.6%) | 16 (14.8%) |
| $5,000 to $9,999 | 16 (12.9%) | 9 (8.3%) |
| $10,000 to $14,999 | 8 (6.5%) | 16 (14.8%) |
| $15,000 to $19,999 | 6 (4.8%) | 17 (15.7%) |
| $20,000 to $24,999 | 3 (2.4%) | 20 (18.5%) |
| $25,000 to $34,999 | 12 (9.7%) | 8 (7.4%) |
| $35,000 to $49,999 | 13 (10.5%) | 17 (15.7%) |
| $50,000 to $74,999 | 23 (18.5%) | 2 (1.8%) |
| $75,000 to $99,999 | 11 (8.9%) | 3 (2.8%) |
| $100,000 to $149,999 | 18 (14.5%) | 0 (0.0%) |
| $150,000 or more | 12 (9.7%) | 0 (0.0%) |
| Total | 124 (100.0%) | 108 (100.0%) |
Monthly Housing Cost Tiers in Bradford
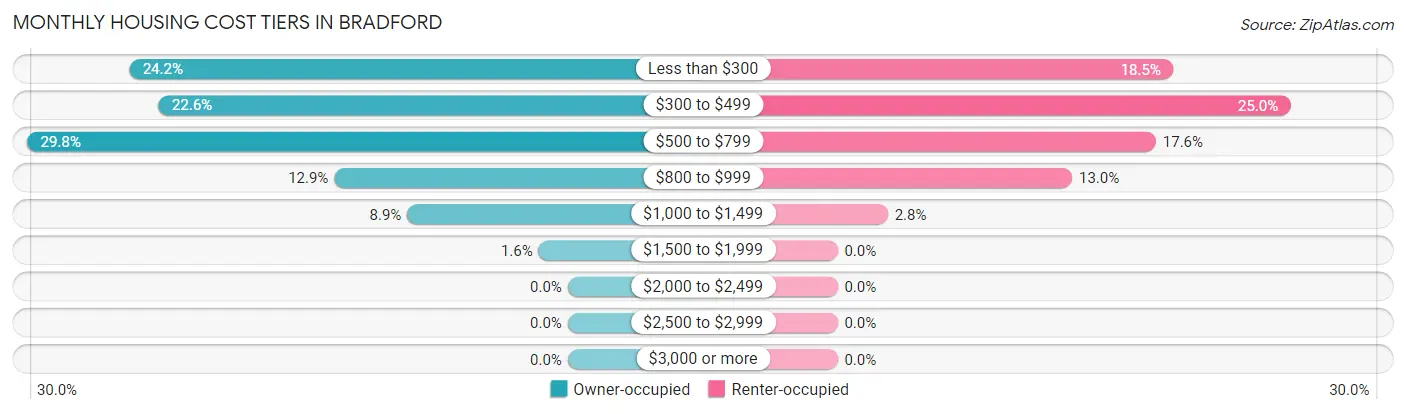
| Monthly Cost | Owner-occupied | Renter-occupied |
| Less than $300 | 30 (24.2%) | 20 (18.5%) |
| $300 to $499 | 28 (22.6%) | 27 (25.0%) |
| $500 to $799 | 37 (29.8%) | 19 (17.6%) |
| $800 to $999 | 16 (12.9%) | 14 (13.0%) |
| $1,000 to $1,499 | 11 (8.9%) | 3 (2.8%) |
| $1,500 to $1,999 | 2 (1.6%) | 0 (0.0%) |
| $2,000 to $2,499 | 0 (0.0%) | 0 (0.0%) |
| $2,500 to $2,999 | 0 (0.0%) | 0 (0.0%) |
| $3,000 or more | 0 (0.0%) | 0 (0.0%) |
| Total | 124 (100.0%) | 108 (100.0%) |
Physical Housing Characteristics in Bradford
Housing Structures in Bradford
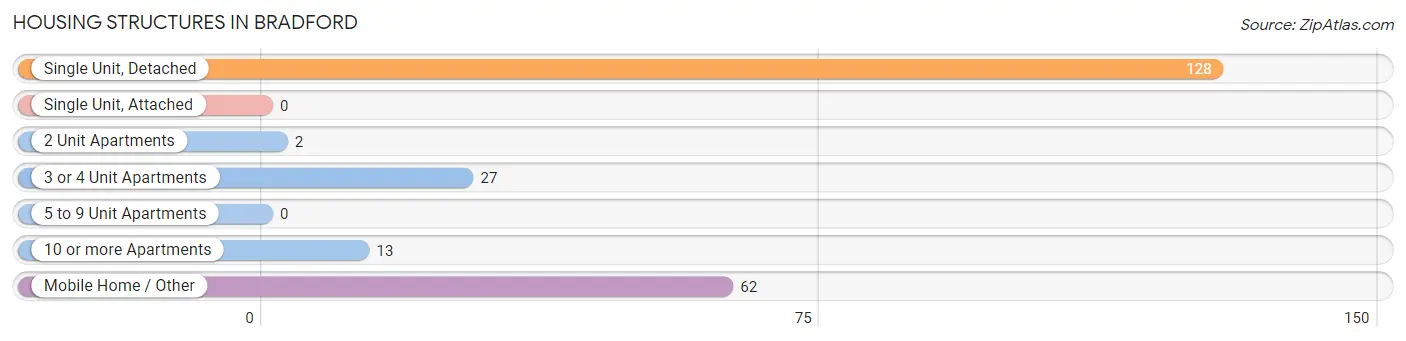
| Structure Type | # Housing Units | % Housing Units |
| Single Unit, Detached | 128 | 55.2% |
| Single Unit, Attached | 0 | 0.0% |
| 2 Unit Apartments | 2 | 0.9% |
| 3 or 4 Unit Apartments | 27 | 11.6% |
| 5 to 9 Unit Apartments | 0 | 0.0% |
| 10 or more Apartments | 13 | 5.6% |
| Mobile Home / Other | 62 | 26.7% |
| Total | 232 | 100.0% |
Housing Structures by Occupancy in Bradford
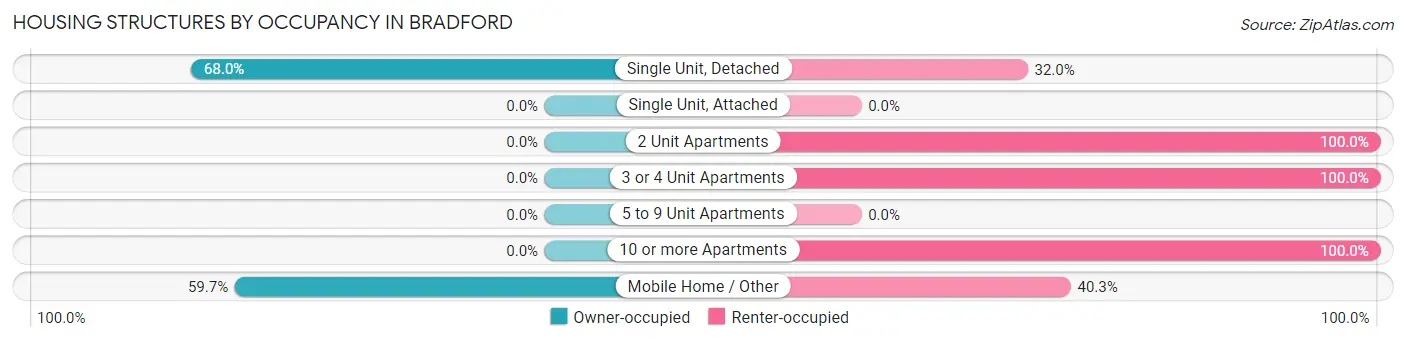
| Structure Type | Owner-occupied | Renter-occupied |
| Single Unit, Detached | 87 (68.0%) | 41 (32.0%) |
| Single Unit, Attached | 0 (0.0%) | 0 (0.0%) |
| 2 Unit Apartments | 0 (0.0%) | 2 (100.0%) |
| 3 or 4 Unit Apartments | 0 (0.0%) | 27 (100.0%) |
| 5 to 9 Unit Apartments | 0 (0.0%) | 0 (0.0%) |
| 10 or more Apartments | 0 (0.0%) | 13 (100.0%) |
| Mobile Home / Other | 37 (59.7%) | 25 (40.3%) |
| Total | 124 (53.4%) | 108 (46.6%) |
Housing Structures by Number of Rooms in Bradford
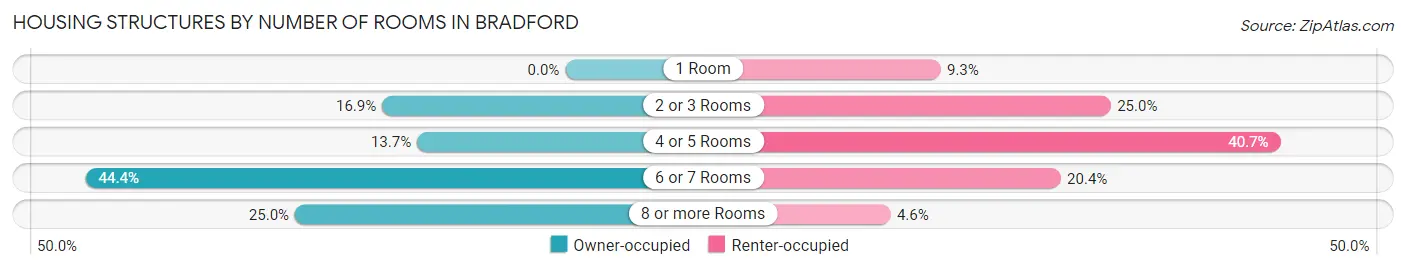
| Number of Rooms | Owner-occupied | Renter-occupied |
| 1 Room | 0 (0.0%) | 10 (9.3%) |
| 2 or 3 Rooms | 21 (16.9%) | 27 (25.0%) |
| 4 or 5 Rooms | 17 (13.7%) | 44 (40.7%) |
| 6 or 7 Rooms | 55 (44.4%) | 22 (20.4%) |
| 8 or more Rooms | 31 (25.0%) | 5 (4.6%) |
| Total | 124 (100.0%) | 108 (100.0%) |
Housing Structure by Heating Type in Bradford
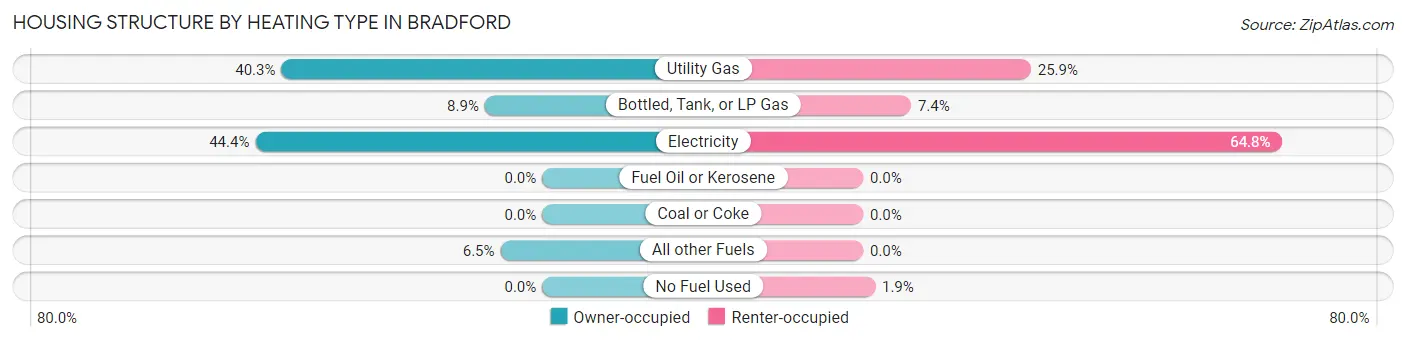
| Heating Type | Owner-occupied | Renter-occupied |
| Utility Gas | 50 (40.3%) | 28 (25.9%) |
| Bottled, Tank, or LP Gas | 11 (8.9%) | 8 (7.4%) |
| Electricity | 55 (44.4%) | 70 (64.8%) |
| Fuel Oil or Kerosene | 0 (0.0%) | 0 (0.0%) |
| Coal or Coke | 0 (0.0%) | 0 (0.0%) |
| All other Fuels | 8 (6.5%) | 0 (0.0%) |
| No Fuel Used | 0 (0.0%) | 2 (1.8%) |
| Total | 124 (100.0%) | 108 (100.0%) |
Household Vehicle Usage in Bradford
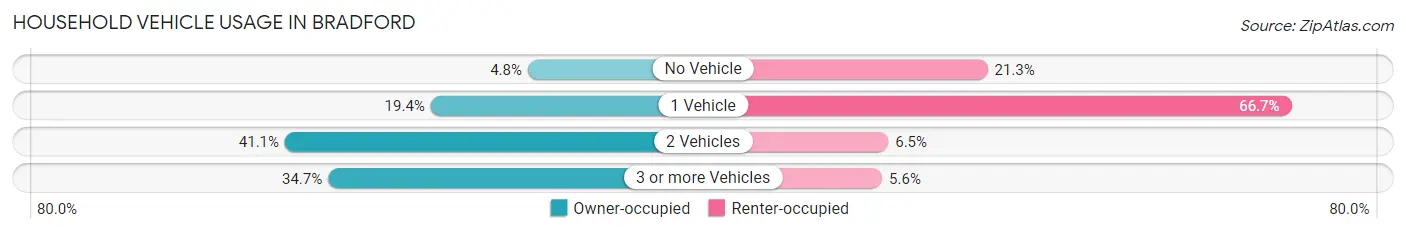
| Vehicles per Household | Owner-occupied | Renter-occupied |
| No Vehicle | 6 (4.8%) | 23 (21.3%) |
| 1 Vehicle | 24 (19.4%) | 72 (66.7%) |
| 2 Vehicles | 51 (41.1%) | 7 (6.5%) |
| 3 or more Vehicles | 43 (34.7%) | 6 (5.6%) |
| Total | 124 (100.0%) | 108 (100.0%) |
Real Estate & Mortgages in Bradford
Real Estate and Mortgage Overview in Bradford
| Characteristic | Without Mortgage | With Mortgage |
| Housing Units | 81 | 43 |
| Median Property Value | $57,900 | $83,600 |
| Median Household Income | $47,708 | $7 |
| Monthly Housing Costs | $438 | $0 |
| Real Estate Taxes | $700 | $10 |
Property Value by Mortgage Status in Bradford
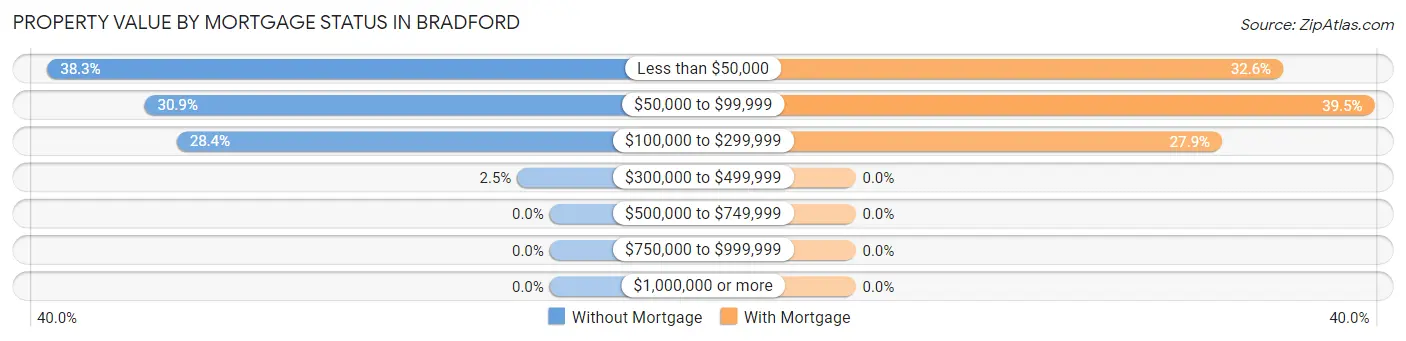
| Property Value | Without Mortgage | With Mortgage |
| Less than $50,000 | 31 (38.3%) | 14 (32.6%) |
| $50,000 to $99,999 | 25 (30.9%) | 17 (39.5%) |
| $100,000 to $299,999 | 23 (28.4%) | 12 (27.9%) |
| $300,000 to $499,999 | 2 (2.5%) | 0 (0.0%) |
| $500,000 to $749,999 | 0 (0.0%) | 0 (0.0%) |
| $750,000 to $999,999 | 0 (0.0%) | 0 (0.0%) |
| $1,000,000 or more | 0 (0.0%) | 0 (0.0%) |
| Total | 81 (100.0%) | 43 (100.0%) |
Household Income by Mortgage Status in Bradford
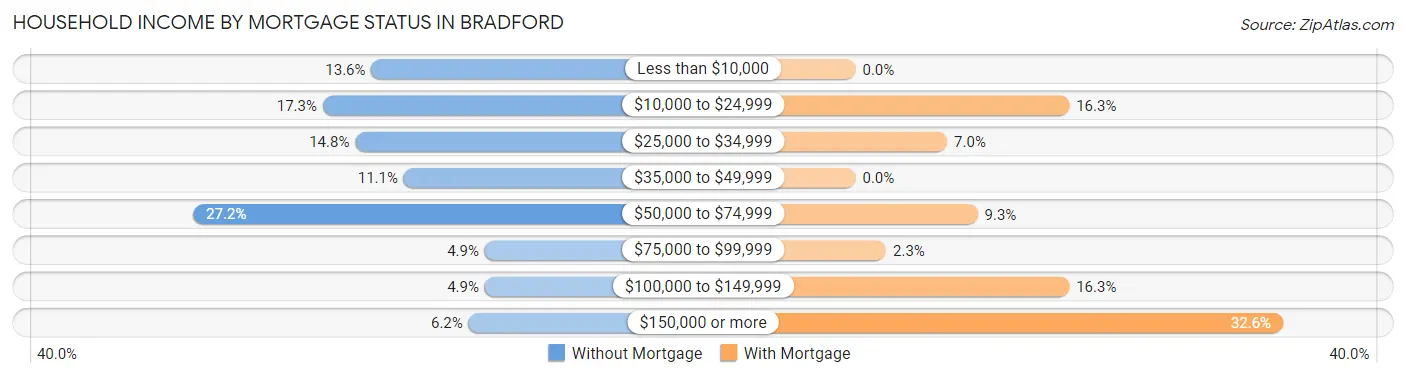
| Household Income | Without Mortgage | With Mortgage |
| Less than $10,000 | 11 (13.6%) | 0 (0.0%) |
| $10,000 to $24,999 | 14 (17.3%) | 7 (16.3%) |
| $25,000 to $34,999 | 12 (14.8%) | 3 (7.0%) |
| $35,000 to $49,999 | 9 (11.1%) | 0 (0.0%) |
| $50,000 to $74,999 | 22 (27.2%) | 4 (9.3%) |
| $75,000 to $99,999 | 4 (4.9%) | 1 (2.3%) |
| $100,000 to $149,999 | 4 (4.9%) | 7 (16.3%) |
| $150,000 or more | 5 (6.2%) | 14 (32.6%) |
| Total | 81 (100.0%) | 43 (100.0%) |
Property Value to Household Income Ratio in Bradford
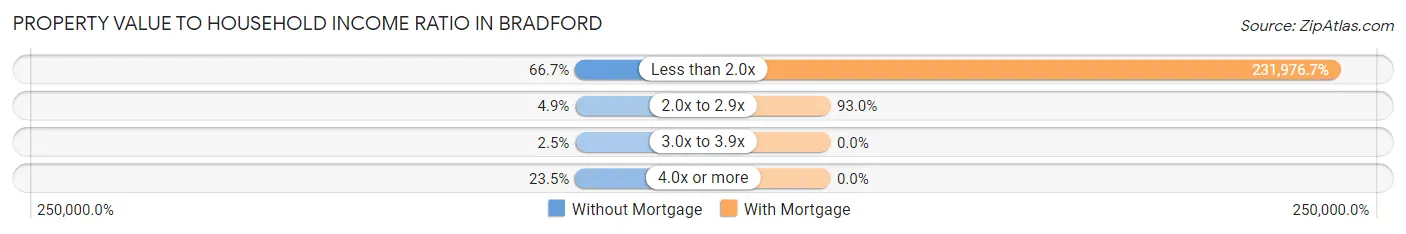
| Value-to-Income Ratio | Without Mortgage | With Mortgage |
| Less than 2.0x | 54 (66.7%) | 99,750 (231,976.7%) |
| 2.0x to 2.9x | 4 (4.9%) | 40 (93.0%) |
| 3.0x to 3.9x | 2 (2.5%) | 0 (0.0%) |
| 4.0x or more | 19 (23.5%) | 0 (0.0%) |
| Total | 81 (100.0%) | 43 (100.0%) |
Real Estate Taxes by Mortgage Status in Bradford
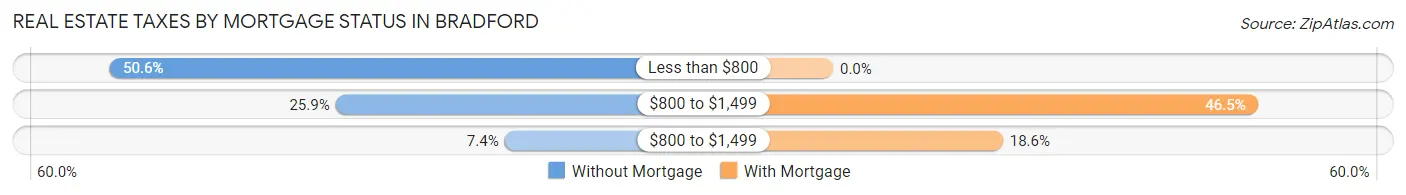
| Property Taxes | Without Mortgage | With Mortgage |
| Less than $800 | 41 (50.6%) | 0 (0.0%) |
| $800 to $1,499 | 21 (25.9%) | 20 (46.5%) |
| $800 to $1,499 | 6 (7.4%) | 8 (18.6%) |
| Total | 81 (100.0%) | 43 (100.0%) |
Health & Disability in Bradford
Health Insurance Coverage by Age in Bradford
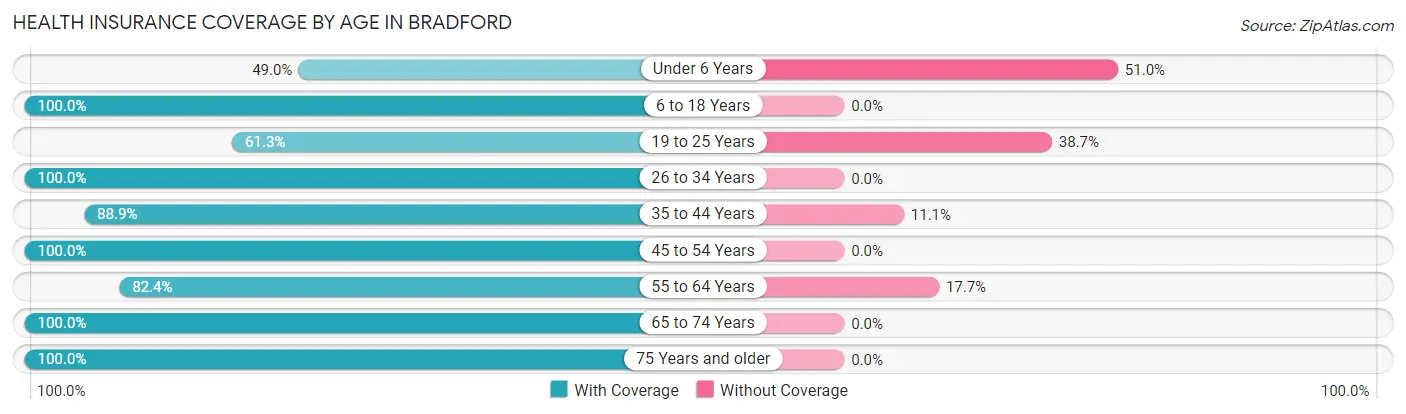
| Age Bracket | With Coverage | Without Coverage |
| Under 6 Years | 24 (49.0%) | 25 (51.0%) |
| 6 to 18 Years | 108 (100.0%) | 0 (0.0%) |
| 19 to 25 Years | 19 (61.3%) | 12 (38.7%) |
| 26 to 34 Years | 94 (100.0%) | 0 (0.0%) |
| 35 to 44 Years | 40 (88.9%) | 5 (11.1%) |
| 45 to 54 Years | 78 (100.0%) | 0 (0.0%) |
| 55 to 64 Years | 56 (82.4%) | 12 (17.6%) |
| 65 to 74 Years | 56 (100.0%) | 0 (0.0%) |
| 75 Years and older | 24 (100.0%) | 0 (0.0%) |
| Total | 499 (90.2%) | 54 (9.8%) |
Health Insurance Coverage by Citizenship Status in Bradford
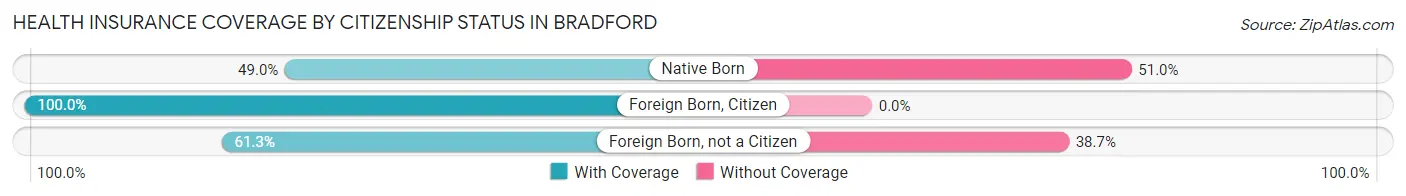
| Citizenship Status | With Coverage | Without Coverage |
| Native Born | 24 (49.0%) | 25 (51.0%) |
| Foreign Born, Citizen | 108 (100.0%) | 0 (0.0%) |
| Foreign Born, not a Citizen | 19 (61.3%) | 12 (38.7%) |
Health Insurance Coverage by Household Income in Bradford
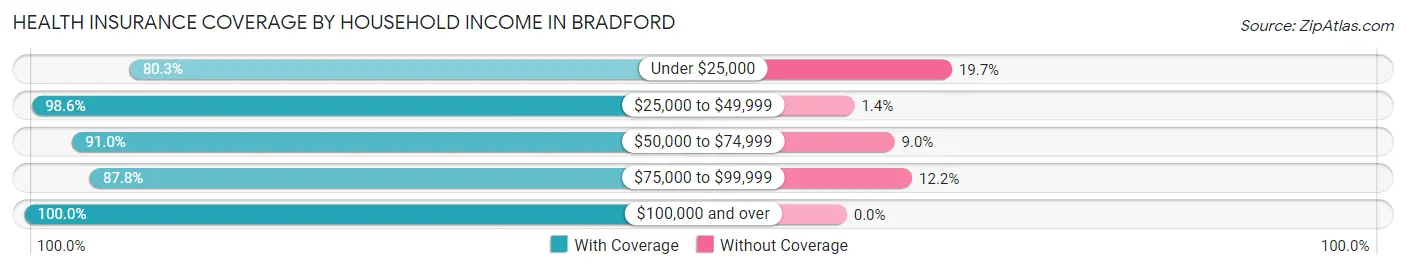
| Household Income | With Coverage | Without Coverage |
| Under $25,000 | 163 (80.3%) | 40 (19.7%) |
| $25,000 to $49,999 | 137 (98.6%) | 2 (1.4%) |
| $50,000 to $74,999 | 61 (91.0%) | 6 (9.0%) |
| $75,000 to $99,999 | 43 (87.8%) | 6 (12.2%) |
| $100,000 and over | 95 (100.0%) | 0 (0.0%) |
Public vs Private Health Insurance Coverage by Age in Bradford
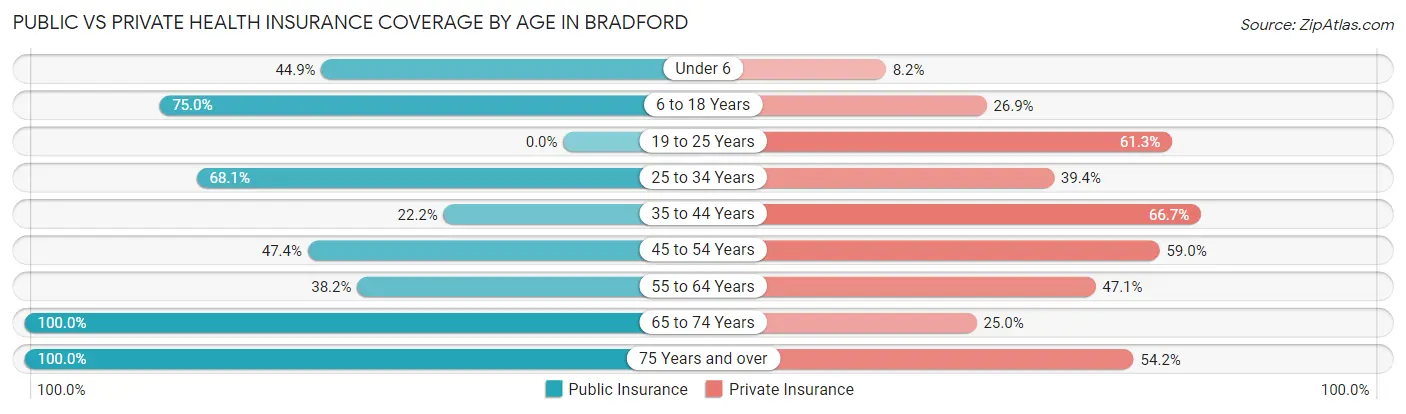
| Age Bracket | Public Insurance | Private Insurance |
| Under 6 | 22 (44.9%) | 4 (8.2%) |
| 6 to 18 Years | 81 (75.0%) | 29 (26.9%) |
| 19 to 25 Years | 0 (0.0%) | 19 (61.3%) |
| 25 to 34 Years | 64 (68.1%) | 37 (39.4%) |
| 35 to 44 Years | 10 (22.2%) | 30 (66.7%) |
| 45 to 54 Years | 37 (47.4%) | 46 (59.0%) |
| 55 to 64 Years | 26 (38.2%) | 32 (47.1%) |
| 65 to 74 Years | 56 (100.0%) | 14 (25.0%) |
| 75 Years and over | 24 (100.0%) | 13 (54.2%) |
| Total | 320 (57.9%) | 224 (40.5%) |
Disability Status by Sex by Age in Bradford
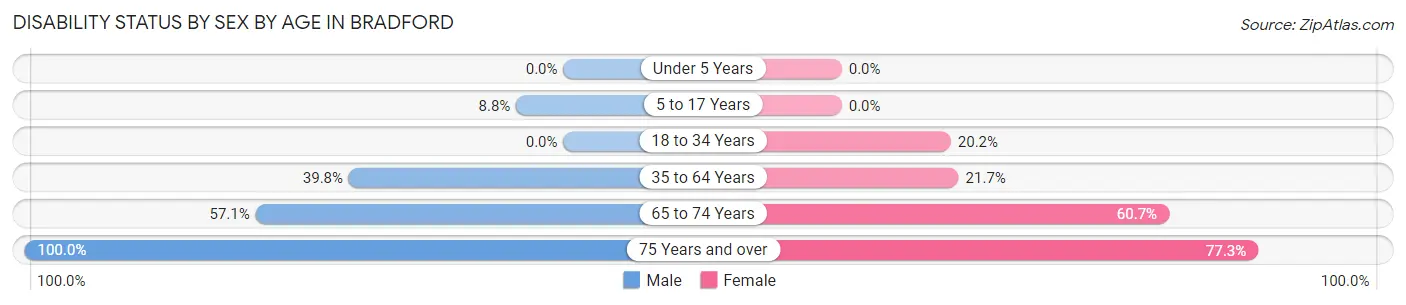
| Age Bracket | Male | Female |
| Under 5 Years | 0 (0.0%) | 0 (0.0%) |
| 5 to 17 Years | 7 (8.7%) | 0 (0.0%) |
| 18 to 34 Years | 0 (0.0%) | 17 (20.2%) |
| 35 to 64 Years | 43 (39.8%) | 18 (21.7%) |
| 65 to 74 Years | 16 (57.1%) | 17 (60.7%) |
| 75 Years and over | 2 (100.0%) | 17 (77.3%) |
Disability Class by Sex by Age in Bradford
Disability Class: Hearing Difficulty
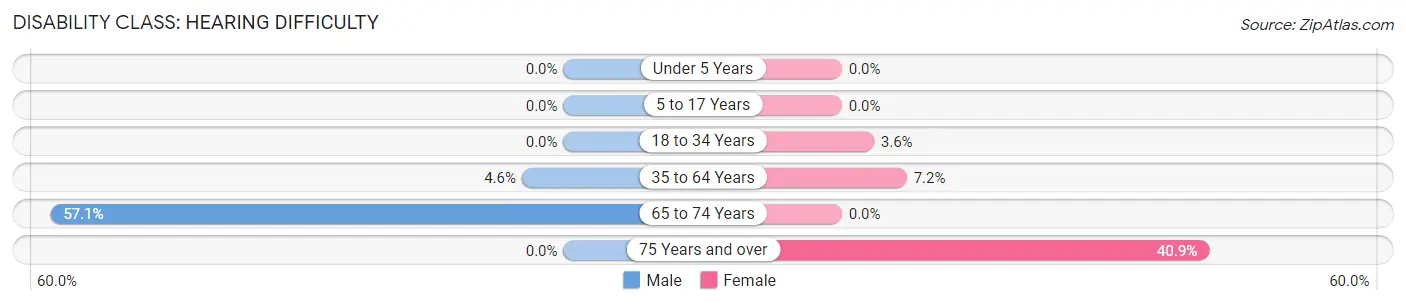
| Age Bracket | Male | Female |
| Under 5 Years | 0 (0.0%) | 0 (0.0%) |
| 5 to 17 Years | 0 (0.0%) | 0 (0.0%) |
| 18 to 34 Years | 0 (0.0%) | 3 (3.6%) |
| 35 to 64 Years | 5 (4.6%) | 6 (7.2%) |
| 65 to 74 Years | 16 (57.1%) | 0 (0.0%) |
| 75 Years and over | 0 (0.0%) | 9 (40.9%) |
Disability Class: Vision Difficulty
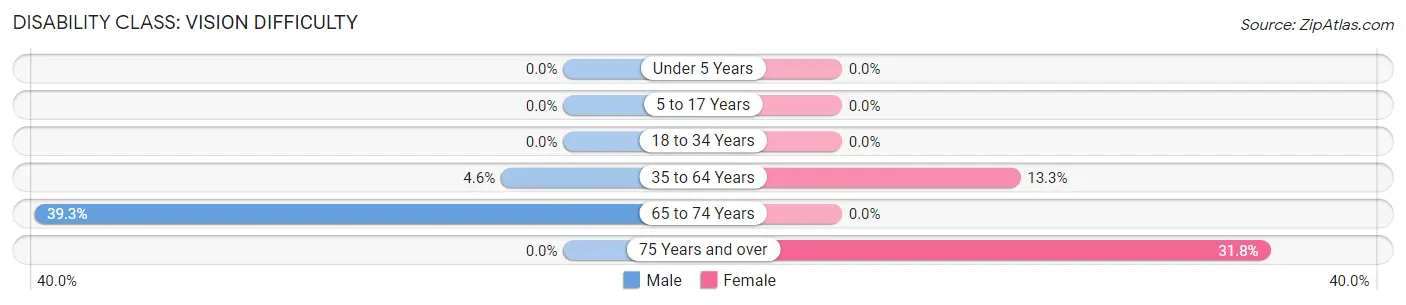
| Age Bracket | Male | Female |
| Under 5 Years | 0 (0.0%) | 0 (0.0%) |
| 5 to 17 Years | 0 (0.0%) | 0 (0.0%) |
| 18 to 34 Years | 0 (0.0%) | 0 (0.0%) |
| 35 to 64 Years | 5 (4.6%) | 11 (13.3%) |
| 65 to 74 Years | 11 (39.3%) | 0 (0.0%) |
| 75 Years and over | 0 (0.0%) | 7 (31.8%) |
Disability Class: Cognitive Difficulty
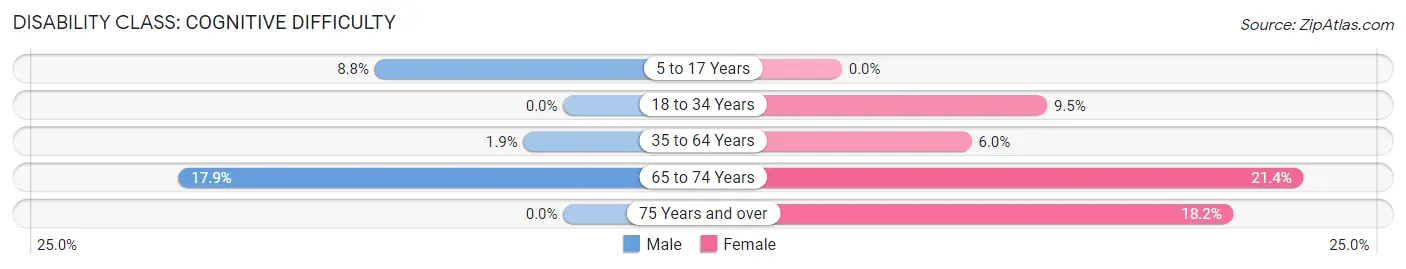
| Age Bracket | Male | Female |
| 5 to 17 Years | 7 (8.7%) | 0 (0.0%) |
| 18 to 34 Years | 0 (0.0%) | 8 (9.5%) |
| 35 to 64 Years | 2 (1.8%) | 5 (6.0%) |
| 65 to 74 Years | 5 (17.9%) | 6 (21.4%) |
| 75 Years and over | 0 (0.0%) | 4 (18.2%) |
Disability Class: Ambulatory Difficulty
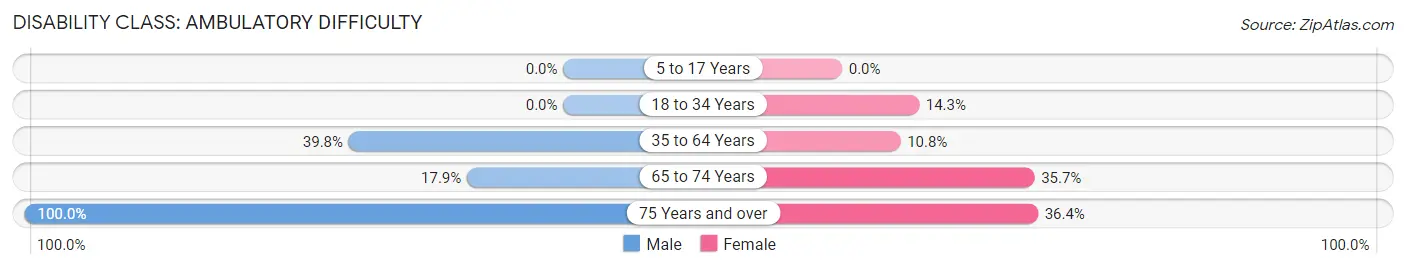
| Age Bracket | Male | Female |
| 5 to 17 Years | 0 (0.0%) | 0 (0.0%) |
| 18 to 34 Years | 0 (0.0%) | 12 (14.3%) |
| 35 to 64 Years | 43 (39.8%) | 9 (10.8%) |
| 65 to 74 Years | 5 (17.9%) | 10 (35.7%) |
| 75 Years and over | 2 (100.0%) | 8 (36.4%) |
Disability Class: Self-Care Difficulty
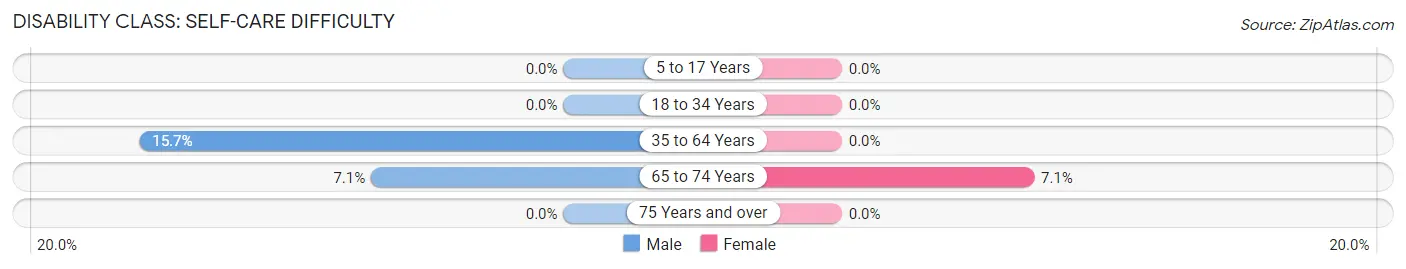
| Age Bracket | Male | Female |
| 5 to 17 Years | 0 (0.0%) | 0 (0.0%) |
| 18 to 34 Years | 0 (0.0%) | 0 (0.0%) |
| 35 to 64 Years | 17 (15.7%) | 0 (0.0%) |
| 65 to 74 Years | 2 (7.1%) | 2 (7.1%) |
| 75 Years and over | 0 (0.0%) | 0 (0.0%) |
Technology Access in Bradford
Computing Device Access in Bradford
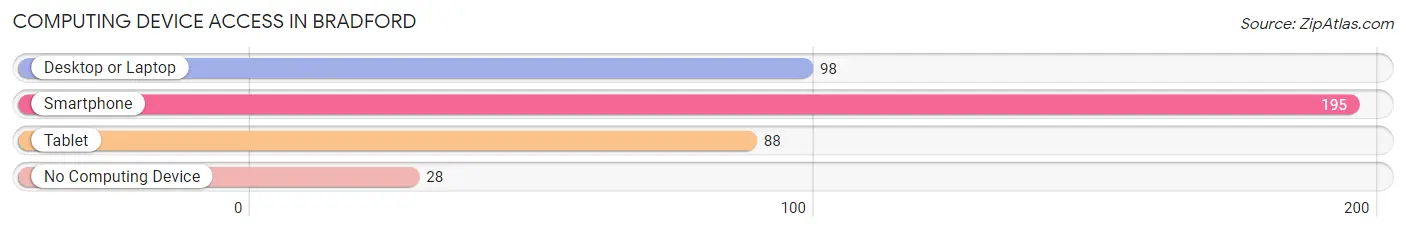
| Device Type | # Households | % Households |
| Desktop or Laptop | 98 | 42.2% |
| Smartphone | 195 | 84.1% |
| Tablet | 88 | 37.9% |
| No Computing Device | 28 | 12.1% |
| Total | 232 | 100.0% |
Internet Access in Bradford
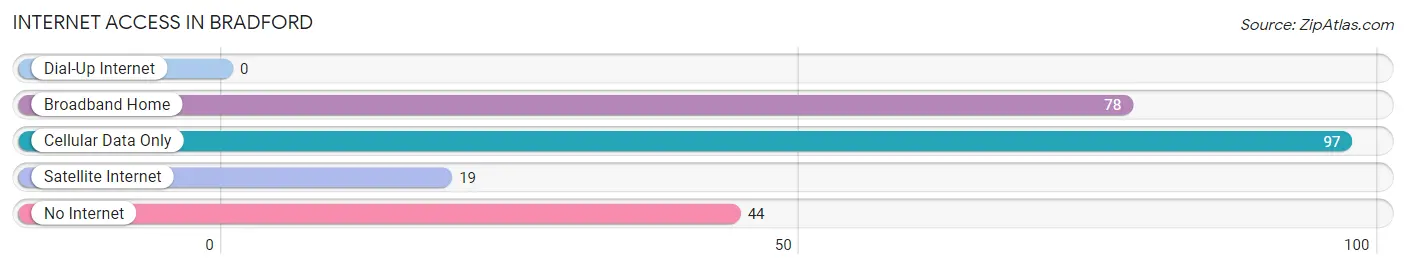
| Internet Type | # Households | % Households |
| Dial-Up Internet | 0 | 0.0% |
| Broadband Home | 78 | 33.6% |
| Cellular Data Only | 97 | 41.8% |
| Satellite Internet | 19 | 8.2% |
| No Internet | 44 | 19.0% |
| Total | 232 | 100.0% |
Bradford Summary
Bradford is a city located in White County, Arkansas, United States. It is situated in the foothills of the Ozark Mountains, approximately 30 miles northeast of Little Rock. The population was 1,845 at the 2010 census.
History
Bradford was founded in 1871 by a group of settlers from the nearby town of Searcy. The town was named after the Bradford family, who were among the first settlers. The town was incorporated in 1881.
In the early 1900s, Bradford was a thriving agricultural community, with cotton, corn, and other crops being grown in the area. The town also had a number of businesses, including a bank, a hotel, a sawmill, and a gristmill.
In the 1920s, Bradford began to experience a decline in population as many of its residents moved away to larger cities in search of better job opportunities. The Great Depression of the 1930s further exacerbated the town’s decline, and by 1940, the population had dropped to just over 500.
In the 1950s, Bradford began to experience a resurgence in population as the town became a popular destination for tourists. The town was also home to a number of popular resorts, including the Bradford Resort and the Bradford Inn.
Geography
Bradford is located at 35°25'25" North, 92°2'17" West (35.423, -92.038). According to the United States Census Bureau, the city has a total area of 1.3 square miles (3.4 km2), all land.
Economy
The economy of Bradford is largely based on agriculture and tourism. The town is home to a number of farms, which produce a variety of crops, including cotton, corn, soybeans, and wheat. The town is also home to a number of popular resorts, which attract tourists from all over the country.
Demographics
As of the 2010 census, there were 1,845 people, 745 households, and 486 families residing in the city. The population density was 1,420.8 people per square mile (548.7/km2). There were 845 housing units at an average density of 645.4 per square mile (249.3/km2). The racial makeup of the city was 97.2% White, 0.3% African American, 0.2% Native American, 0.2% Asian, 0.1% Pacific Islander, 0.7% from other races, and 1.3% from two or more races. Hispanic or Latino of any race were 1.7% of the population.
There were 745 households, out of which 28.2% had children under the age of 18 living with them, 48.2% were married couples living together, 12.3% had a female householder with no husband present, and 35.2% were non-families. 30.2% of all households were made up of individuals, and 14.2% had someone living alone who was 65 years of age or older. The average household size was 2.41 and the average family size was 2.98.
In the city, the population was spread out, with 24.2% under the age of 18, 8.2% from 18 to 24, 25.2% from 25 to 44, 24.2% from 45 to 64, and 18.2% who were 65 years of age or older. The median age was 39 years. For every 100 females, there were 87.2 males. For every 100 females age 18 and over, there were 83.2 males.
The median income for a household in the city was $30,000, and the median income for a family was $36,250. Males had a median income of $30,000 versus $20,000 for females. The per capita income for the city was $15,945. About 11.2% of families and 14.2% of the population were below the poverty line, including 19.2% of those under age 18 and 11.2% of those age 65 or over.
Common Questions
What is Per Capita Income in Bradford?
Per Capita income in Bradford is $19,858.
What is the Median Family Income in Bradford?
Median Family Income in Bradford is $45,000.
What is the Median Household income in Bradford?
Median Household Income in Bradford is $28,333.
What is Income or Wage Gap in Bradford?
Income or Wage Gap in Bradford is 0.3%.
Women in Bradford earn 99.7 cents for every dollar earned by a man.
What is Inequality or Gini Index in Bradford?
Inequality or Gini Index in Bradford is 0.52.
What is the Total Population of Bradford?
Total Population of Bradford is 553.
What is the Total Male Population of Bradford?
Total Male Population of Bradford is 272.
What is the Total Female Population of Bradford?
Total Female Population of Bradford is 281.
What is the Ratio of Males per 100 Females in Bradford?
There are 96.80 Males per 100 Females in Bradford.
What is the Ratio of Females per 100 Males in Bradford?
There are 103.31 Females per 100 Males in Bradford.
What is the Median Population Age in Bradford?
Median Population Age in Bradford is 34.6 Years.
What is the Average Family Size in Bradford
Average Family Size in Bradford is 2.9 People.
What is the Average Household Size in Bradford
Average Household Size in Bradford is 2.4 People.
How Large is the Labor Force in Bradford?
There are 196 People in the Labor Forcein in Bradford.
What is the Percentage of People in the Labor Force in Bradford?
48.0% of People are in the Labor Force in Bradford.
What is the Unemployment Rate in Bradford?
Unemployment Rate in Bradford is 7.1%.