Courtland, MN Map & Demographics
Courtland Map
Courtland Overview
$47,025
PER CAPITA INCOME
$116,154
AVG FAMILY INCOME
$102,546
AVG HOUSEHOLD INCOME
0.3%
WAGE / INCOME GAP [ % ]
99.7¢/ $1
WAGE / INCOME GAP [ $ ]
0.37
INEQUALITY / GINI INDEX
800
TOTAL POPULATION
472
MALE POPULATION
328
FEMALE POPULATION
143.90
MALES / 100 FEMALES
69.49
FEMALES / 100 MALES
39.6
MEDIAN AGE
3.0
AVG FAMILY SIZE
2.3
AVG HOUSEHOLD SIZE
469
LABOR FORCE [ PEOPLE ]
74.1%
PERCENT IN LABOR FORCE
0.9%
UNEMPLOYMENT RATE
Courtland Zip Codes
Courtland Area Codes
Income in Courtland
Income Overview in Courtland
Per Capita Income in Courtland is $47,025, while median incomes of families and households are $116,154 and $102,546 respectively.
| Characteristic | Number | Measure |
| Per Capita Income | 800 | $47,025 |
| Median Family Income | 216 | $116,154 |
| Mean Family Income | 216 | $136,290 |
| Median Household Income | 345 | $102,546 |
| Mean Household Income | 345 | $111,485 |
| Income Deficit | 216 | $0 |
| Wage / Income Gap (%) | 800 | 0.30% |
| Wage / Income Gap ($) | 800 | 99.70¢ per $1 |
| Gini / Inequality Index | 800 | 0.37 |
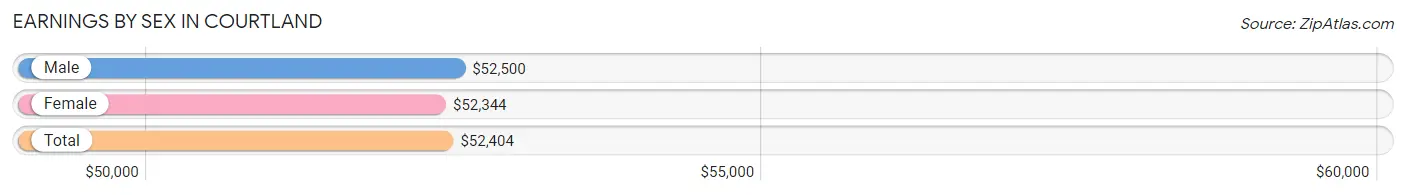
Earnings by Sex in Courtland
Average Earnings in Courtland are $52,404, $52,500 for men and $52,344 for women, a difference of 0.3%.
| Sex | Number | Average Earnings |
| Male | 296 (58.4%) | $52,500 |
| Female | 211 (41.6%) | $52,344 |
| Total | 507 (100.0%) | $52,404 |
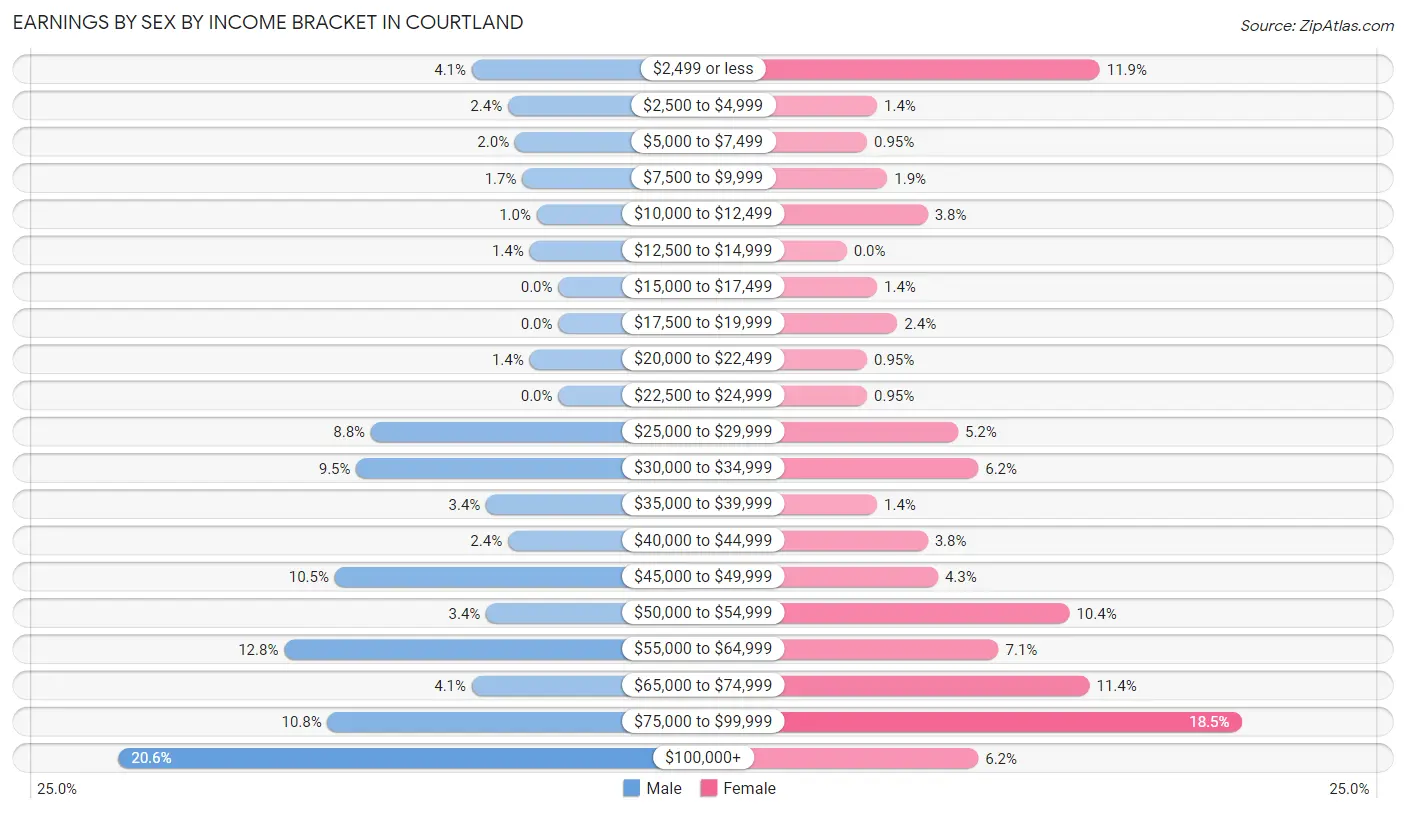
Earnings by Sex by Income Bracket in Courtland
The most common earnings brackets in Courtland are $100,000+ for men (61 | 20.6%) and $75,000 to $99,999 for women (39 | 18.5%).
| Income | Male | Female |
| $2,499 or less | 12 (4.1%) | 25 (11.8%) |
| $2,500 to $4,999 | 7 (2.4%) | 3 (1.4%) |
| $5,000 to $7,499 | 6 (2.0%) | 2 (0.9%) |
| $7,500 to $9,999 | 5 (1.7%) | 4 (1.9%) |
| $10,000 to $12,499 | 3 (1.0%) | 8 (3.8%) |
| $12,500 to $14,999 | 4 (1.3%) | 0 (0.0%) |
| $15,000 to $17,499 | 0 (0.0%) | 3 (1.4%) |
| $17,500 to $19,999 | 0 (0.0%) | 5 (2.4%) |
| $20,000 to $22,499 | 4 (1.3%) | 2 (0.9%) |
| $22,500 to $24,999 | 0 (0.0%) | 2 (0.9%) |
| $25,000 to $29,999 | 26 (8.8%) | 11 (5.2%) |
| $30,000 to $34,999 | 28 (9.5%) | 13 (6.2%) |
| $35,000 to $39,999 | 10 (3.4%) | 3 (1.4%) |
| $40,000 to $44,999 | 7 (2.4%) | 8 (3.8%) |
| $45,000 to $49,999 | 31 (10.5%) | 9 (4.3%) |
| $50,000 to $54,999 | 10 (3.4%) | 22 (10.4%) |
| $55,000 to $64,999 | 38 (12.8%) | 15 (7.1%) |
| $65,000 to $74,999 | 12 (4.1%) | 24 (11.4%) |
| $75,000 to $99,999 | 32 (10.8%) | 39 (18.5%) |
| $100,000+ | 61 (20.6%) | 13 (6.2%) |
| Total | 296 (100.0%) | 211 (100.0%) |
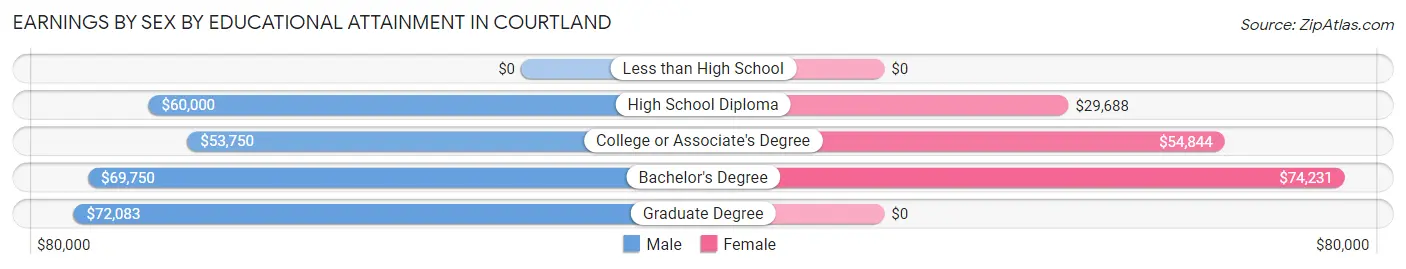
Earnings by Sex by Educational Attainment in Courtland
Average earnings in Courtland are $59,643 for men and $55,000 for women, a difference of 7.8%. Men with an educational attainment of graduate degree enjoy the highest average annual earnings of $72,083, while those with college or associate's degree education earn the least with $53,750. Women with an educational attainment of bachelor's degree earn the most with the average annual earnings of $74,231, while those with high school diploma education have the smallest earnings of $29,688.
| Educational Attainment | Male Income | Female Income |
| Less than High School | - | - |
| High School Diploma | $60,000 | $29,688 |
| College or Associate's Degree | $53,750 | $54,844 |
| Bachelor's Degree | $69,750 | $74,231 |
| Graduate Degree | $72,083 | $0 |
| Total | $59,643 | $55,000 |
Family Income in Courtland
Family Income Brackets in Courtland
According to the Courtland family income data, there are 64 families falling into the $100,000 to $149,999 income range, which is the most common income bracket and makes up 29.6% of all families.
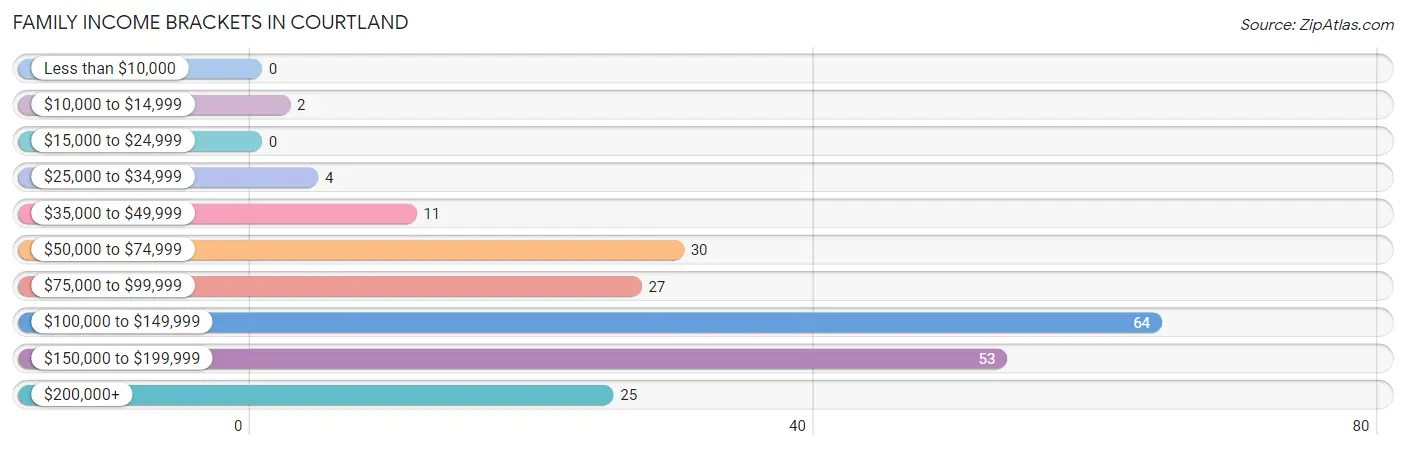
| Income Bracket | # Families | % Families |
| Less than $10,000 | 0 | 0.0% |
| $10,000 to $14,999 | 2 | 0.9% |
| $15,000 to $24,999 | 0 | 0.0% |
| $25,000 to $34,999 | 4 | 1.9% |
| $35,000 to $49,999 | 11 | 5.1% |
| $50,000 to $74,999 | 30 | 13.9% |
| $75,000 to $99,999 | 27 | 12.5% |
| $100,000 to $149,999 | 64 | 29.6% |
| $150,000 to $199,999 | 53 | 24.5% |
| $200,000+ | 25 | 11.6% |
Family Income by Famaliy Size in Courtland
5-person families (36 | 16.7%) account for the highest median family income in Courtland with $178,750 per family, while 3-person families (30 | 13.9%) have the highest median income of $50,278 per family member.
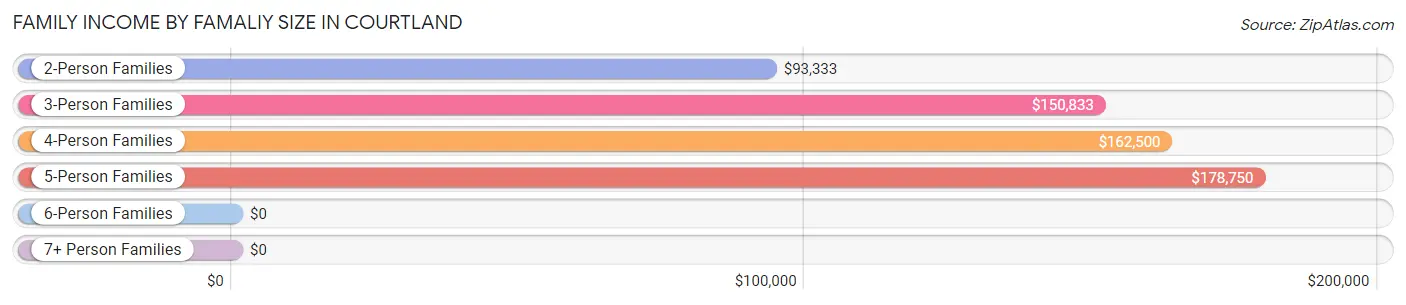
| Income Bracket | # Families | Median Income |
| 2-Person Families | 114 (52.8%) | $93,333 |
| 3-Person Families | 30 (13.9%) | $150,833 |
| 4-Person Families | 30 (13.9%) | $162,500 |
| 5-Person Families | 36 (16.7%) | $178,750 |
| 6-Person Families | 6 (2.8%) | $0 |
| 7+ Person Families | 0 (0.0%) | $0 |
| Total | 216 (100.0%) | $116,154 |
Family Income by Number of Earners in Courtland
The median family income in Courtland is $116,154, with families comprising 3+ earners (34) having the highest median family income of $162,500, while families with no earners (25) have the lowest median family income of $58,750, accounting for 15.7% and 11.6% of families, respectively.
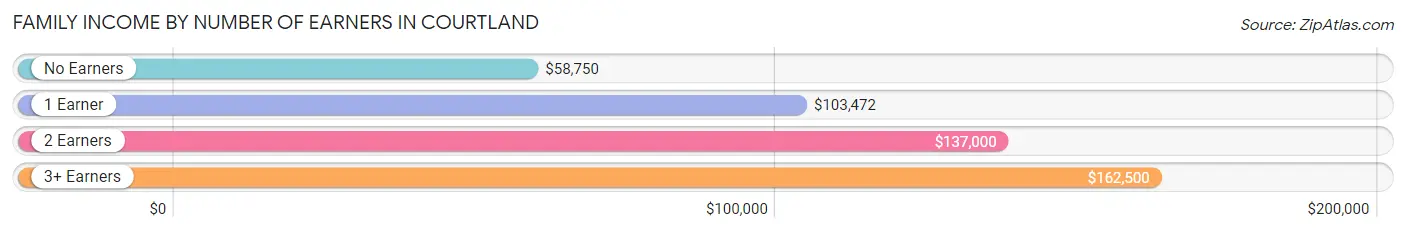
| Number of Earners | # Families | Median Income |
| No Earners | 25 (11.6%) | $58,750 |
| 1 Earner | 33 (15.3%) | $103,472 |
| 2 Earners | 124 (57.4%) | $137,000 |
| 3+ Earners | 34 (15.7%) | $162,500 |
| Total | 216 (100.0%) | $116,154 |
Household Income in Courtland
Household Income Brackets in Courtland
With 94 households falling in the category, the $100,000 to $149,999 income range is the most frequent in Courtland, accounting for 27.3% of all households.
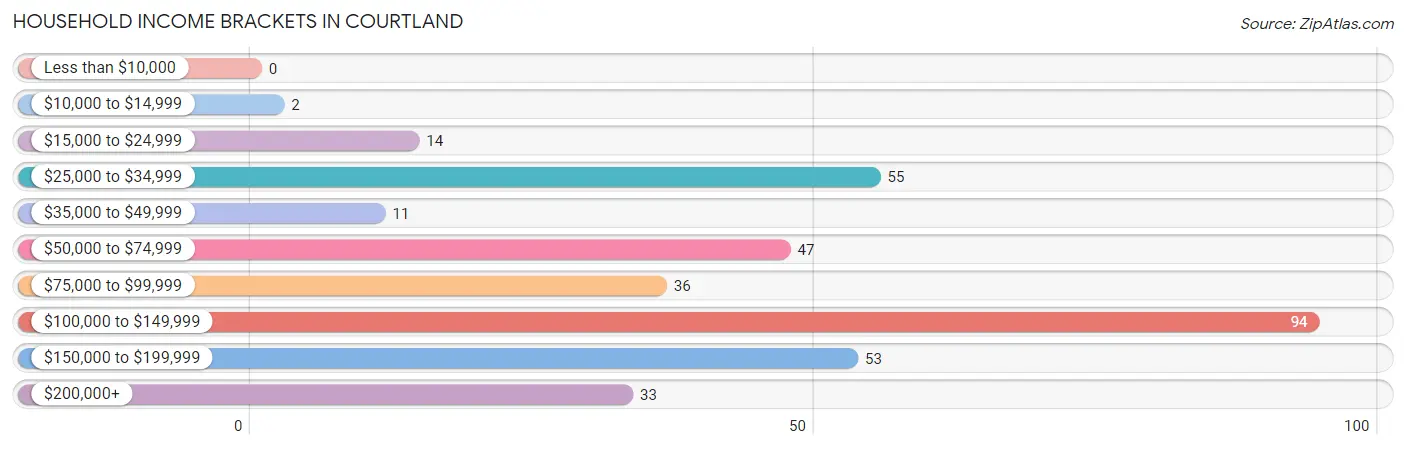
| Income Bracket | # Households | % Households |
| Less than $10,000 | 0 | 0.0% |
| $10,000 to $14,999 | 2 | 0.6% |
| $15,000 to $24,999 | 14 | 4.1% |
| $25,000 to $34,999 | 55 | 15.9% |
| $35,000 to $49,999 | 11 | 3.2% |
| $50,000 to $74,999 | 47 | 13.6% |
| $75,000 to $99,999 | 36 | 10.4% |
| $100,000 to $149,999 | 94 | 27.2% |
| $150,000 to $199,999 | 53 | 15.4% |
| $200,000+ | 33 | 9.6% |
Household Income by Householder Age in Courtland
The median household income in Courtland is $102,546, with the highest median household income of $105,000 found in the 25 to 44 years age bracket for the primary householder. A total of 124 households (35.9%) fall into this category. Meanwhile, the 15 to 24 years age bracket for the primary householder has the lowest median household income of $0, with 10 households (2.9%) in this group.
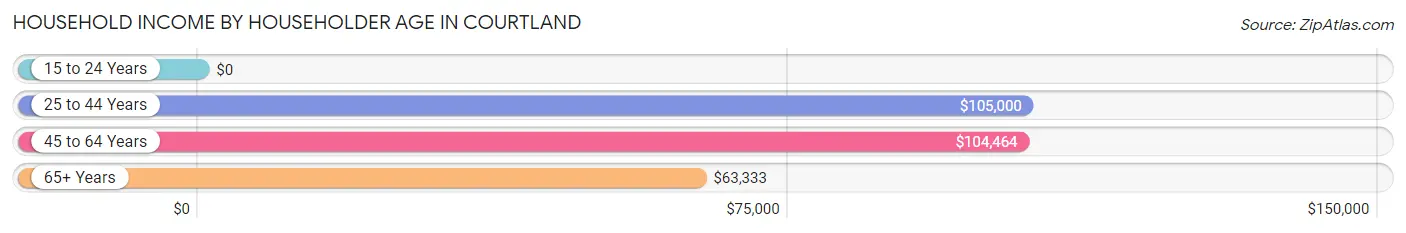
| Income Bracket | # Households | Median Income |
| 15 to 24 Years | 10 (2.9%) | $0 |
| 25 to 44 Years | 124 (35.9%) | $105,000 |
| 45 to 64 Years | 127 (36.8%) | $104,464 |
| 65+ Years | 84 (24.3%) | $63,333 |
| Total | 345 (100.0%) | $102,546 |
Poverty in Courtland
Income Below Poverty by Sex and Age in Courtland
With 1.7% poverty level for males and 1.8% for females among the residents of Courtland, 6 to 11 year old males and 6 to 11 year old females are the most vulnerable to poverty, with 6 males (12.2%) and 6 females (18.2%) in their respective age groups living below the poverty level.
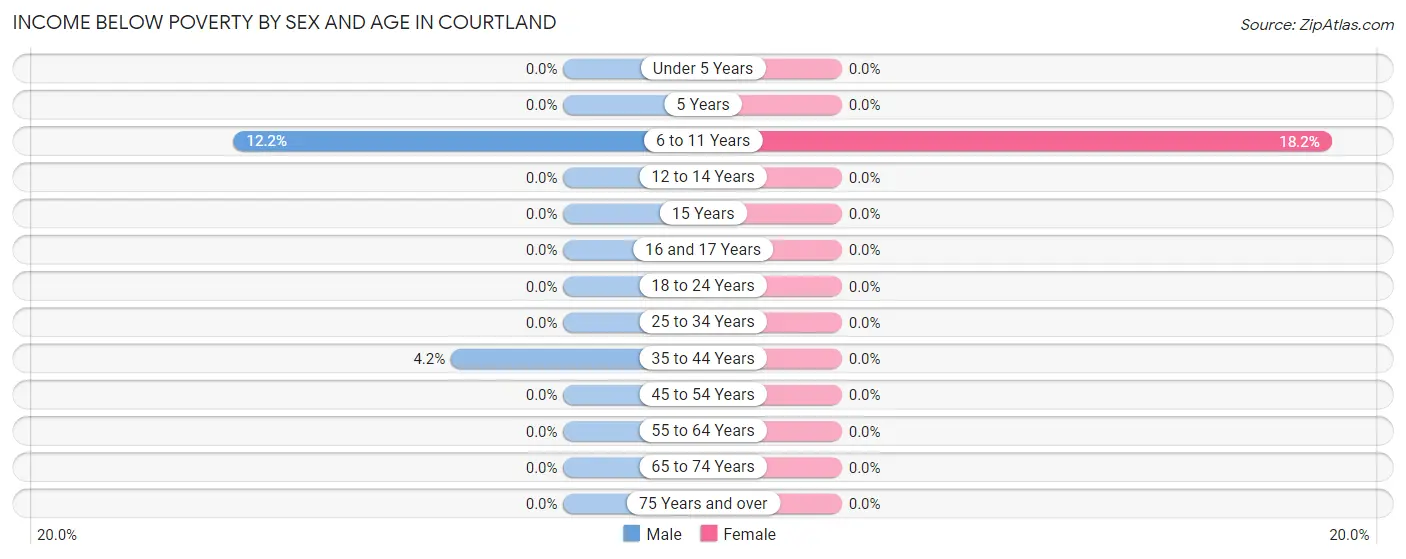
| Age Bracket | Male | Female |
| Under 5 Years | 0 (0.0%) | 0 (0.0%) |
| 5 Years | 0 (0.0%) | 0 (0.0%) |
| 6 to 11 Years | 6 (12.2%) | 6 (18.2%) |
| 12 to 14 Years | 0 (0.0%) | 0 (0.0%) |
| 15 Years | 0 (0.0%) | 0 (0.0%) |
| 16 and 17 Years | 0 (0.0%) | 0 (0.0%) |
| 18 to 24 Years | 0 (0.0%) | 0 (0.0%) |
| 25 to 34 Years | 0 (0.0%) | 0 (0.0%) |
| 35 to 44 Years | 2 (4.2%) | 0 (0.0%) |
| 45 to 54 Years | 0 (0.0%) | 0 (0.0%) |
| 55 to 64 Years | 0 (0.0%) | 0 (0.0%) |
| 65 to 74 Years | 0 (0.0%) | 0 (0.0%) |
| 75 Years and over | 0 (0.0%) | 0 (0.0%) |
| Total | 8 (1.7%) | 6 (1.8%) |
Income Above Poverty by Sex and Age in Courtland
According to the poverty statistics in Courtland, males aged under 5 years and females aged under 5 years are the age groups that are most secure financially, with 100.0% of males and 100.0% of females in these age groups living above the poverty line.
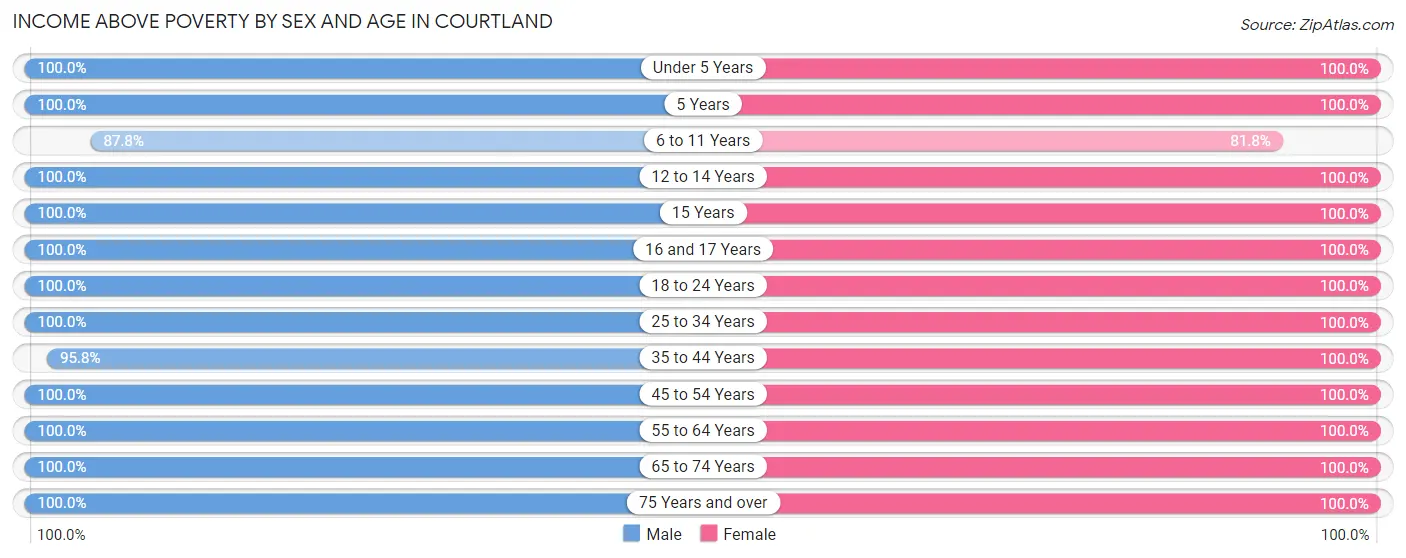
| Age Bracket | Male | Female |
| Under 5 Years | 31 (100.0%) | 15 (100.0%) |
| 5 Years | 4 (100.0%) | 2 (100.0%) |
| 6 to 11 Years | 43 (87.8%) | 27 (81.8%) |
| 12 to 14 Years | 16 (100.0%) | 8 (100.0%) |
| 15 Years | 6 (100.0%) | 3 (100.0%) |
| 16 and 17 Years | 17 (100.0%) | 6 (100.0%) |
| 18 to 24 Years | 33 (100.0%) | 23 (100.0%) |
| 25 to 34 Years | 72 (100.0%) | 45 (100.0%) |
| 35 to 44 Years | 46 (95.8%) | 47 (100.0%) |
| 45 to 54 Years | 85 (100.0%) | 42 (100.0%) |
| 55 to 64 Years | 34 (100.0%) | 43 (100.0%) |
| 65 to 74 Years | 48 (100.0%) | 42 (100.0%) |
| 75 Years and over | 29 (100.0%) | 19 (100.0%) |
| Total | 464 (98.3%) | 322 (98.2%) |
Income Below Poverty Among Married-Couple Families in Courtland
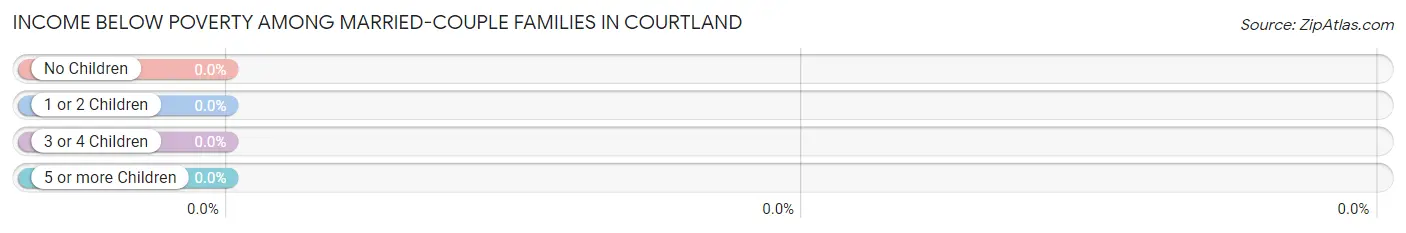
| Children | Above Poverty | Below Poverty |
| No Children | 111 (100.0%) | 0 (0.0%) |
| 1 or 2 Children | 48 (100.0%) | 0 (0.0%) |
| 3 or 4 Children | 34 (100.0%) | 0 (0.0%) |
| 5 or more Children | 0 (0.0%) | 0 (0.0%) |
| Total | 193 (100.0%) | 0 (0.0%) |
Income Below Poverty Among Single-Parent Households in Courtland
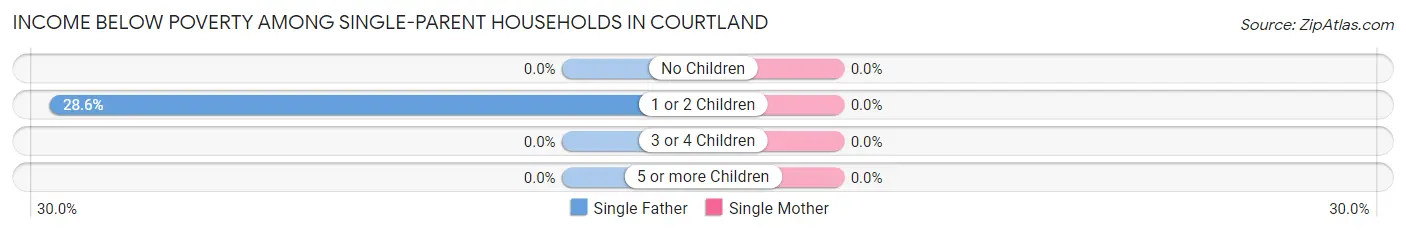
| Children | Single Father | Single Mother |
| No Children | 0 (0.0%) | 0 (0.0%) |
| 1 or 2 Children | 2 (28.6%) | 0 (0.0%) |
| 3 or 4 Children | 0 (0.0%) | 0 (0.0%) |
| 5 or more Children | 0 (0.0%) | 0 (0.0%) |
| Total | 2 (11.8%) | 0 (0.0%) |
Income Below Poverty Among Married-Couple vs Single-Parent Households in Courtland
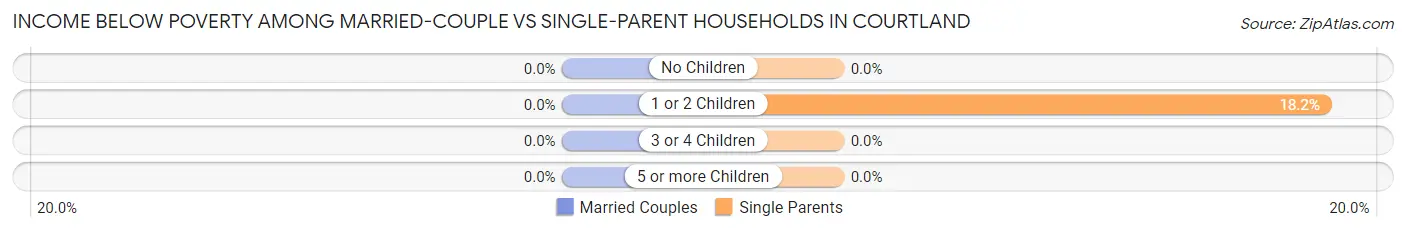
| Children | Married-Couple Families | Single-Parent Households |
| No Children | 0 (0.0%) | 0 (0.0%) |
| 1 or 2 Children | 0 (0.0%) | 2 (18.2%) |
| 3 or 4 Children | 0 (0.0%) | 0 (0.0%) |
| 5 or more Children | 0 (0.0%) | 0 (0.0%) |
| Total | 0 (0.0%) | 2 (8.7%) |
Race in Courtland
The most populous races in Courtland are White / Caucasian (769 | 96.1%), and Two or more Races (31 | 3.9%).
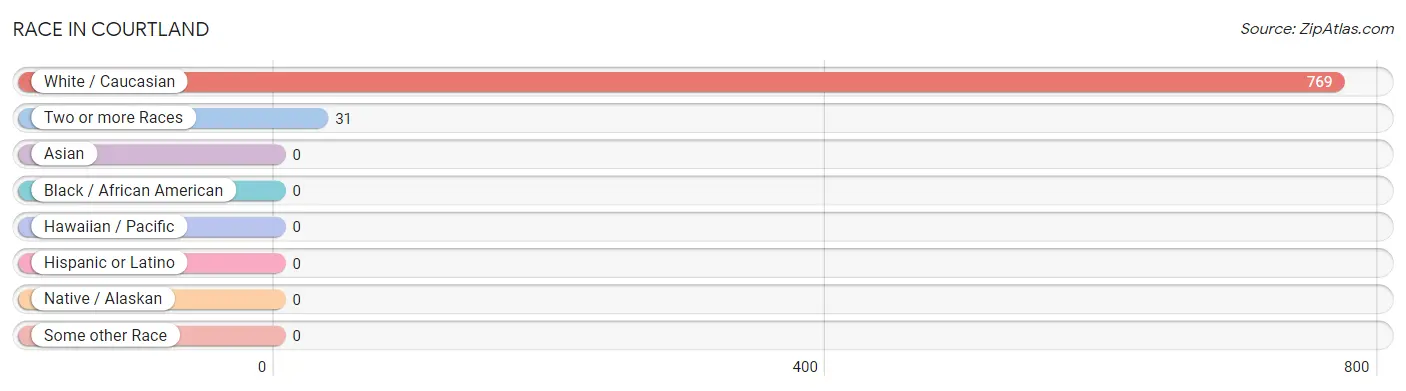
| Race | # Population | % Population |
| Asian | 0 | 0.0% |
| Black / African American | 0 | 0.0% |
| Hawaiian / Pacific | 0 | 0.0% |
| Hispanic or Latino | 0 | 0.0% |
| Native / Alaskan | 0 | 0.0% |
| White / Caucasian | 769 | 96.1% |
| Two or more Races | 31 | 3.9% |
| Some other Race | 0 | 0.0% |
| Total | 800 | 100.0% |
Ancestry in Courtland
The most populous ancestries reported in Courtland are German (528 | 66.0%), Norwegian (80 | 10.0%), Irish (33 | 4.1%), English (30 | 3.7%), and American (28 | 3.5%), together accounting for 87.4% of all Courtland residents.
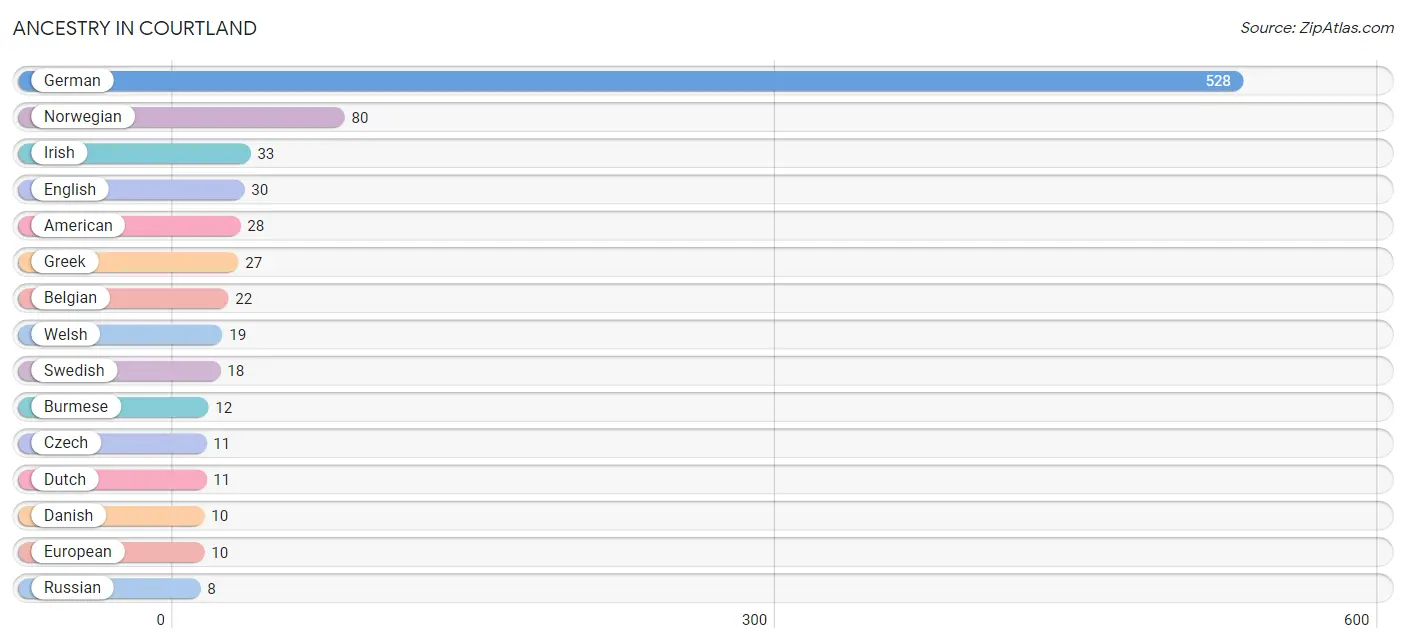
| Ancestry | # Population | % Population |
| American | 28 | 3.5% |
| Belgian | 22 | 2.8% |
| Burmese | 12 | 1.5% |
| Croatian | 2 | 0.3% |
| Czech | 11 | 1.4% |
| Danish | 10 | 1.3% |
| Dutch | 11 | 1.4% |
| English | 30 | 3.7% |
| European | 10 | 1.3% |
| Finnish | 4 | 0.5% |
| French | 5 | 0.6% |
| French Canadian | 6 | 0.7% |
| German | 528 | 66.0% |
| Greek | 27 | 3.4% |
| Irish | 33 | 4.1% |
| Italian | 4 | 0.5% |
| Luxembourger | 2 | 0.3% |
| Norwegian | 80 | 10.0% |
| Polish | 1 | 0.1% |
| Russian | 8 | 1.0% |
| Scandinavian | 2 | 0.3% |
| Scotch-Irish | 5 | 0.6% |
| Scottish | 6 | 0.7% |
| Swedish | 18 | 2.2% |
| Swiss | 1 | 0.1% |
| Welsh | 19 | 2.4% | View All 26 Rows |
Immigrants in Courtland
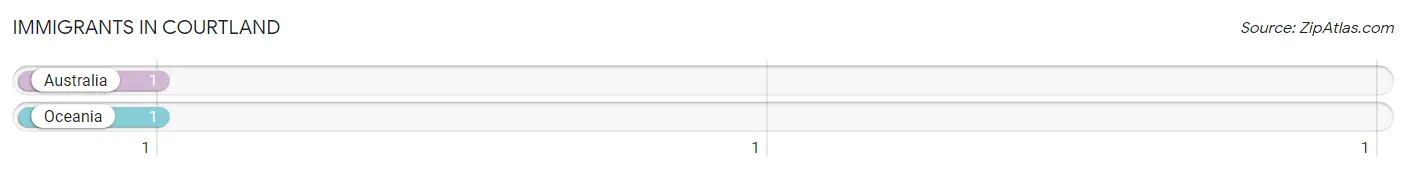
The most numerous immigrant groups reported in Courtland came from Australia (1 | 0.1%), and Oceania (1 | 0.1%), together accounting for 0.2% of all Courtland residents.
| Immigration Origin | # Population | % Population |
| Australia | 1 | 0.1% |
| Oceania | 1 | 0.1% | View All 2 Rows |
Sex and Age in Courtland
Sex and Age in Courtland
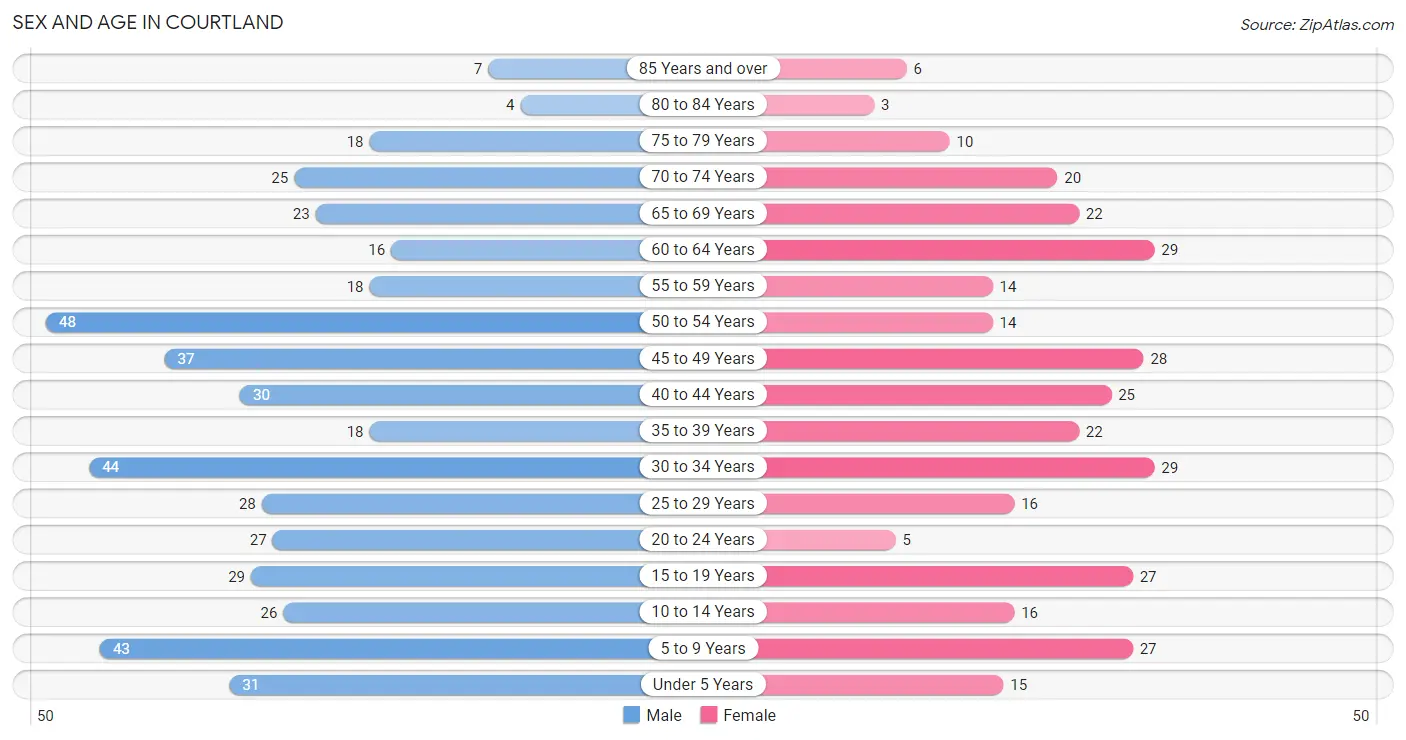
The most populous age groups in Courtland are 50 to 54 Years (48 | 10.2%) for men and 30 to 34 Years (29 | 8.8%) for women.
| Age Bracket | Male | Female |
| Under 5 Years | 31 (6.6%) | 15 (4.6%) |
| 5 to 9 Years | 43 (9.1%) | 27 (8.2%) |
| 10 to 14 Years | 26 (5.5%) | 16 (4.9%) |
| 15 to 19 Years | 29 (6.1%) | 27 (8.2%) |
| 20 to 24 Years | 27 (5.7%) | 5 (1.5%) |
| 25 to 29 Years | 28 (5.9%) | 16 (4.9%) |
| 30 to 34 Years | 44 (9.3%) | 29 (8.8%) |
| 35 to 39 Years | 18 (3.8%) | 22 (6.7%) |
| 40 to 44 Years | 30 (6.4%) | 25 (7.6%) |
| 45 to 49 Years | 37 (7.8%) | 28 (8.5%) |
| 50 to 54 Years | 48 (10.2%) | 14 (4.3%) |
| 55 to 59 Years | 18 (3.8%) | 14 (4.3%) |
| 60 to 64 Years | 16 (3.4%) | 29 (8.8%) |
| 65 to 69 Years | 23 (4.9%) | 22 (6.7%) |
| 70 to 74 Years | 25 (5.3%) | 20 (6.1%) |
| 75 to 79 Years | 18 (3.8%) | 10 (3.0%) |
| 80 to 84 Years | 4 (0.9%) | 3 (0.9%) |
| 85 Years and over | 7 (1.5%) | 6 (1.8%) |
| Total | 472 (100.0%) | 328 (100.0%) |
Families and Households in Courtland
Median Family Size in Courtland
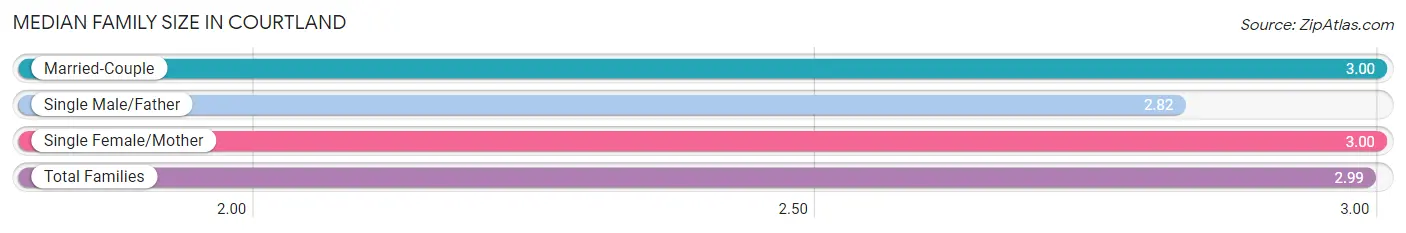
The median family size in Courtland is 2.99 persons per family, with married-couple families (193 | 89.3%) accounting for the largest median family size of 3 persons per family. On the other hand, single male/father families (17 | 7.9%) represent the smallest median family size with 2.82 persons per family.
| Family Type | # Families | Family Size |
| Married-Couple | 193 (89.3%) | 3.00 |
| Single Male/Father | 17 (7.9%) | 2.82 |
| Single Female/Mother | 6 (2.8%) | 3.00 |
| Total Families | 216 (100.0%) | 2.99 |
Median Household Size in Courtland
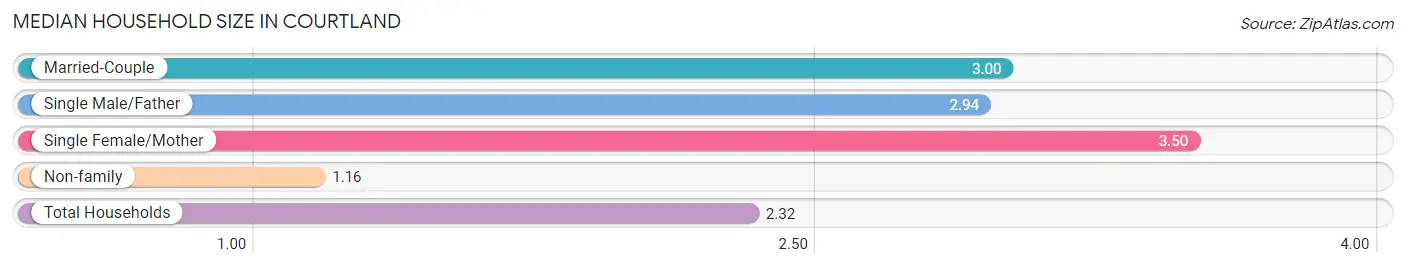
The median household size in Courtland is 2.32 persons per household, with single female/mother households (6 | 1.7%) accounting for the largest median household size of 3.5 persons per household. non-family households (129 | 37.4%) represent the smallest median household size with 1.16 persons per household.
| Household Type | # Households | Household Size |
| Married-Couple | 193 (55.9%) | 3.00 |
| Single Male/Father | 17 (4.9%) | 2.94 |
| Single Female/Mother | 6 (1.7%) | 3.50 |
| Non-family | 129 (37.4%) | 1.16 |
| Total Households | 345 (100.0%) | 2.32 |
Household Size by Marriage Status in Courtland
Out of a total of 345 households in Courtland, 216 (62.6%) are family households, while 129 (37.4%) are nonfamily households. The most numerous type of family households are 2-person households, comprising 112, and the most common type of nonfamily households are 1-person households, comprising 102.
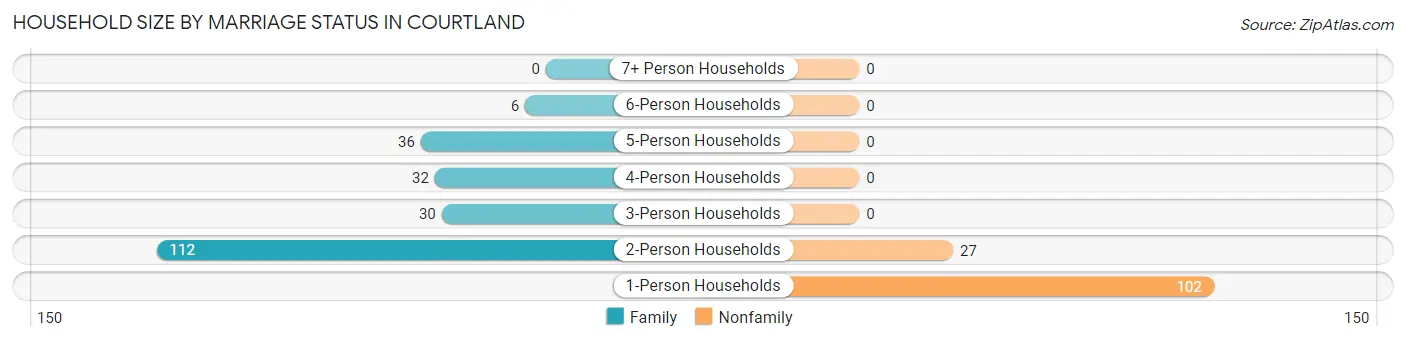
| Household Size | Family Households | Nonfamily Households |
| 1-Person Households | - | 102 (29.6%) |
| 2-Person Households | 112 (32.5%) | 27 (7.8%) |
| 3-Person Households | 30 (8.7%) | 0 (0.0%) |
| 4-Person Households | 32 (9.3%) | 0 (0.0%) |
| 5-Person Households | 36 (10.4%) | 0 (0.0%) |
| 6-Person Households | 6 (1.7%) | 0 (0.0%) |
| 7+ Person Households | 0 (0.0%) | 0 (0.0%) |
| Total | 216 (62.6%) | 129 (37.4%) |
Female Fertility in Courtland
Fertility by Age in Courtland
Average fertility rate in Courtland is 46.0 births per 1,000 women. Women in the age bracket of 20 to 34 years have the highest fertility rate with 100.0 births per 1,000 women. Women in the age bracket of 20 to 34 years acount for 71.4% of all women with births.
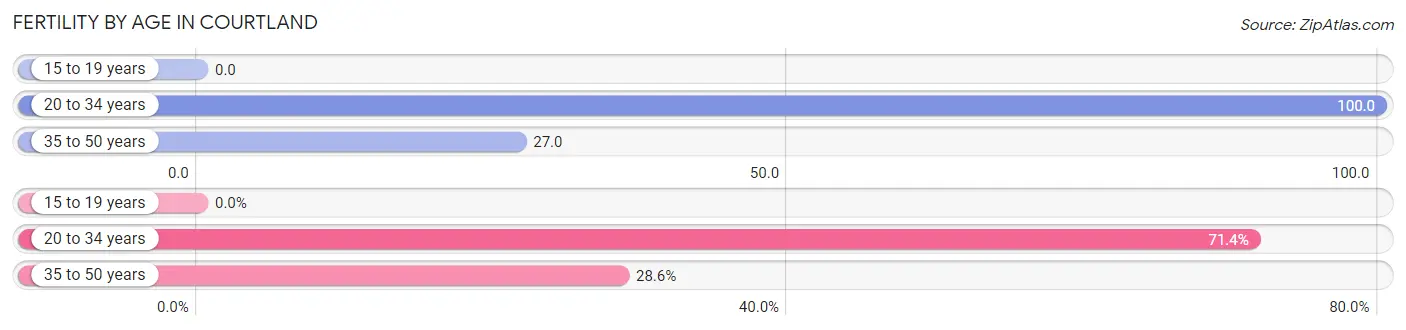
| Age Bracket | Women with Births | Births / 1,000 Women |
| 15 to 19 years | 0 (0.0%) | 0.0 |
| 20 to 34 years | 5 (71.4%) | 100.0 |
| 35 to 50 years | 2 (28.6%) | 27.0 |
| Total | 7 (100.0%) | 46.0 |
Fertility by Age by Marriage Status in Courtland
71.4% of women with births (7) in Courtland are married. The highest percentage of unmarried women with births falls into 20 to 34 years age bracket with 40.0% of them unmarried at the time of birth, while the lowest percentage of unmarried women with births belong to 35 to 50 years age bracket with 0.0% of them unmarried.
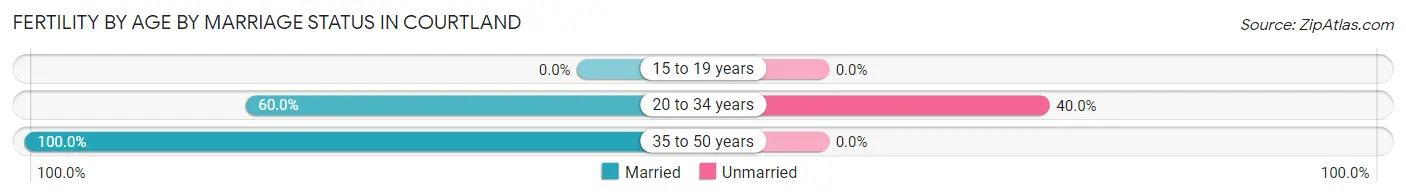
| Age Bracket | Married | Unmarried |
| 15 to 19 years | 0 (0.0%) | 0 (0.0%) |
| 20 to 34 years | 3 (60.0%) | 2 (40.0%) |
| 35 to 50 years | 2 (100.0%) | 0 (0.0%) |
| Total | 5 (71.4%) | 2 (28.6%) |
Fertility by Education in Courtland
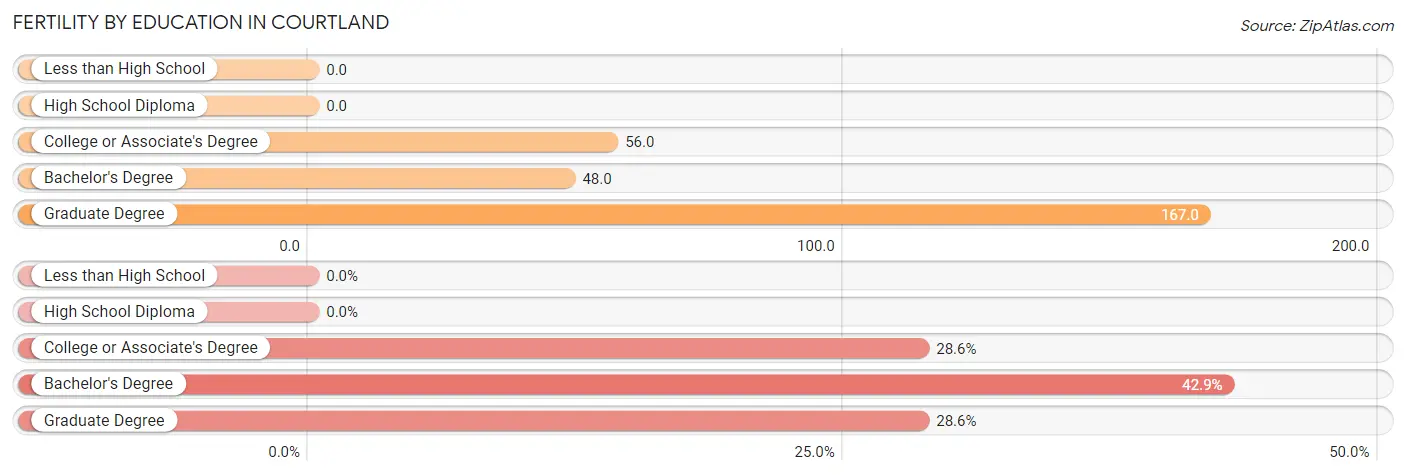
| Educational Attainment | Women with Births | Births / 1,000 Women |
| Less than High School | 0 (0.0%) | 0.0 |
| High School Diploma | 0 (0.0%) | 0.0 |
| College or Associate's Degree | 2 (28.6%) | 56.0 |
| Bachelor's Degree | 3 (42.9%) | 48.0 |
| Graduate Degree | 2 (28.6%) | 167.0 |
| Total | 7 (100.0%) | 46.0 |
Fertility by Education by Marriage Status in Courtland
28.6% of women with births in Courtland are unmarried. Women with the educational attainment of bachelor's degree are most likely to be married with 100.0% of them married at childbirth, while women with the educational attainment of college or associate's degree are least likely to be married with 100.0% of them unmarried at childbirth.
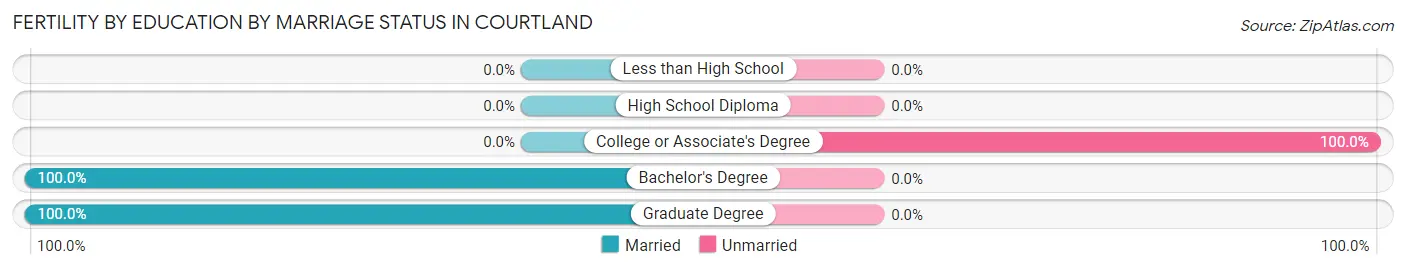
| Educational Attainment | Married | Unmarried |
| Less than High School | 0 (0.0%) | 0 (0.0%) |
| High School Diploma | 0 (0.0%) | 0 (0.0%) |
| College or Associate's Degree | 0 (0.0%) | 2 (100.0%) |
| Bachelor's Degree | 3 (100.0%) | 0 (0.0%) |
| Graduate Degree | 2 (100.0%) | 0 (0.0%) |
| Total | 5 (71.4%) | 2 (28.6%) |
Employment Characteristics in Courtland
Employment by Class of Employer in Courtland
Among the 462 employed individuals in Courtland, private company employees (317 | 68.6%), not-for-profit organizations (67 | 14.5%), and self-employed (not incorporated) (36 | 7.8%) make up the most common classes of employment.
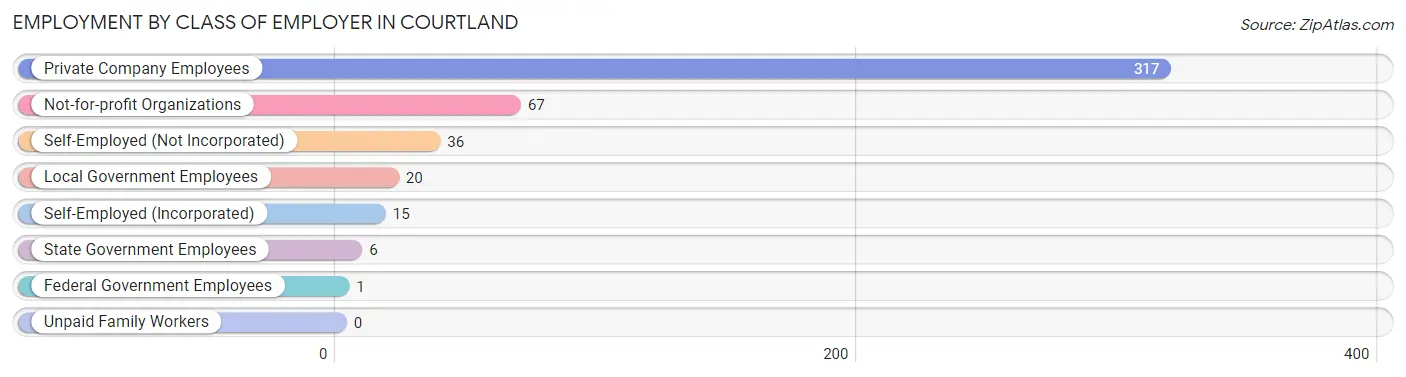
| Employer Class | # Employees | % Employees |
| Private Company Employees | 317 | 68.6% |
| Self-Employed (Incorporated) | 15 | 3.3% |
| Self-Employed (Not Incorporated) | 36 | 7.8% |
| Not-for-profit Organizations | 67 | 14.5% |
| Local Government Employees | 20 | 4.3% |
| State Government Employees | 6 | 1.3% |
| Federal Government Employees | 1 | 0.2% |
| Unpaid Family Workers | 0 | 0.0% |
| Total | 462 | 100.0% |
Employment Status by Age in Courtland
According to the labor force statistics for Courtland, out of the total population over 16 years of age (633), 74.1% or 469 individuals are in the labor force, with 0.9% or 4 of them unemployed. The age group with the highest labor force participation rate is 20 to 24 years, with 100.0% or 32 individuals in the labor force. Within the labor force, the 20 to 24 years age range has the highest percentage of unemployed individuals, with 12.5% or 4 of them being unemployed.
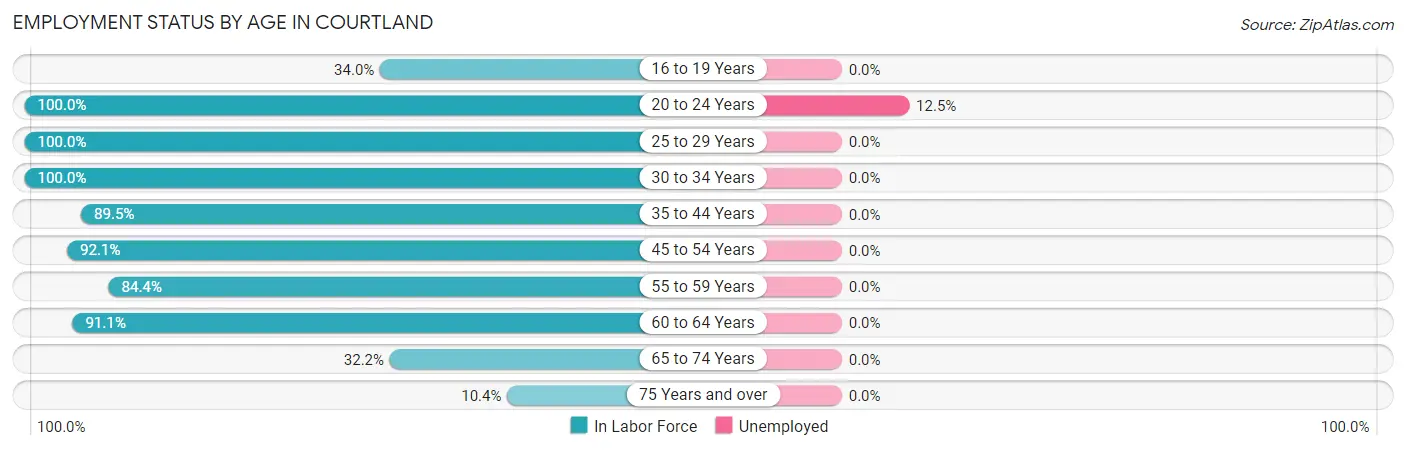
| Age Bracket | In Labor Force | Unemployed |
| 16 to 19 Years | 16 (34.0%) | 0 (0.0%) |
| 20 to 24 Years | 32 (100.0%) | 4 (12.5%) |
| 25 to 29 Years | 44 (100.0%) | 0 (0.0%) |
| 30 to 34 Years | 73 (100.0%) | 0 (0.0%) |
| 35 to 44 Years | 85 (89.5%) | 0 (0.0%) |
| 45 to 54 Years | 117 (92.1%) | 0 (0.0%) |
| 55 to 59 Years | 27 (84.4%) | 0 (0.0%) |
| 60 to 64 Years | 41 (91.1%) | 0 (0.0%) |
| 65 to 74 Years | 29 (32.2%) | 0 (0.0%) |
| 75 Years and over | 5 (10.4%) | 0 (0.0%) |
| Total | 469 (74.1%) | 4 (0.9%) |
Employment Status by Educational Attainment in Courtland
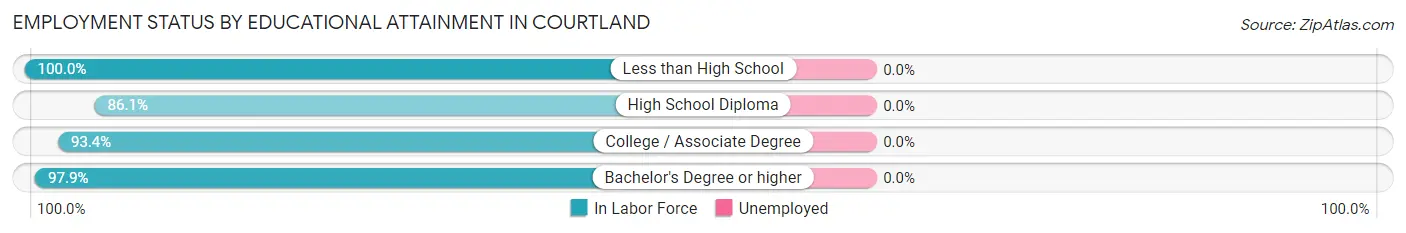
| Educational Attainment | In Labor Force | Unemployed |
| Less than High School | 2 (100.0%) | 0 (0.0%) |
| High School Diploma | 93 (86.1%) | 0 (0.0%) |
| College / Associate Degree | 155 (93.4%) | 0 (0.0%) |
| Bachelor's Degree or higher | 137 (97.9%) | 0 (0.0%) |
| Total | 387 (93.0%) | 0 (0.0%) |
Employment Occupations by Sex in Courtland
Management, Business, Science and Arts Occupations
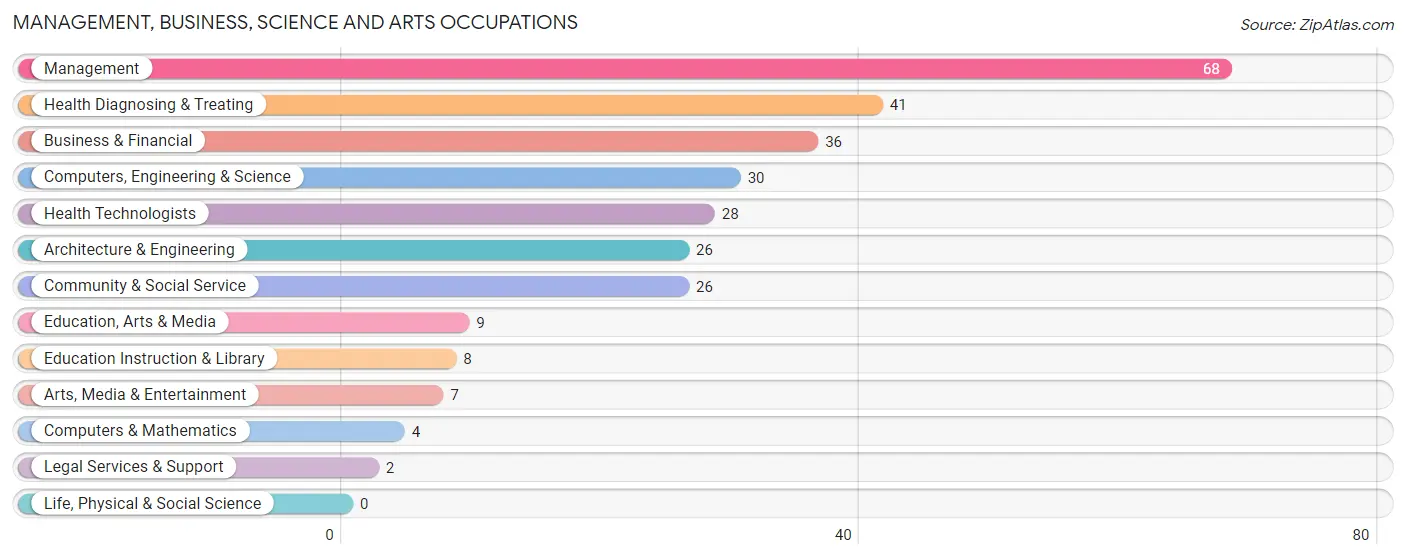
The most common Management, Business, Science and Arts occupations in Courtland are Management (68 | 14.6%), Health Diagnosing & Treating (41 | 8.8%), Business & Financial (36 | 7.7%), Computers, Engineering & Science (30 | 6.5%), and Health Technologists (28 | 6.0%).
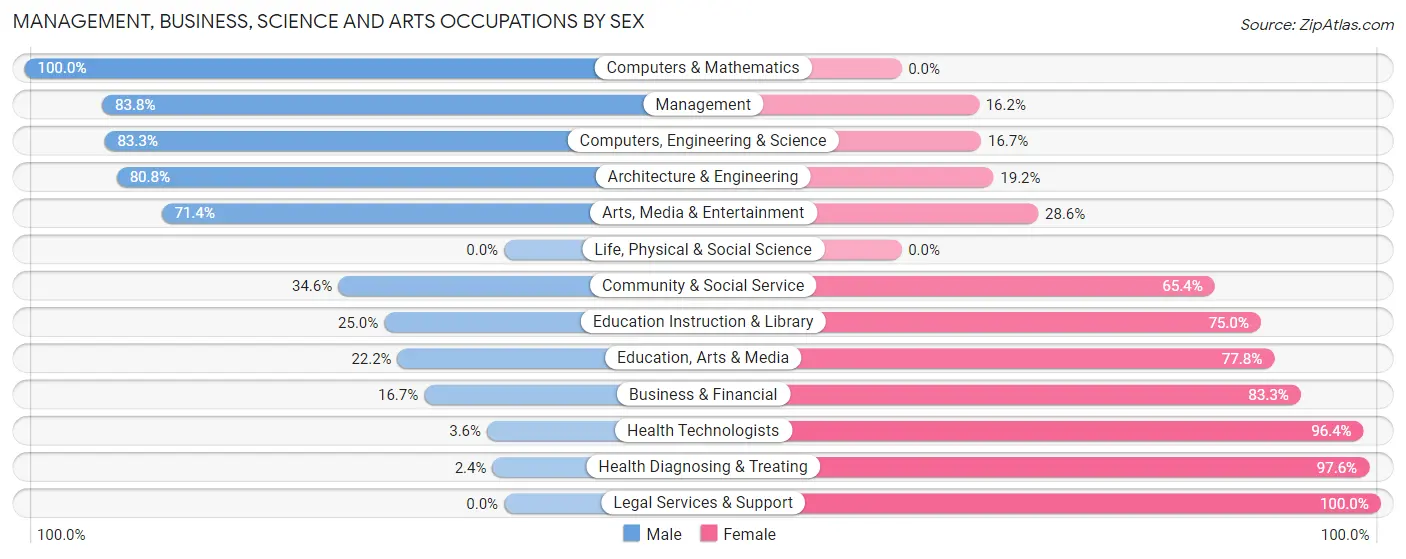
Management, Business, Science and Arts Occupations by Sex
Within the Management, Business, Science and Arts occupations in Courtland, the most male-oriented occupations are Computers & Mathematics (100.0%), Management (83.8%), and Computers, Engineering & Science (83.3%), while the most female-oriented occupations are Legal Services & Support (100.0%), Health Diagnosing & Treating (97.6%), and Health Technologists (96.4%).
| Occupation | Male | Female |
| Management | 57 (83.8%) | 11 (16.2%) |
| Business & Financial | 6 (16.7%) | 30 (83.3%) |
| Computers, Engineering & Science | 25 (83.3%) | 5 (16.7%) |
| Computers & Mathematics | 4 (100.0%) | 0 (0.0%) |
| Architecture & Engineering | 21 (80.8%) | 5 (19.2%) |
| Life, Physical & Social Science | 0 (0.0%) | 0 (0.0%) |
| Community & Social Service | 9 (34.6%) | 17 (65.4%) |
| Education, Arts & Media | 2 (22.2%) | 7 (77.8%) |
| Legal Services & Support | 0 (0.0%) | 2 (100.0%) |
| Education Instruction & Library | 2 (25.0%) | 6 (75.0%) |
| Arts, Media & Entertainment | 5 (71.4%) | 2 (28.6%) |
| Health Diagnosing & Treating | 1 (2.4%) | 40 (97.6%) |
| Health Technologists | 1 (3.6%) | 27 (96.4%) |
| Total (Category) | 98 (48.8%) | 103 (51.2%) |
| Total (Overall) | 288 (61.9%) | 177 (38.1%) |
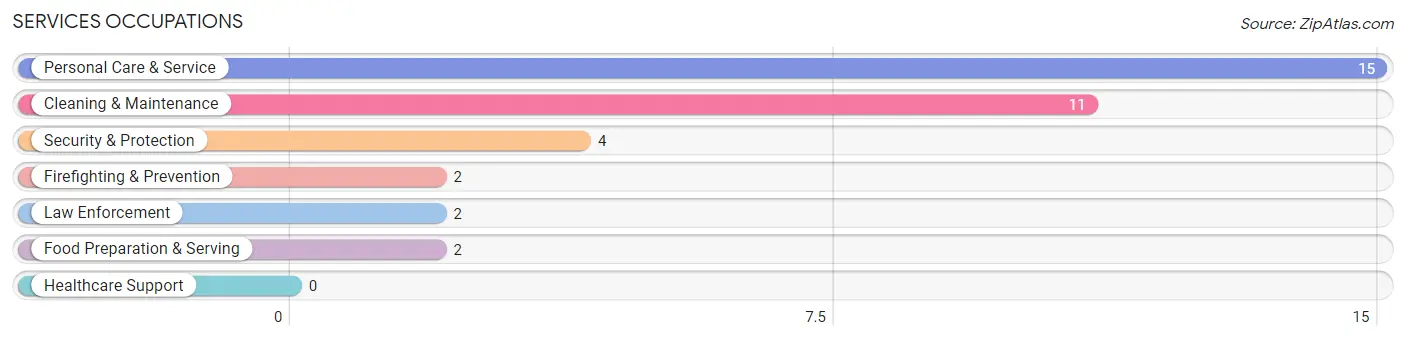
Services Occupations
The most common Services occupations in Courtland are Personal Care & Service (15 | 3.2%), Cleaning & Maintenance (11 | 2.4%), Security & Protection (4 | 0.9%), Firefighting & Prevention (2 | 0.4%), and Law Enforcement (2 | 0.4%).
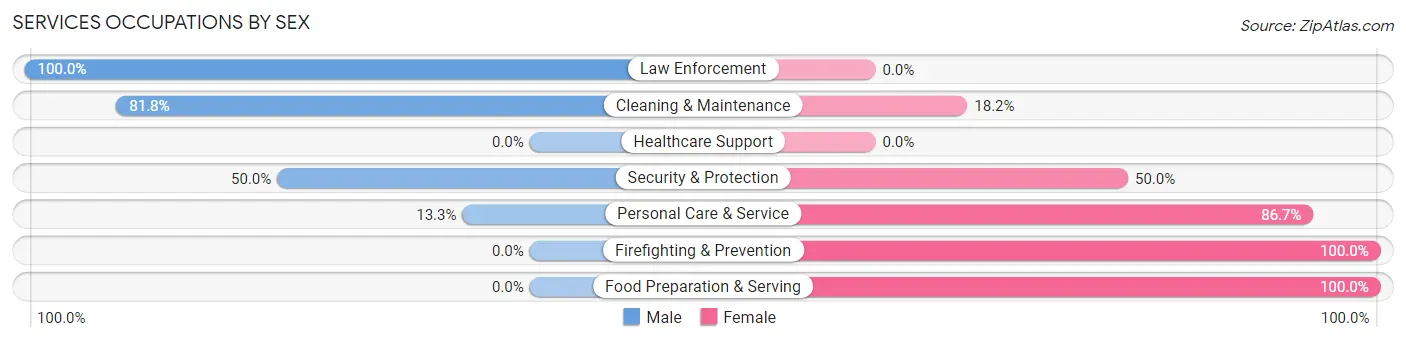
Services Occupations by Sex
Within the Services occupations in Courtland, the most male-oriented occupations are Law Enforcement (100.0%), Cleaning & Maintenance (81.8%), and Security & Protection (50.0%), while the most female-oriented occupations are Firefighting & Prevention (100.0%), Food Preparation & Serving (100.0%), and Personal Care & Service (86.7%).
| Occupation | Male | Female |
| Healthcare Support | 0 (0.0%) | 0 (0.0%) |
| Security & Protection | 2 (50.0%) | 2 (50.0%) |
| Firefighting & Prevention | 0 (0.0%) | 2 (100.0%) |
| Law Enforcement | 2 (100.0%) | 0 (0.0%) |
| Food Preparation & Serving | 0 (0.0%) | 2 (100.0%) |
| Cleaning & Maintenance | 9 (81.8%) | 2 (18.2%) |
| Personal Care & Service | 2 (13.3%) | 13 (86.7%) |
| Total (Category) | 13 (40.6%) | 19 (59.4%) |
| Total (Overall) | 288 (61.9%) | 177 (38.1%) |
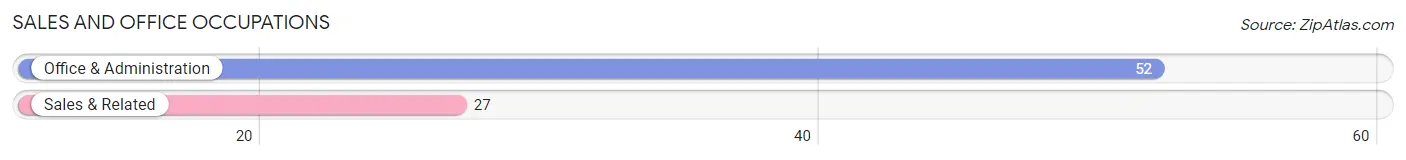
Sales and Office Occupations
The most common Sales and Office occupations in Courtland are Office & Administration (52 | 11.2%), and Sales & Related (27 | 5.8%).
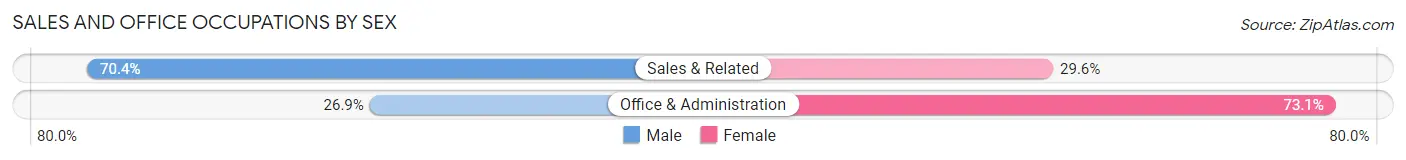
Sales and Office Occupations by Sex
| Occupation | Male | Female |
| Sales & Related | 19 (70.4%) | 8 (29.6%) |
| Office & Administration | 14 (26.9%) | 38 (73.1%) |
| Total (Category) | 33 (41.8%) | 46 (58.2%) |
| Total (Overall) | 288 (61.9%) | 177 (38.1%) |
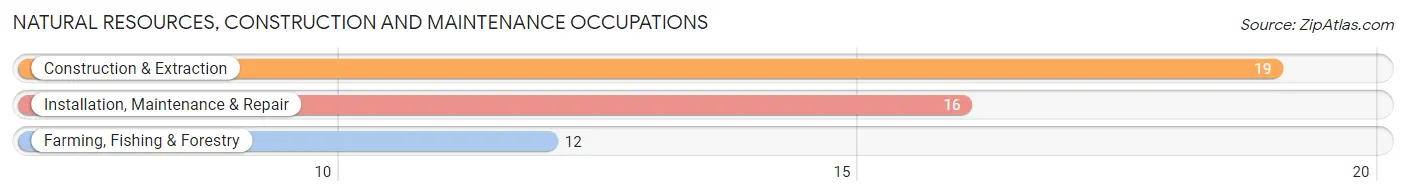
Natural Resources, Construction and Maintenance Occupations
The most common Natural Resources, Construction and Maintenance occupations in Courtland are Construction & Extraction (19 | 4.1%), Installation, Maintenance & Repair (16 | 3.4%), and Farming, Fishing & Forestry (12 | 2.6%).
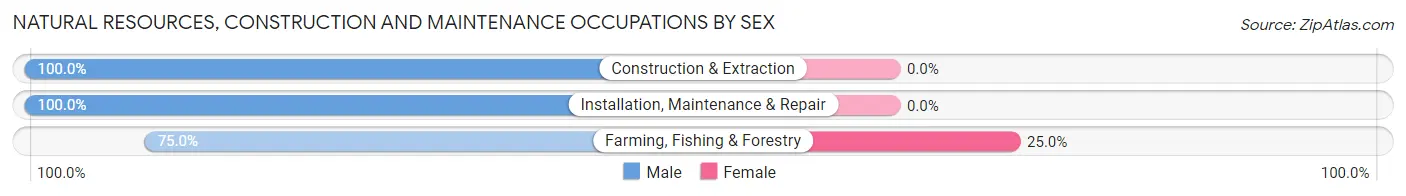
Natural Resources, Construction and Maintenance Occupations by Sex
| Occupation | Male | Female |
| Farming, Fishing & Forestry | 9 (75.0%) | 3 (25.0%) |
| Construction & Extraction | 19 (100.0%) | 0 (0.0%) |
| Installation, Maintenance & Repair | 16 (100.0%) | 0 (0.0%) |
| Total (Category) | 44 (93.6%) | 3 (6.4%) |
| Total (Overall) | 288 (61.9%) | 177 (38.1%) |
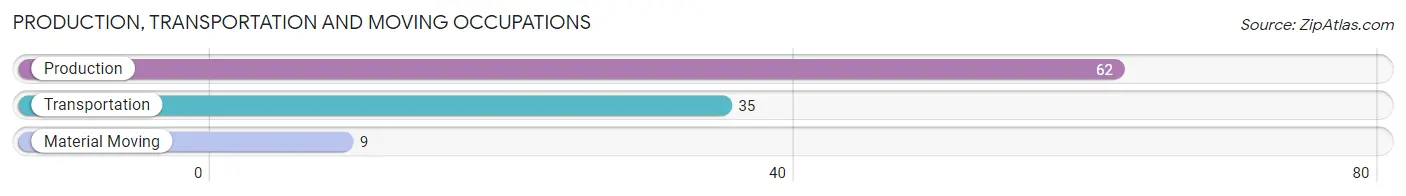
Production, Transportation and Moving Occupations
The most common Production, Transportation and Moving occupations in Courtland are Production (62 | 13.3%), Transportation (35 | 7.5%), and Material Moving (9 | 1.9%).
Production, Transportation and Moving Occupations by Sex
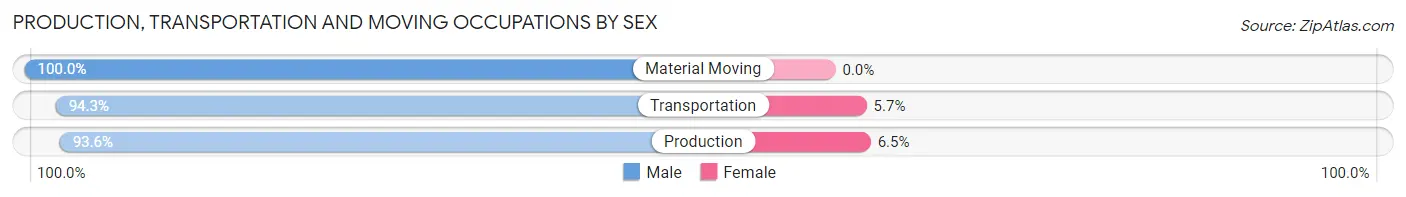
| Occupation | Male | Female |
| Production | 58 (93.5%) | 4 (6.5%) |
| Transportation | 33 (94.3%) | 2 (5.7%) |
| Material Moving | 9 (100.0%) | 0 (0.0%) |
| Total (Category) | 100 (94.3%) | 6 (5.7%) |
| Total (Overall) | 288 (61.9%) | 177 (38.1%) |
Employment Industries by Sex in Courtland
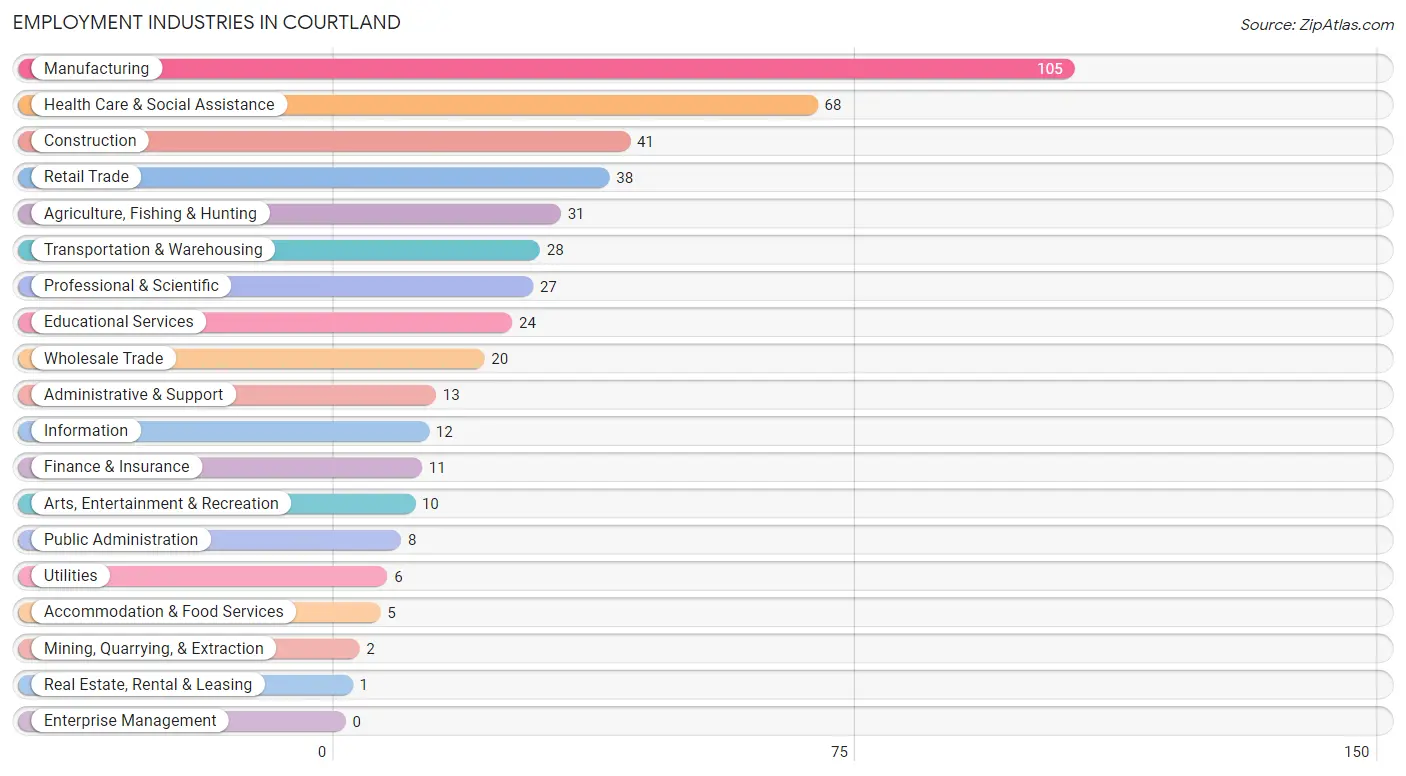
Employment Industries in Courtland
The major employment industries in Courtland include Manufacturing (105 | 22.6%), Health Care & Social Assistance (68 | 14.6%), Construction (41 | 8.8%), Retail Trade (38 | 8.2%), and Agriculture, Fishing & Hunting (31 | 6.7%).
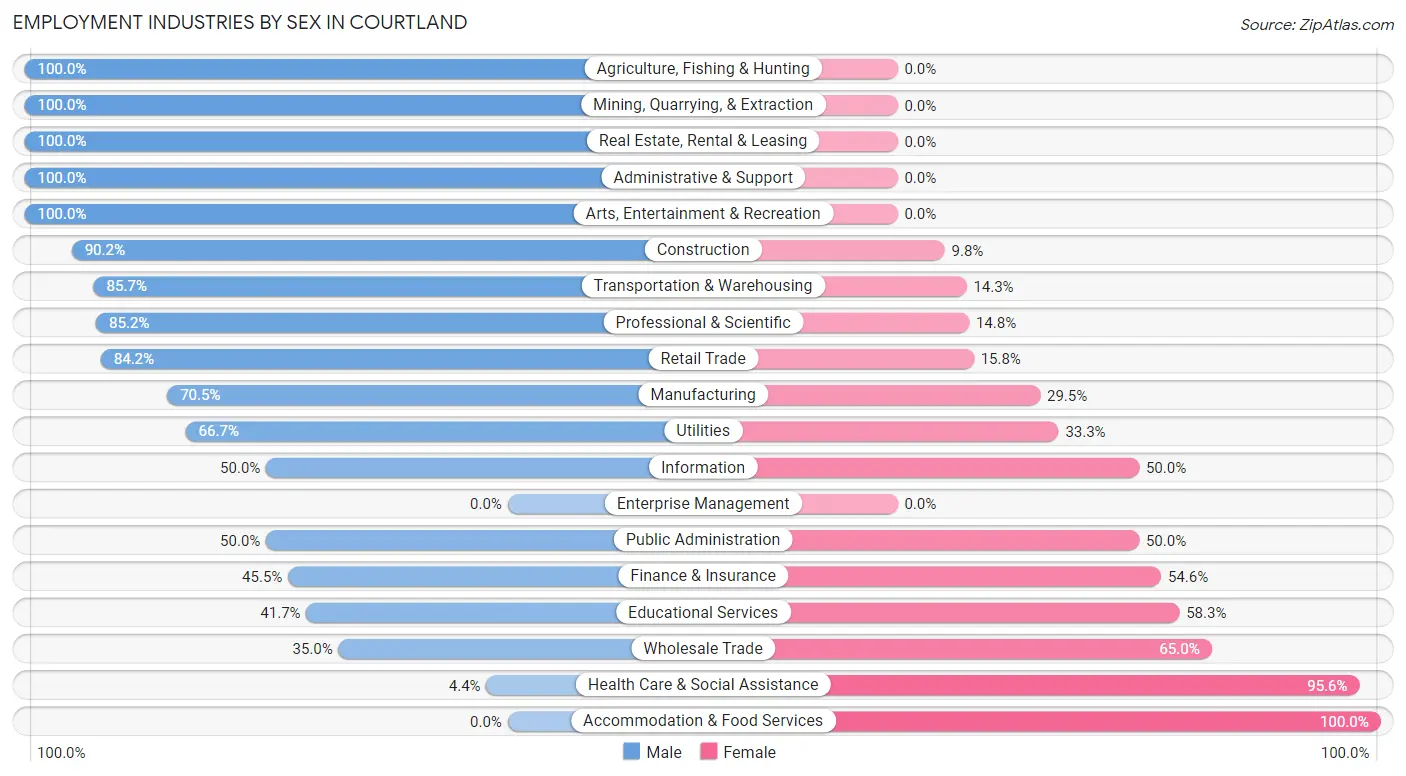
Employment Industries by Sex in Courtland
The Courtland industries that see more men than women are Agriculture, Fishing & Hunting (100.0%), Mining, Quarrying, & Extraction (100.0%), and Real Estate, Rental & Leasing (100.0%), whereas the industries that tend to have a higher number of women are Accommodation & Food Services (100.0%), Health Care & Social Assistance (95.6%), and Wholesale Trade (65.0%).
| Industry | Male | Female |
| Agriculture, Fishing & Hunting | 31 (100.0%) | 0 (0.0%) |
| Mining, Quarrying, & Extraction | 2 (100.0%) | 0 (0.0%) |
| Construction | 37 (90.2%) | 4 (9.8%) |
| Manufacturing | 74 (70.5%) | 31 (29.5%) |
| Wholesale Trade | 7 (35.0%) | 13 (65.0%) |
| Retail Trade | 32 (84.2%) | 6 (15.8%) |
| Transportation & Warehousing | 24 (85.7%) | 4 (14.3%) |
| Utilities | 4 (66.7%) | 2 (33.3%) |
| Information | 6 (50.0%) | 6 (50.0%) |
| Finance & Insurance | 5 (45.5%) | 6 (54.5%) |
| Real Estate, Rental & Leasing | 1 (100.0%) | 0 (0.0%) |
| Professional & Scientific | 23 (85.2%) | 4 (14.8%) |
| Enterprise Management | 0 (0.0%) | 0 (0.0%) |
| Administrative & Support | 13 (100.0%) | 0 (0.0%) |
| Educational Services | 10 (41.7%) | 14 (58.3%) |
| Health Care & Social Assistance | 3 (4.4%) | 65 (95.6%) |
| Arts, Entertainment & Recreation | 10 (100.0%) | 0 (0.0%) |
| Accommodation & Food Services | 0 (0.0%) | 5 (100.0%) |
| Public Administration | 4 (50.0%) | 4 (50.0%) |
| Total | 288 (61.9%) | 177 (38.1%) |
Education in Courtland
School Enrollment in Courtland
The most common levels of schooling among the 173 students in Courtland are elementary school (54 | 31.2%), high school (43 | 24.9%), and middle school (28 | 16.2%).
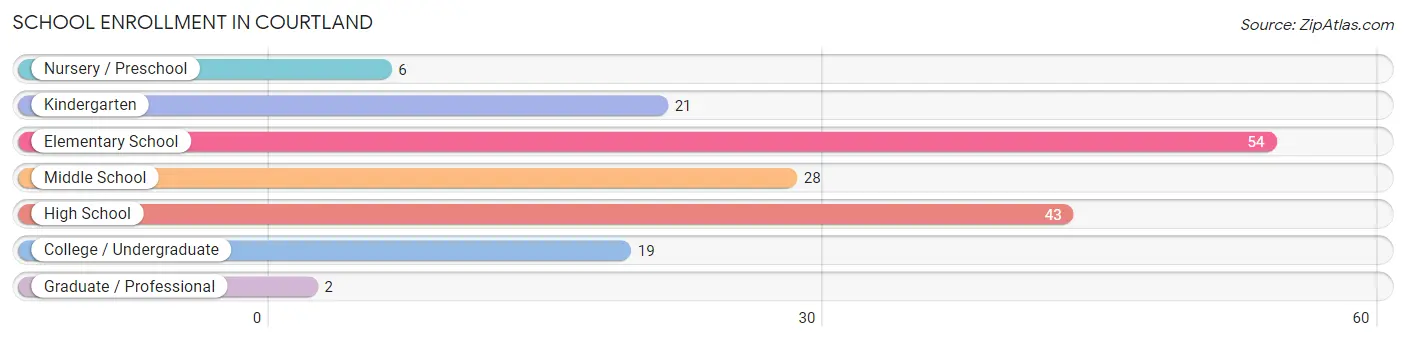
| School Level | # Students | % Students |
| Nursery / Preschool | 6 | 3.5% |
| Kindergarten | 21 | 12.1% |
| Elementary School | 54 | 31.2% |
| Middle School | 28 | 16.2% |
| High School | 43 | 24.9% |
| College / Undergraduate | 19 | 11.0% |
| Graduate / Professional | 2 | 1.2% |
| Total | 173 | 100.0% |
School Enrollment by Age by Funding Source in Courtland
Out of a total of 173 students who are enrolled in schools in Courtland, 44 (25.4%) attend a private institution, while the remaining 129 (74.6%) are enrolled in public schools. The age group of 25 to 34 year olds has the highest likelihood of being enrolled in private schools, with 3 (100.0% in the age bracket) enrolled. Conversely, the age group of 20 to 24 year olds has the lowest likelihood of being enrolled in a private school, with 11 (100.0% in the age bracket) attending a public institution.
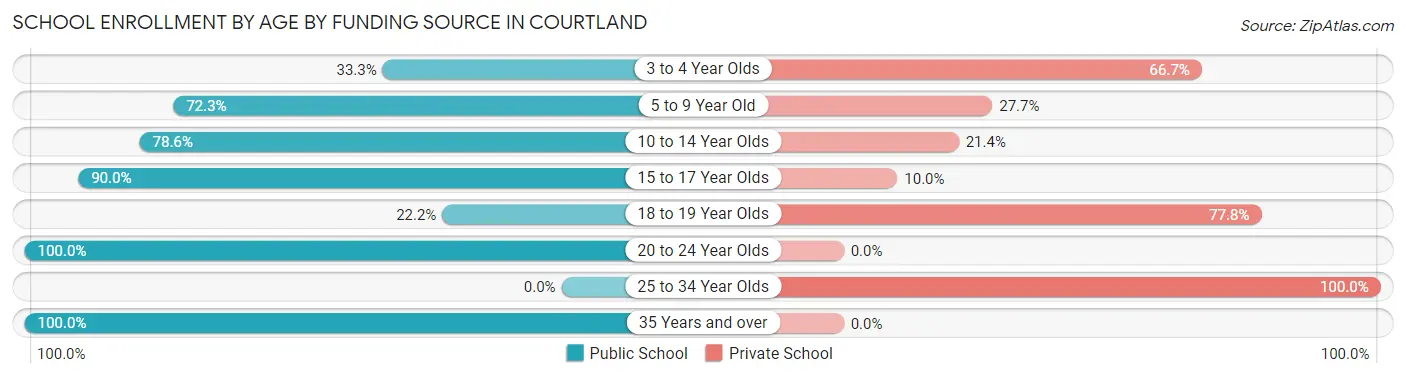
| Age Bracket | Public School | Private School |
| 3 to 4 Year Olds | 2 (33.3%) | 4 (66.7%) |
| 5 to 9 Year Old | 47 (72.3%) | 18 (27.7%) |
| 10 to 14 Year Olds | 33 (78.6%) | 9 (21.4%) |
| 15 to 17 Year Olds | 27 (90.0%) | 3 (10.0%) |
| 18 to 19 Year Olds | 2 (22.2%) | 7 (77.8%) |
| 20 to 24 Year Olds | 11 (100.0%) | 0 (0.0%) |
| 25 to 34 Year Olds | 0 (0.0%) | 3 (100.0%) |
| 35 Years and over | 7 (100.0%) | 0 (0.0%) |
| Total | 129 (74.6%) | 44 (25.4%) |
Educational Attainment by Field of Study in Courtland
Business (40 | 22.0%), education (30 | 16.5%), science & technology (26 | 14.3%), bio, nature & agricultural (20 | 11.0%), and arts & humanities (17 | 9.3%) are the most common fields of study among 182 individuals in Courtland who have obtained a bachelor's degree or higher.
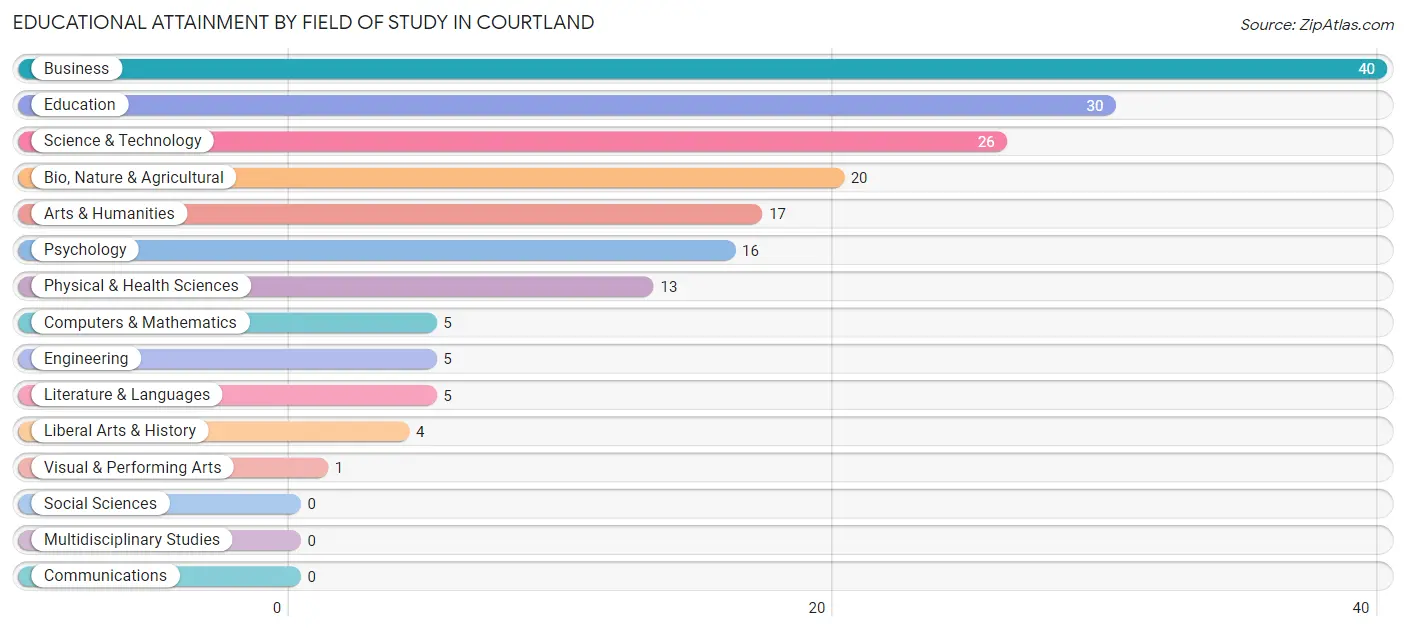
| Field of Study | # Graduates | % Graduates |
| Computers & Mathematics | 5 | 2.8% |
| Bio, Nature & Agricultural | 20 | 11.0% |
| Physical & Health Sciences | 13 | 7.1% |
| Psychology | 16 | 8.8% |
| Social Sciences | 0 | 0.0% |
| Engineering | 5 | 2.8% |
| Multidisciplinary Studies | 0 | 0.0% |
| Science & Technology | 26 | 14.3% |
| Business | 40 | 22.0% |
| Education | 30 | 16.5% |
| Literature & Languages | 5 | 2.8% |
| Liberal Arts & History | 4 | 2.2% |
| Visual & Performing Arts | 1 | 0.5% |
| Communications | 0 | 0.0% |
| Arts & Humanities | 17 | 9.3% |
| Total | 182 | 100.0% |
Transportation & Commute in Courtland
Vehicle Availability by Sex in Courtland
The most prevalent vehicle ownership categories in Courtland are males with 2 vehicles (143, accounting for 49.6%) and females with 2 vehicles (87, making up 82.2%).
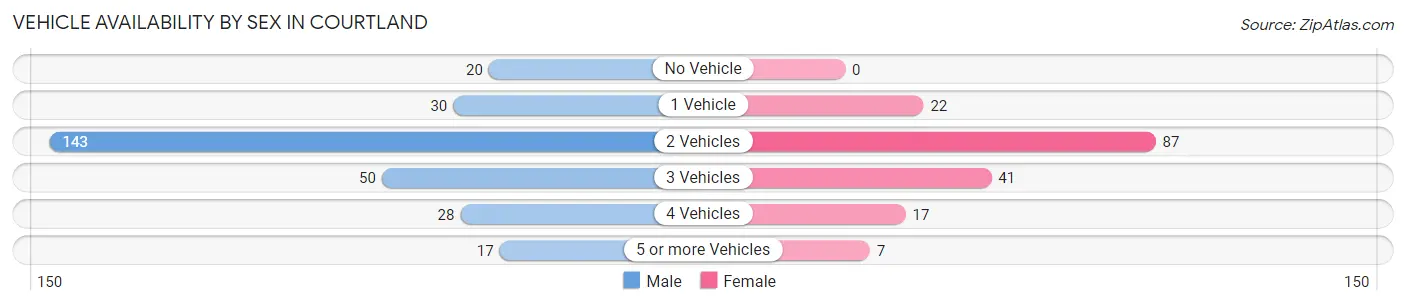
| Vehicles Available | Male | Female |
| No Vehicle | 20 (6.9%) | 0 (0.0%) |
| 1 Vehicle | 30 (10.4%) | 22 (12.6%) |
| 2 Vehicles | 143 (49.6%) | 87 (50.0%) |
| 3 Vehicles | 50 (17.4%) | 41 (23.6%) |
| 4 Vehicles | 28 (9.7%) | 17 (9.8%) |
| 5 or more Vehicles | 17 (5.9%) | 7 (4.0%) |
| Total | 288 (100.0%) | 174 (100.0%) |
Commute Time in Courtland
The most frequently occuring commute durations in Courtland are 15 to 19 minutes (124 commuters, 27.7%), 10 to 14 minutes (109 commuters, 24.3%), and 20 to 24 minutes (73 commuters, 16.3%).
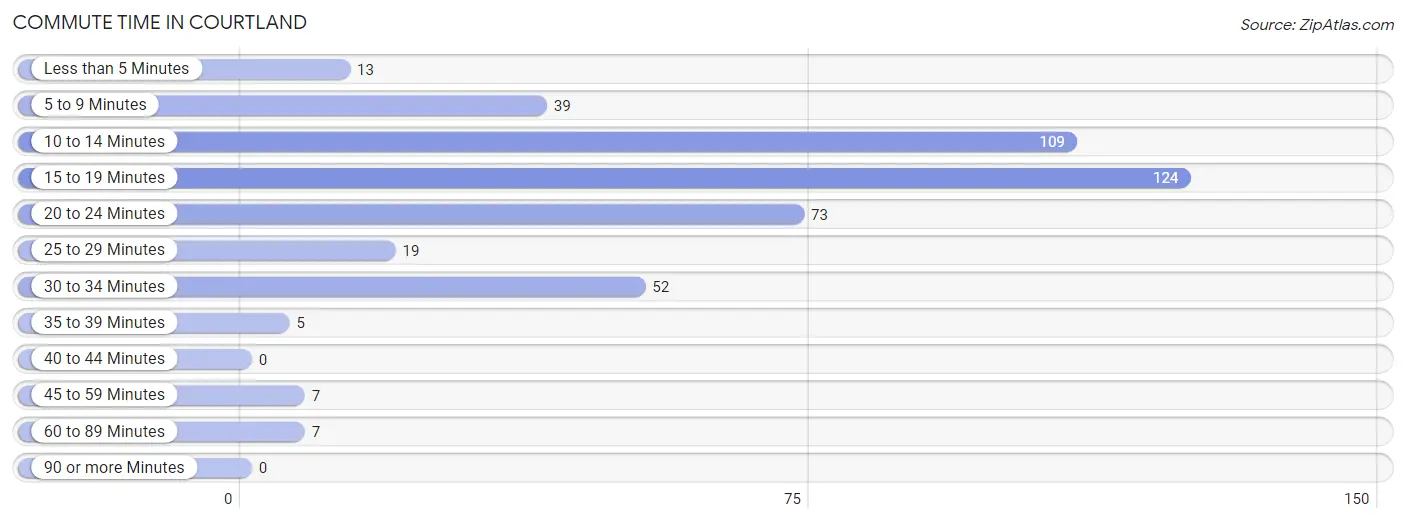
| Commute Time | # Commuters | % Commuters |
| Less than 5 Minutes | 13 | 2.9% |
| 5 to 9 Minutes | 39 | 8.7% |
| 10 to 14 Minutes | 109 | 24.3% |
| 15 to 19 Minutes | 124 | 27.7% |
| 20 to 24 Minutes | 73 | 16.3% |
| 25 to 29 Minutes | 19 | 4.2% |
| 30 to 34 Minutes | 52 | 11.6% |
| 35 to 39 Minutes | 5 | 1.1% |
| 40 to 44 Minutes | 0 | 0.0% |
| 45 to 59 Minutes | 7 | 1.6% |
| 60 to 89 Minutes | 7 | 1.6% |
| 90 or more Minutes | 0 | 0.0% |
Commute Time by Sex in Courtland
The most common commute times in Courtland are 10 to 14 minutes (95 commuters, 33.6%) for males and 15 to 19 minutes (57 commuters, 34.5%) for females.
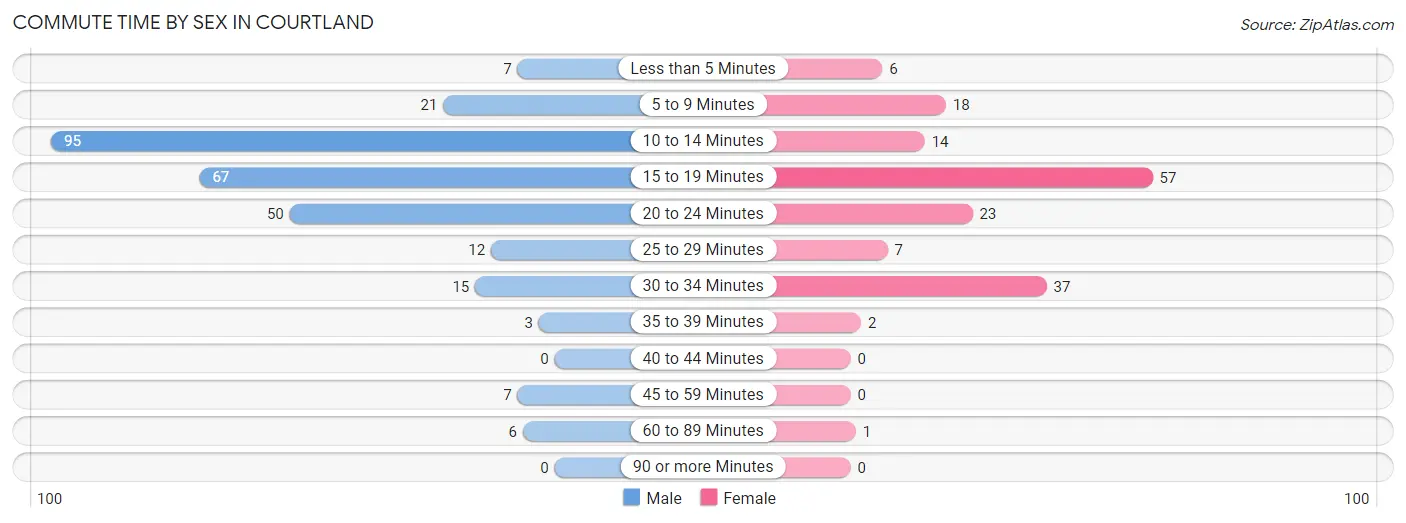
| Commute Time | Male | Female |
| Less than 5 Minutes | 7 (2.5%) | 6 (3.6%) |
| 5 to 9 Minutes | 21 (7.4%) | 18 (10.9%) |
| 10 to 14 Minutes | 95 (33.6%) | 14 (8.5%) |
| 15 to 19 Minutes | 67 (23.7%) | 57 (34.5%) |
| 20 to 24 Minutes | 50 (17.7%) | 23 (13.9%) |
| 25 to 29 Minutes | 12 (4.2%) | 7 (4.2%) |
| 30 to 34 Minutes | 15 (5.3%) | 37 (22.4%) |
| 35 to 39 Minutes | 3 (1.1%) | 2 (1.2%) |
| 40 to 44 Minutes | 0 (0.0%) | 0 (0.0%) |
| 45 to 59 Minutes | 7 (2.5%) | 0 (0.0%) |
| 60 to 89 Minutes | 6 (2.1%) | 1 (0.6%) |
| 90 or more Minutes | 0 (0.0%) | 0 (0.0%) |
Time of Departure to Work by Sex in Courtland
The most frequent times of departure to work in Courtland are 7:30 AM to 7:59 AM (83, 29.3%) for males and 7:00 AM to 7:29 AM (35, 21.2%) for females.
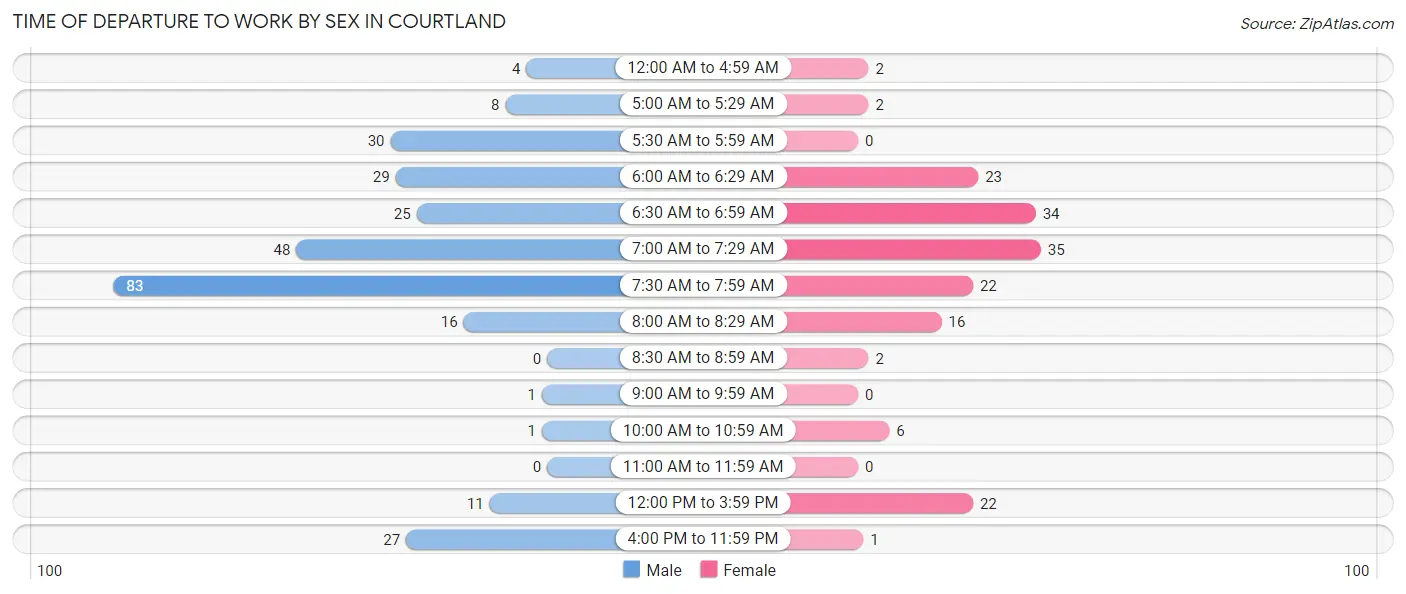
| Time of Departure | Male | Female |
| 12:00 AM to 4:59 AM | 4 (1.4%) | 2 (1.2%) |
| 5:00 AM to 5:29 AM | 8 (2.8%) | 2 (1.2%) |
| 5:30 AM to 5:59 AM | 30 (10.6%) | 0 (0.0%) |
| 6:00 AM to 6:29 AM | 29 (10.2%) | 23 (13.9%) |
| 6:30 AM to 6:59 AM | 25 (8.8%) | 34 (20.6%) |
| 7:00 AM to 7:29 AM | 48 (17.0%) | 35 (21.2%) |
| 7:30 AM to 7:59 AM | 83 (29.3%) | 22 (13.3%) |
| 8:00 AM to 8:29 AM | 16 (5.7%) | 16 (9.7%) |
| 8:30 AM to 8:59 AM | 0 (0.0%) | 2 (1.2%) |
| 9:00 AM to 9:59 AM | 1 (0.4%) | 0 (0.0%) |
| 10:00 AM to 10:59 AM | 1 (0.4%) | 6 (3.6%) |
| 11:00 AM to 11:59 AM | 0 (0.0%) | 0 (0.0%) |
| 12:00 PM to 3:59 PM | 11 (3.9%) | 22 (13.3%) |
| 4:00 PM to 11:59 PM | 27 (9.5%) | 1 (0.6%) |
| Total | 283 (100.0%) | 165 (100.0%) |
Housing Occupancy in Courtland
Occupancy by Ownership in Courtland
Of the total 345 dwellings in Courtland, owner-occupied units account for 282 (81.7%), while renter-occupied units make up 63 (18.3%).
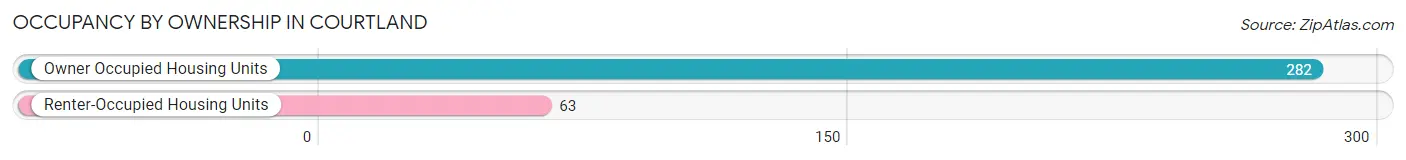
| Occupancy | # Housing Units | % Housing Units |
| Owner Occupied Housing Units | 282 | 81.7% |
| Renter-Occupied Housing Units | 63 | 18.3% |
| Total Occupied Housing Units | 345 | 100.0% |
Occupancy by Household Size in Courtland
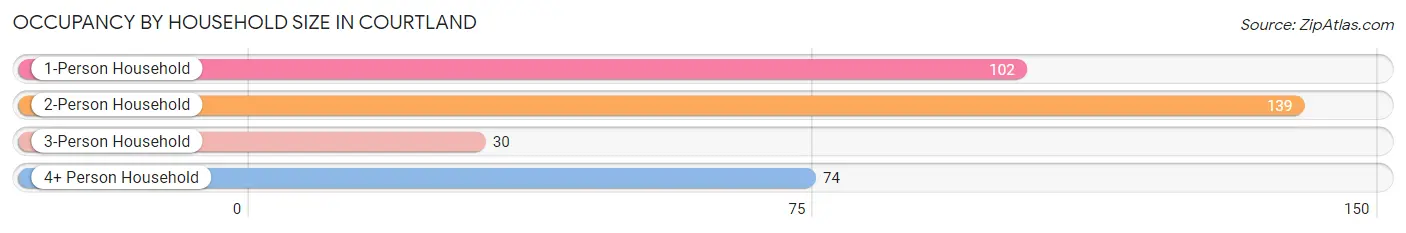
| Household Size | # Housing Units | % Housing Units |
| 1-Person Household | 102 | 29.6% |
| 2-Person Household | 139 | 40.3% |
| 3-Person Household | 30 | 8.7% |
| 4+ Person Household | 74 | 21.4% |
| Total Housing Units | 345 | 100.0% |
Occupancy by Ownership by Household Size in Courtland
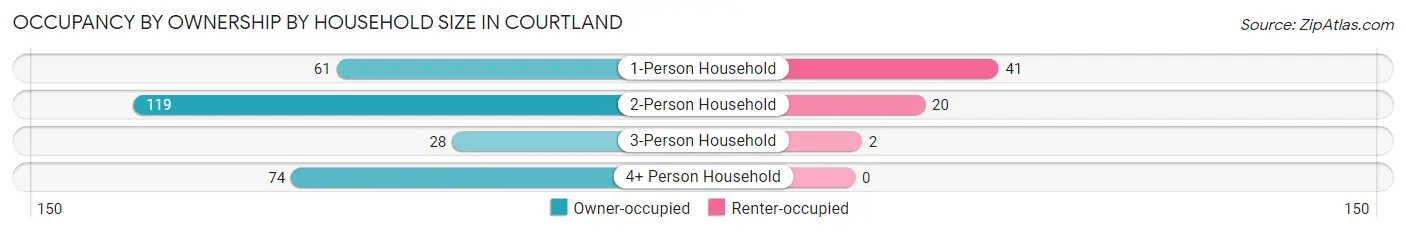
| Household Size | Owner-occupied | Renter-occupied |
| 1-Person Household | 61 (59.8%) | 41 (40.2%) |
| 2-Person Household | 119 (85.6%) | 20 (14.4%) |
| 3-Person Household | 28 (93.3%) | 2 (6.7%) |
| 4+ Person Household | 74 (100.0%) | 0 (0.0%) |
| Total Housing Units | 282 (81.7%) | 63 (18.3%) |
Occupancy by Educational Attainment in Courtland
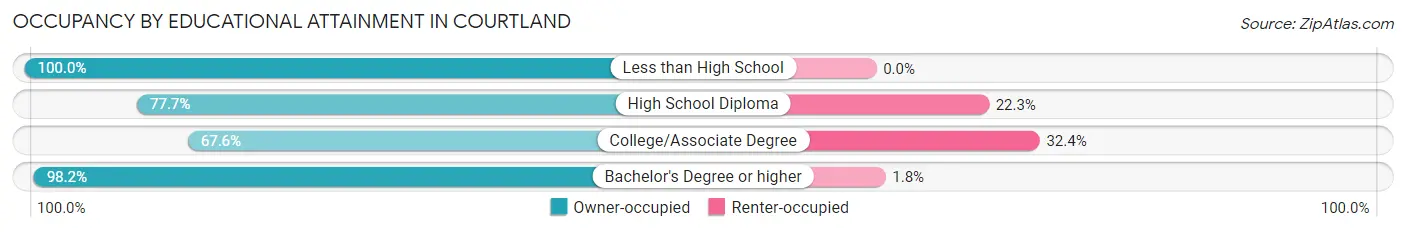
| Household Size | Owner-occupied | Renter-occupied |
| Less than High School | 9 (100.0%) | 0 (0.0%) |
| High School Diploma | 94 (77.7%) | 27 (22.3%) |
| College/Associate Degree | 71 (67.6%) | 34 (32.4%) |
| Bachelor's Degree or higher | 108 (98.2%) | 2 (1.8%) |
Occupancy by Age of Householder in Courtland
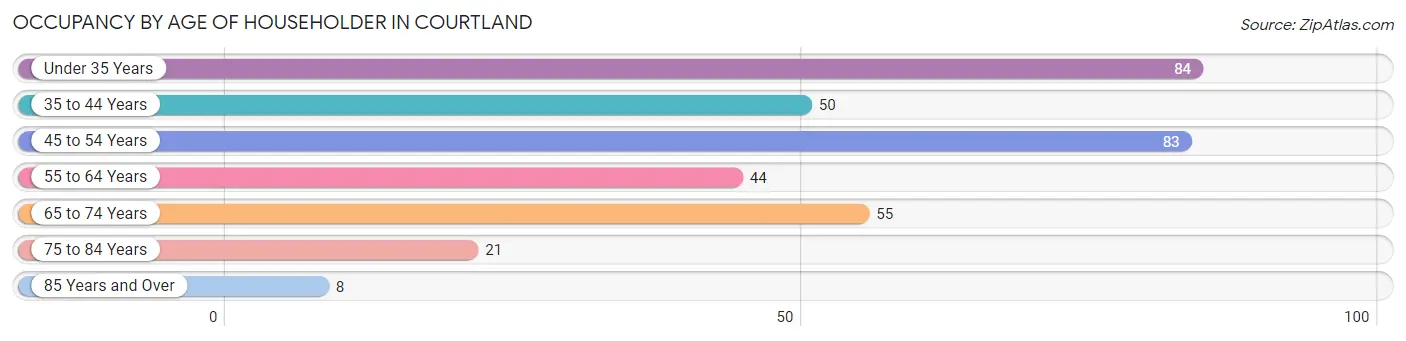
| Age Bracket | # Households | % Households |
| Under 35 Years | 84 | 24.3% |
| 35 to 44 Years | 50 | 14.5% |
| 45 to 54 Years | 83 | 24.1% |
| 55 to 64 Years | 44 | 12.8% |
| 65 to 74 Years | 55 | 15.9% |
| 75 to 84 Years | 21 | 6.1% |
| 85 Years and Over | 8 | 2.3% |
| Total | 345 | 100.0% |
Housing Finances in Courtland
Median Income by Occupancy in Courtland
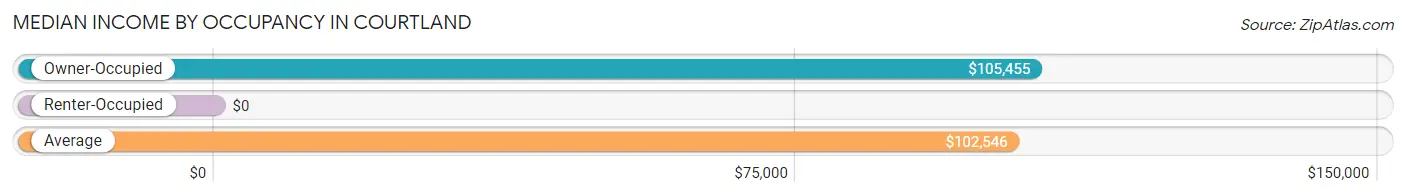
| Occupancy Type | # Households | Median Income |
| Owner-Occupied | 282 (81.7%) | $105,455 |
| Renter-Occupied | 63 (18.3%) | $0 |
| Average | 345 (100.0%) | $102,546 |
Occupancy by Householder Income Bracket in Courtland
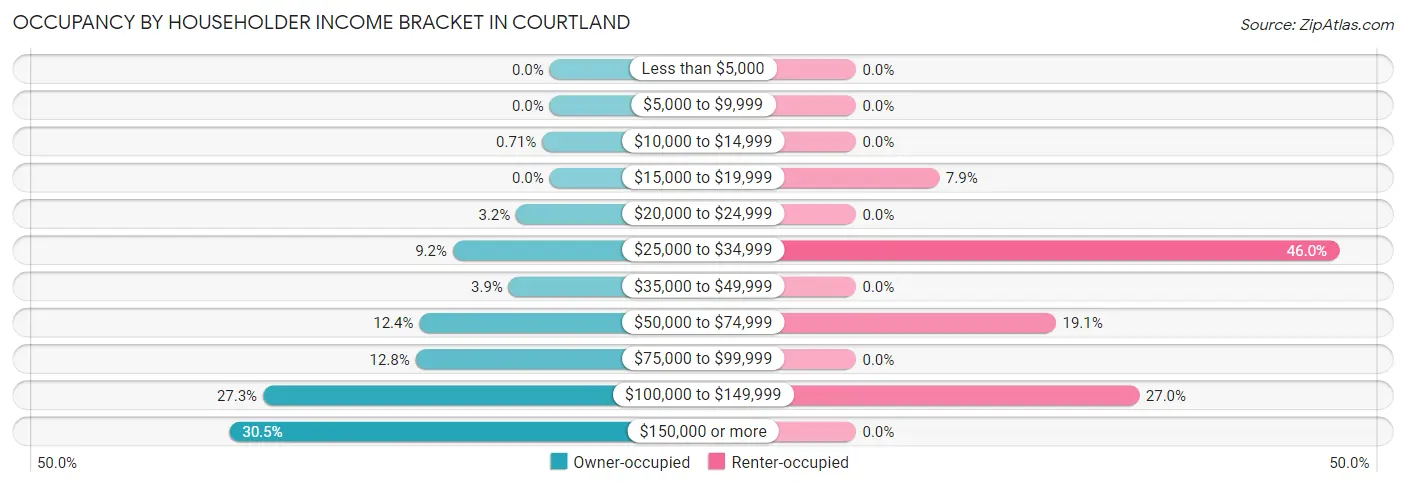
| Income Bracket | Owner-occupied | Renter-occupied |
| Less than $5,000 | 0 (0.0%) | 0 (0.0%) |
| $5,000 to $9,999 | 0 (0.0%) | 0 (0.0%) |
| $10,000 to $14,999 | 2 (0.7%) | 0 (0.0%) |
| $15,000 to $19,999 | 0 (0.0%) | 5 (7.9%) |
| $20,000 to $24,999 | 9 (3.2%) | 0 (0.0%) |
| $25,000 to $34,999 | 26 (9.2%) | 29 (46.0%) |
| $35,000 to $49,999 | 11 (3.9%) | 0 (0.0%) |
| $50,000 to $74,999 | 35 (12.4%) | 12 (19.1%) |
| $75,000 to $99,999 | 36 (12.8%) | 0 (0.0%) |
| $100,000 to $149,999 | 77 (27.3%) | 17 (27.0%) |
| $150,000 or more | 86 (30.5%) | 0 (0.0%) |
| Total | 282 (100.0%) | 63 (100.0%) |
Monthly Housing Cost Tiers in Courtland
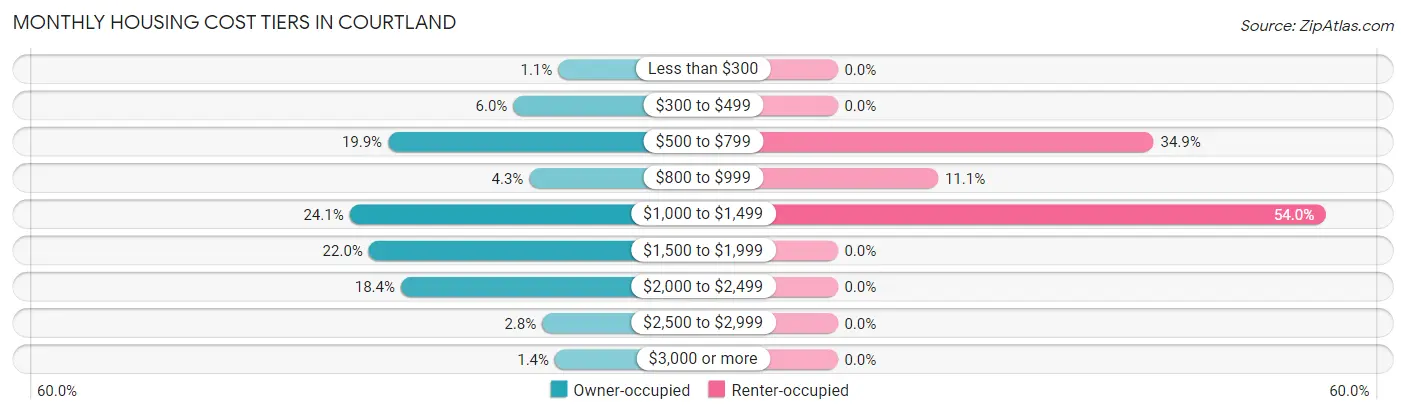
| Monthly Cost | Owner-occupied | Renter-occupied |
| Less than $300 | 3 (1.1%) | 0 (0.0%) |
| $300 to $499 | 17 (6.0%) | 0 (0.0%) |
| $500 to $799 | 56 (19.9%) | 22 (34.9%) |
| $800 to $999 | 12 (4.3%) | 7 (11.1%) |
| $1,000 to $1,499 | 68 (24.1%) | 34 (54.0%) |
| $1,500 to $1,999 | 62 (22.0%) | 0 (0.0%) |
| $2,000 to $2,499 | 52 (18.4%) | 0 (0.0%) |
| $2,500 to $2,999 | 8 (2.8%) | 0 (0.0%) |
| $3,000 or more | 4 (1.4%) | 0 (0.0%) |
| Total | 282 (100.0%) | 63 (100.0%) |
Physical Housing Characteristics in Courtland
Housing Structures in Courtland
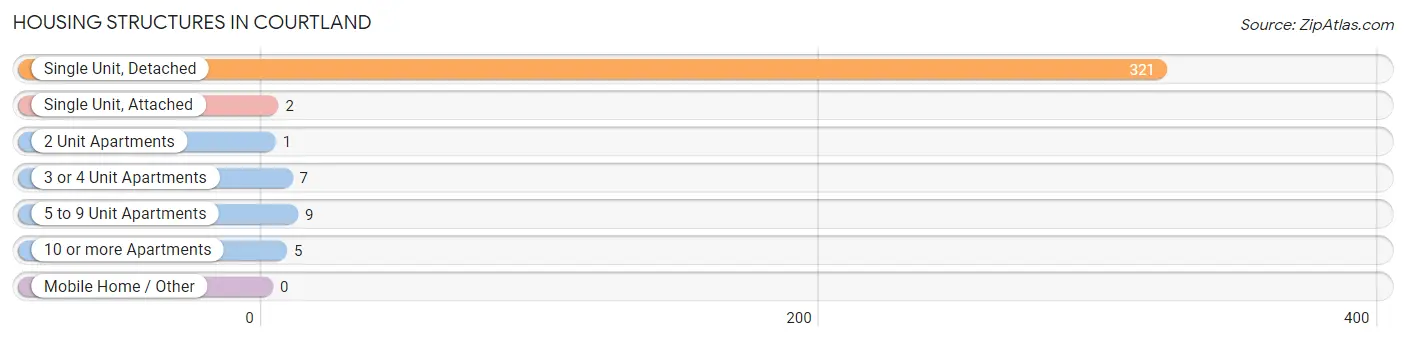
| Structure Type | # Housing Units | % Housing Units |
| Single Unit, Detached | 321 | 93.0% |
| Single Unit, Attached | 2 | 0.6% |
| 2 Unit Apartments | 1 | 0.3% |
| 3 or 4 Unit Apartments | 7 | 2.0% |
| 5 to 9 Unit Apartments | 9 | 2.6% |
| 10 or more Apartments | 5 | 1.5% |
| Mobile Home / Other | 0 | 0.0% |
| Total | 345 | 100.0% |
Housing Structures by Occupancy in Courtland
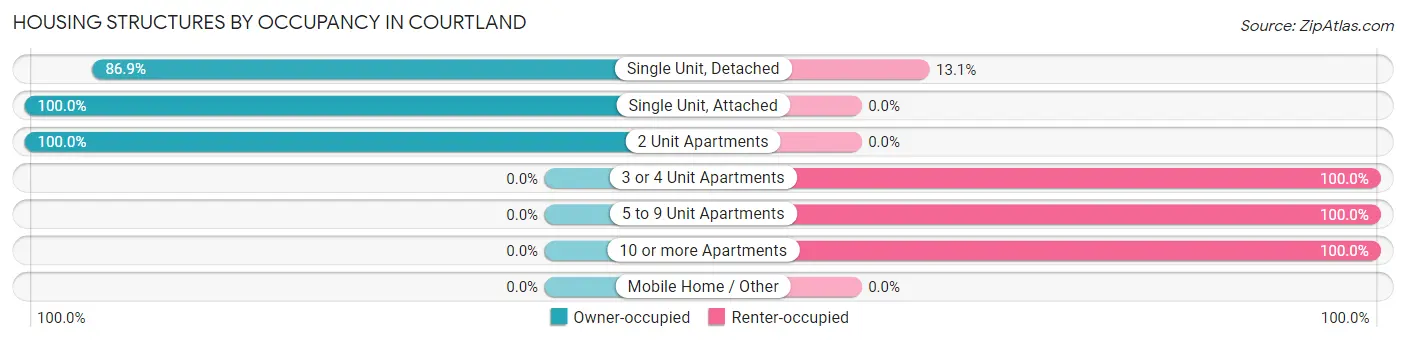
| Structure Type | Owner-occupied | Renter-occupied |
| Single Unit, Detached | 279 (86.9%) | 42 (13.1%) |
| Single Unit, Attached | 2 (100.0%) | 0 (0.0%) |
| 2 Unit Apartments | 1 (100.0%) | 0 (0.0%) |
| 3 or 4 Unit Apartments | 0 (0.0%) | 7 (100.0%) |
| 5 to 9 Unit Apartments | 0 (0.0%) | 9 (100.0%) |
| 10 or more Apartments | 0 (0.0%) | 5 (100.0%) |
| Mobile Home / Other | 0 (0.0%) | 0 (0.0%) |
| Total | 282 (81.7%) | 63 (18.3%) |
Housing Structures by Number of Rooms in Courtland
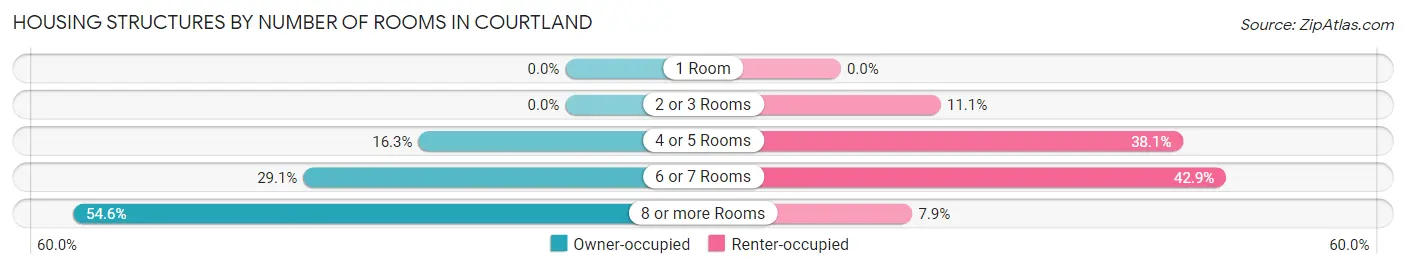
| Number of Rooms | Owner-occupied | Renter-occupied |
| 1 Room | 0 (0.0%) | 0 (0.0%) |
| 2 or 3 Rooms | 0 (0.0%) | 7 (11.1%) |
| 4 or 5 Rooms | 46 (16.3%) | 24 (38.1%) |
| 6 or 7 Rooms | 82 (29.1%) | 27 (42.9%) |
| 8 or more Rooms | 154 (54.6%) | 5 (7.9%) |
| Total | 282 (100.0%) | 63 (100.0%) |
Housing Structure by Heating Type in Courtland
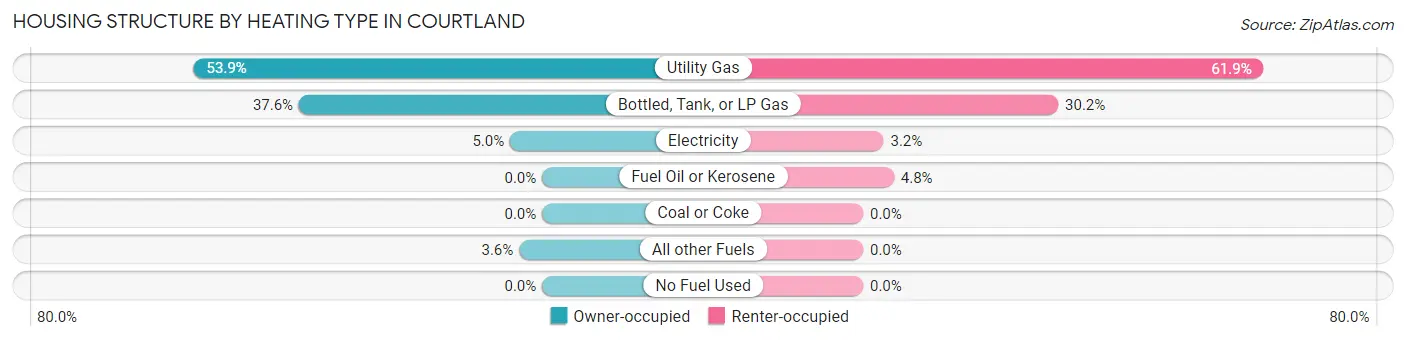
| Heating Type | Owner-occupied | Renter-occupied |
| Utility Gas | 152 (53.9%) | 39 (61.9%) |
| Bottled, Tank, or LP Gas | 106 (37.6%) | 19 (30.2%) |
| Electricity | 14 (5.0%) | 2 (3.2%) |
| Fuel Oil or Kerosene | 0 (0.0%) | 3 (4.8%) |
| Coal or Coke | 0 (0.0%) | 0 (0.0%) |
| All other Fuels | 10 (3.5%) | 0 (0.0%) |
| No Fuel Used | 0 (0.0%) | 0 (0.0%) |
| Total | 282 (100.0%) | 63 (100.0%) |
Household Vehicle Usage in Courtland
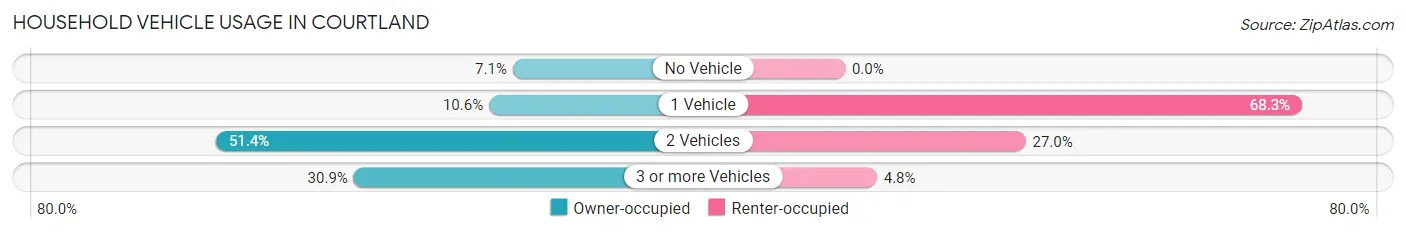
| Vehicles per Household | Owner-occupied | Renter-occupied |
| No Vehicle | 20 (7.1%) | 0 (0.0%) |
| 1 Vehicle | 30 (10.6%) | 43 (68.2%) |
| 2 Vehicles | 145 (51.4%) | 17 (27.0%) |
| 3 or more Vehicles | 87 (30.8%) | 3 (4.8%) |
| Total | 282 (100.0%) | 63 (100.0%) |
Real Estate & Mortgages in Courtland
Real Estate and Mortgage Overview in Courtland
| Characteristic | Without Mortgage | With Mortgage |
| Housing Units | 80 | 202 |
| Median Property Value | $222,500 | $247,700 |
| Median Household Income | $91,250 | $59 |
| Monthly Housing Costs | $636 | $4 |
| Real Estate Taxes | $2,519 | $0 |
Property Value by Mortgage Status in Courtland
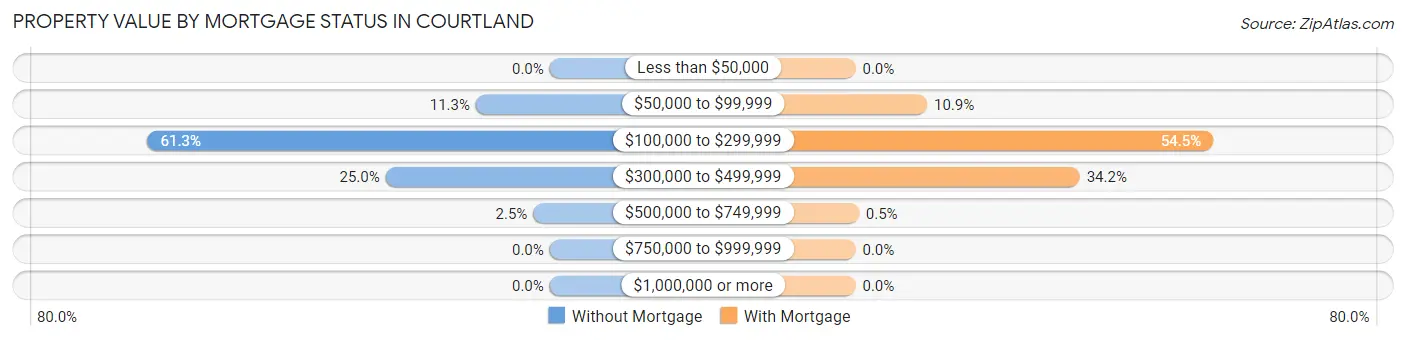
| Property Value | Without Mortgage | With Mortgage |
| Less than $50,000 | 0 (0.0%) | 0 (0.0%) |
| $50,000 to $99,999 | 9 (11.3%) | 22 (10.9%) |
| $100,000 to $299,999 | 49 (61.3%) | 110 (54.5%) |
| $300,000 to $499,999 | 20 (25.0%) | 69 (34.2%) |
| $500,000 to $749,999 | 2 (2.5%) | 1 (0.5%) |
| $750,000 to $999,999 | 0 (0.0%) | 0 (0.0%) |
| $1,000,000 or more | 0 (0.0%) | 0 (0.0%) |
| Total | 80 (100.0%) | 202 (100.0%) |
Household Income by Mortgage Status in Courtland
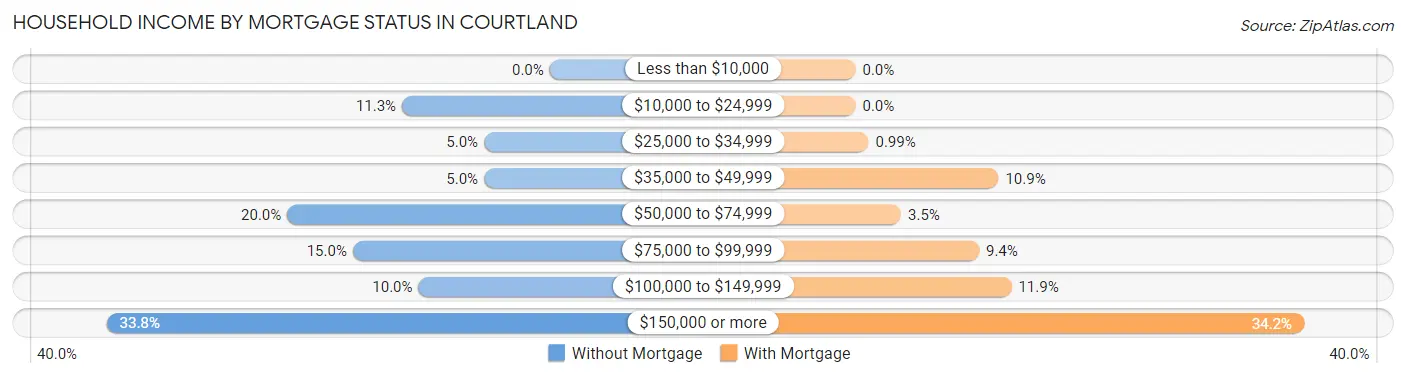
| Household Income | Without Mortgage | With Mortgage |
| Less than $10,000 | 0 (0.0%) | 0 (0.0%) |
| $10,000 to $24,999 | 9 (11.3%) | 0 (0.0%) |
| $25,000 to $34,999 | 4 (5.0%) | 2 (1.0%) |
| $35,000 to $49,999 | 4 (5.0%) | 22 (10.9%) |
| $50,000 to $74,999 | 16 (20.0%) | 7 (3.5%) |
| $75,000 to $99,999 | 12 (15.0%) | 19 (9.4%) |
| $100,000 to $149,999 | 8 (10.0%) | 24 (11.9%) |
| $150,000 or more | 27 (33.8%) | 69 (34.2%) |
| Total | 80 (100.0%) | 202 (100.0%) |
Property Value to Household Income Ratio in Courtland
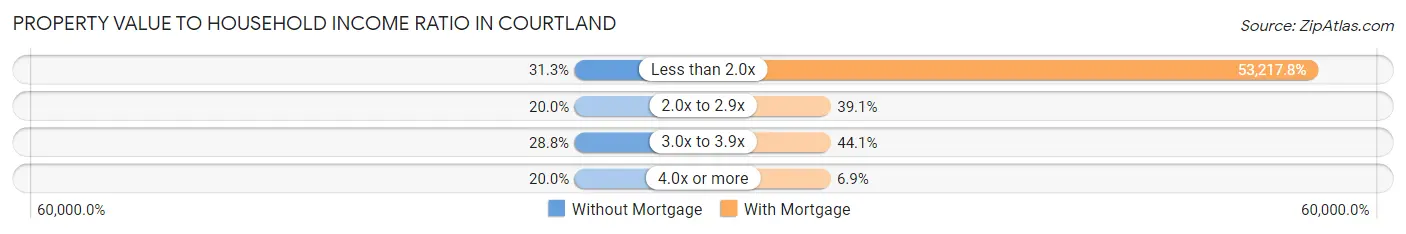
| Value-to-Income Ratio | Without Mortgage | With Mortgage |
| Less than 2.0x | 25 (31.2%) | 107,500 (53,217.8%) |
| 2.0x to 2.9x | 16 (20.0%) | 79 (39.1%) |
| 3.0x to 3.9x | 23 (28.7%) | 89 (44.1%) |
| 4.0x or more | 16 (20.0%) | 14 (6.9%) |
| Total | 80 (100.0%) | 202 (100.0%) |
Real Estate Taxes by Mortgage Status in Courtland
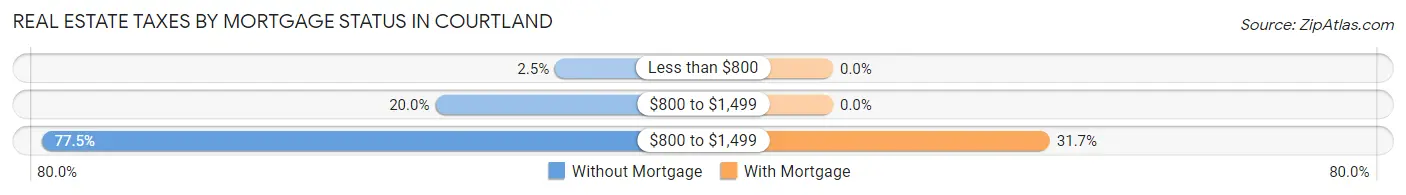
| Property Taxes | Without Mortgage | With Mortgage |
| Less than $800 | 2 (2.5%) | 0 (0.0%) |
| $800 to $1,499 | 16 (20.0%) | 0 (0.0%) |
| $800 to $1,499 | 62 (77.5%) | 64 (31.7%) |
| Total | 80 (100.0%) | 202 (100.0%) |
Health & Disability in Courtland
Health Insurance Coverage by Age in Courtland
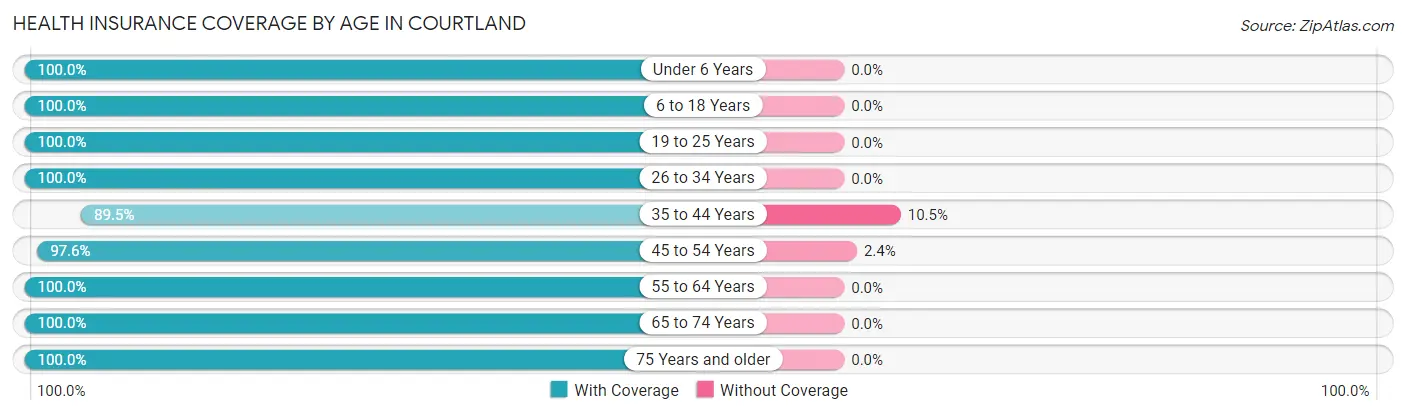
| Age Bracket | With Coverage | Without Coverage |
| Under 6 Years | 52 (100.0%) | 0 (0.0%) |
| 6 to 18 Years | 162 (100.0%) | 0 (0.0%) |
| 19 to 25 Years | 34 (100.0%) | 0 (0.0%) |
| 26 to 34 Years | 115 (100.0%) | 0 (0.0%) |
| 35 to 44 Years | 85 (89.5%) | 10 (10.5%) |
| 45 to 54 Years | 124 (97.6%) | 3 (2.4%) |
| 55 to 64 Years | 77 (100.0%) | 0 (0.0%) |
| 65 to 74 Years | 90 (100.0%) | 0 (0.0%) |
| 75 Years and older | 48 (100.0%) | 0 (0.0%) |
| Total | 787 (98.4%) | 13 (1.6%) |
Health Insurance Coverage by Citizenship Status in Courtland
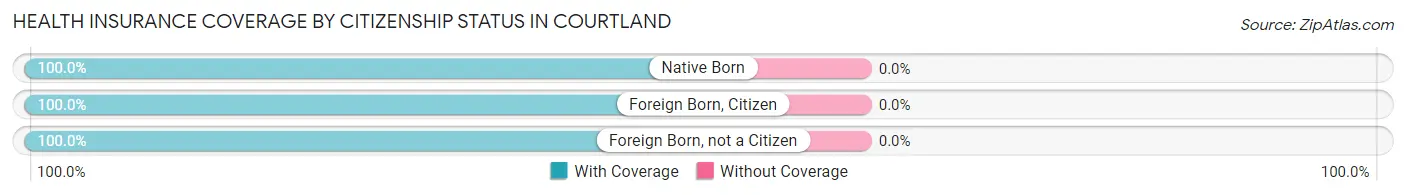
| Citizenship Status | With Coverage | Without Coverage |
| Native Born | 52 (100.0%) | 0 (0.0%) |
| Foreign Born, Citizen | 162 (100.0%) | 0 (0.0%) |
| Foreign Born, not a Citizen | 34 (100.0%) | 0 (0.0%) |
Health Insurance Coverage by Household Income in Courtland
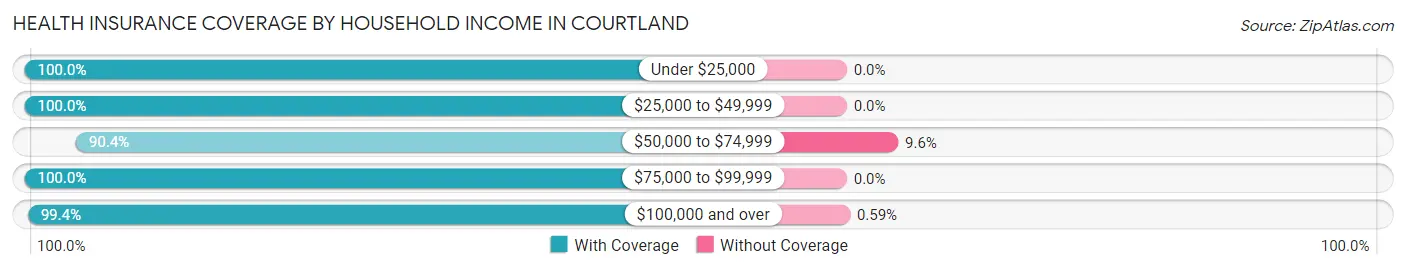
| Household Income | With Coverage | Without Coverage |
| Under $25,000 | 28 (100.0%) | 0 (0.0%) |
| $25,000 to $49,999 | 86 (100.0%) | 0 (0.0%) |
| $50,000 to $74,999 | 94 (90.4%) | 10 (9.6%) |
| $75,000 to $99,999 | 75 (100.0%) | 0 (0.0%) |
| $100,000 and over | 504 (99.4%) | 3 (0.6%) |
Public vs Private Health Insurance Coverage by Age in Courtland
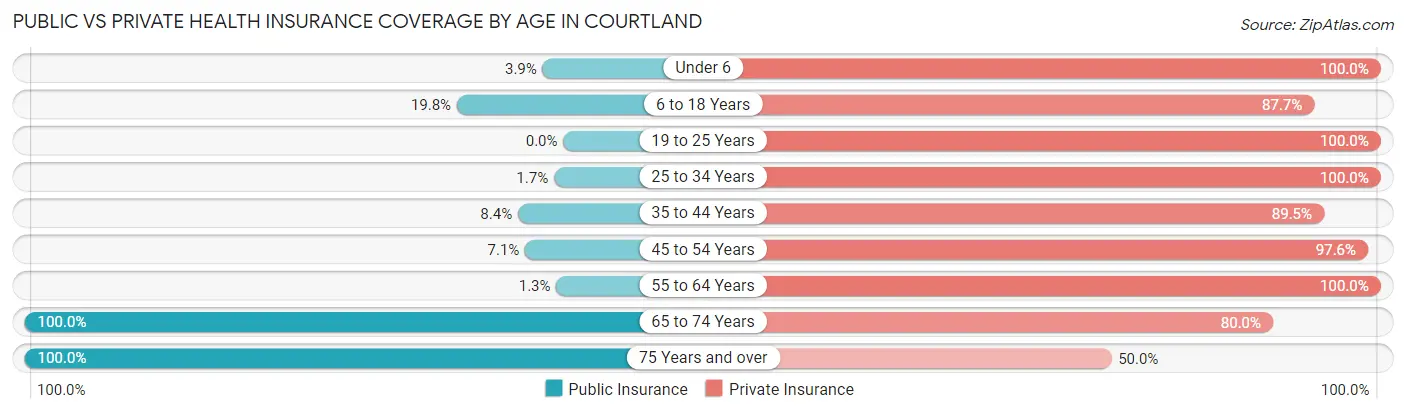
| Age Bracket | Public Insurance | Private Insurance |
| Under 6 | 2 (3.8%) | 52 (100.0%) |
| 6 to 18 Years | 32 (19.8%) | 142 (87.6%) |
| 19 to 25 Years | 0 (0.0%) | 34 (100.0%) |
| 25 to 34 Years | 2 (1.7%) | 115 (100.0%) |
| 35 to 44 Years | 8 (8.4%) | 85 (89.5%) |
| 45 to 54 Years | 9 (7.1%) | 124 (97.6%) |
| 55 to 64 Years | 1 (1.3%) | 77 (100.0%) |
| 65 to 74 Years | 90 (100.0%) | 72 (80.0%) |
| 75 Years and over | 48 (100.0%) | 24 (50.0%) |
| Total | 192 (24.0%) | 725 (90.6%) |
Disability Status by Sex by Age in Courtland
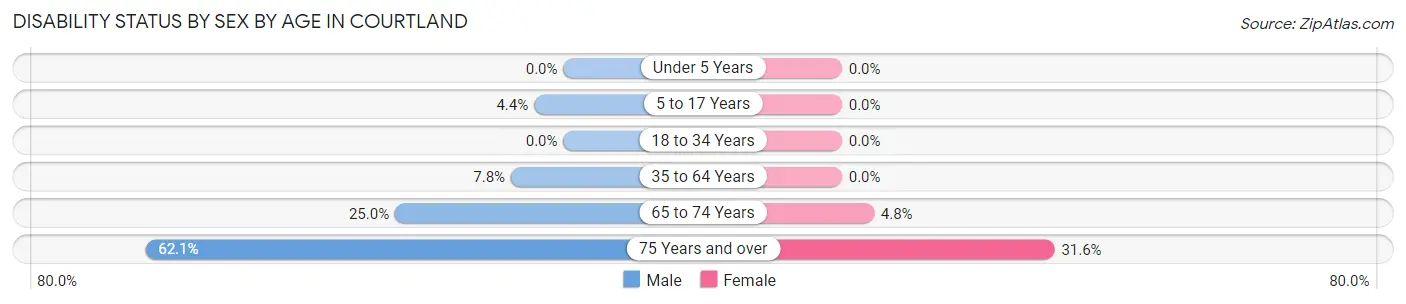
| Age Bracket | Male | Female |
| Under 5 Years | 0 (0.0%) | 0 (0.0%) |
| 5 to 17 Years | 4 (4.3%) | 0 (0.0%) |
| 18 to 34 Years | 0 (0.0%) | 0 (0.0%) |
| 35 to 64 Years | 13 (7.8%) | 0 (0.0%) |
| 65 to 74 Years | 12 (25.0%) | 2 (4.8%) |
| 75 Years and over | 18 (62.1%) | 6 (31.6%) |
Disability Class by Sex by Age in Courtland
Disability Class: Hearing Difficulty
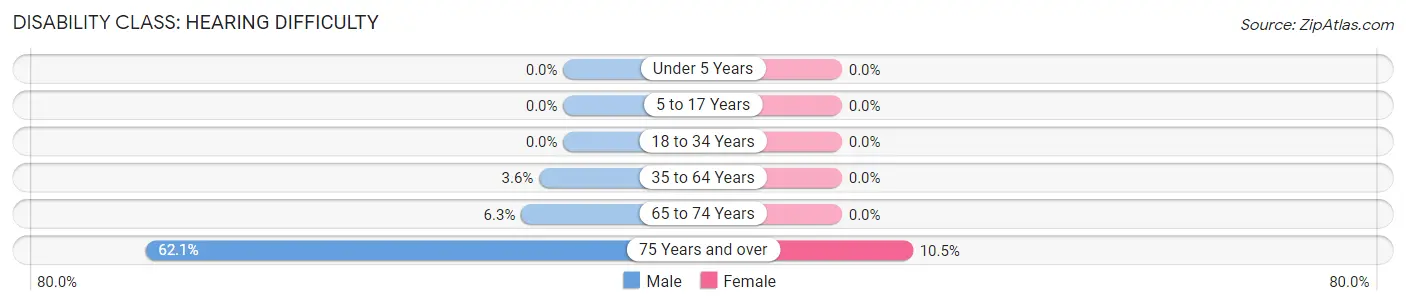
| Age Bracket | Male | Female |
| Under 5 Years | 0 (0.0%) | 0 (0.0%) |
| 5 to 17 Years | 0 (0.0%) | 0 (0.0%) |
| 18 to 34 Years | 0 (0.0%) | 0 (0.0%) |
| 35 to 64 Years | 6 (3.6%) | 0 (0.0%) |
| 65 to 74 Years | 3 (6.2%) | 0 (0.0%) |
| 75 Years and over | 18 (62.1%) | 2 (10.5%) |
Disability Class: Vision Difficulty
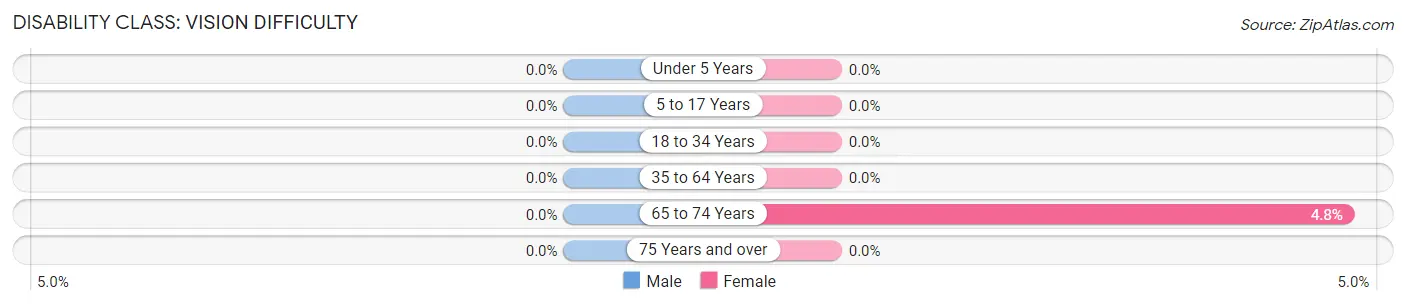
| Age Bracket | Male | Female |
| Under 5 Years | 0 (0.0%) | 0 (0.0%) |
| 5 to 17 Years | 0 (0.0%) | 0 (0.0%) |
| 18 to 34 Years | 0 (0.0%) | 0 (0.0%) |
| 35 to 64 Years | 0 (0.0%) | 0 (0.0%) |
| 65 to 74 Years | 0 (0.0%) | 2 (4.8%) |
| 75 Years and over | 0 (0.0%) | 0 (0.0%) |
Disability Class: Cognitive Difficulty
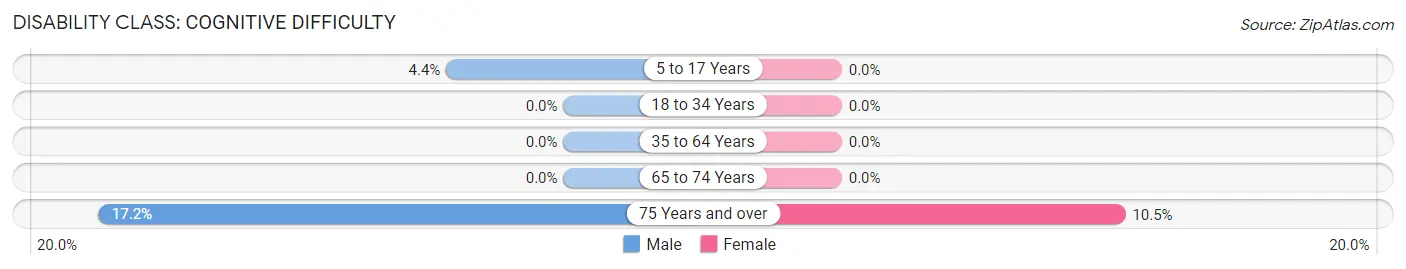
| Age Bracket | Male | Female |
| 5 to 17 Years | 4 (4.3%) | 0 (0.0%) |
| 18 to 34 Years | 0 (0.0%) | 0 (0.0%) |
| 35 to 64 Years | 0 (0.0%) | 0 (0.0%) |
| 65 to 74 Years | 0 (0.0%) | 0 (0.0%) |
| 75 Years and over | 5 (17.2%) | 2 (10.5%) |
Disability Class: Ambulatory Difficulty
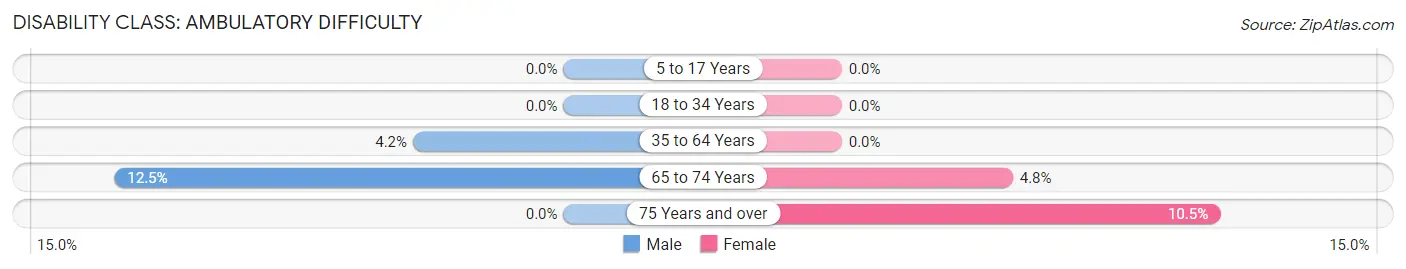
| Age Bracket | Male | Female |
| 5 to 17 Years | 0 (0.0%) | 0 (0.0%) |
| 18 to 34 Years | 0 (0.0%) | 0 (0.0%) |
| 35 to 64 Years | 7 (4.2%) | 0 (0.0%) |
| 65 to 74 Years | 6 (12.5%) | 2 (4.8%) |
| 75 Years and over | 0 (0.0%) | 2 (10.5%) |
Disability Class: Self-Care Difficulty
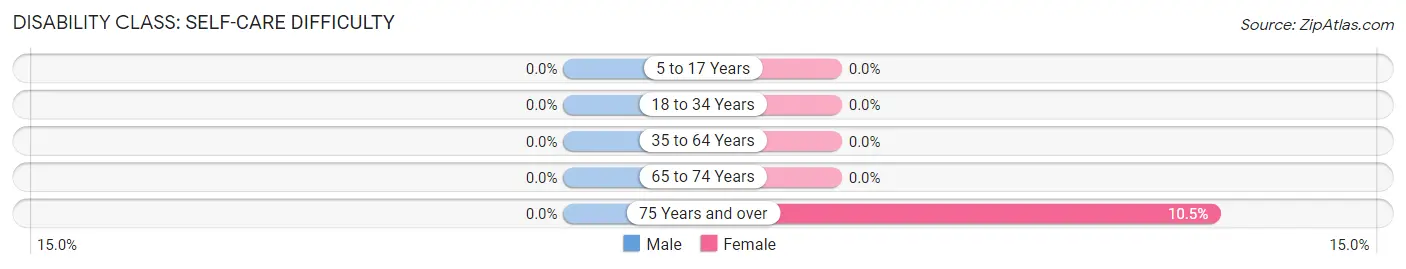
| Age Bracket | Male | Female |
| 5 to 17 Years | 0 (0.0%) | 0 (0.0%) |
| 18 to 34 Years | 0 (0.0%) | 0 (0.0%) |
| 35 to 64 Years | 0 (0.0%) | 0 (0.0%) |
| 65 to 74 Years | 0 (0.0%) | 0 (0.0%) |
| 75 Years and over | 0 (0.0%) | 2 (10.5%) |
Technology Access in Courtland
Computing Device Access in Courtland
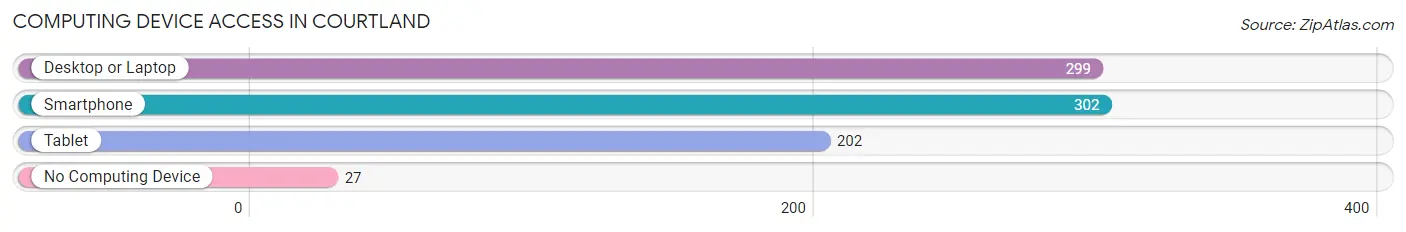
| Device Type | # Households | % Households |
| Desktop or Laptop | 299 | 86.7% |
| Smartphone | 302 | 87.5% |
| Tablet | 202 | 58.6% |
| No Computing Device | 27 | 7.8% |
| Total | 345 | 100.0% |
Internet Access in Courtland
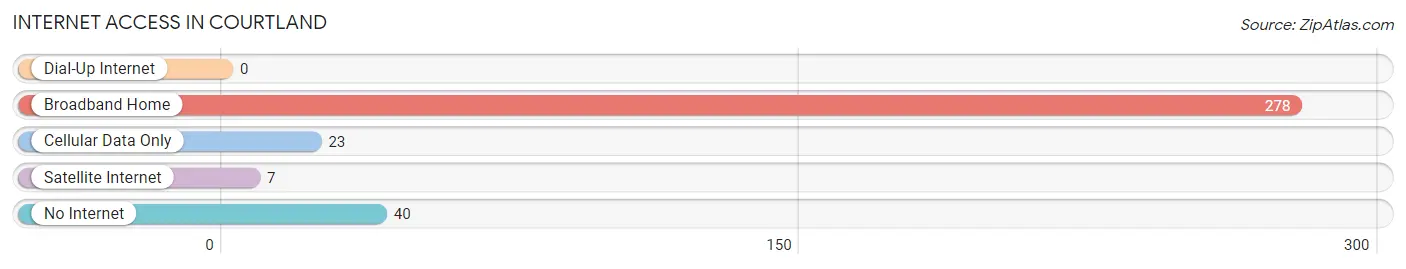
| Internet Type | # Households | % Households |
| Dial-Up Internet | 0 | 0.0% |
| Broadband Home | 278 | 80.6% |
| Cellular Data Only | 23 | 6.7% |
| Satellite Internet | 7 | 2.0% |
| No Internet | 40 | 11.6% |
| Total | 345 | 100.0% |
Courtland Summary
History
The small town of Courtland, Minnesota is located in Nicollet County, in the south-central part of the state. It is situated on the banks of the Minnesota River, and is part of the Mankato-North Mankato Metropolitan Statistical Area. The town was founded in 1856 by a group of settlers from Germany, and was originally known as “New Courtland”. The town was named after the German city of Courtland, which was the birthplace of one of the settlers.
The town was originally a farming community, and the main crops grown were wheat, corn, and oats. The town also had a small sawmill, which provided lumber for the local area. In the late 1800s, the town began to grow and prosper, and by the early 1900s, it had become a thriving community.
The town was incorporated in 1887, and the first mayor was John F. Schmieder. The town continued to grow and prosper, and by the early 1900s, it had become a thriving community. The town had a variety of businesses, including a bank, a hotel, a general store, a blacksmith shop, and a post office.
In the early 1900s, the town was also home to a number of churches, including the German Lutheran Church, the Methodist Episcopal Church, and the Catholic Church. The town also had a number of schools, including a high school, a grade school, and a business college.
The town continued to grow and prosper, and by the mid-1900s, it had become a popular tourist destination. The town was home to a number of attractions, including a golf course, a swimming pool, and a movie theater. The town also had a number of parks, including a city park and a county park.
The town continued to grow and prosper, and by the late 1900s, it had become a popular destination for retirees. The town had a number of retirement communities, and a number of businesses catering to the needs of retirees.
Geography
Courtland is located in the south-central part of Minnesota, in Nicollet County. It is situated on the banks of the Minnesota River, and is part of the Mankato-North Mankato Metropolitan Statistical Area. The town is located approximately 50 miles south of Minneapolis, and is about 25 miles east of Mankato.
The town is located in a rural area, and is surrounded by rolling hills and farmland. The town is located in a temperate climate, and has four distinct seasons. The average temperature in the summer is around 75 degrees Fahrenheit, and the average temperature in the winter is around 20 degrees Fahrenheit.
The town is located in an area of natural beauty, and is home to a number of parks and recreational areas. The town is also home to a number of lakes, including Lake Washington, Lake Minnetonka, and Lake Superior.
Economy
The economy of Courtland is largely based on agriculture and tourism. The town is home to a number of farms, and the main crops grown are wheat, corn, and oats. The town also has a number of businesses catering to the needs of retirees, and a number of businesses catering to the needs of tourists.
The town is also home to a number of manufacturing businesses, including a furniture factory, a printing company, and a plastics factory. The town is also home to a number of retail businesses, including a grocery store, a hardware store, and a number of restaurants.
Demographics
As of the 2010 census, the population of Courtland was 1,845. The town has a population density of 1,845 people per square mile. The median age of the population is 44.7 years, and the median household income is $50,000.
The town is predominantly white, with 95.3% of the population being white. The town also has a small Hispanic population, with 2.2% of the population being Hispanic. The town also has a small African American population, with 0.7% of the population being African American.
Conclusion
Courtland, Minnesota is a small town located in Nicollet County, in the south-central part of the state. The town was founded in 1856 by a group of settlers from Germany, and was originally known as “New Courtland”. The town has a population of 1,845, and the median age of the population is 44.7 years. The town is predominantly white, with 95.3% of the population being white. The town’s economy is largely based on agriculture and tourism, and the town is home to a number of businesses catering to the needs of retirees and tourists.
Common Questions
What is Per Capita Income in Courtland?
Per Capita income in Courtland is $47,025.
What is the Median Family Income in Courtland?
Median Family Income in Courtland is $116,154.
What is the Median Household income in Courtland?
Median Household Income in Courtland is $102,546.
What is Income or Wage Gap in Courtland?
Income or Wage Gap in Courtland is 0.3%.
Women in Courtland earn 99.7 cents for every dollar earned by a man.
What is Inequality or Gini Index in Courtland?
Inequality or Gini Index in Courtland is 0.37.
What is the Total Population of Courtland?
Total Population of Courtland is 800.
What is the Total Male Population of Courtland?
Total Male Population of Courtland is 472.
What is the Total Female Population of Courtland?
Total Female Population of Courtland is 328.
What is the Ratio of Males per 100 Females in Courtland?
There are 143.90 Males per 100 Females in Courtland.
What is the Ratio of Females per 100 Males in Courtland?
There are 69.49 Females per 100 Males in Courtland.
What is the Median Population Age in Courtland?
Median Population Age in Courtland is 39.6 Years.
What is the Average Family Size in Courtland
Average Family Size in Courtland is 3.0 People.
What is the Average Household Size in Courtland
Average Household Size in Courtland is 2.3 People.
How Large is the Labor Force in Courtland?
There are 469 People in the Labor Forcein in Courtland.
What is the Percentage of People in the Labor Force in Courtland?
74.1% of People are in the Labor Force in Courtland.
What is the Unemployment Rate in Courtland?
Unemployment Rate in Courtland is 0.9%.