Area Code 215 Map & Demographics
Area Code 215 Map

Area Code 215 Overview
$51,851
PER CAPITA INCOME
$115,789
AVG FAMILY INCOME
$96,124
AVG HOUSEHOLD INCOME
23.5%
WAGE / INCOME GAP [ % ]
76.5¢/ $1
WAGE / INCOME GAP [ $ ]
$11,224
FAMILY INCOME DEFICIT
47.22
INEQUALITY / GINI INDEX
2,646,610
TOTAL POPULATION
1,275,126
MALE POPULATION
1,371,484
FEMALE POPULATION
92.97
MALES / 100 FEMALES
107.56
FEMALES / 100 MALES
40.7
MEDIAN AGE
3.1
AVG FAMILY SIZE
2.5
AVG HOUSEHOLD SIZE
1,388,001
LABOR FORCE [ PEOPLE ]
64.6%
PERCENT IN LABOR FORCE
6.7%
UNEMPLOYMENT RATE
Income in Area Code 215
Income Overview in Area Code 215
Per Capita Income in Area Code 215 is $51,851, while median incomes of families and households are $115,789 and $96,124 respectively.
| Characteristic | Number | Measure |
| Per Capita Income | 2,646,610 | $51,851 |
| Median Family Income | 631,066 | $115,789 |
| Mean Family Income | 631,066 | $15,188,126 |
| Median Household Income | 1,062,653 | $96,124 |
| Mean Household Income | 1,062,653 | $13,129,263 |
| Income Deficit | 631,066 | $11,224 |
| Wage / Income Gap (%) | 2,646,610 | 23.47% |
| Wage / Income Gap ($) | 2,646,610 | 76.53¢ per $1 |
| Gini / Inequality Index | 2,646,610 | 47.22 |
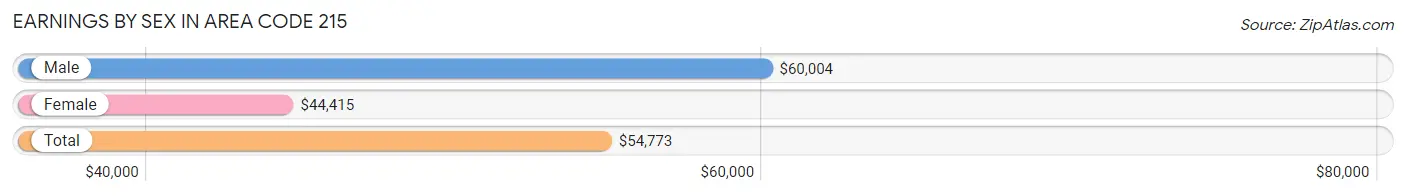
Earnings by Sex in Area Code 215
Average Earnings in Area Code 215 are $54,773, $60,004 for men and $44,415 for women, a difference of 26.0%.
| Sex | Number | Average Earnings |
| Male | 718,000 (50.2%) | $60,004 |
| Female | 713,527 (49.8%) | $44,415 |
| Total | 1,431,527 (100.0%) | $54,773 |
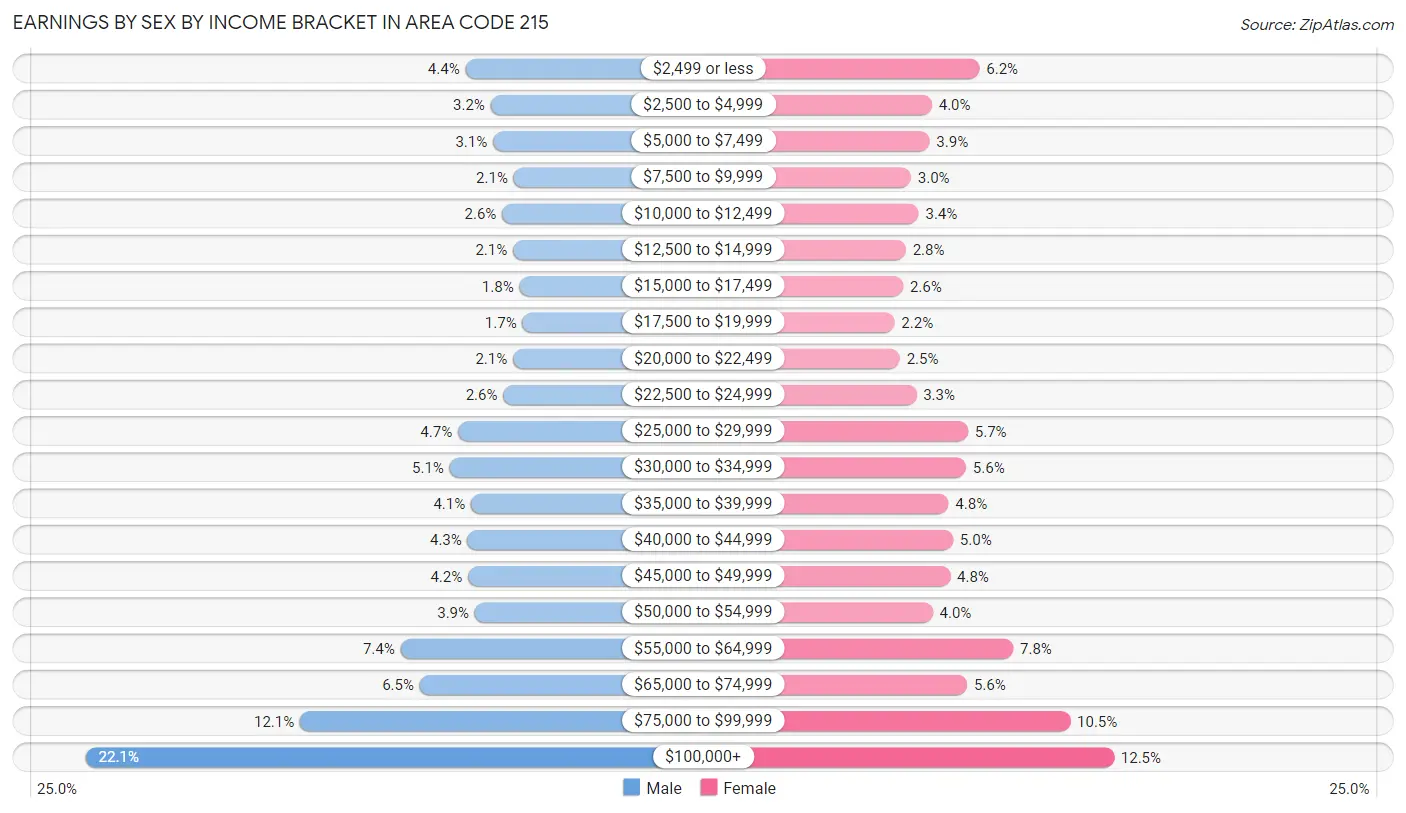
Earnings by Sex by Income Bracket in Area Code 215
The most common earnings brackets in Area Code 215 are $100,000+ for men (158,952 | 22.1%) and $100,000+ for women (89,264 | 12.5%).
| Income | Male | Female |
| $2,499 or less | 31,205 (4.3%) | 44,343 (6.2%) |
| $2,500 to $4,999 | 22,789 (3.2%) | 28,387 (4.0%) |
| $5,000 to $7,499 | 21,935 (3.1%) | 27,636 (3.9%) |
| $7,500 to $9,999 | 14,983 (2.1%) | 21,402 (3.0%) |
| $10,000 to $12,499 | 18,865 (2.6%) | 23,958 (3.4%) |
| $12,500 to $14,999 | 15,233 (2.1%) | 19,711 (2.8%) |
| $15,000 to $17,499 | 13,065 (1.8%) | 18,745 (2.6%) |
| $17,500 to $19,999 | 12,051 (1.7%) | 15,940 (2.2%) |
| $20,000 to $22,499 | 15,255 (2.1%) | 17,660 (2.5%) |
| $22,500 to $24,999 | 18,496 (2.6%) | 23,199 (3.3%) |
| $25,000 to $29,999 | 33,734 (4.7%) | 40,447 (5.7%) |
| $30,000 to $34,999 | 36,560 (5.1%) | 39,802 (5.6%) |
| $35,000 to $39,999 | 29,356 (4.1%) | 33,989 (4.8%) |
| $40,000 to $44,999 | 30,482 (4.3%) | 35,488 (5.0%) |
| $45,000 to $49,999 | 30,398 (4.2%) | 34,505 (4.8%) |
| $50,000 to $54,999 | 28,103 (3.9%) | 28,687 (4.0%) |
| $55,000 to $64,999 | 53,048 (7.4%) | 55,562 (7.8%) |
| $65,000 to $74,999 | 46,613 (6.5%) | 40,150 (5.6%) |
| $75,000 to $99,999 | 86,877 (12.1%) | 74,652 (10.5%) |
| $100,000+ | 158,952 (22.1%) | 89,264 (12.5%) |
| Total | 718,000 (100.0%) | 713,527 (100.0%) |
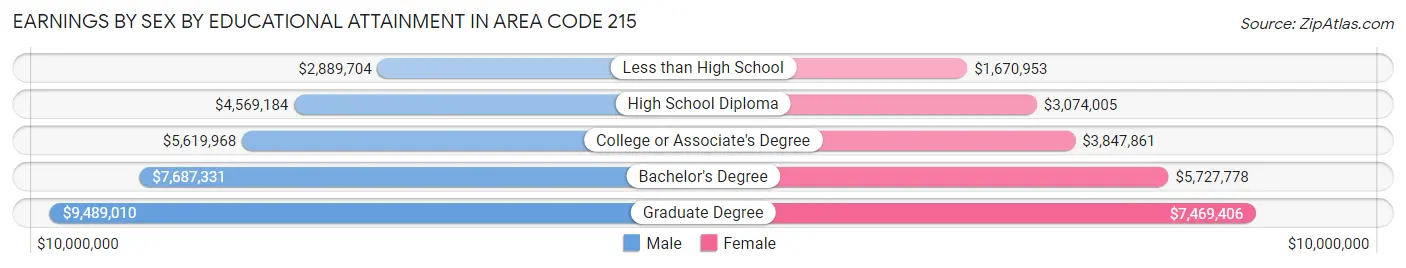
Earnings by Sex by Educational Attainment in Area Code 215
Average earnings in Area Code 215 are $6,701,207 for men and $5,083,550 for women, a difference of 24.1%. Men with an educational attainment of graduate degree enjoy the highest average annual earnings of $9,489,010, while those with less than high school education earn the least with $2,889,704. Women with an educational attainment of graduate degree earn the most with the average annual earnings of $7,469,406, while those with less than high school education have the smallest earnings of $1,670,953.
| Educational Attainment | Male Income | Female Income |
| Less than High School | $2,889,704 | $1,670,953 |
| High School Diploma | $4,569,184 | $3,074,005 |
| College or Associate's Degree | $5,619,968 | $3,847,861 |
| Bachelor's Degree | $7,687,331 | $5,727,778 |
| Graduate Degree | $9,489,010 | $7,469,406 |
| Total | $6,701,207 | $5,083,550 |
Family Income in Area Code 215
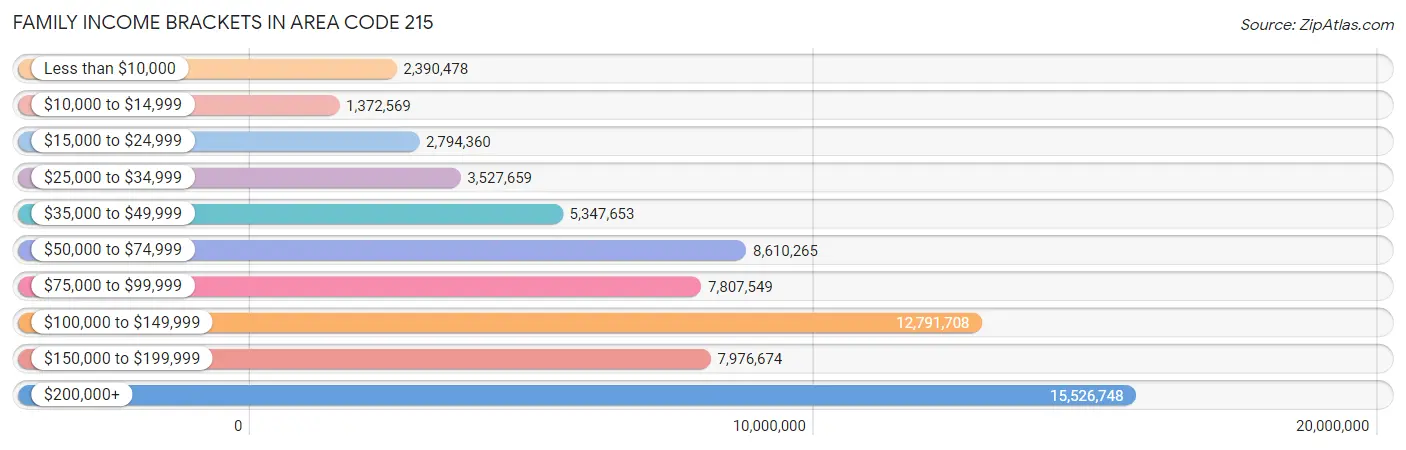
Family Income Brackets in Area Code 215
According to the Area Code 215 family income data, there are 15,526,748 families falling into the $200,000+ income range, which is the most common income bracket and makes up 2,460.4% of all families. Conversely, the $10,000 to $14,999 income bracket is the least frequent group with only 1,372,569 families (217.5%) belonging to this category.
| Income Bracket | # Families | % Families |
| Less than $10,000 | 2,390,478 | 378.8% |
| $10,000 to $14,999 | 1,372,569 | 217.5% |
| $15,000 to $24,999 | 2,794,360 | 442.8% |
| $25,000 to $34,999 | 3,527,659 | 559.0% |
| $35,000 to $49,999 | 5,347,653 | 847.4% |
| $50,000 to $74,999 | 8,610,265 | 1,364.4% |
| $75,000 to $99,999 | 7,807,549 | 1,237.2% |
| $100,000 to $149,999 | 12,791,708 | 2,027.0% |
| $150,000 to $199,999 | 7,976,674 | 1,264.0% |
| $200,000+ | 15,526,748 | 2,460.4% |
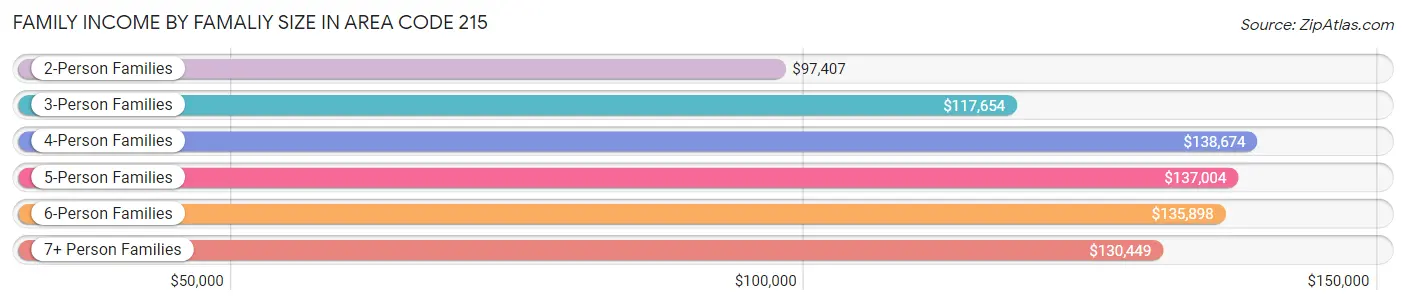
Family Income by Famaliy Size in Area Code 215
4-person families (116,519 | 18.5%) account for the highest median family income in Area Code 215 with $138,674 per family, while 2-person families (282,290 | 44.7%) have the highest median income of $48,703 per family member.
| Income Bracket | # Families | Median Income |
| 2-Person Families | 282,290 (44.7%) | $97,407 |
| 3-Person Families | 153,117 (24.3%) | $117,654 |
| 4-Person Families | 116,519 (18.5%) | $138,674 |
| 5-Person Families | 51,881 (8.2%) | $137,004 |
| 6-Person Families | 17,083 (2.7%) | $135,898 |
| 7+ Person Families | 10,176 (1.6%) | $130,449 |
| Total | 631,066 (100.0%) | $115,789 |
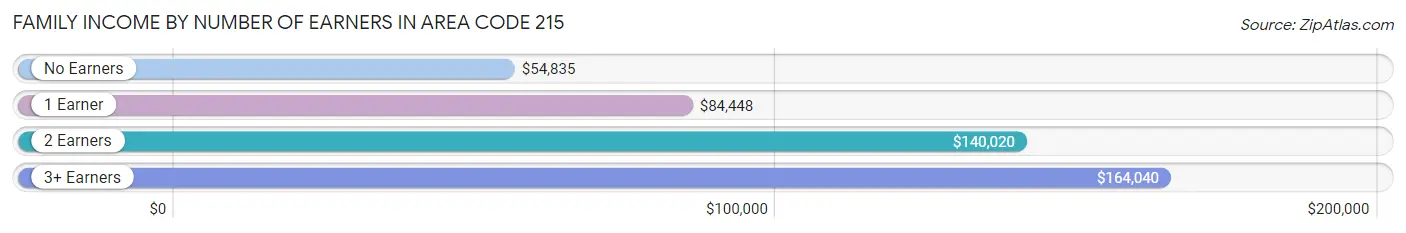
Family Income by Number of Earners in Area Code 215
The median family income in Area Code 215 is $115,789, with families comprising 3+ earners (78,722) having the highest median family income of $164,040, while families with no earners (85,984) have the lowest median family income of $54,835, accounting for 12.5% and 13.6% of families, respectively.
| Number of Earners | # Families | Median Income |
| No Earners | 85,984 (13.6%) | $54,835 |
| 1 Earner | 206,743 (32.8%) | $84,448 |
| 2 Earners | 259,617 (41.1%) | $140,020 |
| 3+ Earners | 78,722 (12.5%) | $164,040 |
| Total | 631,066 (100.0%) | $115,789 |
Household Income in Area Code 215
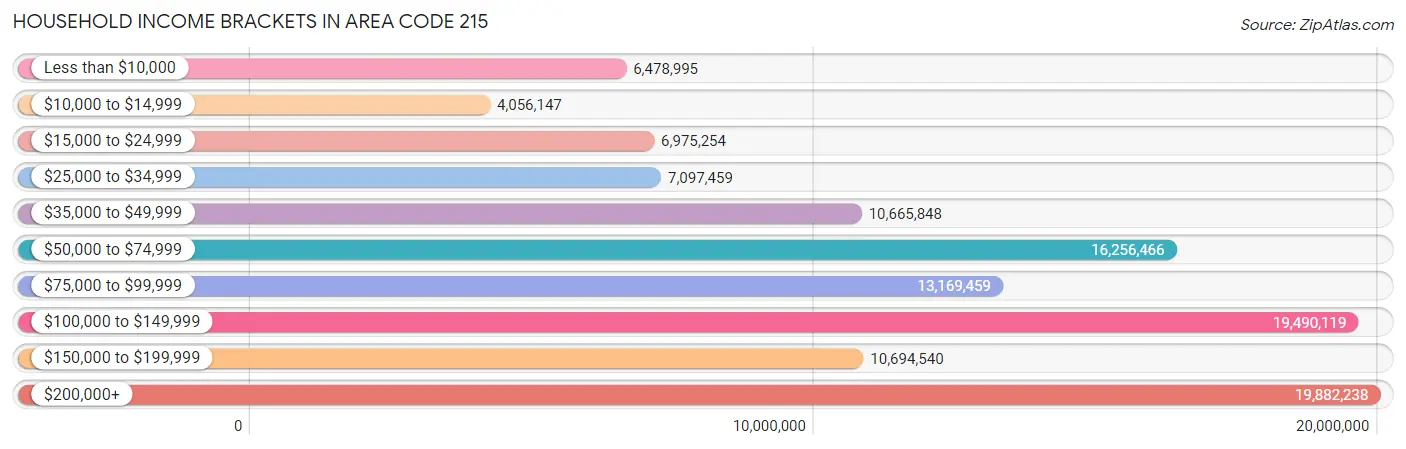
Household Income Brackets in Area Code 215
With 19,882,238 households falling in the category, the $200,000+ income range is the most frequent in Area Code 215, accounting for 1,871.0% of all households. In contrast, only 4,056,147 households (381.7%) fall into the $10,000 to $14,999 income bracket, making it the least populous group.
| Income Bracket | # Households | % Households |
| Less than $10,000 | 6,478,995 | 609.7% |
| $10,000 to $14,999 | 4,056,147 | 381.7% |
| $15,000 to $24,999 | 6,975,254 | 656.4% |
| $25,000 to $34,999 | 7,097,459 | 667.9% |
| $35,000 to $49,999 | 10,665,848 | 1,003.7% |
| $50,000 to $74,999 | 16,256,466 | 1,529.8% |
| $75,000 to $99,999 | 13,169,459 | 1,239.3% |
| $100,000 to $149,999 | 19,490,119 | 1,834.1% |
| $150,000 to $199,999 | 10,694,540 | 1,006.4% |
| $200,000+ | 19,882,238 | 1,871.0% |
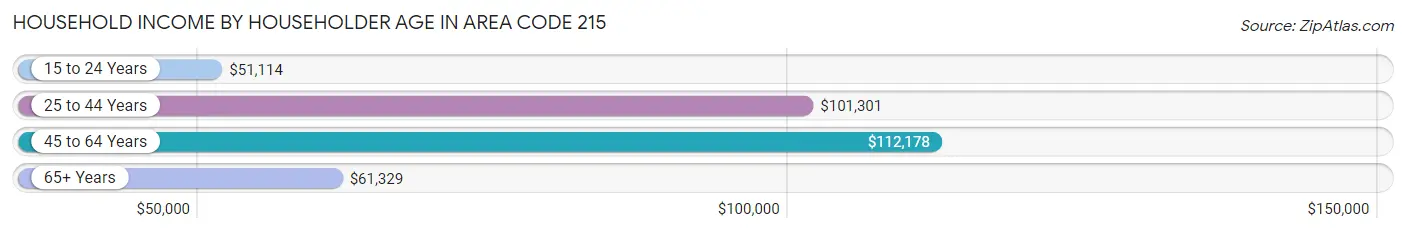
Household Income by Householder Age in Area Code 215
The median household income in Area Code 215 is $96,124, with the highest median household income of $112,178 found in the 45 to 64 years age bracket for the primary householder. A total of 381,665 households (35.9%) fall into this category. Meanwhile, the 15 to 24 years age bracket for the primary householder has the lowest median household income of $51,114, with 34,787 households (3.3%) in this group.
| Income Bracket | # Households | Median Income |
| 15 to 24 Years | 34,787 (3.3%) | $51,114 |
| 25 to 44 Years | 373,675 (35.2%) | $101,301 |
| 45 to 64 Years | 381,665 (35.9%) | $112,178 |
| 65+ Years | 272,526 (25.7%) | $61,329 |
| Total | 1,062,653 (100.0%) | $96,124 |
Poverty in Area Code 215
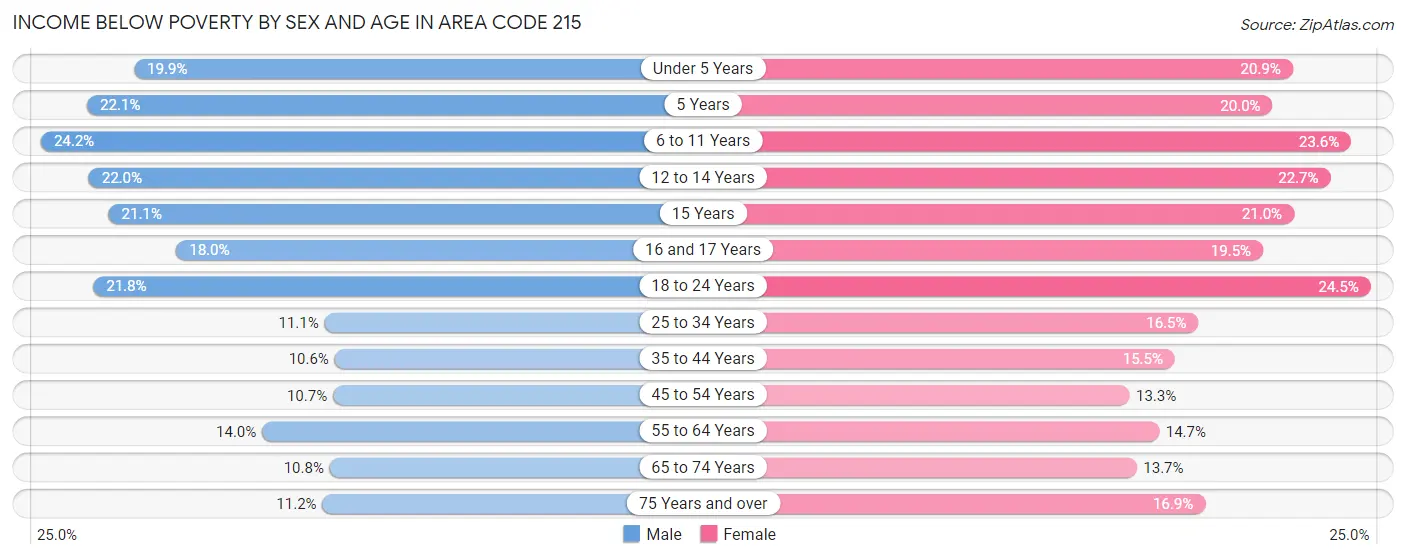
Income Below Poverty by Sex and Age in Area Code 215
With 14.7% poverty level for males and 17.2% for females among the residents of Area Code 215, 6 to 11 year old males and 18 to 24 year old females are the most vulnerable to poverty, with 22,601 males (24.2%) and 26,220 females (24.5%) in their respective age groups living below the poverty level.
| Age Bracket | Male | Female |
| Under 5 Years | 15,018 (19.9%) | 15,220 (20.9%) |
| 5 Years | 3,341 (22.1%) | 2,496 (20.0%) |
| 6 to 11 Years | 22,601 (24.2%) | 21,551 (23.6%) |
| 12 to 14 Years | 10,943 (22.0%) | 10,695 (22.7%) |
| 15 Years | 3,691 (21.1%) | 3,336 (21.0%) |
| 16 and 17 Years | 5,355 (18.0%) | 5,882 (19.5%) |
| 18 to 24 Years | 23,555 (21.8%) | 26,220 (24.5%) |
| 25 to 34 Years | 22,655 (11.1%) | 35,423 (16.5%) |
| 35 to 44 Years | 17,485 (10.6%) | 26,599 (15.4%) |
| 45 to 54 Years | 16,154 (10.7%) | 21,469 (13.3%) |
| 55 to 64 Years | 22,455 (14.0%) | 26,037 (14.7%) |
| 65 to 74 Years | 11,978 (10.8%) | 18,243 (13.7%) |
| 75 Years and over | 7,251 (11.2%) | 17,512 (16.9%) |
| Total | 182,482 (14.7%) | 230,683 (17.2%) |
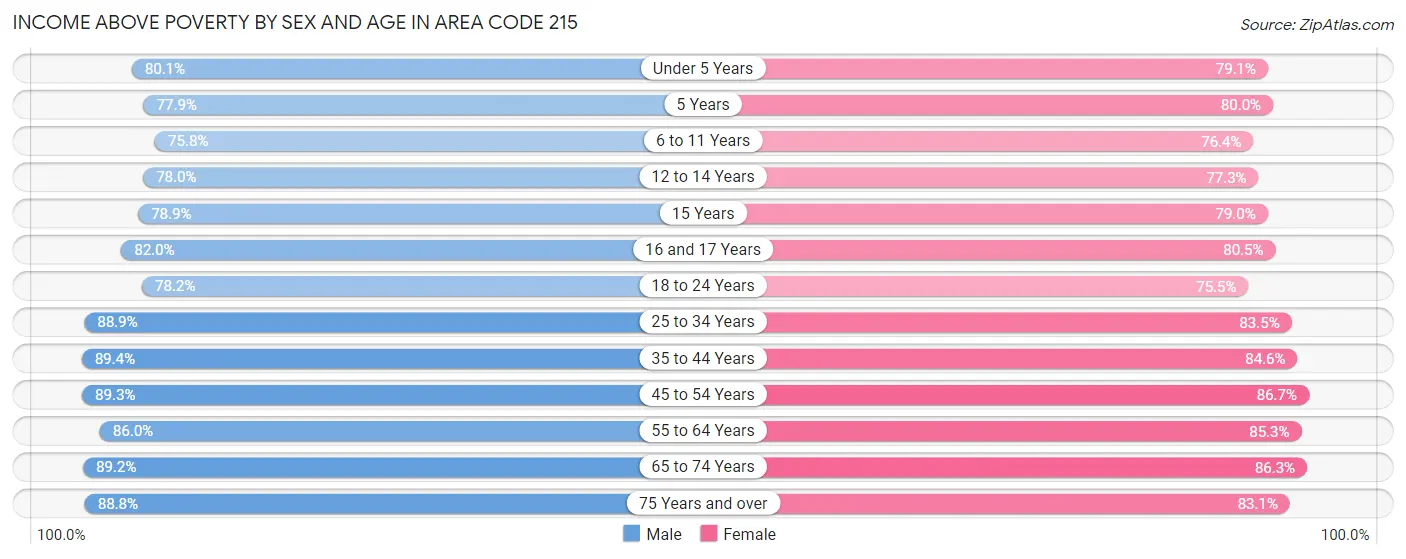
Income Above Poverty by Sex and Age in Area Code 215
According to the poverty statistics in Area Code 215, males aged 35 to 44 years and females aged 45 to 54 years are the age groups that are most secure financially, with 89.4% of males and 86.7% of females in these age groups living above the poverty line.
| Age Bracket | Male | Female |
| Under 5 Years | 60,363 (80.1%) | 57,521 (79.1%) |
| 5 Years | 11,777 (77.9%) | 9,999 (80.0%) |
| 6 to 11 Years | 70,625 (75.8%) | 69,656 (76.4%) |
| 12 to 14 Years | 38,744 (78.0%) | 36,487 (77.3%) |
| 15 Years | 13,806 (78.9%) | 12,565 (79.0%) |
| 16 and 17 Years | 24,460 (82.0%) | 24,217 (80.5%) |
| 18 to 24 Years | 84,441 (78.2%) | 80,634 (75.5%) |
| 25 to 34 Years | 181,888 (88.9%) | 178,729 (83.5%) |
| 35 to 44 Years | 147,293 (89.4%) | 145,603 (84.6%) |
| 45 to 54 Years | 135,013 (89.3%) | 139,542 (86.7%) |
| 55 to 64 Years | 138,132 (86.0%) | 150,951 (85.3%) |
| 65 to 74 Years | 98,555 (89.2%) | 115,244 (86.3%) |
| 75 Years and over | 57,585 (88.8%) | 86,341 (83.1%) |
| Total | 1,062,682 (85.3%) | 1,107,489 (82.8%) |
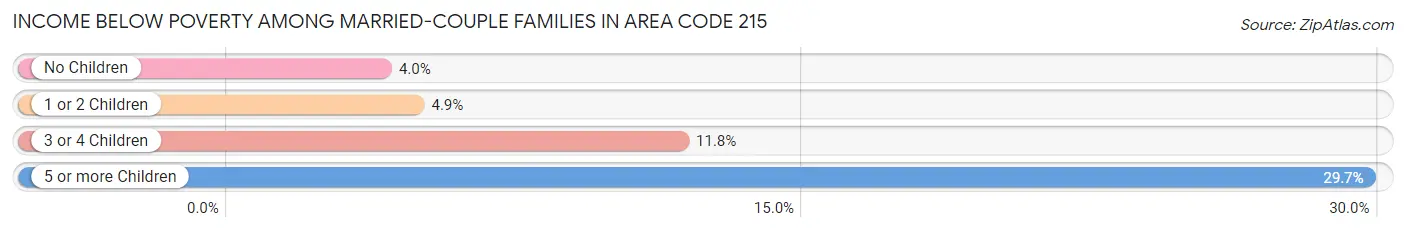
Income Below Poverty Among Married-Couple Families in Area Code 215
The poverty statistics for married-couple families in Area Code 215 show that 5.0% or 20,391 of the total 408,574 families live below the poverty line. Families with 5 or more children have the highest poverty rate of 29.7%, comprising of 613 families. On the other hand, families with no children have the lowest poverty rate of 4.0%, which includes 9,640 families.
| Children | Above Poverty | Below Poverty |
| No Children | 230,175 (96.0%) | 9,640 (4.0%) |
| 1 or 2 Children | 130,817 (95.1%) | 6,700 (4.9%) |
| 3 or 4 Children | 25,740 (88.2%) | 3,438 (11.8%) |
| 5 or more Children | 1,451 (70.3%) | 613 (29.7%) |
| Total | 388,183 (95.0%) | 20,391 (5.0%) |
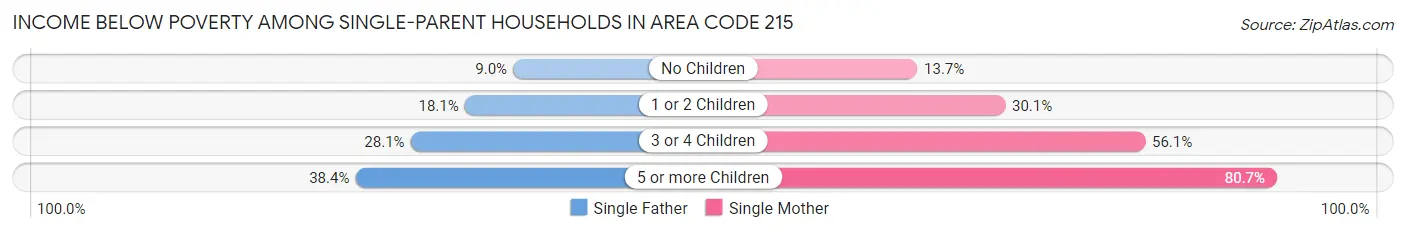
Income Below Poverty Among Single-Parent Households in Area Code 215
According to the poverty data in Area Code 215, 14.6% or 7,821 single-father households and 26.9% or 45,440 single-mother households are living below the poverty line. Among single-father households, those with 5 or more children have the highest poverty rate, with 227 households (38.4%) experiencing poverty. Likewise, among single-mother households, those with 5 or more children have the highest poverty rate, with 1,704 households (80.7%) falling below the poverty line.
| Children | Single Father | Single Mother |
| No Children | 2,357 (9.0%) | 9,142 (13.7%) |
| 1 or 2 Children | 4,222 (18.1%) | 24,769 (30.0%) |
| 3 or 4 Children | 1,015 (28.1%) | 9,825 (56.1%) |
| 5 or more Children | 227 (38.4%) | 1,704 (80.7%) |
| Total | 7,821 (14.6%) | 45,440 (26.9%) |
Income Below Poverty Among Married-Couple vs Single-Parent Households in Area Code 215
The poverty data for Area Code 215 shows that 20,391 of the married-couple family households (5.0%) and 53,261 of the single-parent households (23.9%) are living below the poverty level. Within the married-couple family households, those with 5 or more children have the highest poverty rate, with 613 households (29.7%) falling below the poverty line. Among the single-parent households, those with 5 or more children have the highest poverty rate, with 1,931 household (71.4%) living below poverty.
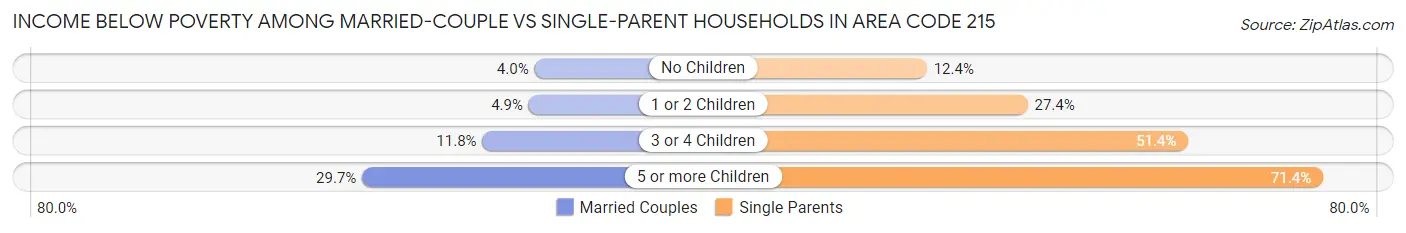
| Children | Married-Couple Families | Single-Parent Households |
| No Children | 9,640 (4.0%) | 11,499 (12.4%) |
| 1 or 2 Children | 6,700 (4.9%) | 28,991 (27.4%) |
| 3 or 4 Children | 3,438 (11.8%) | 10,840 (51.3%) |
| 5 or more Children | 613 (29.7%) | 1,931 (71.4%) |
| Total | 20,391 (5.0%) | 53,261 (23.9%) |
Race in Area Code 215
The most populous races in Area Code 215 are White / Caucasian (1,424,876 | 53.8%), Black / African American (712,148 | 26.9%), and Hispanic or Latino (308,352 | 11.7%).
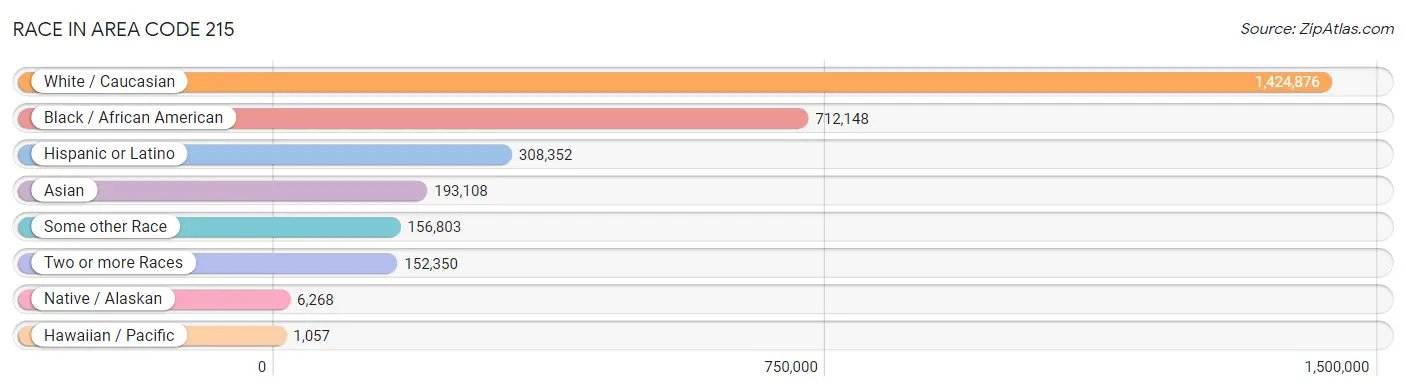
| Race | # Population | % Population |
| Asian | 193,108 | 7.3% |
| Black / African American | 712,148 | 26.9% |
| Hawaiian / Pacific | 1,057 | 0.0% |
| Hispanic or Latino | 308,352 | 11.7% |
| Native / Alaskan | 6,268 | 0.2% |
| White / Caucasian | 1,424,876 | 53.8% |
| Two or more Races | 152,350 | 5.8% |
| Some other Race | 156,803 | 5.9% |
| Total | 2,646,610 | 100.0% |
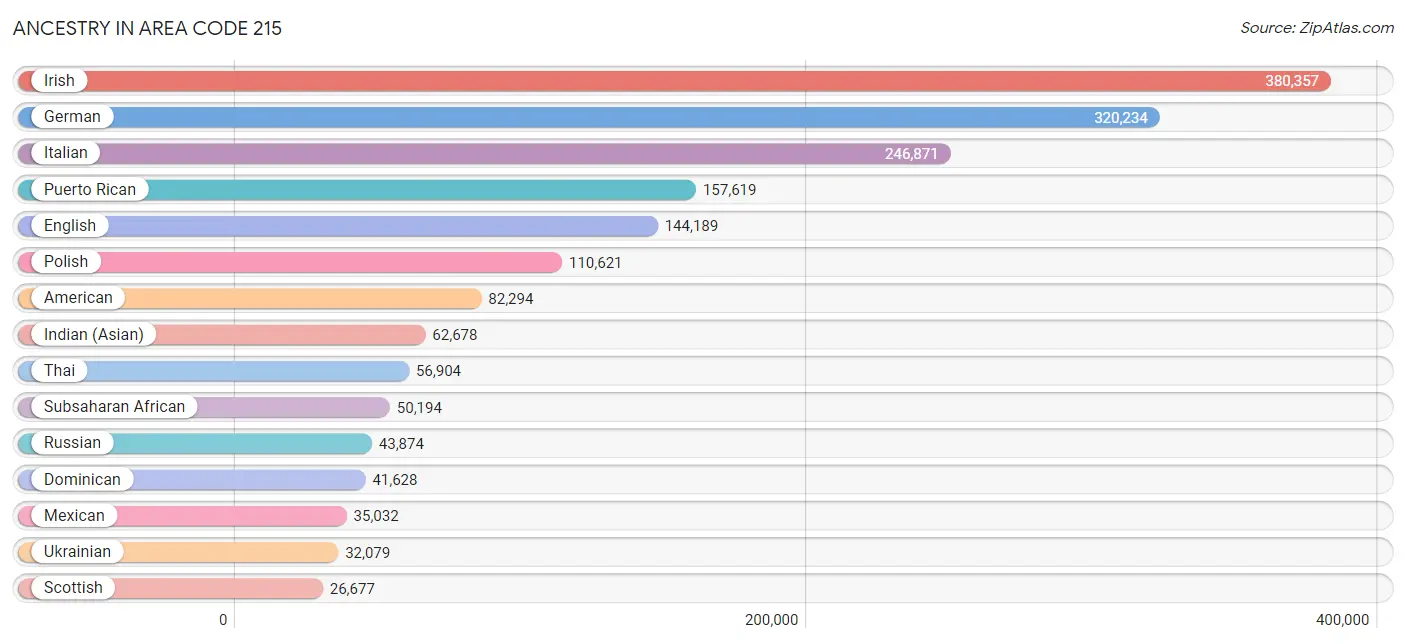
Ancestry in Area Code 215
The most populous ancestries reported in Area Code 215 are Irish (380,357 | 14.4%), German (320,234 | 12.1%), Italian (246,871 | 9.3%), Puerto Rican (157,619 | 6.0%), and English (144,189 | 5.4%), together accounting for 47.2% of all Area Code 215 residents.
| Ancestry | # Population | % Population |
| Afghan | 709 | 0.0% |
| African | 24,689 | 0.9% |
| Alaska Native | 79 | 0.0% |
| Alaskan Athabascan | 20 | 0.0% |
| Albanian | 6,498 | 0.3% |
| Aleut | 21 | 0.0% |
| Alsatian | 80 | 0.0% |
| American | 82,294 | 3.1% |
| Apache | 166 | 0.0% |
| Arab | 19,538 | 0.7% |
| Argentinean | 3,147 | 0.1% |
| Armenian | 3,037 | 0.1% |
| Assyrian / Chaldean / Syriac | 82 | 0.0% |
| Australian | 393 | 0.0% |
| Austrian | 7,596 | 0.3% |
| Bahamian | 334 | 0.0% |
| Bangladeshi | 716 | 0.0% |
| Barbadian | 1,132 | 0.0% |
| Basque | 66 | 0.0% |
| Belgian | 1,119 | 0.0% |
| Belizean | 206 | 0.0% |
| Bermudan | 160 | 0.0% |
| Bhutanese | 4,215 | 0.2% |
| Blackfeet | 786 | 0.0% |
| Bolivian | 345 | 0.0% |
| Brazilian | 6,592 | 0.3% |
| British | 8,953 | 0.3% |
| British West Indian | 959 | 0.0% |
| Bulgarian | 856 | 0.0% |
| Burmese | 20,777 | 0.8% |
| Cajun | 83 | 0.0% |
| Cambodian | 508 | 0.0% |
| Canadian | 2,852 | 0.1% |
| Cape Verdean | 111 | 0.0% |
| Carpatho Rusyn | 154 | 0.0% |
| Celtic | 416 | 0.0% |
| Central American | 24,377 | 0.9% |
| Central American Indian | 3,193 | 0.1% |
| Cherokee | 5,596 | 0.2% |
| Cheyenne | 26 | 0.0% |
| Chickasaw | 79 | 0.0% |
| Chilean | 1,062 | 0.0% |
| Chippewa | 172 | 0.0% |
| Choctaw | 301 | 0.0% |
| Colombian | 10,163 | 0.4% |
| Costa Rican | 2,347 | 0.1% |
| Cree | 30 | 0.0% |
| Creek | 28 | 0.0% |
| Croatian | 2,076 | 0.1% |
| Crow | 27 | 0.0% |
| Cuban | 6,473 | 0.2% |
| Cypriot | 143 | 0.0% |
| Czech | 5,519 | 0.2% |
| Czechoslovakian | 1,718 | 0.1% |
| Danish | 3,325 | 0.1% |
| Delaware | 513 | 0.0% |
| Dominican | 41,628 | 1.6% |
| Dutch | 13,126 | 0.5% |
| Dutch West Indian | 15 | 0.0% |
| Eastern European | 16,339 | 0.6% |
| Ecuadorian | 4,196 | 0.2% |
| Egyptian | 4,308 | 0.2% |
| English | 144,189 | 5.4% |
| Estonian | 392 | 0.0% |
| Ethiopian | 2,651 | 0.1% |
| European | 25,532 | 1.0% |
| Fijian | 13 | 0.0% |
| Filipino | 1,871 | 0.1% |
| Finnish | 1,403 | 0.1% |
| French | 25,676 | 1.0% |
| French American Indian | 107 | 0.0% |
| French Canadian | 4,280 | 0.2% |
| German | 320,234 | 12.1% |
| German Russian | 88 | 0.0% |
| Ghanaian | 2,155 | 0.1% |
| Greek | 10,279 | 0.4% |
| Guamanian / Chamorro | 238 | 0.0% |
| Guatemalan | 7,777 | 0.3% |
| Guyanese | 1,363 | 0.1% |
| Haitian | 13,147 | 0.5% |
| Hmong | 7 | 0.0% |
| Honduran | 5,789 | 0.2% |
| Hopi | 16 | 0.0% |
| Houma | 142 | 0.0% |
| Hungarian | 15,224 | 0.6% |
| Icelander | 84 | 0.0% |
| Indian (Asian) | 62,678 | 2.4% |
| Indonesian | 766 | 0.0% |
| Inupiat | 81 | 0.0% |
| Iranian | 2,257 | 0.1% |
| Iraqi | 717 | 0.0% |
| Irish | 380,357 | 14.4% |
| Iroquois | 626 | 0.0% |
| Israeli | 1,451 | 0.1% |
| Italian | 246,871 | 9.3% |
| Jamaican | 17,560 | 0.7% |
| Japanese | 12,560 | 0.5% |
| Jordanian | 472 | 0.0% |
| Kenyan | 743 | 0.0% |
| Korean | 16,775 | 0.6% |
| Laotian | 2,901 | 0.1% |
| Latvian | 1,070 | 0.0% |
| Lebanese | 3,464 | 0.1% |
| Liberian | 6,436 | 0.2% |
| Lithuanian | 10,870 | 0.4% |
| Lumbee | 245 | 0.0% |
| Luxembourger | 37 | 0.0% |
| Macedonian | 58 | 0.0% |
| Malaysian | 1,634 | 0.1% |
| Maltese | 130 | 0.0% |
| Mexican | 35,032 | 1.3% |
| Mexican American Indian | 931 | 0.0% |
| Mongolian | 327 | 0.0% |
| Moroccan | 2,048 | 0.1% |
| Native Hawaiian | 972 | 0.0% |
| Navajo | 390 | 0.0% |
| New Zealander | 85 | 0.0% |
| Nicaraguan | 1,782 | 0.1% |
| Nigerian | 7,059 | 0.3% |
| Northern European | 1,986 | 0.1% |
| Norwegian | 8,071 | 0.3% |
| Okinawan | 80 | 0.0% |
| Paiute | 20 | 0.0% |
| Pakistani | 1,856 | 0.1% |
| Palestinian | 2,064 | 0.1% |
| Panamanian | 1,477 | 0.1% |
| Paraguayan | 213 | 0.0% |
| Pennsylvania German | 9,210 | 0.4% |
| Peruvian | 2,699 | 0.1% |
| Pima | 5 | 0.0% |
| Polish | 110,621 | 4.2% |
| Portuguese | 5,656 | 0.2% |
| Potawatomi | 138 | 0.0% |
| Puerto Rican | 157,619 | 6.0% |
| Romanian | 4,684 | 0.2% |
| Russian | 43,874 | 1.7% |
| Salvadoran | 5,177 | 0.2% |
| Samoan | 513 | 0.0% |
| Scandinavian | 2,441 | 0.1% |
| Scotch-Irish | 11,710 | 0.4% |
| Scottish | 26,677 | 1.0% |
| Seminole | 57 | 0.0% |
| Senegalese | 406 | 0.0% |
| Serbian | 706 | 0.0% |
| Shoshone | 27 | 0.0% |
| Sierra Leonean | 1,352 | 0.1% |
| Sioux | 147 | 0.0% |
| Slavic | 1,630 | 0.1% |
| Slovak | 7,479 | 0.3% |
| Slovene | 712 | 0.0% |
| Somali | 157 | 0.0% |
| South African | 616 | 0.0% |
| South American | 25,661 | 1.0% |
| South American Indian | 434 | 0.0% |
| Soviet Union | 105 | 0.0% |
| Spaniard | 4,617 | 0.2% |
| Spanish | 3,527 | 0.1% |
| Spanish American | 110 | 0.0% |
| Spanish American Indian | 18 | 0.0% |
| Sri Lankan | 24,072 | 0.9% |
| Subsaharan African | 50,194 | 1.9% |
| Sudanese | 347 | 0.0% |
| Swedish | 11,242 | 0.4% |
| Swiss | 5,940 | 0.2% |
| Syrian | 1,011 | 0.0% |
| Taiwanese | 10 | 0.0% |
| Thai | 56,904 | 2.1% |
| Tlingit-Haida | 7 | 0.0% |
| Tongan | 87 | 0.0% |
| Trinidadian and Tobagonian | 4,283 | 0.2% |
| Turkish | 2,753 | 0.1% |
| U.S. Virgin Islander | 355 | 0.0% |
| Ugandan | 130 | 0.0% |
| Ukrainian | 32,079 | 1.2% |
| Uruguayan | 300 | 0.0% |
| Venezuelan | 3,260 | 0.1% |
| Vietnamese | 3,456 | 0.1% |
| Welsh | 14,151 | 0.5% |
| West Indian | 5,973 | 0.2% |
| Yaqui | 29 | 0.0% |
| Yugoslavian | 831 | 0.0% |
| Zimbabwean | 220 | 0.0% | View All 182 Rows |
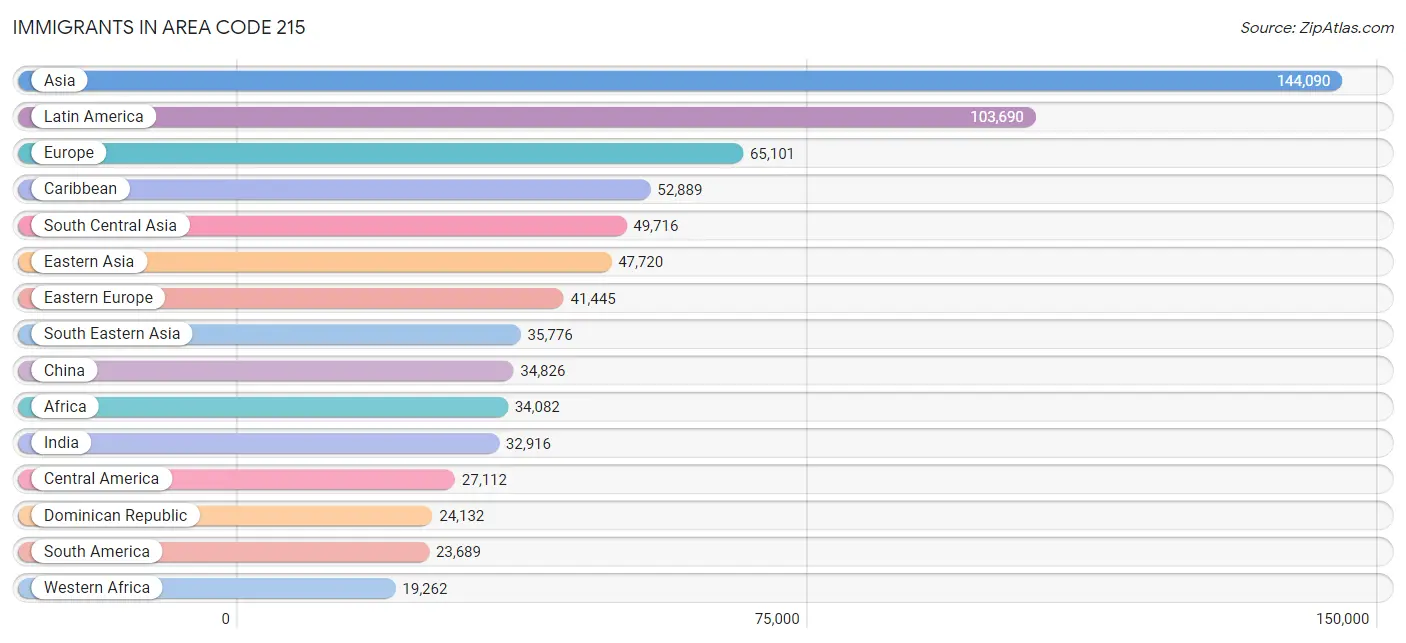
Immigrants in Area Code 215
The most numerous immigrant groups reported in Area Code 215 came from Asia (144,090 | 5.4%), Latin America (103,690 | 3.9%), Europe (65,101 | 2.5%), Caribbean (52,889 | 2.0%), and South Central Asia (49,716 | 1.9%), together accounting for 15.7% of all Area Code 215 residents.
| Immigration Origin | # Population | % Population |
| Afghanistan | 458 | 0.0% |
| Africa | 34,082 | 1.3% |
| Albania | 5,074 | 0.2% |
| Argentina | 2,078 | 0.1% |
| Armenia | 232 | 0.0% |
| Asia | 144,090 | 5.4% |
| Australia | 489 | 0.0% |
| Austria | 250 | 0.0% |
| Bahamas | 163 | 0.0% |
| Bangladesh | 4,619 | 0.2% |
| Barbados | 568 | 0.0% |
| Belarus | 2,819 | 0.1% |
| Belgium | 236 | 0.0% |
| Belize | 207 | 0.0% |
| Bolivia | 245 | 0.0% |
| Bosnia and Herzegovina | 333 | 0.0% |
| Brazil | 7,084 | 0.3% |
| Bulgaria | 660 | 0.0% |
| Cambodia | 6,700 | 0.3% |
| Cameroon | 872 | 0.0% |
| Canada | 4,375 | 0.2% |
| Caribbean | 52,889 | 2.0% |
| Central America | 27,112 | 1.0% |
| Chile | 646 | 0.0% |
| China | 34,826 | 1.3% |
| Colombia | 4,913 | 0.2% |
| Congo | 89 | 0.0% |
| Costa Rica | 2,180 | 0.1% |
| Croatia | 199 | 0.0% |
| Cuba | 1,718 | 0.1% |
| Czechoslovakia | 491 | 0.0% |
| Denmark | 141 | 0.0% |
| Dominica | 772 | 0.0% |
| Dominican Republic | 24,132 | 0.9% |
| Eastern Africa | 3,473 | 0.1% |
| Eastern Asia | 47,720 | 1.8% |
| Eastern Europe | 41,445 | 1.6% |
| Ecuador | 2,672 | 0.1% |
| Egypt | 2,605 | 0.1% |
| El Salvador | 2,510 | 0.1% |
| England | 2,026 | 0.1% |
| Eritrea | 115 | 0.0% |
| Ethiopia | 1,687 | 0.1% |
| Europe | 65,101 | 2.5% |
| Fiji | 87 | 0.0% |
| France | 1,076 | 0.0% |
| Germany | 4,533 | 0.2% |
| Ghana | 2,304 | 0.1% |
| Greece | 1,557 | 0.1% |
| Grenada | 294 | 0.0% |
| Guatemala | 5,574 | 0.2% |
| Guyana | 1,671 | 0.1% |
| Haiti | 8,217 | 0.3% |
| Honduras | 2,921 | 0.1% |
| Hong Kong | 1,796 | 0.1% |
| Hungary | 512 | 0.0% |
| India | 32,916 | 1.2% |
| Indonesia | 2,113 | 0.1% |
| Iran | 1,262 | 0.1% |
| Iraq | 722 | 0.0% |
| Ireland | 1,289 | 0.1% |
| Israel | 1,981 | 0.1% |
| Italy | 4,829 | 0.2% |
| Jamaica | 11,763 | 0.4% |
| Japan | 831 | 0.0% |
| Jordan | 717 | 0.0% |
| Kazakhstan | 320 | 0.0% |
| Kenya | 740 | 0.0% |
| Korea | 11,903 | 0.4% |
| Kuwait | 344 | 0.0% |
| Laos | 575 | 0.0% |
| Latin America | 103,690 | 3.9% |
| Latvia | 248 | 0.0% |
| Lebanon | 725 | 0.0% |
| Liberia | 7,444 | 0.3% |
| Lithuania | 391 | 0.0% |
| Malaysia | 765 | 0.0% |
| Mexico | 12,627 | 0.5% |
| Middle Africa | 1,721 | 0.1% |
| Moldova | 864 | 0.0% |
| Morocco | 1,737 | 0.1% |
| Nepal | 710 | 0.0% |
| Netherlands | 383 | 0.0% |
| Nicaragua | 818 | 0.0% |
| Nigeria | 4,777 | 0.2% |
| North Macedonia | 126 | 0.0% |
| Northern Africa | 6,097 | 0.2% |
| Northern Europe | 8,065 | 0.3% |
| Norway | 114 | 0.0% |
| Oceania | 826 | 0.0% |
| Pakistan | 4,280 | 0.2% |
| Panama | 275 | 0.0% |
| Peru | 1,867 | 0.1% |
| Philippines | 6,946 | 0.3% |
| Poland | 3,628 | 0.1% |
| Portugal | 1,500 | 0.1% |
| Romania | 1,402 | 0.1% |
| Russia | 6,466 | 0.2% |
| Saudi Arabia | 829 | 0.0% |
| Scotland | 405 | 0.0% |
| Senegal | 123 | 0.0% |
| Serbia | 262 | 0.0% |
| Sierra Leone | 1,416 | 0.1% |
| Singapore | 361 | 0.0% |
| Somalia | 29 | 0.0% |
| South Africa | 696 | 0.0% |
| South America | 23,689 | 0.9% |
| South Central Asia | 49,716 | 1.9% |
| South Eastern Asia | 35,776 | 1.3% |
| Southern Europe | 8,702 | 0.3% |
| Spain | 796 | 0.0% |
| Sri Lanka | 538 | 0.0% |
| St. Vincent and the Grenadines | 162 | 0.0% |
| Sudan | 382 | 0.0% |
| Sweden | 367 | 0.0% |
| Switzerland | 347 | 0.0% |
| Syria | 764 | 0.0% |
| Taiwan | 1,945 | 0.1% |
| Thailand | 1,828 | 0.1% |
| Trinidad and Tobago | 3,724 | 0.1% |
| Turkey | 1,380 | 0.1% |
| Uganda | 245 | 0.0% |
| Ukraine | 13,563 | 0.5% |
| Uruguay | 273 | 0.0% |
| Uzbekistan | 3,161 | 0.1% |
| Venezuela | 2,142 | 0.1% |
| Vietnam | 15,851 | 0.6% |
| West Indies | 488 | 0.0% |
| Western Africa | 19,262 | 0.7% |
| Western Asia | 10,359 | 0.4% |
| Western Europe | 6,825 | 0.3% |
| Yemen | 206 | 0.0% |
| Zaire | 146 | 0.0% |
| Zimbabwe | 364 | 0.0% | View All 134 Rows |
Sex and Age in Area Code 215
Sex and Age in Area Code 215
The most populous age groups in Area Code 215 are 30 to 34 Years (104,028 | 8.2%) for men and 30 to 34 Years (108,725 | 7.9%) for women.
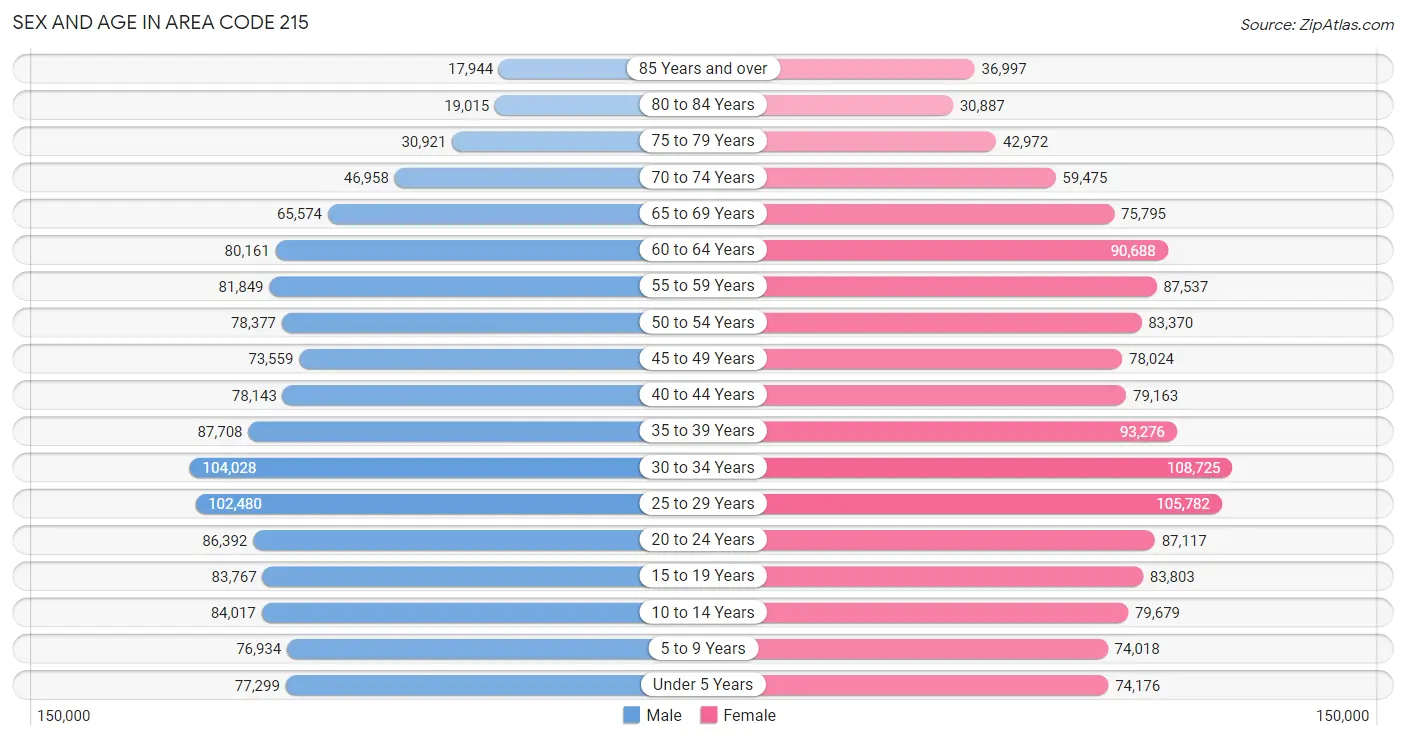
| Age Bracket | Male | Female |
| Under 5 Years | 77,299 (6.1%) | 74,176 (5.4%) |
| 5 to 9 Years | 76,934 (6.0%) | 74,018 (5.4%) |
| 10 to 14 Years | 84,017 (6.6%) | 79,679 (5.8%) |
| 15 to 19 Years | 83,767 (6.6%) | 83,803 (6.1%) |
| 20 to 24 Years | 86,392 (6.8%) | 87,117 (6.4%) |
| 25 to 29 Years | 102,480 (8.0%) | 105,782 (7.7%) |
| 30 to 34 Years | 104,028 (8.2%) | 108,725 (7.9%) |
| 35 to 39 Years | 87,708 (6.9%) | 93,276 (6.8%) |
| 40 to 44 Years | 78,143 (6.1%) | 79,163 (5.8%) |
| 45 to 49 Years | 73,559 (5.8%) | 78,024 (5.7%) |
| 50 to 54 Years | 78,377 (6.1%) | 83,370 (6.1%) |
| 55 to 59 Years | 81,849 (6.4%) | 87,537 (6.4%) |
| 60 to 64 Years | 80,161 (6.3%) | 90,688 (6.6%) |
| 65 to 69 Years | 65,574 (5.1%) | 75,795 (5.5%) |
| 70 to 74 Years | 46,958 (3.7%) | 59,475 (4.3%) |
| 75 to 79 Years | 30,921 (2.4%) | 42,972 (3.1%) |
| 80 to 84 Years | 19,015 (1.5%) | 30,887 (2.2%) |
| 85 Years and over | 17,944 (1.4%) | 36,997 (2.7%) |
| Total | 1,275,126 (100.0%) | 1,371,484 (100.0%) |
Families and Households in Area Code 215
Median Family Size in Area Code 215
The median family size in Area Code 215 is 3.06 persons per family, with married-couple families (408,574 | 64.7%) accounting for the largest median family size of 3.11833 persons per family. On the other hand, single male/father families (53,647 | 8.5%) represent the smallest median family size with 2.68 persons per family.
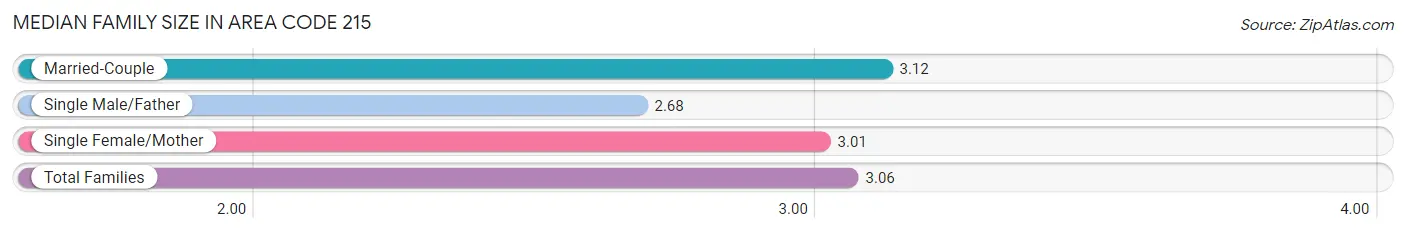
| Family Type | # Families | Family Size |
| Married-Couple | 408,574 (64.7%) | 3.12 |
| Single Male/Father | 53,647 (8.5%) | 2.68 |
| Single Female/Mother | 168,845 (26.8%) | 3.01 |
| Total Families | 631,066 (100.0%) | 3.06 |
Median Household Size in Area Code 215
The median household size in Area Code 215 is 2.45 persons per household, with single female/mother households (168,845 | 15.9%) accounting for the largest median household size of 3.22504 persons per household. non-family households (431,587 | 40.6%) represent the smallest median household size with 1.23 persons per household.
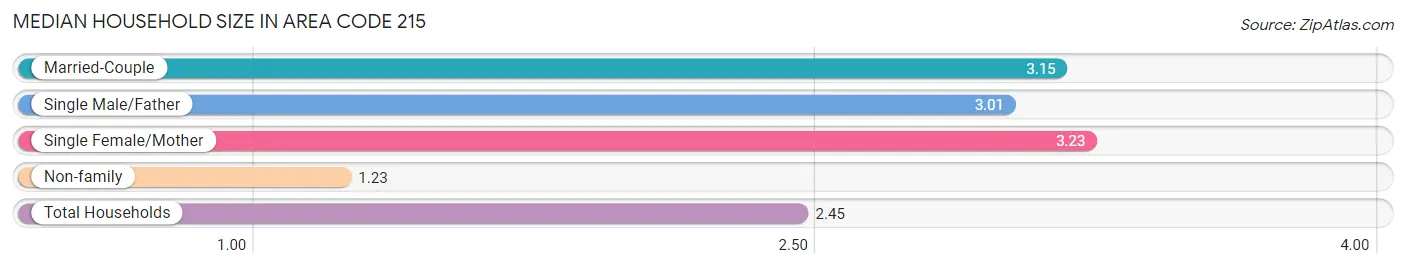
| Household Type | # Households | Household Size |
| Married-Couple | 408,574 (38.5%) | 3.15 |
| Single Male/Father | 53,647 (5.1%) | 3.01 |
| Single Female/Mother | 168,845 (15.9%) | 3.23 |
| Non-family | 431,587 (40.6%) | 1.23 |
| Total Households | 1,062,653 (100.0%) | 2.45 |
Household Size by Marriage Status in Area Code 215
Out of a total of 1,062,653 households in Area Code 215, 631,066 (59.4%) are family households, while 431,587 (40.6%) are nonfamily households. The most numerous type of family households are 2-person households, comprising 261,952, and the most common type of nonfamily households are 1-person households, comprising 347,693.
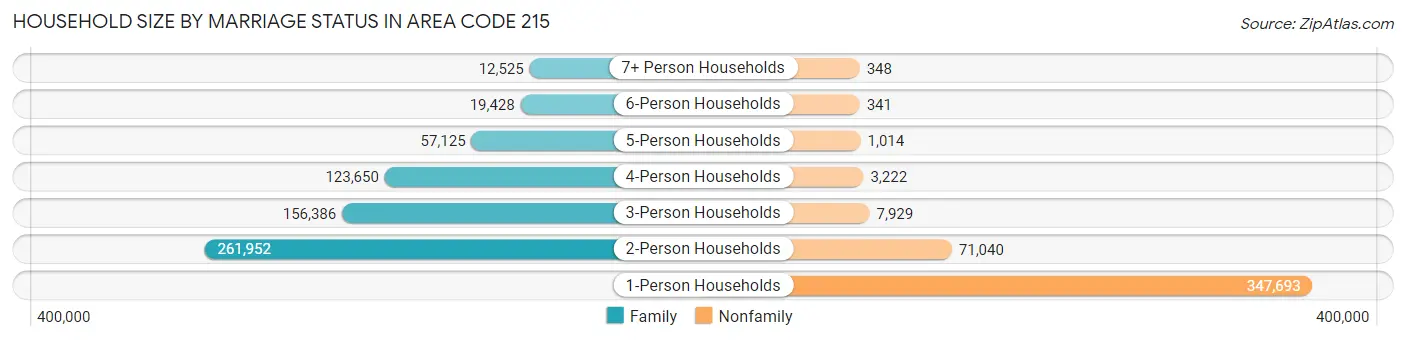
| Household Size | Family Households | Nonfamily Households |
| 1-Person Households | - | 347,693 (32.7%) |
| 2-Person Households | 261,952 (24.6%) | 71,040 (6.7%) |
| 3-Person Households | 156,386 (14.7%) | 7,929 (0.7%) |
| 4-Person Households | 123,650 (11.6%) | 3,222 (0.3%) |
| 5-Person Households | 57,125 (5.4%) | 1,014 (0.1%) |
| 6-Person Households | 19,428 (1.8%) | 341 (0.0%) |
| 7+ Person Households | 12,525 (1.2%) | 348 (0.0%) |
| Total | 631,066 (59.4%) | 431,587 (40.6%) |
Female Fertility in Area Code 215
Fertility by Age in Area Code 215
Average fertility rate in Area Code 215 is 46.8 births per 1,000 women. Women in the age bracket of 20 to 34 years have the highest fertility rate with 77.3 births per 1,000 women. Women in the age bracket of 20 to 34 years acount for 69.4% of all women with births.
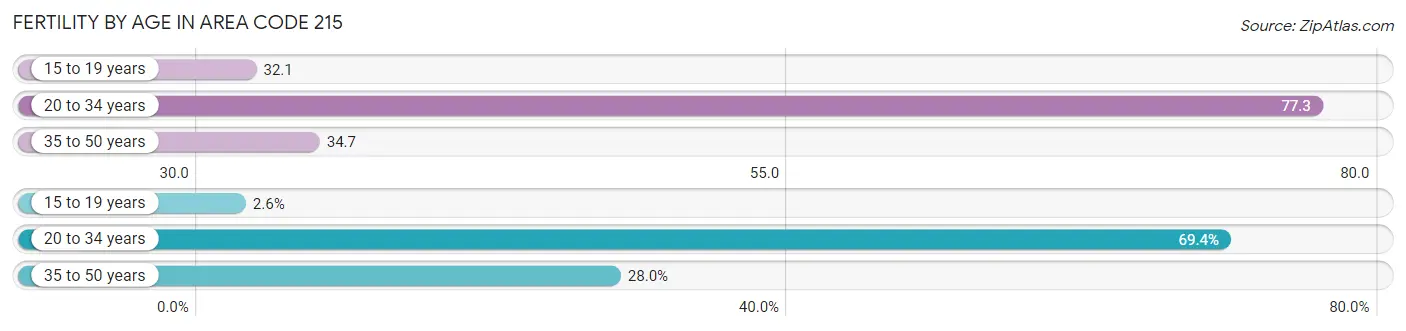
| Age Bracket | Women with Births | Births / 1,000 Women |
| 15 to 19 years | 813 (2.6%) | 32.1 |
| 20 to 34 years | 21,934 (69.4%) | 77.3 |
| 35 to 50 years | 8,856 (28.0%) | 34.7 |
| Total | 31,603 (100.0%) | 46.8 |
Fertility by Age by Marriage Status in Area Code 215
62.5% of women with births (31,603) in Area Code 215 are married. The highest percentage of unmarried women with births falls into 15 to 19 years age bracket with 95.8% of them unmarried at the time of birth, while the lowest percentage of unmarried women with births belong to 35 to 50 years age bracket with 40.6% of them unmarried.
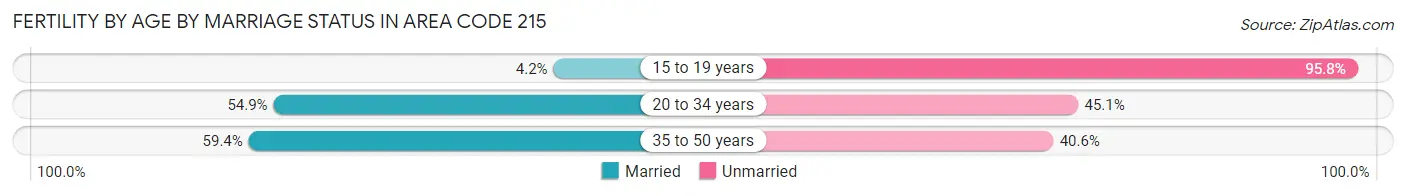
| Age Bracket | Married | Unmarried |
| 15 to 19 years | 34 (4.2%) | 779 (95.8%) |
| 20 to 34 years | 12,043 (54.9%) | 9,891 (45.1%) |
| 35 to 50 years | 5,261 (59.4%) | 3,595 (40.6%) |
| Total | 19,760 (62.5%) | 11,843 (37.5%) |
Fertility by Education in Area Code 215
Average fertility rate in Area Code 215 is 46.8 births per 1,000 women. Women with the education attainment of graduate degree have the highest fertility rate of 71.1 births per 1,000 women, while women with the education attainment of less than high school have the lowest fertility at 45.8 births per 1,000 women. Women with the education attainment of college or associate's degree represent 24.7% of all women with births.
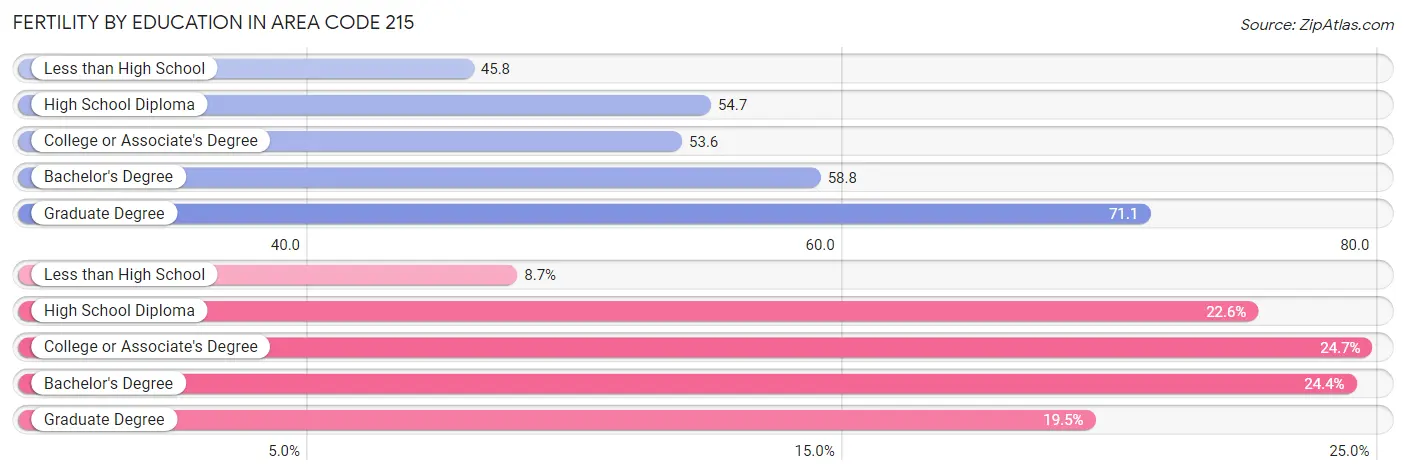
| Educational Attainment | Women with Births | Births / 1,000 Women |
| Less than High School | 2,752 (8.7%) | 45.8 |
| High School Diploma | 7,139 (22.6%) | 54.7 |
| College or Associate's Degree | 7,816 (24.7%) | 53.6 |
| Bachelor's Degree | 7,722 (24.4%) | 58.8 |
| Graduate Degree | 6,174 (19.5%) | 71.1 |
| Total | 31,603 (100.0%) | 46.8 |
Fertility by Education by Marriage Status in Area Code 215
37.5% of women with births in Area Code 215 are unmarried. Women with the educational attainment of bachelor's degree are most likely to be married with 63.7% of them married at childbirth, while women with the educational attainment of high school diploma are least likely to be married with 74.3% of them unmarried at childbirth.
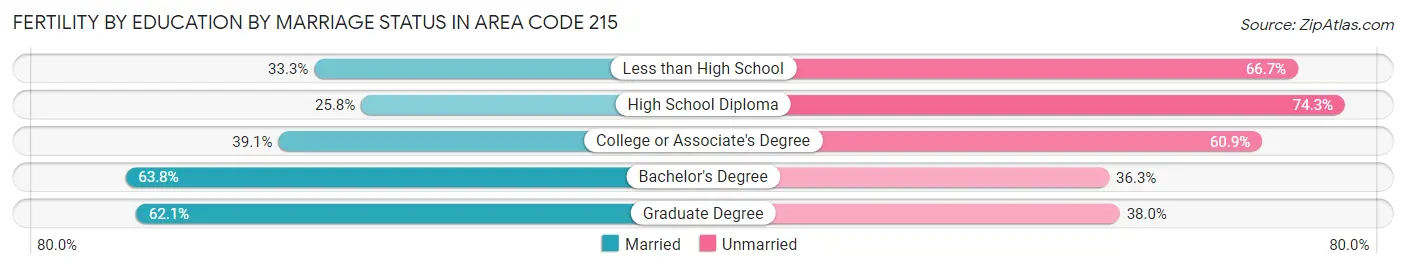
| Educational Attainment | Married | Unmarried |
| Less than High School | 917 (33.3%) | 1,835 (66.7%) |
| High School Diploma | 1,838 (25.8%) | 5,301 (74.3%) |
| College or Associate's Degree | 3,055 (39.1%) | 4,761 (60.9%) |
| Bachelor's Degree | 4,923 (63.7%) | 2,799 (36.2%) |
| Graduate Degree | 3,831 (62.1%) | 2,343 (38.0%) |
| Total | 19,760 (62.5%) | 11,843 (37.5%) |
Employment Characteristics in Area Code 215
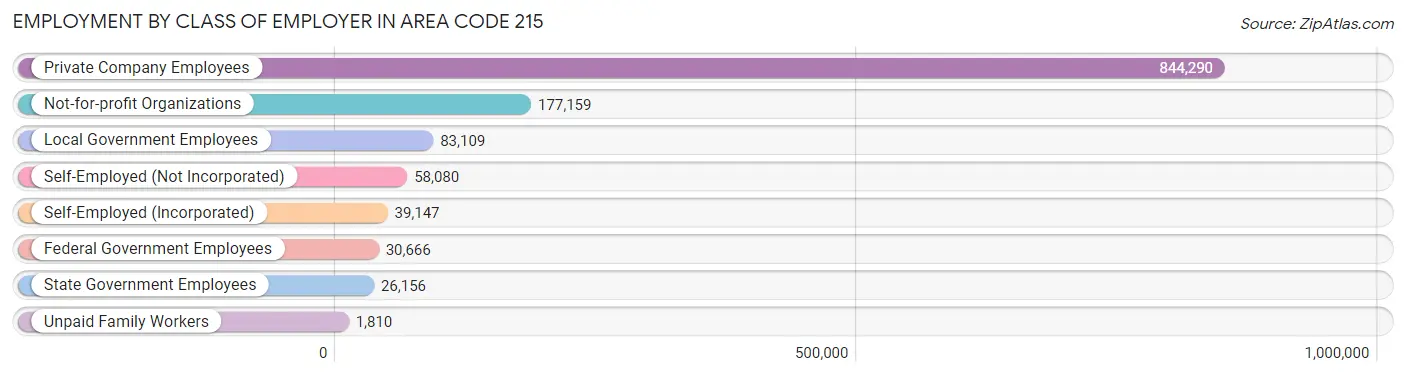
Employment by Class of Employer in Area Code 215
Among the 1,260,417 employed individuals in Area Code 215, private company employees (844,290 | 67.0%), not-for-profit organizations (177,159 | 14.1%), and local government employees (83,109 | 6.6%) make up the most common classes of employment.
| Employer Class | # Employees | % Employees |
| Private Company Employees | 844,290 | 67.0% |
| Self-Employed (Incorporated) | 39,147 | 3.1% |
| Self-Employed (Not Incorporated) | 58,080 | 4.6% |
| Not-for-profit Organizations | 177,159 | 14.1% |
| Local Government Employees | 83,109 | 6.6% |
| State Government Employees | 26,156 | 2.1% |
| Federal Government Employees | 30,666 | 2.4% |
| Unpaid Family Workers | 1,810 | 0.1% |
| Total | 1,260,417 | 100.0% |
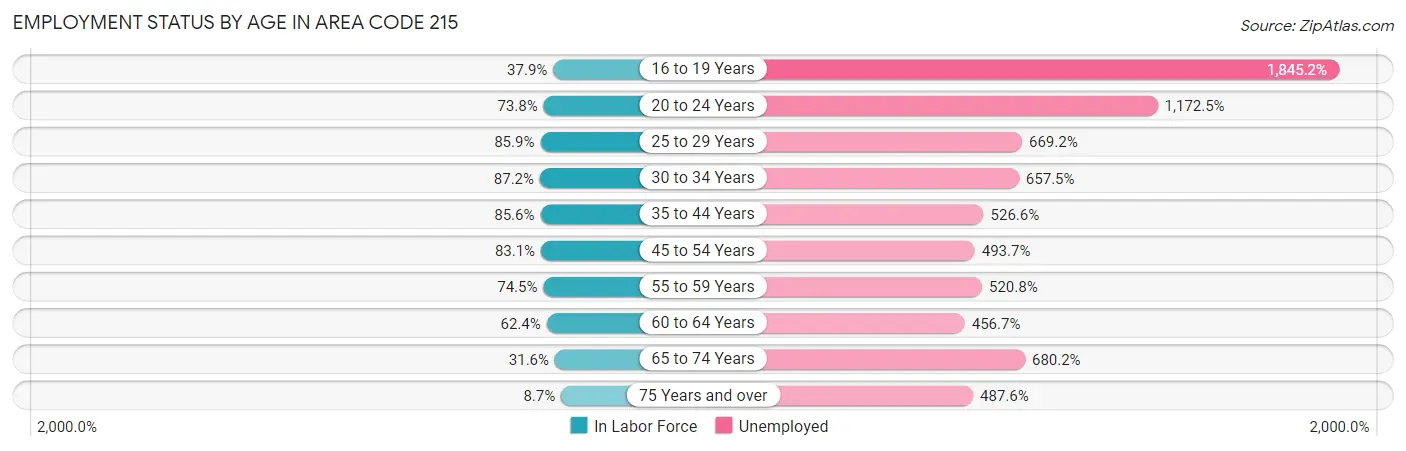
Employment Status by Age in Area Code 215
According to the labor force statistics for Area Code 215, out of the total population over 16 years of age (2,146,978), 64.6% or 1,388,021 individuals are in the labor force, with 6.7% or 93,553 of them unemployed. The age group with the highest labor force participation rate is 30 to 34 years, with 87.2% or 185,499 individuals in the labor force. Within the labor force, the 16 to 19 years age range has the highest percentage of unemployed individuals, with 1,845.2% or 937,288 of them being unemployed.
| Age Bracket | In Labor Force | Unemployed |
| 16 to 19 Years | 50,802 (37.9%) | 937,288 (1,845.2%) |
| 20 to 24 Years | 128,072 (73.8%) | 1,501,586 (1,172.5%) |
| 25 to 29 Years | 178,822 (85.9%) | 1,196,623 (669.2%) |
| 30 to 34 Years | 185,504 (87.2%) | 1,219,656 (657.5%) |
| 35 to 44 Years | 289,531 (85.6%) | 1,524,728 (526.6%) |
| 45 to 54 Years | 260,505 (83.1%) | 1,286,103 (493.7%) |
| 55 to 59 Years | 126,245 (74.5%) | 657,474 (520.8%) |
| 60 to 64 Years | 106,518 (62.4%) | 486,495 (456.7%) |
| 65 to 74 Years | 78,315 (31.6%) | 532,631 (680.2%) |
| 75 Years and over | 15,487 (8.7%) | 75,476 (487.6%) |
| Total | 1,388,001 (64.6%) | 93,616 (6.7%) |
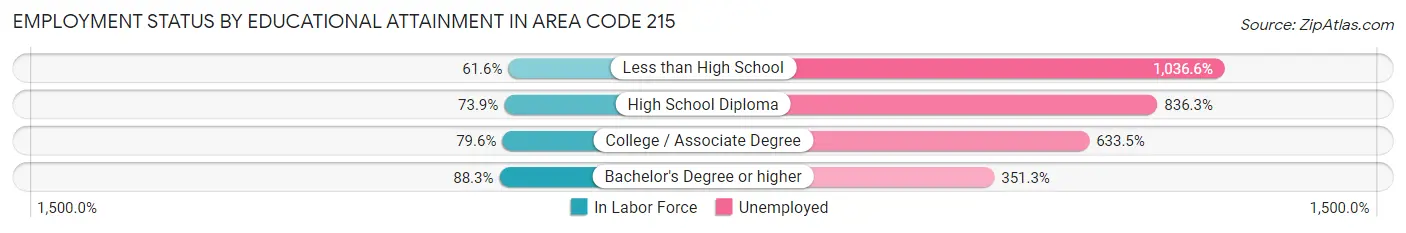
Employment Status by Educational Attainment in Area Code 215
According to labor force statistics for Area Code 215, 80.2% of individuals (1,133,546) out of the total population between 25 and 64 years of age (1,412,870) are in the labor force, with 575.4% or 6,522,424 of them being unemployed. The group with the highest labor force participation rate are those with the educational attainment of bachelor's degree or higher, with 88.3% or 521,379 individuals in the labor force. Within the labor force, individuals with less than high school education have the highest percentage of unemployment, with 1,036.6% or 770,754 of them being unemployed.
| Educational Attainment | In Labor Force | Unemployed |
| Less than High School | 74,349 (61.6%) | 1,252,234 (1,036.6%) |
| High School Diploma | 273,438 (73.9%) | 3,094,151 (836.3%) |
| College / Associate Degree | 263,835 (79.6%) | 2,100,414 (633.5%) |
| Bachelor's Degree or higher | 521,382 (88.3%) | 2,074,532 (351.3%) |
| Total | 1,133,584 (80.2%) | 8,129,654 (575.4%) |
Employment Occupations by Sex in Area Code 215
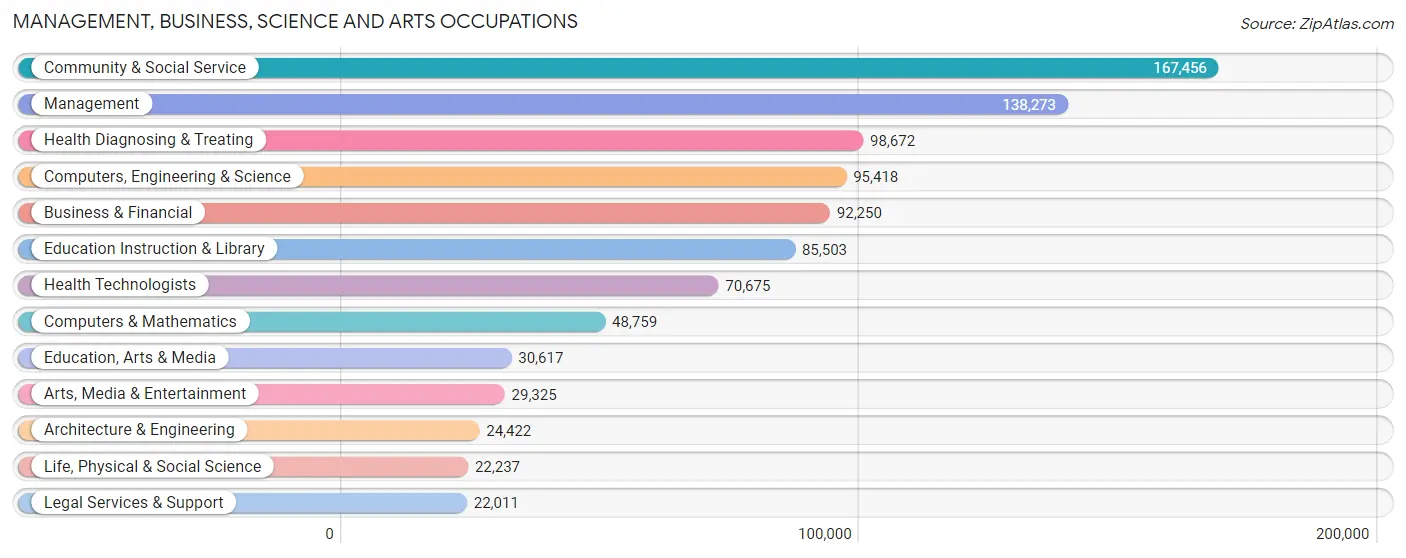
Management, Business, Science and Arts Occupations
The most common Management, Business, Science and Arts occupations in Area Code 215 are Community & Social Service (167,456 | 13.0%), Management (138,273 | 10.7%), Health Diagnosing & Treating (98,672 | 7.6%), Computers, Engineering & Science (95,418 | 7.4%), and Business & Financial (92,250 | 7.1%).
Management, Business, Science and Arts Occupations by Sex
Within the Management, Business, Science and Arts occupations in Area Code 215, the most male-oriented occupations are Architecture & Engineering (81.6%), Computers & Mathematics (73.3%), and Computers, Engineering & Science (69.7%), while the most female-oriented occupations are Health Diagnosing & Treating (73.4%), Health Technologists (73.0%), and Education Instruction & Library (71.8%).
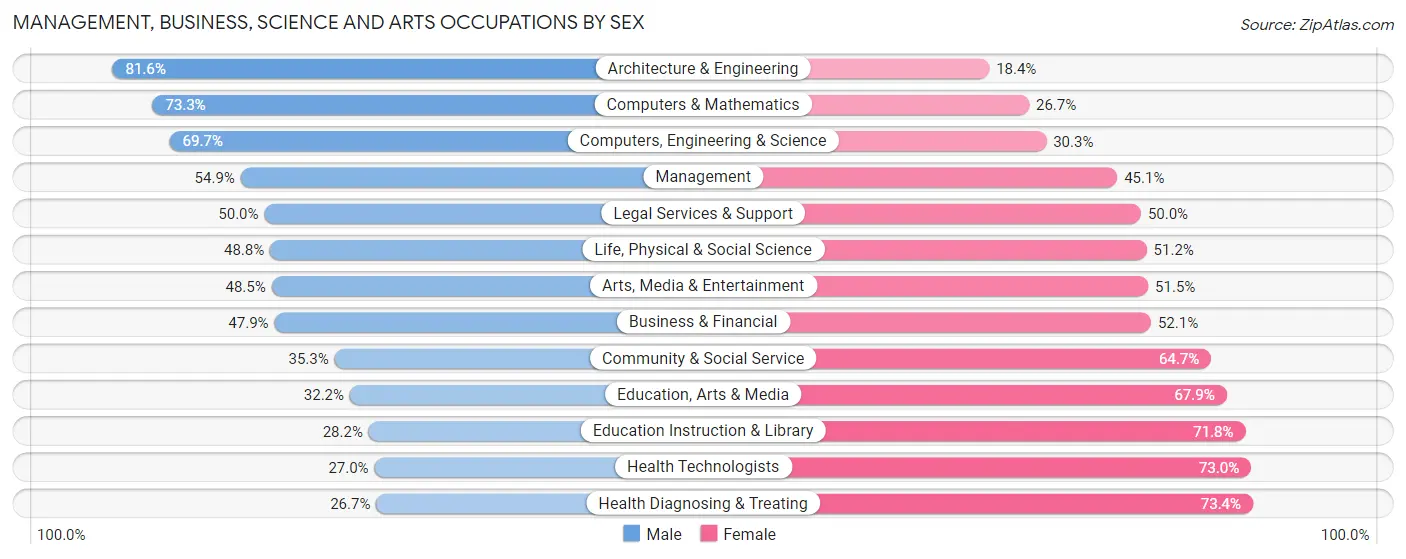
| Occupation | Male | Female |
| Management | 75,958 (54.9%) | 62,315 (45.1%) |
| Business & Financial | 44,175 (47.9%) | 48,075 (52.1%) |
| Computers, Engineering & Science | 66,541 (69.7%) | 28,877 (30.3%) |
| Computers & Mathematics | 35,754 (73.3%) | 13,005 (26.7%) |
| Architecture & Engineering | 19,937 (81.6%) | 4,485 (18.4%) |
| Life, Physical & Social Science | 10,850 (48.8%) | 11,387 (51.2%) |
| Community & Social Service | 59,178 (35.3%) | 108,278 (64.7%) |
| Education, Arts & Media | 9,843 (32.2%) | 20,774 (67.8%) |
| Legal Services & Support | 11,001 (50.0%) | 11,010 (50.0%) |
| Education Instruction & Library | 24,117 (28.2%) | 61,386 (71.8%) |
| Arts, Media & Entertainment | 14,217 (48.5%) | 15,108 (51.5%) |
| Health Diagnosing & Treating | 26,295 (26.7%) | 72,377 (73.4%) |
| Health Technologists | 19,094 (27.0%) | 51,581 (73.0%) |
| Total (Category) | 272,147 (46.0%) | 319,922 (54.0%) |
| Total (Overall) | 646,711 (50.1%) | 642,768 (49.8%) |
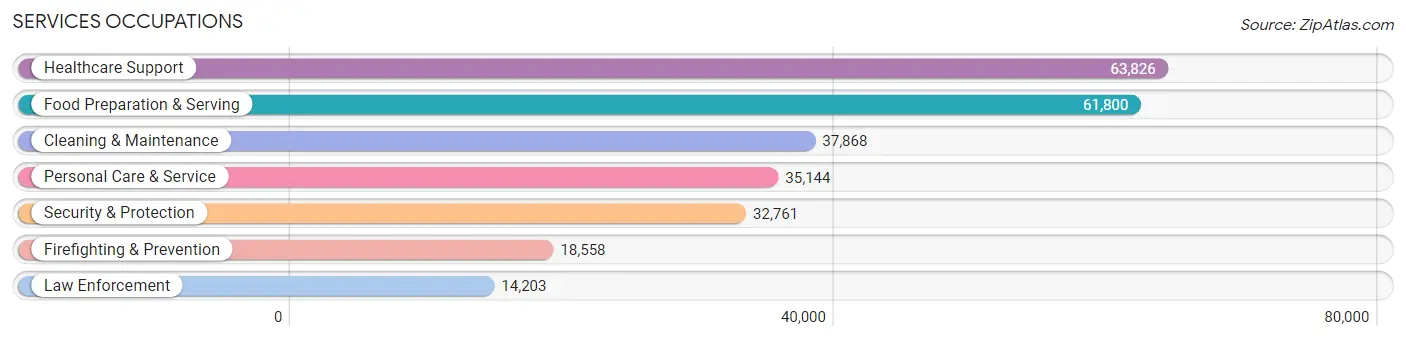
Services Occupations
The most common Services occupations in Area Code 215 are Healthcare Support (63,826 | 5.0%), Food Preparation & Serving (61,800 | 4.8%), Cleaning & Maintenance (37,868 | 2.9%), Personal Care & Service (35,144 | 2.7%), and Security & Protection (32,761 | 2.5%).
Services Occupations by Sex
Within the Services occupations in Area Code 215, the most male-oriented occupations are Law Enforcement (77.9%), Security & Protection (70.2%), and Firefighting & Prevention (64.3%), while the most female-oriented occupations are Healthcare Support (81.6%), Personal Care & Service (74.2%), and Food Preparation & Serving (48.6%).
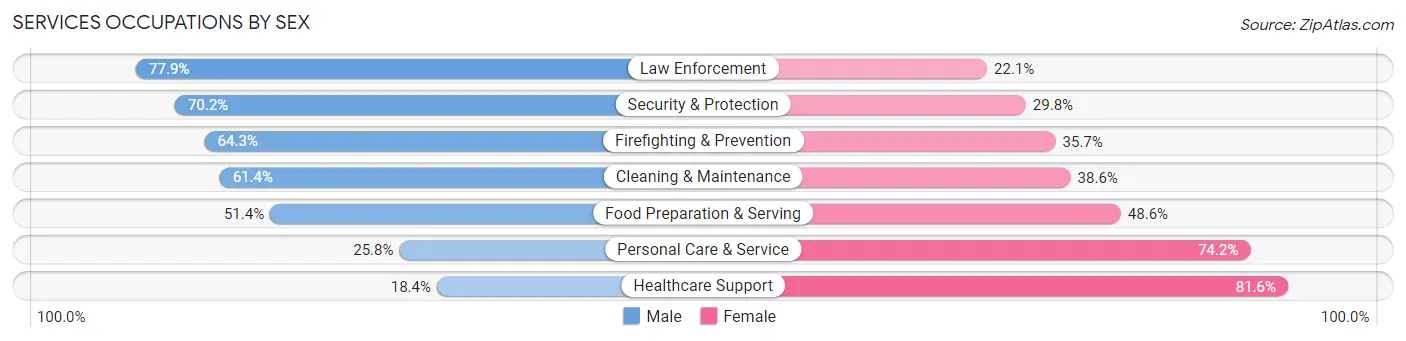
| Occupation | Male | Female |
| Healthcare Support | 11,730 (18.4%) | 52,096 (81.6%) |
| Security & Protection | 23,004 (70.2%) | 9,757 (29.8%) |
| Firefighting & Prevention | 11,940 (64.3%) | 6,618 (35.7%) |
| Law Enforcement | 11,064 (77.9%) | 3,139 (22.1%) |
| Food Preparation & Serving | 31,771 (51.4%) | 30,029 (48.6%) |
| Cleaning & Maintenance | 23,234 (61.4%) | 14,634 (38.6%) |
| Personal Care & Service | 9,070 (25.8%) | 26,074 (74.2%) |
| Total (Category) | 98,809 (42.7%) | 132,590 (57.3%) |
| Total (Overall) | 646,711 (50.1%) | 642,768 (49.8%) |
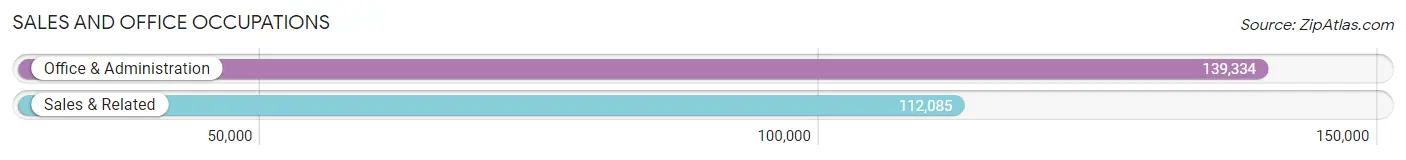
Sales and Office Occupations
The most common Sales and Office occupations in Area Code 215 are Office & Administration (139,334 | 10.8%), and Sales & Related (112,085 | 8.7%).
Sales and Office Occupations by Sex
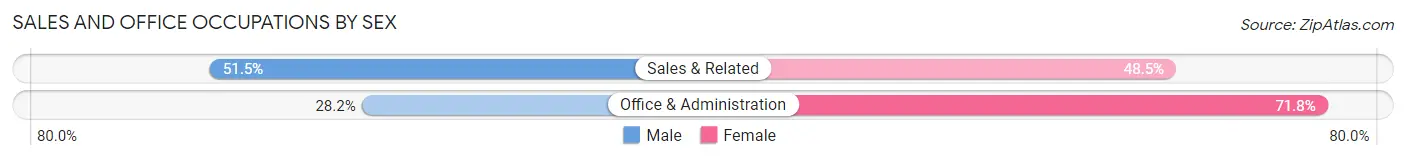
| Occupation | Male | Female |
| Sales & Related | 57,712 (51.5%) | 54,373 (48.5%) |
| Office & Administration | 39,252 (28.2%) | 100,082 (71.8%) |
| Total (Category) | 96,964 (38.6%) | 154,455 (61.4%) |
| Total (Overall) | 646,711 (50.1%) | 642,768 (49.8%) |
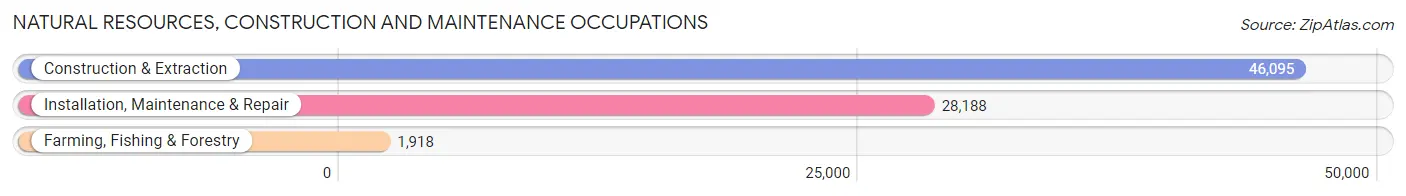
Natural Resources, Construction and Maintenance Occupations
The most common Natural Resources, Construction and Maintenance occupations in Area Code 215 are Construction & Extraction (46,095 | 3.6%), Installation, Maintenance & Repair (28,188 | 2.2%), and Farming, Fishing & Forestry (1,918 | 0.2%).
Natural Resources, Construction and Maintenance Occupations by Sex
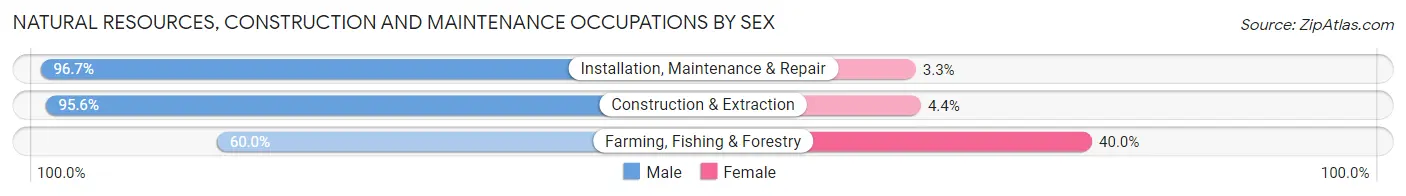
| Occupation | Male | Female |
| Farming, Fishing & Forestry | 1,151 (60.0%) | 767 (40.0%) |
| Construction & Extraction | 44,078 (95.6%) | 2,017 (4.4%) |
| Installation, Maintenance & Repair | 27,254 (96.7%) | 934 (3.3%) |
| Total (Category) | 72,483 (95.1%) | 3,718 (4.9%) |
| Total (Overall) | 646,711 (50.1%) | 642,768 (49.8%) |
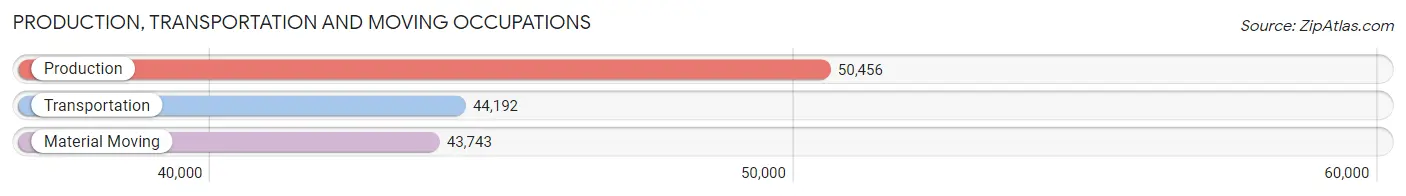
Production, Transportation and Moving Occupations
The most common Production, Transportation and Moving occupations in Area Code 215 are Production (50,456 | 3.9%), Transportation (44,192 | 3.4%), and Material Moving (43,743 | 3.4%).
Production, Transportation and Moving Occupations by Sex
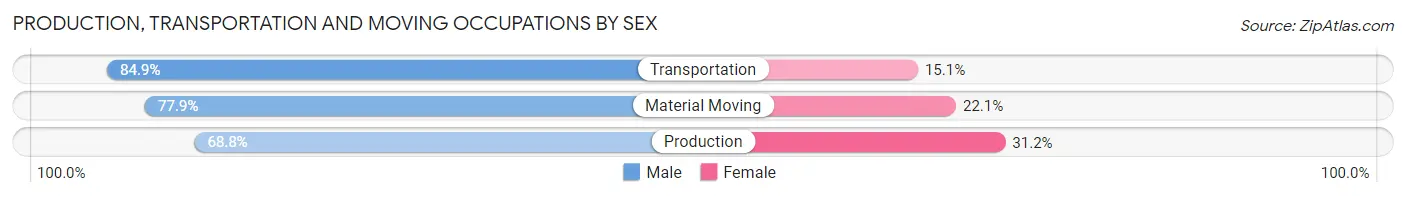
| Occupation | Male | Female |
| Production | 34,728 (68.8%) | 15,728 (31.2%) |
| Transportation | 37,507 (84.9%) | 6,685 (15.1%) |
| Material Moving | 34,073 (77.9%) | 9,670 (22.1%) |
| Total (Category) | 106,308 (76.8%) | 32,083 (23.2%) |
| Total (Overall) | 646,711 (50.1%) | 642,768 (49.8%) |
Employment Industries by Sex in Area Code 215
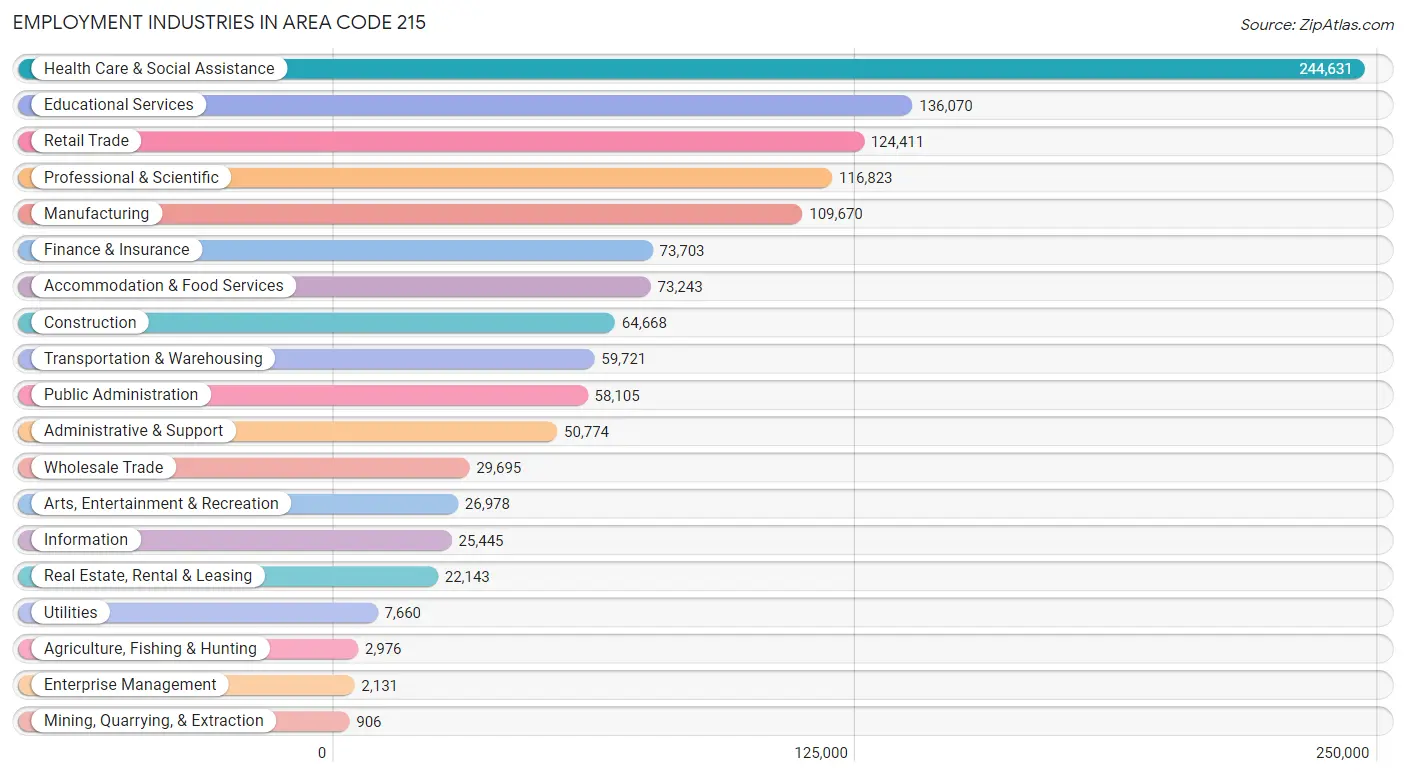
Employment Industries in Area Code 215
The major employment industries in Area Code 215 include Health Care & Social Assistance (244,631 | 19.0%), Educational Services (136,070 | 10.5%), Retail Trade (124,411 | 9.7%), Professional & Scientific (116,823 | 9.1%), and Manufacturing (109,670 | 8.5%).
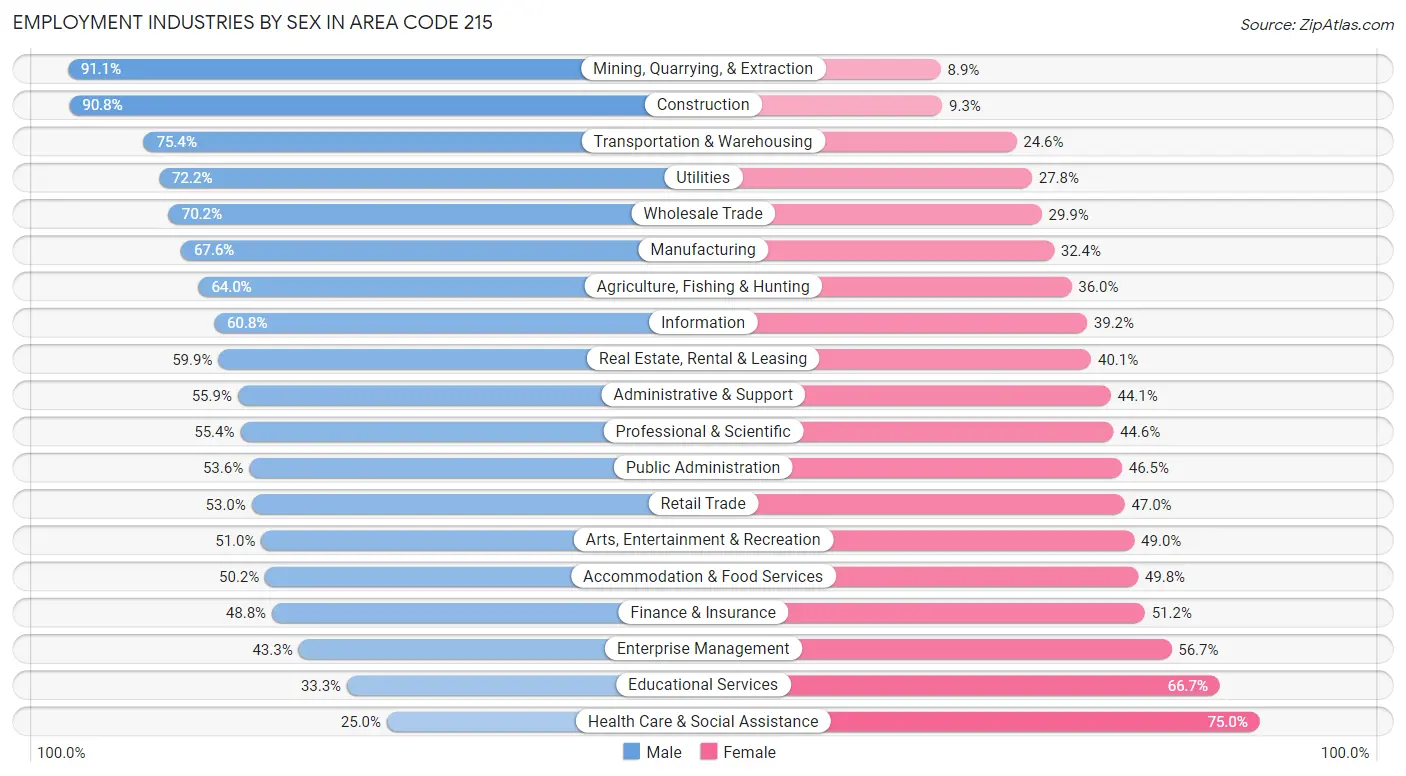
Employment Industries by Sex in Area Code 215
The Area Code 215 industries that see more men than women are Mining, Quarrying, & Extraction (91.1%), Construction (90.7%), and Transportation & Warehousing (75.4%), whereas the industries that tend to have a higher number of women are Health Care & Social Assistance (75.0%), Educational Services (66.7%), and Enterprise Management (56.7%).
| Industry | Male | Female |
| Agriculture, Fishing & Hunting | 1,905 (64.0%) | 1,071 (36.0%) |
| Mining, Quarrying, & Extraction | 825 (91.1%) | 81 (8.9%) |
| Construction | 58,686 (90.7%) | 5,982 (9.2%) |
| Manufacturing | 74,169 (67.6%) | 35,501 (32.4%) |
| Wholesale Trade | 20,831 (70.2%) | 8,864 (29.8%) |
| Retail Trade | 65,954 (53.0%) | 58,457 (47.0%) |
| Transportation & Warehousing | 45,019 (75.4%) | 14,702 (24.6%) |
| Utilities | 5,529 (72.2%) | 2,131 (27.8%) |
| Information | 15,467 (60.8%) | 9,978 (39.2%) |
| Finance & Insurance | 35,978 (48.8%) | 37,725 (51.2%) |
| Real Estate, Rental & Leasing | 13,267 (59.9%) | 8,876 (40.1%) |
| Professional & Scientific | 64,674 (55.4%) | 52,149 (44.6%) |
| Enterprise Management | 923 (43.3%) | 1,208 (56.7%) |
| Administrative & Support | 28,378 (55.9%) | 22,396 (44.1%) |
| Educational Services | 45,289 (33.3%) | 90,781 (66.7%) |
| Health Care & Social Assistance | 61,207 (25.0%) | 183,424 (75.0%) |
| Arts, Entertainment & Recreation | 13,759 (51.0%) | 13,219 (49.0%) |
| Accommodation & Food Services | 36,784 (50.2%) | 36,459 (49.8%) |
| Public Administration | 31,115 (53.5%) | 26,990 (46.5%) |
| Total | 646,711 (50.1%) | 642,768 (49.8%) |
Education in Area Code 215
School Enrollment in Area Code 215
The most common levels of schooling among the 638,495 students in Area Code 215 are college / undergraduate (136,779 | 21.4%), high school (129,925 | 20.3%), and middle school (128,097 | 20.1%).

| School Level | # Students | % Students |
| Nursery / Preschool | 40,311 | 6.3% |
| Kindergarten | 29,170 | 4.6% |
| Elementary School | 119,701 | 18.8% |
| Middle School | 128,097 | 20.1% |
| High School | 129,925 | 20.3% |
| College / Undergraduate | 136,779 | 21.4% |
| Graduate / Professional | 54,512 | 8.5% |
| Total | 638,495 | 100.0% |
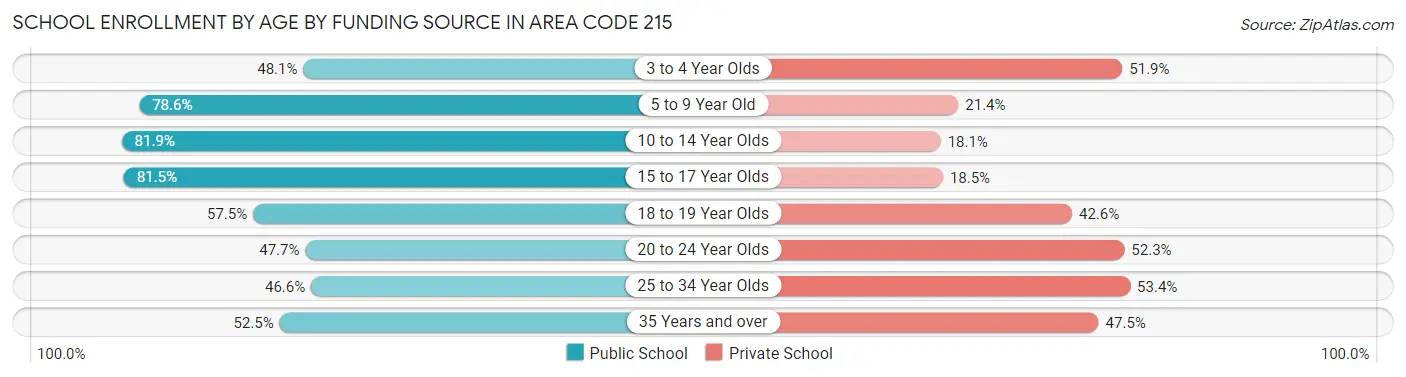
School Enrollment by Age by Funding Source in Area Code 215
Out of a total of 638,495 students who are enrolled in schools in Area Code 215, 198,630 (31.1%) attend a private institution, while the remaining 439,865 (68.9%) are enrolled in public schools. The age group of 25 to 34 year olds has the highest likelihood of being enrolled in private schools, with 26,861 (53.4% in the age bracket) enrolled. Conversely, the age group of 10 to 14 year olds has the lowest likelihood of being enrolled in a private school, with 130,266 (81.9% in the age bracket) attending a public institution.
| Age Bracket | Public School | Private School |
| 3 to 4 Year Olds | 15,284 (48.1%) | 16,500 (51.9%) |
| 5 to 9 Year Old | 110,219 (78.6%) | 29,941 (21.4%) |
| 10 to 14 Year Olds | 130,266 (81.9%) | 28,730 (18.1%) |
| 15 to 17 Year Olds | 73,863 (81.5%) | 16,753 (18.5%) |
| 18 to 19 Year Olds | 33,161 (57.5%) | 24,558 (42.5%) |
| 20 to 24 Year Olds | 35,241 (47.7%) | 38,623 (52.3%) |
| 25 to 34 Year Olds | 23,478 (46.6%) | 26,861 (53.4%) |
| 35 Years and over | 18,387 (52.5%) | 16,630 (47.5%) |
| Total | 439,865 (68.9%) | 198,630 (31.1%) |
Educational Attainment by Field of Study in Area Code 215
Business (151,828 | 19.5%), science & technology (77,616 | 10.0%), education (73,953 | 9.5%), social sciences (64,846 | 8.3%), and bio, nature & agricultural (53,238 | 6.9%) are the most common fields of study among 777,346 individuals in Area Code 215 who have obtained a bachelor's degree or higher.
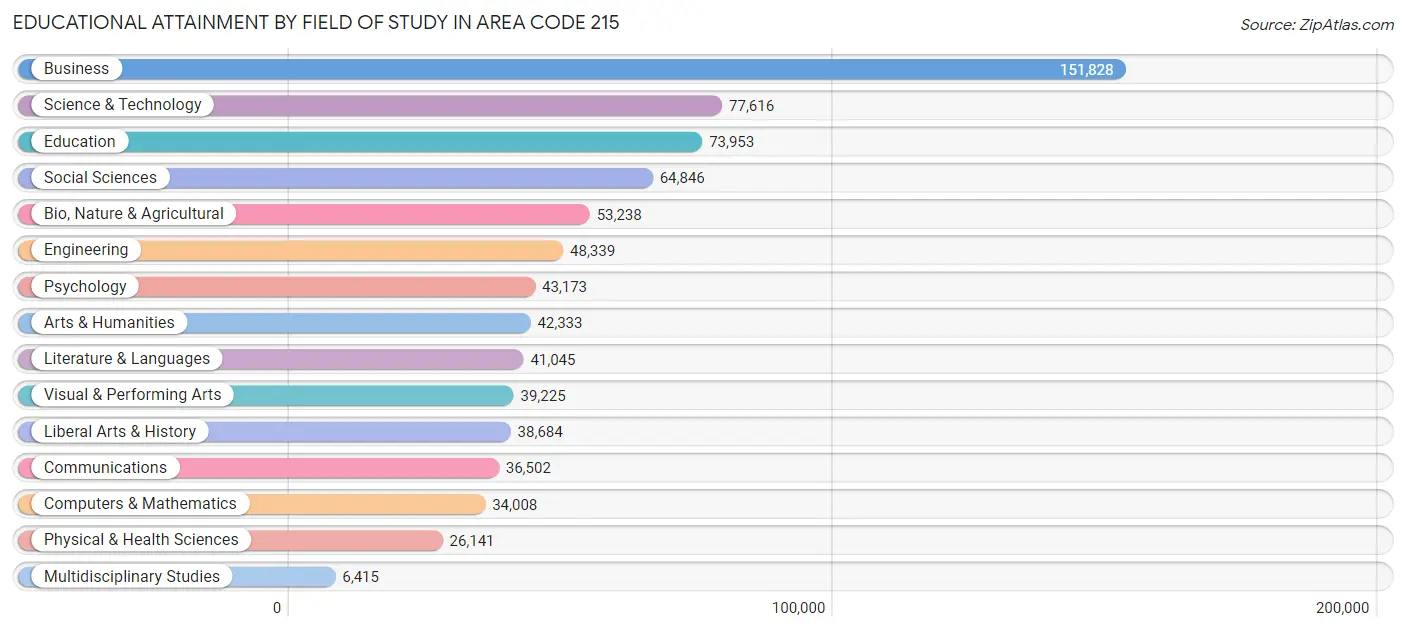
| Field of Study | # Graduates | % Graduates |
| Computers & Mathematics | 34,008 | 4.4% |
| Bio, Nature & Agricultural | 53,238 | 6.9% |
| Physical & Health Sciences | 26,141 | 3.4% |
| Psychology | 43,173 | 5.6% |
| Social Sciences | 64,846 | 8.3% |
| Engineering | 48,339 | 6.2% |
| Multidisciplinary Studies | 6,415 | 0.8% |
| Science & Technology | 77,616 | 10.0% |
| Business | 151,828 | 19.5% |
| Education | 73,953 | 9.5% |
| Literature & Languages | 41,045 | 5.3% |
| Liberal Arts & History | 38,684 | 5.0% |
| Visual & Performing Arts | 39,225 | 5.1% |
| Communications | 36,502 | 4.7% |
| Arts & Humanities | 42,333 | 5.4% |
| Total | 777,346 | 100.0% |
Transportation & Commute in Area Code 215
Vehicle Availability by Sex in Area Code 215
The most prevalent vehicle ownership categories in Area Code 215 are males with 2 vehicles (242,249, accounting for 38.4%) and females with 2 vehicles (212,195, making up 39.3%).
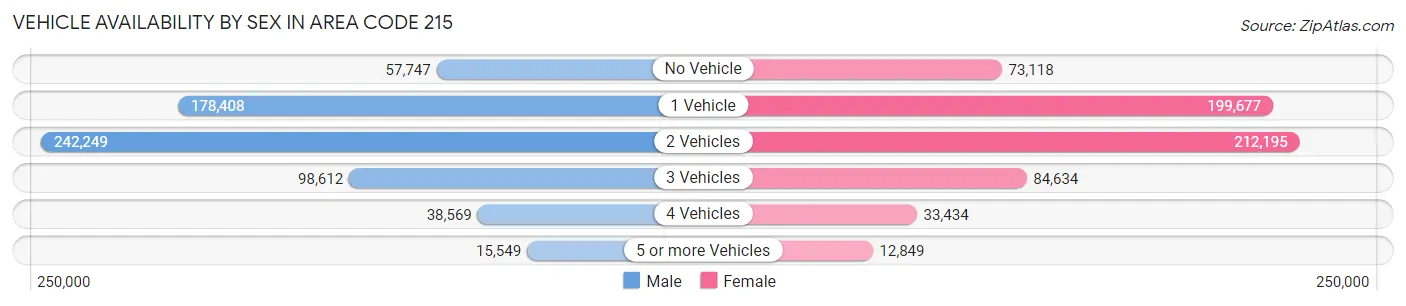
| Vehicles Available | Male | Female |
| No Vehicle | 57,747 (9.1%) | 73,118 (11.9%) |
| 1 Vehicle | 178,408 (28.3%) | 199,677 (32.4%) |
| 2 Vehicles | 242,249 (38.4%) | 212,195 (34.4%) |
| 3 Vehicles | 98,612 (15.6%) | 84,634 (13.7%) |
| 4 Vehicles | 38,569 (6.1%) | 33,434 (5.4%) |
| 5 or more Vehicles | 15,549 (2.5%) | 12,849 (2.1%) |
| Total | 631,134 (100.0%) | 615,907 (100.0%) |
Commute Time in Area Code 215
The most frequently occuring commute durations in Area Code 215 are 30 to 34 minutes (177,060 commuters, 16.5%), 20 to 24 minutes (138,548 commuters, 12.9%), and 15 to 19 minutes (132,866 commuters, 12.4%).
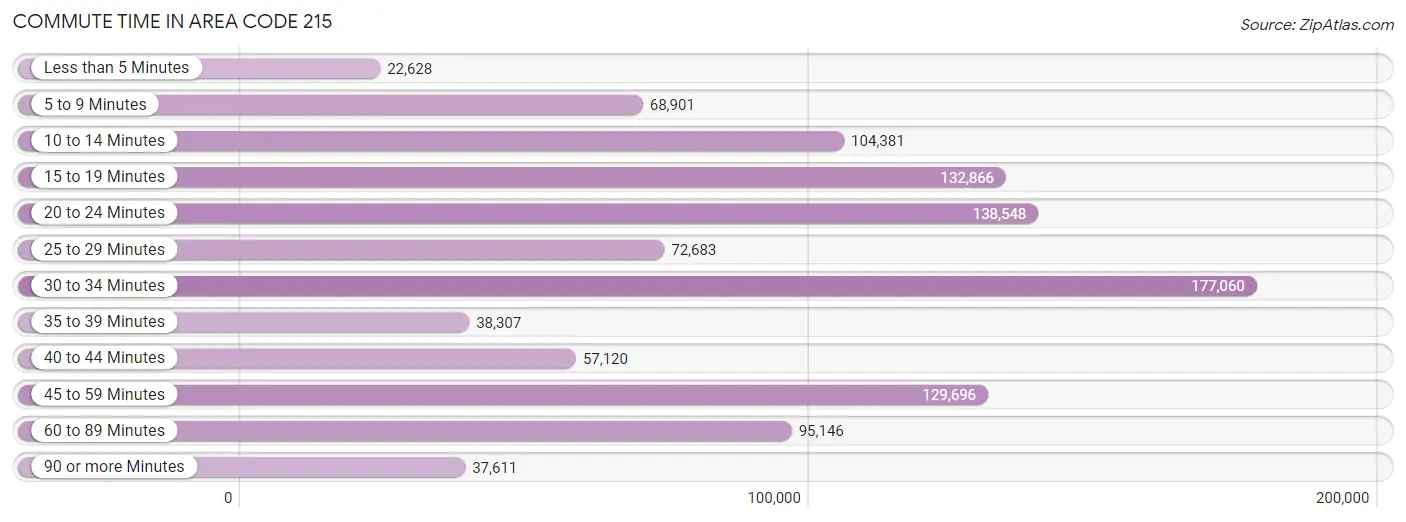
| Commute Time | # Commuters | % Commuters |
| Less than 5 Minutes | 22,628 | 2.1% |
| 5 to 9 Minutes | 68,901 | 6.4% |
| 10 to 14 Minutes | 104,381 | 9.7% |
| 15 to 19 Minutes | 132,866 | 12.4% |
| 20 to 24 Minutes | 138,548 | 12.9% |
| 25 to 29 Minutes | 72,683 | 6.8% |
| 30 to 34 Minutes | 177,060 | 16.5% |
| 35 to 39 Minutes | 38,307 | 3.6% |
| 40 to 44 Minutes | 57,120 | 5.3% |
| 45 to 59 Minutes | 129,696 | 12.1% |
| 60 to 89 Minutes | 95,146 | 8.8% |
| 90 or more Minutes | 37,611 | 3.5% |
Commute Time by Sex in Area Code 215
The most common commute times in Area Code 215 are 30 to 34 minutes (90,331 commuters, 16.5%) for males and 30 to 34 minutes (86,729 commuters, 16.5%) for females.
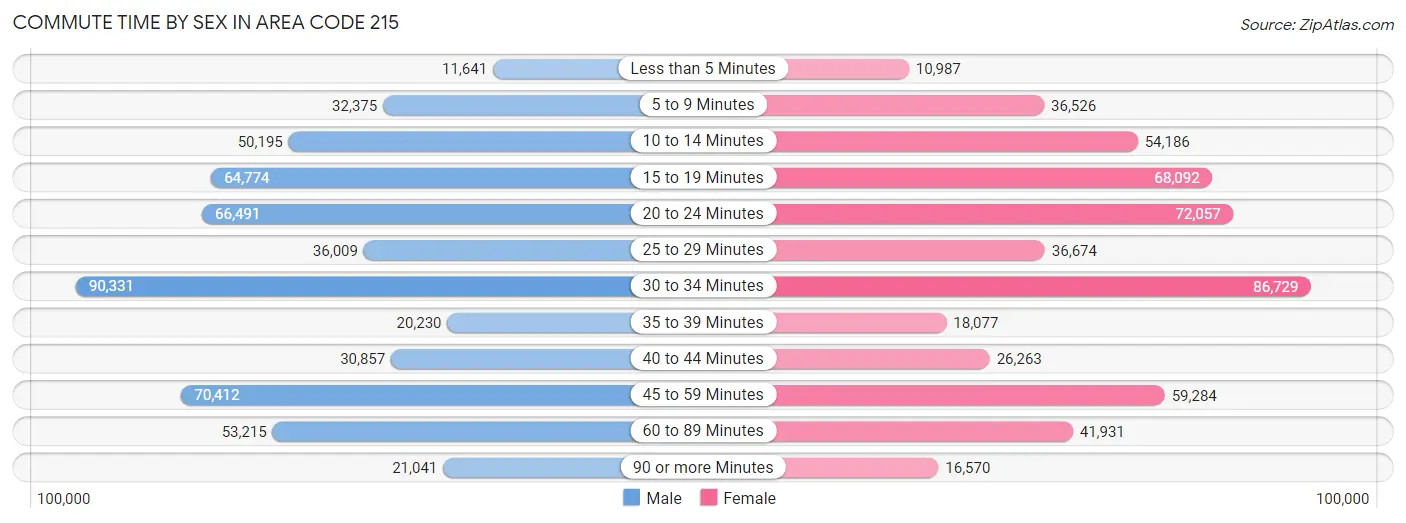
| Commute Time | Male | Female |
| Less than 5 Minutes | 11,641 (2.1%) | 10,987 (2.1%) |
| 5 to 9 Minutes | 32,375 (5.9%) | 36,526 (6.9%) |
| 10 to 14 Minutes | 50,195 (9.2%) | 54,186 (10.3%) |
| 15 to 19 Minutes | 64,774 (11.8%) | 68,092 (12.9%) |
| 20 to 24 Minutes | 66,491 (12.1%) | 72,057 (13.7%) |
| 25 to 29 Minutes | 36,009 (6.6%) | 36,674 (7.0%) |
| 30 to 34 Minutes | 90,331 (16.5%) | 86,729 (16.5%) |
| 35 to 39 Minutes | 20,230 (3.7%) | 18,077 (3.4%) |
| 40 to 44 Minutes | 30,857 (5.6%) | 26,263 (5.0%) |
| 45 to 59 Minutes | 70,412 (12.9%) | 59,284 (11.2%) |
| 60 to 89 Minutes | 53,215 (9.7%) | 41,931 (8.0%) |
| 90 or more Minutes | 21,041 (3.8%) | 16,570 (3.1%) |
Time of Departure to Work by Sex in Area Code 215
The most frequent times of departure to work in Area Code 215 are 7:00 AM to 7:29 AM (73,174, 13.4%) for males and 7:00 AM to 7:29 AM (78,883, 15.0%) for females.
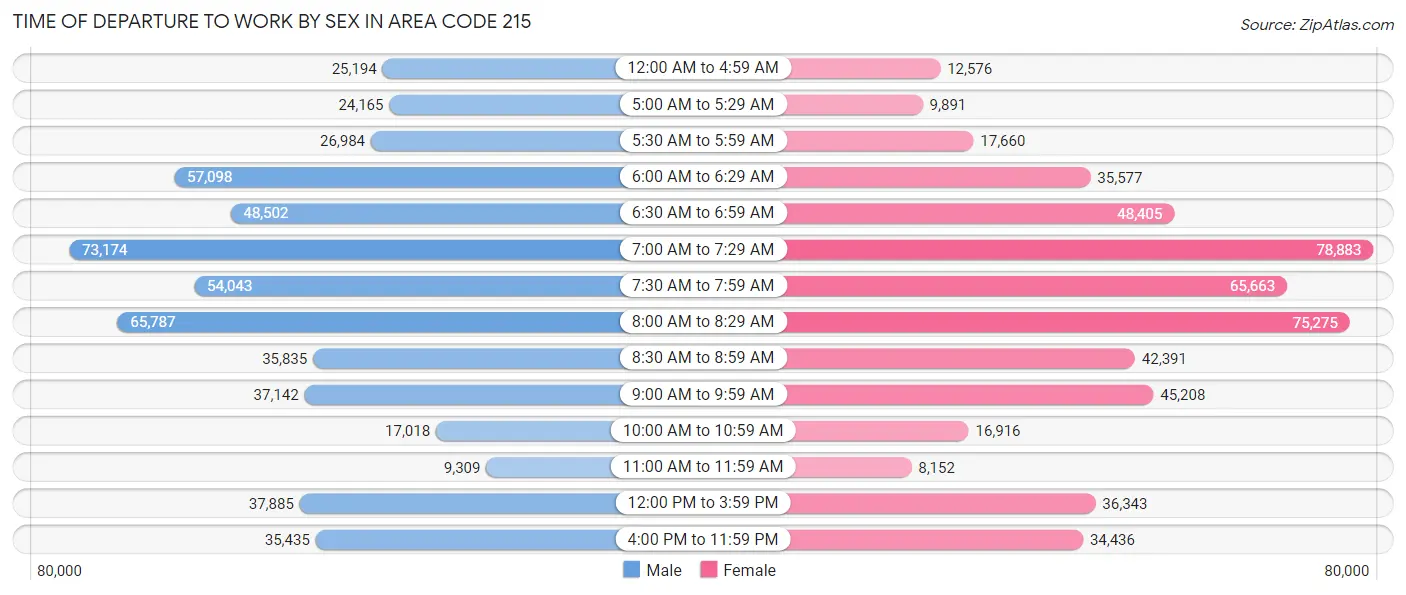
| Time of Departure | Male | Female |
| 12:00 AM to 4:59 AM | 25,194 (4.6%) | 12,576 (2.4%) |
| 5:00 AM to 5:29 AM | 24,165 (4.4%) | 9,891 (1.9%) |
| 5:30 AM to 5:59 AM | 26,984 (4.9%) | 17,660 (3.4%) |
| 6:00 AM to 6:29 AM | 57,098 (10.4%) | 35,577 (6.8%) |
| 6:30 AM to 6:59 AM | 48,502 (8.9%) | 48,405 (9.2%) |
| 7:00 AM to 7:29 AM | 73,174 (13.4%) | 78,883 (15.0%) |
| 7:30 AM to 7:59 AM | 54,043 (9.9%) | 65,663 (12.4%) |
| 8:00 AM to 8:29 AM | 65,787 (12.0%) | 75,275 (14.3%) |
| 8:30 AM to 8:59 AM | 35,835 (6.5%) | 42,391 (8.0%) |
| 9:00 AM to 9:59 AM | 37,142 (6.8%) | 45,208 (8.6%) |
| 10:00 AM to 10:59 AM | 17,018 (3.1%) | 16,916 (3.2%) |
| 11:00 AM to 11:59 AM | 9,309 (1.7%) | 8,152 (1.5%) |
| 12:00 PM to 3:59 PM | 37,885 (6.9%) | 36,343 (6.9%) |
| 4:00 PM to 11:59 PM | 35,435 (6.5%) | 34,436 (6.5%) |
| Total | 547,571 (100.0%) | 527,376 (100.0%) |
Housing Occupancy in Area Code 215
Occupancy by Ownership in Area Code 215
Of the total 1,062,653 dwellings in Area Code 215, owner-occupied units account for 645,550 (60.8%), while renter-occupied units make up 417,103 (39.3%).
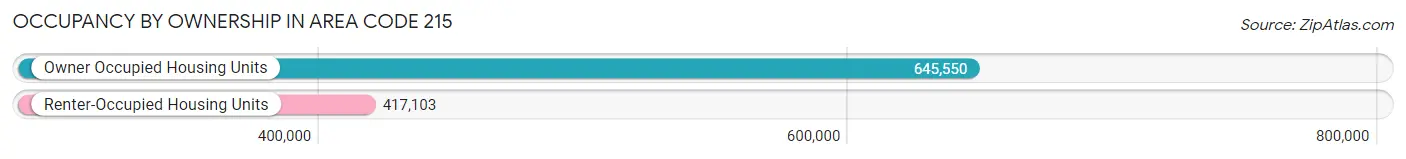
| Occupancy | # Housing Units | % Housing Units |
| Owner Occupied Housing Units | 645,550 | 60.8% |
| Renter-Occupied Housing Units | 417,103 | 39.3% |
| Total Occupied Housing Units | 1,062,653 | 100.0% |
Occupancy by Household Size in Area Code 215
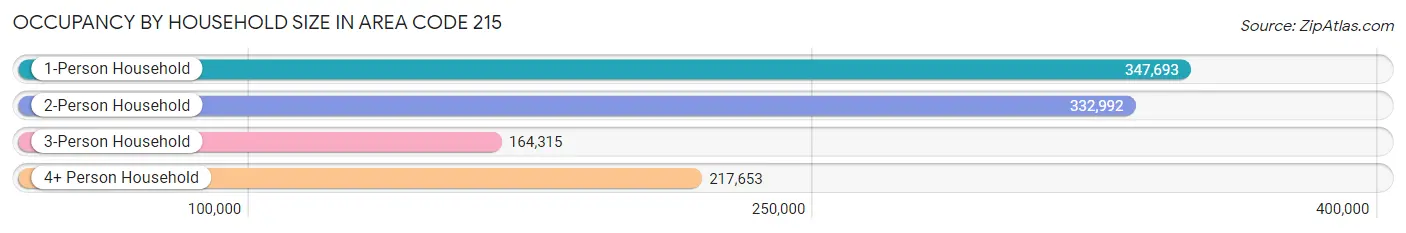
| Household Size | # Housing Units | % Housing Units |
| 1-Person Household | 347,693 | 32.7% |
| 2-Person Household | 332,992 | 31.3% |
| 3-Person Household | 164,315 | 15.5% |
| 4+ Person Household | 217,653 | 20.5% |
| Total Housing Units | 1,062,653 | 100.0% |
Occupancy by Ownership by Household Size in Area Code 215
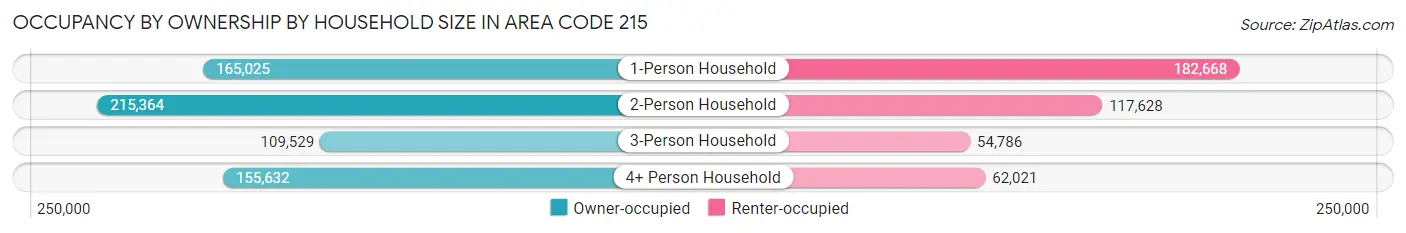
| Household Size | Owner-occupied | Renter-occupied |
| 1-Person Household | 165,025 (47.5%) | 182,668 (52.5%) |
| 2-Person Household | 215,364 (64.7%) | 117,628 (35.3%) |
| 3-Person Household | 109,529 (66.7%) | 54,786 (33.3%) |
| 4+ Person Household | 155,632 (71.5%) | 62,021 (28.5%) |
| Total Housing Units | 645,550 (60.8%) | 417,103 (39.3%) |
Occupancy by Educational Attainment in Area Code 215
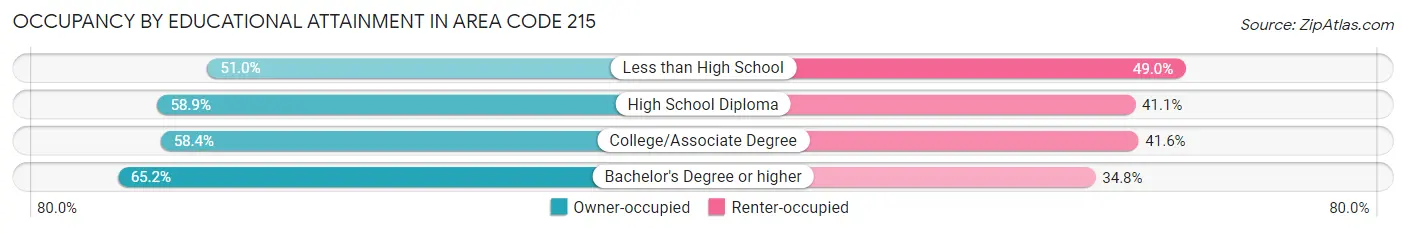
| Household Size | Owner-occupied | Renter-occupied |
| Less than High School | 46,707 (51.0%) | 44,862 (49.0%) |
| High School Diploma | 160,254 (58.9%) | 111,750 (41.1%) |
| College/Associate Degree | 149,002 (58.4%) | 106,111 (41.6%) |
| Bachelor's Degree or higher | 289,587 (65.2%) | 154,380 (34.8%) |
Occupancy by Age of Householder in Area Code 215
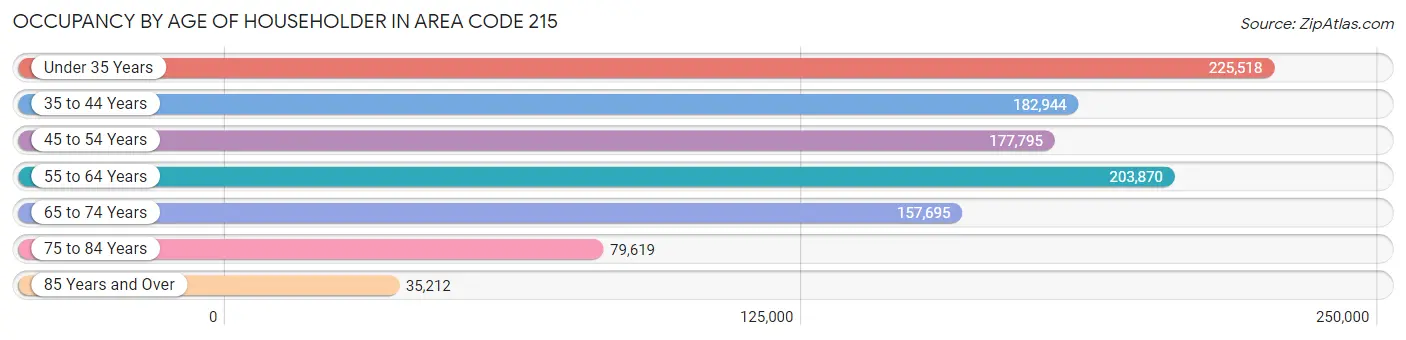
| Age Bracket | # Households | % Households |
| Under 35 Years | 225,518 | 21.2% |
| 35 to 44 Years | 182,944 | 17.2% |
| 45 to 54 Years | 177,795 | 16.7% |
| 55 to 64 Years | 203,870 | 19.2% |
| 65 to 74 Years | 157,695 | 14.8% |
| 75 to 84 Years | 79,619 | 7.5% |
| 85 Years and Over | 35,212 | 3.3% |
| Total | 1,062,653 | 100.0% |
Housing Finances in Area Code 215
Median Income by Occupancy in Area Code 215
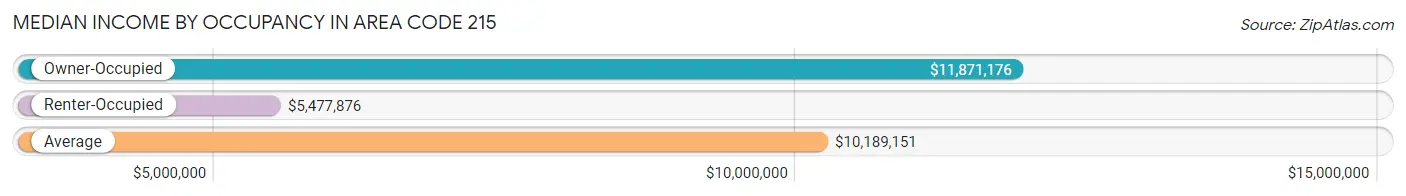
| Occupancy Type | # Households | Median Income |
| Owner-Occupied | 645,550 (60.8%) | $11,871,176 |
| Renter-Occupied | 417,103 (39.3%) | $5,477,876 |
| Average | 1,062,653 (100.0%) | $10,189,151 |
Occupancy by Householder Income Bracket in Area Code 215
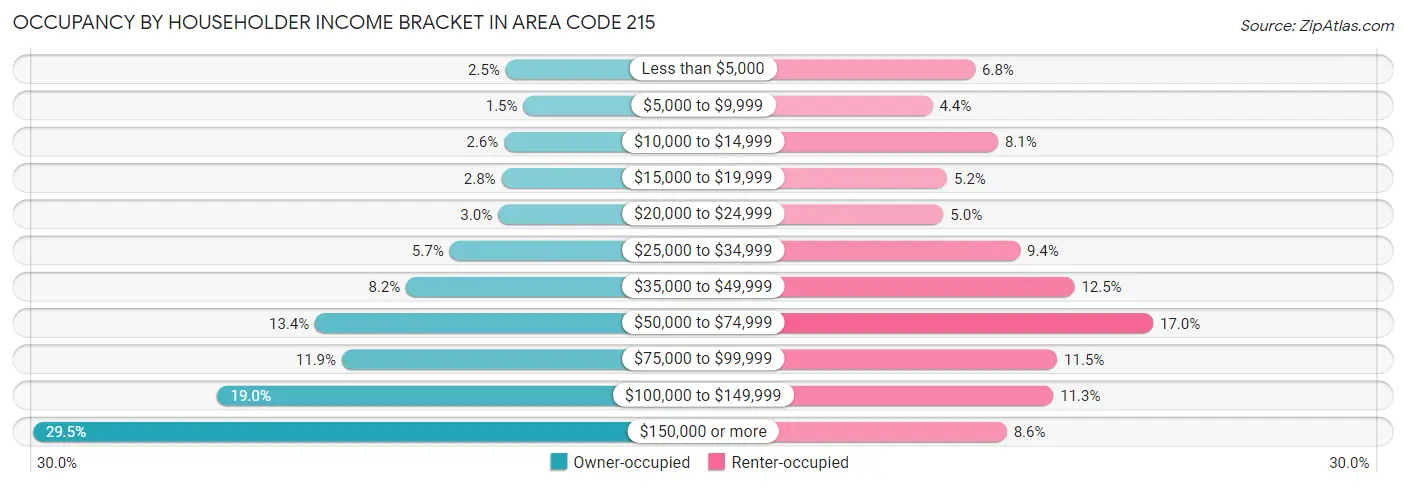
| Income Bracket | Owner-occupied | Renter-occupied |
| Less than $5,000 | 16,225 (2.5%) | 28,495 (6.8%) |
| $5,000 to $9,999 | 9,690 (1.5%) | 18,348 (4.4%) |
| $10,000 to $14,999 | 16,760 (2.6%) | 33,938 (8.1%) |
| $15,000 to $19,999 | 17,726 (2.8%) | 21,831 (5.2%) |
| $20,000 to $24,999 | 19,072 (2.9%) | 20,925 (5.0%) |
| $25,000 to $34,999 | 36,926 (5.7%) | 39,217 (9.4%) |
| $35,000 to $49,999 | 52,903 (8.2%) | 52,181 (12.5%) |
| $50,000 to $74,999 | 86,526 (13.4%) | 70,924 (17.0%) |
| $75,000 to $99,999 | 76,642 (11.9%) | 48,071 (11.5%) |
| $100,000 to $149,999 | 122,452 (19.0%) | 47,146 (11.3%) |
| $150,000 or more | 190,628 (29.5%) | 36,027 (8.6%) |
| Total | 645,550 (100.0%) | 417,103 (100.0%) |
Monthly Housing Cost Tiers in Area Code 215
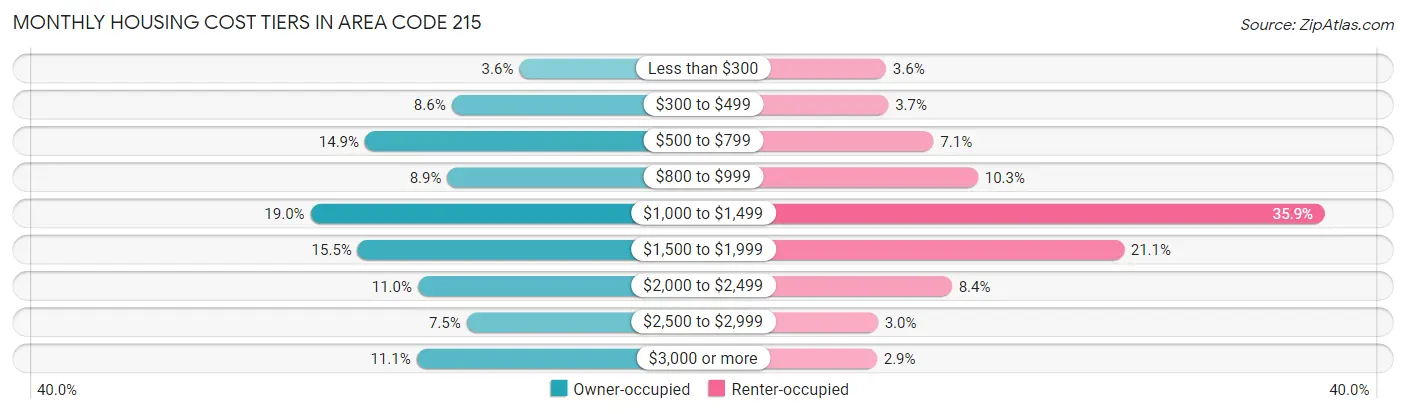
| Monthly Cost | Owner-occupied | Renter-occupied |
| Less than $300 | 23,034 (3.6%) | 14,870 (3.6%) |
| $300 to $499 | 55,270 (8.6%) | 15,612 (3.7%) |
| $500 to $799 | 96,428 (14.9%) | 29,508 (7.1%) |
| $800 to $999 | 57,266 (8.9%) | 43,133 (10.3%) |
| $1,000 to $1,499 | 122,361 (19.0%) | 149,730 (35.9%) |
| $1,500 to $1,999 | 99,888 (15.5%) | 87,984 (21.1%) |
| $2,000 to $2,499 | 71,291 (11.0%) | 35,118 (8.4%) |
| $2,500 to $2,999 | 48,102 (7.4%) | 12,391 (3.0%) |
| $3,000 or more | 71,910 (11.1%) | 12,107 (2.9%) |
| Total | 645,550 (100.0%) | 417,103 (100.0%) |
Physical Housing Characteristics in Area Code 215
Housing Structures in Area Code 215
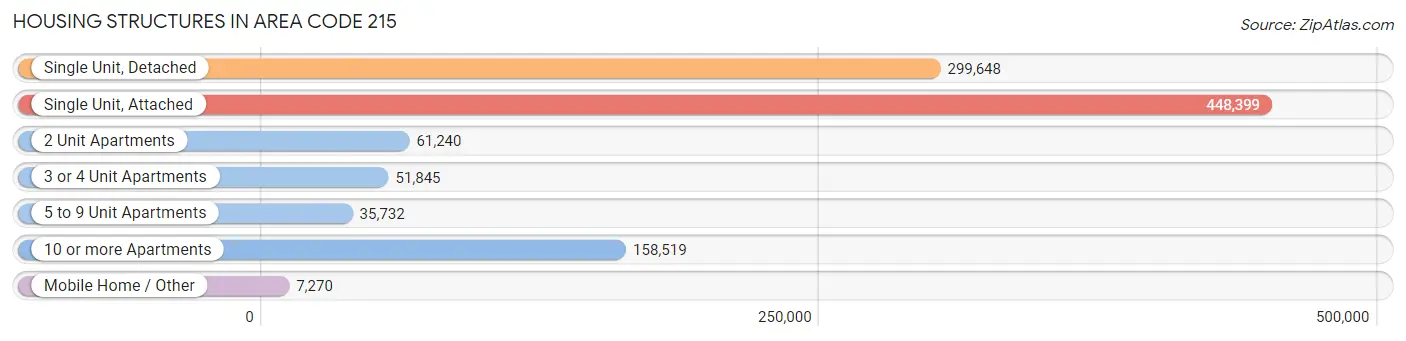
| Structure Type | # Housing Units | % Housing Units |
| Single Unit, Detached | 299,648 | 28.2% |
| Single Unit, Attached | 448,399 | 42.2% |
| 2 Unit Apartments | 61,240 | 5.8% |
| 3 or 4 Unit Apartments | 51,845 | 4.9% |
| 5 to 9 Unit Apartments | 35,732 | 3.4% |
| 10 or more Apartments | 158,519 | 14.9% |
| Mobile Home / Other | 7,270 | 0.7% |
| Total | 1,062,653 | 100.0% |
Housing Structures by Occupancy in Area Code 215
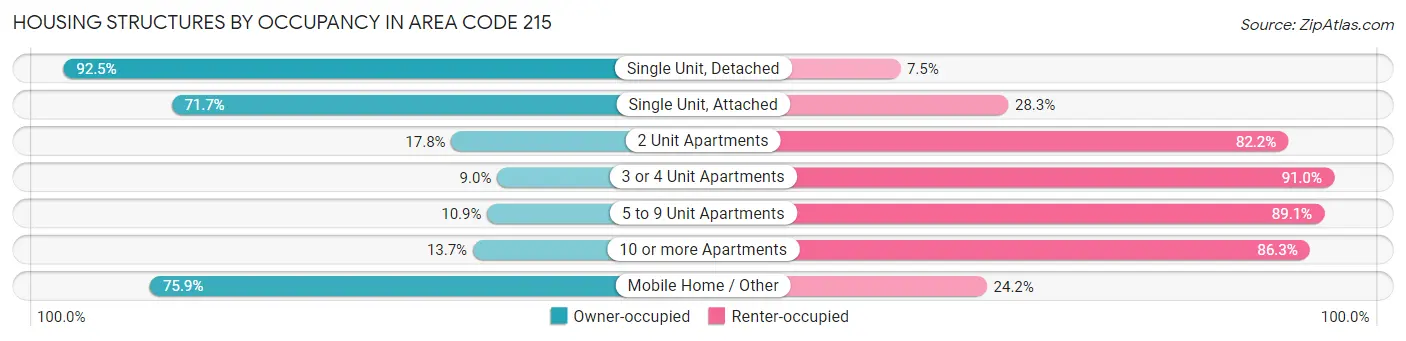
| Structure Type | Owner-occupied | Renter-occupied |
| Single Unit, Detached | 277,267 (92.5%) | 22,381 (7.5%) |
| Single Unit, Attached | 321,600 (71.7%) | 126,799 (28.3%) |
| 2 Unit Apartments | 10,915 (17.8%) | 50,325 (82.2%) |
| 3 or 4 Unit Apartments | 4,665 (9.0%) | 47,180 (91.0%) |
| 5 to 9 Unit Apartments | 3,899 (10.9%) | 31,833 (89.1%) |
| 10 or more Apartments | 21,690 (13.7%) | 136,829 (86.3%) |
| Mobile Home / Other | 5,514 (75.8%) | 1,756 (24.1%) |
| Total | 645,550 (60.8%) | 417,103 (39.3%) |
Housing Structures by Number of Rooms in Area Code 215
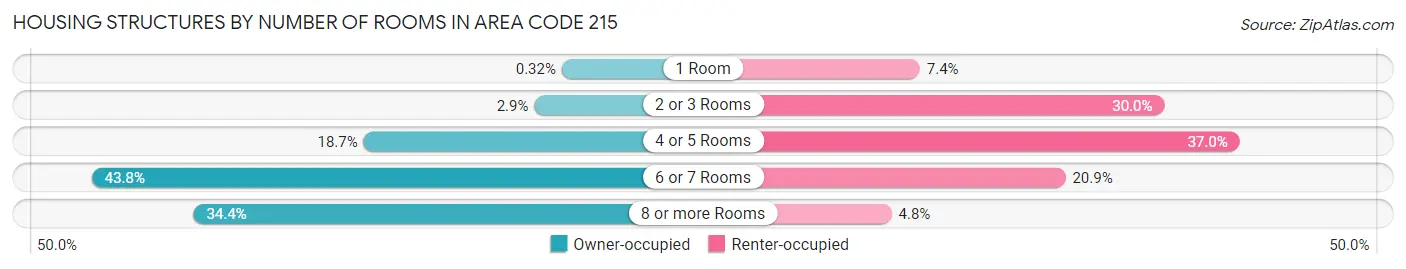
| Number of Rooms | Owner-occupied | Renter-occupied |
| 1 Room | 2,036 (0.3%) | 30,843 (7.4%) |
| 2 or 3 Rooms | 18,455 (2.9%) | 125,120 (30.0%) |
| 4 or 5 Rooms | 120,393 (18.6%) | 154,221 (37.0%) |
| 6 or 7 Rooms | 282,748 (43.8%) | 86,990 (20.9%) |
| 8 or more Rooms | 221,918 (34.4%) | 19,929 (4.8%) |
| Total | 645,550 (100.0%) | 417,103 (100.0%) |
Housing Structure by Heating Type in Area Code 215
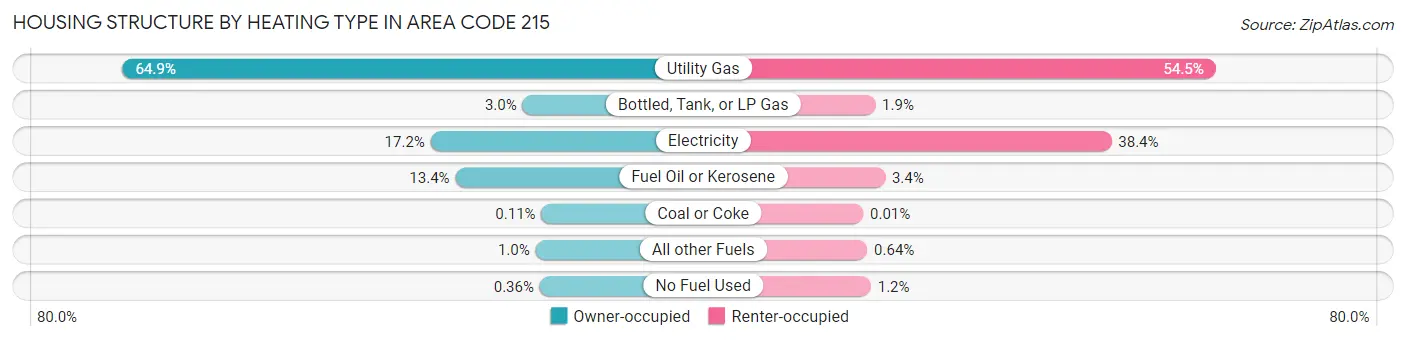
| Heating Type | Owner-occupied | Renter-occupied |
| Utility Gas | 418,720 (64.9%) | 227,320 (54.5%) |
| Bottled, Tank, or LP Gas | 19,506 (3.0%) | 7,807 (1.9%) |
| Electricity | 111,247 (17.2%) | 160,142 (38.4%) |
| Fuel Oil or Kerosene | 86,494 (13.4%) | 14,136 (3.4%) |
| Coal or Coke | 738 (0.1%) | 35 (0.0%) |
| All other Fuels | 6,498 (1.0%) | 2,673 (0.6%) |
| No Fuel Used | 2,347 (0.4%) | 4,990 (1.2%) |
| Total | 645,550 (100.0%) | 417,103 (100.0%) |
Household Vehicle Usage in Area Code 215
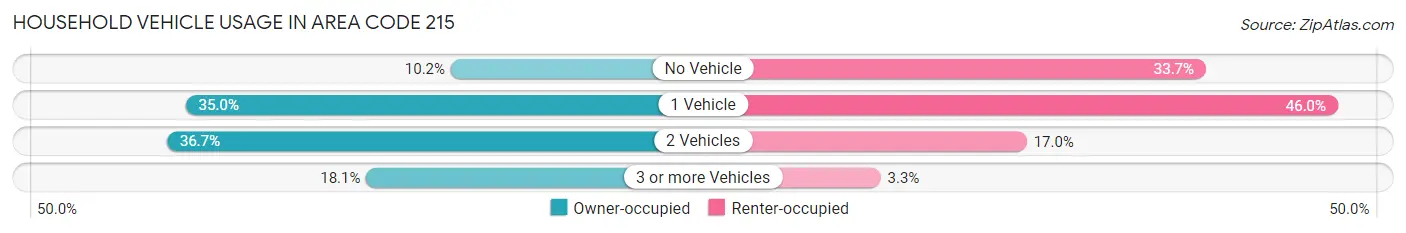
| Vehicles per Household | Owner-occupied | Renter-occupied |
| No Vehicle | 65,916 (10.2%) | 140,508 (33.7%) |
| 1 Vehicle | 225,733 (35.0%) | 191,906 (46.0%) |
| 2 Vehicles | 237,052 (36.7%) | 70,787 (17.0%) |
| 3 or more Vehicles | 116,849 (18.1%) | 13,902 (3.3%) |
| Total | 645,550 (100.0%) | 417,103 (100.0%) |
Real Estate & Mortgages in Area Code 215
Real Estate and Mortgage Overview in Area Code 215
| Characteristic | Without Mortgage | With Mortgage |
| Housing Units | 241,268 | 404,282 |
| Median Property Value | $31,728,700 | $37,635,300 |
| Median Household Income | $7,832,490 | $144,421 |
| Monthly Housing Costs | $78,870 | $70,130 |
| Real Estate Taxes | $411,262 | $8,342 |
Property Value by Mortgage Status in Area Code 215
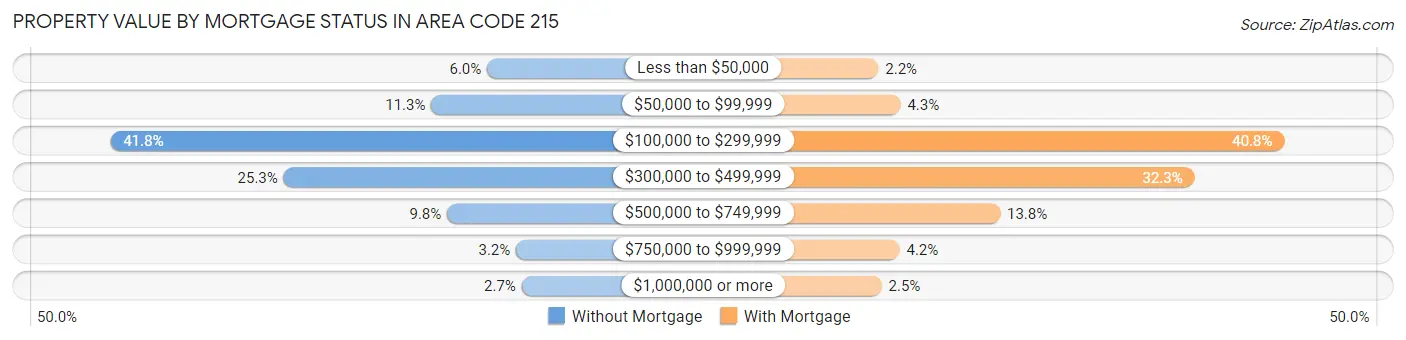
| Property Value | Without Mortgage | With Mortgage |
| Less than $50,000 | 14,355 (5.9%) | 8,793 (2.2%) |
| $50,000 to $99,999 | 27,193 (11.3%) | 17,298 (4.3%) |
| $100,000 to $299,999 | 100,958 (41.8%) | 165,052 (40.8%) |
| $300,000 to $499,999 | 61,108 (25.3%) | 130,523 (32.3%) |
| $500,000 to $749,999 | 23,543 (9.8%) | 55,648 (13.8%) |
| $750,000 to $999,999 | 7,705 (3.2%) | 16,954 (4.2%) |
| $1,000,000 or more | 6,406 (2.7%) | 10,014 (2.5%) |
| Total | 241,268 (100.0%) | 404,282 (100.0%) |
Household Income by Mortgage Status in Area Code 215
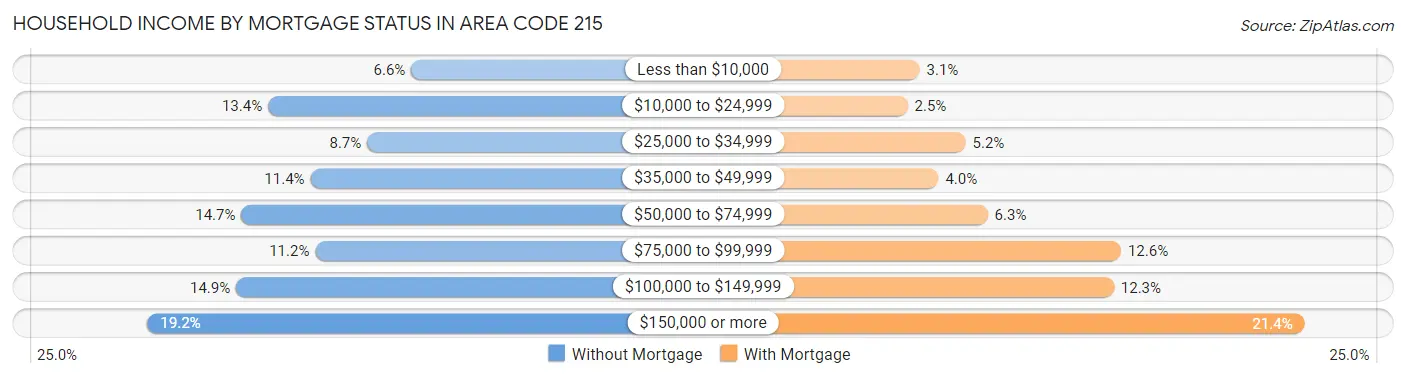
| Household Income | Without Mortgage | With Mortgage |
| Less than $10,000 | 15,903 (6.6%) | 12,347 (3.0%) |
| $10,000 to $24,999 | 32,356 (13.4%) | 10,012 (2.5%) |
| $25,000 to $34,999 | 20,962 (8.7%) | 21,202 (5.2%) |
| $35,000 to $49,999 | 27,479 (11.4%) | 15,964 (4.0%) |
| $50,000 to $74,999 | 35,408 (14.7%) | 25,424 (6.3%) |
| $75,000 to $99,999 | 26,922 (11.2%) | 51,118 (12.6%) |
| $100,000 to $149,999 | 36,031 (14.9%) | 49,720 (12.3%) |
| $150,000 or more | 46,207 (19.2%) | 86,421 (21.4%) |
| Total | 241,268 (100.0%) | 404,282 (100.0%) |
Property Value to Household Income Ratio in Area Code 215
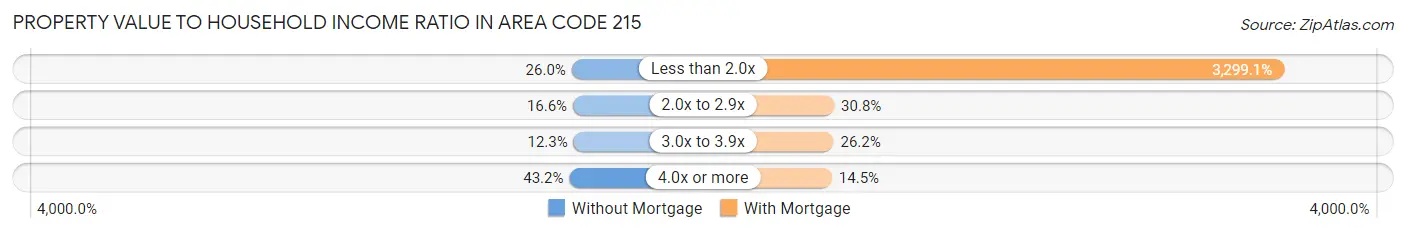
| Value-to-Income Ratio | Without Mortgage | With Mortgage |
| Less than 2.0x | 62,812 (26.0%) | 13,337,505 (3,299.1%) |
| 2.0x to 2.9x | 40,104 (16.6%) | 124,567 (30.8%) |
| 3.0x to 3.9x | 29,701 (12.3%) | 105,733 (26.2%) |
| 4.0x or more | 104,124 (43.2%) | 58,498 (14.5%) |
| Total | 241,268 (100.0%) | 404,282 (100.0%) |
Real Estate Taxes by Mortgage Status in Area Code 215
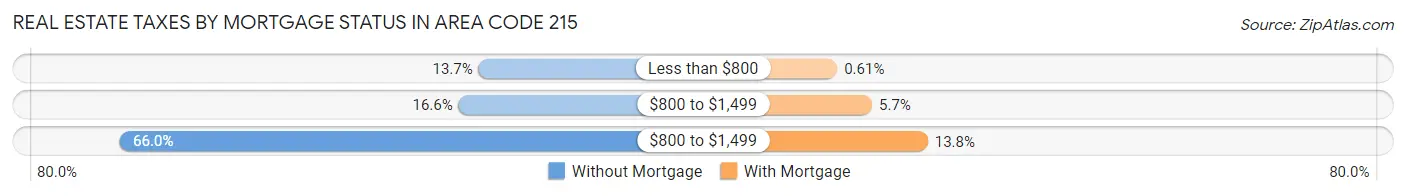
| Property Taxes | Without Mortgage | With Mortgage |
| Less than $800 | 32,988 (13.7%) | 2,464 (0.6%) |
| $800 to $1,499 | 40,016 (16.6%) | 23,090 (5.7%) |
| $800 to $1,499 | 159,333 (66.0%) | 55,958 (13.8%) |
| Total | 241,268 (100.0%) | 404,282 (100.0%) |
Health & Disability in Area Code 215
Health Insurance Coverage by Age in Area Code 215
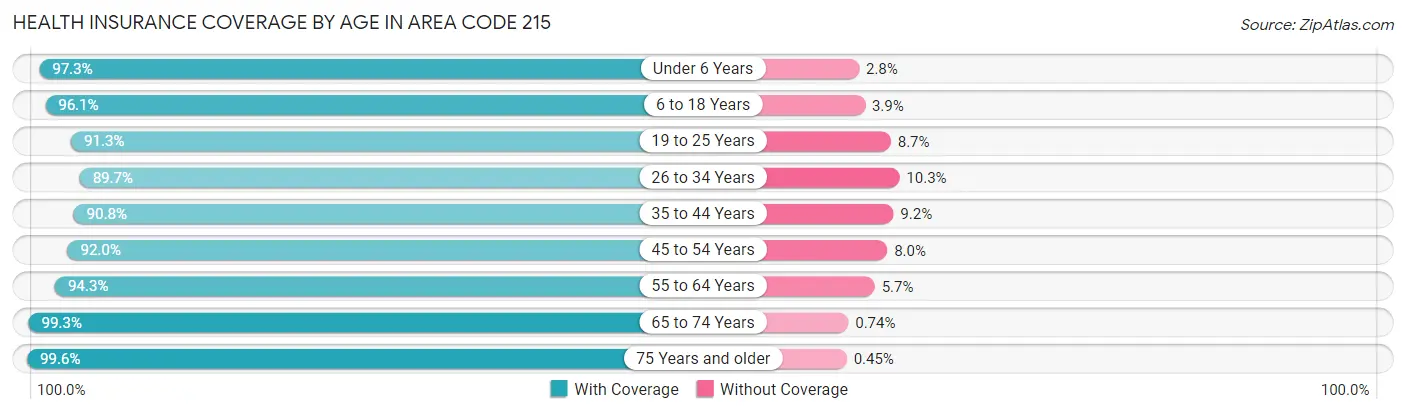
| Age Bracket | With Coverage | Without Coverage |
| Under 6 Years | 174,439 (97.3%) | 4,934 (2.8%) |
| 6 to 18 Years | 403,973 (96.1%) | 16,227 (3.9%) |
| 19 to 25 Years | 222,934 (91.3%) | 21,155 (8.7%) |
| 26 to 34 Years | 341,143 (89.7%) | 39,083 (10.3%) |
| 35 to 44 Years | 305,716 (90.8%) | 30,813 (9.2%) |
| 45 to 54 Years | 287,015 (92.0%) | 24,978 (8.0%) |
| 55 to 64 Years | 318,454 (94.3%) | 19,135 (5.7%) |
| 65 to 74 Years | 242,220 (99.3%) | 1,800 (0.7%) |
| 75 Years and older | 167,937 (99.6%) | 752 (0.4%) |
| Total | 2,463,831 (93.9%) | 158,877 (6.1%) |
Health Insurance Coverage by Citizenship Status in Area Code 215
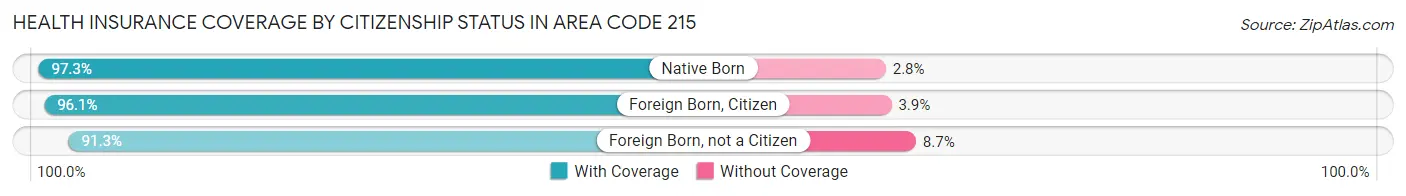
| Citizenship Status | With Coverage | Without Coverage |
| Native Born | 174,439 (97.3%) | 4,934 (2.8%) |
| Foreign Born, Citizen | 403,973 (96.1%) | 16,227 (3.9%) |
| Foreign Born, not a Citizen | 222,934 (91.3%) | 21,155 (8.7%) |
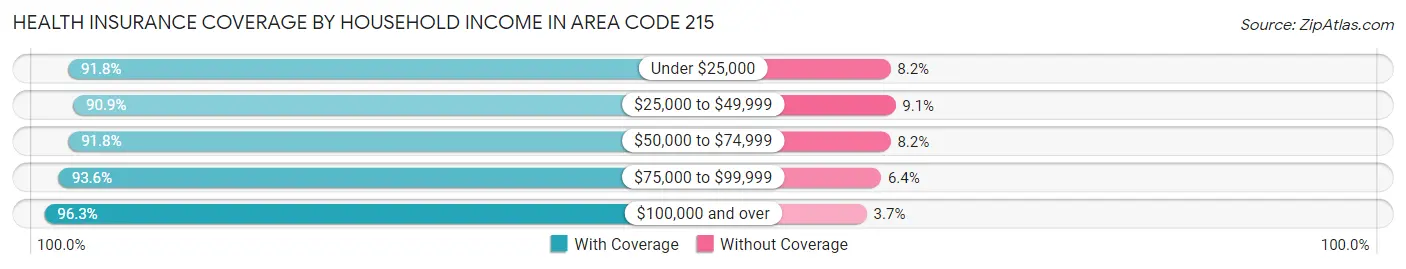
Health Insurance Coverage by Household Income in Area Code 215
| Household Income | With Coverage | Without Coverage |
| Under $25,000 | 335,416 (91.8%) | 29,786 (8.2%) |
| $25,000 to $49,999 | 352,392 (90.9%) | 35,273 (9.1%) |
| $50,000 to $74,999 | 328,459 (91.8%) | 29,251 (8.2%) |
| $75,000 to $99,999 | 284,759 (93.6%) | 19,492 (6.4%) |
| $100,000 and over | 1,119,789 (96.3%) | 43,283 (3.7%) |
Public vs Private Health Insurance Coverage by Age in Area Code 215
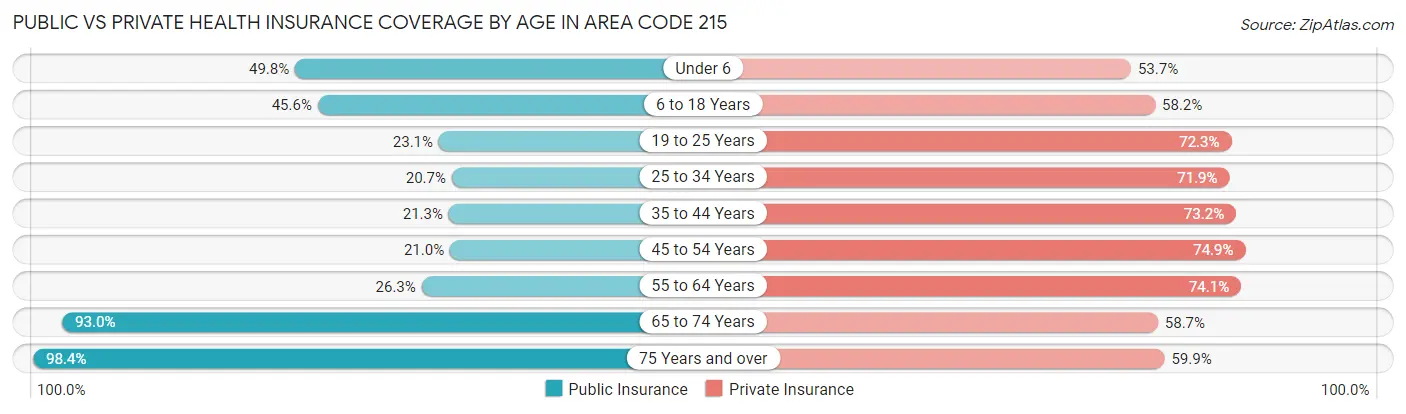
| Age Bracket | Public Insurance | Private Insurance |
| Under 6 | 89,334 (49.8%) | 96,279 (53.7%) |
| 6 to 18 Years | 191,573 (45.6%) | 244,401 (58.2%) |
| 19 to 25 Years | 56,399 (23.1%) | 176,459 (72.3%) |
| 25 to 34 Years | 78,744 (20.7%) | 273,490 (71.9%) |
| 35 to 44 Years | 71,541 (21.3%) | 246,200 (73.2%) |
| 45 to 54 Years | 65,643 (21.0%) | 233,638 (74.9%) |
| 55 to 64 Years | 88,836 (26.3%) | 250,131 (74.1%) |
| 65 to 74 Years | 226,976 (93.0%) | 143,174 (58.7%) |
| 75 Years and over | 166,016 (98.4%) | 101,046 (59.9%) |
| Total | 1,035,062 (39.5%) | 1,764,818 (67.3%) |
Disability Status by Sex by Age in Area Code 215
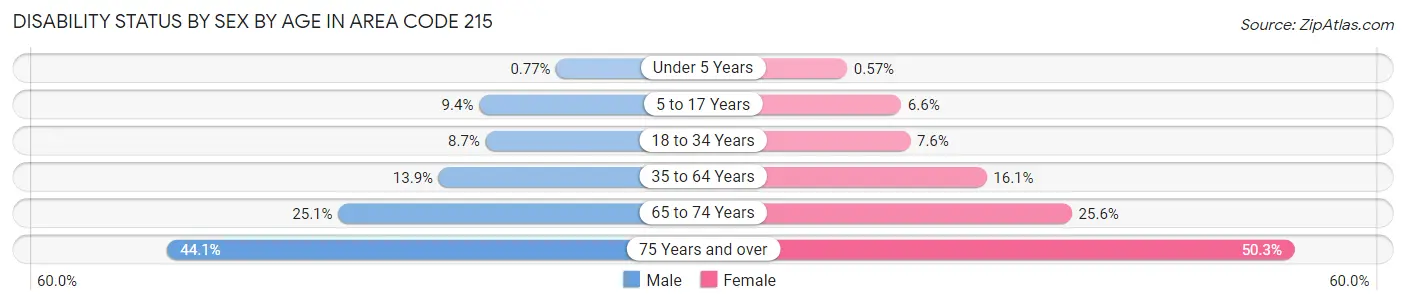
| Age Bracket | Male | Female |
| Under 5 Years | 596 (0.8%) | 421 (0.6%) |
| 5 to 17 Years | 19,522 (9.4%) | 13,144 (6.6%) |
| 18 to 34 Years | 28,153 (8.6%) | 25,754 (7.6%) |
| 35 to 64 Years | 65,981 (13.9%) | 82,084 (16.1%) |
| 65 to 74 Years | 27,695 (25.1%) | 34,169 (25.6%) |
| 75 Years and over | 28,587 (44.1%) | 52,269 (50.3%) |
Disability Class by Sex by Age in Area Code 215
Disability Class: Hearing Difficulty
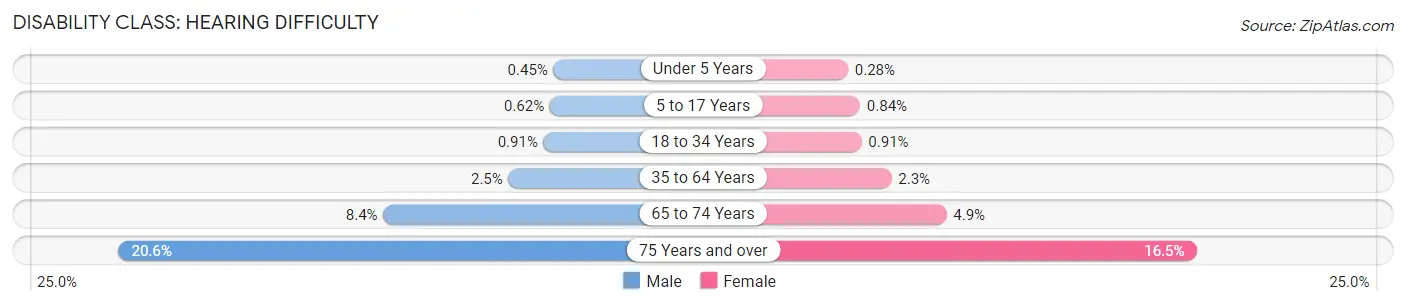
| Age Bracket | Male | Female |
| Under 5 Years | 348 (0.4%) | 204 (0.3%) |
| 5 to 17 Years | 1,302 (0.6%) | 1,673 (0.8%) |
| 18 to 34 Years | 2,978 (0.9%) | 3,080 (0.9%) |
| 35 to 64 Years | 12,093 (2.5%) | 11,721 (2.3%) |
| 65 to 74 Years | 9,232 (8.4%) | 6,476 (4.9%) |
| 75 Years and over | 13,382 (20.6%) | 17,087 (16.5%) |
Disability Class: Vision Difficulty
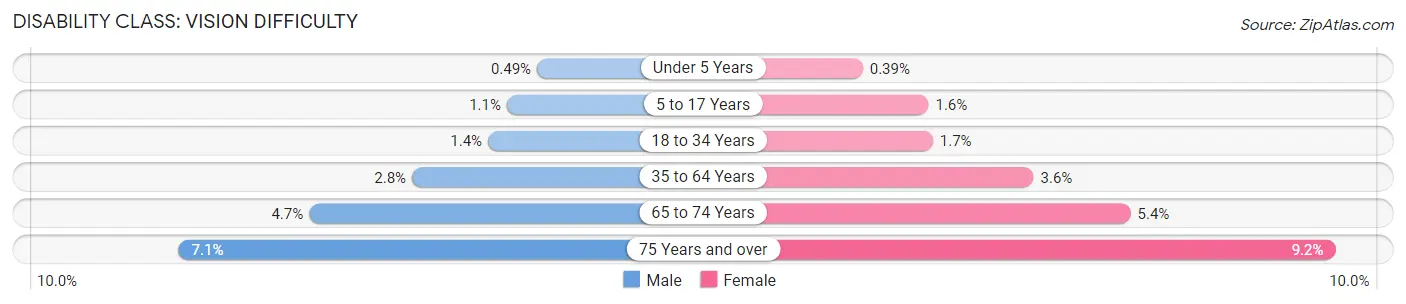
| Age Bracket | Male | Female |
| Under 5 Years | 381 (0.5%) | 287 (0.4%) |
| 5 to 17 Years | 2,183 (1.1%) | 3,227 (1.6%) |
| 18 to 34 Years | 4,553 (1.4%) | 5,726 (1.7%) |
| 35 to 64 Years | 13,370 (2.8%) | 18,145 (3.6%) |
| 65 to 74 Years | 5,221 (4.7%) | 7,156 (5.4%) |
| 75 Years and over | 4,629 (7.1%) | 9,510 (9.2%) |
Disability Class: Cognitive Difficulty
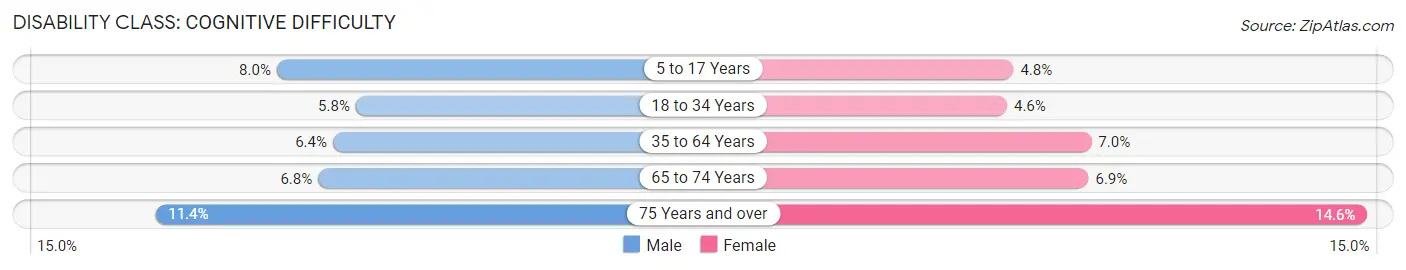
| Age Bracket | Male | Female |
| 5 to 17 Years | 16,630 (8.0%) | 9,547 (4.8%) |
| 18 to 34 Years | 18,805 (5.8%) | 15,578 (4.6%) |
| 35 to 64 Years | 30,543 (6.4%) | 35,423 (7.0%) |
| 65 to 74 Years | 7,552 (6.8%) | 9,166 (6.9%) |
| 75 Years and over | 7,363 (11.4%) | 15,196 (14.6%) |
Disability Class: Ambulatory Difficulty
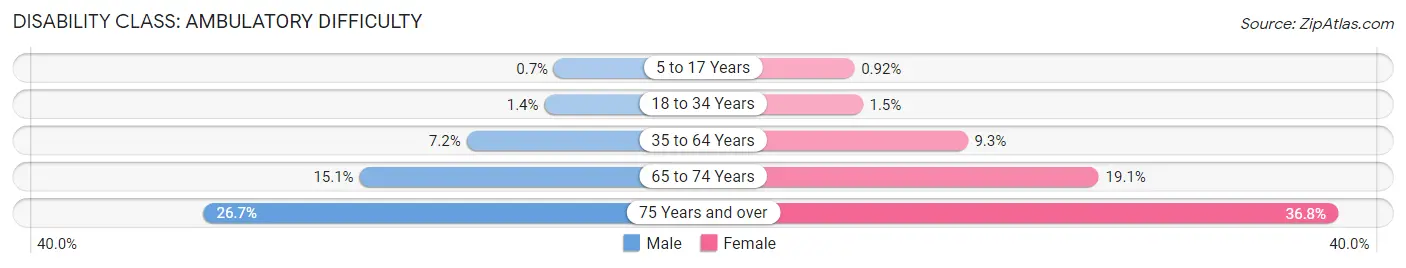
| Age Bracket | Male | Female |
| 5 to 17 Years | 1,459 (0.7%) | 1,834 (0.9%) |
| 18 to 34 Years | 4,580 (1.4%) | 5,210 (1.5%) |
| 35 to 64 Years | 34,232 (7.2%) | 47,599 (9.3%) |
| 65 to 74 Years | 16,732 (15.1%) | 25,460 (19.1%) |
| 75 Years and over | 17,317 (26.7%) | 38,251 (36.8%) |
Disability Class: Self-Care Difficulty
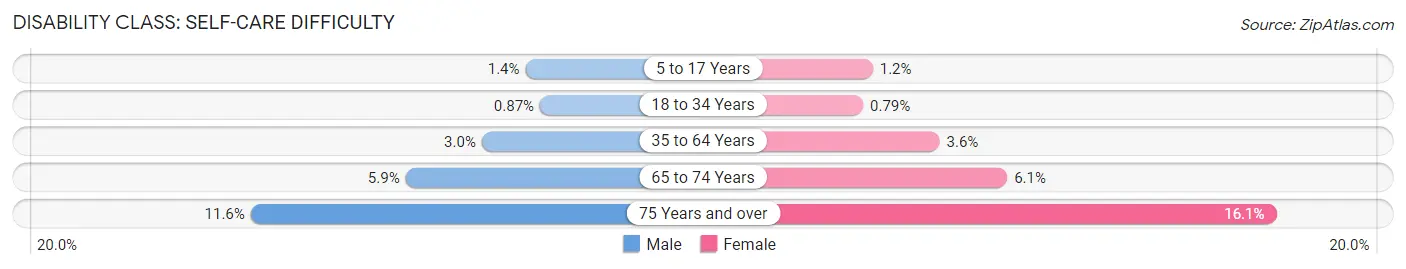
| Age Bracket | Male | Female |
| 5 to 17 Years | 2,929 (1.4%) | 2,293 (1.1%) |
| 18 to 34 Years | 2,837 (0.9%) | 2,687 (0.8%) |
| 35 to 64 Years | 14,426 (3.0%) | 18,515 (3.6%) |
| 65 to 74 Years | 6,473 (5.9%) | 8,194 (6.1%) |
| 75 Years and over | 7,529 (11.6%) | 16,750 (16.1%) |
Technology Access in Area Code 215
Computing Device Access in Area Code 215
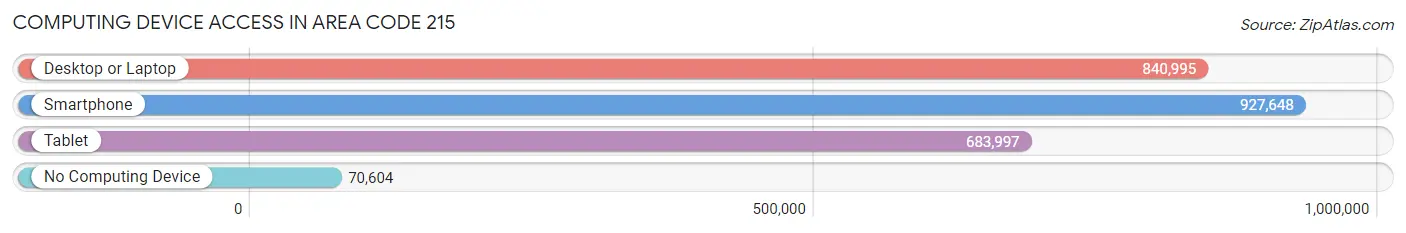
| Device Type | # Households | % Households |
| Desktop or Laptop | 840,995 | 79.1% |
| Smartphone | 927,648 | 87.3% |
| Tablet | 683,997 | 64.4% |
| No Computing Device | 70,604 | 6.6% |
| Total | 1,062,653 | 100.0% |
Internet Access in Area Code 215
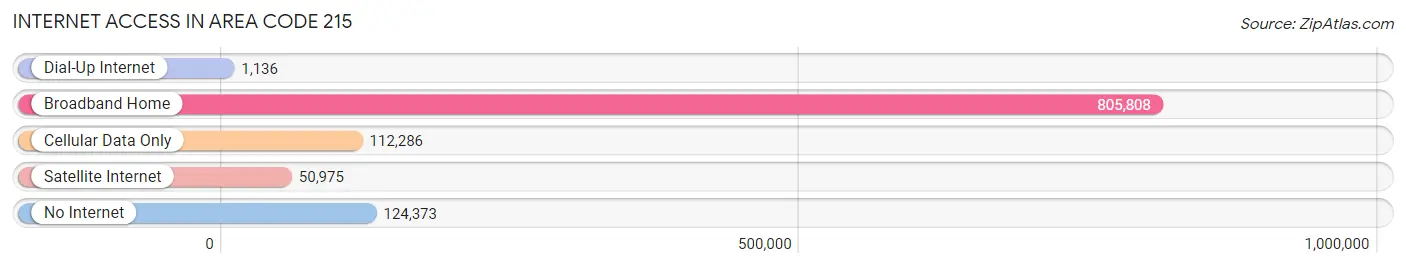
| Internet Type | # Households | % Households |
| Dial-Up Internet | 1,136 | 0.1% |
| Broadband Home | 805,808 | 75.8% |
| Cellular Data Only | 112,286 | 10.6% |
| Satellite Internet | 50,975 | 4.8% |
| No Internet | 124,373 | 11.7% |
| Total | 1,062,653 | 100.0% |
Area Code 215 Summary
Geography
Area code 215 is a telephone area code in the North American Numbering Plan (NANP) for the city of Philadelphia and its surrounding suburbs in southeastern Pennsylvania. It was one of the original area codes established in 1947.
Social
Area code 215 is a major hub for social activity in the Philadelphia area. It is home to many of the city's most popular attractions, including the Philadelphia Museum of Art, the Liberty Bell, and the Philadelphia Zoo. It is also home to a variety of restaurants, bars, and clubs.
Economics
Area code 215 is a major economic center in the Philadelphia region. It is home to many of the city's largest employers, including the University of Pennsylvania, Temple University, and the Philadelphia Stock Exchange. It is also home to a variety of financial institutions, including banks, investment firms, and insurance companies.
Demographics
Area code 215 is home to a diverse population. According to the 2010 census, the population of the area code was 1,567,442, with a median age of 34.7 years. The population is predominantly African American, with a large Hispanic population as well. The area code is also home to a large number of immigrants from around the world.
Common Questions
What is Per Capita Income in Area Code 215?
Per Capita income in Area Code 215 is $51,851.
What is the Median Family Income in Area Code 215?
Median Family Income in Area Code 215 is $115,789.
What is the Median Household income in Area Code 215?
Median Household Income in Area Code 215 is $96,124.
What is Income or Wage Gap in Area Code 215?
Income or Wage Gap in Area Code 215 is 23.5%.
Women in Area Code 215 earn 76.5 cents for every dollar earned by a man.
What is Family Income Deficit in Area Code 215?
Family Income Deficit in Area Code 215 is $11,224.
Families that are below poverty line in Area Code 215 earn $11,224 less on average than the poverty threshold level.
What is Inequality or Gini Index in Area Code 215?
Inequality or Gini Index in Area Code 215 is 47.22.
What is the Total Population of Area Code 215?
Total Population of Area Code 215 is 2,646,610.
What is the Total Male Population of Area Code 215?
Total Male Population of Area Code 215 is 1,275,126.
What is the Total Female Population of Area Code 215?
Total Female Population of Area Code 215 is 1,371,484.
What is the Ratio of Males per 100 Females in Area Code 215?
There are 92.97 Males per 100 Females in Area Code 215.
What is the Ratio of Females per 100 Males in Area Code 215?
There are 107.56 Females per 100 Males in Area Code 215.
What is the Median Population Age in Area Code 215?
Median Population Age in Area Code 215 is 40.7 Years.
What is the Average Family Size in Area Code 215
Average Family Size in Area Code 215 is 3.1 People.
What is the Average Household Size in Area Code 215
Average Household Size in Area Code 215 is 2.5 People.
How Large is the Labor Force in Area Code 215?
There are 1,388,001 People in the Labor Forcein in Area Code 215.
What is the Percentage of People in the Labor Force in Area Code 215?
64.6% of People are in the Labor Force in Area Code 215.
What is the Unemployment Rate in Area Code 215?
Unemployment Rate in Area Code 215 is 6.7%.