Area Code 484 Map & Demographics
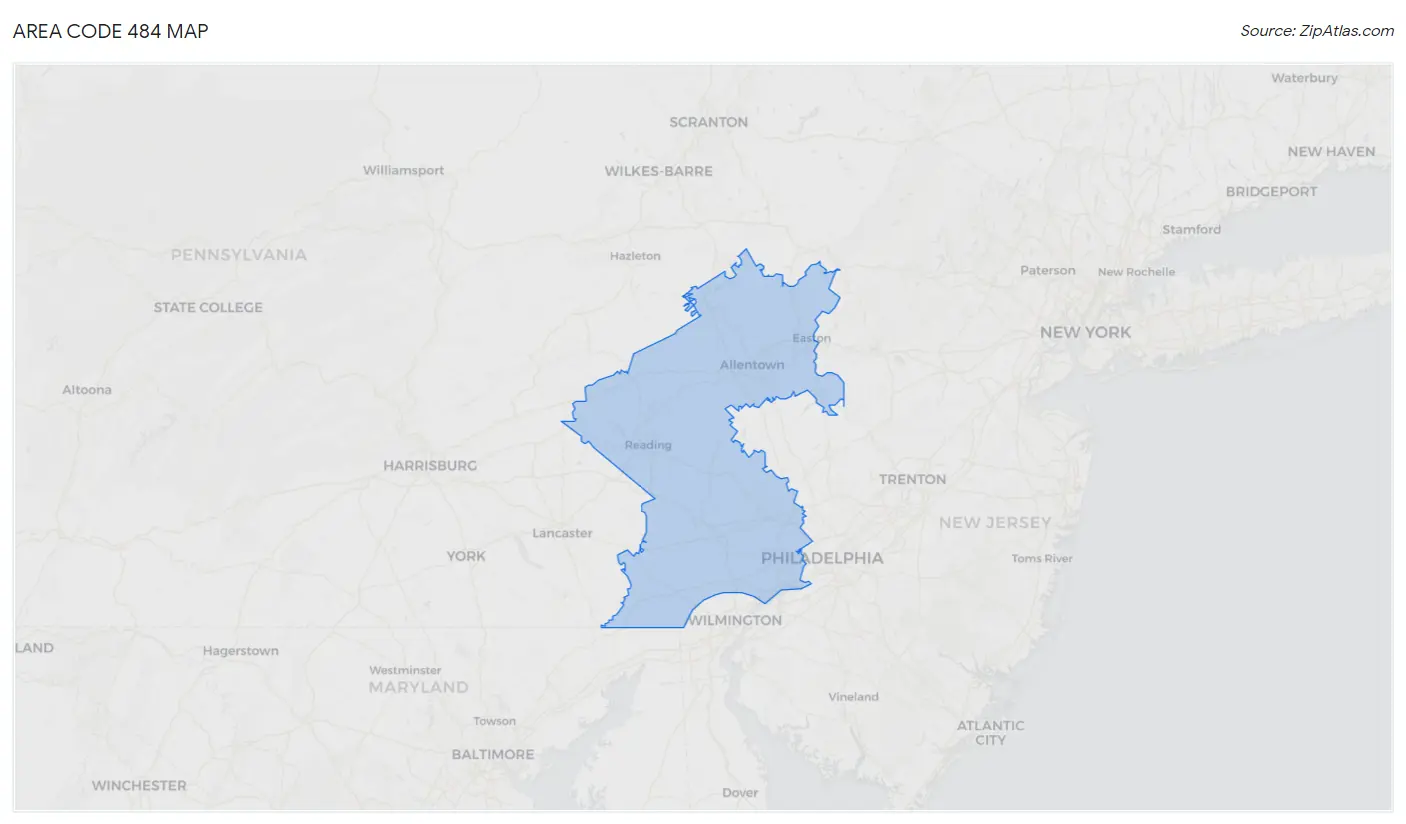
Area Code 484 Map
Area Code 484 Overview
$53,107
PER CAPITA INCOME
$129,502
AVG FAMILY INCOME
$104,913
AVG HOUSEHOLD INCOME
31.0%
WAGE / INCOME GAP [ % ]
69.0¢/ $1
WAGE / INCOME GAP [ $ ]
$11,389
FAMILY INCOME DEFICIT
64.64
INEQUALITY / GINI INDEX
2,442,093
TOTAL POPULATION
1,204,261
MALE POPULATION
1,237,832
FEMALE POPULATION
97.29
MALES / 100 FEMALES
102.79
FEMALES / 100 MALES
41.8
MEDIAN AGE
3.1
AVG FAMILY SIZE
2.5
AVG HOUSEHOLD SIZE
1,329,998
LABOR FORCE [ PEOPLE ]
66.8%
PERCENT IN LABOR FORCE
5.2%
UNEMPLOYMENT RATE
Income in Area Code 484
Income Overview in Area Code 484
Per Capita Income in Area Code 484 is $53,107, while median incomes of families and households are $129,502 and $104,913 respectively.
| Characteristic | Number | Measure |
| Per Capita Income | 2,442,093 | $53,107 |
| Median Family Income | 613,408 | $129,502 |
| Mean Family Income | 613,408 | $24,089,494 |
| Median Household Income | 949,880 | $104,913 |
| Mean Household Income | 949,880 | $20,761,556 |
| Income Deficit | 613,408 | $11,389 |
| Wage / Income Gap (%) | 2,442,093 | 31.04% |
| Wage / Income Gap ($) | 2,442,093 | 68.96¢ per $1 |
| Gini / Inequality Index | 2,442,093 | 64.64 |
Earnings by Sex in Area Code 484
Average Earnings in Area Code 484 are $53,596, $65,141 for men and $45,394 for women, a difference of 30.3%.
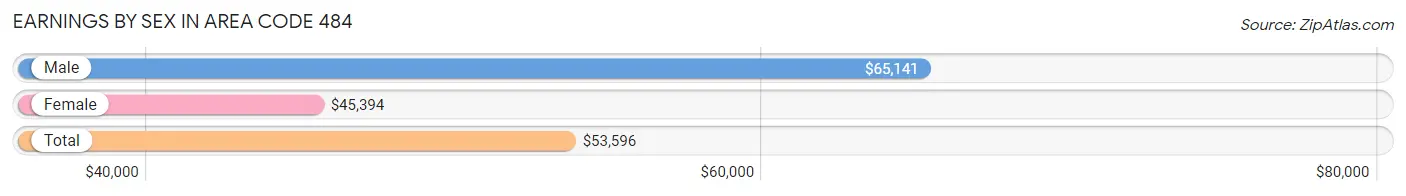
| Sex | Number | Average Earnings |
| Male | 725,248 (52.3%) | $65,141 |
| Female | 660,936 (47.7%) | $45,394 |
| Total | 1,386,184 (100.0%) | $53,596 |
Earnings by Sex by Income Bracket in Area Code 484
The most common earnings brackets in Area Code 484 are $100,000+ for men (202,131 | 27.9%) and $100,000+ for women (96,511 | 14.6%).
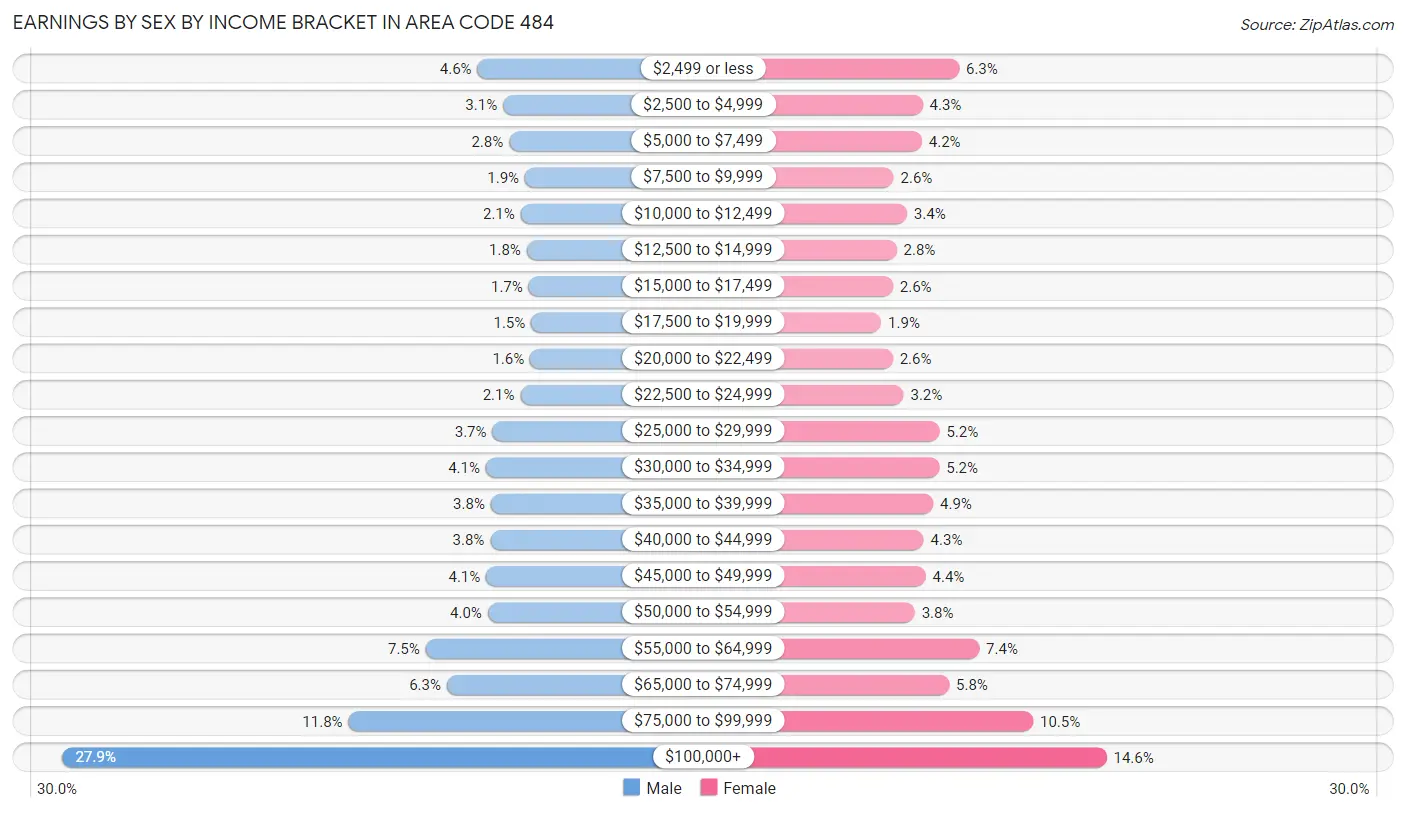
| Income | Male | Female |
| $2,499 or less | 33,022 (4.5%) | 41,699 (6.3%) |
| $2,500 to $4,999 | 22,567 (3.1%) | 28,145 (4.3%) |
| $5,000 to $7,499 | 20,082 (2.8%) | 27,922 (4.2%) |
| $7,500 to $9,999 | 13,663 (1.9%) | 17,386 (2.6%) |
| $10,000 to $12,499 | 15,386 (2.1%) | 22,355 (3.4%) |
| $12,500 to $14,999 | 12,883 (1.8%) | 18,506 (2.8%) |
| $15,000 to $17,499 | 12,142 (1.7%) | 17,097 (2.6%) |
| $17,500 to $19,999 | 11,128 (1.5%) | 12,729 (1.9%) |
| $20,000 to $22,499 | 11,561 (1.6%) | 17,074 (2.6%) |
| $22,500 to $24,999 | 15,515 (2.1%) | 21,110 (3.2%) |
| $25,000 to $29,999 | 26,876 (3.7%) | 34,448 (5.2%) |
| $30,000 to $34,999 | 29,590 (4.1%) | 34,368 (5.2%) |
| $35,000 to $39,999 | 27,576 (3.8%) | 32,058 (4.9%) |
| $40,000 to $44,999 | 27,761 (3.8%) | 28,576 (4.3%) |
| $45,000 to $49,999 | 29,479 (4.1%) | 29,282 (4.4%) |
| $50,000 to $54,999 | 28,778 (4.0%) | 25,271 (3.8%) |
| $55,000 to $64,999 | 54,104 (7.5%) | 49,180 (7.4%) |
| $65,000 to $74,999 | 45,447 (6.3%) | 37,991 (5.8%) |
| $75,000 to $99,999 | 85,557 (11.8%) | 69,228 (10.5%) |
| $100,000+ | 202,131 (27.9%) | 96,511 (14.6%) |
| Total | 725,248 (100.0%) | 660,936 (100.0%) |
Earnings by Sex by Educational Attainment in Area Code 484
Average earnings in Area Code 484 are $10,912,161 for men and $7,528,876 for women, a difference of 31.0%. Men with an educational attainment of graduate degree enjoy the highest average annual earnings of $14,284,183, while those with less than high school education earn the least with $3,912,944. Women with an educational attainment of graduate degree earn the most with the average annual earnings of $10,979,858, while those with less than high school education have the smallest earnings of $1,498,601.
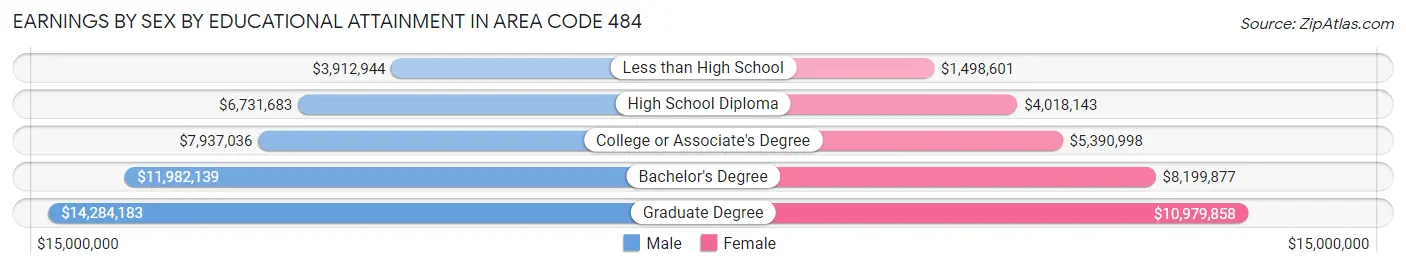
| Educational Attainment | Male Income | Female Income |
| Less than High School | $3,912,944 | $1,498,601 |
| High School Diploma | $6,731,683 | $4,018,143 |
| College or Associate's Degree | $7,937,036 | $5,390,998 |
| Bachelor's Degree | $11,982,139 | $8,199,877 |
| Graduate Degree | $14,284,183 | $10,979,858 |
| Total | $10,912,161 | $7,528,876 |
Family Income in Area Code 484
Family Income Brackets in Area Code 484
According to the Area Code 484 family income data, there are 23,284,968 families falling into the $200,000+ income range, which is the most common income bracket and makes up 3,796.0% of all families. Conversely, the $10,000 to $14,999 income bracket is the least frequent group with only 1,114,562 families (181.7%) belonging to this category.
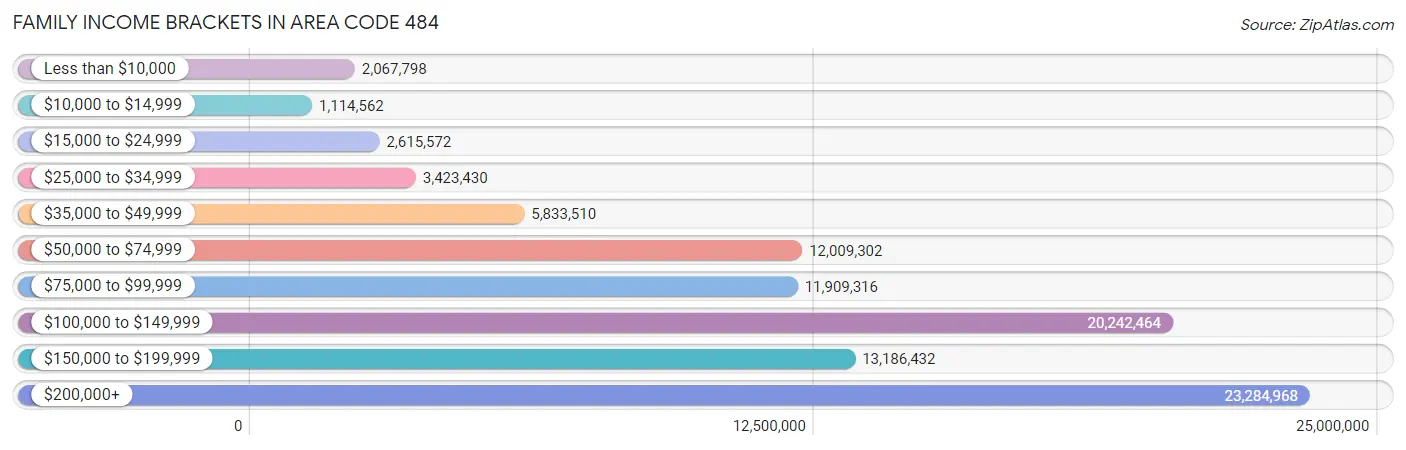
| Income Bracket | # Families | % Families |
| Less than $10,000 | 2,067,798 | 337.1% |
| $10,000 to $14,999 | 1,114,562 | 181.7% |
| $15,000 to $24,999 | 2,615,572 | 426.4% |
| $25,000 to $34,999 | 3,423,430 | 558.1% |
| $35,000 to $49,999 | 5,833,510 | 951.0% |
| $50,000 to $74,999 | 12,009,302 | 1,957.8% |
| $75,000 to $99,999 | 11,909,316 | 1,941.5% |
| $100,000 to $149,999 | 20,242,464 | 3,300.0% |
| $150,000 to $199,999 | 13,186,432 | 2,149.7% |
| $200,000+ | 23,284,968 | 3,796.0% |
Family Income by Famaliy Size in Area Code 484
6-person families (16,265 | 2.6%) account for the highest median family income in Area Code 484 with $165,895 per family, while 2-person families (284,018 | 46.3%) have the highest median income of $53,575 per family member.
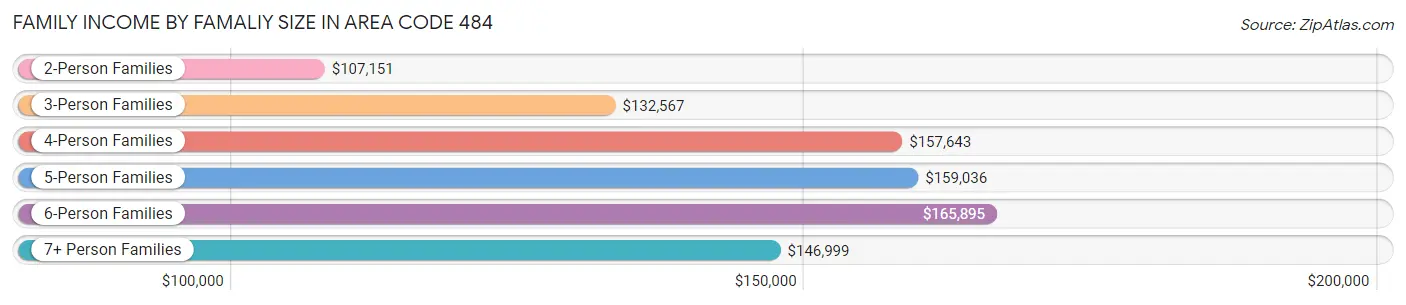
| Income Bracket | # Families | Median Income |
| 2-Person Families | 284,018 (46.3%) | $107,151 |
| 3-Person Families | 137,504 (22.4%) | $132,567 |
| 4-Person Families | 118,813 (19.4%) | $157,643 |
| 5-Person Families | 49,097 (8.0%) | $159,036 |
| 6-Person Families | 16,265 (2.6%) | $165,895 |
| 7+ Person Families | 7,711 (1.3%) | $146,999 |
| Total | 613,408 (100.0%) | $129,502 |
Family Income by Number of Earners in Area Code 484
The median family income in Area Code 484 is $129,502, with families comprising 3+ earners (84,443) having the highest median family income of $175,037, while families with no earners (78,898) have the lowest median family income of $64,730, accounting for 13.8% and 12.9% of families, respectively.
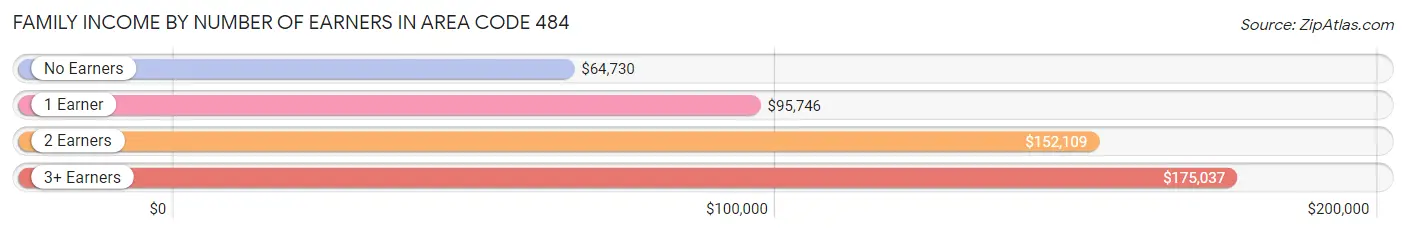
| Number of Earners | # Families | Median Income |
| No Earners | 78,898 (12.9%) | $64,730 |
| 1 Earner | 175,281 (28.6%) | $95,746 |
| 2 Earners | 274,786 (44.8%) | $152,109 |
| 3+ Earners | 84,443 (13.8%) | $175,037 |
| Total | 613,408 (100.0%) | $129,502 |
Household Income in Area Code 484
Household Income Brackets in Area Code 484
With 28,056,606 households falling in the category, the $200,000+ income range is the most frequent in Area Code 484, accounting for 2,953.7% of all households. In contrast, only 3,331,229 households (350.7%) fall into the $10,000 to $14,999 income bracket, making it the least populous group.
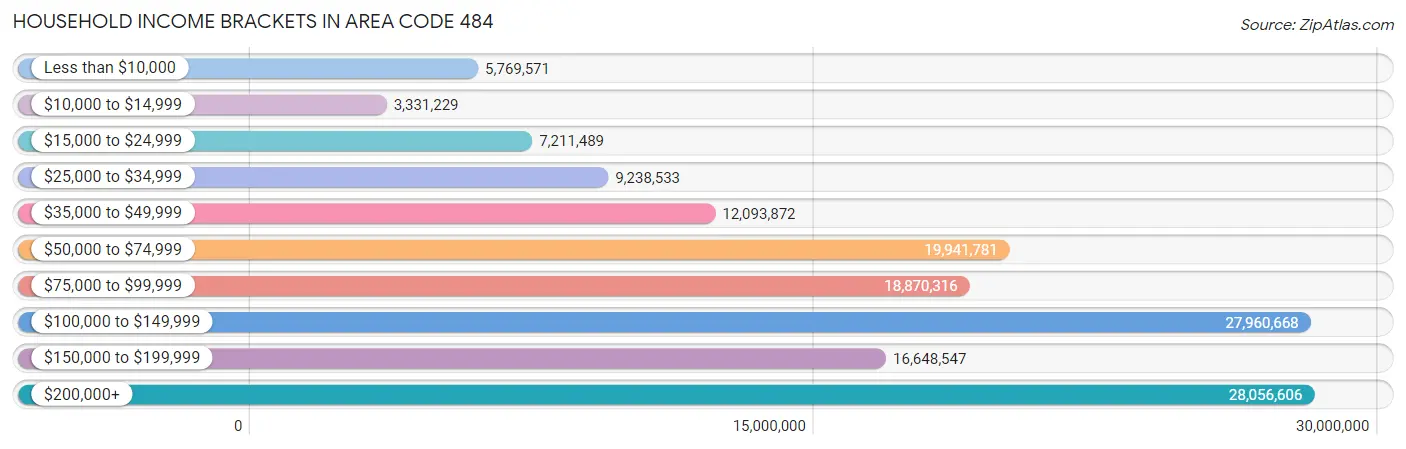
| Income Bracket | # Households | % Households |
| Less than $10,000 | 5,769,571 | 607.4% |
| $10,000 to $14,999 | 3,331,229 | 350.7% |
| $15,000 to $24,999 | 7,211,489 | 759.2% |
| $25,000 to $34,999 | 9,238,533 | 972.6% |
| $35,000 to $49,999 | 12,093,872 | 1,273.2% |
| $50,000 to $74,999 | 19,941,781 | 2,099.4% |
| $75,000 to $99,999 | 18,870,316 | 1,986.6% |
| $100,000 to $149,999 | 27,960,668 | 2,943.6% |
| $150,000 to $199,999 | 16,648,547 | 1,752.7% |
| $200,000+ | 28,056,606 | 2,953.7% |
Household Income by Householder Age in Area Code 484
The median household income in Area Code 484 is $104,913, with the highest median household income of $130,832 found in the 45 to 64 years age bracket for the primary householder. A total of 356,610 households (37.5%) fall into this category. Meanwhile, the 15 to 24 years age bracket for the primary householder has the lowest median household income of $58,510, with 26,217 households (2.8%) in this group.
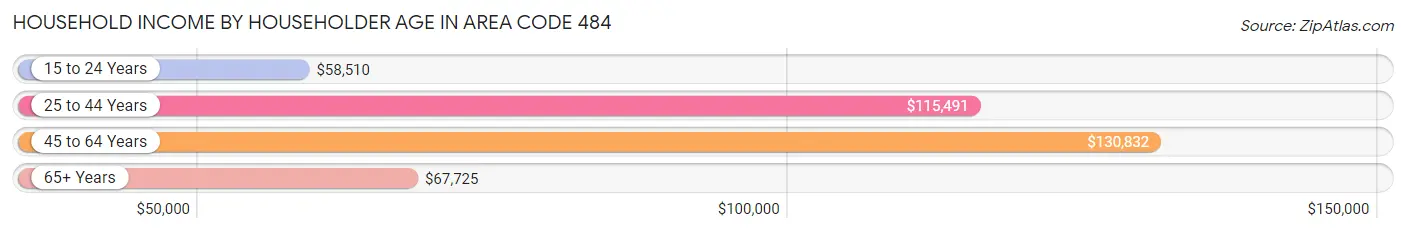
| Income Bracket | # Households | Median Income |
| 15 to 24 Years | 26,217 (2.8%) | $58,510 |
| 25 to 44 Years | 307,791 (32.4%) | $115,491 |
| 45 to 64 Years | 356,610 (37.5%) | $130,832 |
| 65+ Years | 259,262 (27.3%) | $67,725 |
| Total | 949,880 (100.0%) | $104,913 |
Poverty in Area Code 484
Income Below Poverty by Sex and Age in Area Code 484
With 8.6% poverty level for males and 10.0% for females among the residents of Area Code 484, under 5 year old males and 18 to 24 year old females are the most vulnerable to poverty, with 10,068 males (15.1%) and 14,368 females (15.7%) in their respective age groups living below the poverty level.
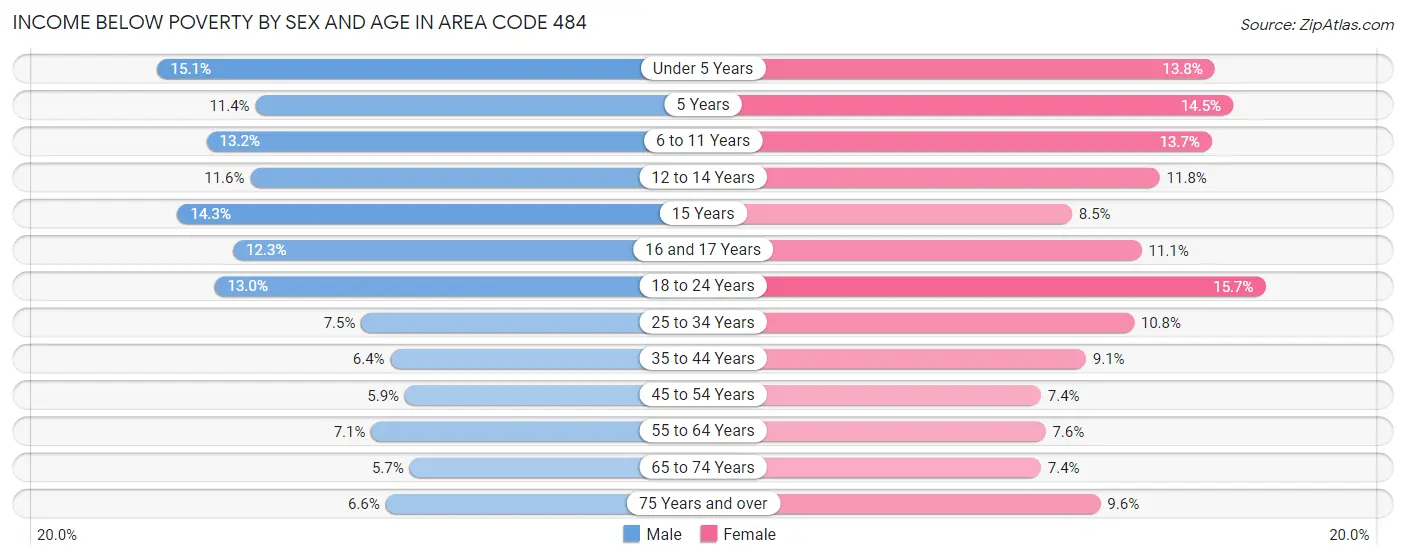
| Age Bracket | Male | Female |
| Under 5 Years | 10,068 (15.1%) | 8,675 (13.8%) |
| 5 Years | 1,539 (11.4%) | 1,935 (14.5%) |
| 6 to 11 Years | 11,307 (13.2%) | 11,055 (13.7%) |
| 12 to 14 Years | 5,455 (11.6%) | 5,178 (11.8%) |
| 15 Years | 2,385 (14.3%) | 1,351 (8.5%) |
| 16 and 17 Years | 3,646 (12.3%) | 3,274 (11.1%) |
| 18 to 24 Years | 12,441 (13.0%) | 14,368 (15.7%) |
| 25 to 34 Years | 12,413 (7.5%) | 17,614 (10.8%) |
| 35 to 44 Years | 9,823 (6.4%) | 13,931 (9.1%) |
| 45 to 54 Years | 8,892 (5.9%) | 11,130 (7.4%) |
| 55 to 64 Years | 11,420 (7.1%) | 12,687 (7.6%) |
| 65 to 74 Years | 6,424 (5.7%) | 9,285 (7.4%) |
| 75 Years and over | 4,508 (6.6%) | 9,707 (9.6%) |
| Total | 100,321 (8.6%) | 120,190 (10.0%) |
Income Above Poverty by Sex and Age in Area Code 484
According to the poverty statistics in Area Code 484, males aged 65 to 74 years and females aged 45 to 54 years are the age groups that are most secure financially, with 94.3% of males and 92.6% of females in these age groups living above the poverty line.
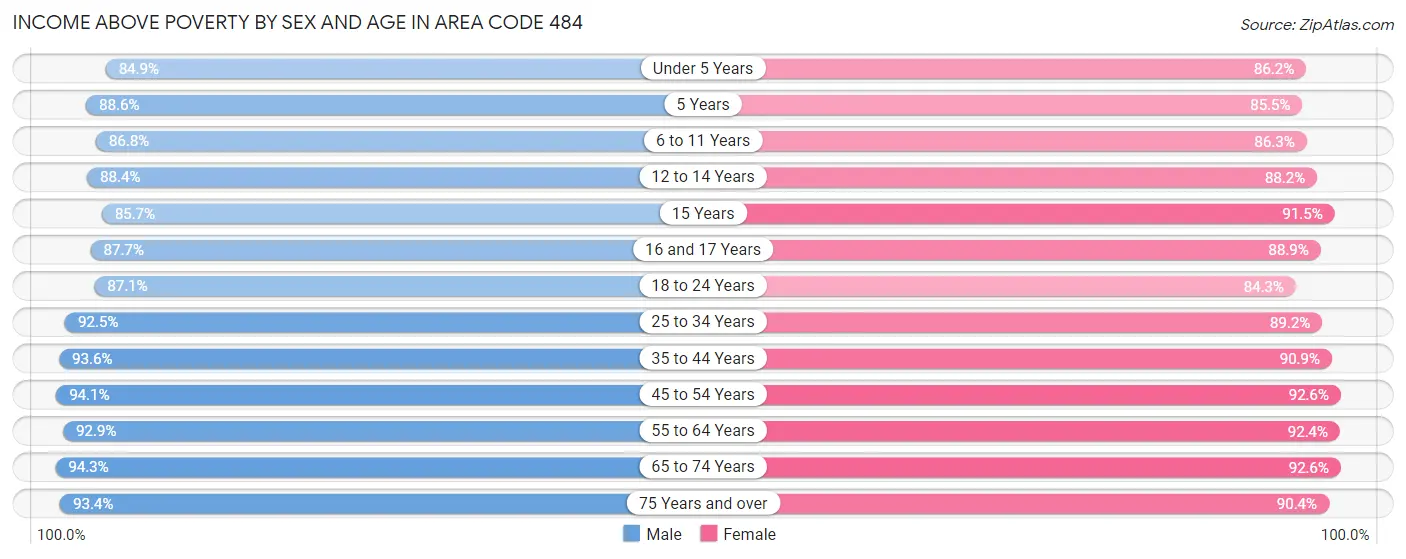
| Age Bracket | Male | Female |
| Under 5 Years | 56,787 (84.9%) | 53,991 (86.2%) |
| 5 Years | 11,931 (88.6%) | 11,390 (85.5%) |
| 6 to 11 Years | 74,066 (86.8%) | 69,474 (86.3%) |
| 12 to 14 Years | 41,488 (88.4%) | 38,698 (88.2%) |
| 15 Years | 14,265 (85.7%) | 14,476 (91.5%) |
| 16 and 17 Years | 26,089 (87.7%) | 26,131 (88.9%) |
| 18 to 24 Years | 83,638 (87.1%) | 77,033 (84.3%) |
| 25 to 34 Years | 153,202 (92.5%) | 144,835 (89.2%) |
| 35 to 44 Years | 143,206 (93.6%) | 139,748 (90.9%) |
| 45 to 54 Years | 142,217 (94.1%) | 139,470 (92.6%) |
| 55 to 64 Years | 148,689 (92.9%) | 155,042 (92.4%) |
| 65 to 74 Years | 106,041 (94.3%) | 116,341 (92.6%) |
| 75 Years and over | 63,824 (93.4%) | 91,394 (90.4%) |
| Total | 1,065,443 (91.4%) | 1,078,023 (90.0%) |
Income Below Poverty Among Married-Couple Families in Area Code 484
The poverty statistics for married-couple families in Area Code 484 show that 2.8% or 13,135 of the total 468,253 families live below the poverty line. Families with 5 or more children have the highest poverty rate of 20.7%, comprising of 546 families. On the other hand, families with no children have the lowest poverty rate of 2.4%, which includes 6,557 families.
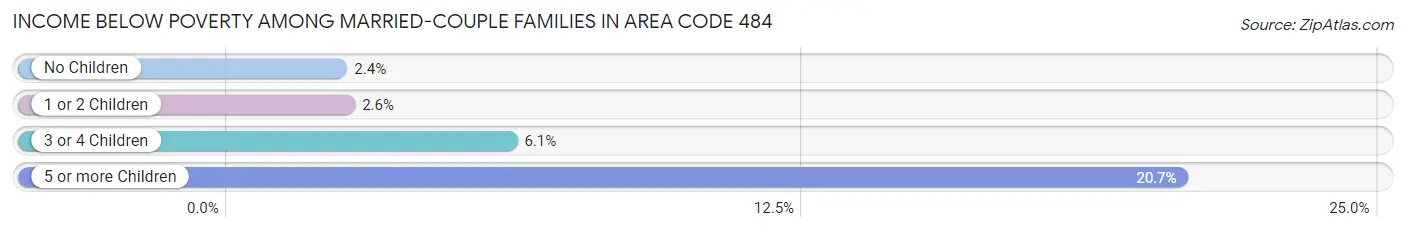
| Children | Above Poverty | Below Poverty |
| No Children | 269,521 (97.6%) | 6,557 (2.4%) |
| 1 or 2 Children | 151,785 (97.5%) | 3,979 (2.5%) |
| 3 or 4 Children | 31,718 (93.9%) | 2,053 (6.1%) |
| 5 or more Children | 2,094 (79.3%) | 546 (20.7%) |
| Total | 455,118 (97.2%) | 13,135 (2.8%) |
Income Below Poverty Among Single-Parent Households in Area Code 484
According to the poverty data in Area Code 484, 9.1% or 3,672 single-father households and 20.9% or 21,948 single-mother households are living below the poverty line. Among single-father households, those with 5 or more children have the highest poverty rate, with 64 households (36.0%) experiencing poverty. Likewise, among single-mother households, those with 5 or more children have the highest poverty rate, with 803 households (80.9%) falling below the poverty line.
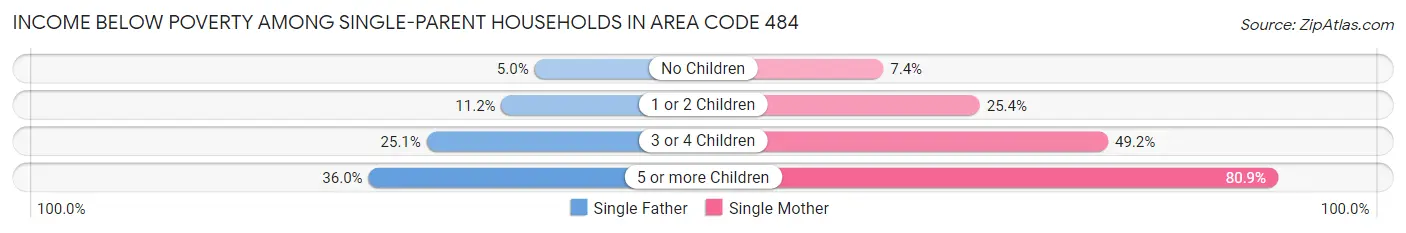
| Children | Single Father | Single Mother |
| No Children | 1,008 (5.0%) | 3,101 (7.4%) |
| 1 or 2 Children | 1,964 (11.2%) | 13,211 (25.4%) |
| 3 or 4 Children | 636 (25.1%) | 4,833 (49.2%) |
| 5 or more Children | 64 (36.0%) | 803 (80.9%) |
| Total | 3,672 (9.1%) | 21,948 (20.9%) |
Income Below Poverty Among Married-Couple vs Single-Parent Households in Area Code 484
The poverty data for Area Code 484 shows that 13,135 of the married-couple family households (2.8%) and 25,620 of the single-parent households (17.6%) are living below the poverty level. Within the married-couple family households, those with 5 or more children have the highest poverty rate, with 546 households (20.7%) falling below the poverty line. Among the single-parent households, those with 5 or more children have the highest poverty rate, with 867 household (74.0%) living below poverty.
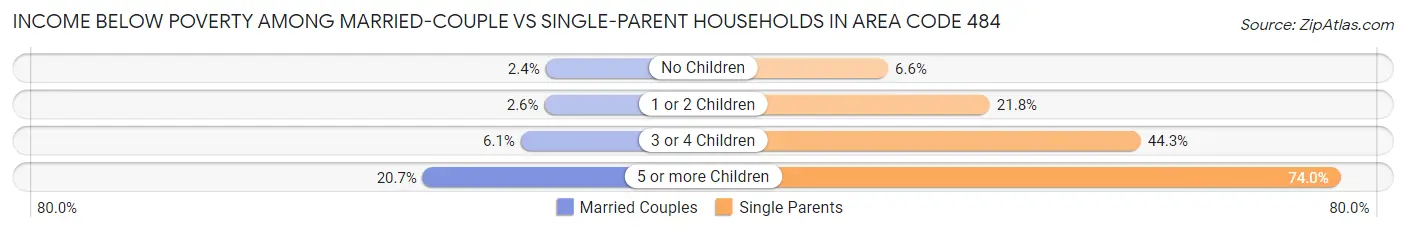
| Children | Married-Couple Families | Single-Parent Households |
| No Children | 6,557 (2.4%) | 4,109 (6.6%) |
| 1 or 2 Children | 3,979 (2.5%) | 15,175 (21.8%) |
| 3 or 4 Children | 2,053 (6.1%) | 5,469 (44.3%) |
| 5 or more Children | 546 (20.7%) | 867 (74.0%) |
| Total | 13,135 (2.8%) | 25,620 (17.6%) |
Race in Area Code 484
The most populous races in Area Code 484 are White / Caucasian (1,788,460 | 73.2%), Hispanic or Latino (286,922 | 11.7%), and Black / African American (249,975 | 10.2%).
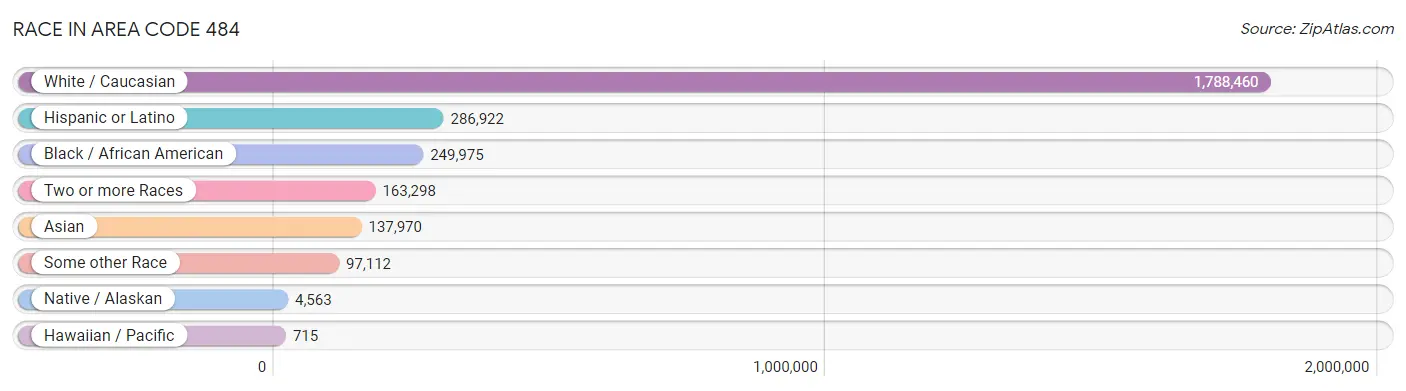
| Race | # Population | % Population |
| Asian | 137,970 | 5.7% |
| Black / African American | 249,975 | 10.2% |
| Hawaiian / Pacific | 715 | 0.0% |
| Hispanic or Latino | 286,922 | 11.7% |
| Native / Alaskan | 4,563 | 0.2% |
| White / Caucasian | 1,788,460 | 73.2% |
| Two or more Races | 163,298 | 6.7% |
| Some other Race | 97,112 | 4.0% |
| Total | 2,442,093 | 100.0% |
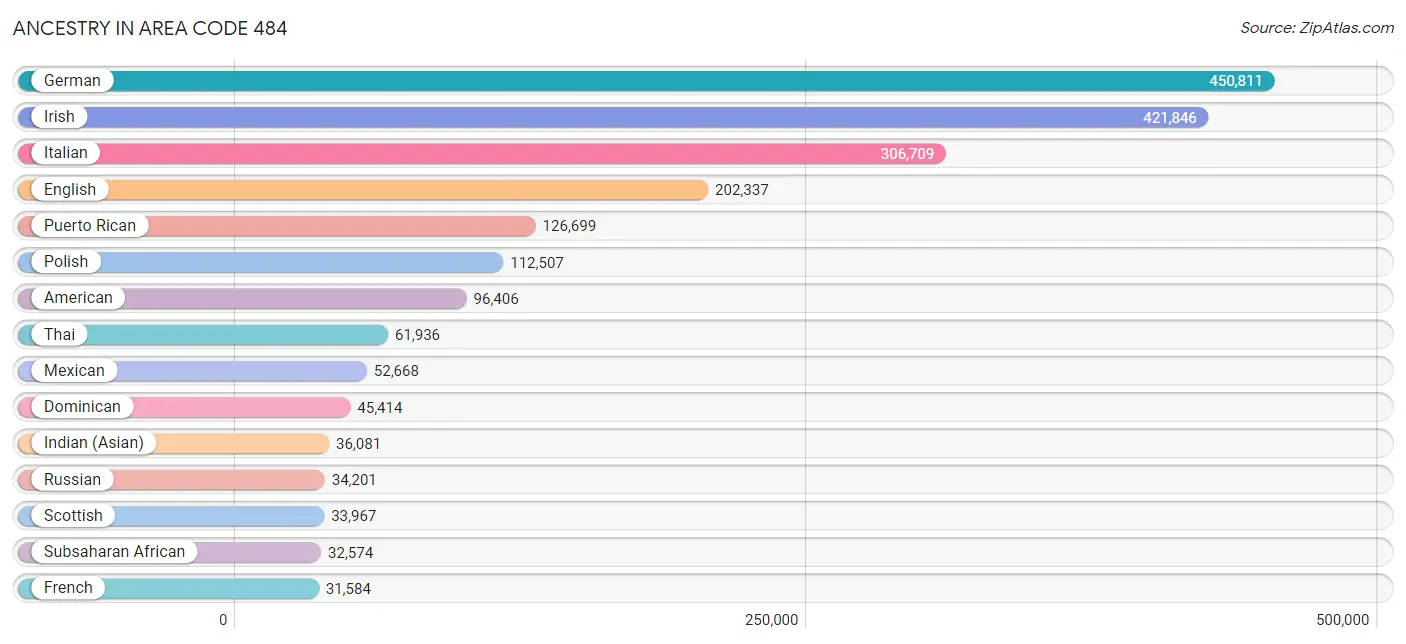
Ancestry in Area Code 484
The most populous ancestries reported in Area Code 484 are German (450,811 | 18.5%), Irish (421,846 | 17.3%), Italian (306,709 | 12.6%), English (202,337 | 8.3%), and Puerto Rican (126,699 | 5.2%), together accounting for 61.8% of all Area Code 484 residents.
| Ancestry | # Population | % Population |
| Afghan | 520 | 0.0% |
| African | 15,930 | 0.6% |
| Alaska Native | 74 | 0.0% |
| Alaskan Athabascan | 30 | 0.0% |
| Albanian | 2,043 | 0.1% |
| Aleut | 21 | 0.0% |
| Alsatian | 223 | 0.0% |
| American | 96,406 | 4.0% |
| Apache | 264 | 0.0% |
| Arab | 21,926 | 0.9% |
| Arapaho | 2 | 0.0% |
| Argentinean | 1,773 | 0.1% |
| Armenian | 4,468 | 0.2% |
| Assyrian / Chaldean / Syriac | 27 | 0.0% |
| Australian | 729 | 0.0% |
| Austrian | 13,048 | 0.5% |
| Bahamian | 151 | 0.0% |
| Bangladeshi | 16 | 0.0% |
| Barbadian | 506 | 0.0% |
| Basque | 104 | 0.0% |
| Belgian | 1,579 | 0.1% |
| Belizean | 67 | 0.0% |
| Bermudan | 22 | 0.0% |
| Bhutanese | 4,751 | 0.2% |
| Blackfeet | 613 | 0.0% |
| Bolivian | 313 | 0.0% |
| Brazilian | 2,042 | 0.1% |
| British | 12,913 | 0.5% |
| British West Indian | 631 | 0.0% |
| Bulgarian | 847 | 0.0% |
| Burmese | 15,460 | 0.6% |
| Cajun | 200 | 0.0% |
| Cambodian | 115 | 0.0% |
| Canadian | 4,087 | 0.2% |
| Cape Verdean | 236 | 0.0% |
| Carpatho Rusyn | 386 | 0.0% |
| Celtic | 250 | 0.0% |
| Central American | 16,409 | 0.7% |
| Central American Indian | 4,268 | 0.2% |
| Cherokee | 3,429 | 0.1% |
| Cheyenne | 37 | 0.0% |
| Chickasaw | 18 | 0.0% |
| Chilean | 1,494 | 0.1% |
| Chinese | 55 | 0.0% |
| Chippewa | 158 | 0.0% |
| Choctaw | 36 | 0.0% |
| Colombian | 7,475 | 0.3% |
| Comanche | 46 | 0.0% |
| Costa Rican | 1,386 | 0.1% |
| Cree | 3 | 0.0% |
| Creek | 97 | 0.0% |
| Croatian | 2,157 | 0.1% |
| Crow | 27 | 0.0% |
| Cuban | 6,708 | 0.3% |
| Cypriot | 63 | 0.0% |
| Czech | 6,693 | 0.3% |
| Czechoslovakian | 2,796 | 0.1% |
| Danish | 3,724 | 0.2% |
| Delaware | 511 | 0.0% |
| Dominican | 45,414 | 1.9% |
| Dutch | 24,931 | 1.0% |
| Dutch West Indian | 19 | 0.0% |
| Eastern European | 14,280 | 0.6% |
| Ecuadorian | 7,082 | 0.3% |
| Egyptian | 3,679 | 0.2% |
| English | 202,337 | 8.3% |
| Estonian | 177 | 0.0% |
| Ethiopian | 1,407 | 0.1% |
| European | 30,890 | 1.3% |
| Filipino | 2,322 | 0.1% |
| Finnish | 1,635 | 0.1% |
| French | 31,584 | 1.3% |
| French American Indian | 163 | 0.0% |
| French Canadian | 5,321 | 0.2% |
| German | 450,811 | 18.5% |
| German Russian | 94 | 0.0% |
| Ghanaian | 1,369 | 0.1% |
| Greek | 16,231 | 0.7% |
| Guamanian / Chamorro | 284 | 0.0% |
| Guatemalan | 4,470 | 0.2% |
| Guyanese | 683 | 0.0% |
| Haitian | 5,673 | 0.2% |
| Honduran | 4,355 | 0.2% |
| Hopi | 6 | 0.0% |
| Hungarian | 23,117 | 0.9% |
| Icelander | 147 | 0.0% |
| Indian (Asian) | 36,081 | 1.5% |
| Indonesian | 197 | 0.0% |
| Inupiat | 28 | 0.0% |
| Iranian | 1,872 | 0.1% |
| Iraqi | 452 | 0.0% |
| Irish | 421,846 | 17.3% |
| Iroquois | 571 | 0.0% |
| Israeli | 1,148 | 0.1% |
| Italian | 306,709 | 12.6% |
| Jamaican | 9,822 | 0.4% |
| Japanese | 3,008 | 0.1% |
| Jordanian | 799 | 0.0% |
| Kenyan | 886 | 0.0% |
| Kiowa | 3 | 0.0% |
| Korean | 13,081 | 0.5% |
| Laotian | 632 | 0.0% |
| Latvian | 963 | 0.0% |
| Lebanese | 4,927 | 0.2% |
| Liberian | 3,562 | 0.2% |
| Lithuanian | 11,438 | 0.5% |
| Lumbee | 99 | 0.0% |
| Luxembourger | 179 | 0.0% |
| Macedonian | 160 | 0.0% |
| Malaysian | 822 | 0.0% |
| Maltese | 305 | 0.0% |
| Mexican | 52,668 | 2.2% |
| Mexican American Indian | 1,201 | 0.1% |
| Mongolian | 269 | 0.0% |
| Moroccan | 1,354 | 0.1% |
| Native Hawaiian | 1,179 | 0.1% |
| Navajo | 187 | 0.0% |
| New Zealander | 209 | 0.0% |
| Nicaraguan | 882 | 0.0% |
| Nigerian | 3,371 | 0.1% |
| Northern European | 2,760 | 0.1% |
| Norwegian | 10,014 | 0.4% |
| Okinawan | 202 | 0.0% |
| Ottawa | 7 | 0.0% |
| Paiute | 33 | 0.0% |
| Pakistani | 1,378 | 0.1% |
| Palestinian | 479 | 0.0% |
| Panamanian | 1,100 | 0.1% |
| Paraguayan | 276 | 0.0% |
| Pennsylvania German | 30,108 | 1.2% |
| Peruvian | 3,542 | 0.2% |
| Pima | 69 | 0.0% |
| Polish | 112,507 | 4.6% |
| Portuguese | 6,143 | 0.3% |
| Potawatomi | 102 | 0.0% |
| Pueblo | 17 | 0.0% |
| Puerto Rican | 126,699 | 5.2% |
| Romanian | 4,020 | 0.2% |
| Russian | 34,201 | 1.4% |
| Salvadoran | 4,125 | 0.2% |
| Samoan | 37 | 0.0% |
| Scandinavian | 3,520 | 0.1% |
| Scotch-Irish | 16,086 | 0.7% |
| Scottish | 33,967 | 1.4% |
| Seminole | 163 | 0.0% |
| Senegalese | 192 | 0.0% |
| Serbian | 1,262 | 0.1% |
| Shoshone | 7 | 0.0% |
| Sierra Leonean | 1,008 | 0.0% |
| Sioux | 361 | 0.0% |
| Slavic | 1,610 | 0.1% |
| Slovak | 20,863 | 0.9% |
| Slovene | 1,219 | 0.1% |
| Somali | 206 | 0.0% |
| South African | 622 | 0.0% |
| South American | 24,685 | 1.0% |
| South American Indian | 346 | 0.0% |
| Soviet Union | 55 | 0.0% |
| Spaniard | 3,731 | 0.2% |
| Spanish | 3,036 | 0.1% |
| Spanish American | 87 | 0.0% |
| Spanish American Indian | 18 | 0.0% |
| Sri Lankan | 12,139 | 0.5% |
| Subsaharan African | 32,574 | 1.3% |
| Sudanese | 116 | 0.0% |
| Swedish | 13,954 | 0.6% |
| Swiss | 9,672 | 0.4% |
| Syrian | 6,585 | 0.3% |
| Thai | 61,936 | 2.5% |
| Tlingit-Haida | 9 | 0.0% |
| Tongan | 145 | 0.0% |
| Trinidadian and Tobagonian | 2,048 | 0.1% |
| Turkish | 2,258 | 0.1% |
| U.S. Virgin Islander | 155 | 0.0% |
| Ugandan | 240 | 0.0% |
| Ukrainian | 20,919 | 0.9% |
| Uruguayan | 514 | 0.0% |
| Ute | 20 | 0.0% |
| Venezuelan | 1,639 | 0.1% |
| Vietnamese | 2,877 | 0.1% |
| Welsh | 25,704 | 1.1% |
| West Indian | 1,393 | 0.1% |
| Yaqui | 29 | 0.0% |
| Yugoslavian | 1,028 | 0.0% |
| Zimbabwean | 39 | 0.0% | View All 185 Rows |
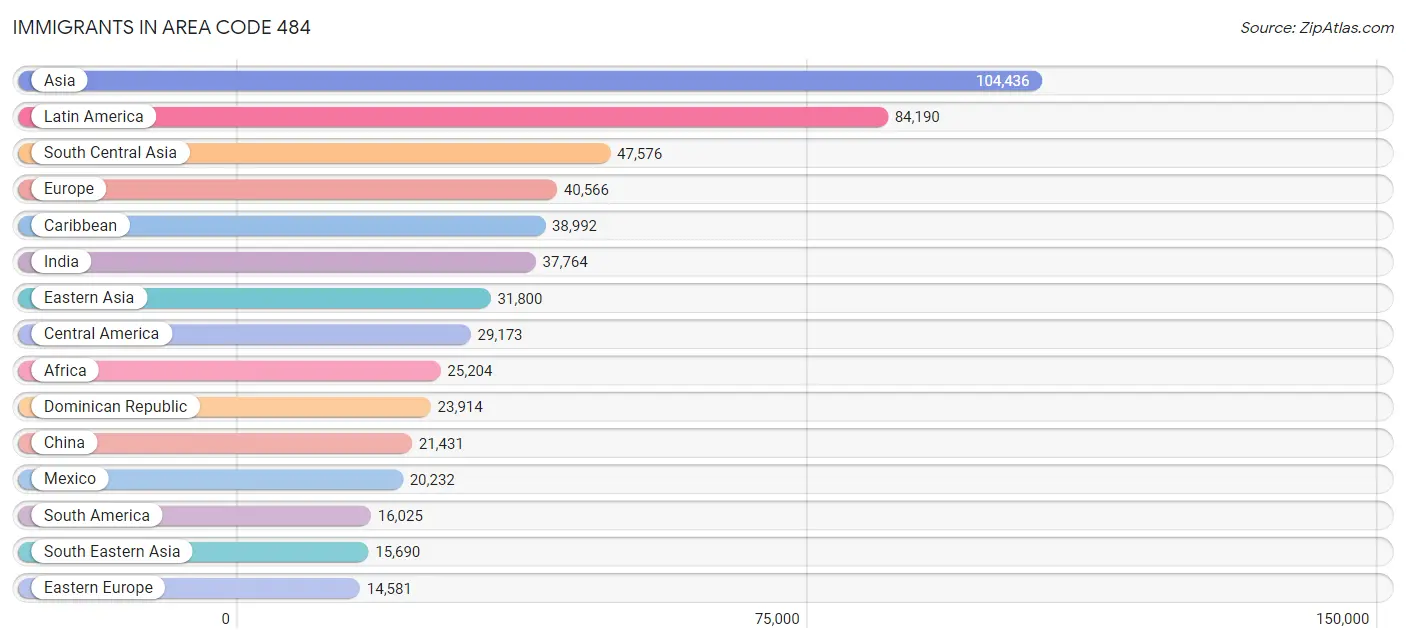
Immigrants in Area Code 484
The most numerous immigrant groups reported in Area Code 484 came from Asia (104,436 | 4.3%), Latin America (84,190 | 3.5%), South Central Asia (47,576 | 1.9%), Europe (40,566 | 1.7%), and Caribbean (38,992 | 1.6%), together accounting for 12.9% of all Area Code 484 residents.
| Immigration Origin | # Population | % Population |
| Afghanistan | 315 | 0.0% |
| Africa | 25,204 | 1.0% |
| Albania | 1,158 | 0.1% |
| Argentina | 1,108 | 0.1% |
| Armenia | 241 | 0.0% |
| Asia | 104,436 | 4.3% |
| Australia | 765 | 0.0% |
| Austria | 264 | 0.0% |
| Azores | 188 | 0.0% |
| Bahamas | 128 | 0.0% |
| Bangladesh | 3,376 | 0.1% |
| Barbados | 332 | 0.0% |
| Belarus | 523 | 0.0% |
| Belgium | 180 | 0.0% |
| Belize | 17 | 0.0% |
| Bolivia | 154 | 0.0% |
| Bosnia and Herzegovina | 154 | 0.0% |
| Brazil | 2,231 | 0.1% |
| Bulgaria | 603 | 0.0% |
| Cabo Verde | 21 | 0.0% |
| Cambodia | 1,508 | 0.1% |
| Cameroon | 616 | 0.0% |
| Canada | 5,052 | 0.2% |
| Caribbean | 38,992 | 1.6% |
| Central America | 29,173 | 1.2% |
| Chile | 861 | 0.0% |
| China | 21,431 | 0.9% |
| Colombia | 3,973 | 0.2% |
| Congo | 16 | 0.0% |
| Costa Rica | 565 | 0.0% |
| Croatia | 199 | 0.0% |
| Cuba | 1,039 | 0.0% |
| Czechoslovakia | 414 | 0.0% |
| Denmark | 161 | 0.0% |
| Dominica | 1,163 | 0.1% |
| Dominican Republic | 23,914 | 1.0% |
| Eastern Africa | 3,803 | 0.2% |
| Eastern Asia | 31,800 | 1.3% |
| Eastern Europe | 14,581 | 0.6% |
| Ecuador | 3,481 | 0.1% |
| Egypt | 2,145 | 0.1% |
| El Salvador | 1,879 | 0.1% |
| England | 3,223 | 0.1% |
| Eritrea | 231 | 0.0% |
| Ethiopia | 751 | 0.0% |
| Europe | 40,566 | 1.7% |
| France | 1,447 | 0.1% |
| Germany | 4,883 | 0.2% |
| Ghana | 1,398 | 0.1% |
| Greece | 1,905 | 0.1% |
| Grenada | 244 | 0.0% |
| Guatemala | 2,630 | 0.1% |
| Guyana | 858 | 0.0% |
| Haiti | 3,968 | 0.2% |
| Honduras | 3,002 | 0.1% |
| Hong Kong | 887 | 0.0% |
| Hungary | 499 | 0.0% |
| India | 37,764 | 1.5% |
| Indonesia | 457 | 0.0% |
| Iran | 1,404 | 0.1% |
| Iraq | 434 | 0.0% |
| Ireland | 1,591 | 0.1% |
| Israel | 1,045 | 0.0% |
| Italy | 3,983 | 0.2% |
| Jamaica | 5,985 | 0.3% |
| Japan | 1,247 | 0.1% |
| Jordan | 691 | 0.0% |
| Kazakhstan | 262 | 0.0% |
| Kenya | 1,313 | 0.1% |
| Korea | 9,121 | 0.4% |
| Kuwait | 195 | 0.0% |
| Laos | 296 | 0.0% |
| Latin America | 84,190 | 3.5% |
| Latvia | 112 | 0.0% |
| Lebanon | 1,364 | 0.1% |
| Liberia | 4,652 | 0.2% |
| Lithuania | 370 | 0.0% |
| Malaysia | 343 | 0.0% |
| Mexico | 20,232 | 0.8% |
| Middle Africa | 1,095 | 0.0% |
| Moldova | 87 | 0.0% |
| Morocco | 1,434 | 0.1% |
| Nepal | 536 | 0.0% |
| Netherlands | 796 | 0.0% |
| Nicaragua | 328 | 0.0% |
| Nigeria | 2,598 | 0.1% |
| North Macedonia | 104 | 0.0% |
| Northern Africa | 5,059 | 0.2% |
| Northern Europe | 10,020 | 0.4% |
| Norway | 122 | 0.0% |
| Oceania | 1,018 | 0.0% |
| Pakistan | 2,810 | 0.1% |
| Panama | 520 | 0.0% |
| Peru | 1,407 | 0.1% |
| Philippines | 5,253 | 0.2% |
| Poland | 2,790 | 0.1% |
| Portugal | 1,209 | 0.1% |
| Romania | 1,478 | 0.1% |
| Russia | 3,102 | 0.1% |
| Saudi Arabia | 355 | 0.0% |
| Scotland | 631 | 0.0% |
| Senegal | 190 | 0.0% |
| Serbia | 227 | 0.0% |
| Sierra Leone | 1,702 | 0.1% |
| Singapore | 334 | 0.0% |
| Somalia | 13 | 0.0% |
| South Africa | 1,049 | 0.0% |
| South America | 16,025 | 0.7% |
| South Central Asia | 47,576 | 1.9% |
| South Eastern Asia | 15,690 | 0.6% |
| Southern Europe | 7,871 | 0.3% |
| Spain | 689 | 0.0% |
| Sri Lanka | 322 | 0.0% |
| St. Vincent and the Grenadines | 72 | 0.0% |
| Sudan | 325 | 0.0% |
| Sweden | 251 | 0.0% |
| Switzerland | 418 | 0.0% |
| Syria | 3,226 | 0.1% |
| Taiwan | 2,356 | 0.1% |
| Thailand | 1,008 | 0.0% |
| Trinidad and Tobago | 1,842 | 0.1% |
| Turkey | 1,091 | 0.0% |
| Uganda | 396 | 0.0% |
| Ukraine | 2,039 | 0.1% |
| Uruguay | 269 | 0.0% |
| Uzbekistan | 597 | 0.0% |
| Venezuela | 1,464 | 0.1% |
| Vietnam | 6,301 | 0.3% |
| West Indies | 61 | 0.0% |
| Western Africa | 12,566 | 0.5% |
| Western Asia | 9,240 | 0.4% |
| Western Europe | 8,003 | 0.3% |
| Zaire | 172 | 0.0% |
| Zimbabwe | 383 | 0.0% | View All 134 Rows |
Sex and Age in Area Code 484
Sex and Age in Area Code 484
The most populous age groups in Area Code 484 are 30 to 34 Years (85,671 | 7.1%) for men and 55 to 59 Years (86,670 | 7.0%) for women.
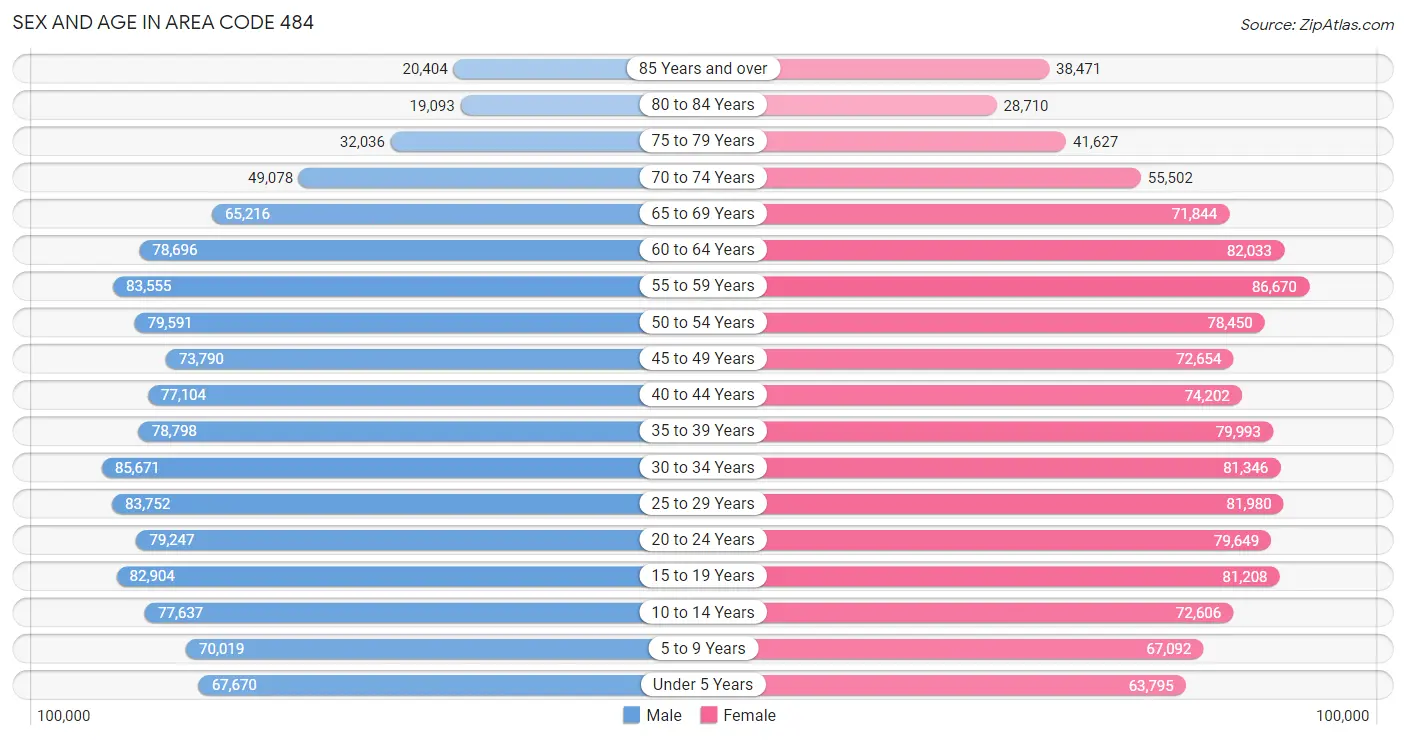
| Age Bracket | Male | Female |
| Under 5 Years | 67,670 (5.6%) | 63,795 (5.1%) |
| 5 to 9 Years | 70,019 (5.8%) | 67,092 (5.4%) |
| 10 to 14 Years | 77,637 (6.5%) | 72,606 (5.9%) |
| 15 to 19 Years | 82,904 (6.9%) | 81,208 (6.6%) |
| 20 to 24 Years | 79,247 (6.6%) | 79,649 (6.4%) |
| 25 to 29 Years | 83,752 (7.0%) | 81,980 (6.6%) |
| 30 to 34 Years | 85,671 (7.1%) | 81,346 (6.6%) |
| 35 to 39 Years | 78,798 (6.5%) | 79,993 (6.5%) |
| 40 to 44 Years | 77,104 (6.4%) | 74,202 (6.0%) |
| 45 to 49 Years | 73,790 (6.1%) | 72,654 (5.9%) |
| 50 to 54 Years | 79,591 (6.6%) | 78,450 (6.3%) |
| 55 to 59 Years | 83,555 (6.9%) | 86,670 (7.0%) |
| 60 to 64 Years | 78,696 (6.5%) | 82,033 (6.6%) |
| 65 to 69 Years | 65,216 (5.4%) | 71,844 (5.8%) |
| 70 to 74 Years | 49,078 (4.1%) | 55,502 (4.5%) |
| 75 to 79 Years | 32,036 (2.7%) | 41,627 (3.4%) |
| 80 to 84 Years | 19,093 (1.6%) | 28,710 (2.3%) |
| 85 Years and over | 20,404 (1.7%) | 38,471 (3.1%) |
| Total | 1,204,261 (100.0%) | 1,237,832 (100.0%) |
Families and Households in Area Code 484
Median Family Size in Area Code 484
The median family size in Area Code 484 is 3.07 persons per family, with married-couple families (468,253 | 76.3%) accounting for the largest median family size of 3.12269 persons per family. On the other hand, single male/father families (40,295 | 6.6%) represent the smallest median family size with 2.69 persons per family.
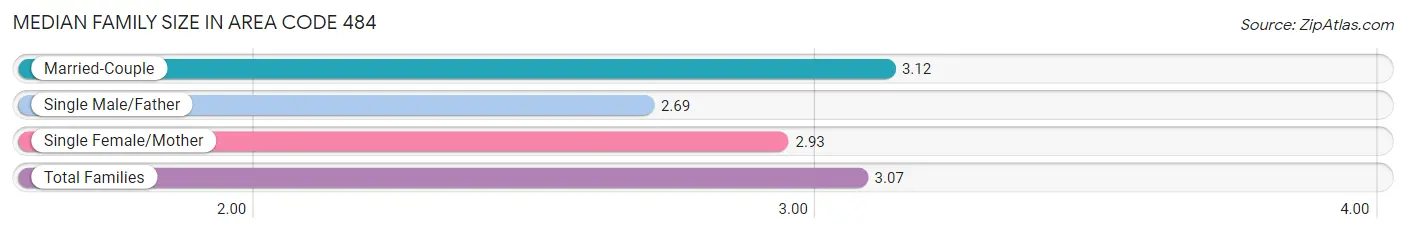
| Family Type | # Families | Family Size |
| Married-Couple | 468,253 (76.3%) | 3.12 |
| Single Male/Father | 40,295 (6.6%) | 2.69 |
| Single Female/Mother | 104,860 (17.1%) | 2.93 |
| Total Families | 613,408 (100.0%) | 3.07 |
Median Household Size in Area Code 484
The median household size in Area Code 484 is 2.53 persons per household, with married-couple households (468,253 | 49.3%) accounting for the largest median household size of 3.14307 persons per household. non-family households (336,472 | 35.4%) represent the smallest median household size with 1.24 persons per household.
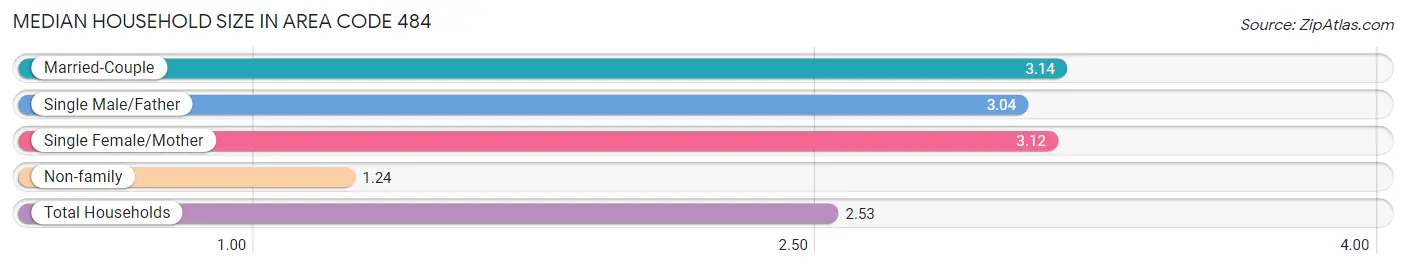
| Household Type | # Households | Household Size |
| Married-Couple | 468,253 (49.3%) | 3.14 |
| Single Male/Father | 40,295 (4.2%) | 3.04 |
| Single Female/Mother | 104,860 (11.0%) | 3.12 |
| Non-family | 336,472 (35.4%) | 1.24 |
| Total Households | 949,880 (100.0%) | 2.53 |
Household Size by Marriage Status in Area Code 484
Out of a total of 949,880 households in Area Code 484, 613,408 (64.6%) are family households, while 336,472 (35.4%) are nonfamily households. The most numerous type of family households are 2-person households, comprising 268,407, and the most common type of nonfamily households are 1-person households, comprising 271,867.
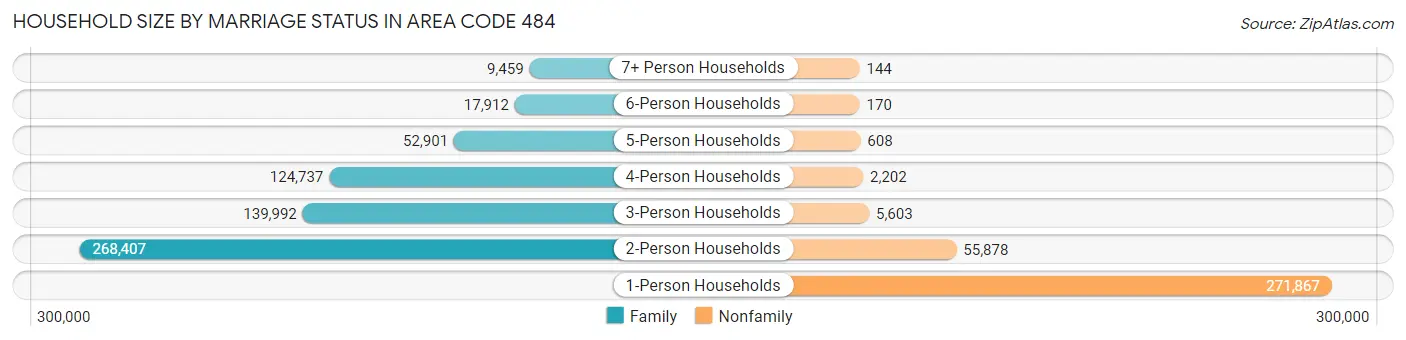
| Household Size | Family Households | Nonfamily Households |
| 1-Person Households | - | 271,867 (28.6%) |
| 2-Person Households | 268,407 (28.3%) | 55,878 (5.9%) |
| 3-Person Households | 139,992 (14.7%) | 5,603 (0.6%) |
| 4-Person Households | 124,737 (13.1%) | 2,202 (0.2%) |
| 5-Person Households | 52,901 (5.6%) | 608 (0.1%) |
| 6-Person Households | 17,912 (1.9%) | 170 (0.0%) |
| 7+ Person Households | 9,459 (1.0%) | 144 (0.0%) |
| Total | 613,408 (64.6%) | 336,472 (35.4%) |
Female Fertility in Area Code 484
Fertility by Age in Area Code 484
Average fertility rate in Area Code 484 is 54.5 births per 1,000 women. Women in the age bracket of 20 to 34 years have the highest fertility rate with 96.9 births per 1,000 women. Women in the age bracket of 20 to 34 years acount for 65.6% of all women with births.
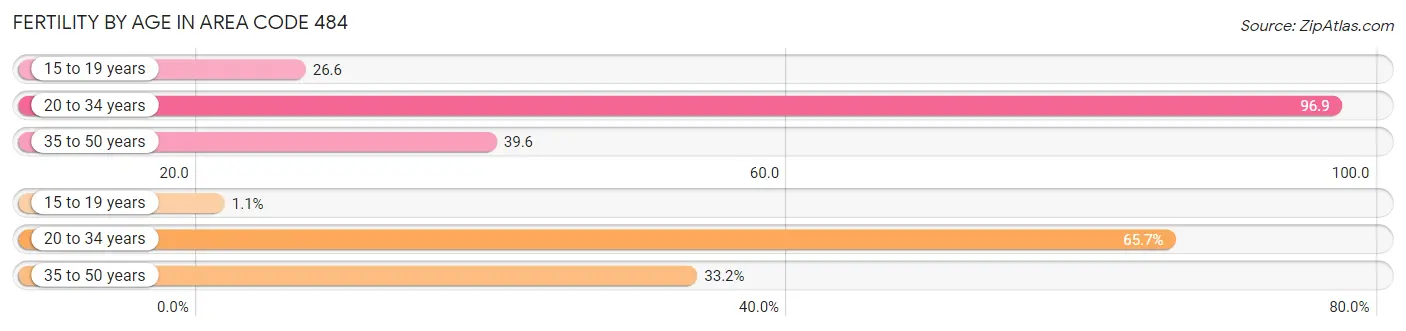
| Age Bracket | Women with Births | Births / 1,000 Women |
| 15 to 19 years | 322 (1.1%) | 26.6 |
| 20 to 34 years | 18,475 (65.6%) | 96.9 |
| 35 to 50 years | 9,346 (33.2%) | 39.6 |
| Total | 28,143 (100.0%) | 54.5 |
Fertility by Age by Marriage Status in Area Code 484
70.2% of women with births (28,143) in Area Code 484 are married. The highest percentage of unmarried women with births falls into 15 to 19 years age bracket with 100.0% of them unmarried at the time of birth, while the lowest percentage of unmarried women with births belong to 35 to 50 years age bracket with 32.4% of them unmarried.
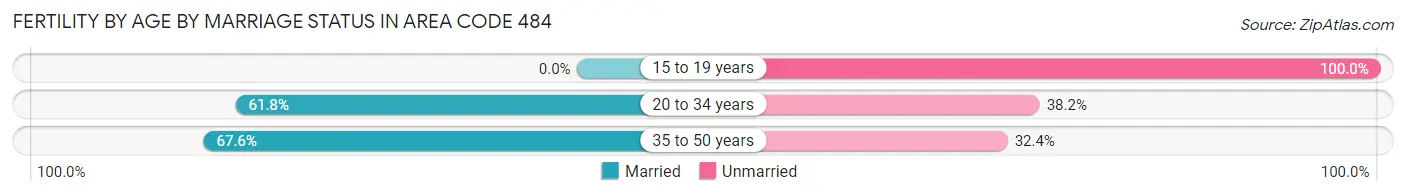
| Age Bracket | Married | Unmarried |
| 15 to 19 years | 0 (0.0%) | 322 (100.0%) |
| 20 to 34 years | 11,411 (61.8%) | 7,064 (38.2%) |
| 35 to 50 years | 6,314 (67.6%) | 3,032 (32.4%) |
| Total | 19,760 (70.2%) | 8,383 (29.8%) |
Fertility by Education in Area Code 484
Average fertility rate in Area Code 484 is 54.5 births per 1,000 women. Women with the education attainment of graduate degree have the highest fertility rate of 110.2 births per 1,000 women, while women with the education attainment of less than high school have the lowest fertility at 59.2 births per 1,000 women. Women with the education attainment of bachelor's degree represent 25.5% of all women with births.
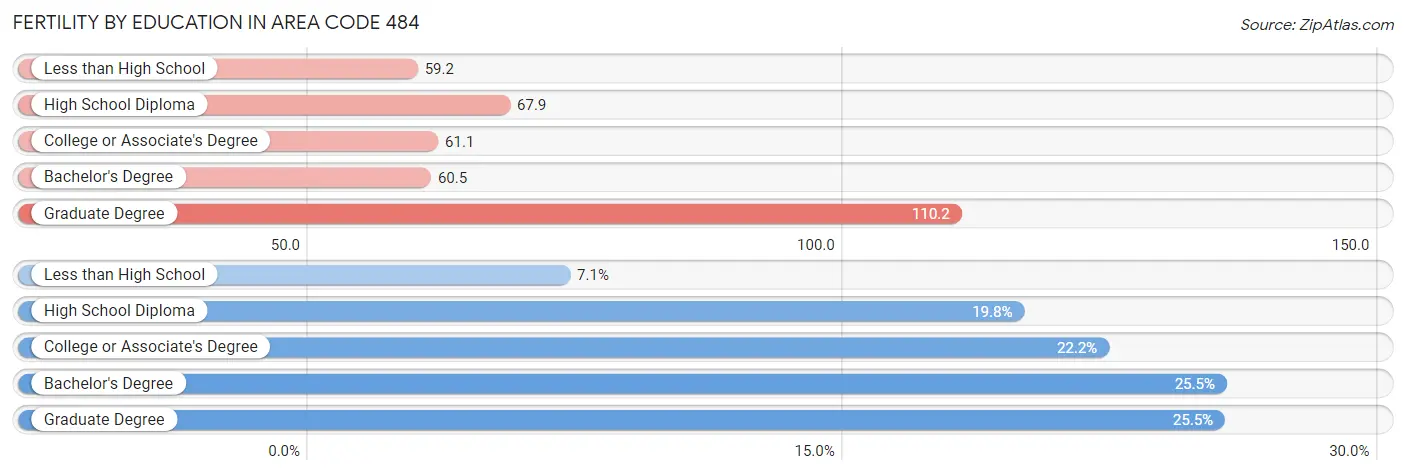
| Educational Attainment | Women with Births | Births / 1,000 Women |
| Less than High School | 1,984 (7.0%) | 59.2 |
| High School Diploma | 5,576 (19.8%) | 67.9 |
| College or Associate's Degree | 6,244 (22.2%) | 61.1 |
| Bachelor's Degree | 7,176 (25.5%) | 60.5 |
| Graduate Degree | 7,163 (25.5%) | 110.2 |
| Total | 28,143 (100.0%) | 54.5 |
Fertility by Education by Marriage Status in Area Code 484
29.8% of women with births in Area Code 484 are unmarried. Women with the educational attainment of bachelor's degree are most likely to be married with 63.3% of them married at childbirth, while women with the educational attainment of less than high school are least likely to be married with 75.6% of them unmarried at childbirth.
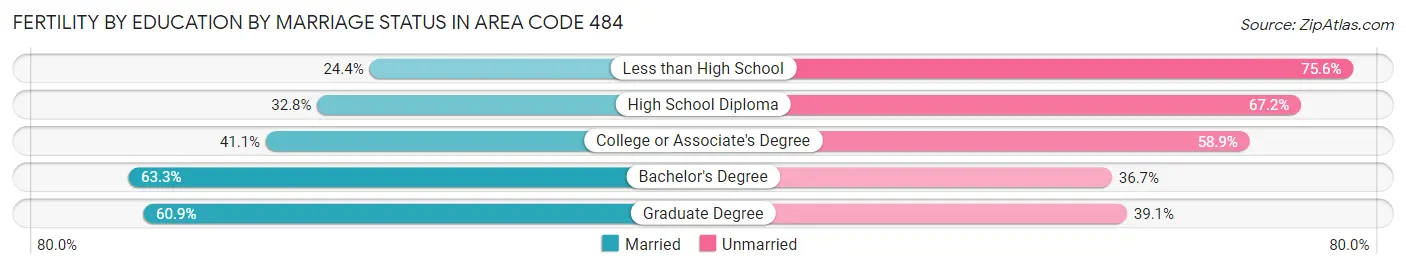
| Educational Attainment | Married | Unmarried |
| Less than High School | 484 (24.4%) | 1,500 (75.6%) |
| High School Diploma | 1,829 (32.8%) | 3,747 (67.2%) |
| College or Associate's Degree | 2,566 (41.1%) | 3,678 (58.9%) |
| Bachelor's Degree | 4,543 (63.3%) | 2,633 (36.7%) |
| Graduate Degree | 4,362 (60.9%) | 2,801 (39.1%) |
| Total | 19,760 (70.2%) | 8,383 (29.8%) |
Employment Characteristics in Area Code 484
Employment by Class of Employer in Area Code 484
Among the 1,231,582 employed individuals in Area Code 484, private company employees (862,533 | 70.0%), not-for-profit organizations (152,727 | 12.4%), and local government employees (67,940 | 5.5%) make up the most common classes of employment.
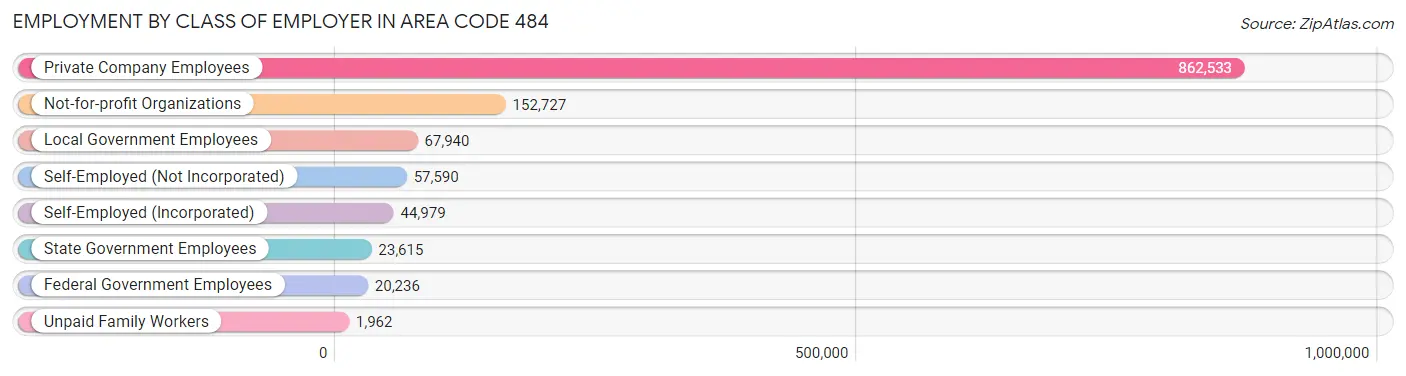
| Employer Class | # Employees | % Employees |
| Private Company Employees | 862,533 | 70.0% |
| Self-Employed (Incorporated) | 44,979 | 3.6% |
| Self-Employed (Not Incorporated) | 57,590 | 4.7% |
| Not-for-profit Organizations | 152,727 | 12.4% |
| Local Government Employees | 67,940 | 5.5% |
| State Government Employees | 23,615 | 1.9% |
| Federal Government Employees | 20,236 | 1.6% |
| Unpaid Family Workers | 1,962 | 0.2% |
| Total | 1,231,582 | 100.0% |
Employment Status by Age in Area Code 484
According to the labor force statistics for Area Code 484, out of the total population over 16 years of age (1,990,617), 66.8% or 1,329,931 individuals are in the labor force, with 5.2% or 69,156 of them unemployed. The age group with the highest labor force participation rate is 30 to 34 years, with 87.5% or 146,123 individuals in the labor force. Within the labor force, the 16 to 19 years age range has the highest percentage of unemployed individuals, with 1,903.1% or 1,073,995 of them being unemployed.
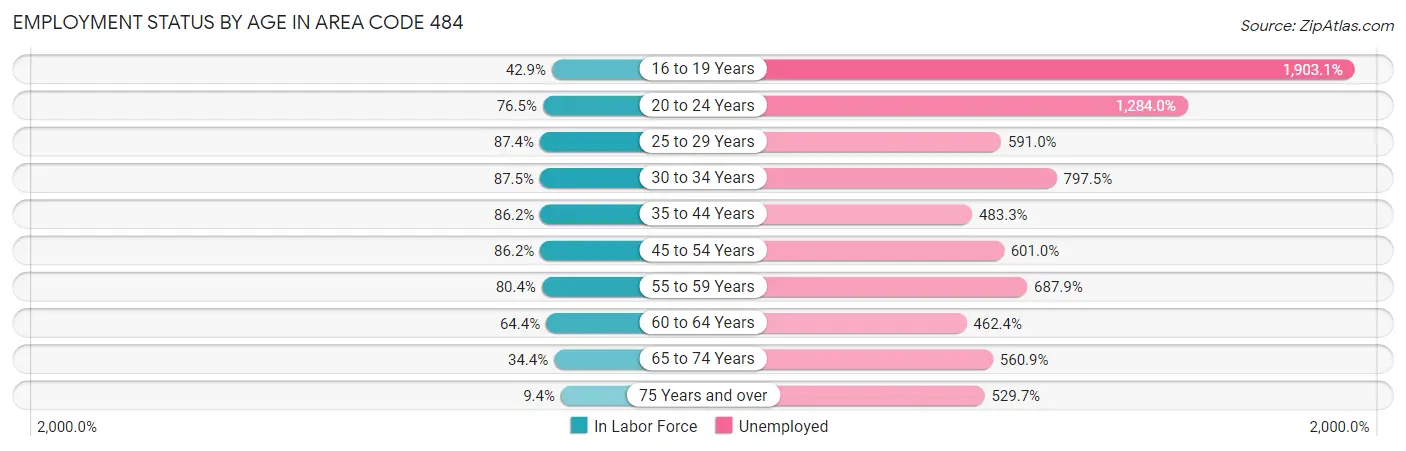
| Age Bracket | In Labor Force | Unemployed |
| 16 to 19 Years | 56,428 (42.9%) | 1,073,995 (1,903.1%) |
| 20 to 24 Years | 121,540 (76.5%) | 1,560,574 (1,284.0%) |
| 25 to 29 Years | 144,874 (87.4%) | 856,158 (591.0%) |
| 30 to 34 Years | 146,127 (87.5%) | 1,165,331 (797.5%) |
| 35 to 44 Years | 267,204 (86.2%) | 1,291,431 (483.3%) |
| 45 to 54 Years | 262,472 (86.2%) | 1,577,421 (601.0%) |
| 55 to 59 Years | 136,876 (80.4%) | 941,584 (687.9%) |
| 60 to 64 Years | 103,549 (64.4%) | 478,778 (462.4%) |
| 65 to 74 Years | 83,232 (34.4%) | 466,787 (560.9%) |
| 75 Years and over | 16,889 (9.4%) | 89,413 (529.7%) |
| Total | 1,329,998 (66.8%) | 69,166 (5.2%) |
Employment Status by Educational Attainment in Area Code 484
According to labor force statistics for Area Code 484, 82.9% of individuals (1,059,954) out of the total population between 25 and 64 years of age (1,278,285) are in the labor force, with 611.3% or 6,479,499 of them being unemployed. The group with the highest labor force participation rate are those with the educational attainment of bachelor's degree or higher, with 88.8% or 542,108 individuals in the labor force. Within the labor force, individuals with less than high school education have the highest percentage of unemployment, with 1,129.4% or 572,177 of them being unemployed.
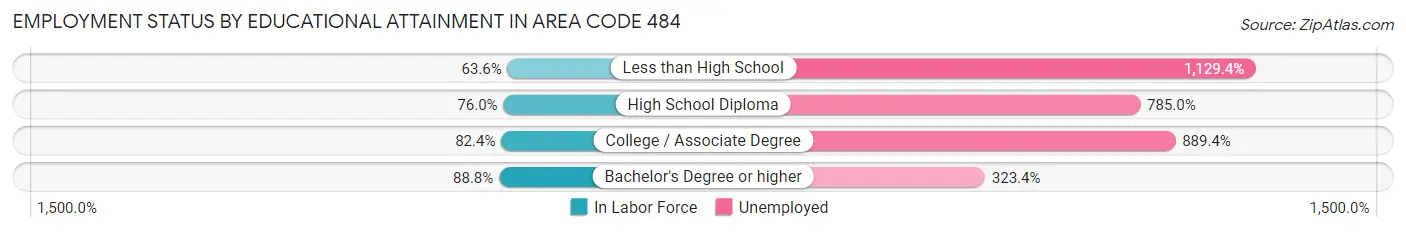
| Educational Attainment | In Labor Force | Unemployed |
| Less than High School | 50,660 (63.6%) | 899,217 (1,129.4%) |
| High School Diploma | 228,560 (76.0%) | 2,360,118 (785.0%) |
| College / Associate Degree | 237,164 (82.4%) | 2,558,537 (889.4%) |
| Bachelor's Degree or higher | 542,124 (88.8%) | 1,973,852 (323.4%) |
| Total | 1,059,942 (82.9%) | 7,814,156 (611.3%) |
Employment Occupations by Sex in Area Code 484
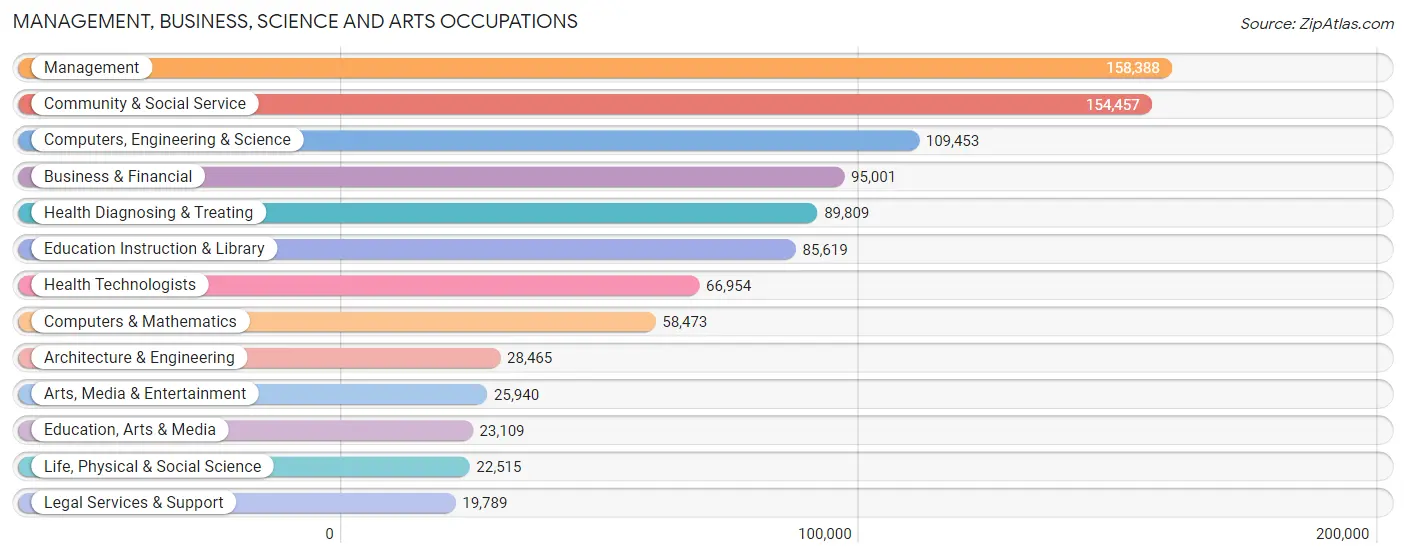
Management, Business, Science and Arts Occupations
The most common Management, Business, Science and Arts occupations in Area Code 484 are Management (158,388 | 12.6%), Community & Social Service (154,457 | 12.3%), Computers, Engineering & Science (109,453 | 8.7%), Business & Financial (95,001 | 7.6%), and Health Diagnosing & Treating (89,809 | 7.2%).
Management, Business, Science and Arts Occupations by Sex
Within the Management, Business, Science and Arts occupations in Area Code 484, the most male-oriented occupations are Architecture & Engineering (82.8%), Computers & Mathematics (75.8%), and Computers, Engineering & Science (72.7%), while the most female-oriented occupations are Health Diagnosing & Treating (73.6%), Health Technologists (72.6%), and Education Instruction & Library (71.7%).
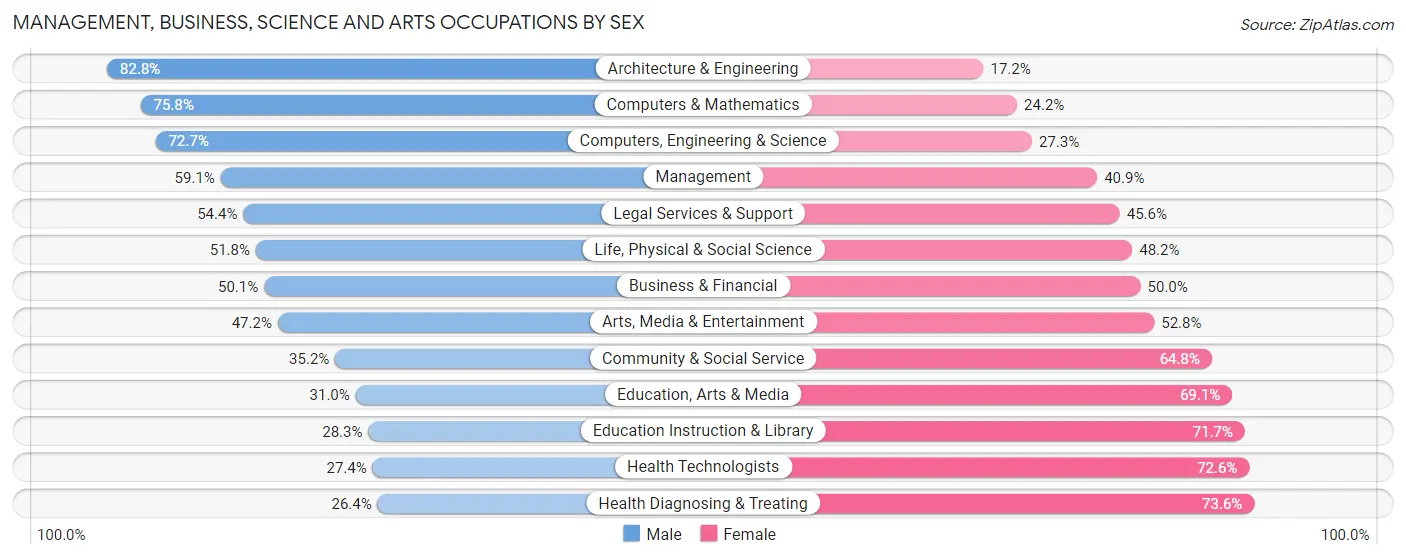
| Occupation | Male | Female |
| Management | 93,604 (59.1%) | 64,784 (40.9%) |
| Business & Financial | 47,552 (50.0%) | 47,449 (49.9%) |
| Computers, Engineering & Science | 79,563 (72.7%) | 29,890 (27.3%) |
| Computers & Mathematics | 44,330 (75.8%) | 14,143 (24.2%) |
| Architecture & Engineering | 23,575 (82.8%) | 4,890 (17.2%) |
| Life, Physical & Social Science | 11,658 (51.8%) | 10,857 (48.2%) |
| Community & Social Service | 54,394 (35.2%) | 100,063 (64.8%) |
| Education, Arts & Media | 7,152 (30.9%) | 15,957 (69.1%) |
| Legal Services & Support | 10,763 (54.4%) | 9,026 (45.6%) |
| Education Instruction & Library | 24,235 (28.3%) | 61,384 (71.7%) |
| Arts, Media & Entertainment | 12,244 (47.2%) | 13,696 (52.8%) |
| Health Diagnosing & Treating | 23,682 (26.4%) | 66,127 (73.6%) |
| Health Technologists | 18,352 (27.4%) | 48,602 (72.6%) |
| Total (Category) | 298,795 (49.2%) | 308,313 (50.8%) |
| Total (Overall) | 657,198 (52.4%) | 596,368 (47.6%) |
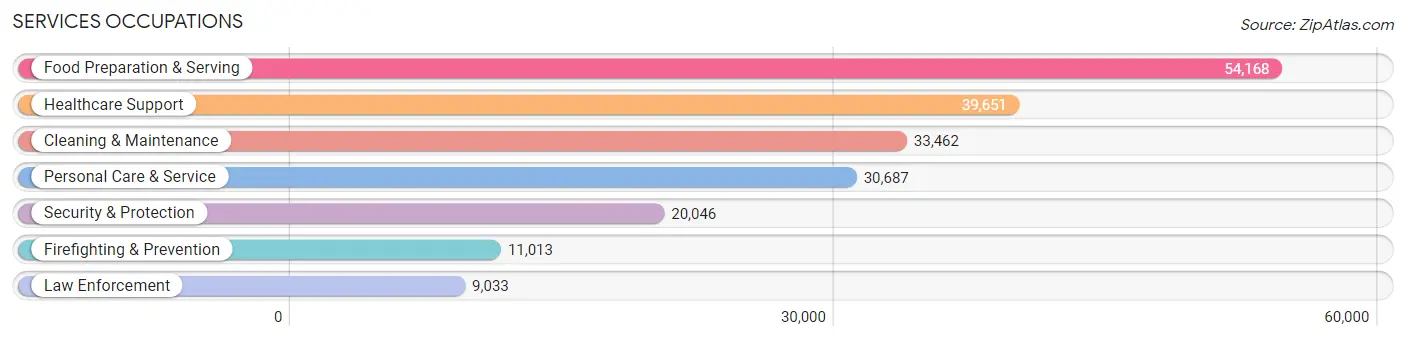
Services Occupations
The most common Services occupations in Area Code 484 are Food Preparation & Serving (54,168 | 4.3%), Healthcare Support (39,651 | 3.2%), Cleaning & Maintenance (33,462 | 2.7%), Personal Care & Service (30,687 | 2.5%), and Security & Protection (20,046 | 1.6%).
Services Occupations by Sex
Within the Services occupations in Area Code 484, the most male-oriented occupations are Law Enforcement (84.7%), Security & Protection (76.9%), and Firefighting & Prevention (70.5%), while the most female-oriented occupations are Healthcare Support (84.7%), Personal Care & Service (75.7%), and Food Preparation & Serving (53.7%).
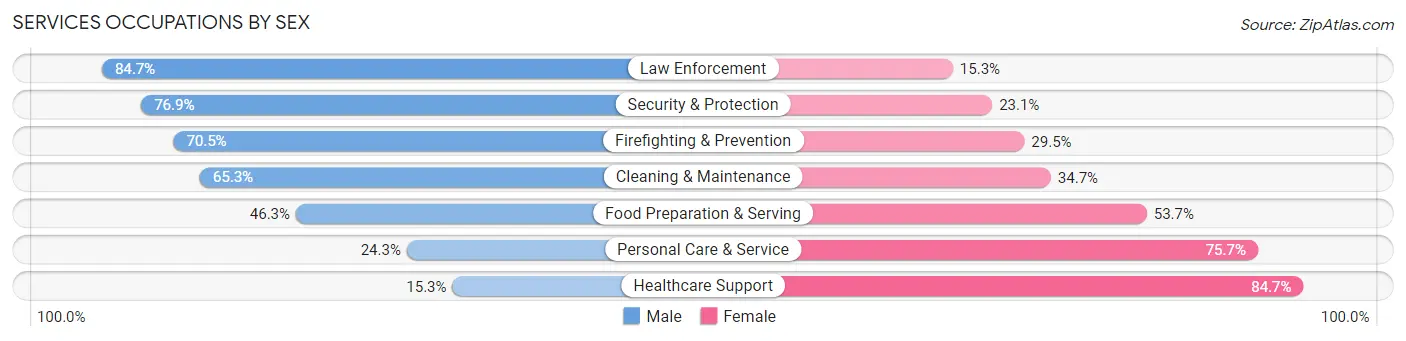
| Occupation | Male | Female |
| Healthcare Support | 6,064 (15.3%) | 33,587 (84.7%) |
| Security & Protection | 15,415 (76.9%) | 4,631 (23.1%) |
| Firefighting & Prevention | 7,766 (70.5%) | 3,247 (29.5%) |
| Law Enforcement | 7,649 (84.7%) | 1,384 (15.3%) |
| Food Preparation & Serving | 25,073 (46.3%) | 29,095 (53.7%) |
| Cleaning & Maintenance | 21,845 (65.3%) | 11,617 (34.7%) |
| Personal Care & Service | 7,466 (24.3%) | 23,221 (75.7%) |
| Total (Category) | 75,863 (42.6%) | 102,151 (57.4%) |
| Total (Overall) | 657,198 (52.4%) | 596,368 (47.6%) |
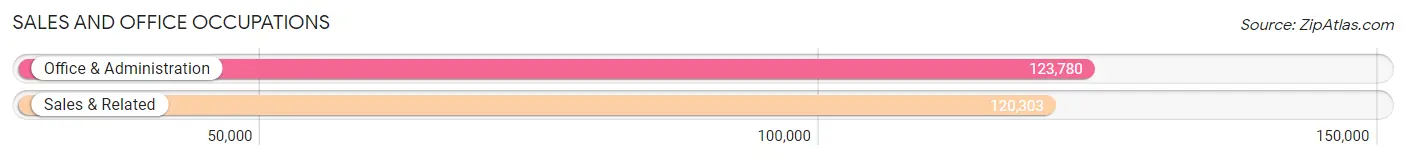
Sales and Office Occupations
The most common Sales and Office occupations in Area Code 484 are Office & Administration (123,780 | 9.9%), and Sales & Related (120,303 | 9.6%).
Sales and Office Occupations by Sex
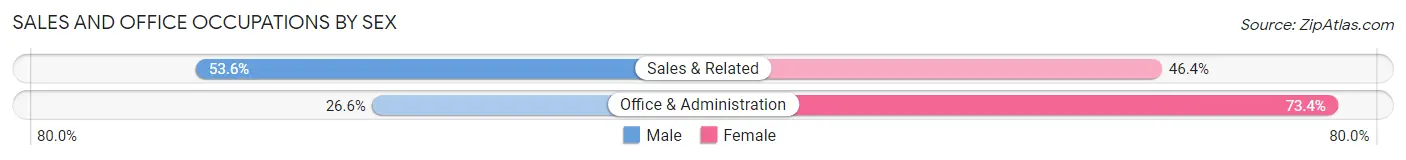
| Occupation | Male | Female |
| Sales & Related | 64,530 (53.6%) | 55,773 (46.4%) |
| Office & Administration | 32,928 (26.6%) | 90,852 (73.4%) |
| Total (Category) | 97,458 (39.9%) | 146,625 (60.1%) |
| Total (Overall) | 657,198 (52.4%) | 596,368 (47.6%) |
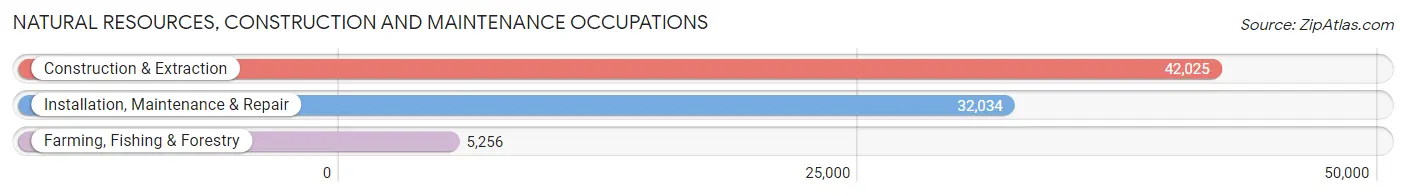
Natural Resources, Construction and Maintenance Occupations
The most common Natural Resources, Construction and Maintenance occupations in Area Code 484 are Construction & Extraction (42,025 | 3.4%), Installation, Maintenance & Repair (32,034 | 2.6%), and Farming, Fishing & Forestry (5,256 | 0.4%).
Natural Resources, Construction and Maintenance Occupations by Sex
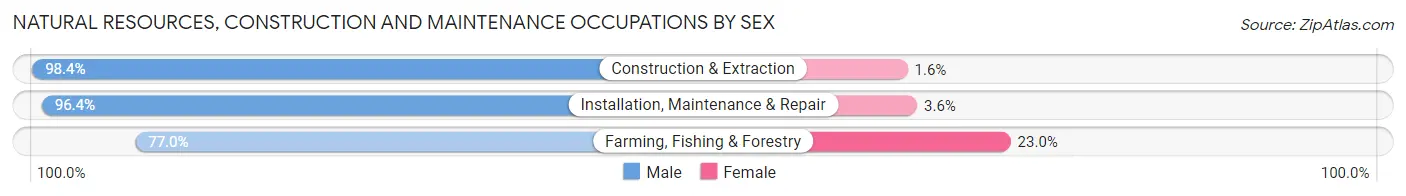
| Occupation | Male | Female |
| Farming, Fishing & Forestry | 4,045 (77.0%) | 1,211 (23.0%) |
| Construction & Extraction | 41,351 (98.4%) | 674 (1.6%) |
| Installation, Maintenance & Repair | 30,888 (96.4%) | 1,146 (3.6%) |
| Total (Category) | 76,284 (96.2%) | 3,031 (3.8%) |
| Total (Overall) | 657,198 (52.4%) | 596,368 (47.6%) |
Production, Transportation and Moving Occupations
The most common Production, Transportation and Moving occupations in Area Code 484 are Production (59,415 | 4.7%), Material Moving (46,578 | 3.7%), and Transportation (39,053 | 3.1%).
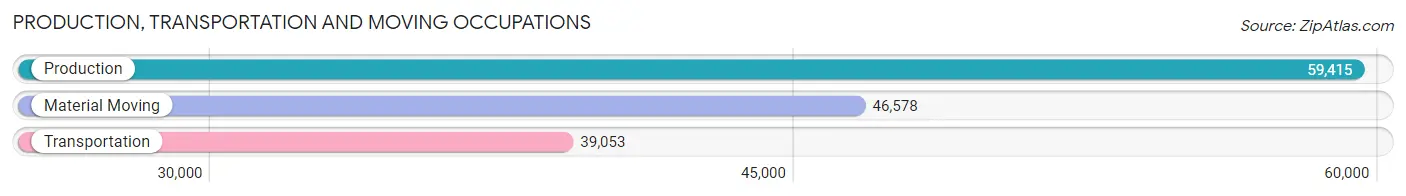
Production, Transportation and Moving Occupations by Sex
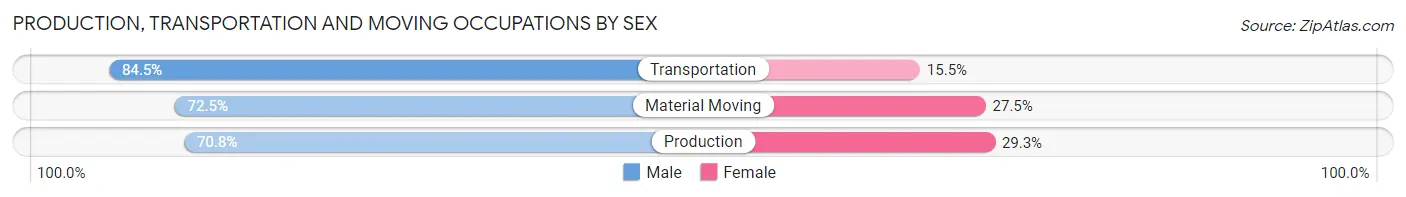
| Occupation | Male | Female |
| Production | 42,038 (70.8%) | 17,377 (29.2%) |
| Transportation | 33,009 (84.5%) | 6,044 (15.5%) |
| Material Moving | 33,751 (72.5%) | 12,827 (27.5%) |
| Total (Category) | 108,798 (75.0%) | 36,248 (25.0%) |
| Total (Overall) | 657,198 (52.4%) | 596,368 (47.6%) |
Employment Industries by Sex in Area Code 484
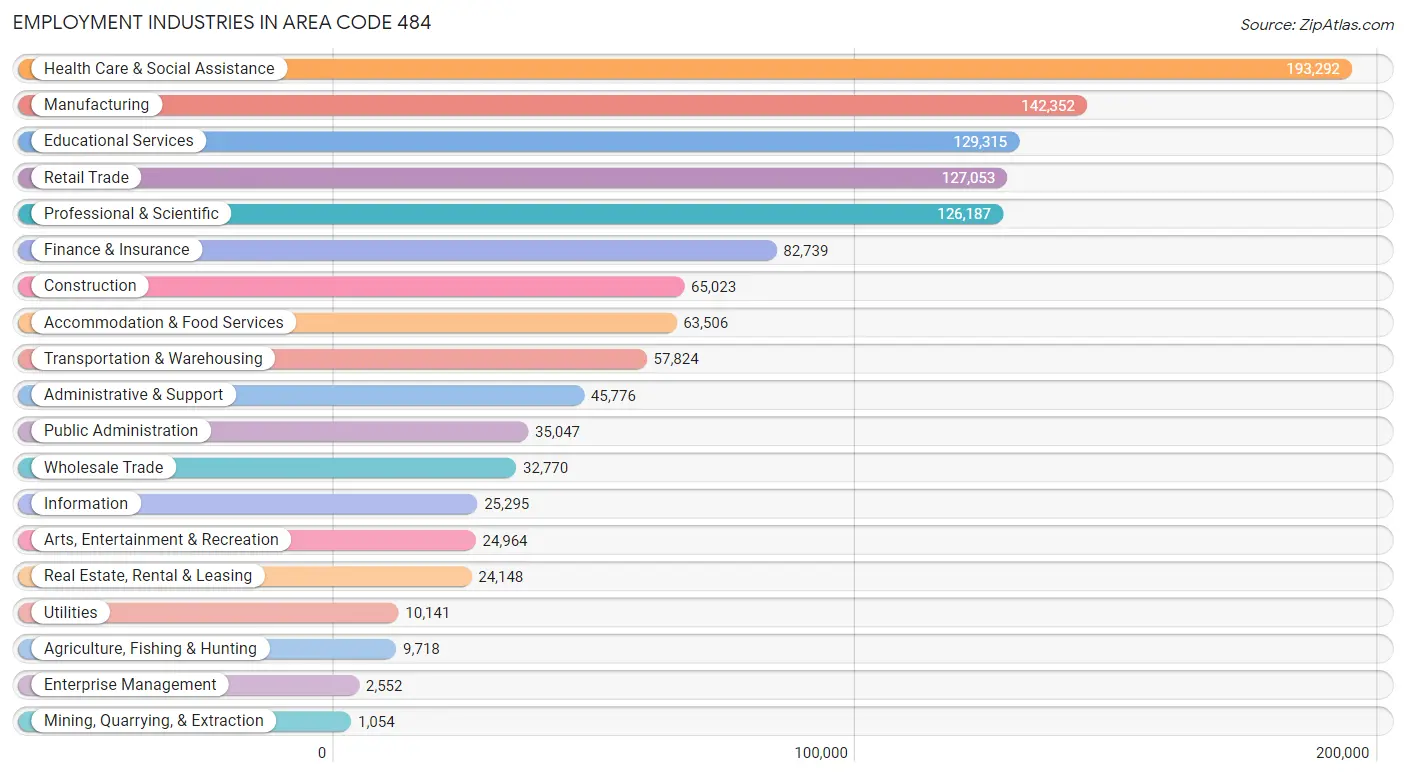
Employment Industries in Area Code 484
The major employment industries in Area Code 484 include Health Care & Social Assistance (193,292 | 15.4%), Manufacturing (142,352 | 11.4%), Educational Services (129,315 | 10.3%), Retail Trade (127,053 | 10.1%), and Professional & Scientific (126,187 | 10.1%).
Employment Industries by Sex in Area Code 484
The Area Code 484 industries that see more men than women are Construction (90.0%), Mining, Quarrying, & Extraction (79.6%), and Utilities (77.2%), whereas the industries that tend to have a higher number of women are Health Care & Social Assistance (77.0%), Educational Services (66.1%), and Accommodation & Food Services (53.4%).
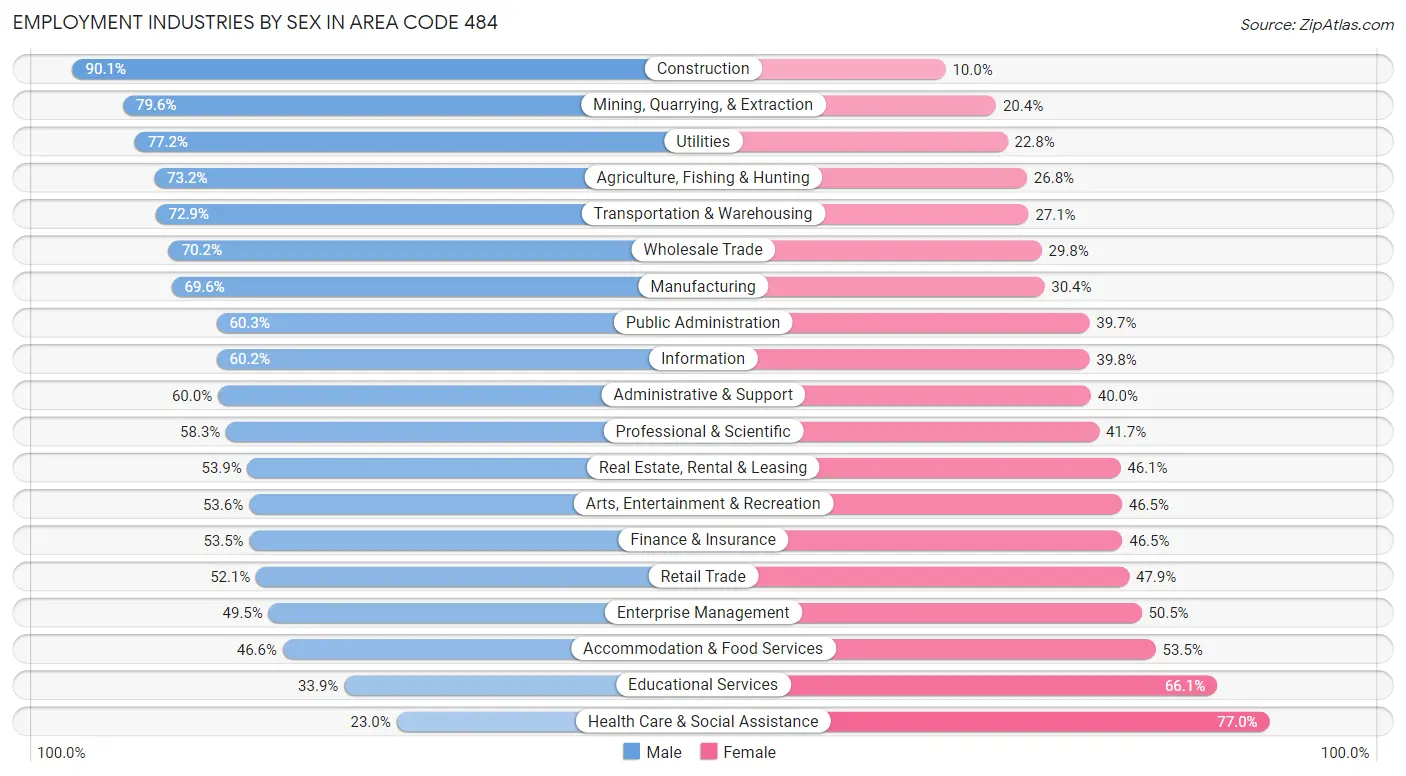
| Industry | Male | Female |
| Agriculture, Fishing & Hunting | 7,114 (73.2%) | 2,604 (26.8%) |
| Mining, Quarrying, & Extraction | 839 (79.6%) | 215 (20.4%) |
| Construction | 58,555 (90.0%) | 6,468 (10.0%) |
| Manufacturing | 99,071 (69.6%) | 43,281 (30.4%) |
| Wholesale Trade | 22,993 (70.2%) | 9,777 (29.8%) |
| Retail Trade | 66,138 (52.1%) | 60,915 (47.9%) |
| Transportation & Warehousing | 42,145 (72.9%) | 15,679 (27.1%) |
| Utilities | 7,829 (77.2%) | 2,312 (22.8%) |
| Information | 15,238 (60.2%) | 10,057 (39.8%) |
| Finance & Insurance | 44,231 (53.5%) | 38,508 (46.5%) |
| Real Estate, Rental & Leasing | 13,005 (53.9%) | 11,143 (46.1%) |
| Professional & Scientific | 73,541 (58.3%) | 52,646 (41.7%) |
| Enterprise Management | 1,263 (49.5%) | 1,289 (50.5%) |
| Administrative & Support | 27,450 (60.0%) | 18,326 (40.0%) |
| Educational Services | 43,792 (33.9%) | 85,523 (66.1%) |
| Health Care & Social Assistance | 44,467 (23.0%) | 148,825 (77.0%) |
| Arts, Entertainment & Recreation | 13,369 (53.5%) | 11,595 (46.5%) |
| Accommodation & Food Services | 29,565 (46.6%) | 33,941 (53.4%) |
| Public Administration | 21,127 (60.3%) | 13,920 (39.7%) |
| Total | 657,198 (52.4%) | 596,368 (47.6%) |
Education in Area Code 484
School Enrollment in Area Code 484
The most common levels of schooling among the 583,906 students in Area Code 484 are college / undergraduate (128,759 | 22.1%), high school (124,160 | 21.3%), and middle school (119,455 | 20.5%).
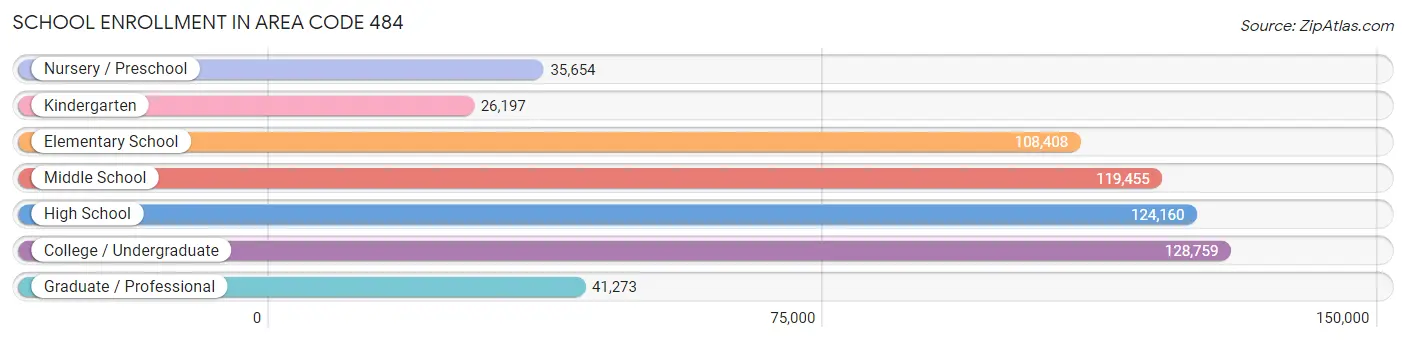
| School Level | # Students | % Students |
| Nursery / Preschool | 35,654 | 6.1% |
| Kindergarten | 26,197 | 4.5% |
| Elementary School | 108,408 | 18.6% |
| Middle School | 119,455 | 20.5% |
| High School | 124,160 | 21.3% |
| College / Undergraduate | 128,759 | 22.1% |
| Graduate / Professional | 41,273 | 7.1% |
| Total | 583,906 | 100.0% |
School Enrollment by Age by Funding Source in Area Code 484
Out of a total of 583,906 students who are enrolled in schools in Area Code 484, 158,821 (27.2%) attend a private institution, while the remaining 425,085 (72.8%) are enrolled in public schools. The age group of 3 to 4 year olds has the highest likelihood of being enrolled in private schools, with 15,994 (59.0% in the age bracket) enrolled. Conversely, the age group of 10 to 14 year olds has the lowest likelihood of being enrolled in a private school, with 126,969 (86.3% in the age bracket) attending a public institution.
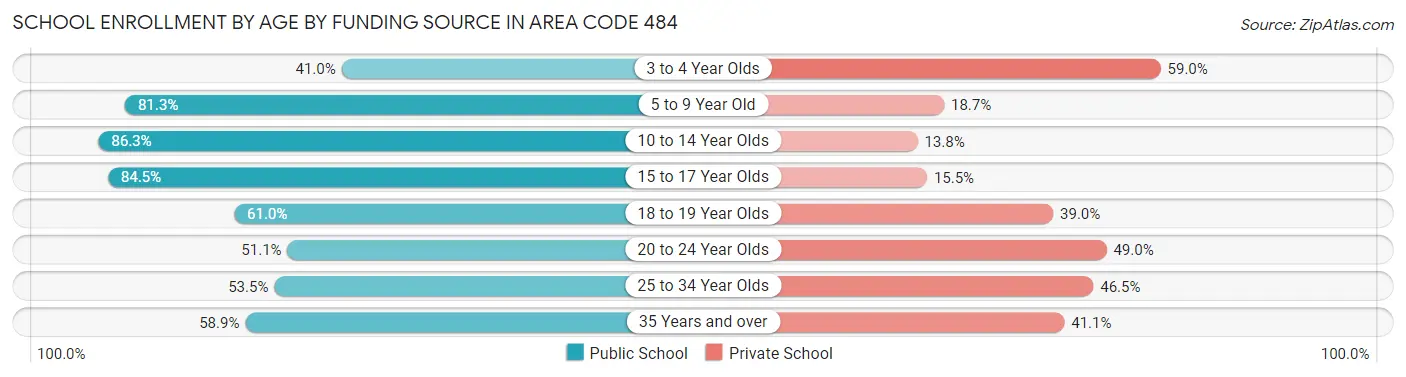
| Age Bracket | Public School | Private School |
| 3 to 4 Year Olds | 11,100 (41.0%) | 15,994 (59.0%) |
| 5 to 9 Year Old | 104,299 (81.3%) | 23,988 (18.7%) |
| 10 to 14 Year Olds | 126,969 (86.3%) | 20,245 (13.8%) |
| 15 to 17 Year Olds | 76,256 (84.5%) | 13,995 (15.5%) |
| 18 to 19 Year Olds | 35,815 (61.0%) | 22,905 (39.0%) |
| 20 to 24 Year Olds | 34,826 (51.0%) | 33,399 (48.9%) |
| 25 to 34 Year Olds | 19,634 (53.5%) | 17,064 (46.5%) |
| 35 Years and over | 16,148 (58.9%) | 11,269 (41.1%) |
| Total | 425,085 (72.8%) | 158,821 (27.2%) |
Educational Attainment by Field of Study in Area Code 484
Business (169,504 | 20.6%), education (85,951 | 10.4%), science & technology (77,147 | 9.4%), social sciences (64,535 | 7.8%), and engineering (62,895 | 7.6%) are the most common fields of study among 824,375 individuals in Area Code 484 who have obtained a bachelor's degree or higher.
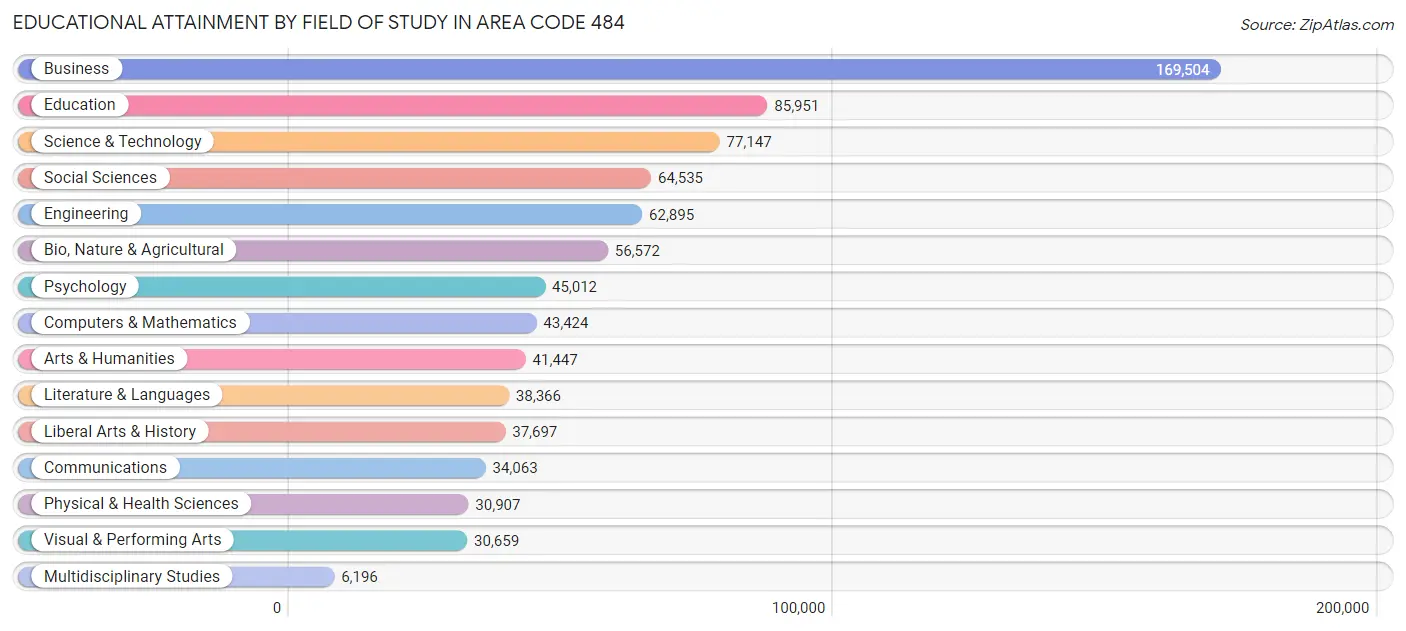
| Field of Study | # Graduates | % Graduates |
| Computers & Mathematics | 43,424 | 5.3% |
| Bio, Nature & Agricultural | 56,572 | 6.9% |
| Physical & Health Sciences | 30,907 | 3.7% |
| Psychology | 45,012 | 5.5% |
| Social Sciences | 64,535 | 7.8% |
| Engineering | 62,895 | 7.6% |
| Multidisciplinary Studies | 6,196 | 0.7% |
| Science & Technology | 77,147 | 9.4% |
| Business | 169,504 | 20.6% |
| Education | 85,951 | 10.4% |
| Literature & Languages | 38,366 | 4.6% |
| Liberal Arts & History | 37,697 | 4.6% |
| Visual & Performing Arts | 30,659 | 3.7% |
| Communications | 34,063 | 4.1% |
| Arts & Humanities | 41,447 | 5.0% |
| Total | 824,375 | 100.0% |
Transportation & Commute in Area Code 484
Vehicle Availability by Sex in Area Code 484
The most prevalent vehicle ownership categories in Area Code 484 are males with 2 vehicles (281,292, accounting for 43.8%) and females with 2 vehicles (237,671, making up 49.2%).
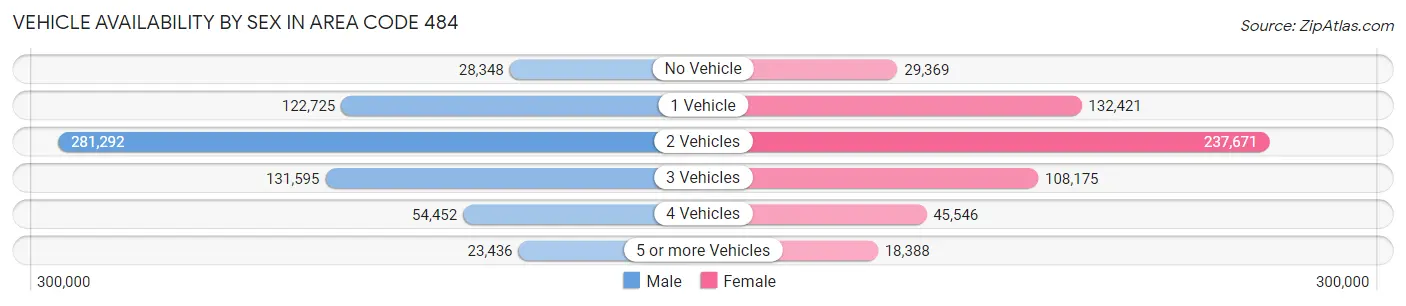
| Vehicles Available | Male | Female |
| No Vehicle | 28,348 (4.4%) | 29,369 (5.1%) |
| 1 Vehicle | 122,725 (19.1%) | 132,421 (23.2%) |
| 2 Vehicles | 281,292 (43.8%) | 237,671 (41.6%) |
| 3 Vehicles | 131,595 (20.5%) | 108,175 (18.9%) |
| 4 Vehicles | 54,452 (8.5%) | 45,546 (8.0%) |
| 5 or more Vehicles | 23,436 (3.6%) | 18,388 (3.2%) |
| Total | 641,848 (100.0%) | 571,570 (100.0%) |
Commute Time in Area Code 484
The most frequently occuring commute durations in Area Code 484 are 20 to 24 minutes (151,717 commuters, 14.6%), 15 to 19 minutes (150,132 commuters, 14.4%), and 30 to 34 minutes (143,696 commuters, 13.8%).
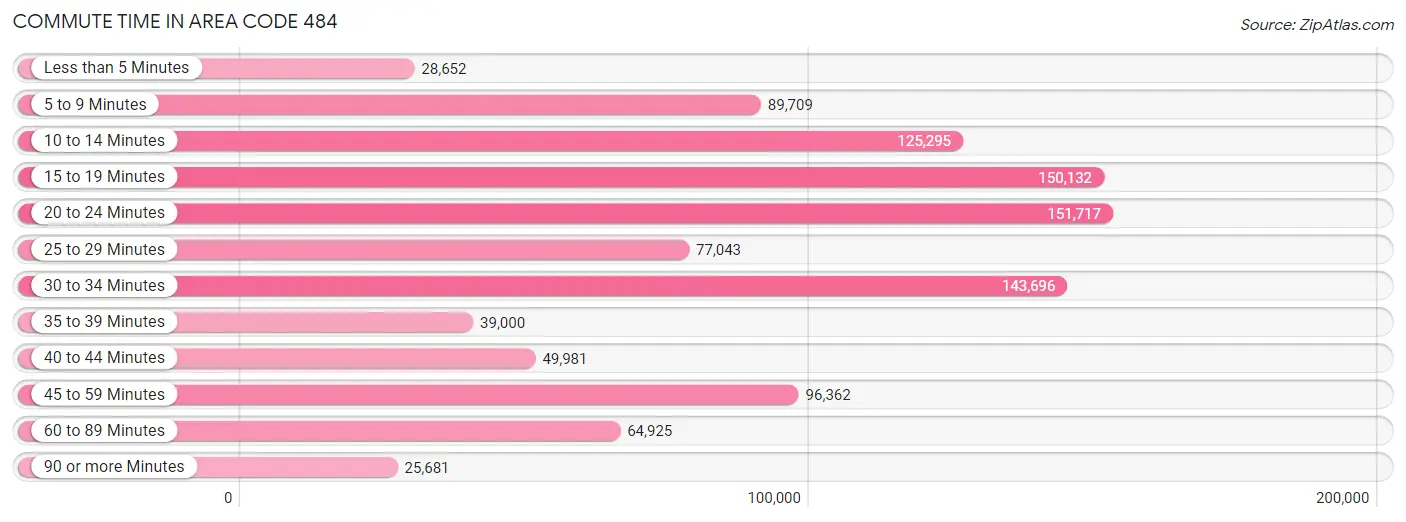
| Commute Time | # Commuters | % Commuters |
| Less than 5 Minutes | 28,652 | 2.8% |
| 5 to 9 Minutes | 89,709 | 8.6% |
| 10 to 14 Minutes | 125,295 | 12.0% |
| 15 to 19 Minutes | 150,132 | 14.4% |
| 20 to 24 Minutes | 151,717 | 14.6% |
| 25 to 29 Minutes | 77,043 | 7.4% |
| 30 to 34 Minutes | 143,696 | 13.8% |
| 35 to 39 Minutes | 39,000 | 3.7% |
| 40 to 44 Minutes | 49,981 | 4.8% |
| 45 to 59 Minutes | 96,362 | 9.2% |
| 60 to 89 Minutes | 64,925 | 6.2% |
| 90 or more Minutes | 25,681 | 2.5% |
Commute Time by Sex in Area Code 484
The most common commute times in Area Code 484 are 30 to 34 minutes (78,097 commuters, 14.1%) for males and 20 to 24 minutes (74,453 commuters, 15.2%) for females.
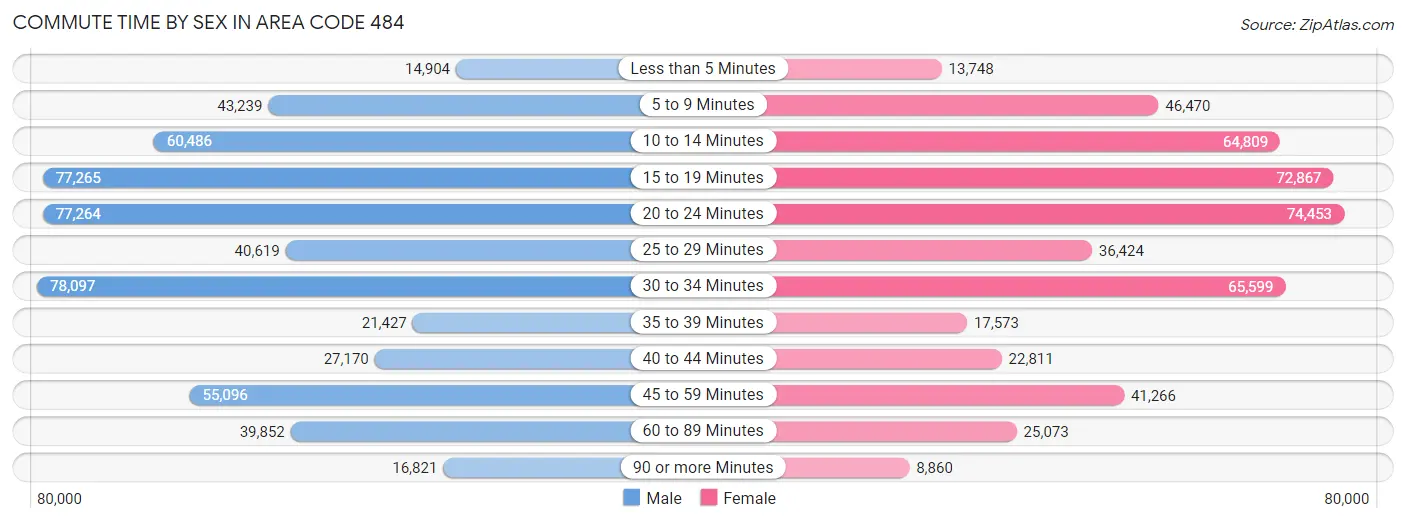
| Commute Time | Male | Female |
| Less than 5 Minutes | 14,904 (2.7%) | 13,748 (2.8%) |
| 5 to 9 Minutes | 43,239 (7.8%) | 46,470 (9.5%) |
| 10 to 14 Minutes | 60,486 (11.0%) | 64,809 (13.2%) |
| 15 to 19 Minutes | 77,265 (14.0%) | 72,867 (14.9%) |
| 20 to 24 Minutes | 77,264 (14.0%) | 74,453 (15.2%) |
| 25 to 29 Minutes | 40,619 (7.4%) | 36,424 (7.4%) |
| 30 to 34 Minutes | 78,097 (14.1%) | 65,599 (13.4%) |
| 35 to 39 Minutes | 21,427 (3.9%) | 17,573 (3.6%) |
| 40 to 44 Minutes | 27,170 (4.9%) | 22,811 (4.7%) |
| 45 to 59 Minutes | 55,096 (10.0%) | 41,266 (8.4%) |
| 60 to 89 Minutes | 39,852 (7.2%) | 25,073 (5.1%) |
| 90 or more Minutes | 16,821 (3.0%) | 8,860 (1.8%) |
Time of Departure to Work by Sex in Area Code 484
The most frequent times of departure to work in Area Code 484 are 7:00 AM to 7:29 AM (74,740, 13.5%) for males and 7:00 AM to 7:29 AM (70,692, 14.4%) for females.
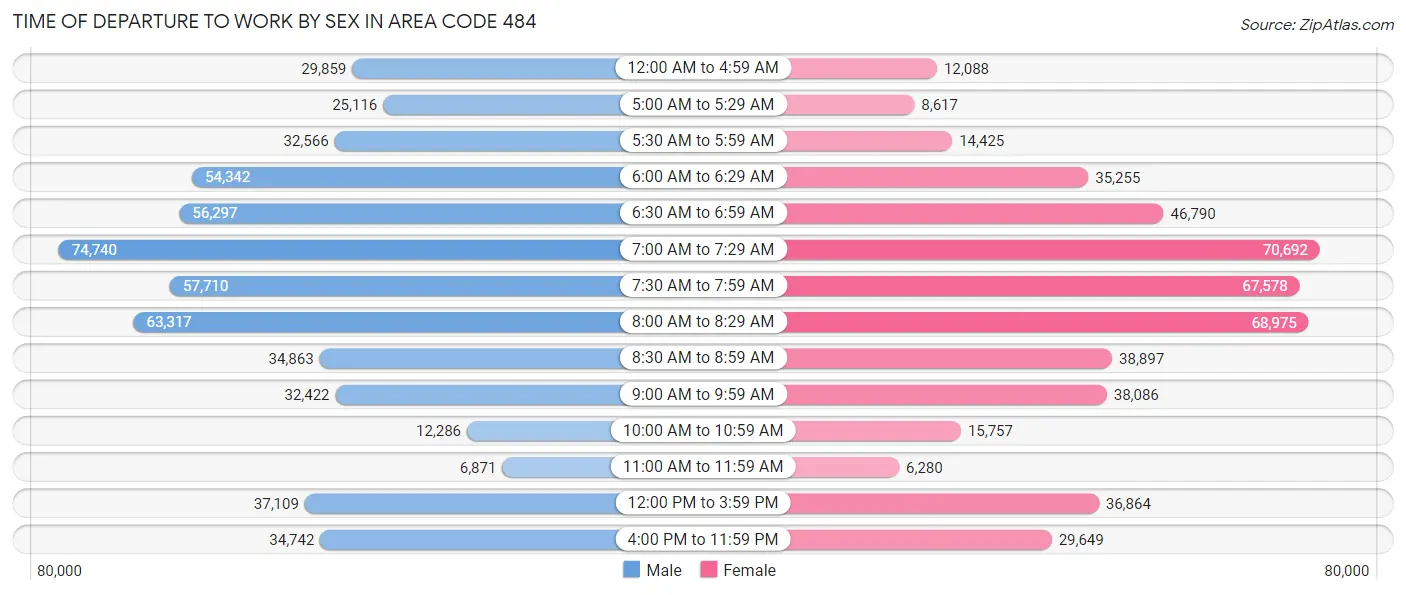
| Time of Departure | Male | Female |
| 12:00 AM to 4:59 AM | 29,859 (5.4%) | 12,088 (2.5%) |
| 5:00 AM to 5:29 AM | 25,116 (4.5%) | 8,617 (1.8%) |
| 5:30 AM to 5:59 AM | 32,566 (5.9%) | 14,425 (2.9%) |
| 6:00 AM to 6:29 AM | 54,342 (9.8%) | 35,255 (7.2%) |
| 6:30 AM to 6:59 AM | 56,297 (10.2%) | 46,790 (9.6%) |
| 7:00 AM to 7:29 AM | 74,740 (13.5%) | 70,692 (14.4%) |
| 7:30 AM to 7:59 AM | 57,710 (10.4%) | 67,578 (13.8%) |
| 8:00 AM to 8:29 AM | 63,317 (11.5%) | 68,975 (14.1%) |
| 8:30 AM to 8:59 AM | 34,863 (6.3%) | 38,897 (7.9%) |
| 9:00 AM to 9:59 AM | 32,422 (5.9%) | 38,086 (7.8%) |
| 10:00 AM to 10:59 AM | 12,286 (2.2%) | 15,757 (3.2%) |
| 11:00 AM to 11:59 AM | 6,871 (1.2%) | 6,280 (1.3%) |
| 12:00 PM to 3:59 PM | 37,109 (6.7%) | 36,864 (7.5%) |
| 4:00 PM to 11:59 PM | 34,742 (6.3%) | 29,649 (6.0%) |
| Total | 552,240 (100.0%) | 489,953 (100.0%) |
Housing Occupancy in Area Code 484
Occupancy by Ownership in Area Code 484
Of the total 949,880 dwellings in Area Code 484, owner-occupied units account for 634,182 (66.8%), while renter-occupied units make up 315,698 (33.2%).
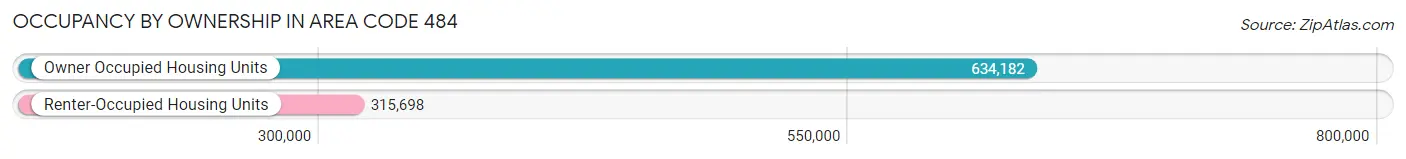
| Occupancy | # Housing Units | % Housing Units |
| Owner Occupied Housing Units | 634,182 | 66.8% |
| Renter-Occupied Housing Units | 315,698 | 33.2% |
| Total Occupied Housing Units | 949,880 | 100.0% |
Occupancy by Household Size in Area Code 484
| Household Size | # Housing Units | % Housing Units |
| 1-Person Household | 271,867 | 28.6% |
| 2-Person Household | 324,285 | 34.1% |
| 3-Person Household | 145,595 | 15.3% |
| 4+ Person Household | 208,133 | 21.9% |
| Total Housing Units | 949,880 | 100.0% |
Occupancy by Ownership by Household Size in Area Code 484
| Household Size | Owner-occupied | Renter-occupied |
| 1-Person Household | 132,634 (48.8%) | 139,233 (51.2%) |
| 2-Person Household | 232,121 (71.6%) | 92,164 (28.4%) |
| 3-Person Household | 107,671 (74.0%) | 37,924 (26.1%) |
| 4+ Person Household | 161,756 (77.7%) | 46,377 (22.3%) |
| Total Housing Units | 634,182 (66.8%) | 315,698 (33.2%) |
Occupancy by Educational Attainment in Area Code 484
| Household Size | Owner-occupied | Renter-occupied |
| Less than High School | 28,567 (46.7%) | 32,613 (53.3%) |
| High School Diploma | 136,863 (62.5%) | 82,234 (37.5%) |
| College/Associate Degree | 138,575 (63.8%) | 78,591 (36.2%) |
| Bachelor's Degree or higher | 330,177 (73.0%) | 122,260 (27.0%) |
Occupancy by Age of Householder in Area Code 484
| Age Bracket | # Households | % Households |
| Under 35 Years | 173,120 | 18.2% |
| 35 to 44 Years | 160,888 | 16.9% |
| 45 to 54 Years | 168,167 | 17.7% |
| 55 to 64 Years | 188,443 | 19.8% |
| 65 to 74 Years | 146,821 | 15.5% |
| 75 to 84 Years | 75,888 | 8.0% |
| 85 Years and Over | 36,553 | 3.8% |
| Total | 949,880 | 100.0% |
Housing Finances in Area Code 484
Median Income by Occupancy in Area Code 484
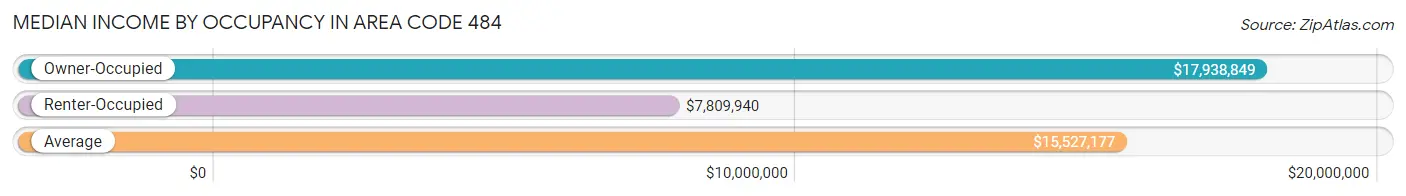
| Occupancy Type | # Households | Median Income |
| Owner-Occupied | 634,182 (66.8%) | $17,938,849 |
| Renter-Occupied | 315,698 (33.2%) | $7,809,940 |
| Average | 949,880 (100.0%) | $15,527,177 |
Occupancy by Householder Income Bracket in Area Code 484
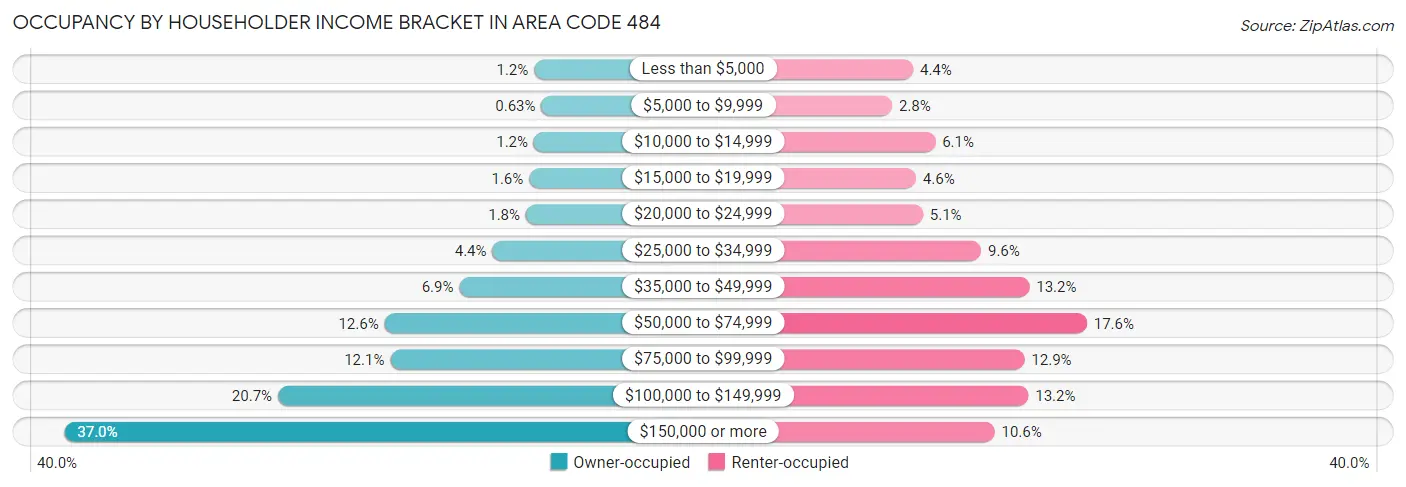
| Income Bracket | Owner-occupied | Renter-occupied |
| Less than $5,000 | 7,467 (1.2%) | 13,829 (4.4%) |
| $5,000 to $9,999 | 4,004 (0.6%) | 8,761 (2.8%) |
| $10,000 to $14,999 | 7,602 (1.2%) | 19,174 (6.1%) |
| $15,000 to $19,999 | 9,909 (1.6%) | 14,526 (4.6%) |
| $20,000 to $24,999 | 11,503 (1.8%) | 16,207 (5.1%) |
| $25,000 to $34,999 | 27,624 (4.4%) | 30,170 (9.6%) |
| $35,000 to $49,999 | 43,606 (6.9%) | 41,810 (13.2%) |
| $50,000 to $74,999 | 79,788 (12.6%) | 55,630 (17.6%) |
| $75,000 to $99,999 | 77,006 (12.1%) | 40,622 (12.9%) |
| $100,000 to $149,999 | 131,247 (20.7%) | 41,532 (13.2%) |
| $150,000 or more | 234,426 (37.0%) | 33,437 (10.6%) |
| Total | 634,182 (100.0%) | 315,698 (100.0%) |
Monthly Housing Cost Tiers in Area Code 484
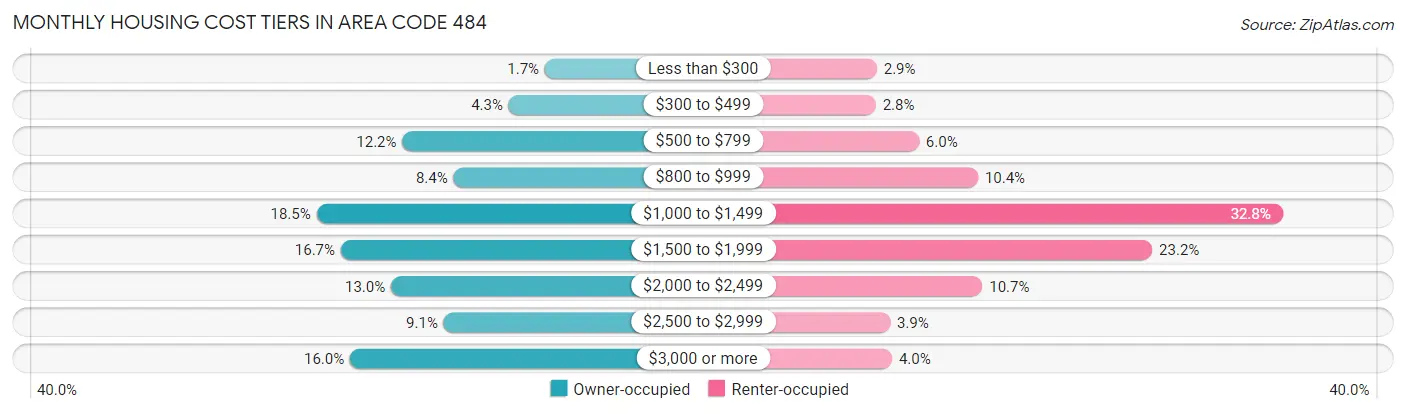
| Monthly Cost | Owner-occupied | Renter-occupied |
| Less than $300 | 10,636 (1.7%) | 9,169 (2.9%) |
| $300 to $499 | 27,520 (4.3%) | 8,911 (2.8%) |
| $500 to $799 | 77,250 (12.2%) | 18,953 (6.0%) |
| $800 to $999 | 53,342 (8.4%) | 32,665 (10.3%) |
| $1,000 to $1,499 | 117,342 (18.5%) | 103,512 (32.8%) |
| $1,500 to $1,999 | 106,002 (16.7%) | 73,164 (23.2%) |
| $2,000 to $2,499 | 82,522 (13.0%) | 33,680 (10.7%) |
| $2,500 to $2,999 | 57,899 (9.1%) | 12,206 (3.9%) |
| $3,000 or more | 101,669 (16.0%) | 12,678 (4.0%) |
| Total | 634,182 (100.0%) | 315,698 (100.0%) |
Physical Housing Characteristics in Area Code 484
Housing Structures in Area Code 484
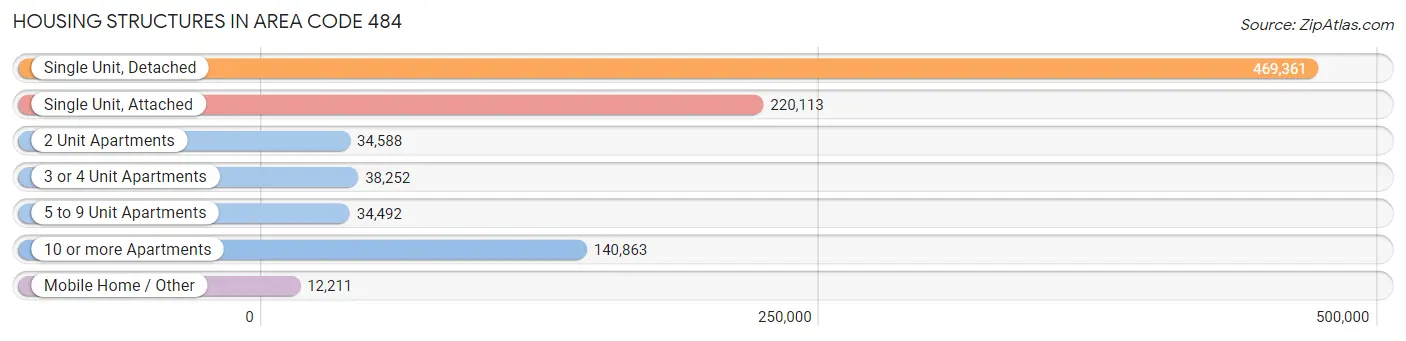
| Structure Type | # Housing Units | % Housing Units |
| Single Unit, Detached | 469,361 | 49.4% |
| Single Unit, Attached | 220,113 | 23.2% |
| 2 Unit Apartments | 34,588 | 3.6% |
| 3 or 4 Unit Apartments | 38,252 | 4.0% |
| 5 to 9 Unit Apartments | 34,492 | 3.6% |
| 10 or more Apartments | 140,863 | 14.8% |
| Mobile Home / Other | 12,211 | 1.3% |
| Total | 949,880 | 100.0% |
Housing Structures by Occupancy in Area Code 484
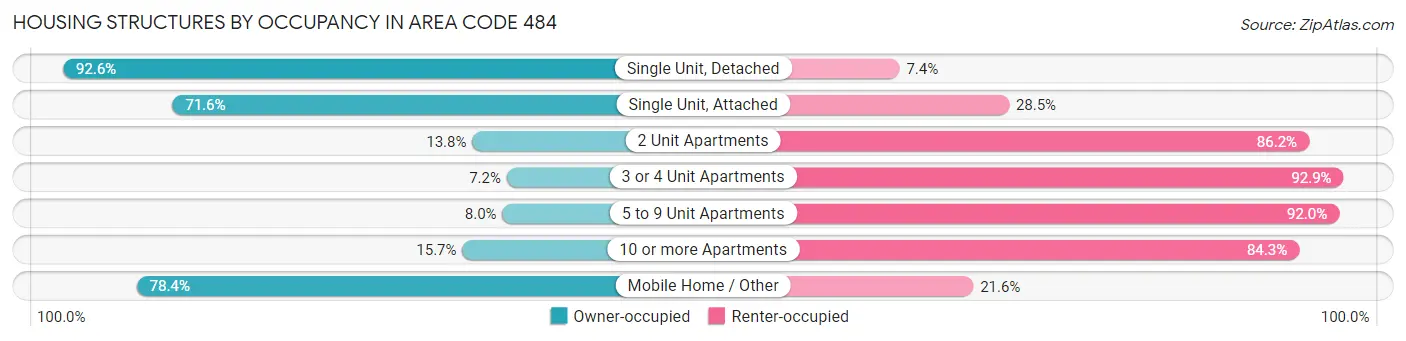
| Structure Type | Owner-occupied | Renter-occupied |
| Single Unit, Detached | 434,705 (92.6%) | 34,656 (7.4%) |
| Single Unit, Attached | 157,499 (71.6%) | 62,614 (28.4%) |
| 2 Unit Apartments | 4,772 (13.8%) | 29,816 (86.2%) |
| 3 or 4 Unit Apartments | 2,735 (7.1%) | 35,517 (92.8%) |
| 5 to 9 Unit Apartments | 2,760 (8.0%) | 31,732 (92.0%) |
| 10 or more Apartments | 22,134 (15.7%) | 118,729 (84.3%) |
| Mobile Home / Other | 9,577 (78.4%) | 2,634 (21.6%) |
| Total | 634,182 (66.8%) | 315,698 (33.2%) |
Housing Structures by Number of Rooms in Area Code 484
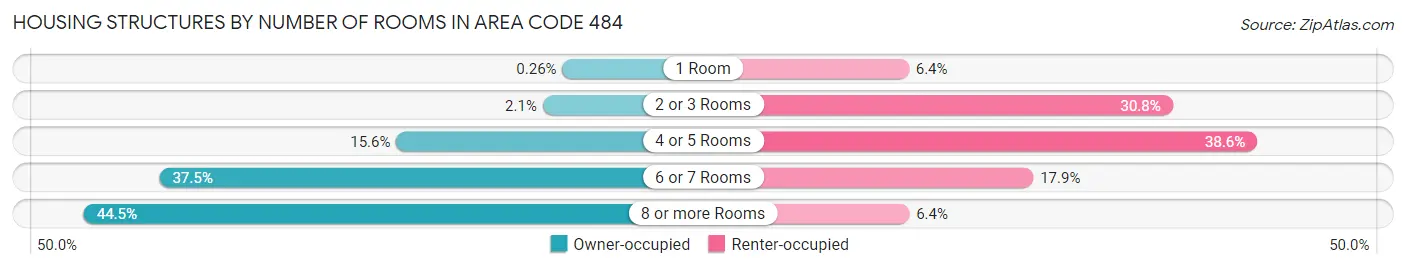
| Number of Rooms | Owner-occupied | Renter-occupied |
| 1 Room | 1,658 (0.3%) | 20,119 (6.4%) |
| 2 or 3 Rooms | 13,202 (2.1%) | 97,111 (30.8%) |
| 4 or 5 Rooms | 99,058 (15.6%) | 121,793 (38.6%) |
| 6 or 7 Rooms | 237,950 (37.5%) | 56,452 (17.9%) |
| 8 or more Rooms | 282,314 (44.5%) | 20,223 (6.4%) |
| Total | 634,182 (100.0%) | 315,698 (100.0%) |
Housing Structure by Heating Type in Area Code 484
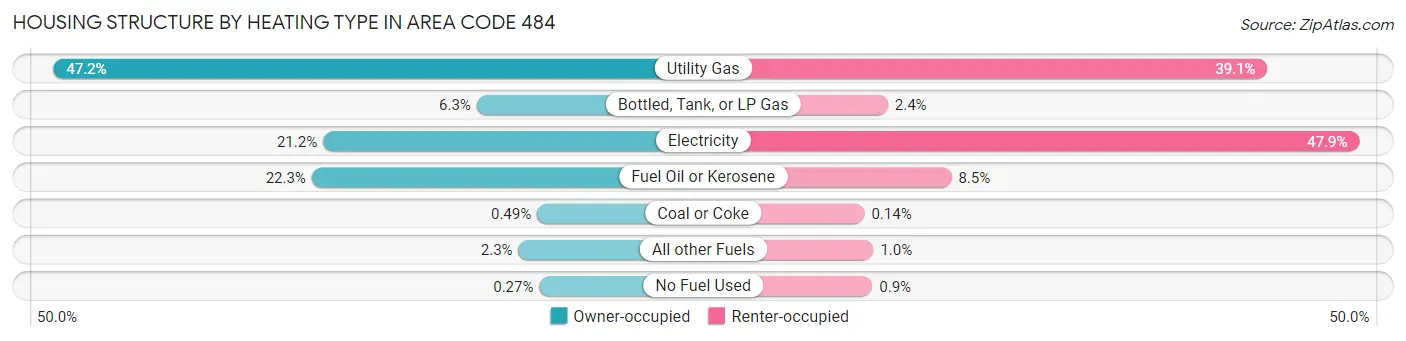
| Heating Type | Owner-occupied | Renter-occupied |
| Utility Gas | 299,446 (47.2%) | 123,348 (39.1%) |
| Bottled, Tank, or LP Gas | 40,061 (6.3%) | 7,583 (2.4%) |
| Electricity | 134,234 (21.2%) | 151,332 (47.9%) |
| Fuel Oil or Kerosene | 141,144 (22.3%) | 26,956 (8.5%) |
| Coal or Coke | 3,102 (0.5%) | 446 (0.1%) |
| All other Fuels | 14,498 (2.3%) | 3,186 (1.0%) |
| No Fuel Used | 1,697 (0.3%) | 2,847 (0.9%) |
| Total | 634,182 (100.0%) | 315,698 (100.0%) |
Household Vehicle Usage in Area Code 484
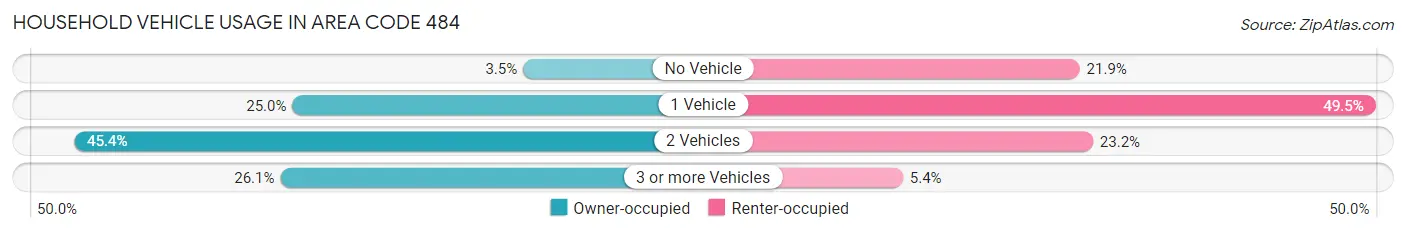
| Vehicles per Household | Owner-occupied | Renter-occupied |
| No Vehicle | 22,029 (3.5%) | 69,168 (21.9%) |
| 1 Vehicle | 158,618 (25.0%) | 156,374 (49.5%) |
| 2 Vehicles | 287,822 (45.4%) | 73,074 (23.2%) |
| 3 or more Vehicles | 165,713 (26.1%) | 17,082 (5.4%) |
| Total | 634,182 (100.0%) | 315,698 (100.0%) |
Real Estate & Mortgages in Area Code 484
Real Estate and Mortgage Overview in Area Code 484
| Characteristic | Without Mortgage | With Mortgage |
| Housing Units | 219,984 | 414,198 |
| Median Property Value | $47,845,700 | $53,477,500 |
| Median Household Income | $12,690,961 | $179,732 |
| Monthly Housing Costs | $122,757 | $98,950 |
| Real Estate Taxes | $735,659 | $4,421 |
Property Value by Mortgage Status in Area Code 484
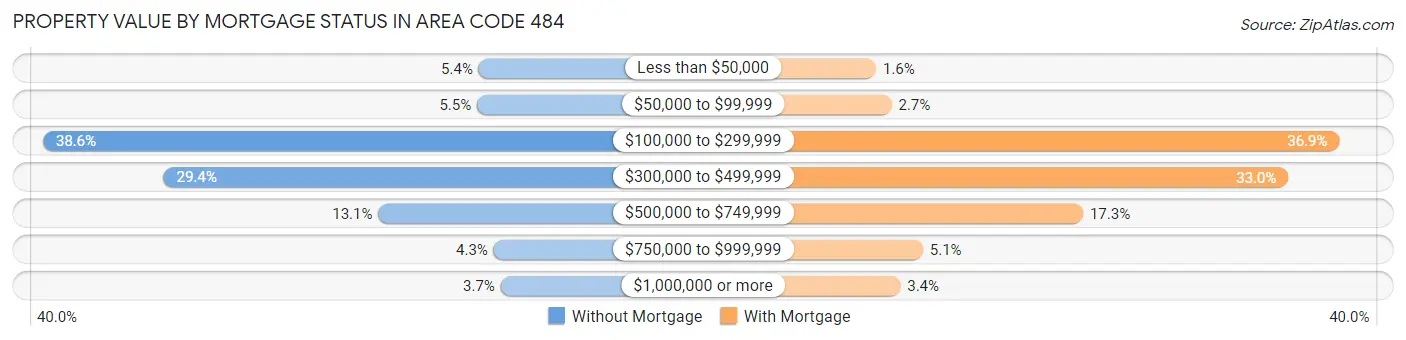
| Property Value | Without Mortgage | With Mortgage |
| Less than $50,000 | 11,883 (5.4%) | 6,471 (1.6%) |
| $50,000 to $99,999 | 12,158 (5.5%) | 11,351 (2.7%) |
| $100,000 to $299,999 | 84,946 (38.6%) | 152,678 (36.9%) |
| $300,000 to $499,999 | 64,705 (29.4%) | 136,569 (33.0%) |
| $500,000 to $749,999 | 28,711 (13.1%) | 71,781 (17.3%) |
| $750,000 to $999,999 | 9,380 (4.3%) | 21,238 (5.1%) |
| $1,000,000 or more | 8,201 (3.7%) | 14,110 (3.4%) |
| Total | 219,984 (100.0%) | 414,198 (100.0%) |
Household Income by Mortgage Status in Area Code 484
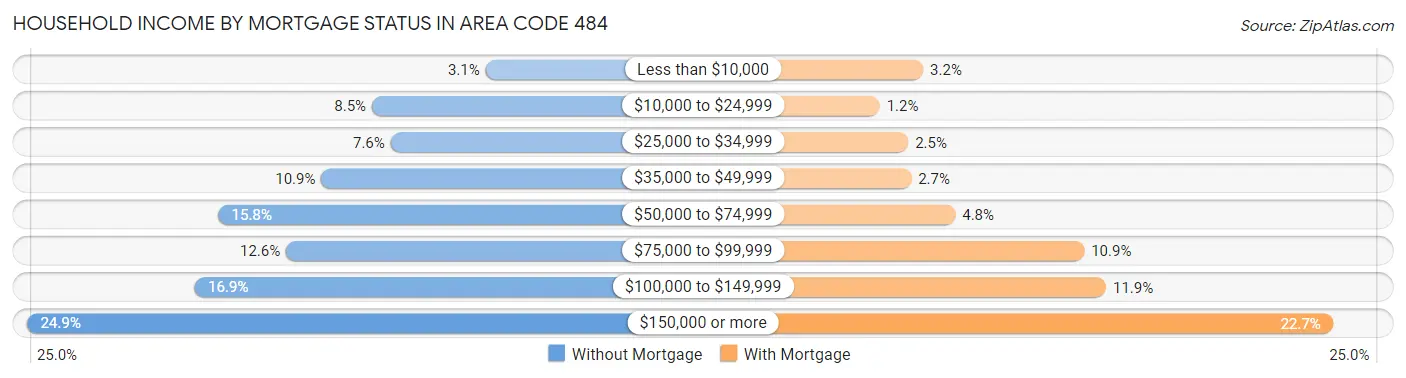
| Household Income | Without Mortgage | With Mortgage |
| Less than $10,000 | 6,709 (3.0%) | 13,321 (3.2%) |
| $10,000 to $24,999 | 18,613 (8.5%) | 4,762 (1.1%) |
| $25,000 to $34,999 | 16,650 (7.6%) | 10,401 (2.5%) |
| $35,000 to $49,999 | 23,911 (10.9%) | 10,974 (2.6%) |
| $50,000 to $74,999 | 34,669 (15.8%) | 19,695 (4.8%) |
| $75,000 to $99,999 | 27,606 (12.6%) | 45,119 (10.9%) |
| $100,000 to $149,999 | 37,132 (16.9%) | 49,400 (11.9%) |
| $150,000 or more | 54,694 (24.9%) | 94,115 (22.7%) |
| Total | 219,984 (100.0%) | 414,198 (100.0%) |
Property Value to Household Income Ratio in Area Code 484
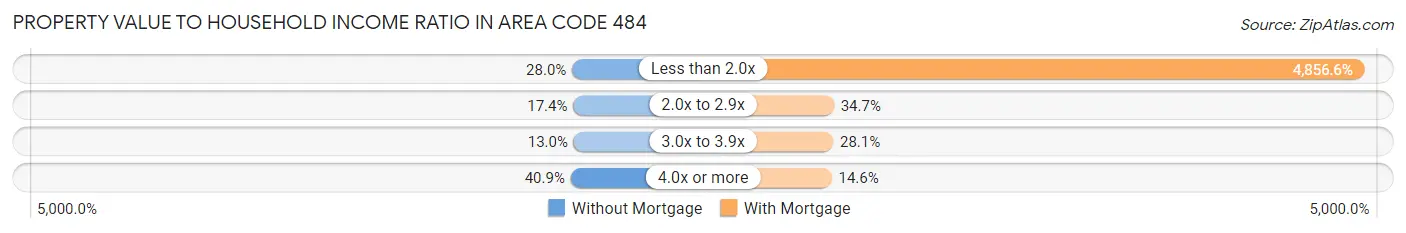
| Value-to-Income Ratio | Without Mortgage | With Mortgage |
| Less than 2.0x | 61,626 (28.0%) | 20,115,794 (4,856.6%) |
| 2.0x to 2.9x | 38,174 (17.3%) | 143,704 (34.7%) |
| 3.0x to 3.9x | 28,583 (13.0%) | 116,419 (28.1%) |
| 4.0x or more | 90,007 (40.9%) | 60,422 (14.6%) |
| Total | 219,984 (100.0%) | 414,198 (100.0%) |
Real Estate Taxes by Mortgage Status in Area Code 484
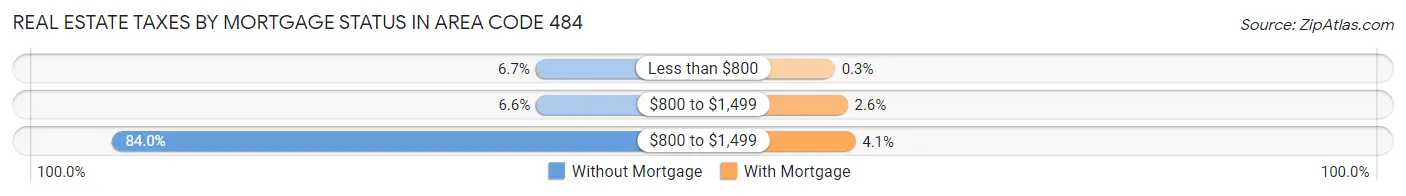
| Property Taxes | Without Mortgage | With Mortgage |
| Less than $800 | 14,619 (6.7%) | 1,231 (0.3%) |
| $800 to $1,499 | 14,465 (6.6%) | 10,929 (2.6%) |
| $800 to $1,499 | 184,677 (84.0%) | 16,835 (4.1%) |
| Total | 219,984 (100.0%) | 414,198 (100.0%) |
Health & Disability in Area Code 484
Health Insurance Coverage by Age in Area Code 484
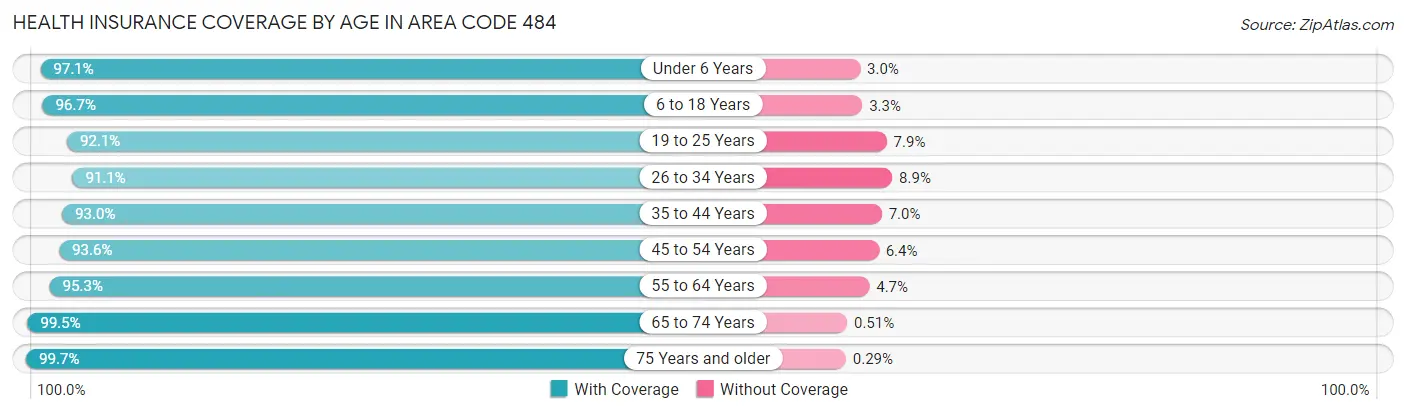
| Age Bracket | With Coverage | Without Coverage |
| Under 6 Years | 153,798 (97.1%) | 4,682 (2.9%) |
| 6 to 18 Years | 375,636 (96.7%) | 12,976 (3.3%) |
| 19 to 25 Years | 205,595 (92.1%) | 17,636 (7.9%) |
| 26 to 34 Years | 270,198 (91.1%) | 26,496 (8.9%) |
| 35 to 44 Years | 285,126 (93.0%) | 21,406 (7.0%) |
| 45 to 54 Years | 282,228 (93.6%) | 19,350 (6.4%) |
| 55 to 64 Years | 312,351 (95.3%) | 15,267 (4.7%) |
| 65 to 74 Years | 236,865 (99.5%) | 1,226 (0.5%) |
| 75 Years and older | 168,935 (99.7%) | 498 (0.3%) |
| Total | 2,290,732 (95.0%) | 119,537 (5.0%) |
Health Insurance Coverage by Citizenship Status in Area Code 484
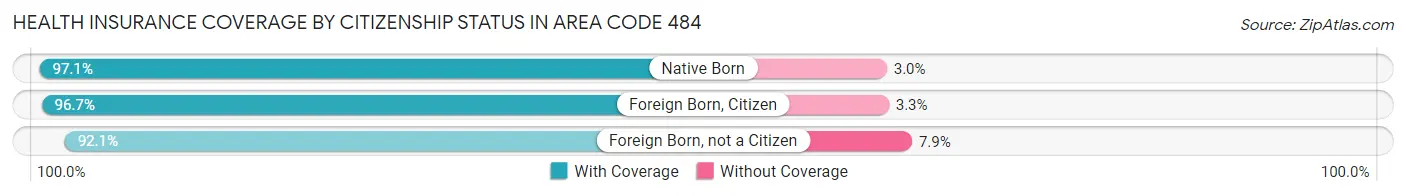
| Citizenship Status | With Coverage | Without Coverage |
| Native Born | 153,798 (97.1%) | 4,682 (2.9%) |
| Foreign Born, Citizen | 375,636 (96.7%) | 12,976 (3.3%) |
| Foreign Born, not a Citizen | 205,595 (92.1%) | 17,636 (7.9%) |
Health Insurance Coverage by Household Income in Area Code 484
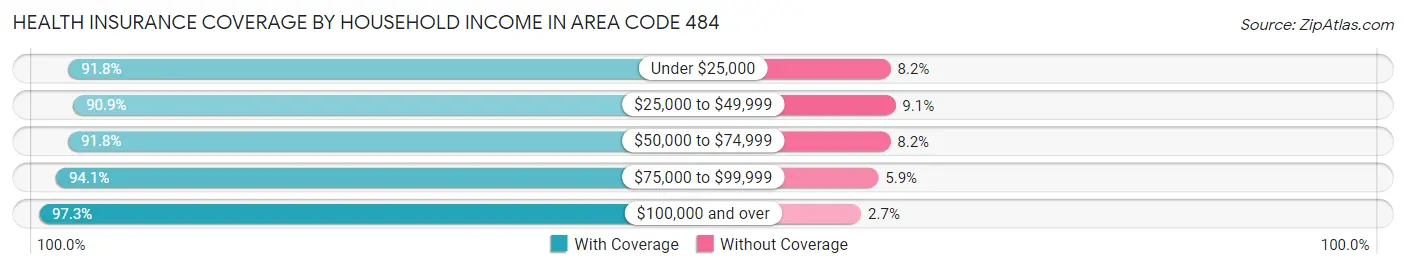
| Household Income | With Coverage | Without Coverage |
| Under $25,000 | 175,816 (91.8%) | 15,718 (8.2%) |
| $25,000 to $49,999 | 252,395 (90.9%) | 25,293 (9.1%) |
| $50,000 to $74,999 | 271,935 (91.8%) | 24,168 (8.2%) |
| $75,000 to $99,999 | 268,491 (94.1%) | 16,862 (5.9%) |
| $100,000 and over | 1,271,766 (97.3%) | 35,092 (2.7%) |
Public vs Private Health Insurance Coverage by Age in Area Code 484
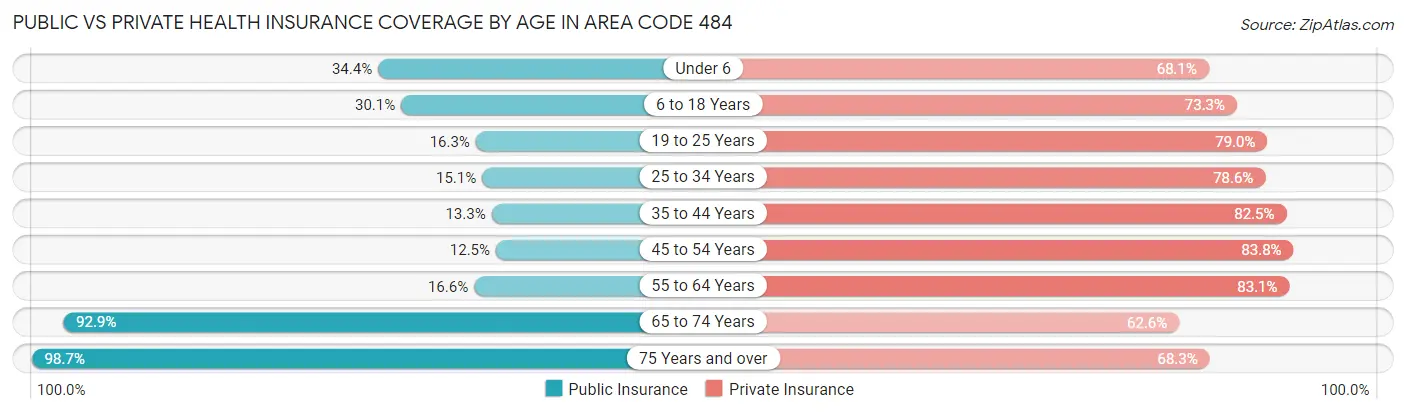
| Age Bracket | Public Insurance | Private Insurance |
| Under 6 | 54,530 (34.4%) | 107,963 (68.1%) |
| 6 to 18 Years | 117,087 (30.1%) | 284,939 (73.3%) |
| 19 to 25 Years | 36,325 (16.3%) | 176,283 (79.0%) |
| 25 to 34 Years | 44,776 (15.1%) | 233,148 (78.6%) |
| 35 to 44 Years | 40,894 (13.3%) | 252,912 (82.5%) |
| 45 to 54 Years | 37,798 (12.5%) | 252,822 (83.8%) |
| 55 to 64 Years | 54,339 (16.6%) | 272,157 (83.1%) |
| 65 to 74 Years | 221,070 (92.8%) | 149,045 (62.6%) |
| 75 Years and over | 167,271 (98.7%) | 115,643 (68.2%) |
| Total | 774,090 (32.1%) | 1,844,912 (76.5%) |
Disability Status by Sex by Age in Area Code 484
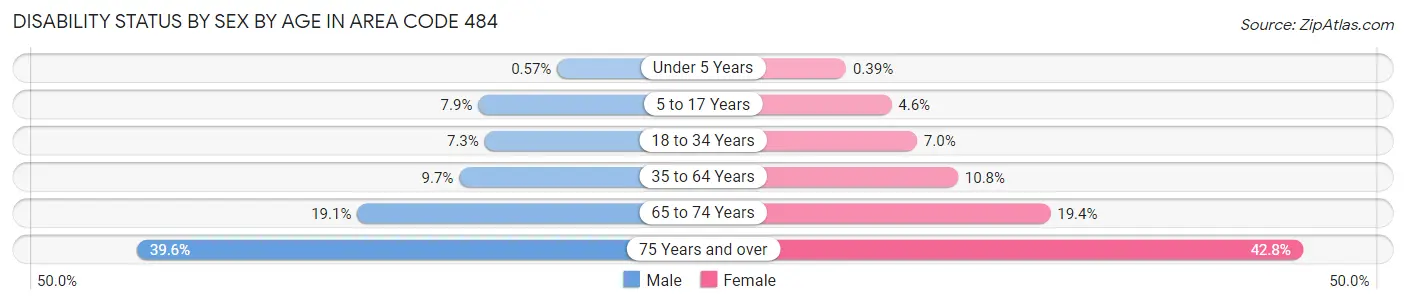
| Age Bracket | Male | Female |
| Under 5 Years | 388 (0.6%) | 249 (0.4%) |
| 5 to 17 Years | 15,330 (7.9%) | 8,515 (4.6%) |
| 18 to 34 Years | 20,377 (7.3%) | 19,366 (7.0%) |
| 35 to 64 Years | 44,821 (9.7%) | 50,837 (10.8%) |
| 65 to 74 Years | 21,513 (19.1%) | 24,304 (19.4%) |
| 75 Years and over | 27,043 (39.6%) | 43,236 (42.8%) |
Disability Class by Sex by Age in Area Code 484
Disability Class: Hearing Difficulty
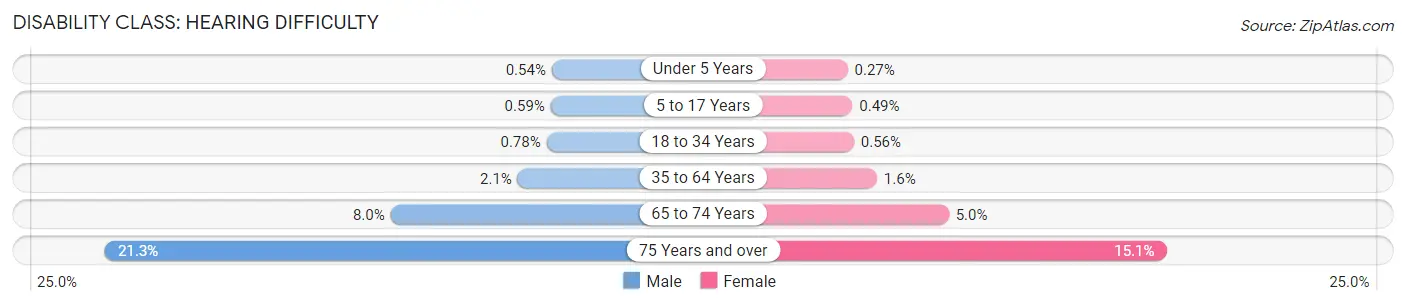
| Age Bracket | Male | Female |
| Under 5 Years | 365 (0.5%) | 173 (0.3%) |
| 5 to 17 Years | 1,145 (0.6%) | 903 (0.5%) |
| 18 to 34 Years | 2,176 (0.8%) | 1,564 (0.6%) |
| 35 to 64 Years | 9,842 (2.1%) | 7,683 (1.6%) |
| 65 to 74 Years | 9,025 (8.0%) | 6,236 (5.0%) |
| 75 Years and over | 14,533 (21.3%) | 15,228 (15.1%) |
Disability Class: Vision Difficulty
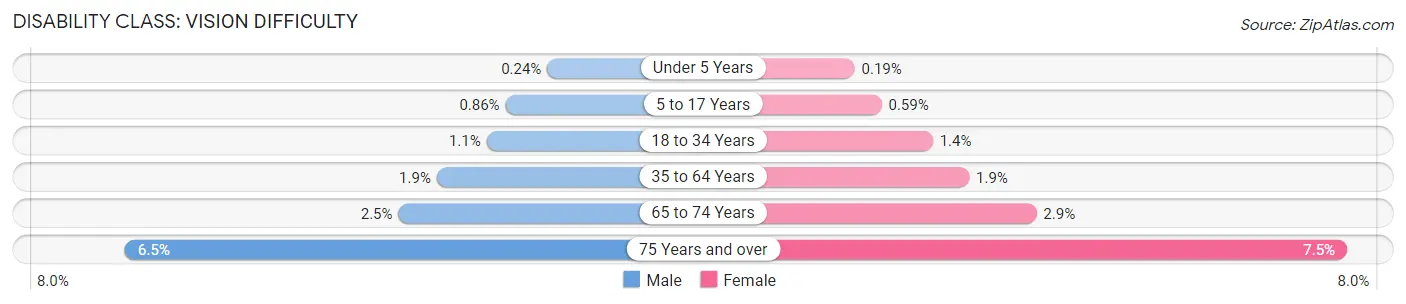
| Age Bracket | Male | Female |
| Under 5 Years | 161 (0.2%) | 119 (0.2%) |
| 5 to 17 Years | 1,660 (0.9%) | 1,091 (0.6%) |
| 18 to 34 Years | 3,182 (1.1%) | 3,759 (1.3%) |
| 35 to 64 Years | 8,721 (1.9%) | 8,920 (1.9%) |
| 65 to 74 Years | 2,757 (2.5%) | 3,632 (2.9%) |
| 75 Years and over | 4,447 (6.5%) | 7,587 (7.5%) |
Disability Class: Cognitive Difficulty
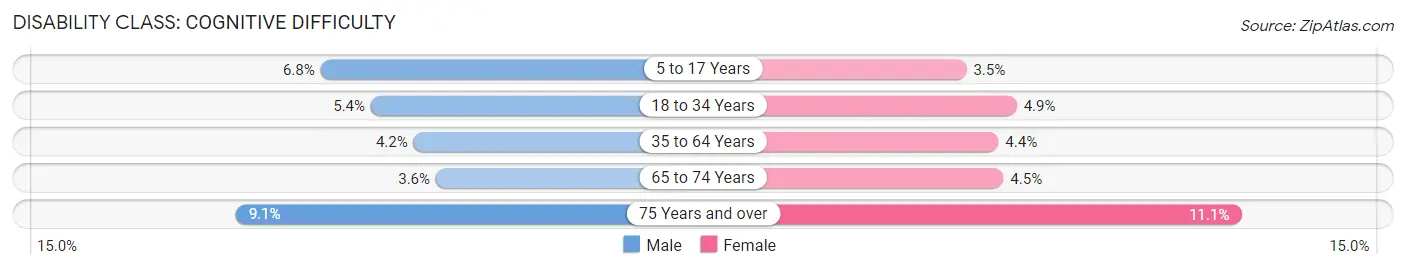
| Age Bracket | Male | Female |
| 5 to 17 Years | 13,117 (6.8%) | 6,412 (3.5%) |
| 18 to 34 Years | 14,939 (5.4%) | 13,536 (4.9%) |
| 35 to 64 Years | 19,331 (4.2%) | 20,578 (4.4%) |
| 65 to 74 Years | 3,998 (3.5%) | 5,658 (4.5%) |
| 75 Years and over | 6,235 (9.1%) | 11,244 (11.1%) |
Disability Class: Ambulatory Difficulty
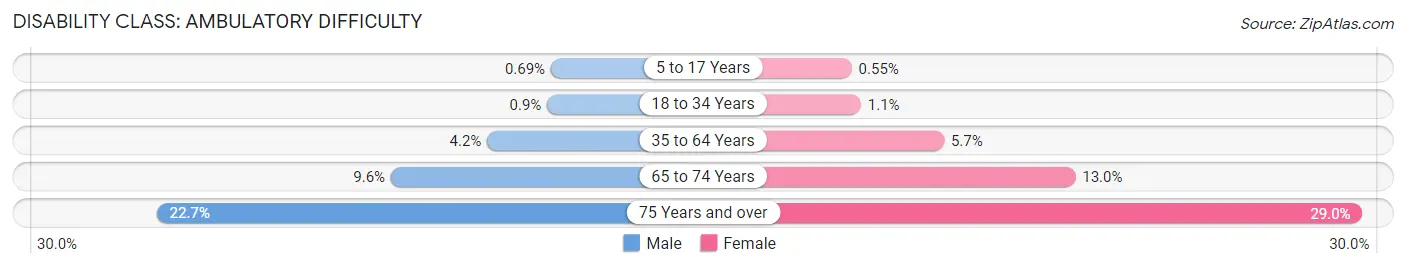
| Age Bracket | Male | Female |
| 5 to 17 Years | 1,340 (0.7%) | 1,023 (0.5%) |
| 18 to 34 Years | 2,499 (0.9%) | 2,957 (1.1%) |
| 35 to 64 Years | 19,642 (4.2%) | 26,840 (5.7%) |
| 65 to 74 Years | 10,800 (9.6%) | 16,326 (13.0%) |
| 75 Years and over | 15,479 (22.7%) | 29,313 (29.0%) |
Disability Class: Self-Care Difficulty
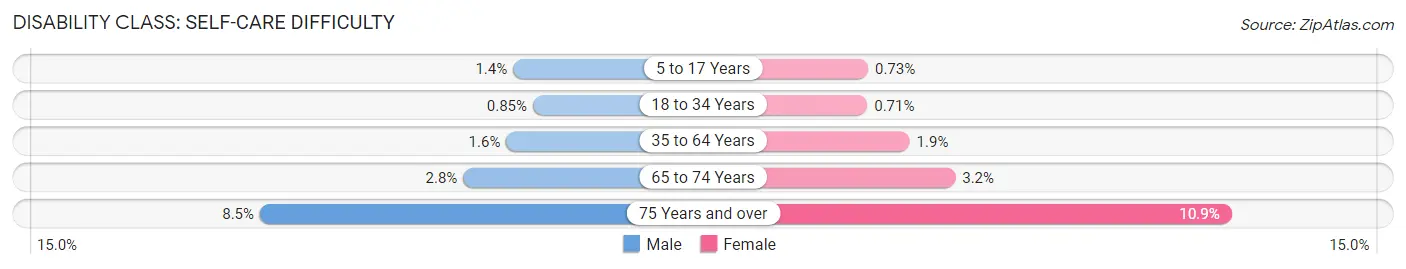
| Age Bracket | Male | Female |
| 5 to 17 Years | 2,722 (1.4%) | 1,343 (0.7%) |
| 18 to 34 Years | 2,377 (0.9%) | 1,962 (0.7%) |
| 35 to 64 Years | 7,373 (1.6%) | 8,931 (1.9%) |
| 65 to 74 Years | 3,135 (2.8%) | 3,967 (3.2%) |
| 75 Years and over | 5,775 (8.5%) | 10,972 (10.8%) |
Technology Access in Area Code 484
Computing Device Access in Area Code 484
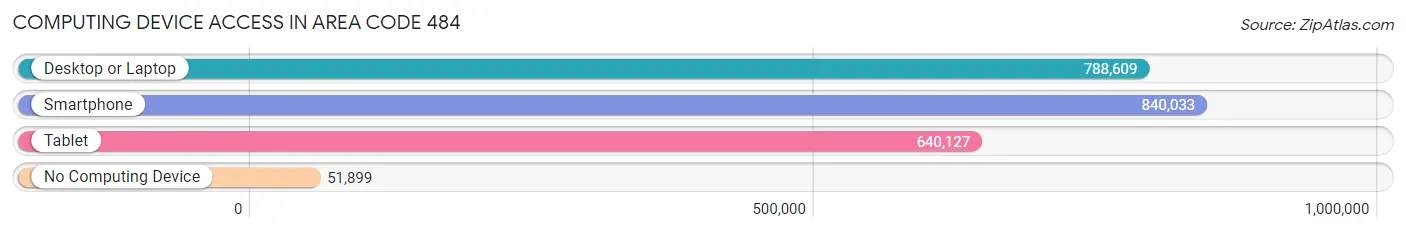
| Device Type | # Households | % Households |
| Desktop or Laptop | 788,609 | 83.0% |
| Smartphone | 840,033 | 88.4% |
| Tablet | 640,127 | 67.4% |
| No Computing Device | 51,899 | 5.5% |
| Total | 949,880 | 100.0% |
Internet Access in Area Code 484
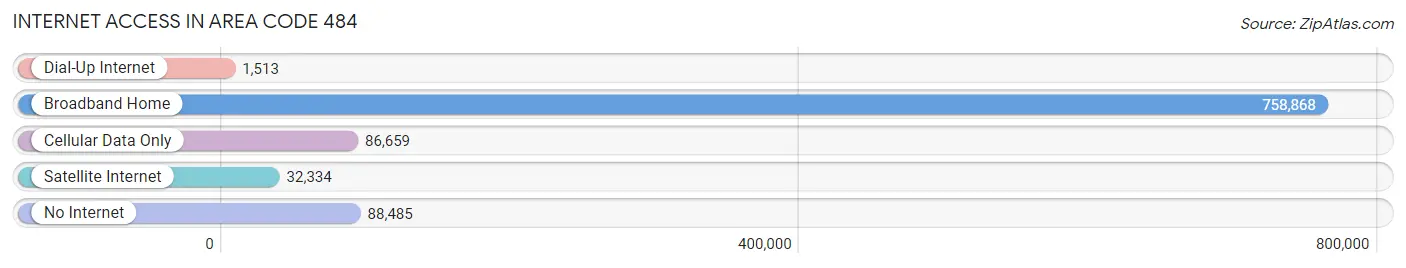
| Internet Type | # Households | % Households |
| Dial-Up Internet | 1,513 | 0.2% |
| Broadband Home | 758,868 | 79.9% |
| Cellular Data Only | 86,659 | 9.1% |
| Satellite Internet | 32,334 | 3.4% |
| No Internet | 88,485 | 9.3% |
| Total | 949,880 | 100.0% |
Area Code 484 Summary
Geography
Area code 484 is a telephone area code in the North American Numbering Plan (NANP) for the eastern half of Pennsylvania. It was created in 1999 as a split from area code 610. It serves the cities of Allentown, Bethlehem, Reading, and the surrounding areas.
Social
Area code 484 is a vibrant and diverse area with a wide range of cultural and recreational activities. The area is home to a variety of museums, galleries, and performing arts venues, as well as a number of professional sports teams. The area is also home to a number of colleges and universities, making it a popular destination for students.
Economics
Area code 484 is an economically diverse area, with a mix of industries ranging from manufacturing to technology. The area is home to a number of Fortune 500 companies, including Air Products and Chemicals, PPL Corporation, and Crayola. The area is also home to a number of smaller businesses, making it a popular destination for entrepreneurs.
Demographics
Area code 484 is home to a diverse population, with a mix of ethnicities and backgrounds. According to the most recent census data, the population of the area is approximately 1.7 million people. The area is also home to a large number of immigrants, with a significant percentage of the population being foreign-born.
Common Questions
What is Per Capita Income in Area Code 484?
Per Capita income in Area Code 484 is $53,107.
What is the Median Family Income in Area Code 484?
Median Family Income in Area Code 484 is $129,502.
What is the Median Household income in Area Code 484?
Median Household Income in Area Code 484 is $104,913.
What is Income or Wage Gap in Area Code 484?
Income or Wage Gap in Area Code 484 is 31.0%.
Women in Area Code 484 earn 69.0 cents for every dollar earned by a man.
What is Family Income Deficit in Area Code 484?
Family Income Deficit in Area Code 484 is $11,389.
Families that are below poverty line in Area Code 484 earn $11,389 less on average than the poverty threshold level.
What is Inequality or Gini Index in Area Code 484?
Inequality or Gini Index in Area Code 484 is 64.64.
What is the Total Population of Area Code 484?
Total Population of Area Code 484 is 2,442,093.
What is the Total Male Population of Area Code 484?
Total Male Population of Area Code 484 is 1,204,261.
What is the Total Female Population of Area Code 484?
Total Female Population of Area Code 484 is 1,237,832.
What is the Ratio of Males per 100 Females in Area Code 484?
There are 97.29 Males per 100 Females in Area Code 484.
What is the Ratio of Females per 100 Males in Area Code 484?
There are 102.79 Females per 100 Males in Area Code 484.
What is the Median Population Age in Area Code 484?
Median Population Age in Area Code 484 is 41.8 Years.
What is the Average Family Size in Area Code 484
Average Family Size in Area Code 484 is 3.1 People.
What is the Average Household Size in Area Code 484
Average Household Size in Area Code 484 is 2.5 People.
How Large is the Labor Force in Area Code 484?
There are 1,329,998 People in the Labor Forcein in Area Code 484.
What is the Percentage of People in the Labor Force in Area Code 484?
66.8% of People are in the Labor Force in Area Code 484.
What is the Unemployment Rate in Area Code 484?
Unemployment Rate in Area Code 484 is 5.2%.