Montgomery County, PA Map & Demographics
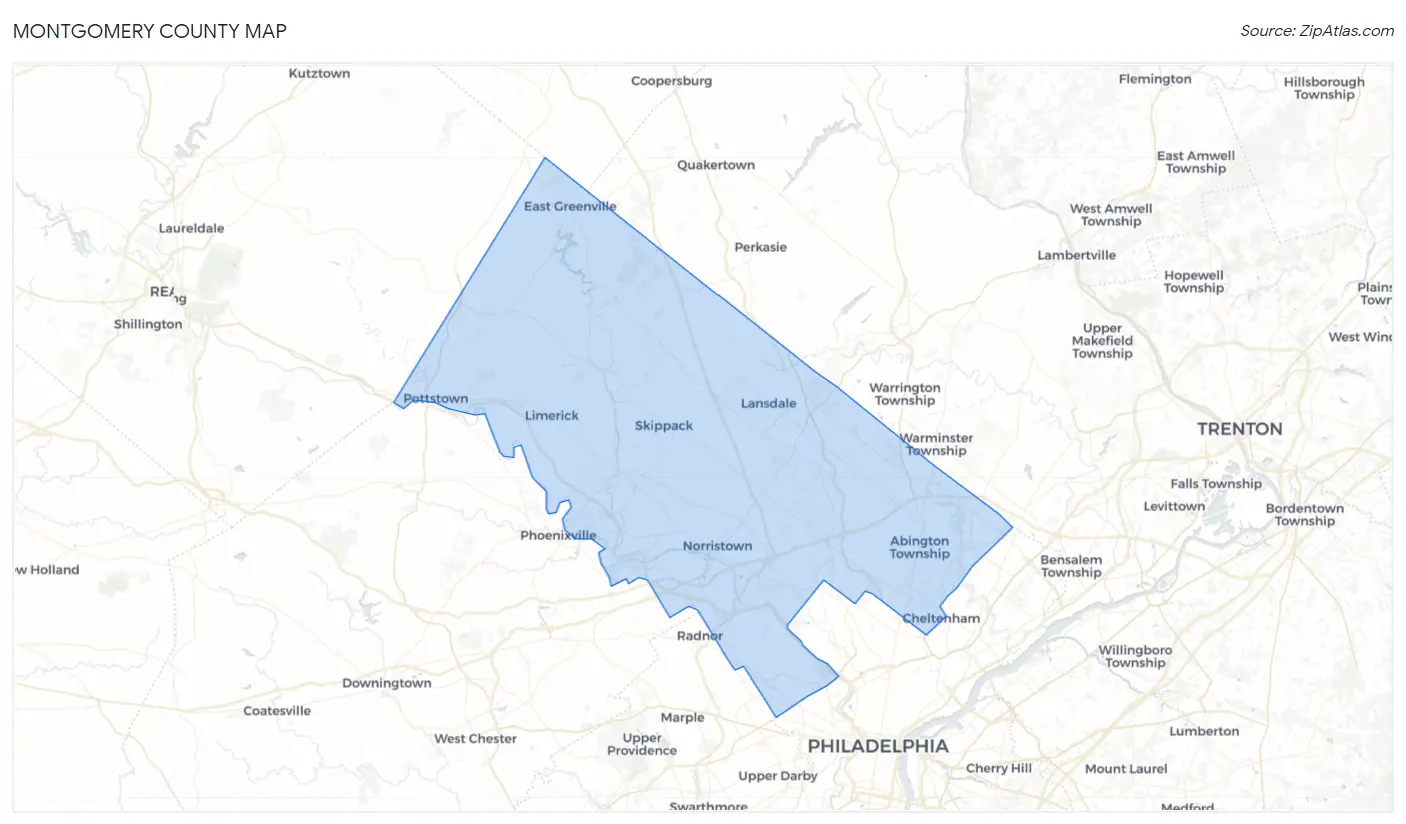
Montgomery County Map
Montgomery County Overview
$57,945
PER CAPITA INCOME
$134,397
AVG FAMILY INCOME
$107,441
AVG HOUSEHOLD INCOME
29.6%
WAGE / INCOME GAP [ % ]
70.4¢/ $1
WAGE / INCOME GAP [ $ ]
$11,296
FAMILY INCOME DEFICIT
0.47
INEQUALITY / GINI INDEX
856,399
TOTAL POPULATION
419,933
MALE POPULATION
436,466
FEMALE POPULATION
96.21
MALES / 100 FEMALES
103.94
FEMALES / 100 MALES
41.2
MEDIAN AGE
3.1
AVG FAMILY SIZE
2.5
AVG HOUSEHOLD SIZE
473,989
LABOR FORCE [ PEOPLE ]
68.2%
PERCENT IN LABOR FORCE
4.5%
UNEMPLOYMENT RATE
Income in Montgomery County
Income Overview in Montgomery County
Per Capita Income in Montgomery County is $57,945, while median incomes of families and households are $134,397 and $107,441 respectively.
| Characteristic | Number | Measure |
| Per Capita Income | 856,399 | $57,945 |
| Median Family Income | 223,129 | $134,397 |
| Mean Family Income | 223,129 | $177,697 |
| Median Household Income | 329,680 | $107,441 |
| Mean Household Income | 329,680 | $148,273 |
| Income Deficit | 223,129 | $11,296 |
| Wage / Income Gap (%) | 856,399 | 29.58% |
| Wage / Income Gap ($) | 856,399 | 70.42¢ per $1 |
| Gini / Inequality Index | 856,399 | 0.47 |
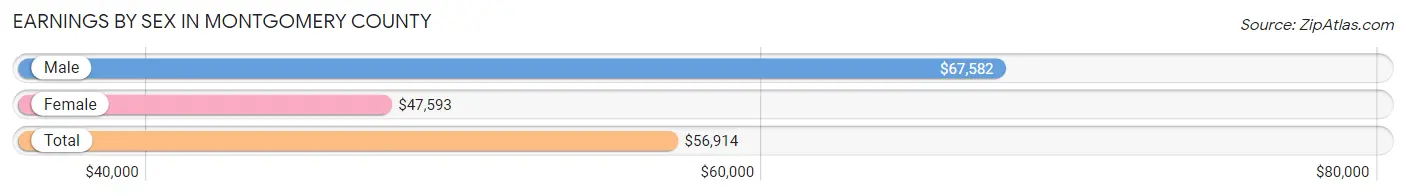
Earnings by Sex in Montgomery County
Average Earnings in Montgomery County are $56,914, $67,582 for men and $47,593 for women, a difference of 29.6%.
| Sex | Number | Average Earnings |
| Male | 255,756 (51.9%) | $67,582 |
| Female | 236,900 (48.1%) | $47,593 |
| Total | 492,656 (100.0%) | $56,914 |
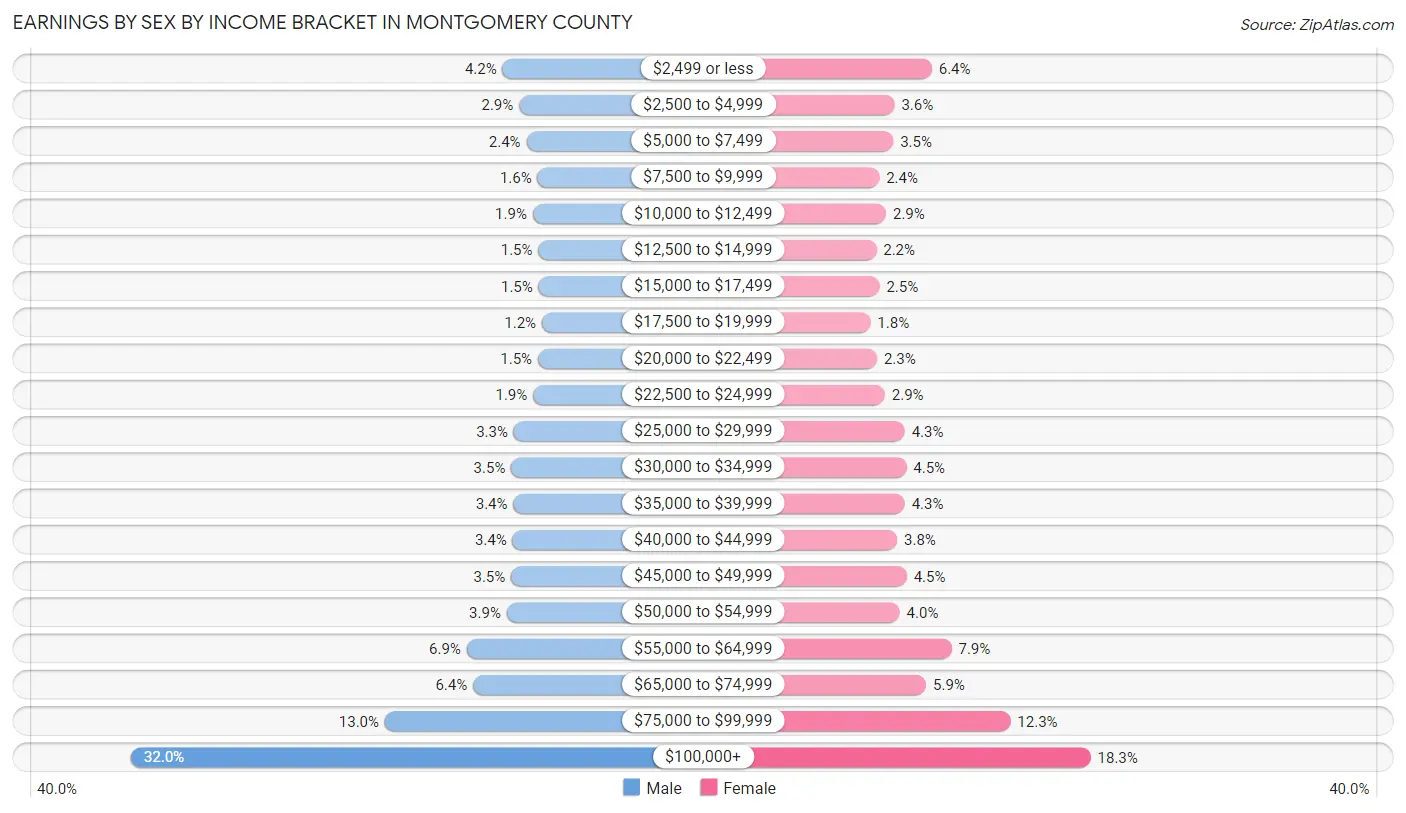
Earnings by Sex by Income Bracket in Montgomery County
The most common earnings brackets in Montgomery County are $100,000+ for men (81,921 | 32.0%) and $100,000+ for women (43,271 | 18.3%).
| Income | Male | Female |
| $2,499 or less | 10,698 (4.2%) | 15,094 (6.4%) |
| $2,500 to $4,999 | 7,521 (2.9%) | 8,467 (3.6%) |
| $5,000 to $7,499 | 6,107 (2.4%) | 8,240 (3.5%) |
| $7,500 to $9,999 | 4,001 (1.6%) | 5,746 (2.4%) |
| $10,000 to $12,499 | 4,905 (1.9%) | 6,971 (2.9%) |
| $12,500 to $14,999 | 3,831 (1.5%) | 5,232 (2.2%) |
| $15,000 to $17,499 | 3,790 (1.5%) | 5,803 (2.5%) |
| $17,500 to $19,999 | 3,142 (1.2%) | 4,191 (1.8%) |
| $20,000 to $22,499 | 3,912 (1.5%) | 5,345 (2.3%) |
| $22,500 to $24,999 | 4,839 (1.9%) | 6,743 (2.9%) |
| $25,000 to $29,999 | 8,542 (3.3%) | 10,279 (4.3%) |
| $30,000 to $34,999 | 9,039 (3.5%) | 10,574 (4.5%) |
| $35,000 to $39,999 | 8,626 (3.4%) | 10,273 (4.3%) |
| $40,000 to $44,999 | 8,763 (3.4%) | 8,926 (3.8%) |
| $45,000 to $49,999 | 9,059 (3.5%) | 10,640 (4.5%) |
| $50,000 to $54,999 | 9,894 (3.9%) | 9,391 (4.0%) |
| $55,000 to $64,999 | 17,561 (6.9%) | 18,592 (7.9%) |
| $65,000 to $74,999 | 16,355 (6.4%) | 14,077 (5.9%) |
| $75,000 to $99,999 | 33,250 (13.0%) | 29,045 (12.3%) |
| $100,000+ | 81,921 (32.0%) | 43,271 (18.3%) |
| Total | 255,756 (100.0%) | 236,900 (100.0%) |
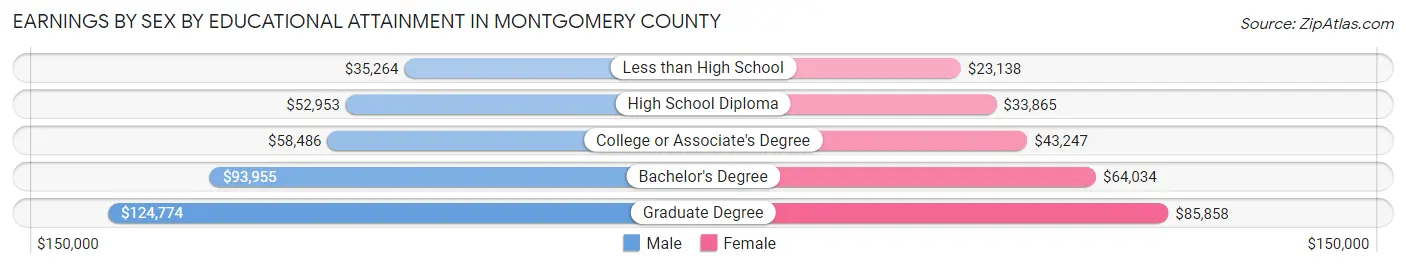
Earnings by Sex by Educational Attainment in Montgomery County
Average earnings in Montgomery County are $76,167 for men and $55,796 for women, a difference of 26.8%. Men with an educational attainment of graduate degree enjoy the highest average annual earnings of $124,774, while those with less than high school education earn the least with $35,264. Women with an educational attainment of graduate degree earn the most with the average annual earnings of $85,858, while those with less than high school education have the smallest earnings of $23,138.
| Educational Attainment | Male Income | Female Income |
| Less than High School | $35,264 | $23,138 |
| High School Diploma | $52,953 | $33,865 |
| College or Associate's Degree | $58,486 | $43,247 |
| Bachelor's Degree | $93,955 | $64,034 |
| Graduate Degree | $124,774 | $85,858 |
| Total | $76,167 | $55,796 |
Family Income in Montgomery County
Family Income Brackets in Montgomery County
According to the Montgomery County family income data, there are 64,261 families falling into the $200,000+ income range, which is the most common income bracket and makes up 28.8% of all families. Conversely, the $10,000 to $14,999 income bracket is the least frequent group with only 2,454 families (1.1%) belonging to this category.
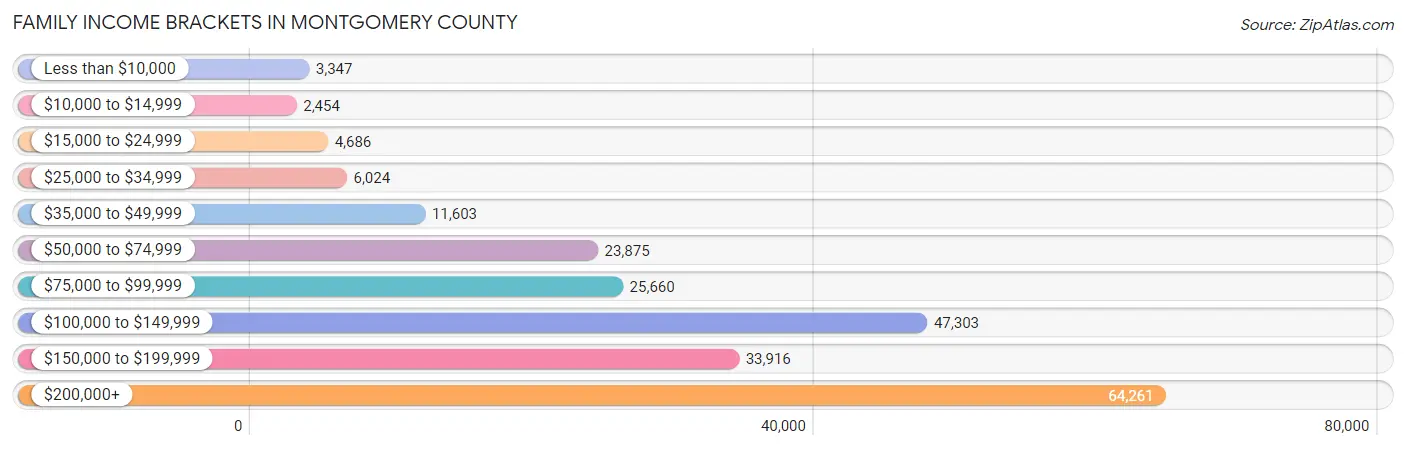
| Income Bracket | # Families | % Families |
| Less than $10,000 | 3,347 | 1.5% |
| $10,000 to $14,999 | 2,454 | 1.1% |
| $15,000 to $24,999 | 4,686 | 2.1% |
| $25,000 to $34,999 | 6,024 | 2.7% |
| $35,000 to $49,999 | 11,603 | 5.2% |
| $50,000 to $74,999 | 23,875 | 10.7% |
| $75,000 to $99,999 | 25,660 | 11.5% |
| $100,000 to $149,999 | 47,303 | 21.2% |
| $150,000 to $199,999 | 33,916 | 15.2% |
| $200,000+ | 64,261 | 28.8% |
Family Income by Famaliy Size in Montgomery County
5-person families (18,226 | 8.2%) account for the highest median family income in Montgomery County with $176,346 per family, while 2-person families (99,690 | 44.7%) have the highest median income of $55,806 per family member.
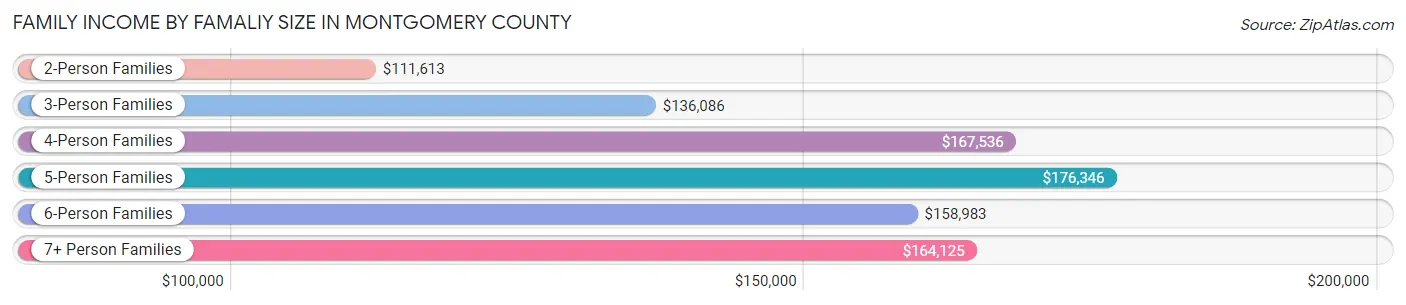
| Income Bracket | # Families | Median Income |
| 2-Person Families | 99,690 (44.7%) | $111,613 |
| 3-Person Families | 50,880 (22.8%) | $136,086 |
| 4-Person Families | 46,317 (20.8%) | $167,536 |
| 5-Person Families | 18,226 (8.2%) | $176,346 |
| 6-Person Families | 5,646 (2.5%) | $158,983 |
| 7+ Person Families | 2,370 (1.1%) | $164,125 |
| Total | 223,129 (100.0%) | $134,397 |
Family Income by Number of Earners in Montgomery County
The median family income in Montgomery County is $134,397, with families comprising 3+ earners (32,493) having the highest median family income of $183,750, while families with no earners (24,892) have the lowest median family income of $64,899, accounting for 14.6% and 11.2% of families, respectively.
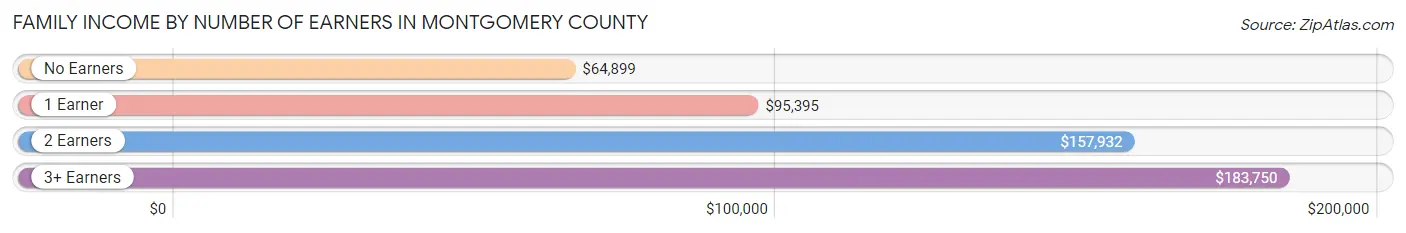
| Number of Earners | # Families | Median Income |
| No Earners | 24,892 (11.2%) | $64,899 |
| 1 Earner | 59,931 (26.9%) | $95,395 |
| 2 Earners | 105,813 (47.4%) | $157,932 |
| 3+ Earners | 32,493 (14.6%) | $183,750 |
| Total | 223,129 (100.0%) | $134,397 |
Household Income in Montgomery County
Household Income Brackets in Montgomery County
With 71,870 households falling in the category, the $200,000+ income range is the most frequent in Montgomery County, accounting for 21.8% of all households. In contrast, only 6,264 households (1.9%) fall into the $10,000 to $14,999 income bracket, making it the least populous group.
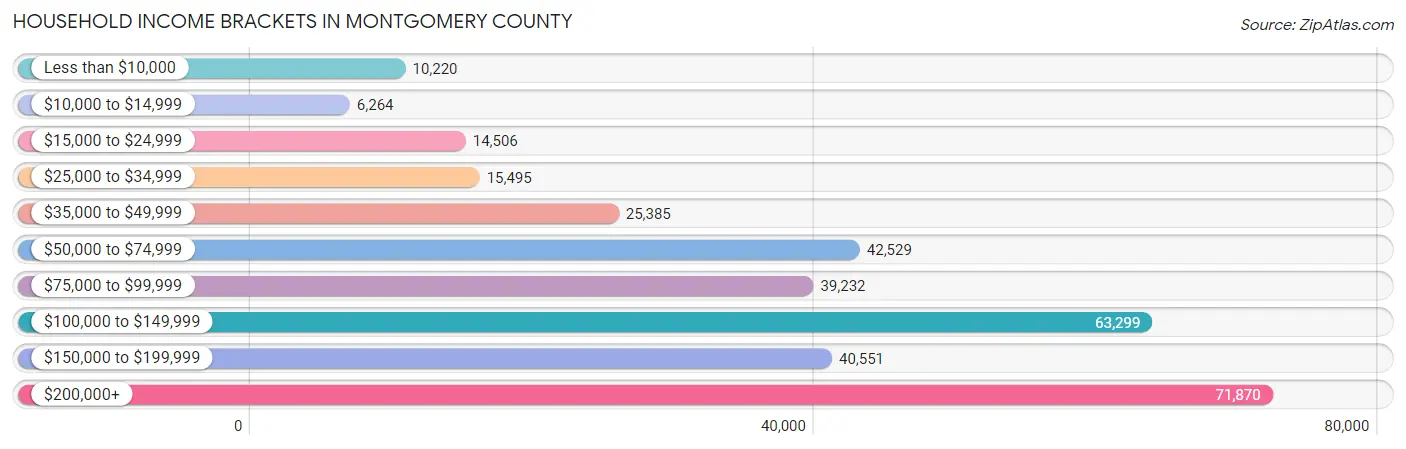
| Income Bracket | # Households | % Households |
| Less than $10,000 | 10,220 | 3.1% |
| $10,000 to $14,999 | 6,264 | 1.9% |
| $15,000 to $24,999 | 14,506 | 4.4% |
| $25,000 to $34,999 | 15,495 | 4.7% |
| $35,000 to $49,999 | 25,385 | 7.7% |
| $50,000 to $74,999 | 42,529 | 12.9% |
| $75,000 to $99,999 | 39,232 | 11.9% |
| $100,000 to $149,999 | 63,299 | 19.2% |
| $150,000 to $199,999 | 40,551 | 12.3% |
| $200,000+ | 71,870 | 21.8% |
Household Income by Householder Age in Montgomery County
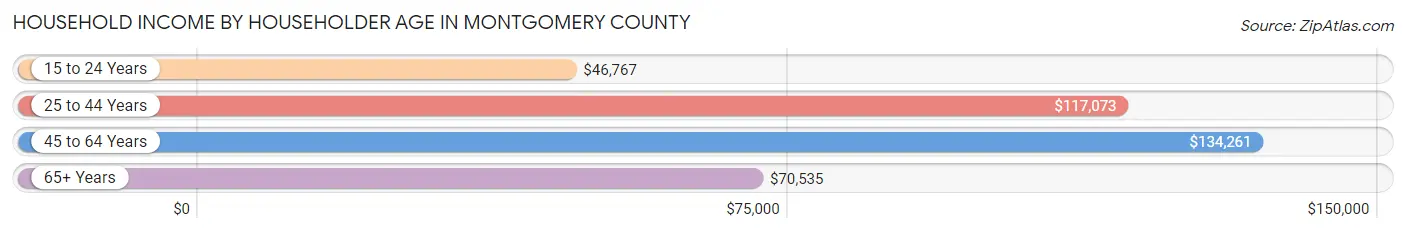
The median household income in Montgomery County is $107,441, with the highest median household income of $134,261 found in the 45 to 64 years age bracket for the primary householder. A total of 126,966 households (38.5%) fall into this category. Meanwhile, the 15 to 24 years age bracket for the primary householder has the lowest median household income of $46,767, with 7,506 households (2.3%) in this group.
| Income Bracket | # Households | Median Income |
| 15 to 24 Years | 7,506 (2.3%) | $46,767 |
| 25 to 44 Years | 101,655 (30.8%) | $117,073 |
| 45 to 64 Years | 126,966 (38.5%) | $134,261 |
| 65+ Years | 93,553 (28.4%) | $70,535 |
| Total | 329,680 (100.0%) | $107,441 |
Poverty in Montgomery County
Income Below Poverty by Sex and Age in Montgomery County
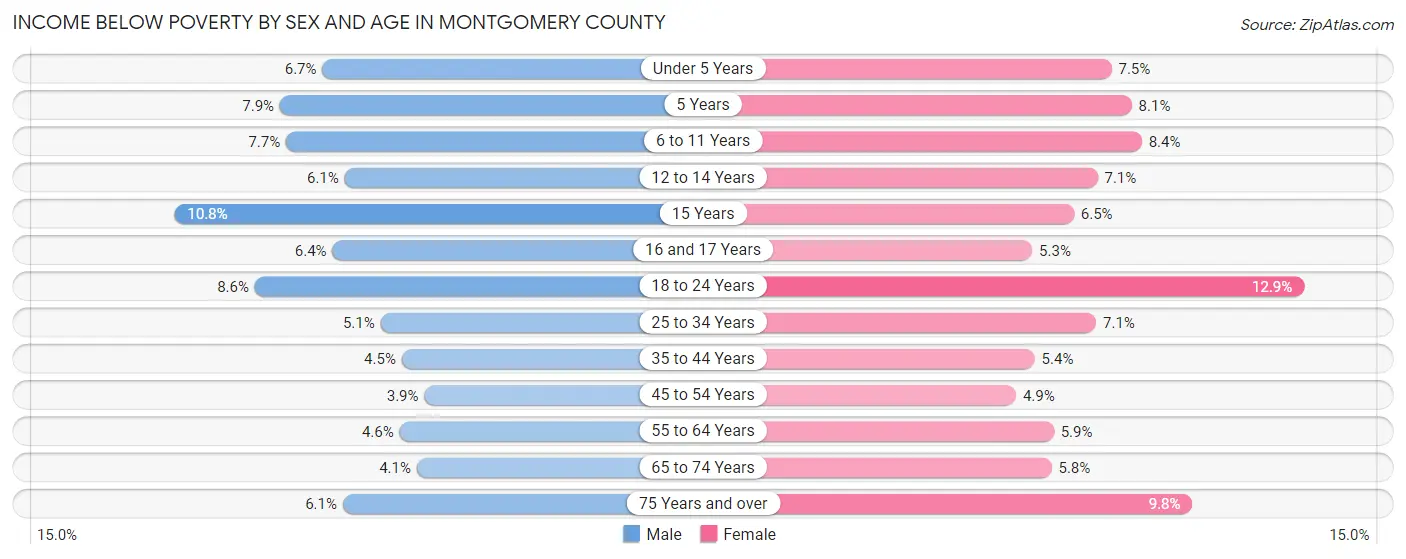
With 5.5% poverty level for males and 7.0% for females among the residents of Montgomery County, 15 year old males and 18 to 24 year old females are the most vulnerable to poverty, with 689 males (10.8%) and 3,999 females (12.9%) in their respective age groups living below the poverty level.
| Age Bracket | Male | Female |
| Under 5 Years | 1,543 (6.7%) | 1,625 (7.5%) |
| 5 Years | 390 (7.9%) | 358 (8.1%) |
| 6 to 11 Years | 2,345 (7.7%) | 2,548 (8.4%) |
| 12 to 14 Years | 1,052 (6.1%) | 1,080 (7.1%) |
| 15 Years | 689 (10.8%) | 371 (6.5%) |
| 16 and 17 Years | 678 (6.4%) | 558 (5.3%) |
| 18 to 24 Years | 2,818 (8.6%) | 3,999 (12.9%) |
| 25 to 34 Years | 2,664 (5.1%) | 3,639 (7.1%) |
| 35 to 44 Years | 2,476 (4.5%) | 2,966 (5.4%) |
| 45 to 54 Years | 2,106 (3.9%) | 2,683 (4.9%) |
| 55 to 64 Years | 2,612 (4.6%) | 3,593 (5.9%) |
| 65 to 74 Years | 1,626 (4.1%) | 2,674 (5.8%) |
| 75 Years and over | 1,543 (6.1%) | 3,729 (9.8%) |
| Total | 22,542 (5.5%) | 29,823 (7.0%) |
Income Above Poverty by Sex and Age in Montgomery County
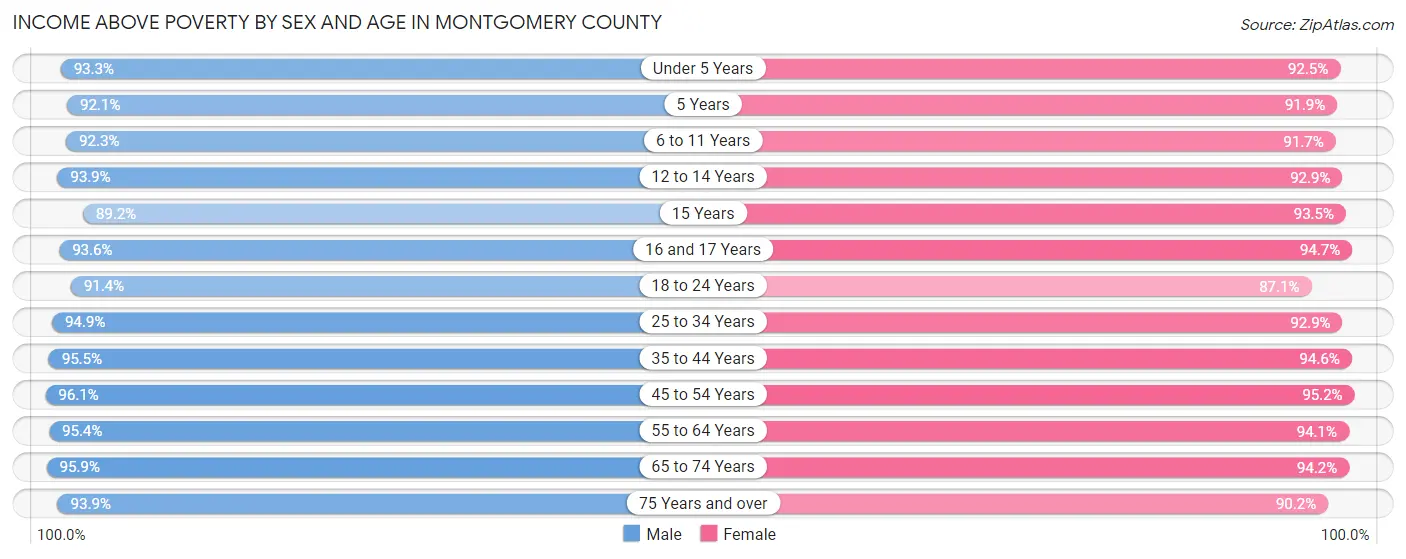
According to the poverty statistics in Montgomery County, males aged 45 to 54 years and females aged 45 to 54 years are the age groups that are most secure financially, with 96.1% of males and 95.2% of females in these age groups living above the poverty line.
| Age Bracket | Male | Female |
| Under 5 Years | 21,457 (93.3%) | 20,003 (92.5%) |
| 5 Years | 4,550 (92.1%) | 4,076 (91.9%) |
| 6 to 11 Years | 28,036 (92.3%) | 27,959 (91.6%) |
| 12 to 14 Years | 16,212 (93.9%) | 14,091 (92.9%) |
| 15 Years | 5,675 (89.2%) | 5,372 (93.5%) |
| 16 and 17 Years | 9,872 (93.6%) | 9,961 (94.7%) |
| 18 to 24 Years | 29,980 (91.4%) | 27,082 (87.1%) |
| 25 to 34 Years | 49,661 (94.9%) | 47,738 (92.9%) |
| 35 to 44 Years | 52,601 (95.5%) | 52,299 (94.6%) |
| 45 to 54 Years | 52,306 (96.1%) | 52,617 (95.2%) |
| 55 to 64 Years | 54,728 (95.4%) | 57,306 (94.1%) |
| 65 to 74 Years | 38,252 (95.9%) | 43,095 (94.2%) |
| 75 Years and over | 23,600 (93.9%) | 34,487 (90.2%) |
| Total | 386,930 (94.5%) | 396,086 (93.0%) |
Income Below Poverty Among Married-Couple Families in Montgomery County
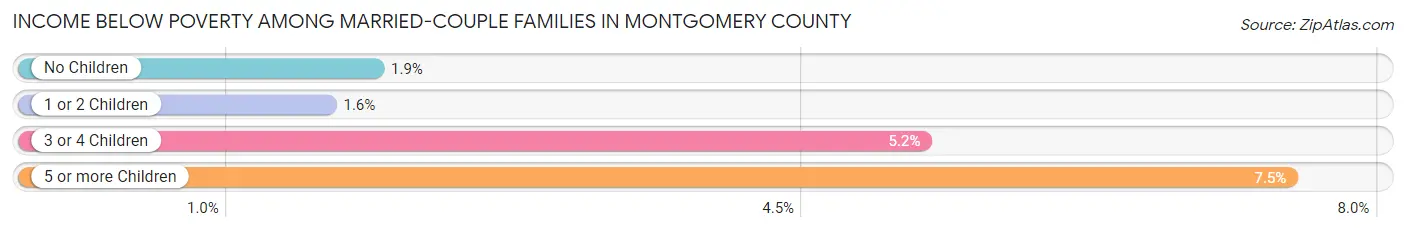
The poverty statistics for married-couple families in Montgomery County show that 2.1% or 3,712 of the total 180,074 families live below the poverty line. Families with 5 or more children have the highest poverty rate of 7.5%, comprising of 58 families. On the other hand, families with 1 or 2 children have the lowest poverty rate of 1.6%, which includes 1,006 families.
| Children | Above Poverty | Below Poverty |
| No Children | 100,696 (98.1%) | 1,935 (1.9%) |
| 1 or 2 Children | 62,025 (98.4%) | 1,006 (1.6%) |
| 3 or 4 Children | 12,921 (94.8%) | 713 (5.2%) |
| 5 or more Children | 720 (92.5%) | 58 (7.5%) |
| Total | 176,362 (97.9%) | 3,712 (2.1%) |
Income Below Poverty Among Single-Parent Households in Montgomery County
According to the poverty data in Montgomery County, 5.6% or 699 single-father households and 15.4% or 4,708 single-mother households are living below the poverty line. Among single-father households, those with 5 or more children have the highest poverty rate, with 29 households (42.6%) experiencing poverty. Likewise, among single-mother households, those with 3 or 4 children have the highest poverty rate, with 743 households (36.8%) falling below the poverty line.
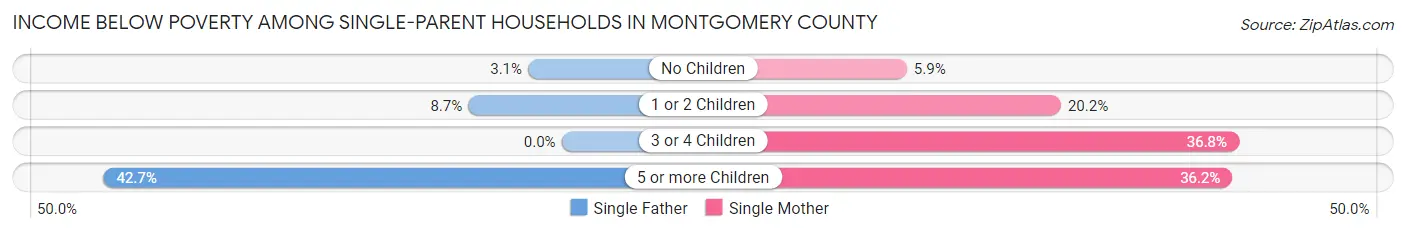
| Children | Single Father | Single Mother |
| No Children | 188 (3.1%) | 759 (5.9%) |
| 1 or 2 Children | 482 (8.7%) | 3,151 (20.2%) |
| 3 or 4 Children | 0 (0.0%) | 743 (36.8%) |
| 5 or more Children | 29 (42.6%) | 55 (36.2%) |
| Total | 699 (5.6%) | 4,708 (15.4%) |
Income Below Poverty Among Married-Couple vs Single-Parent Households in Montgomery County
The poverty data for Montgomery County shows that 3,712 of the married-couple family households (2.1%) and 5,407 of the single-parent households (12.6%) are living below the poverty level. Within the married-couple family households, those with 5 or more children have the highest poverty rate, with 58 households (7.5%) falling below the poverty line. Among the single-parent households, those with 5 or more children have the highest poverty rate, with 84 household (38.2%) living below poverty.
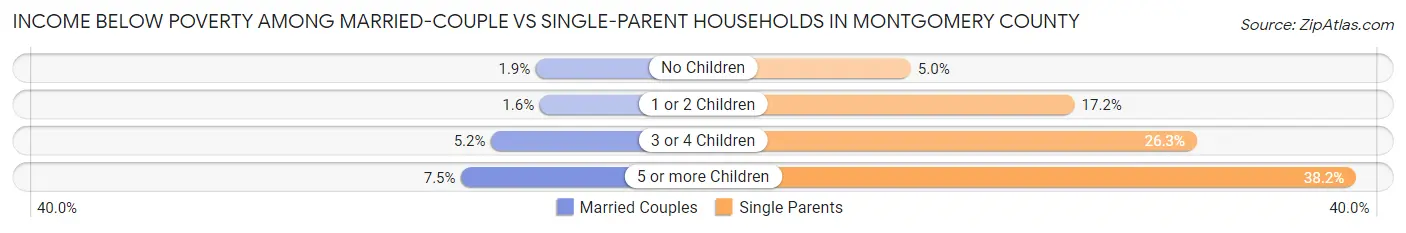
| Children | Married-Couple Families | Single-Parent Households |
| No Children | 1,935 (1.9%) | 947 (5.0%) |
| 1 or 2 Children | 1,006 (1.6%) | 3,633 (17.2%) |
| 3 or 4 Children | 713 (5.2%) | 743 (26.3%) |
| 5 or more Children | 58 (7.5%) | 84 (38.2%) |
| Total | 3,712 (2.1%) | 5,407 (12.6%) |
Race in Montgomery County
The most populous races in Montgomery County are White / Caucasian (650,218 | 75.9%), Black / African American (78,309 | 9.1%), and Asian (67,279 | 7.9%).
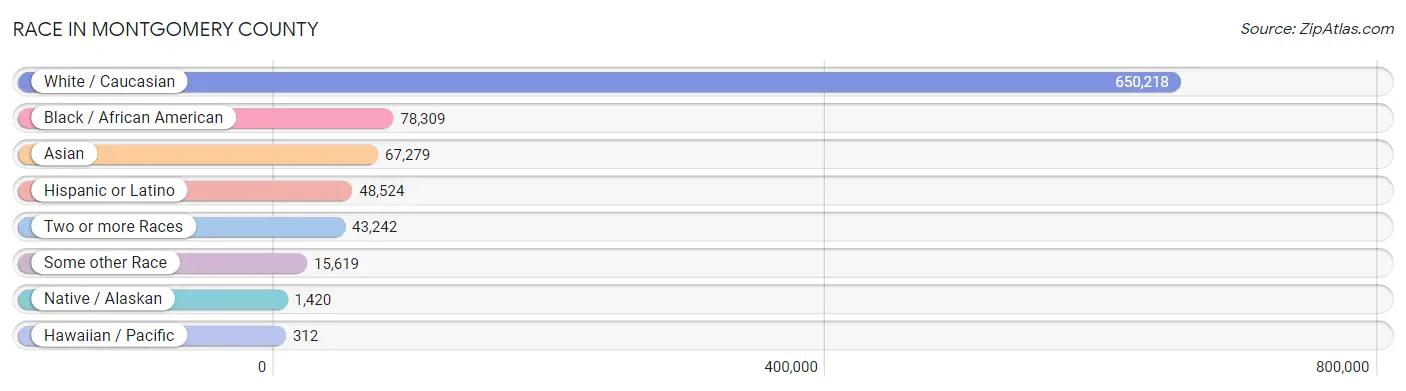
| Race | # Population | % Population |
| Asian | 67,279 | 7.9% |
| Black / African American | 78,309 | 9.1% |
| Hawaiian / Pacific | 312 | 0.0% |
| Hispanic or Latino | 48,524 | 5.7% |
| Native / Alaskan | 1,420 | 0.2% |
| White / Caucasian | 650,218 | 75.9% |
| Two or more Races | 43,242 | 5.1% |
| Some other Race | 15,619 | 1.8% |
| Total | 856,399 | 100.0% |
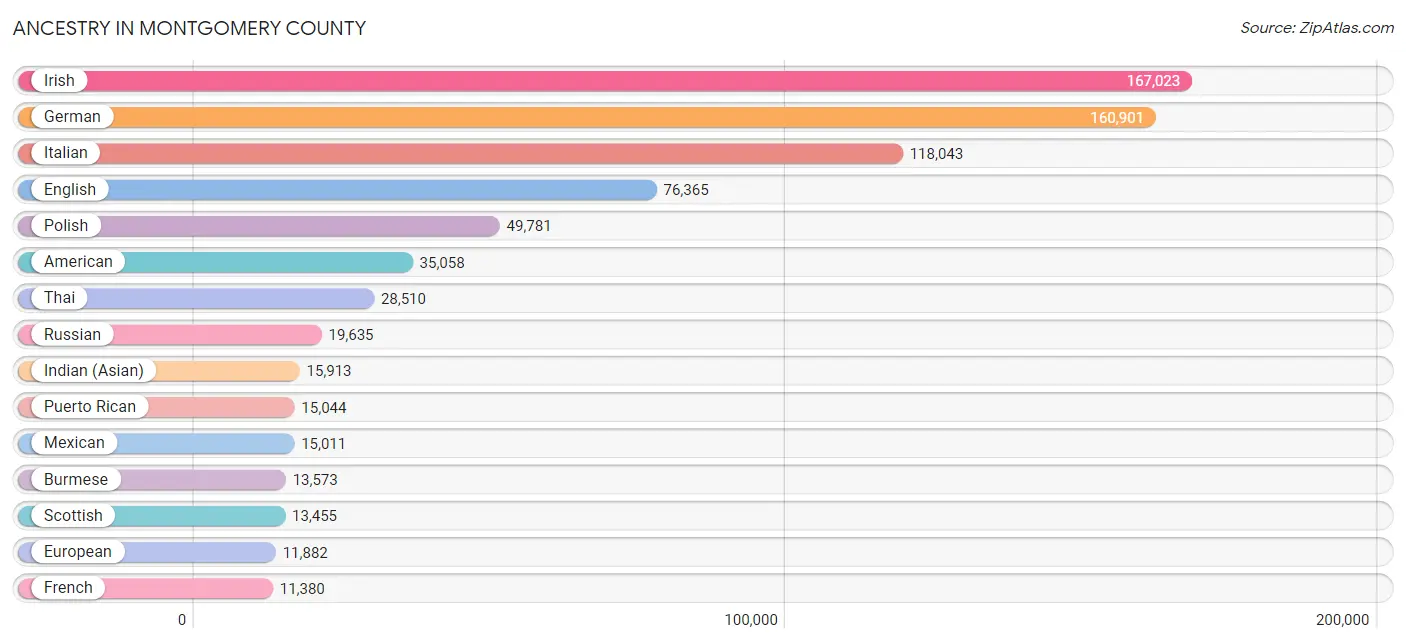
Ancestry in Montgomery County
The most populous ancestries reported in Montgomery County are Irish (167,023 | 19.5%), German (160,901 | 18.8%), Italian (118,043 | 13.8%), English (76,365 | 8.9%), and Polish (49,781 | 5.8%), together accounting for 66.8% of all Montgomery County residents.
| Ancestry | # Population | % Population |
| Afghan | 162 | 0.0% |
| African | 3,340 | 0.4% |
| Alaska Native | 58 | 0.0% |
| Alaskan Athabascan | 22 | 0.0% |
| Albanian | 882 | 0.1% |
| Alsatian | 55 | 0.0% |
| American | 35,058 | 4.1% |
| Apache | 21 | 0.0% |
| Arab | 6,821 | 0.8% |
| Argentinean | 794 | 0.1% |
| Armenian | 1,242 | 0.2% |
| Assyrian / Chaldean / Syriac | 14 | 0.0% |
| Australian | 106 | 0.0% |
| Austrian | 3,876 | 0.4% |
| Bahamian | 134 | 0.0% |
| Bangladeshi | 6 | 0.0% |
| Barbadian | 291 | 0.0% |
| Basque | 37 | 0.0% |
| Belgian | 500 | 0.1% |
| Belizean | 85 | 0.0% |
| Bhutanese | 1,569 | 0.2% |
| Blackfeet | 125 | 0.0% |
| Bolivian | 303 | 0.0% |
| Brazilian | 653 | 0.1% |
| British | 4,812 | 0.6% |
| British West Indian | 73 | 0.0% |
| Bulgarian | 389 | 0.1% |
| Burmese | 13,573 | 1.6% |
| Cajun | 58 | 0.0% |
| Cambodian | 88 | 0.0% |
| Canadian | 1,038 | 0.1% |
| Cape Verdean | 17 | 0.0% |
| Carpatho Rusyn | 248 | 0.0% |
| Celtic | 166 | 0.0% |
| Central American | 5,355 | 0.6% |
| Central American Indian | 1,157 | 0.1% |
| Cherokee | 1,745 | 0.2% |
| Chickasaw | 8 | 0.0% |
| Chilean | 368 | 0.0% |
| Chinese | 7 | 0.0% |
| Chippewa | 37 | 0.0% |
| Choctaw | 34 | 0.0% |
| Colombian | 2,007 | 0.2% |
| Costa Rican | 397 | 0.1% |
| Croatian | 732 | 0.1% |
| Cuban | 1,774 | 0.2% |
| Cypriot | 48 | 0.0% |
| Czech | 2,372 | 0.3% |
| Czechoslovakian | 799 | 0.1% |
| Danish | 1,386 | 0.2% |
| Delaware | 168 | 0.0% |
| Dominican | 2,455 | 0.3% |
| Dutch | 6,821 | 0.8% |
| Dutch West Indian | 15 | 0.0% |
| Eastern European | 8,532 | 1.0% |
| Ecuadorian | 805 | 0.1% |
| Egyptian | 2,064 | 0.2% |
| English | 76,365 | 8.9% |
| Estonian | 170 | 0.0% |
| Ethiopian | 339 | 0.0% |
| European | 11,882 | 1.4% |
| Filipino | 1,042 | 0.1% |
| Finnish | 836 | 0.1% |
| French | 11,380 | 1.3% |
| French American Indian | 13 | 0.0% |
| French Canadian | 1,908 | 0.2% |
| German | 160,901 | 18.8% |
| German Russian | 14 | 0.0% |
| Ghanaian | 750 | 0.1% |
| Greek | 4,836 | 0.6% |
| Guamanian / Chamorro | 148 | 0.0% |
| Guatemalan | 982 | 0.1% |
| Guyanese | 679 | 0.1% |
| Haitian | 1,832 | 0.2% |
| Honduran | 1,210 | 0.1% |
| Hopi | 16 | 0.0% |
| Houma | 5 | 0.0% |
| Hungarian | 6,564 | 0.8% |
| Icelander | 39 | 0.0% |
| Indian (Asian) | 15,913 | 1.9% |
| Iranian | 973 | 0.1% |
| Iraqi | 178 | 0.0% |
| Irish | 167,023 | 19.5% |
| Iroquois | 142 | 0.0% |
| Israeli | 794 | 0.1% |
| Italian | 118,043 | 13.8% |
| Jamaican | 4,070 | 0.5% |
| Japanese | 1,103 | 0.1% |
| Jordanian | 104 | 0.0% |
| Kenyan | 218 | 0.0% |
| Korean | 5,353 | 0.6% |
| Laotian | 283 | 0.0% |
| Latvian | 381 | 0.0% |
| Lebanese | 1,433 | 0.2% |
| Liberian | 129 | 0.0% |
| Lithuanian | 5,843 | 0.7% |
| Lumbee | 66 | 0.0% |
| Luxembourger | 37 | 0.0% |
| Macedonian | 50 | 0.0% |
| Malaysian | 316 | 0.0% |
| Maltese | 158 | 0.0% |
| Mexican | 15,011 | 1.8% |
| Mexican American Indian | 232 | 0.0% |
| Mongolian | 128 | 0.0% |
| Moroccan | 613 | 0.1% |
| Native Hawaiian | 360 | 0.0% |
| Navajo | 141 | 0.0% |
| New Zealander | 54 | 0.0% |
| Nicaraguan | 160 | 0.0% |
| Nigerian | 1,276 | 0.2% |
| Northern European | 920 | 0.1% |
| Norwegian | 3,247 | 0.4% |
| Okinawan | 96 | 0.0% |
| Paiute | 6 | 0.0% |
| Pakistani | 532 | 0.1% |
| Palestinian | 117 | 0.0% |
| Panamanian | 428 | 0.1% |
| Paraguayan | 233 | 0.0% |
| Pennsylvania German | 6,889 | 0.8% |
| Peruvian | 615 | 0.1% |
| Polish | 49,781 | 5.8% |
| Portuguese | 1,809 | 0.2% |
| Potawatomi | 67 | 0.0% |
| Puerto Rican | 15,044 | 1.8% |
| Romanian | 2,177 | 0.3% |
| Russian | 19,635 | 2.3% |
| Salvadoran | 2,168 | 0.3% |
| Samoan | 60 | 0.0% |
| Scandinavian | 1,021 | 0.1% |
| Scotch-Irish | 5,550 | 0.6% |
| Scottish | 13,455 | 1.6% |
| Seminole | 12 | 0.0% |
| Senegalese | 14 | 0.0% |
| Serbian | 246 | 0.0% |
| Sioux | 117 | 0.0% |
| Slavic | 518 | 0.1% |
| Slovak | 4,476 | 0.5% |
| Slovene | 245 | 0.0% |
| South African | 533 | 0.1% |
| South American | 5,747 | 0.7% |
| South American Indian | 113 | 0.0% |
| Soviet Union | 61 | 0.0% |
| Spaniard | 915 | 0.1% |
| Spanish | 666 | 0.1% |
| Spanish American Indian | 18 | 0.0% |
| Sri Lankan | 5,910 | 0.7% |
| Subsaharan African | 8,143 | 0.9% |
| Sudanese | 196 | 0.0% |
| Swedish | 5,416 | 0.6% |
| Swiss | 2,722 | 0.3% |
| Syrian | 367 | 0.0% |
| Taiwanese | 10 | 0.0% |
| Thai | 28,510 | 3.3% |
| Tlingit-Haida | 9 | 0.0% |
| Tongan | 87 | 0.0% |
| Trinidadian and Tobagonian | 776 | 0.1% |
| Turkish | 569 | 0.1% |
| U.S. Virgin Islander | 46 | 0.0% |
| Ukrainian | 10,327 | 1.2% |
| Uruguayan | 22 | 0.0% |
| Venezuelan | 559 | 0.1% |
| Vietnamese | 1,187 | 0.1% |
| Welsh | 7,567 | 0.9% |
| West Indian | 1,111 | 0.1% |
| Yugoslavian | 230 | 0.0% |
| Zimbabwean | 236 | 0.0% | View All 166 Rows |
Immigrants in Montgomery County
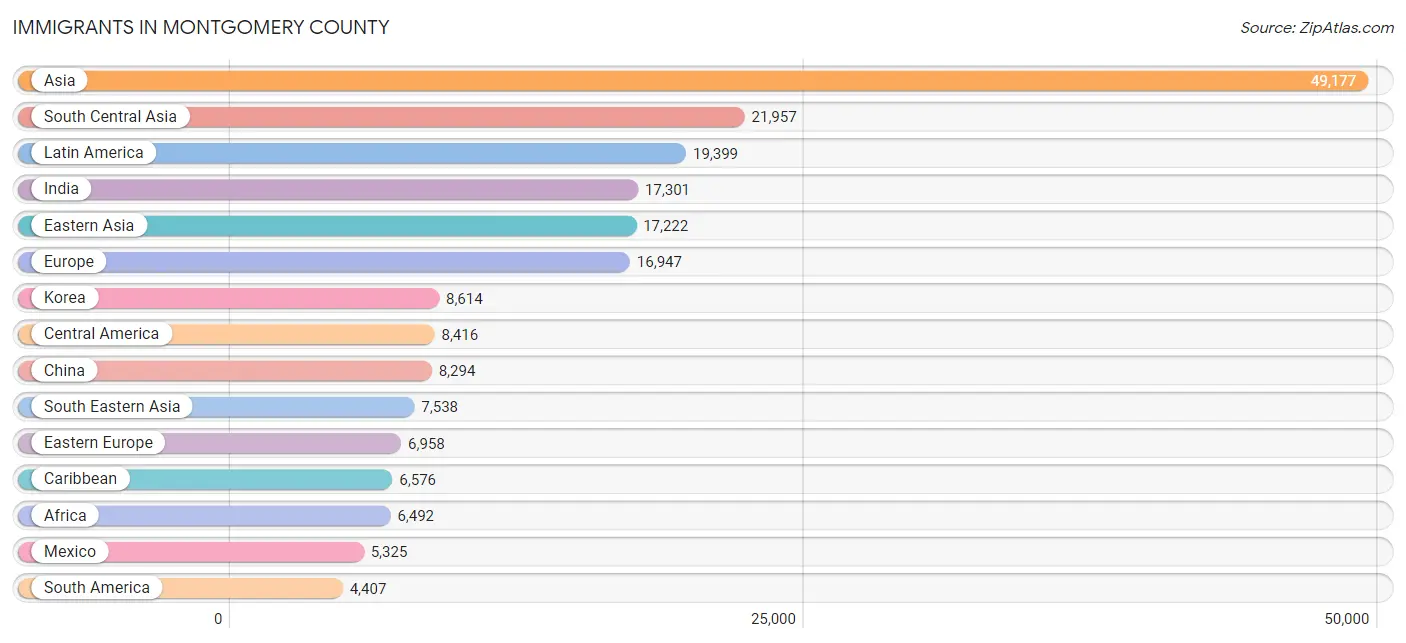
The most numerous immigrant groups reported in Montgomery County came from Asia (49,177 | 5.7%), South Central Asia (21,957 | 2.6%), Latin America (19,399 | 2.3%), India (17,301 | 2.0%), and Eastern Asia (17,222 | 2.0%), together accounting for 14.6% of all Montgomery County residents.
| Immigration Origin | # Population | % Population |
| Afghanistan | 30 | 0.0% |
| Africa | 6,492 | 0.8% |
| Albania | 220 | 0.0% |
| Argentina | 565 | 0.1% |
| Armenia | 27 | 0.0% |
| Asia | 49,177 | 5.7% |
| Australia | 104 | 0.0% |
| Austria | 32 | 0.0% |
| Bahamas | 95 | 0.0% |
| Bangladesh | 1,589 | 0.2% |
| Barbados | 119 | 0.0% |
| Belarus | 268 | 0.0% |
| Belgium | 87 | 0.0% |
| Belize | 15 | 0.0% |
| Bolivia | 177 | 0.0% |
| Bosnia and Herzegovina | 32 | 0.0% |
| Brazil | 695 | 0.1% |
| Bulgaria | 287 | 0.0% |
| Cambodia | 829 | 0.1% |
| Cameroon | 45 | 0.0% |
| Canada | 1,500 | 0.2% |
| Caribbean | 6,576 | 0.8% |
| Central America | 8,416 | 1.0% |
| Chile | 287 | 0.0% |
| China | 8,294 | 1.0% |
| Colombia | 803 | 0.1% |
| Costa Rica | 187 | 0.0% |
| Croatia | 22 | 0.0% |
| Cuba | 283 | 0.0% |
| Czechoslovakia | 259 | 0.0% |
| Denmark | 128 | 0.0% |
| Dominica | 25 | 0.0% |
| Dominican Republic | 965 | 0.1% |
| Eastern Africa | 1,228 | 0.1% |
| Eastern Asia | 17,222 | 2.0% |
| Eastern Europe | 6,958 | 0.8% |
| Ecuador | 537 | 0.1% |
| Egypt | 1,514 | 0.2% |
| El Salvador | 1,189 | 0.1% |
| England | 1,177 | 0.1% |
| Ethiopia | 263 | 0.0% |
| Europe | 16,947 | 2.0% |
| France | 538 | 0.1% |
| Germany | 1,910 | 0.2% |
| Ghana | 387 | 0.1% |
| Greece | 578 | 0.1% |
| Grenada | 205 | 0.0% |
| Guatemala | 790 | 0.1% |
| Guyana | 519 | 0.1% |
| Haiti | 1,415 | 0.2% |
| Honduras | 746 | 0.1% |
| Hong Kong | 782 | 0.1% |
| Hungary | 150 | 0.0% |
| India | 17,301 | 2.0% |
| Indonesia | 136 | 0.0% |
| Iran | 796 | 0.1% |
| Iraq | 148 | 0.0% |
| Ireland | 580 | 0.1% |
| Israel | 702 | 0.1% |
| Italy | 2,315 | 0.3% |
| Jamaica | 2,612 | 0.3% |
| Japan | 314 | 0.0% |
| Jordan | 185 | 0.0% |
| Kazakhstan | 236 | 0.0% |
| Kenya | 345 | 0.0% |
| Korea | 8,614 | 1.0% |
| Kuwait | 79 | 0.0% |
| Laos | 216 | 0.0% |
| Latin America | 19,399 | 2.3% |
| Latvia | 29 | 0.0% |
| Lebanon | 529 | 0.1% |
| Liberia | 108 | 0.0% |
| Lithuania | 155 | 0.0% |
| Malaysia | 75 | 0.0% |
| Mexico | 5,325 | 0.6% |
| Middle Africa | 451 | 0.1% |
| Moldova | 112 | 0.0% |
| Morocco | 504 | 0.1% |
| Nepal | 355 | 0.0% |
| Netherlands | 285 | 0.0% |
| Nicaragua | 81 | 0.0% |
| Nigeria | 784 | 0.1% |
| Northern Africa | 2,722 | 0.3% |
| Northern Europe | 3,034 | 0.4% |
| Norway | 72 | 0.0% |
| Oceania | 171 | 0.0% |
| Pakistan | 757 | 0.1% |
| Panama | 83 | 0.0% |
| Peru | 441 | 0.1% |
| Philippines | 2,475 | 0.3% |
| Poland | 834 | 0.1% |
| Portugal | 550 | 0.1% |
| Romania | 492 | 0.1% |
| Russia | 1,685 | 0.2% |
| Saudi Arabia | 39 | 0.0% |
| Scotland | 126 | 0.0% |
| Serbia | 11 | 0.0% |
| Sierra Leone | 9 | 0.0% |
| Singapore | 200 | 0.0% |
| South Africa | 448 | 0.1% |
| South America | 4,407 | 0.5% |
| South Central Asia | 21,957 | 2.6% |
| South Eastern Asia | 7,538 | 0.9% |
| Southern Europe | 3,981 | 0.5% |
| Spain | 509 | 0.1% |
| Sri Lanka | 12 | 0.0% |
| St. Vincent and the Grenadines | 16 | 0.0% |
| Sudan | 55 | 0.0% |
| Sweden | 37 | 0.0% |
| Switzerland | 97 | 0.0% |
| Syria | 52 | 0.0% |
| Taiwan | 1,051 | 0.1% |
| Thailand | 246 | 0.0% |
| Trinidad and Tobago | 766 | 0.1% |
| Turkey | 308 | 0.0% |
| Uganda | 61 | 0.0% |
| Ukraine | 1,956 | 0.2% |
| Uruguay | 60 | 0.0% |
| Uzbekistan | 724 | 0.1% |
| Venezuela | 204 | 0.0% |
| Vietnam | 3,323 | 0.4% |
| Western Africa | 1,405 | 0.2% |
| Western Asia | 2,420 | 0.3% |
| Western Europe | 2,949 | 0.3% |
| Zaire | 54 | 0.0% |
| Zimbabwe | 191 | 0.0% | View All 126 Rows |
Sex and Age in Montgomery County
Sex and Age in Montgomery County
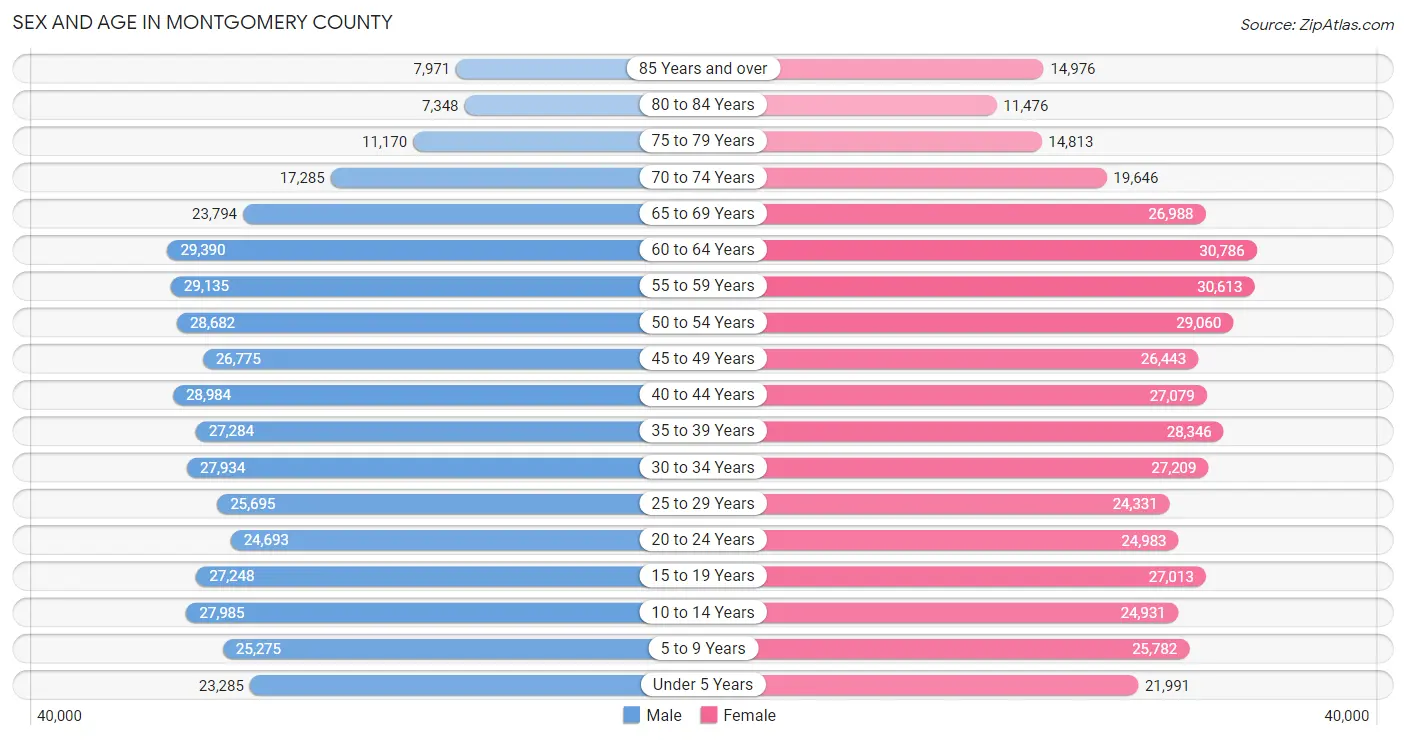
The most populous age groups in Montgomery County are 60 to 64 Years (29,390 | 7.0%) for men and 60 to 64 Years (30,786 | 7.0%) for women.
| Age Bracket | Male | Female |
| Under 5 Years | 23,285 (5.5%) | 21,991 (5.0%) |
| 5 to 9 Years | 25,275 (6.0%) | 25,782 (5.9%) |
| 10 to 14 Years | 27,985 (6.7%) | 24,931 (5.7%) |
| 15 to 19 Years | 27,248 (6.5%) | 27,013 (6.2%) |
| 20 to 24 Years | 24,693 (5.9%) | 24,983 (5.7%) |
| 25 to 29 Years | 25,695 (6.1%) | 24,331 (5.6%) |
| 30 to 34 Years | 27,934 (6.7%) | 27,209 (6.2%) |
| 35 to 39 Years | 27,284 (6.5%) | 28,346 (6.5%) |
| 40 to 44 Years | 28,984 (6.9%) | 27,079 (6.2%) |
| 45 to 49 Years | 26,775 (6.4%) | 26,443 (6.1%) |
| 50 to 54 Years | 28,682 (6.8%) | 29,060 (6.7%) |
| 55 to 59 Years | 29,135 (6.9%) | 30,613 (7.0%) |
| 60 to 64 Years | 29,390 (7.0%) | 30,786 (7.0%) |
| 65 to 69 Years | 23,794 (5.7%) | 26,988 (6.2%) |
| 70 to 74 Years | 17,285 (4.1%) | 19,646 (4.5%) |
| 75 to 79 Years | 11,170 (2.7%) | 14,813 (3.4%) |
| 80 to 84 Years | 7,348 (1.8%) | 11,476 (2.6%) |
| 85 Years and over | 7,971 (1.9%) | 14,976 (3.4%) |
| Total | 419,933 (100.0%) | 436,466 (100.0%) |
Families and Households in Montgomery County
Median Family Size in Montgomery County
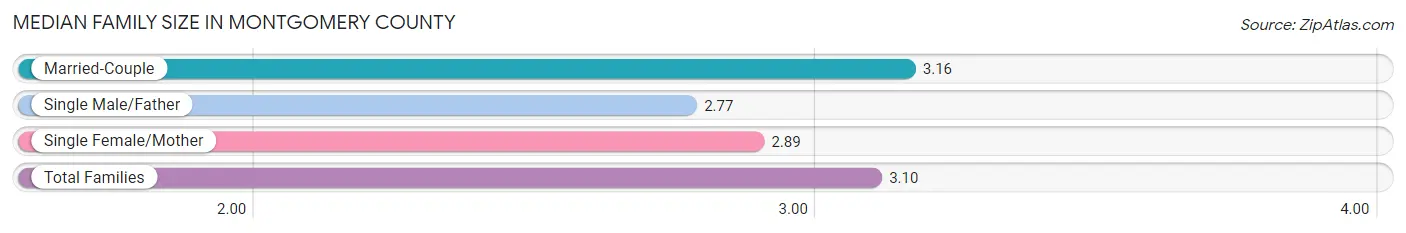
The median family size in Montgomery County is 3.10 persons per family, with married-couple families (180,074 | 80.7%) accounting for the largest median family size of 3.16 persons per family. On the other hand, single male/father families (12,421 | 5.6%) represent the smallest median family size with 2.77 persons per family.
| Family Type | # Families | Family Size |
| Married-Couple | 180,074 (80.7%) | 3.16 |
| Single Male/Father | 12,421 (5.6%) | 2.77 |
| Single Female/Mother | 30,634 (13.7%) | 2.89 |
| Total Families | 223,129 (100.0%) | 3.10 |
Median Household Size in Montgomery County
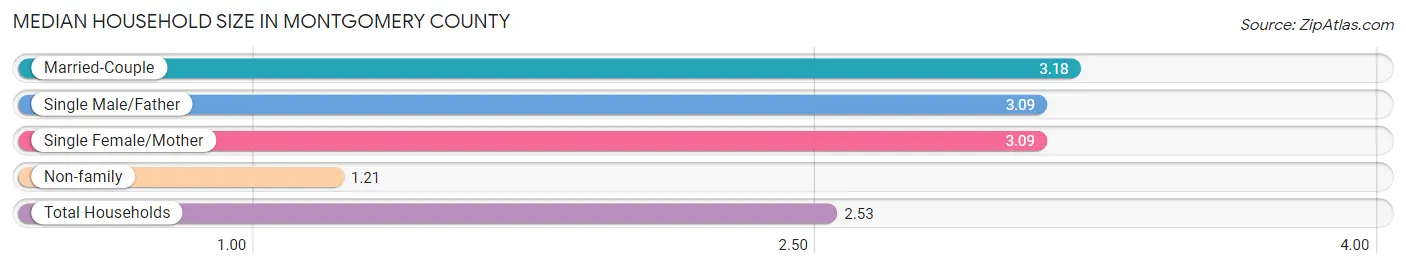
The median household size in Montgomery County is 2.53 persons per household, with married-couple households (180,074 | 54.6%) accounting for the largest median household size of 3.18 persons per household. non-family households (106,551 | 32.3%) represent the smallest median household size with 1.21 persons per household.
| Household Type | # Households | Household Size |
| Married-Couple | 180,074 (54.6%) | 3.18 |
| Single Male/Father | 12,421 (3.8%) | 3.09 |
| Single Female/Mother | 30,634 (9.3%) | 3.09 |
| Non-family | 106,551 (32.3%) | 1.21 |
| Total Households | 329,680 (100.0%) | 2.53 |
Household Size by Marriage Status in Montgomery County
Out of a total of 329,680 households in Montgomery County, 223,129 (67.7%) are family households, while 106,551 (32.3%) are nonfamily households. The most numerous type of family households are 2-person households, comprising 94,969, and the most common type of nonfamily households are 1-person households, comprising 87,553.
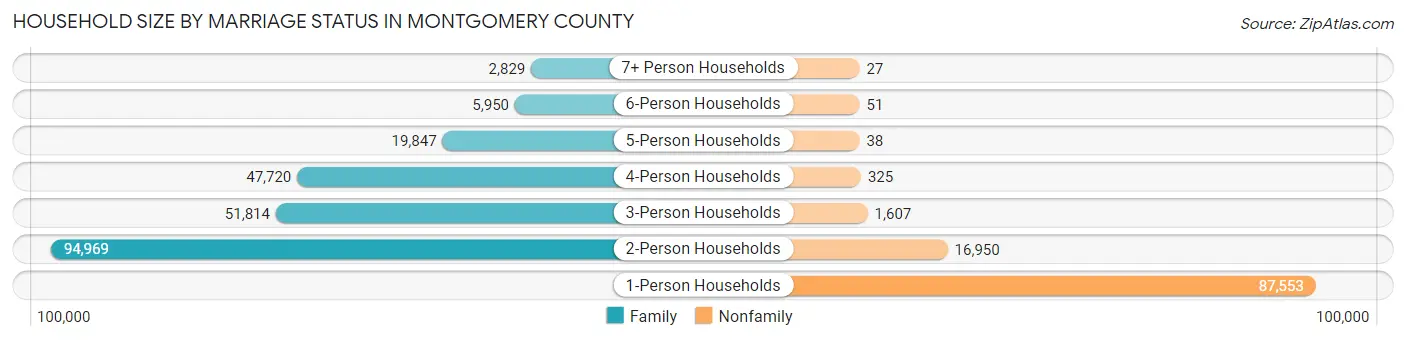
| Household Size | Family Households | Nonfamily Households |
| 1-Person Households | - | 87,553 (26.6%) |
| 2-Person Households | 94,969 (28.8%) | 16,950 (5.1%) |
| 3-Person Households | 51,814 (15.7%) | 1,607 (0.5%) |
| 4-Person Households | 47,720 (14.5%) | 325 (0.1%) |
| 5-Person Households | 19,847 (6.0%) | 38 (0.0%) |
| 6-Person Households | 5,950 (1.8%) | 51 (0.0%) |
| 7+ Person Households | 2,829 (0.9%) | 27 (0.0%) |
| Total | 223,129 (67.7%) | 106,551 (32.3%) |
Female Fertility in Montgomery County
Fertility by Age in Montgomery County
Average fertility rate in Montgomery County is 53.0 births per 1,000 women. Women in the age bracket of 20 to 34 years have the highest fertility rate with 83.0 births per 1,000 women. Women in the age bracket of 20 to 34 years acount for 62.3% of all women with births.
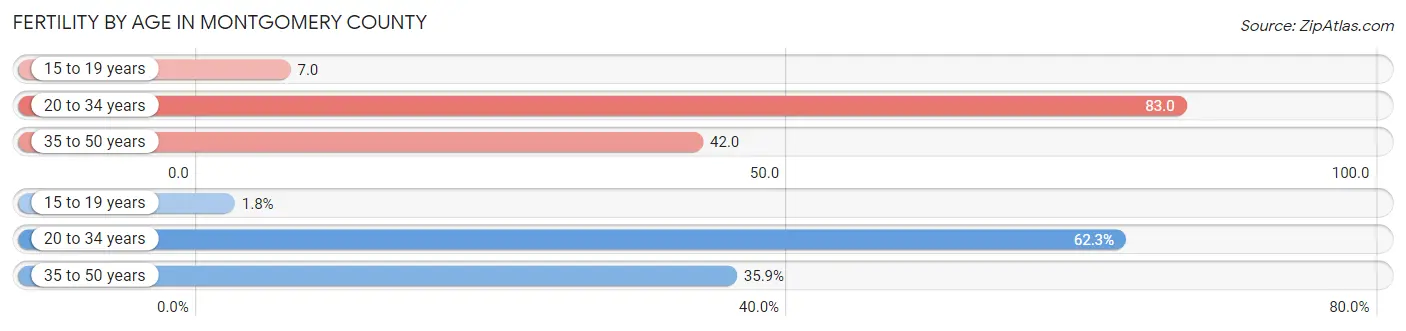
| Age Bracket | Women with Births | Births / 1,000 Women |
| 15 to 19 years | 185 (1.8%) | 7.0 |
| 20 to 34 years | 6,314 (62.3%) | 83.0 |
| 35 to 50 years | 3,638 (35.9%) | 42.0 |
| Total | 10,137 (100.0%) | 53.0 |
Fertility by Age by Marriage Status in Montgomery County
79.0% of women with births (10,137) in Montgomery County are married. The highest percentage of unmarried women with births falls into 15 to 19 years age bracket with 100.0% of them unmarried at the time of birth, while the lowest percentage of unmarried women with births belong to 35 to 50 years age bracket with 9.0% of them unmarried.
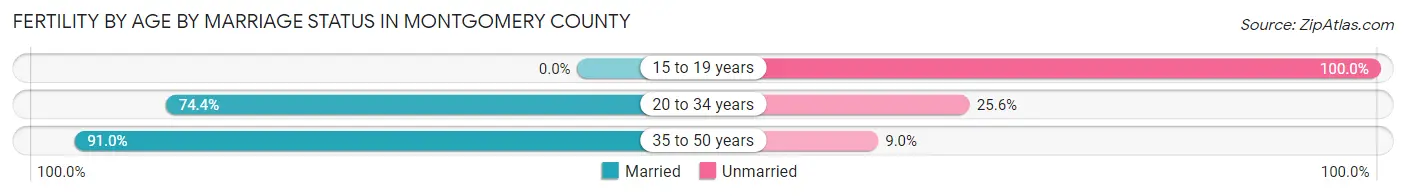
| Age Bracket | Married | Unmarried |
| 15 to 19 years | 0 (0.0%) | 185 (100.0%) |
| 20 to 34 years | 4,698 (74.4%) | 1,616 (25.6%) |
| 35 to 50 years | 3,311 (91.0%) | 327 (9.0%) |
| Total | 8,008 (79.0%) | 2,129 (21.0%) |
Fertility by Education in Montgomery County
Average fertility rate in Montgomery County is 53.0 births per 1,000 women. Women with the education attainment of graduate degree have the highest fertility rate of 71.0 births per 1,000 women, while women with the education attainment of less than high school have the lowest fertility at 17.0 births per 1,000 women. Women with the education attainment of bachelor's degree represent 33.5% of all women with births.
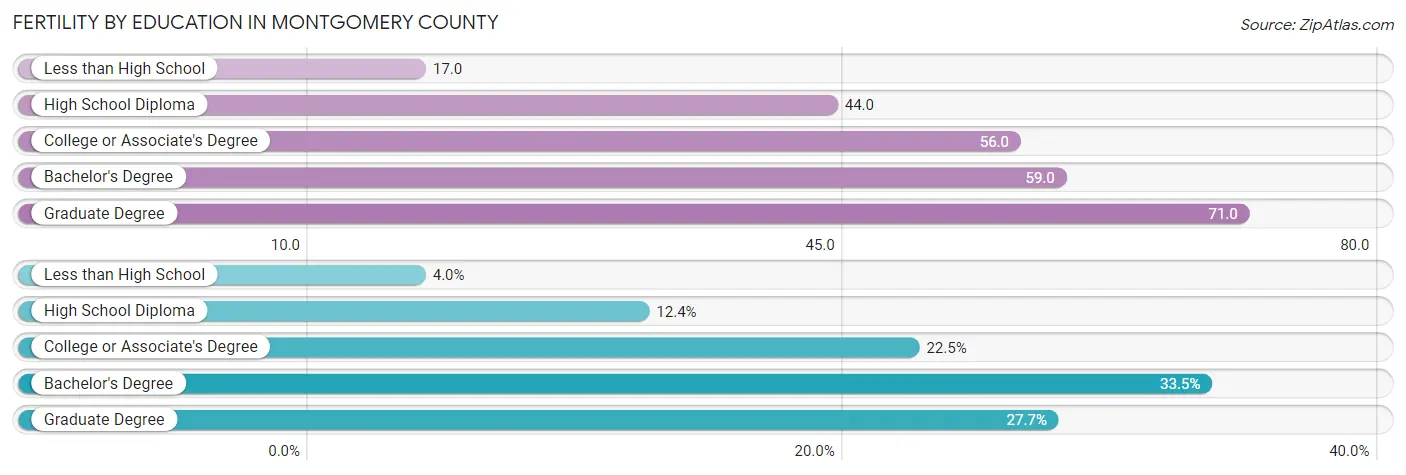
| Educational Attainment | Women with Births | Births / 1,000 Women |
| Less than High School | 404 (4.0%) | 17.0 |
| High School Diploma | 1,254 (12.4%) | 44.0 |
| College or Associate's Degree | 2,280 (22.5%) | 56.0 |
| Bachelor's Degree | 3,391 (33.5%) | 59.0 |
| Graduate Degree | 2,808 (27.7%) | 71.0 |
| Total | 10,137 (100.0%) | 53.0 |
Fertility by Education by Marriage Status in Montgomery County
21.0% of women with births in Montgomery County are unmarried. Women with the educational attainment of graduate degree are most likely to be married with 94.7% of them married at childbirth, while women with the educational attainment of high school diploma are least likely to be married with 61.4% of them unmarried at childbirth.
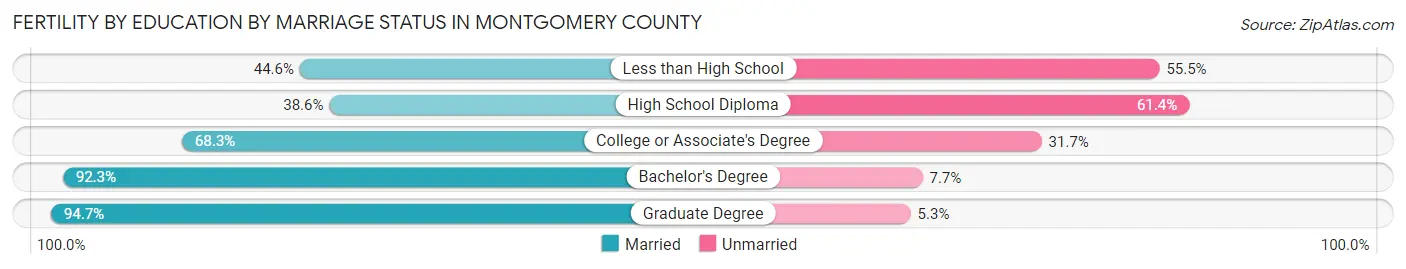
| Educational Attainment | Married | Unmarried |
| Less than High School | 180 (44.6%) | 224 (55.4%) |
| High School Diploma | 484 (38.6%) | 770 (61.4%) |
| College or Associate's Degree | 1,557 (68.3%) | 723 (31.7%) |
| Bachelor's Degree | 3,130 (92.3%) | 261 (7.7%) |
| Graduate Degree | 2,659 (94.7%) | 149 (5.3%) |
| Total | 8,008 (79.0%) | 2,129 (21.0%) |
Employment Characteristics in Montgomery County
Employment by Class of Employer in Montgomery County
Among the 443,958 employed individuals in Montgomery County, private company employees (310,677 | 70.0%), not-for-profit organizations (56,009 | 12.6%), and local government employees (23,438 | 5.3%) make up the most common classes of employment.
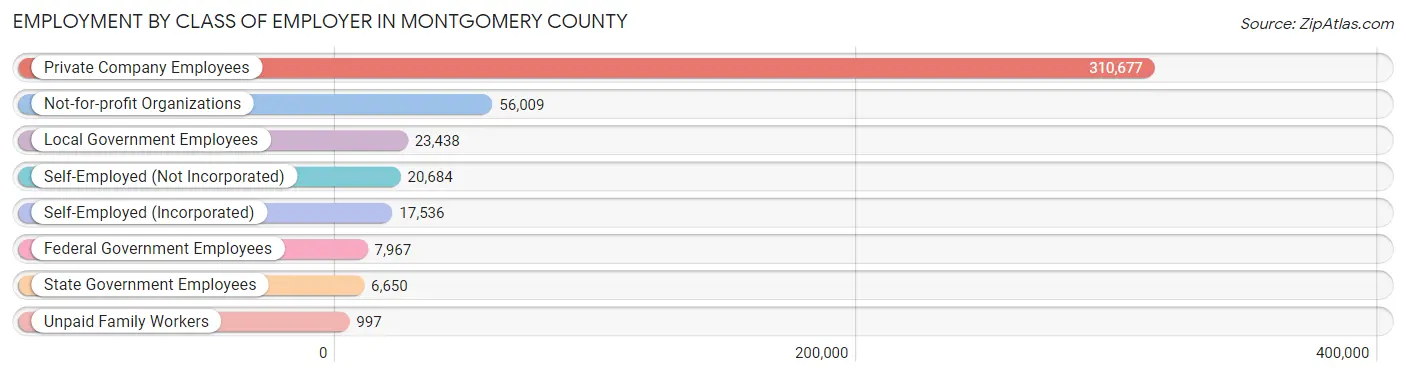
| Employer Class | # Employees | % Employees |
| Private Company Employees | 310,677 | 70.0% |
| Self-Employed (Incorporated) | 17,536 | 4.0% |
| Self-Employed (Not Incorporated) | 20,684 | 4.7% |
| Not-for-profit Organizations | 56,009 | 12.6% |
| Local Government Employees | 23,438 | 5.3% |
| State Government Employees | 6,650 | 1.5% |
| Federal Government Employees | 7,967 | 1.8% |
| Unpaid Family Workers | 997 | 0.2% |
| Total | 443,958 | 100.0% |
Employment Status by Age in Montgomery County
According to the labor force statistics for Montgomery County, out of the total population over 16 years of age (694,999), 68.2% or 473,989 individuals are in the labor force, with 4.5% or 21,330 of them unemployed. The age group with the highest labor force participation rate is 30 to 34 years, with 89.4% or 49,298 individuals in the labor force. Within the labor force, the 16 to 19 years age range has the highest percentage of unemployed individuals, with 11.5% or 1,995 of them being unemployed.
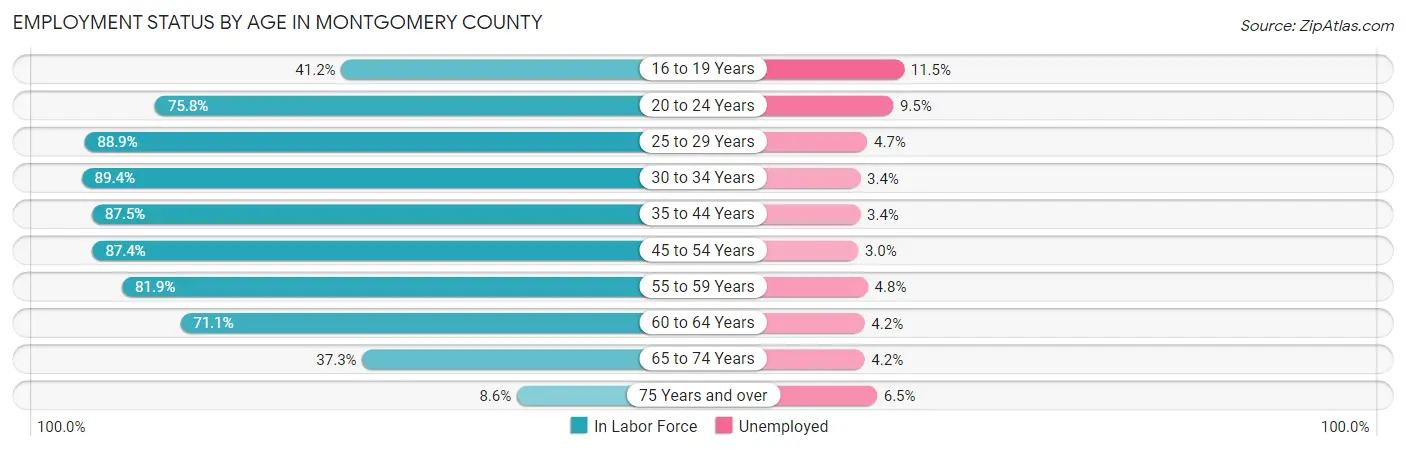
| Age Bracket | In Labor Force | Unemployed |
| 16 to 19 Years | 17,349 (41.2%) | 1,995 (11.5%) |
| 20 to 24 Years | 37,654 (75.8%) | 3,577 (9.5%) |
| 25 to 29 Years | 44,473 (88.9%) | 2,090 (4.7%) |
| 30 to 34 Years | 49,298 (89.4%) | 1,676 (3.4%) |
| 35 to 44 Years | 97,731 (87.5%) | 3,323 (3.4%) |
| 45 to 54 Years | 96,979 (87.4%) | 2,909 (3.0%) |
| 55 to 59 Years | 48,934 (81.9%) | 2,349 (4.8%) |
| 60 to 64 Years | 42,785 (71.1%) | 1,797 (4.2%) |
| 65 to 74 Years | 32,717 (37.3%) | 1,374 (4.2%) |
| 75 Years and over | 5,827 (8.6%) | 379 (6.5%) |
| Total | 473,989 (68.2%) | 21,330 (4.5%) |
Employment Status by Educational Attainment in Montgomery County
According to labor force statistics for Montgomery County, 84.9% of individuals (380,136) out of the total population between 25 and 64 years of age (447,746) are in the labor force, with 3.7% or 14,065 of them being unemployed. The group with the highest labor force participation rate are those with the educational attainment of bachelor's degree or higher, with 89.5% or 221,526 individuals in the labor force. Within the labor force, individuals with less than high school education have the highest percentage of unemployment, with 6.4% or 766 of them being unemployed.
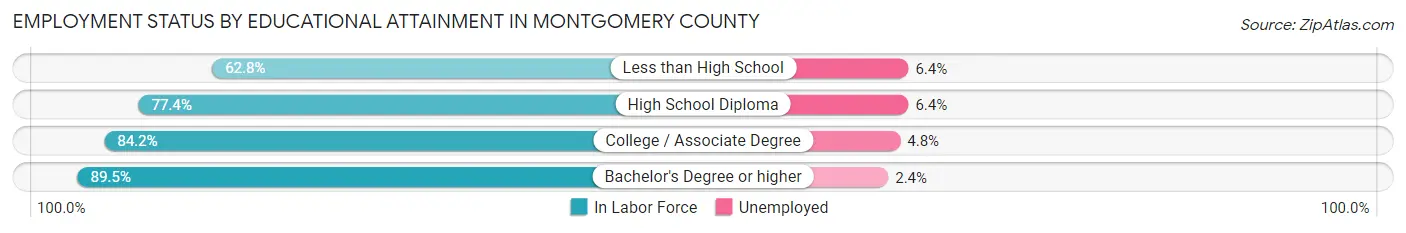
| Educational Attainment | In Labor Force | Unemployed |
| Less than High School | 11,964 (62.8%) | 1,219 (6.4%) |
| High School Diploma | 67,426 (77.4%) | 5,575 (6.4%) |
| College / Associate Degree | 79,204 (84.2%) | 4,515 (4.8%) |
| Bachelor's Degree or higher | 221,526 (89.5%) | 5,940 (2.4%) |
| Total | 380,136 (84.9%) | 16,567 (3.7%) |
Employment Occupations by Sex in Montgomery County
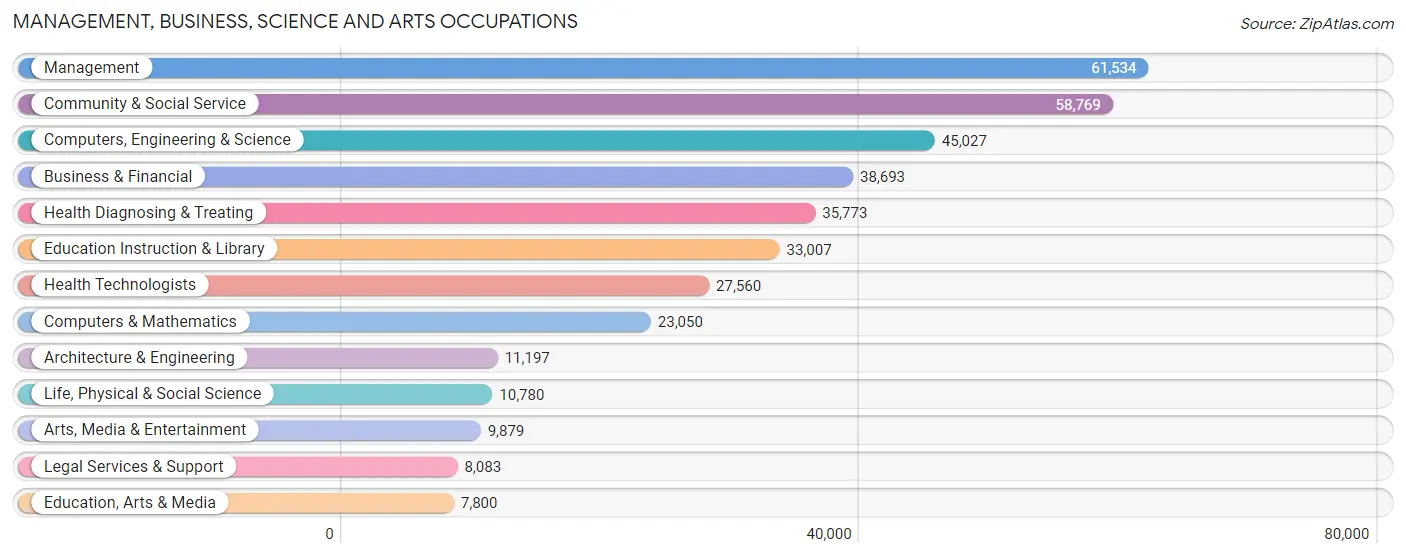
Management, Business, Science and Arts Occupations
The most common Management, Business, Science and Arts occupations in Montgomery County are Management (61,534 | 13.6%), Community & Social Service (58,769 | 13.0%), Computers, Engineering & Science (45,027 | 10.0%), Business & Financial (38,693 | 8.6%), and Health Diagnosing & Treating (35,773 | 7.9%).
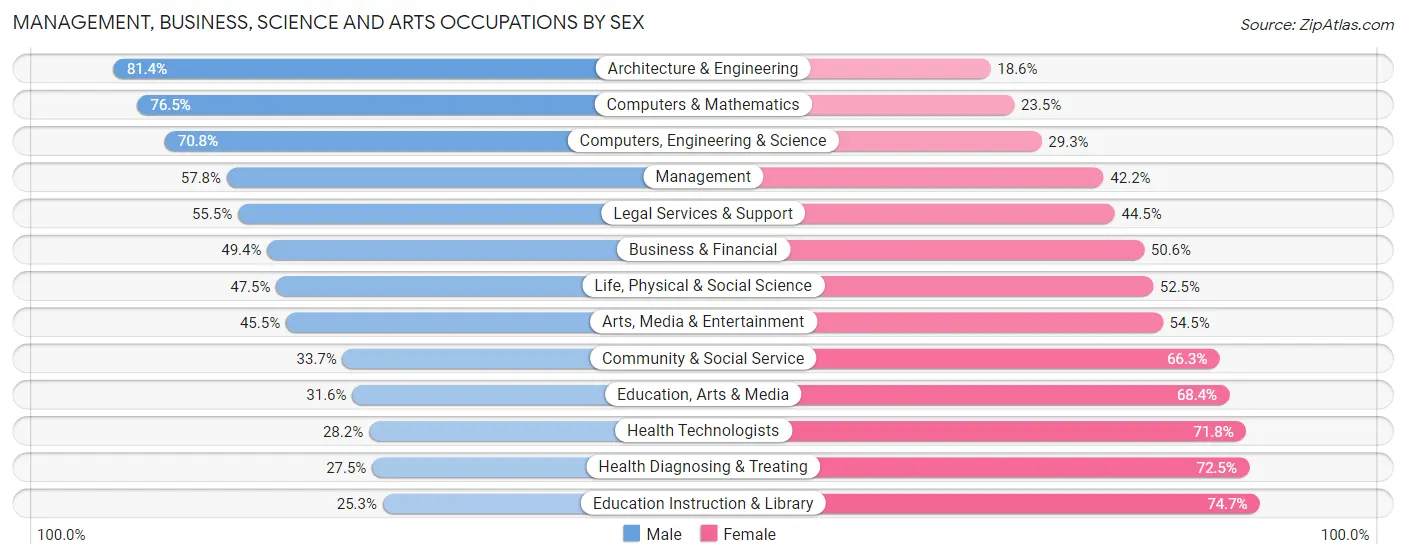
Management, Business, Science and Arts Occupations by Sex
Within the Management, Business, Science and Arts occupations in Montgomery County, the most male-oriented occupations are Architecture & Engineering (81.4%), Computers & Mathematics (76.5%), and Computers, Engineering & Science (70.8%), while the most female-oriented occupations are Education Instruction & Library (74.7%), Health Diagnosing & Treating (72.5%), and Health Technologists (71.8%).
| Occupation | Male | Female |
| Management | 35,570 (57.8%) | 25,964 (42.2%) |
| Business & Financial | 19,107 (49.4%) | 19,586 (50.6%) |
| Computers, Engineering & Science | 31,858 (70.8%) | 13,169 (29.2%) |
| Computers & Mathematics | 17,625 (76.5%) | 5,425 (23.5%) |
| Architecture & Engineering | 9,113 (81.4%) | 2,084 (18.6%) |
| Life, Physical & Social Science | 5,120 (47.5%) | 5,660 (52.5%) |
| Community & Social Service | 19,784 (33.7%) | 38,985 (66.3%) |
| Education, Arts & Media | 2,467 (31.6%) | 5,333 (68.4%) |
| Legal Services & Support | 4,485 (55.5%) | 3,598 (44.5%) |
| Education Instruction & Library | 8,340 (25.3%) | 24,667 (74.7%) |
| Arts, Media & Entertainment | 4,492 (45.5%) | 5,387 (54.5%) |
| Health Diagnosing & Treating | 9,834 (27.5%) | 25,939 (72.5%) |
| Health Technologists | 7,760 (28.2%) | 19,800 (71.8%) |
| Total (Category) | 116,153 (48.4%) | 123,643 (51.6%) |
| Total (Overall) | 233,942 (51.8%) | 217,553 (48.2%) |
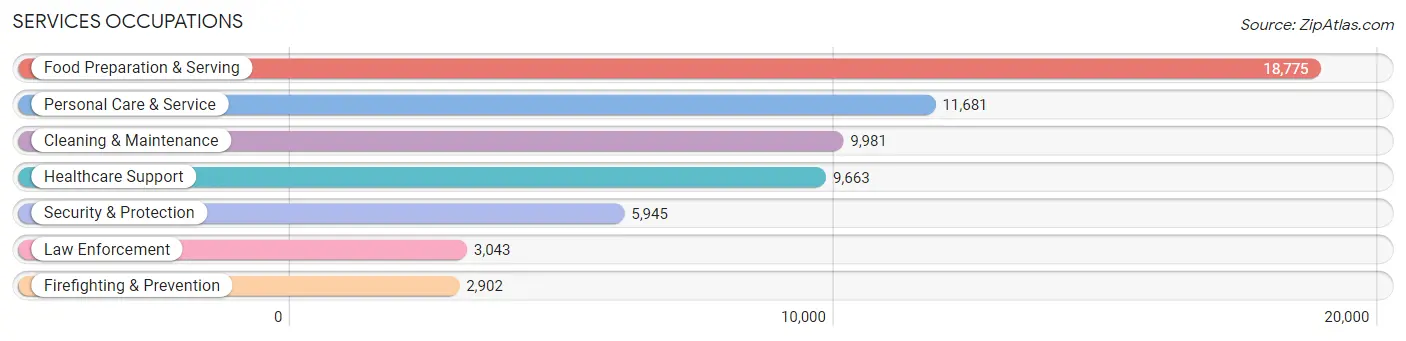
Services Occupations
The most common Services occupations in Montgomery County are Food Preparation & Serving (18,775 | 4.2%), Personal Care & Service (11,681 | 2.6%), Cleaning & Maintenance (9,981 | 2.2%), Healthcare Support (9,663 | 2.1%), and Security & Protection (5,945 | 1.3%).
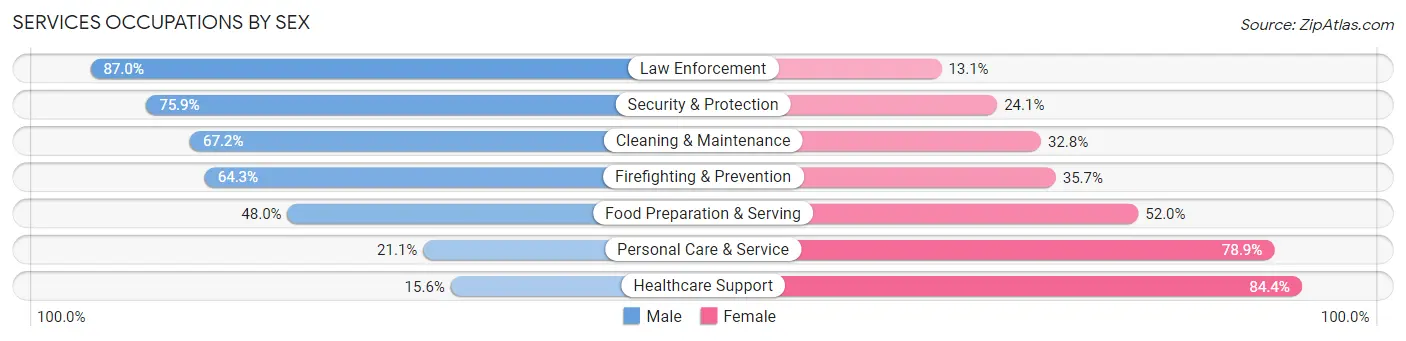
Services Occupations by Sex
Within the Services occupations in Montgomery County, the most male-oriented occupations are Law Enforcement (87.0%), Security & Protection (75.9%), and Cleaning & Maintenance (67.2%), while the most female-oriented occupations are Healthcare Support (84.4%), Personal Care & Service (78.9%), and Food Preparation & Serving (52.0%).
| Occupation | Male | Female |
| Healthcare Support | 1,510 (15.6%) | 8,153 (84.4%) |
| Security & Protection | 4,512 (75.9%) | 1,433 (24.1%) |
| Firefighting & Prevention | 1,866 (64.3%) | 1,036 (35.7%) |
| Law Enforcement | 2,646 (87.0%) | 397 (13.1%) |
| Food Preparation & Serving | 9,005 (48.0%) | 9,770 (52.0%) |
| Cleaning & Maintenance | 6,710 (67.2%) | 3,271 (32.8%) |
| Personal Care & Service | 2,462 (21.1%) | 9,219 (78.9%) |
| Total (Category) | 24,199 (43.2%) | 31,846 (56.8%) |
| Total (Overall) | 233,942 (51.8%) | 217,553 (48.2%) |
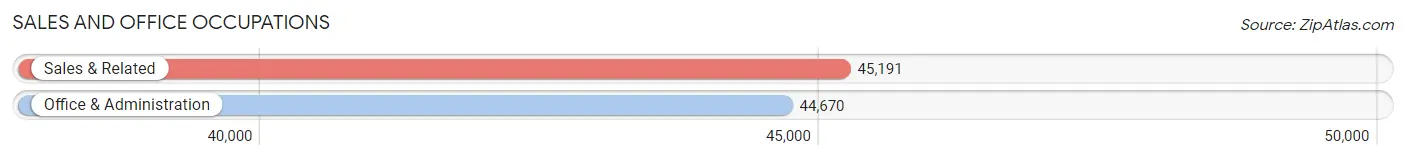
Sales and Office Occupations
The most common Sales and Office occupations in Montgomery County are Sales & Related (45,191 | 10.0%), and Office & Administration (44,670 | 9.9%).
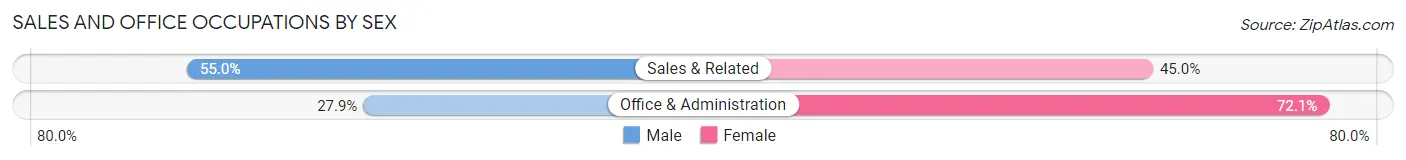
Sales and Office Occupations by Sex
| Occupation | Male | Female |
| Sales & Related | 24,860 (55.0%) | 20,331 (45.0%) |
| Office & Administration | 12,467 (27.9%) | 32,203 (72.1%) |
| Total (Category) | 37,327 (41.5%) | 52,534 (58.5%) |
| Total (Overall) | 233,942 (51.8%) | 217,553 (48.2%) |
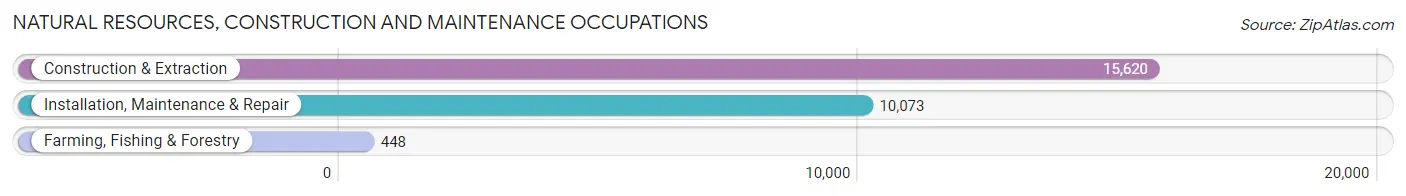
Natural Resources, Construction and Maintenance Occupations
The most common Natural Resources, Construction and Maintenance occupations in Montgomery County are Construction & Extraction (15,620 | 3.5%), Installation, Maintenance & Repair (10,073 | 2.2%), and Farming, Fishing & Forestry (448 | 0.1%).
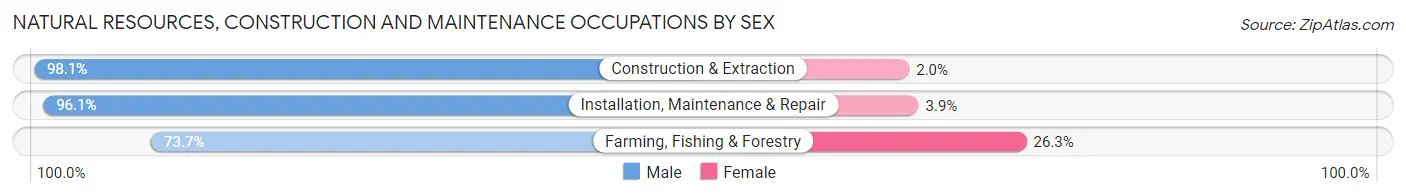
Natural Resources, Construction and Maintenance Occupations by Sex
| Occupation | Male | Female |
| Farming, Fishing & Forestry | 330 (73.7%) | 118 (26.3%) |
| Construction & Extraction | 15,315 (98.1%) | 305 (1.9%) |
| Installation, Maintenance & Repair | 9,682 (96.1%) | 391 (3.9%) |
| Total (Category) | 25,327 (96.9%) | 814 (3.1%) |
| Total (Overall) | 233,942 (51.8%) | 217,553 (48.2%) |
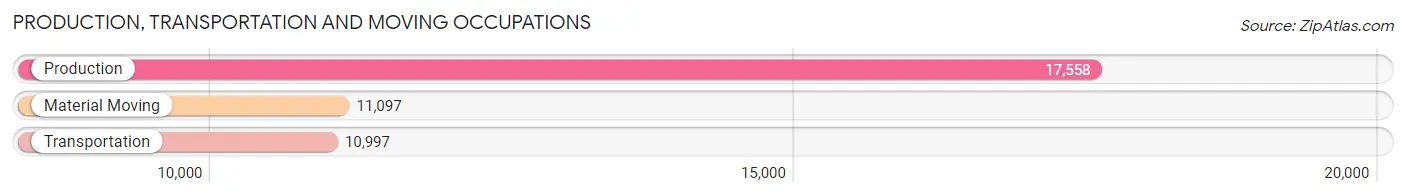
Production, Transportation and Moving Occupations
The most common Production, Transportation and Moving occupations in Montgomery County are Production (17,558 | 3.9%), Material Moving (11,097 | 2.5%), and Transportation (10,997 | 2.4%).
Production, Transportation and Moving Occupations by Sex
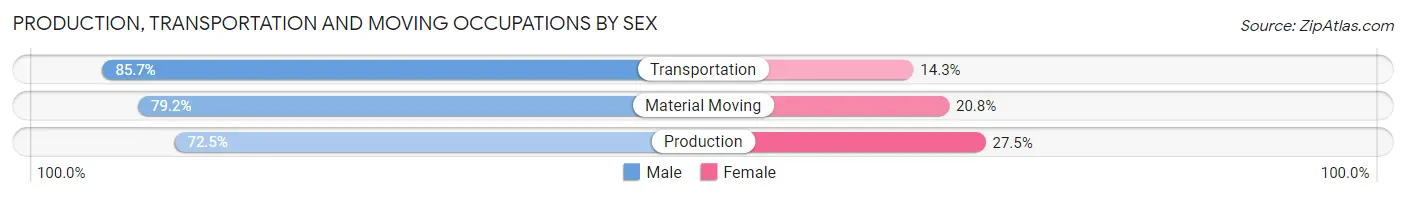
| Occupation | Male | Female |
| Production | 12,726 (72.5%) | 4,832 (27.5%) |
| Transportation | 9,425 (85.7%) | 1,572 (14.3%) |
| Material Moving | 8,785 (79.2%) | 2,312 (20.8%) |
| Total (Category) | 30,936 (78.0%) | 8,716 (22.0%) |
| Total (Overall) | 233,942 (51.8%) | 217,553 (48.2%) |
Employment Industries by Sex in Montgomery County
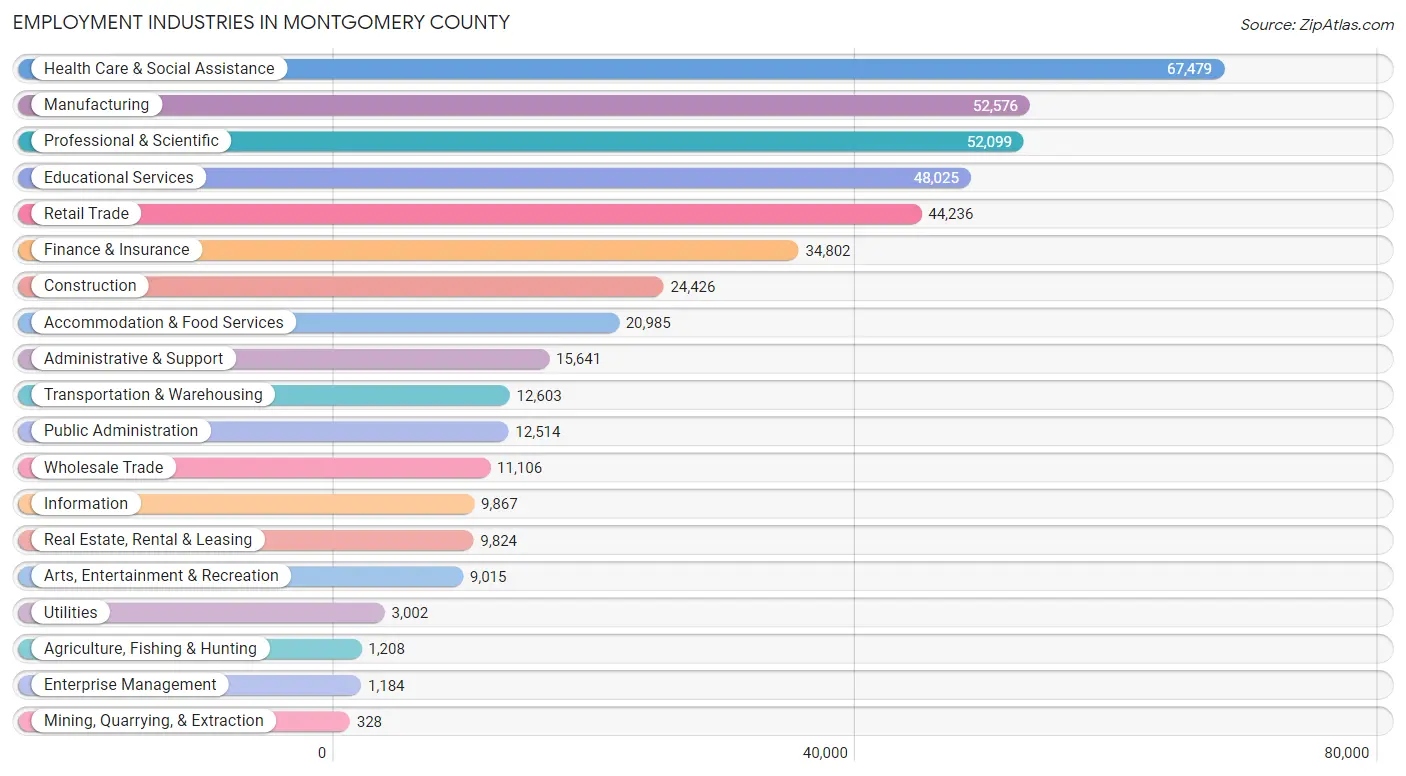
Employment Industries in Montgomery County
The major employment industries in Montgomery County include Health Care & Social Assistance (67,479 | 14.9%), Manufacturing (52,576 | 11.6%), Professional & Scientific (52,099 | 11.5%), Educational Services (48,025 | 10.6%), and Retail Trade (44,236 | 9.8%).
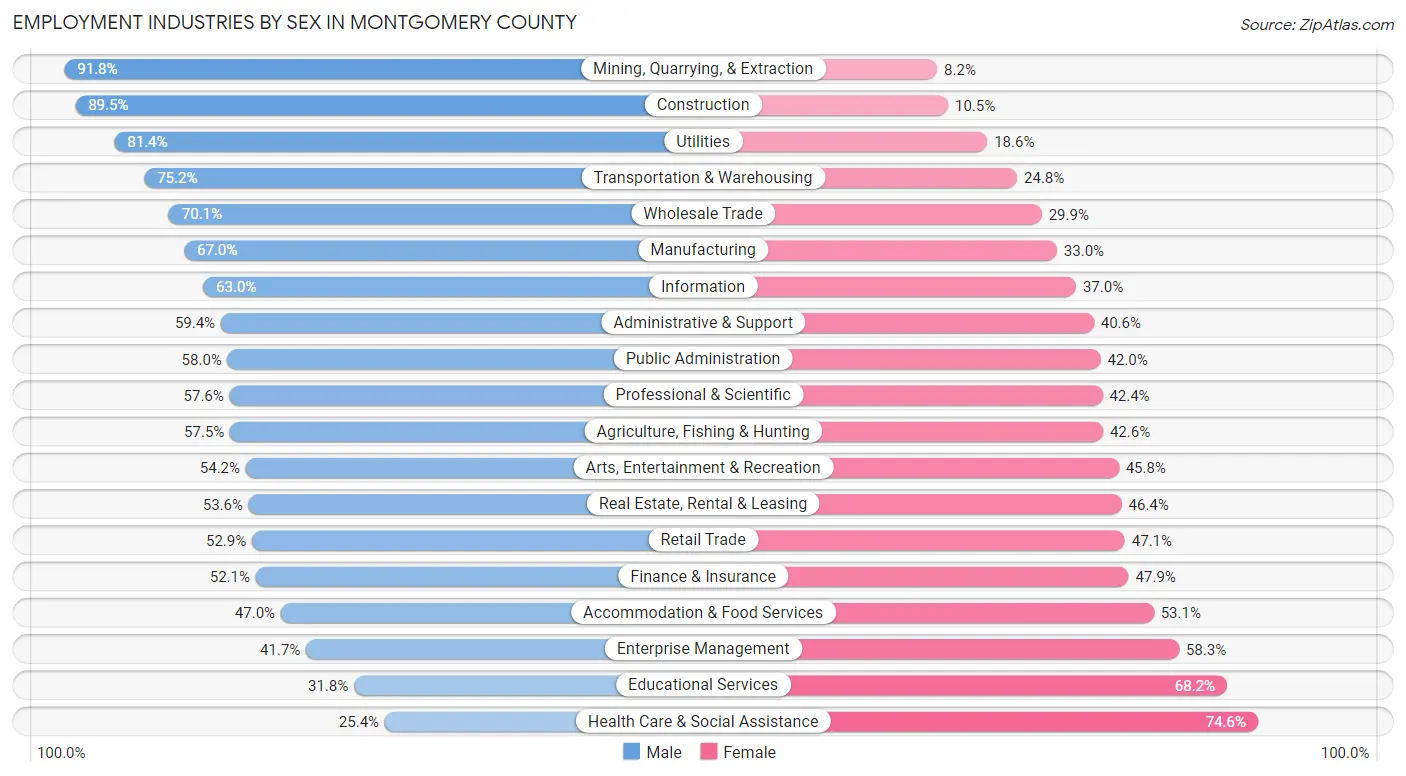
Employment Industries by Sex in Montgomery County
The Montgomery County industries that see more men than women are Mining, Quarrying, & Extraction (91.8%), Construction (89.5%), and Utilities (81.4%), whereas the industries that tend to have a higher number of women are Health Care & Social Assistance (74.6%), Educational Services (68.2%), and Enterprise Management (58.3%).
| Industry | Male | Female |
| Agriculture, Fishing & Hunting | 694 (57.5%) | 514 (42.5%) |
| Mining, Quarrying, & Extraction | 301 (91.8%) | 27 (8.2%) |
| Construction | 21,867 (89.5%) | 2,559 (10.5%) |
| Manufacturing | 35,221 (67.0%) | 17,355 (33.0%) |
| Wholesale Trade | 7,789 (70.1%) | 3,317 (29.9%) |
| Retail Trade | 23,408 (52.9%) | 20,828 (47.1%) |
| Transportation & Warehousing | 9,481 (75.2%) | 3,122 (24.8%) |
| Utilities | 2,444 (81.4%) | 558 (18.6%) |
| Information | 6,220 (63.0%) | 3,647 (37.0%) |
| Finance & Insurance | 18,147 (52.1%) | 16,655 (47.9%) |
| Real Estate, Rental & Leasing | 5,266 (53.6%) | 4,558 (46.4%) |
| Professional & Scientific | 29,988 (57.6%) | 22,111 (42.4%) |
| Enterprise Management | 494 (41.7%) | 690 (58.3%) |
| Administrative & Support | 9,284 (59.4%) | 6,357 (40.6%) |
| Educational Services | 15,276 (31.8%) | 32,749 (68.2%) |
| Health Care & Social Assistance | 17,152 (25.4%) | 50,327 (74.6%) |
| Arts, Entertainment & Recreation | 4,886 (54.2%) | 4,129 (45.8%) |
| Accommodation & Food Services | 9,852 (46.9%) | 11,133 (53.0%) |
| Public Administration | 7,254 (58.0%) | 5,260 (42.0%) |
| Total | 233,942 (51.8%) | 217,553 (48.2%) |
Education in Montgomery County
School Enrollment in Montgomery County
The most common levels of schooling among the 203,170 students in Montgomery County are high school (45,857 | 22.6%), middle school (41,500 | 20.4%), and elementary school (40,580 | 20.0%).
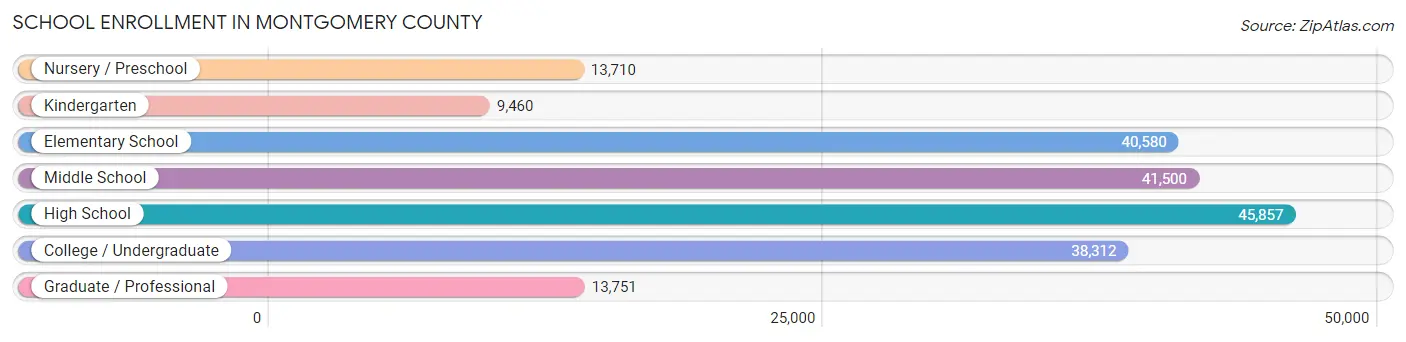
| School Level | # Students | % Students |
| Nursery / Preschool | 13,710 | 6.8% |
| Kindergarten | 9,460 | 4.7% |
| Elementary School | 40,580 | 20.0% |
| Middle School | 41,500 | 20.4% |
| High School | 45,857 | 22.6% |
| College / Undergraduate | 38,312 | 18.9% |
| Graduate / Professional | 13,751 | 6.8% |
| Total | 203,170 | 100.0% |
School Enrollment by Age by Funding Source in Montgomery County
Out of a total of 203,170 students who are enrolled in schools in Montgomery County, 58,513 (28.8%) attend a private institution, while the remaining 144,657 (71.2%) are enrolled in public schools. The age group of 3 to 4 year olds has the highest likelihood of being enrolled in private schools, with 7,256 (69.2% in the age bracket) enrolled. Conversely, the age group of 10 to 14 year olds has the lowest likelihood of being enrolled in a private school, with 42,889 (82.8% in the age bracket) attending a public institution.
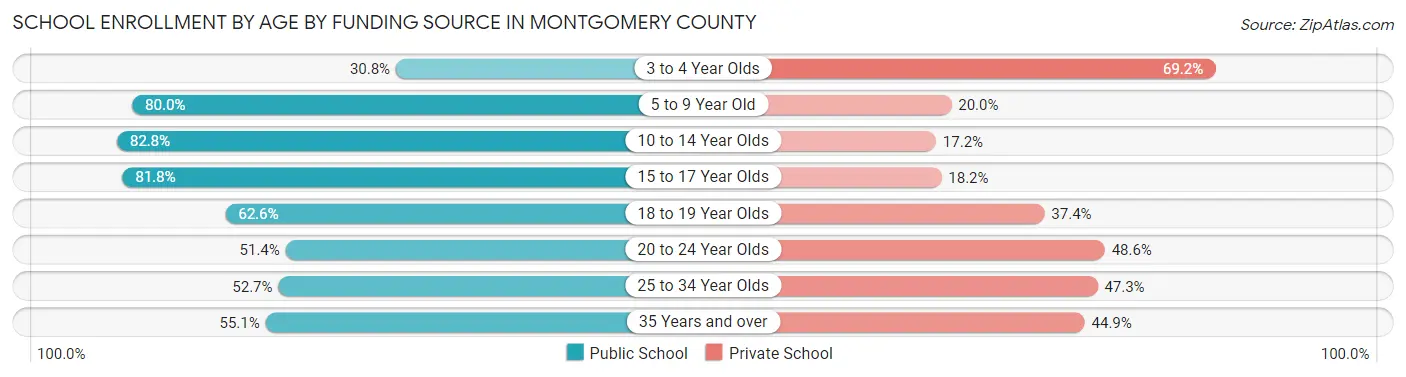
| Age Bracket | Public School | Private School |
| 3 to 4 Year Olds | 3,234 (30.8%) | 7,256 (69.2%) |
| 5 to 9 Year Old | 38,337 (80.0%) | 9,611 (20.0%) |
| 10 to 14 Year Olds | 42,889 (82.8%) | 8,896 (17.2%) |
| 15 to 17 Year Olds | 26,742 (81.8%) | 5,951 (18.2%) |
| 18 to 19 Year Olds | 10,789 (62.6%) | 6,444 (37.4%) |
| 20 to 24 Year Olds | 11,225 (51.4%) | 10,621 (48.6%) |
| 25 to 34 Year Olds | 5,507 (52.7%) | 4,937 (47.3%) |
| 35 Years and over | 5,915 (55.1%) | 4,816 (44.9%) |
| Total | 144,657 (71.2%) | 58,513 (28.8%) |
Educational Attainment by Field of Study in Montgomery County
Business (70,822 | 21.2%), education (33,961 | 10.2%), science & technology (32,710 | 9.8%), social sciences (24,393 | 7.3%), and engineering (23,939 | 7.1%) are the most common fields of study among 334,585 individuals in Montgomery County who have obtained a bachelor's degree or higher.
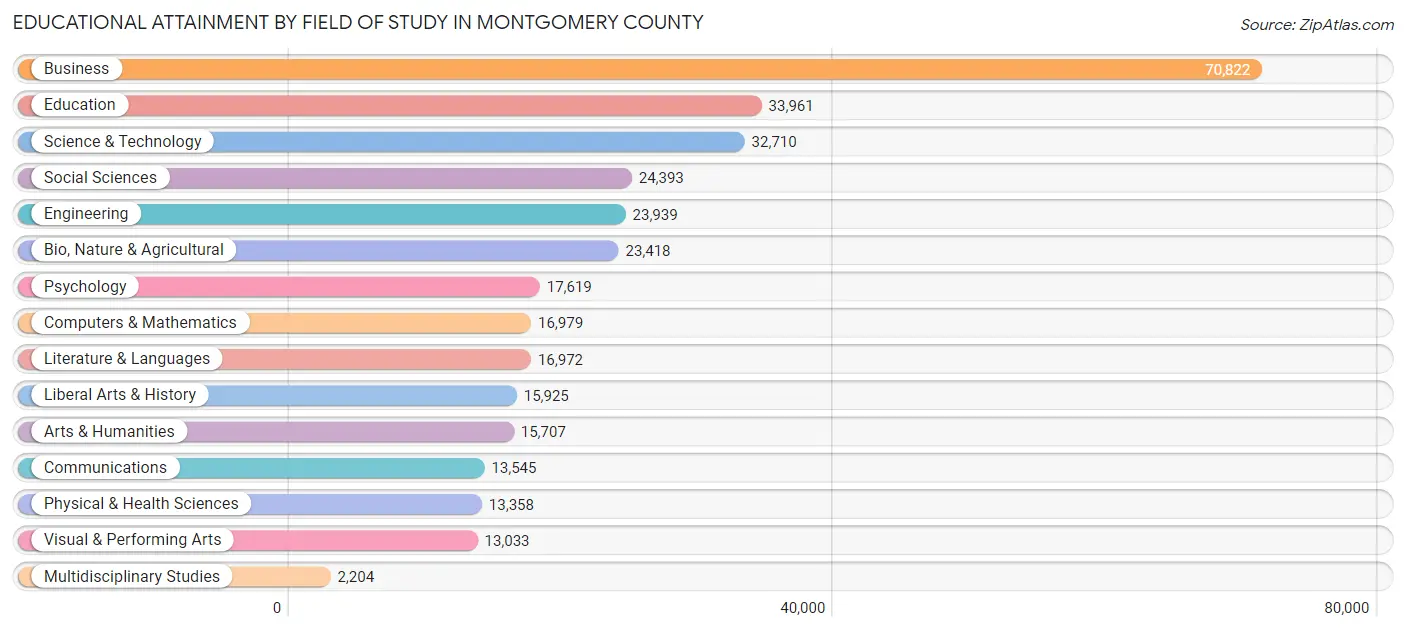
| Field of Study | # Graduates | % Graduates |
| Computers & Mathematics | 16,979 | 5.1% |
| Bio, Nature & Agricultural | 23,418 | 7.0% |
| Physical & Health Sciences | 13,358 | 4.0% |
| Psychology | 17,619 | 5.3% |
| Social Sciences | 24,393 | 7.3% |
| Engineering | 23,939 | 7.1% |
| Multidisciplinary Studies | 2,204 | 0.7% |
| Science & Technology | 32,710 | 9.8% |
| Business | 70,822 | 21.2% |
| Education | 33,961 | 10.2% |
| Literature & Languages | 16,972 | 5.1% |
| Liberal Arts & History | 15,925 | 4.8% |
| Visual & Performing Arts | 13,033 | 3.9% |
| Communications | 13,545 | 4.1% |
| Arts & Humanities | 15,707 | 4.7% |
| Total | 334,585 | 100.0% |
Transportation & Commute in Montgomery County
Vehicle Availability by Sex in Montgomery County
The most prevalent vehicle ownership categories in Montgomery County are males with 2 vehicles (111,674, accounting for 48.4%) and females with 2 vehicles (96,835, making up 53.1%).
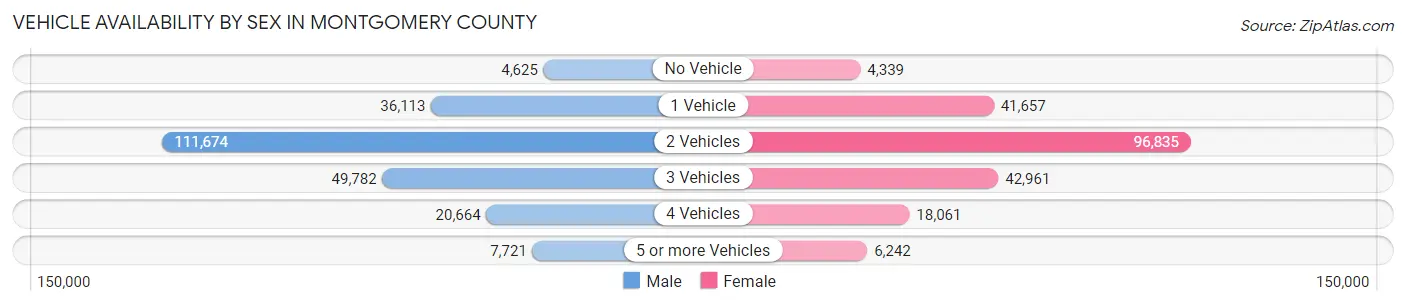
| Vehicles Available | Male | Female |
| No Vehicle | 4,625 (2.0%) | 4,339 (2.1%) |
| 1 Vehicle | 36,113 (15.7%) | 41,657 (19.8%) |
| 2 Vehicles | 111,674 (48.4%) | 96,835 (46.1%) |
| 3 Vehicles | 49,782 (21.6%) | 42,961 (20.4%) |
| 4 Vehicles | 20,664 (9.0%) | 18,061 (8.6%) |
| 5 or more Vehicles | 7,721 (3.4%) | 6,242 (3.0%) |
| Total | 230,579 (100.0%) | 210,095 (100.0%) |
Commute Time in Montgomery County
The most frequently occuring commute durations in Montgomery County are 30 to 34 minutes (51,282 commuters, 14.1%), 15 to 19 minutes (47,829 commuters, 13.1%), and 10 to 14 minutes (43,558 commuters, 12.0%).
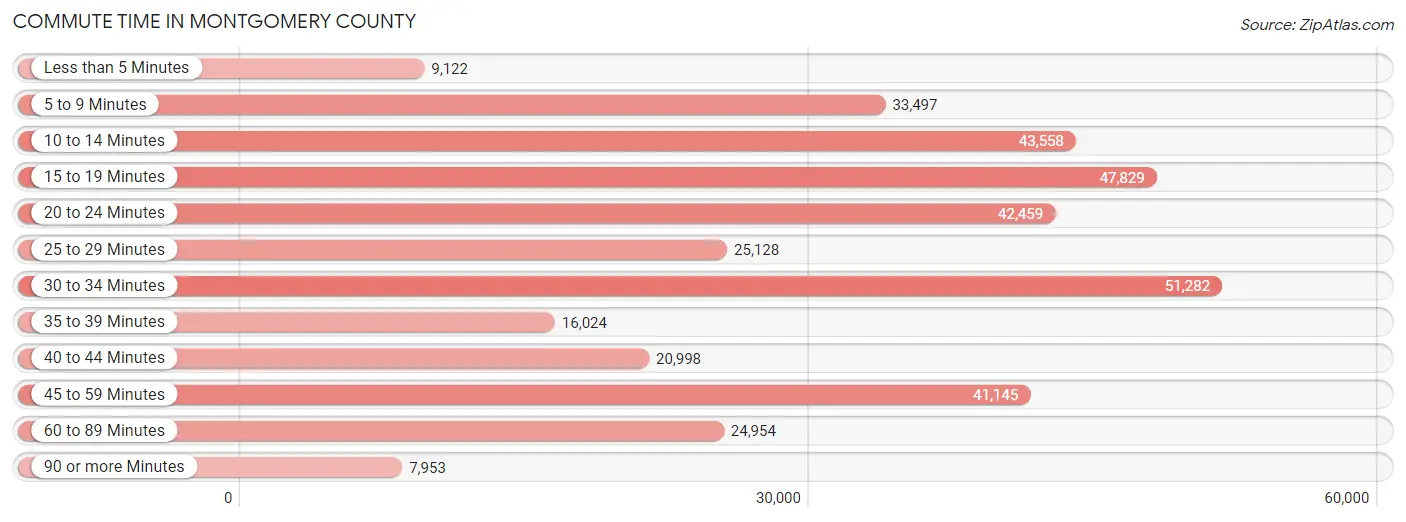
| Commute Time | # Commuters | % Commuters |
| Less than 5 Minutes | 9,122 | 2.5% |
| 5 to 9 Minutes | 33,497 | 9.2% |
| 10 to 14 Minutes | 43,558 | 12.0% |
| 15 to 19 Minutes | 47,829 | 13.1% |
| 20 to 24 Minutes | 42,459 | 11.7% |
| 25 to 29 Minutes | 25,128 | 6.9% |
| 30 to 34 Minutes | 51,282 | 14.1% |
| 35 to 39 Minutes | 16,024 | 4.4% |
| 40 to 44 Minutes | 20,998 | 5.8% |
| 45 to 59 Minutes | 41,145 | 11.3% |
| 60 to 89 Minutes | 24,954 | 6.9% |
| 90 or more Minutes | 7,953 | 2.2% |
Commute Time by Sex in Montgomery County
The most common commute times in Montgomery County are 30 to 34 minutes (28,118 commuters, 14.7%) for males and 15 to 19 minutes (24,652 commuters, 14.3%) for females.
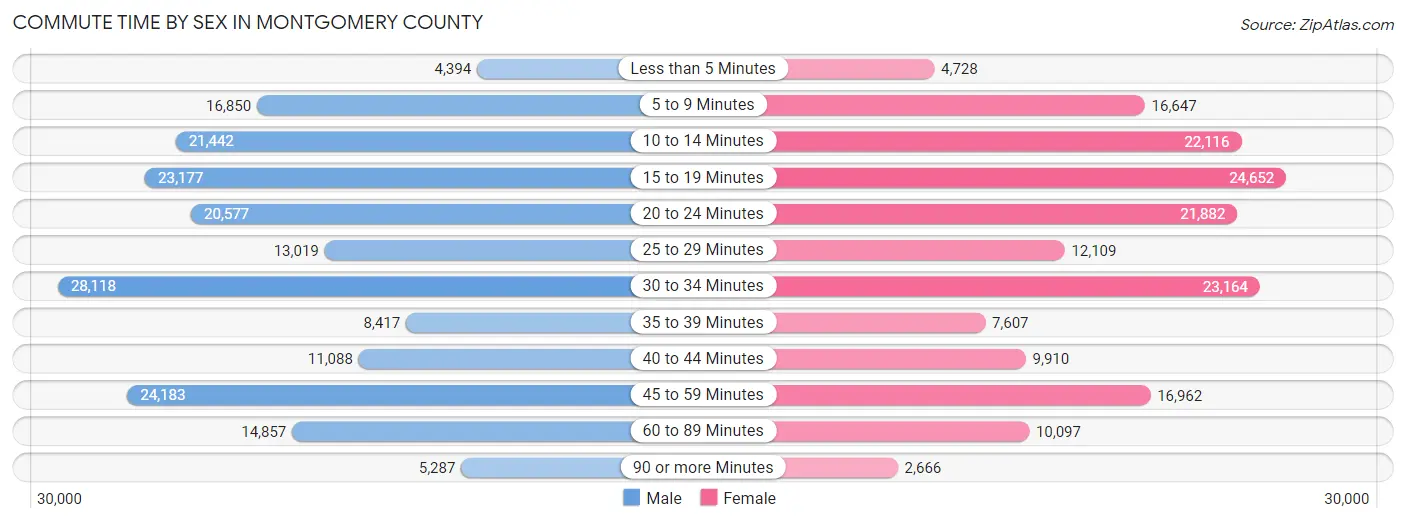
| Commute Time | Male | Female |
| Less than 5 Minutes | 4,394 (2.3%) | 4,728 (2.7%) |
| 5 to 9 Minutes | 16,850 (8.8%) | 16,647 (9.7%) |
| 10 to 14 Minutes | 21,442 (11.2%) | 22,116 (12.8%) |
| 15 to 19 Minutes | 23,177 (12.1%) | 24,652 (14.3%) |
| 20 to 24 Minutes | 20,577 (10.7%) | 21,882 (12.7%) |
| 25 to 29 Minutes | 13,019 (6.8%) | 12,109 (7.0%) |
| 30 to 34 Minutes | 28,118 (14.7%) | 23,164 (13.4%) |
| 35 to 39 Minutes | 8,417 (4.4%) | 7,607 (4.4%) |
| 40 to 44 Minutes | 11,088 (5.8%) | 9,910 (5.7%) |
| 45 to 59 Minutes | 24,183 (12.6%) | 16,962 (9.8%) |
| 60 to 89 Minutes | 14,857 (7.8%) | 10,097 (5.9%) |
| 90 or more Minutes | 5,287 (2.8%) | 2,666 (1.5%) |
Time of Departure to Work by Sex in Montgomery County
The most frequent times of departure to work in Montgomery County are 7:00 AM to 7:29 AM (28,012, 14.6%) for males and 8:00 AM to 8:29 AM (27,177, 15.8%) for females.
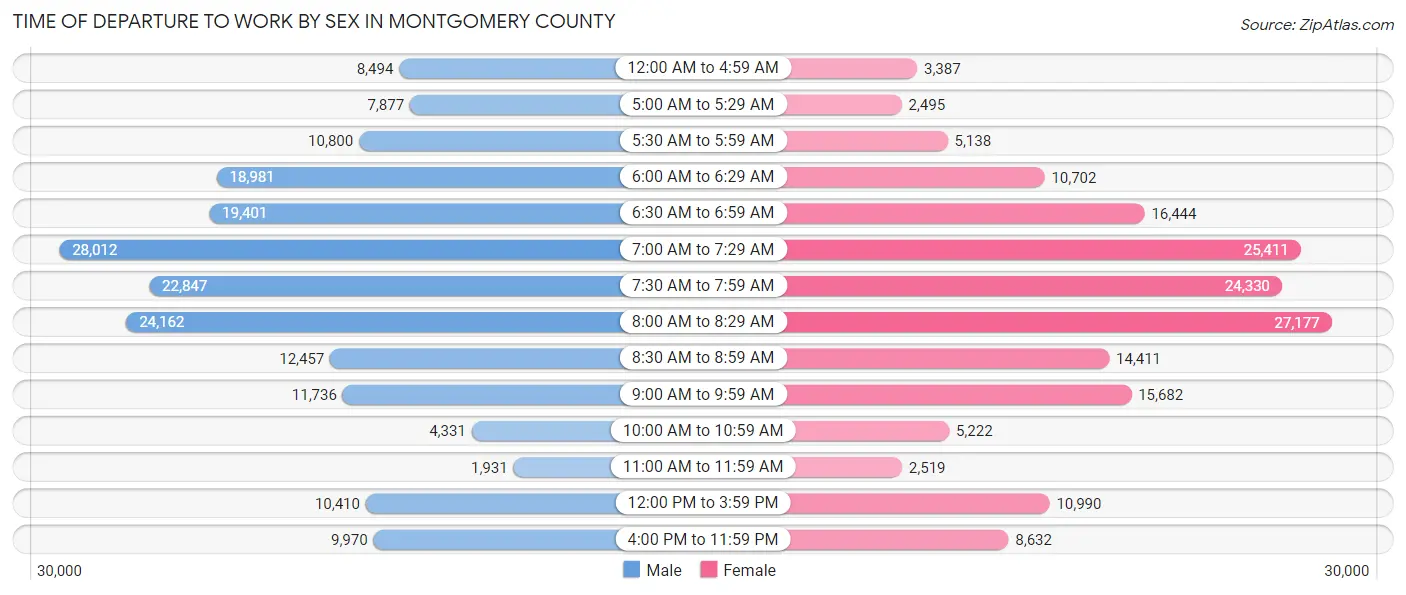
| Time of Departure | Male | Female |
| 12:00 AM to 4:59 AM | 8,494 (4.4%) | 3,387 (2.0%) |
| 5:00 AM to 5:29 AM | 7,877 (4.1%) | 2,495 (1.5%) |
| 5:30 AM to 5:59 AM | 10,800 (5.6%) | 5,138 (3.0%) |
| 6:00 AM to 6:29 AM | 18,981 (9.9%) | 10,702 (6.2%) |
| 6:30 AM to 6:59 AM | 19,401 (10.1%) | 16,444 (9.5%) |
| 7:00 AM to 7:29 AM | 28,012 (14.6%) | 25,411 (14.7%) |
| 7:30 AM to 7:59 AM | 22,847 (11.9%) | 24,330 (14.1%) |
| 8:00 AM to 8:29 AM | 24,162 (12.6%) | 27,177 (15.8%) |
| 8:30 AM to 8:59 AM | 12,457 (6.5%) | 14,411 (8.4%) |
| 9:00 AM to 9:59 AM | 11,736 (6.1%) | 15,682 (9.1%) |
| 10:00 AM to 10:59 AM | 4,331 (2.3%) | 5,222 (3.0%) |
| 11:00 AM to 11:59 AM | 1,931 (1.0%) | 2,519 (1.5%) |
| 12:00 PM to 3:59 PM | 10,410 (5.4%) | 10,990 (6.4%) |
| 4:00 PM to 11:59 PM | 9,970 (5.2%) | 8,632 (5.0%) |
| Total | 191,409 (100.0%) | 172,540 (100.0%) |
Housing Occupancy in Montgomery County
Occupancy by Ownership in Montgomery County
Of the total 329,680 dwellings in Montgomery County, owner-occupied units account for 236,503 (71.7%), while renter-occupied units make up 93,177 (28.3%).
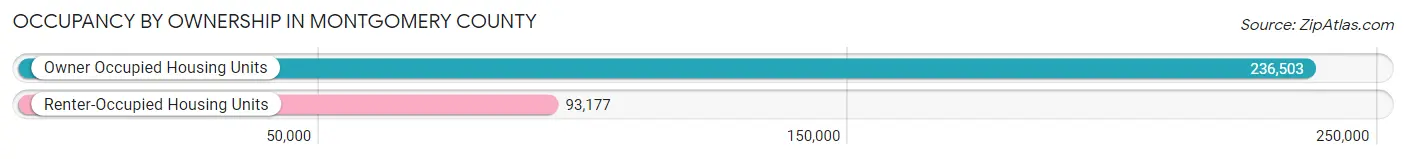
| Occupancy | # Housing Units | % Housing Units |
| Owner Occupied Housing Units | 236,503 | 71.7% |
| Renter-Occupied Housing Units | 93,177 | 28.3% |
| Total Occupied Housing Units | 329,680 | 100.0% |
Occupancy by Household Size in Montgomery County
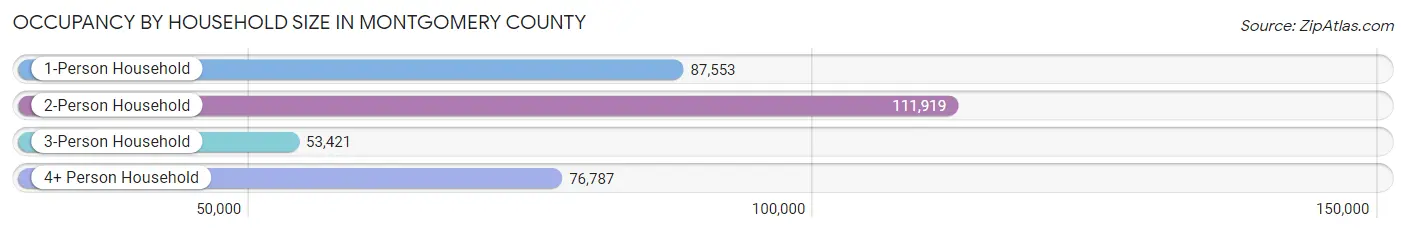
| Household Size | # Housing Units | % Housing Units |
| 1-Person Household | 87,553 | 26.6% |
| 2-Person Household | 111,919 | 34.0% |
| 3-Person Household | 53,421 | 16.2% |
| 4+ Person Household | 76,787 | 23.3% |
| Total Housing Units | 329,680 | 100.0% |
Occupancy by Ownership by Household Size in Montgomery County
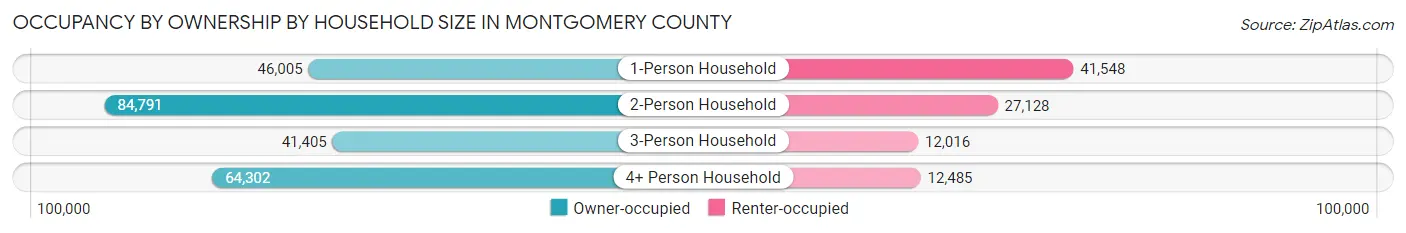
| Household Size | Owner-occupied | Renter-occupied |
| 1-Person Household | 46,005 (52.5%) | 41,548 (47.4%) |
| 2-Person Household | 84,791 (75.8%) | 27,128 (24.2%) |
| 3-Person Household | 41,405 (77.5%) | 12,016 (22.5%) |
| 4+ Person Household | 64,302 (83.7%) | 12,485 (16.3%) |
| Total Housing Units | 236,503 (71.7%) | 93,177 (28.3%) |
Occupancy by Educational Attainment in Montgomery County
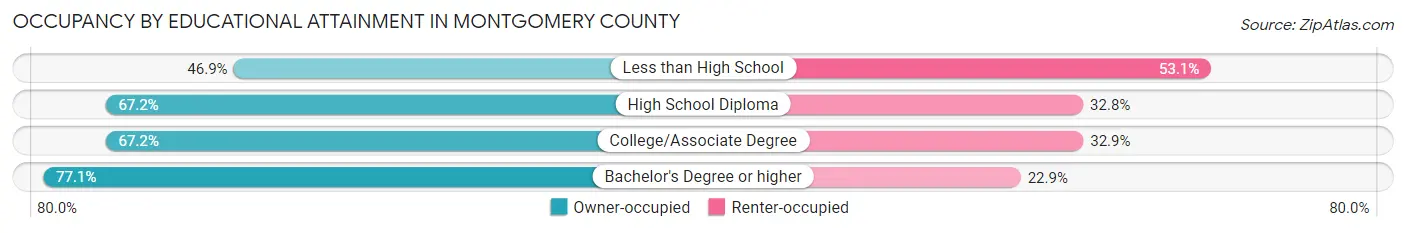
| Household Size | Owner-occupied | Renter-occupied |
| Less than High School | 6,300 (46.9%) | 7,139 (53.1%) |
| High School Diploma | 43,461 (67.2%) | 21,246 (32.8%) |
| College/Associate Degree | 48,131 (67.1%) | 23,542 (32.9%) |
| Bachelor's Degree or higher | 138,611 (77.1%) | 41,250 (22.9%) |
Occupancy by Age of Householder in Montgomery County
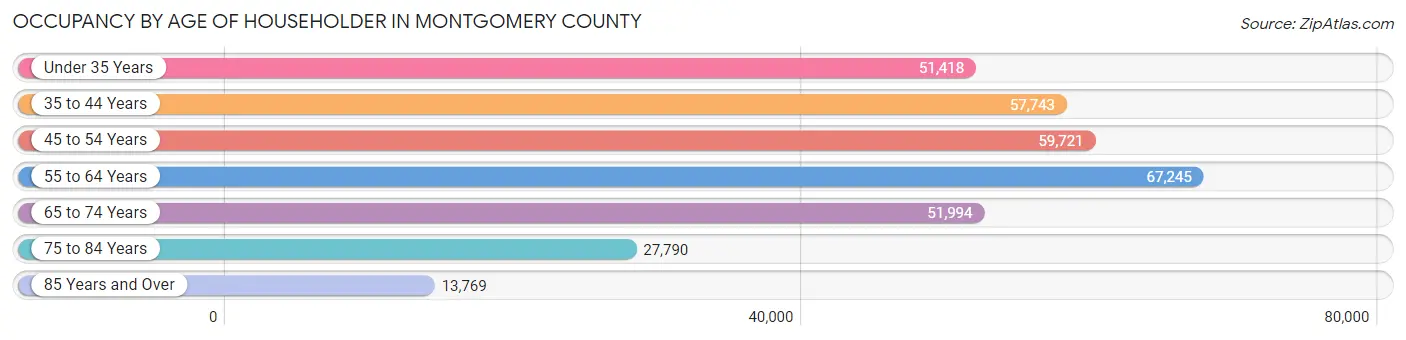
| Age Bracket | # Households | % Households |
| Under 35 Years | 51,418 | 15.6% |
| 35 to 44 Years | 57,743 | 17.5% |
| 45 to 54 Years | 59,721 | 18.1% |
| 55 to 64 Years | 67,245 | 20.4% |
| 65 to 74 Years | 51,994 | 15.8% |
| 75 to 84 Years | 27,790 | 8.4% |
| 85 Years and Over | 13,769 | 4.2% |
| Total | 329,680 | 100.0% |
Housing Finances in Montgomery County
Median Income by Occupancy in Montgomery County
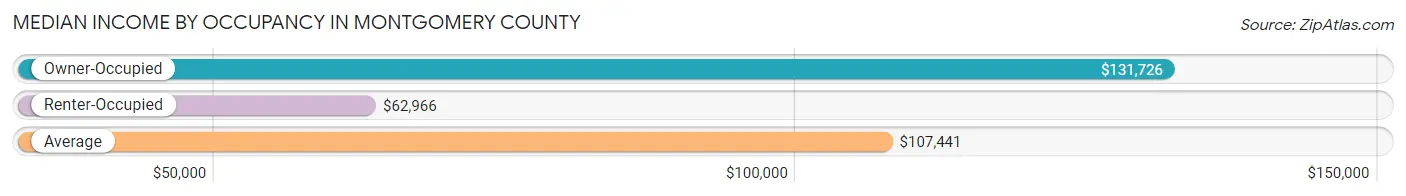
| Occupancy Type | # Households | Median Income |
| Owner-Occupied | 236,503 (71.7%) | $131,726 |
| Renter-Occupied | 93,177 (28.3%) | $62,966 |
| Average | 329,680 (100.0%) | $107,441 |
Occupancy by Householder Income Bracket in Montgomery County
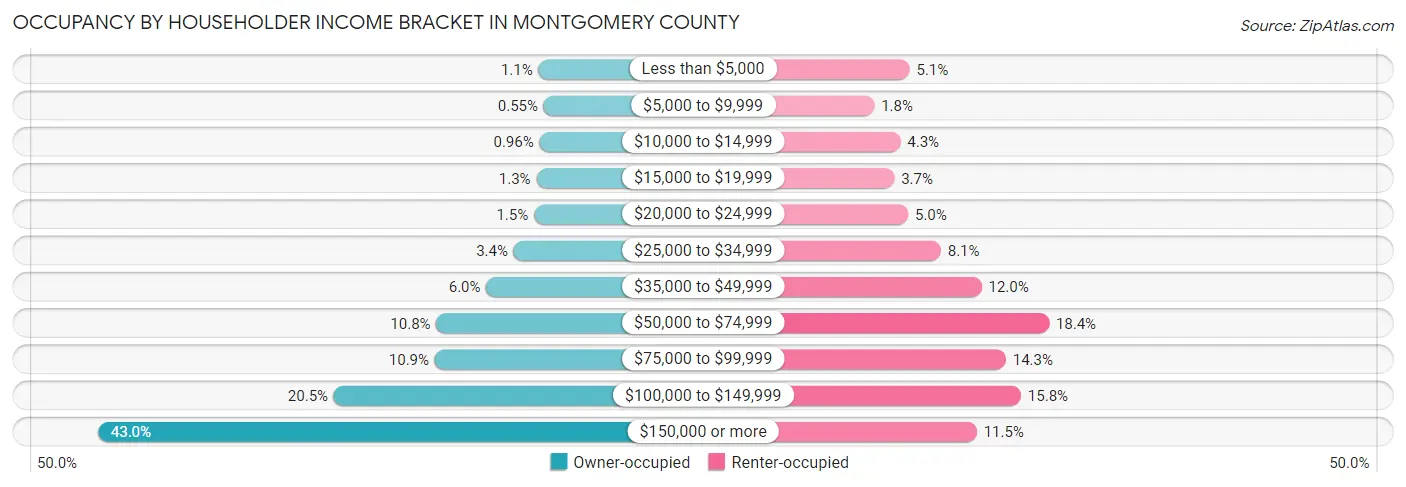
| Income Bracket | Owner-occupied | Renter-occupied |
| Less than $5,000 | 2,493 (1.1%) | 4,791 (5.1%) |
| $5,000 to $9,999 | 1,305 (0.5%) | 1,660 (1.8%) |
| $10,000 to $14,999 | 2,278 (1.0%) | 3,981 (4.3%) |
| $15,000 to $19,999 | 2,965 (1.3%) | 3,426 (3.7%) |
| $20,000 to $24,999 | 3,502 (1.5%) | 4,661 (5.0%) |
| $25,000 to $34,999 | 8,063 (3.4%) | 7,563 (8.1%) |
| $35,000 to $49,999 | 14,229 (6.0%) | 11,179 (12.0%) |
| $50,000 to $74,999 | 25,492 (10.8%) | 17,159 (18.4%) |
| $75,000 to $99,999 | 25,845 (10.9%) | 13,330 (14.3%) |
| $100,000 to $149,999 | 48,586 (20.5%) | 14,676 (15.8%) |
| $150,000 or more | 101,745 (43.0%) | 10,751 (11.5%) |
| Total | 236,503 (100.0%) | 93,177 (100.0%) |
Monthly Housing Cost Tiers in Montgomery County
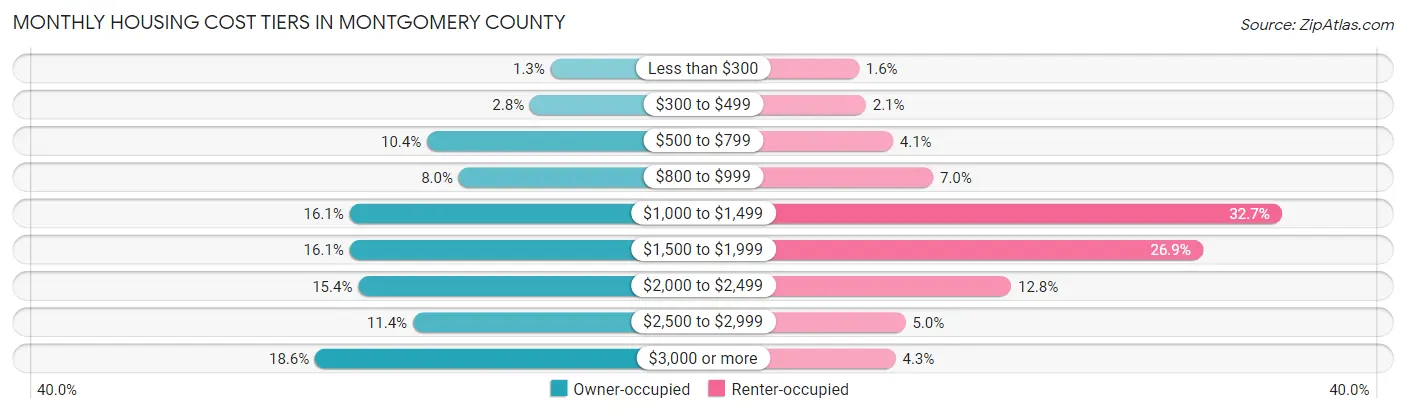
| Monthly Cost | Owner-occupied | Renter-occupied |
| Less than $300 | 2,977 (1.3%) | 1,473 (1.6%) |
| $300 to $499 | 6,582 (2.8%) | 1,952 (2.1%) |
| $500 to $799 | 24,503 (10.4%) | 3,800 (4.1%) |
| $800 to $999 | 18,976 (8.0%) | 6,556 (7.0%) |
| $1,000 to $1,499 | 38,002 (16.1%) | 30,473 (32.7%) |
| $1,500 to $1,999 | 37,990 (16.1%) | 25,055 (26.9%) |
| $2,000 to $2,499 | 36,494 (15.4%) | 11,918 (12.8%) |
| $2,500 to $2,999 | 26,954 (11.4%) | 4,667 (5.0%) |
| $3,000 or more | 44,025 (18.6%) | 3,986 (4.3%) |
| Total | 236,503 (100.0%) | 93,177 (100.0%) |
Physical Housing Characteristics in Montgomery County
Housing Structures in Montgomery County
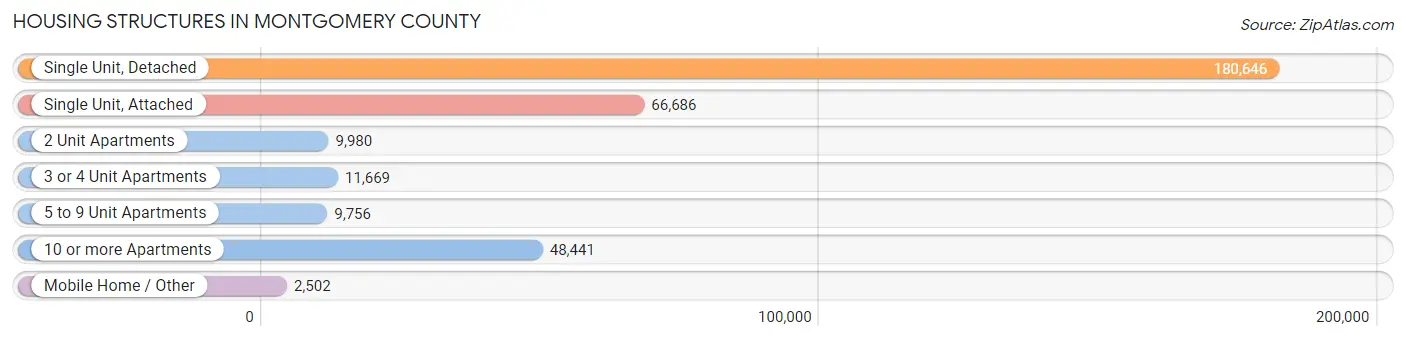
| Structure Type | # Housing Units | % Housing Units |
| Single Unit, Detached | 180,646 | 54.8% |
| Single Unit, Attached | 66,686 | 20.2% |
| 2 Unit Apartments | 9,980 | 3.0% |
| 3 or 4 Unit Apartments | 11,669 | 3.5% |
| 5 to 9 Unit Apartments | 9,756 | 3.0% |
| 10 or more Apartments | 48,441 | 14.7% |
| Mobile Home / Other | 2,502 | 0.8% |
| Total | 329,680 | 100.0% |
Housing Structures by Occupancy in Montgomery County
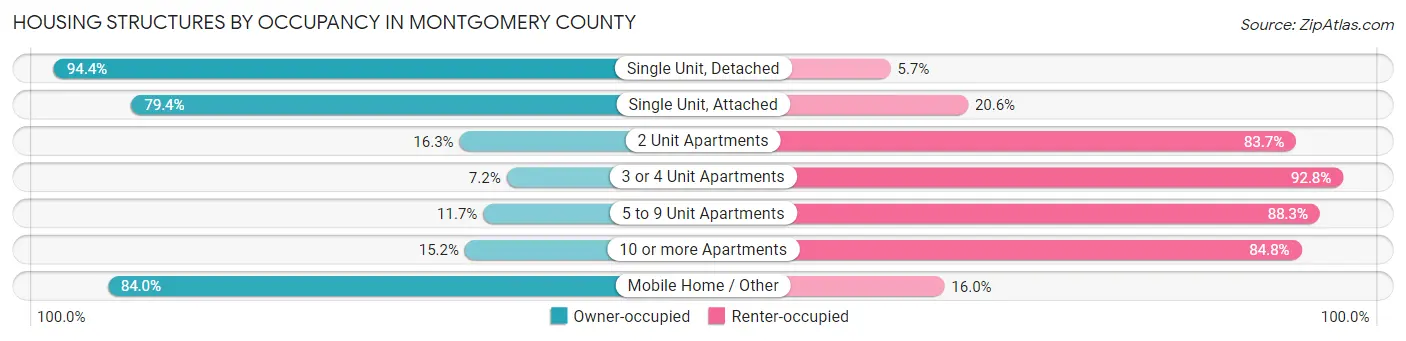
| Structure Type | Owner-occupied | Renter-occupied |
| Single Unit, Detached | 170,433 (94.4%) | 10,213 (5.7%) |
| Single Unit, Attached | 52,978 (79.4%) | 13,708 (20.6%) |
| 2 Unit Apartments | 1,625 (16.3%) | 8,355 (83.7%) |
| 3 or 4 Unit Apartments | 842 (7.2%) | 10,827 (92.8%) |
| 5 to 9 Unit Apartments | 1,142 (11.7%) | 8,614 (88.3%) |
| 10 or more Apartments | 7,382 (15.2%) | 41,059 (84.8%) |
| Mobile Home / Other | 2,101 (84.0%) | 401 (16.0%) |
| Total | 236,503 (71.7%) | 93,177 (28.3%) |
Housing Structures by Number of Rooms in Montgomery County
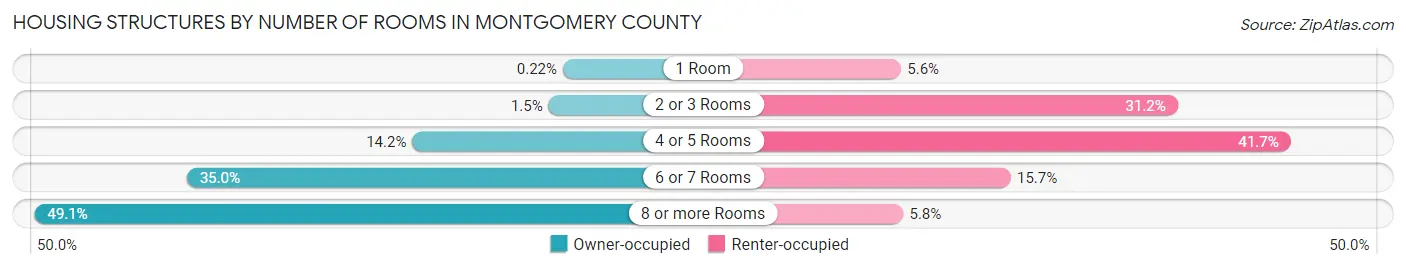
| Number of Rooms | Owner-occupied | Renter-occupied |
| 1 Room | 531 (0.2%) | 5,208 (5.6%) |
| 2 or 3 Rooms | 3,644 (1.5%) | 29,096 (31.2%) |
| 4 or 5 Rooms | 33,465 (14.1%) | 38,824 (41.7%) |
| 6 or 7 Rooms | 82,767 (35.0%) | 14,654 (15.7%) |
| 8 or more Rooms | 116,096 (49.1%) | 5,395 (5.8%) |
| Total | 236,503 (100.0%) | 93,177 (100.0%) |
Housing Structure by Heating Type in Montgomery County
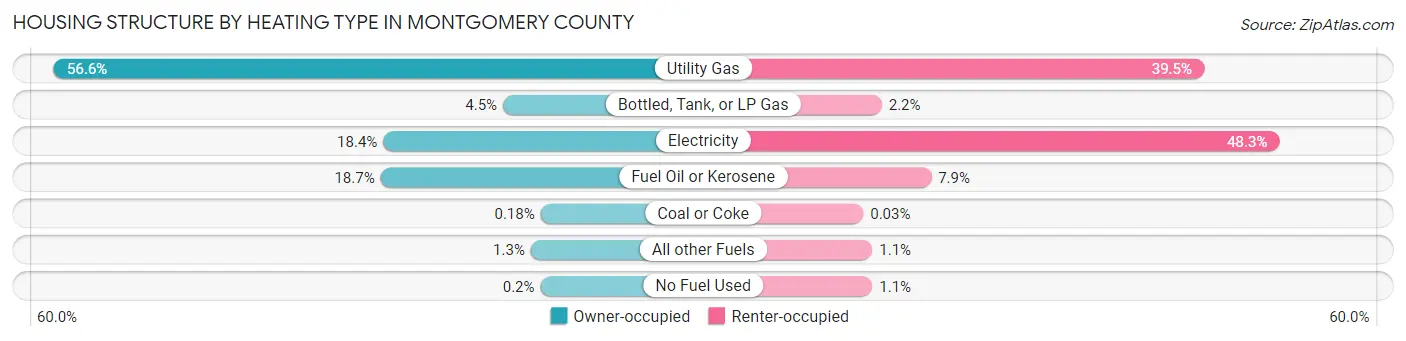
| Heating Type | Owner-occupied | Renter-occupied |
| Utility Gas | 133,870 (56.6%) | 36,808 (39.5%) |
| Bottled, Tank, or LP Gas | 10,727 (4.5%) | 2,022 (2.2%) |
| Electricity | 43,589 (18.4%) | 44,956 (48.2%) |
| Fuel Oil or Kerosene | 44,309 (18.7%) | 7,360 (7.9%) |
| Coal or Coke | 414 (0.2%) | 27 (0.0%) |
| All other Fuels | 3,124 (1.3%) | 1,002 (1.1%) |
| No Fuel Used | 470 (0.2%) | 1,002 (1.1%) |
| Total | 236,503 (100.0%) | 93,177 (100.0%) |
Household Vehicle Usage in Montgomery County
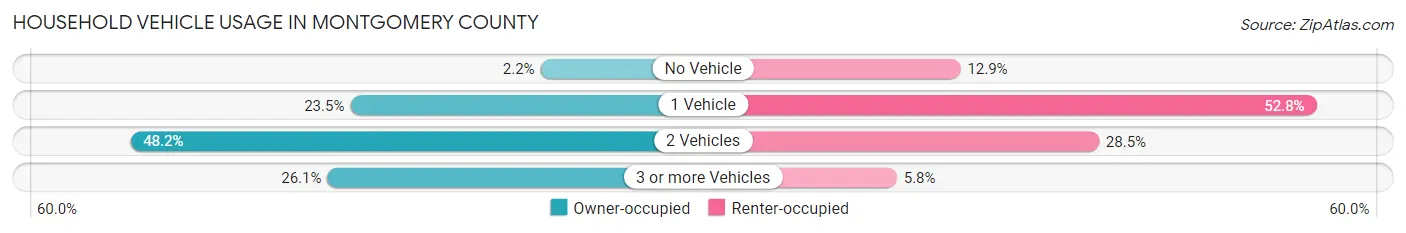
| Vehicles per Household | Owner-occupied | Renter-occupied |
| No Vehicle | 5,246 (2.2%) | 12,054 (12.9%) |
| 1 Vehicle | 55,625 (23.5%) | 49,207 (52.8%) |
| 2 Vehicles | 113,918 (48.2%) | 26,505 (28.4%) |
| 3 or more Vehicles | 61,714 (26.1%) | 5,411 (5.8%) |
| Total | 236,503 (100.0%) | 93,177 (100.0%) |
Real Estate & Mortgages in Montgomery County
Real Estate and Mortgage Overview in Montgomery County
| Characteristic | Without Mortgage | With Mortgage |
| Housing Units | 77,736 | 158,767 |
| Median Property Value | $369,000 | $387,900 |
| Median Household Income | $96,039 | $77,517 |
| Monthly Housing Costs | $876 | $42,756 |
| Real Estate Taxes | $5,403 | $1,583 |
Property Value by Mortgage Status in Montgomery County
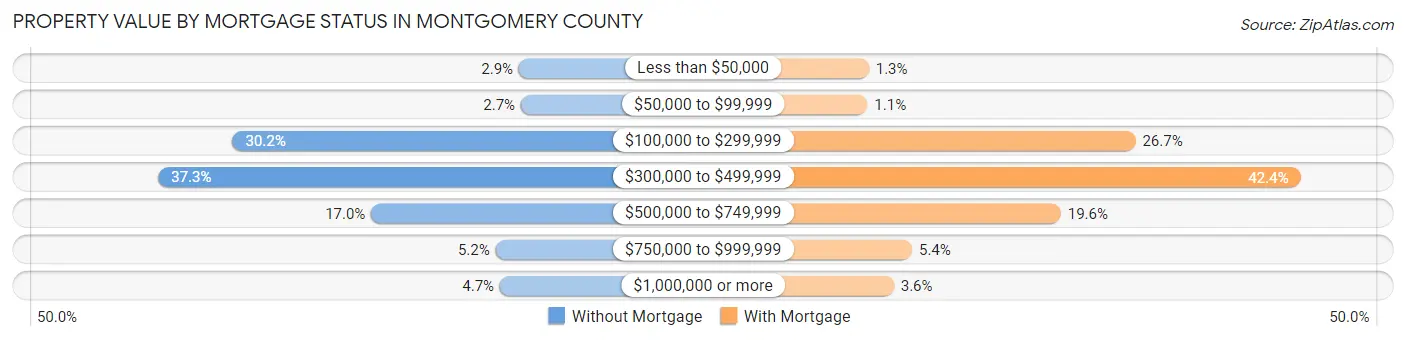
| Property Value | Without Mortgage | With Mortgage |
| Less than $50,000 | 2,267 (2.9%) | 2,006 (1.3%) |
| $50,000 to $99,999 | 2,126 (2.7%) | 1,800 (1.1%) |
| $100,000 to $299,999 | 23,475 (30.2%) | 42,321 (26.7%) |
| $300,000 to $499,999 | 28,983 (37.3%) | 67,274 (42.4%) |
| $500,000 to $749,999 | 13,204 (17.0%) | 31,037 (19.6%) |
| $750,000 to $999,999 | 4,007 (5.1%) | 8,544 (5.4%) |
| $1,000,000 or more | 3,674 (4.7%) | 5,785 (3.6%) |
| Total | 77,736 (100.0%) | 158,767 (100.0%) |
Household Income by Mortgage Status in Montgomery County
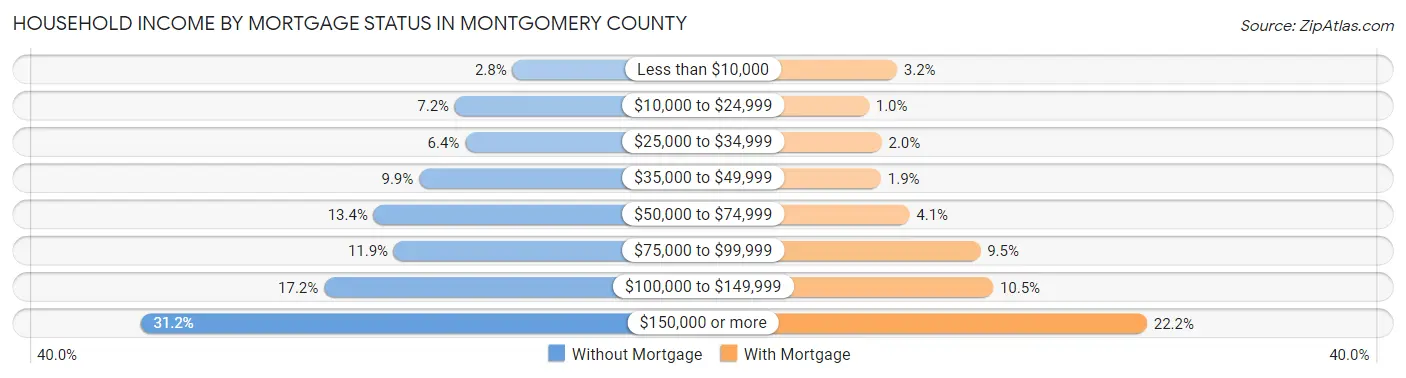
| Household Income | Without Mortgage | With Mortgage |
| Less than $10,000 | 2,190 (2.8%) | 5,001 (3.2%) |
| $10,000 to $24,999 | 5,603 (7.2%) | 1,608 (1.0%) |
| $25,000 to $34,999 | 4,997 (6.4%) | 3,142 (2.0%) |
| $35,000 to $49,999 | 7,727 (9.9%) | 3,066 (1.9%) |
| $50,000 to $74,999 | 10,415 (13.4%) | 6,502 (4.1%) |
| $75,000 to $99,999 | 9,219 (11.9%) | 15,077 (9.5%) |
| $100,000 to $149,999 | 13,357 (17.2%) | 16,626 (10.5%) |
| $150,000 or more | 24,228 (31.2%) | 35,229 (22.2%) |
| Total | 77,736 (100.0%) | 158,767 (100.0%) |
Property Value to Household Income Ratio in Montgomery County
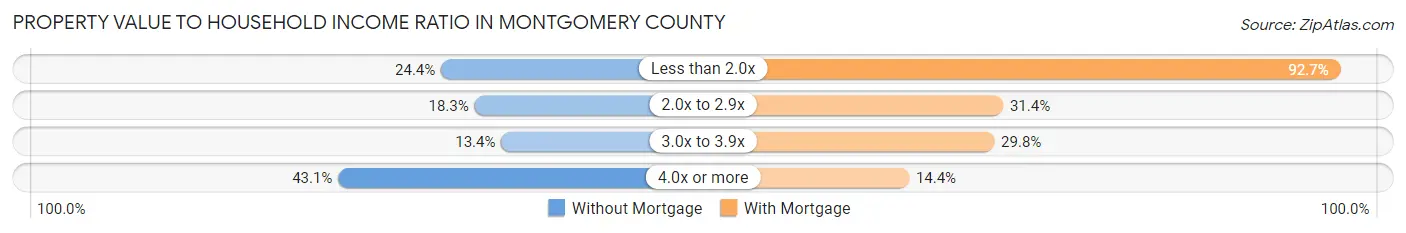
| Value-to-Income Ratio | Without Mortgage | With Mortgage |
| Less than 2.0x | 18,935 (24.4%) | 147,226 (92.7%) |
| 2.0x to 2.9x | 14,207 (18.3%) | 49,895 (31.4%) |
| 3.0x to 3.9x | 10,438 (13.4%) | 47,360 (29.8%) |
| 4.0x or more | 33,463 (43.0%) | 22,791 (14.3%) |
| Total | 77,736 (100.0%) | 158,767 (100.0%) |
Real Estate Taxes by Mortgage Status in Montgomery County
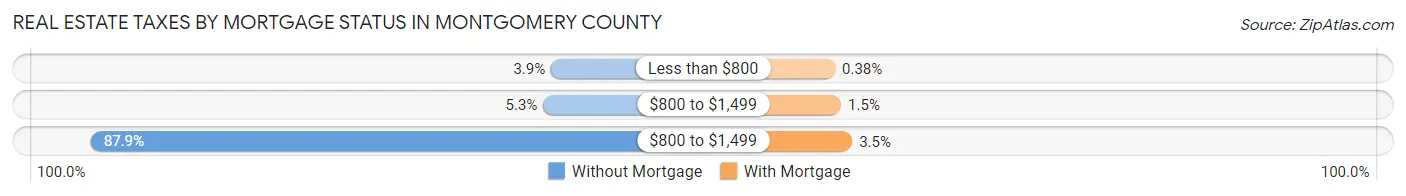
| Property Taxes | Without Mortgage | With Mortgage |
| Less than $800 | 2,993 (3.8%) | 597 (0.4%) |
| $800 to $1,499 | 4,103 (5.3%) | 2,346 (1.5%) |
| $800 to $1,499 | 68,339 (87.9%) | 5,549 (3.5%) |
| Total | 77,736 (100.0%) | 158,767 (100.0%) |
Health & Disability in Montgomery County
Health Insurance Coverage by Age in Montgomery County
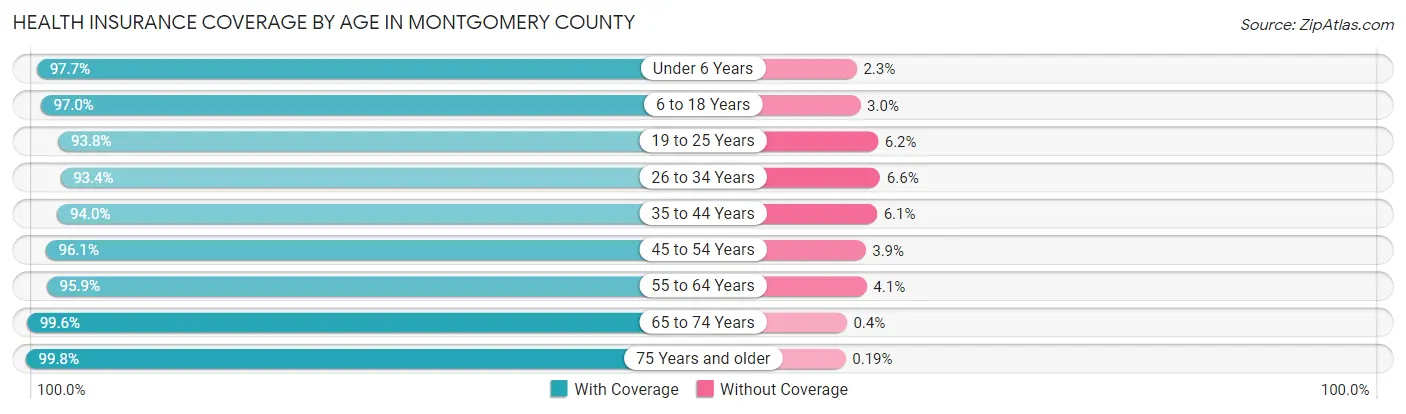
| Age Bracket | With Coverage | Without Coverage |
| Under 6 Years | 53,486 (97.7%) | 1,244 (2.3%) |
| 6 to 18 Years | 135,278 (97.0%) | 4,130 (3.0%) |
| 19 to 25 Years | 63,859 (93.8%) | 4,247 (6.2%) |
| 26 to 34 Years | 87,709 (93.4%) | 6,238 (6.6%) |
| 35 to 44 Years | 103,448 (94.0%) | 6,657 (6.0%) |
| 45 to 54 Years | 105,366 (96.1%) | 4,285 (3.9%) |
| 55 to 64 Years | 113,164 (95.9%) | 4,858 (4.1%) |
| 65 to 74 Years | 85,306 (99.6%) | 341 (0.4%) |
| 75 Years and older | 63,239 (99.8%) | 120 (0.2%) |
| Total | 810,855 (96.2%) | 32,120 (3.8%) |
Health Insurance Coverage by Citizenship Status in Montgomery County
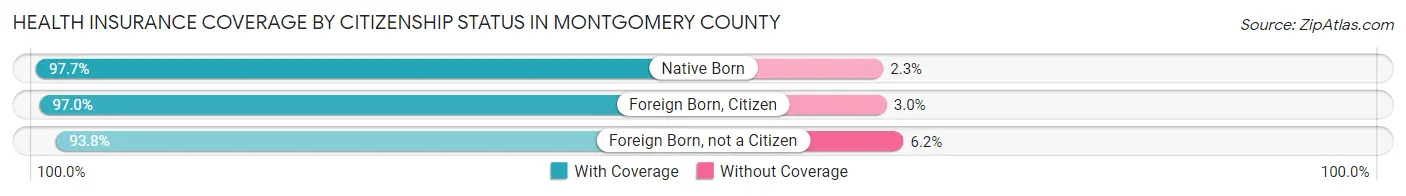
| Citizenship Status | With Coverage | Without Coverage |
| Native Born | 53,486 (97.7%) | 1,244 (2.3%) |
| Foreign Born, Citizen | 135,278 (97.0%) | 4,130 (3.0%) |
| Foreign Born, not a Citizen | 63,859 (93.8%) | 4,247 (6.2%) |
Health Insurance Coverage by Household Income in Montgomery County
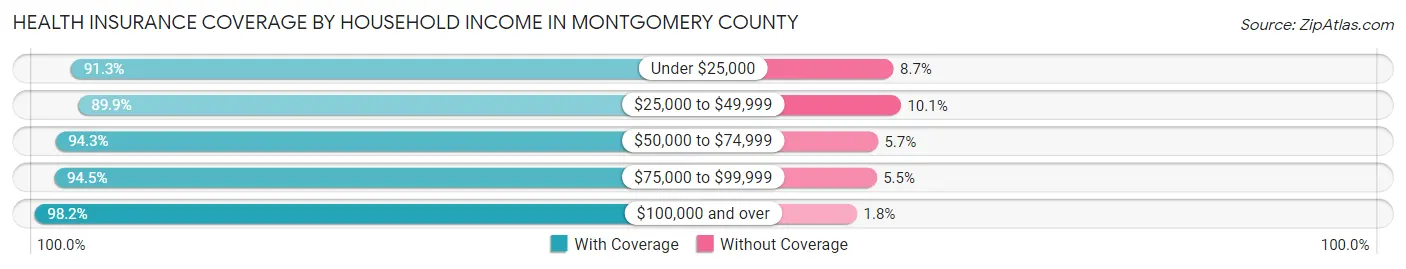
| Household Income | With Coverage | Without Coverage |
| Under $25,000 | 45,357 (91.3%) | 4,312 (8.7%) |
| $25,000 to $49,999 | 66,390 (89.9%) | 7,423 (10.1%) |
| $50,000 to $74,999 | 83,067 (94.3%) | 5,056 (5.7%) |
| $75,000 to $99,999 | 87,818 (94.5%) | 5,117 (5.5%) |
| $100,000 and over | 519,453 (98.2%) | 9,759 (1.8%) |
Public vs Private Health Insurance Coverage by Age in Montgomery County
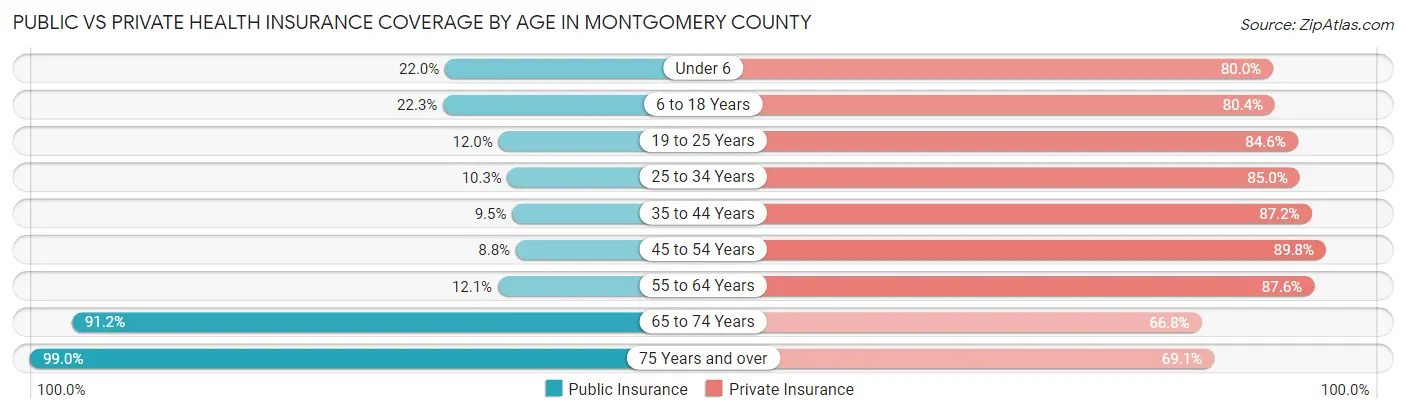
| Age Bracket | Public Insurance | Private Insurance |
| Under 6 | 12,014 (22.0%) | 43,797 (80.0%) |
| 6 to 18 Years | 31,104 (22.3%) | 112,065 (80.4%) |
| 19 to 25 Years | 8,187 (12.0%) | 57,623 (84.6%) |
| 25 to 34 Years | 9,704 (10.3%) | 79,833 (85.0%) |
| 35 to 44 Years | 10,432 (9.5%) | 95,980 (87.2%) |
| 45 to 54 Years | 9,650 (8.8%) | 98,508 (89.8%) |
| 55 to 64 Years | 14,332 (12.1%) | 103,410 (87.6%) |
| 65 to 74 Years | 78,126 (91.2%) | 57,166 (66.7%) |
| 75 Years and over | 62,720 (99.0%) | 43,757 (69.1%) |
| Total | 236,269 (28.0%) | 692,139 (82.1%) |
Disability Status by Sex by Age in Montgomery County
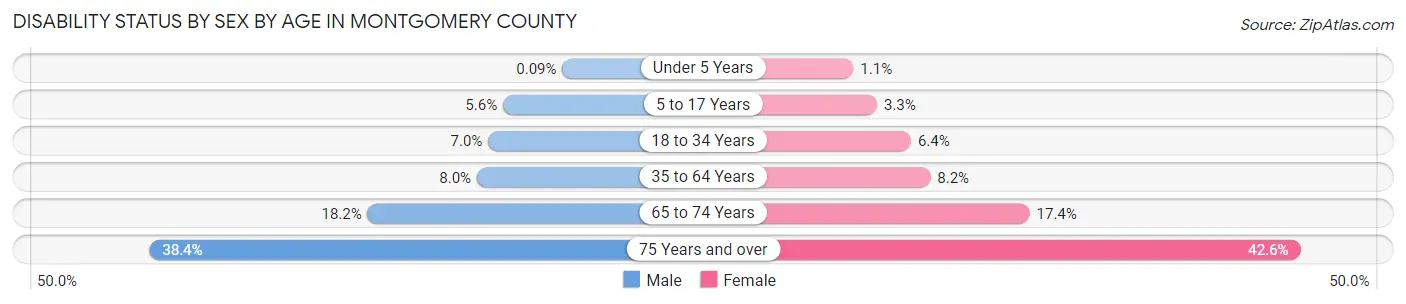
| Age Bracket | Male | Female |
| Under 5 Years | 22 (0.1%) | 237 (1.1%) |
| 5 to 17 Years | 3,930 (5.6%) | 2,193 (3.3%) |
| 18 to 34 Years | 6,061 (7.0%) | 5,586 (6.4%) |
| 35 to 64 Years | 13,332 (8.0%) | 14,087 (8.2%) |
| 65 to 74 Years | 7,244 (18.2%) | 7,979 (17.4%) |
| 75 Years and over | 9,660 (38.4%) | 16,264 (42.6%) |
Disability Class by Sex by Age in Montgomery County
Disability Class: Hearing Difficulty
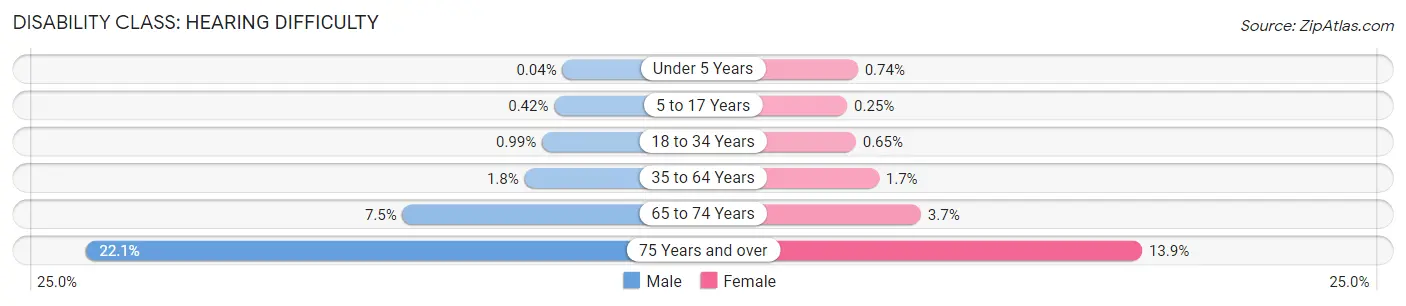
| Age Bracket | Male | Female |
| Under 5 Years | 9 (0.0%) | 162 (0.7%) |
| 5 to 17 Years | 298 (0.4%) | 167 (0.3%) |
| 18 to 34 Years | 860 (1.0%) | 569 (0.6%) |
| 35 to 64 Years | 2,989 (1.8%) | 2,944 (1.7%) |
| 65 to 74 Years | 2,976 (7.5%) | 1,679 (3.7%) |
| 75 Years and over | 5,563 (22.1%) | 5,324 (13.9%) |
Disability Class: Vision Difficulty
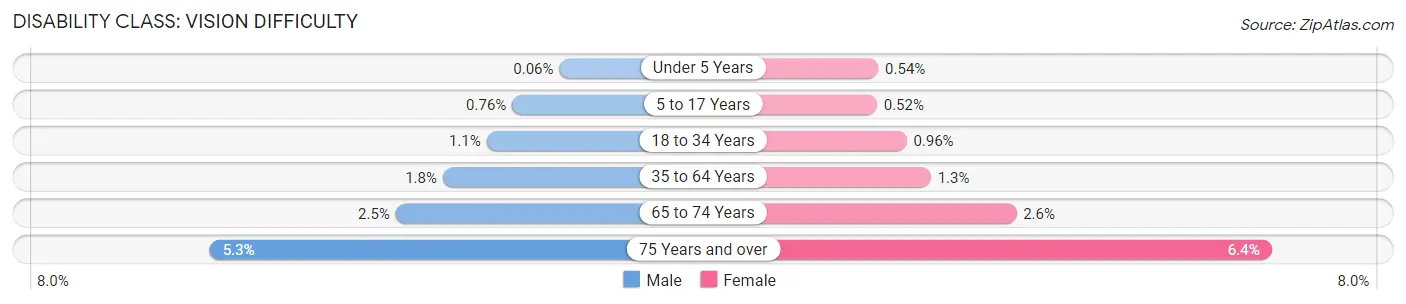
| Age Bracket | Male | Female |
| Under 5 Years | 13 (0.1%) | 118 (0.5%) |
| 5 to 17 Years | 536 (0.8%) | 348 (0.5%) |
| 18 to 34 Years | 991 (1.1%) | 837 (1.0%) |
| 35 to 64 Years | 2,972 (1.8%) | 2,258 (1.3%) |
| 65 to 74 Years | 991 (2.5%) | 1,186 (2.6%) |
| 75 Years and over | 1,320 (5.2%) | 2,440 (6.4%) |
Disability Class: Cognitive Difficulty
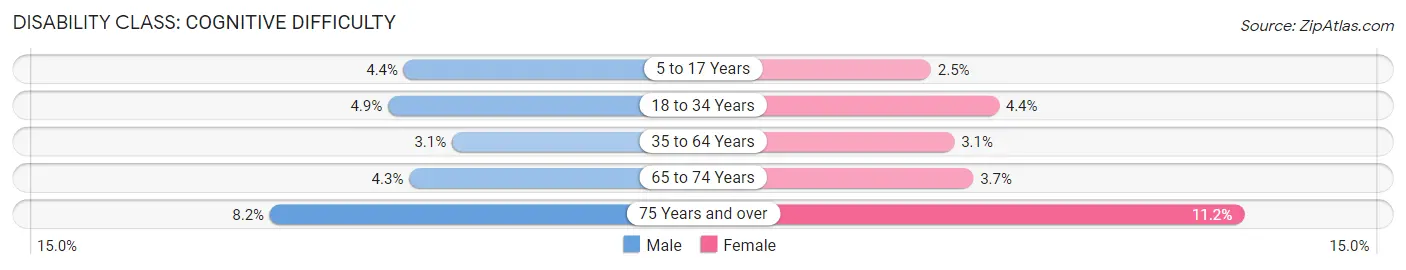
| Age Bracket | Male | Female |
| 5 to 17 Years | 3,112 (4.4%) | 1,663 (2.5%) |
| 18 to 34 Years | 4,237 (4.9%) | 3,804 (4.4%) |
| 35 to 64 Years | 5,154 (3.1%) | 5,364 (3.1%) |
| 65 to 74 Years | 1,712 (4.3%) | 1,673 (3.7%) |
| 75 Years and over | 2,054 (8.2%) | 4,280 (11.2%) |
Disability Class: Ambulatory Difficulty
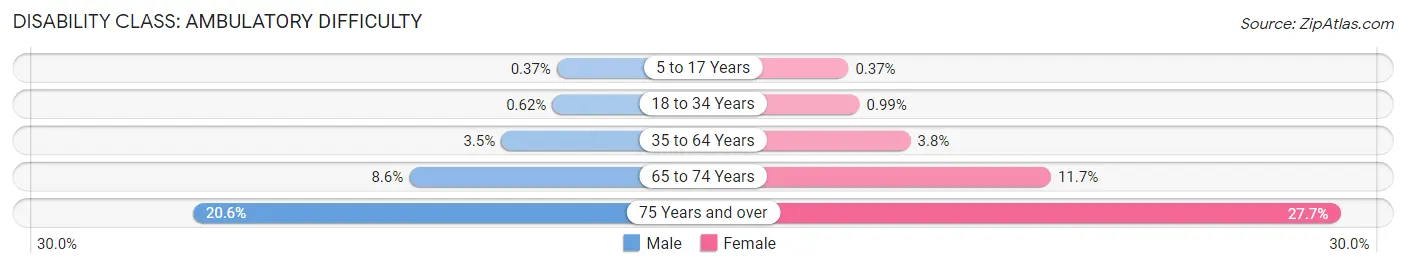
| Age Bracket | Male | Female |
| 5 to 17 Years | 259 (0.4%) | 250 (0.4%) |
| 18 to 34 Years | 538 (0.6%) | 858 (1.0%) |
| 35 to 64 Years | 5,776 (3.5%) | 6,574 (3.8%) |
| 65 to 74 Years | 3,425 (8.6%) | 5,330 (11.7%) |
| 75 Years and over | 5,186 (20.6%) | 10,602 (27.7%) |
Disability Class: Self-Care Difficulty
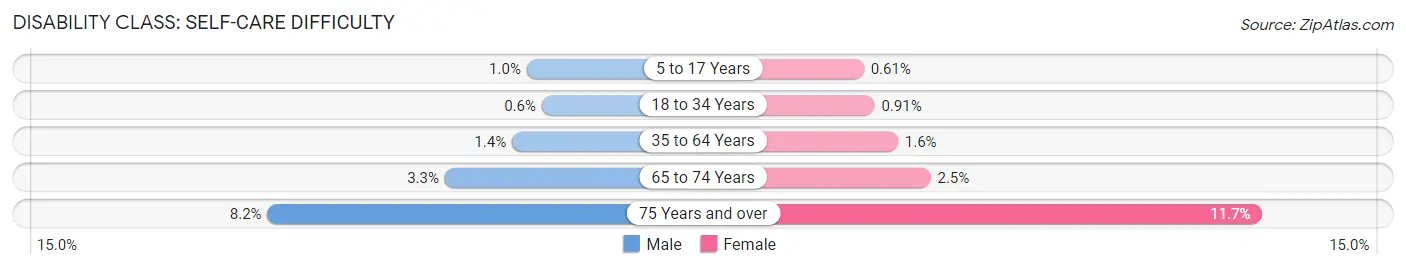
| Age Bracket | Male | Female |
| 5 to 17 Years | 718 (1.0%) | 410 (0.6%) |
| 18 to 34 Years | 517 (0.6%) | 792 (0.9%) |
| 35 to 64 Years | 2,380 (1.4%) | 2,678 (1.6%) |
| 65 to 74 Years | 1,316 (3.3%) | 1,132 (2.5%) |
| 75 Years and over | 2,073 (8.2%) | 4,474 (11.7%) |
Technology Access in Montgomery County
Computing Device Access in Montgomery County
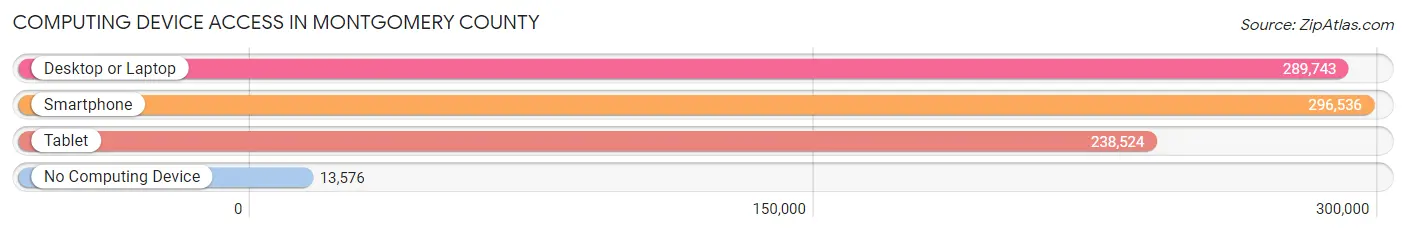
| Device Type | # Households | % Households |
| Desktop or Laptop | 289,743 | 87.9% |
| Smartphone | 296,536 | 89.9% |
| Tablet | 238,524 | 72.4% |
| No Computing Device | 13,576 | 4.1% |
| Total | 329,680 | 100.0% |
Internet Access in Montgomery County
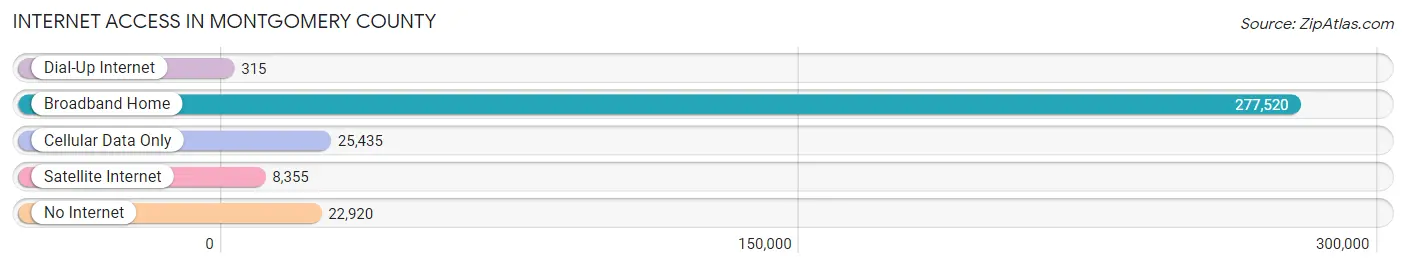
| Internet Type | # Households | % Households |
| Dial-Up Internet | 315 | 0.1% |
| Broadband Home | 277,520 | 84.2% |
| Cellular Data Only | 25,435 | 7.7% |
| Satellite Internet | 8,355 | 2.5% |
| No Internet | 22,920 | 7.0% |
| Total | 329,680 | 100.0% |
Montgomery County Summary
Montgomery County, Pennsylvania is located in the southeastern corner of the state and is part of the Philadelphia metropolitan area. It is the third most populous county in Pennsylvania and the most populous county in the state outside of Philadelphia. Montgomery County is home to a diverse population of over 800,000 people and is known for its rich history, vibrant economy, and diverse geography.
History
Montgomery County was established in 1784 and was named after General Richard Montgomery, a Revolutionary War hero. The county was originally part of Philadelphia County and was created to provide a more convenient location for the county seat. The county seat was moved to Norristown in 1784 and has remained there ever since.
The county has a long and rich history, with many of its towns and villages having been founded in the late 1700s and early 1800s. The county was home to many prominent figures in American history, including George Washington, who visited the county in 1793. The county was also home to the first railroad in the United States, the Philadelphia and Reading Railroad, which was built in 1832.
The county has also been home to many prominent industries, including steel production, textiles, and paper manufacturing. The county was also home to the first commercial radio station in the United States, WIP, which began broadcasting in 1922.
Geography
Montgomery County is located in the southeastern corner of Pennsylvania and is part of the Philadelphia metropolitan area. The county is bordered by Bucks County to the north, Philadelphia County to the east, Delaware County to the south, and Chester County to the west. The county is divided into four regions: the Upper Merion Township, Lower Merion Township, Upper Providence Township, and Lower Providence Township.
The county is home to a variety of landscapes, including rolling hills, wooded areas, and open fields. The county is also home to several rivers, including the Schuylkill River, the Perkiomen Creek, and the Wissahickon Creek. The county is also home to several parks, including Valley Forge National Historical Park, Norristown Farm Park, and Evansburg State Park.
Economy
Montgomery County is home to a vibrant and diverse economy. The county is home to several major employers, including Merck & Co., GlaxoSmithKline, and Lockheed Martin. The county is also home to several universities, including Temple University, Drexel University, and the University of Pennsylvania.
The county is also home to several major shopping centers, including King of Prussia Mall, Plymouth Meeting Mall, and Montgomery Mall. The county is also home to several major sports teams, including the Philadelphia Eagles, the Philadelphia Phillies, and the Philadelphia 76ers.
Demographics
As of the 2010 census, Montgomery County had a population of 799,874 people. The population was spread out with 24.3% under the age of 18, 10.2% from 18 to 24, 32.2% from 25 to 44, 22.3% from 45 to 64, and 10.9% who were 65 years of age or older. The median age was 36.3 years.
The racial makeup of the county was 79.2% White, 11.2% African American, 0.2% Native American, 4.2% Asian, 0.1% Pacific Islander, 2.3% from other races, and 2.9% from two or more races. Hispanic or Latino of any race were 5.3% of the population.
The median income for a household in the county was $76,824 and the median income for a family was $90,717. The per capita income for the county was $37,817. About 5.2% of families and 7.7% of the population were below the poverty line, including 10.2% of those under age 18 and 6.2% of those age 65 or over.
Common Questions
What is Per Capita Income in Montgomery County?
Per Capita income in Montgomery County is $57,945.
What is the Median Family Income in Montgomery County?
Median Family Income in Montgomery County is $134,397.
What is the Median Household income in Montgomery County?
Median Household Income in Montgomery County is $107,441.
What is Income or Wage Gap in Montgomery County?
Income or Wage Gap in Montgomery County is 29.6%.
Women in Montgomery County earn 70.4 cents for every dollar earned by a man.
What is Family Income Deficit in Montgomery County?
Family Income Deficit in Montgomery County is $11,296.
Families that are below poverty line in Montgomery County earn $11,296 less on average than the poverty threshold level.
What is Inequality or Gini Index in Montgomery County?
Inequality or Gini Index in Montgomery County is 0.47.
What is the Total Population of Montgomery County?
Total Population of Montgomery County is 856,399.
What is the Total Male Population of Montgomery County?
Total Male Population of Montgomery County is 419,933.
What is the Total Female Population of Montgomery County?
Total Female Population of Montgomery County is 436,466.
What is the Ratio of Males per 100 Females in Montgomery County?
There are 96.21 Males per 100 Females in Montgomery County.
What is the Ratio of Females per 100 Males in Montgomery County?
There are 103.94 Females per 100 Males in Montgomery County.
What is the Median Population Age in Montgomery County?
Median Population Age in Montgomery County is 41.2 Years.
What is the Average Family Size in Montgomery County
Average Family Size in Montgomery County is 3.1 People.
What is the Average Household Size in Montgomery County
Average Household Size in Montgomery County is 2.5 People.
How Large is the Labor Force in Montgomery County?
There are 473,989 People in the Labor Forcein in Montgomery County.
What is the Percentage of People in the Labor Force in Montgomery County?
68.2% of People are in the Labor Force in Montgomery County.
What is the Unemployment Rate in Montgomery County?
Unemployment Rate in Montgomery County is 4.5%.