Delaware County, PA Map & Demographics
Delaware County Map
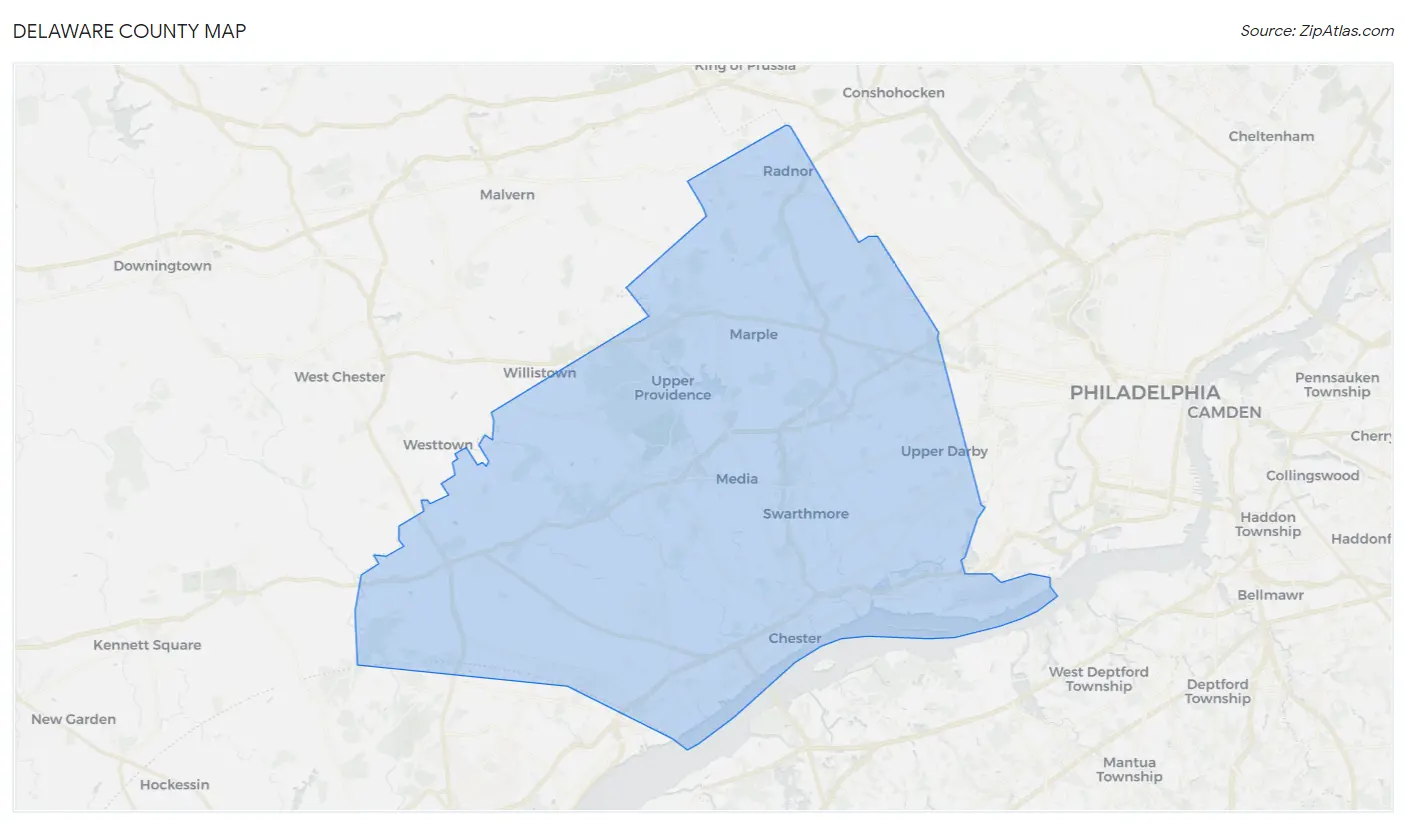
Delaware County Overview
$46,926
PER CAPITA INCOME
$112,011
AVG FAMILY INCOME
$86,390
AVG HOUSEHOLD INCOME
25.5%
WAGE / INCOME GAP [ % ]
74.5¢/ $1
WAGE / INCOME GAP [ $ ]
$11,031
FAMILY INCOME DEFICIT
0.48
INEQUALITY / GINI INDEX
575,312
TOTAL POPULATION
279,037
MALE POPULATION
296,275
FEMALE POPULATION
94.18
MALES / 100 FEMALES
106.18
FEMALES / 100 MALES
39.0
MEDIAN AGE
3.2
AVG FAMILY SIZE
2.6
AVG HOUSEHOLD SIZE
306,712
LABOR FORCE [ PEOPLE ]
66.3%
PERCENT IN LABOR FORCE
6.8%
UNEMPLOYMENT RATE
Income in Delaware County
Income Overview in Delaware County
Per Capita Income in Delaware County is $46,926, while median incomes of families and households are $112,011 and $86,390 respectively.
| Characteristic | Number | Measure |
| Per Capita Income | 575,312 | $46,926 |
| Median Family Income | 142,548 | $112,011 |
| Mean Family Income | 142,548 | $147,889 |
| Median Household Income | 215,833 | $86,390 |
| Mean Household Income | 215,833 | $121,862 |
| Income Deficit | 142,548 | $11,031 |
| Wage / Income Gap (%) | 575,312 | 25.51% |
| Wage / Income Gap ($) | 575,312 | 74.49¢ per $1 |
| Gini / Inequality Index | 575,312 | 0.48 |
Earnings by Sex in Delaware County
Average Earnings in Delaware County are $46,830, $54,179 for men and $40,359 for women, a difference of 25.5%.
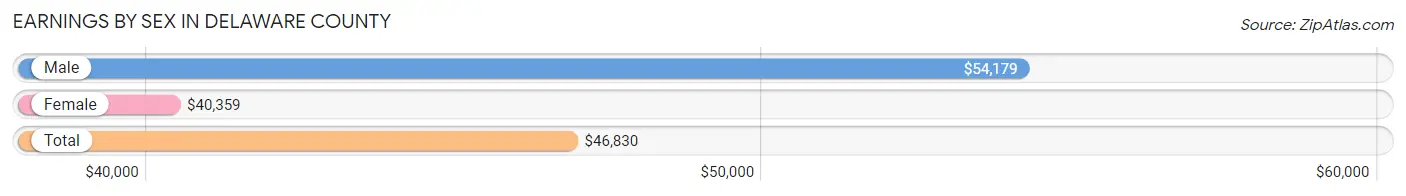
| Sex | Number | Average Earnings |
| Male | 161,421 (50.9%) | $54,179 |
| Female | 155,474 (49.1%) | $40,359 |
| Total | 316,895 (100.0%) | $46,830 |
Earnings by Sex by Income Bracket in Delaware County
The most common earnings brackets in Delaware County are $100,000+ for men (40,664 | 25.2%) and $100,000+ for women (21,553 | 13.9%).
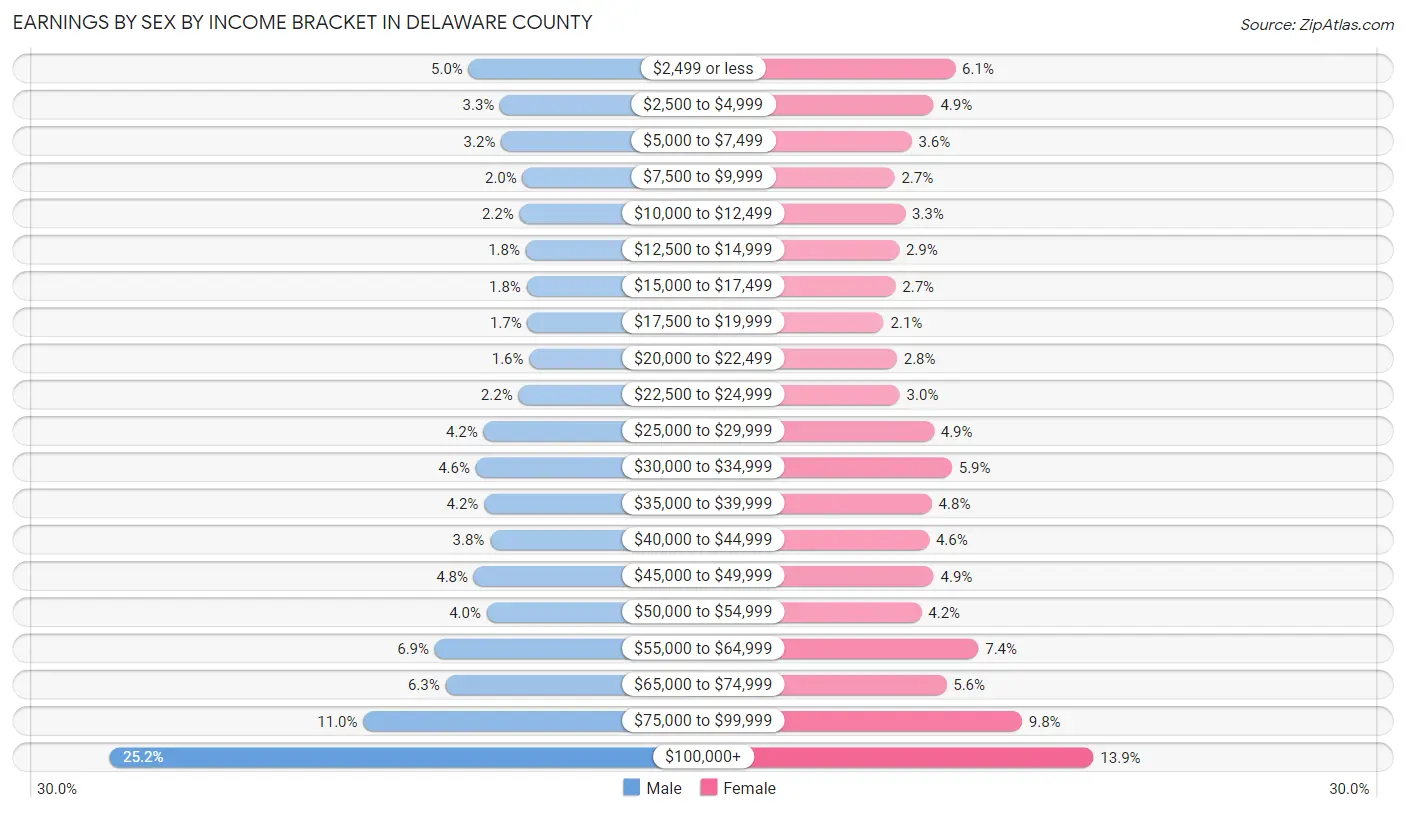
| Income | Male | Female |
| $2,499 or less | 8,134 (5.0%) | 9,464 (6.1%) |
| $2,500 to $4,999 | 5,283 (3.3%) | 7,578 (4.9%) |
| $5,000 to $7,499 | 5,187 (3.2%) | 5,661 (3.6%) |
| $7,500 to $9,999 | 3,248 (2.0%) | 4,160 (2.7%) |
| $10,000 to $12,499 | 3,527 (2.2%) | 5,079 (3.3%) |
| $12,500 to $14,999 | 2,948 (1.8%) | 4,558 (2.9%) |
| $15,000 to $17,499 | 2,870 (1.8%) | 4,239 (2.7%) |
| $17,500 to $19,999 | 2,798 (1.7%) | 3,225 (2.1%) |
| $20,000 to $22,499 | 2,639 (1.6%) | 4,376 (2.8%) |
| $22,500 to $24,999 | 3,622 (2.2%) | 4,624 (3.0%) |
| $25,000 to $29,999 | 6,782 (4.2%) | 7,601 (4.9%) |
| $30,000 to $34,999 | 7,496 (4.6%) | 9,170 (5.9%) |
| $35,000 to $39,999 | 6,733 (4.2%) | 7,411 (4.8%) |
| $40,000 to $44,999 | 6,188 (3.8%) | 7,188 (4.6%) |
| $45,000 to $49,999 | 7,670 (4.8%) | 7,593 (4.9%) |
| $50,000 to $54,999 | 6,494 (4.0%) | 6,516 (4.2%) |
| $55,000 to $64,999 | 11,208 (6.9%) | 11,491 (7.4%) |
| $65,000 to $74,999 | 10,232 (6.3%) | 8,691 (5.6%) |
| $75,000 to $99,999 | 17,698 (11.0%) | 15,296 (9.8%) |
| $100,000+ | 40,664 (25.2%) | 21,553 (13.9%) |
| Total | 161,421 (100.0%) | 155,474 (100.0%) |
Earnings by Sex by Educational Attainment in Delaware County
Average earnings in Delaware County are $64,225 for men and $47,430 for women, a difference of 26.2%. Men with an educational attainment of graduate degree enjoy the highest average annual earnings of $118,267, while those with less than high school education earn the least with $35,314. Women with an educational attainment of graduate degree earn the most with the average annual earnings of $81,757, while those with less than high school education have the smallest earnings of $27,072.
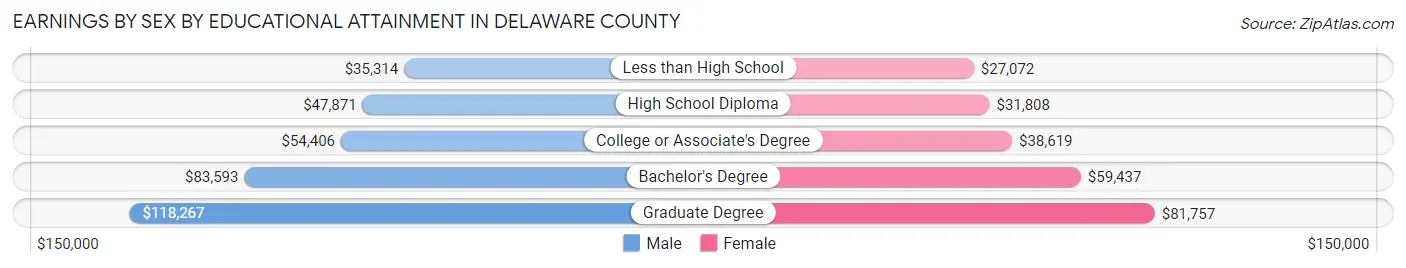
| Educational Attainment | Male Income | Female Income |
| Less than High School | $35,314 | $27,072 |
| High School Diploma | $47,871 | $31,808 |
| College or Associate's Degree | $54,406 | $38,619 |
| Bachelor's Degree | $83,593 | $59,437 |
| Graduate Degree | $118,267 | $81,757 |
| Total | $64,225 | $47,430 |
Family Income in Delaware County
Family Income Brackets in Delaware County
According to the Delaware County family income data, there are 30,505 families falling into the $200,000+ income range, which is the most common income bracket and makes up 21.4% of all families. Conversely, the $10,000 to $14,999 income bracket is the least frequent group with only 2,423 families (1.7%) belonging to this category.
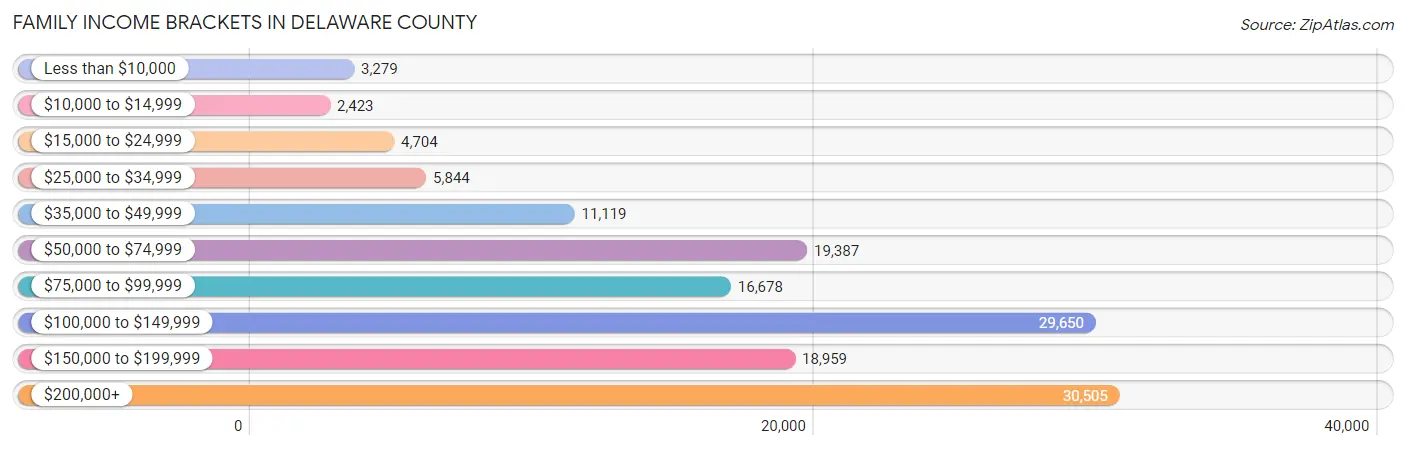
| Income Bracket | # Families | % Families |
| Less than $10,000 | 3,279 | 2.3% |
| $10,000 to $14,999 | 2,423 | 1.7% |
| $15,000 to $24,999 | 4,704 | 3.3% |
| $25,000 to $34,999 | 5,844 | 4.1% |
| $35,000 to $49,999 | 11,119 | 7.8% |
| $50,000 to $74,999 | 19,387 | 13.6% |
| $75,000 to $99,999 | 16,678 | 11.7% |
| $100,000 to $149,999 | 29,650 | 20.8% |
| $150,000 to $199,999 | 18,959 | 13.3% |
| $200,000+ | 30,505 | 21.4% |
Family Income by Famaliy Size in Delaware County
4-person families (28,385 | 19.9%) account for the highest median family income in Delaware County with $146,586 per family, while 2-person families (60,887 | 42.7%) have the highest median income of $46,924 per family member.
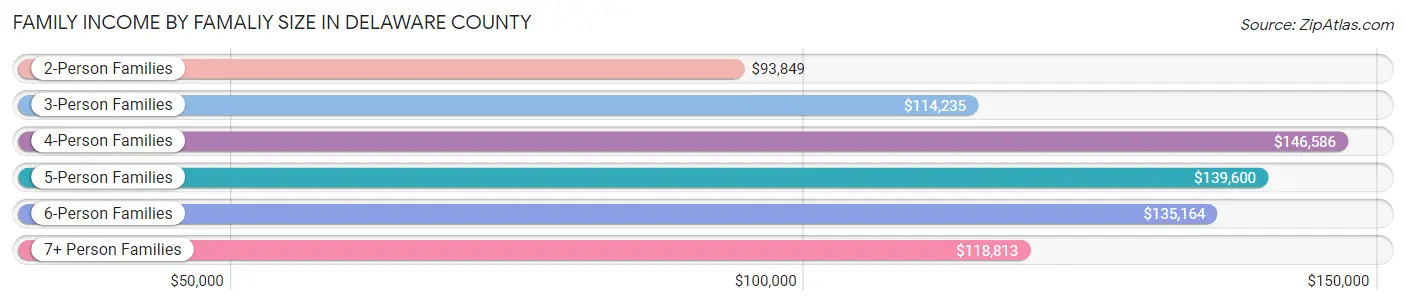
| Income Bracket | # Families | Median Income |
| 2-Person Families | 60,887 (42.7%) | $93,849 |
| 3-Person Families | 34,087 (23.9%) | $114,235 |
| 4-Person Families | 28,385 (19.9%) | $146,586 |
| 5-Person Families | 12,679 (8.9%) | $139,600 |
| 6-Person Families | 4,654 (3.3%) | $135,164 |
| 7+ Person Families | 1,856 (1.3%) | $118,813 |
| Total | 142,548 (100.0%) | $112,011 |
Family Income by Number of Earners in Delaware County
The median family income in Delaware County is $112,011, with families comprising 3+ earners (21,168) having the highest median family income of $174,119, while families with no earners (17,066) have the lowest median family income of $56,422, accounting for 14.8% and 12.0% of families, respectively.
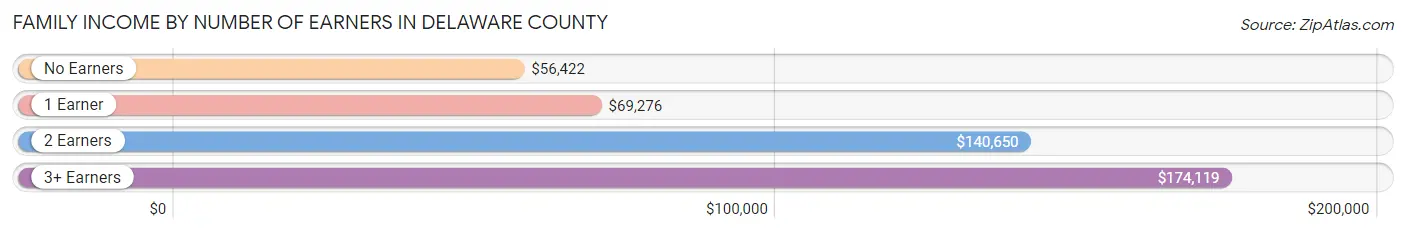
| Number of Earners | # Families | Median Income |
| No Earners | 17,066 (12.0%) | $56,422 |
| 1 Earner | 44,221 (31.0%) | $69,276 |
| 2 Earners | 60,093 (42.2%) | $140,650 |
| 3+ Earners | 21,168 (14.8%) | $174,119 |
| Total | 142,548 (100.0%) | $112,011 |
Household Income in Delaware County
Household Income Brackets in Delaware County
With 38,202 households falling in the category, the $100,000 to $149,999 income range is the most frequent in Delaware County, accounting for 17.7% of all households. In contrast, only 6,259 households (2.9%) fall into the $10,000 to $14,999 income bracket, making it the least populous group.
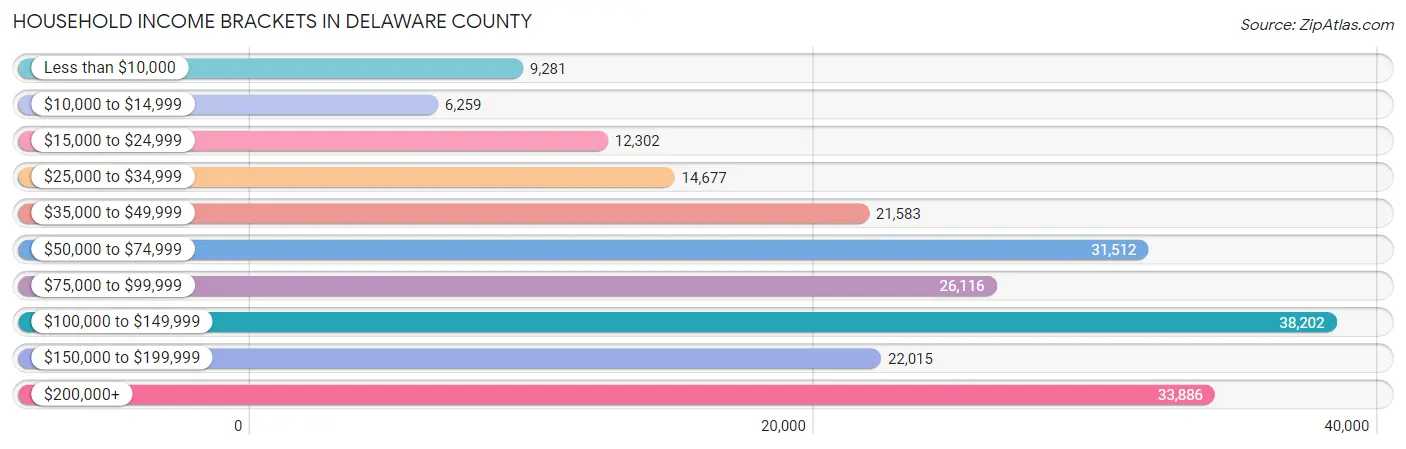
| Income Bracket | # Households | % Households |
| Less than $10,000 | 9,281 | 4.3% |
| $10,000 to $14,999 | 6,259 | 2.9% |
| $15,000 to $24,999 | 12,302 | 5.7% |
| $25,000 to $34,999 | 14,677 | 6.8% |
| $35,000 to $49,999 | 21,583 | 10.0% |
| $50,000 to $74,999 | 31,512 | 14.6% |
| $75,000 to $99,999 | 26,116 | 12.1% |
| $100,000 to $149,999 | 38,202 | 17.7% |
| $150,000 to $199,999 | 22,015 | 10.2% |
| $200,000+ | 33,886 | 15.7% |
Household Income by Householder Age in Delaware County
The median household income in Delaware County is $86,390, with the highest median household income of $103,948 found in the 45 to 64 years age bracket for the primary householder. A total of 84,768 households (39.3%) fall into this category. Meanwhile, the 15 to 24 years age bracket for the primary householder has the lowest median household income of $43,775, with 3,985 households (1.8%) in this group.
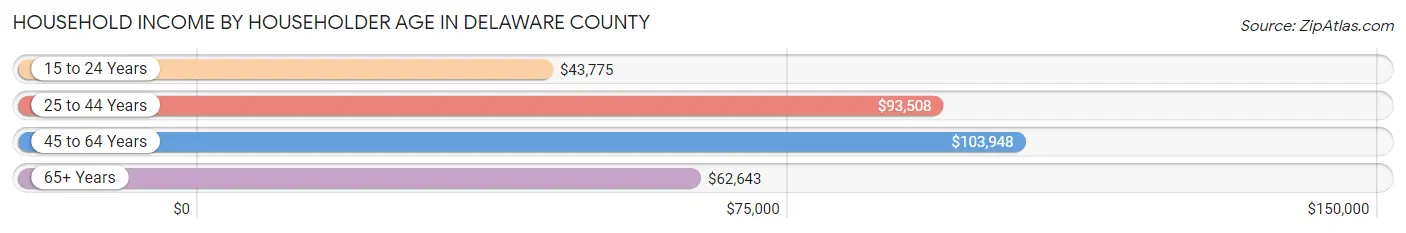
| Income Bracket | # Households | Median Income |
| 15 to 24 Years | 3,985 (1.8%) | $43,775 |
| 25 to 44 Years | 66,771 (30.9%) | $93,508 |
| 45 to 64 Years | 84,768 (39.3%) | $103,948 |
| 65+ Years | 60,309 (27.9%) | $62,643 |
| Total | 215,833 (100.0%) | $86,390 |
Poverty in Delaware County
Income Below Poverty by Sex and Age in Delaware County
With 8.3% poverty level for males and 10.9% for females among the residents of Delaware County, under 5 year old males and 6 to 11 year old females are the most vulnerable to poverty, with 2,456 males (14.7%) and 3,288 females (15.8%) in their respective age groups living below the poverty level.
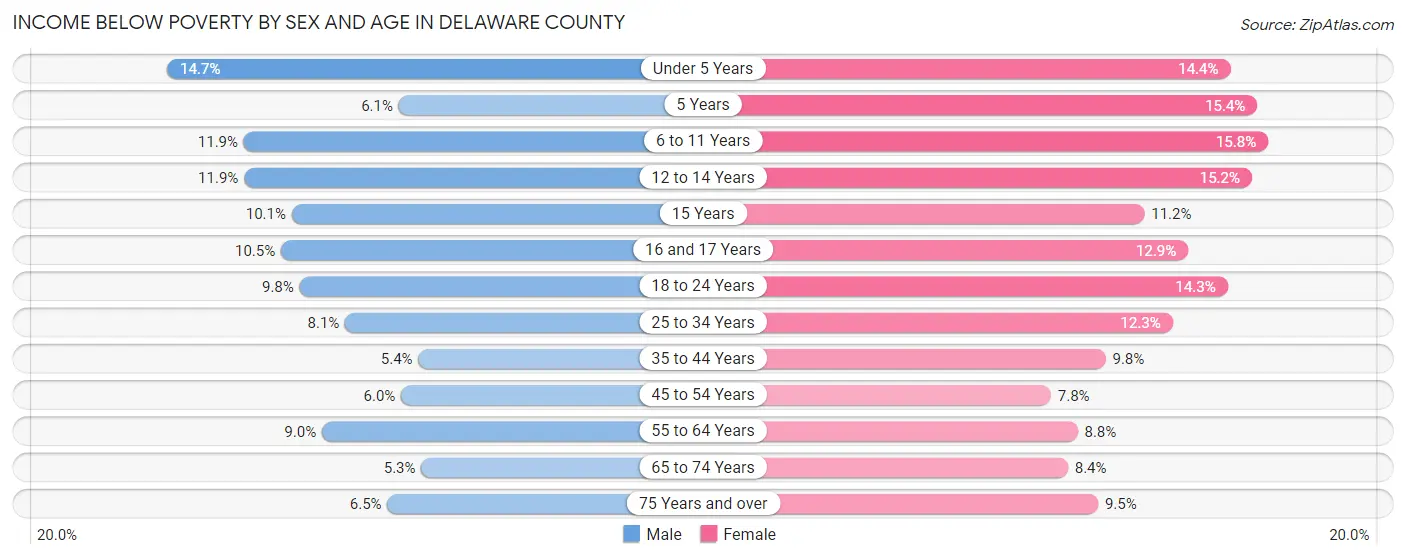
| Age Bracket | Male | Female |
| Under 5 Years | 2,456 (14.7%) | 2,274 (14.4%) |
| 5 Years | 218 (6.1%) | 440 (15.4%) |
| 6 to 11 Years | 2,473 (11.9%) | 3,288 (15.8%) |
| 12 to 14 Years | 1,341 (11.8%) | 1,643 (15.2%) |
| 15 Years | 477 (10.1%) | 449 (11.2%) |
| 16 and 17 Years | 688 (10.5%) | 846 (12.9%) |
| 18 to 24 Years | 2,211 (9.8%) | 3,071 (14.3%) |
| 25 to 34 Years | 2,886 (8.1%) | 4,591 (12.3%) |
| 35 to 44 Years | 1,885 (5.4%) | 3,617 (9.8%) |
| 45 to 54 Years | 2,040 (6.0%) | 2,752 (7.8%) |
| 55 to 64 Years | 3,357 (9.0%) | 3,571 (8.7%) |
| 65 to 74 Years | 1,351 (5.3%) | 2,503 (8.4%) |
| 75 Years and over | 960 (6.5%) | 2,169 (9.5%) |
| Total | 22,343 (8.3%) | 31,214 (10.9%) |
Income Above Poverty by Sex and Age in Delaware County
According to the poverty statistics in Delaware County, males aged 65 to 74 years and females aged 45 to 54 years are the age groups that are most secure financially, with 94.7% of males and 92.2% of females in these age groups living above the poverty line.
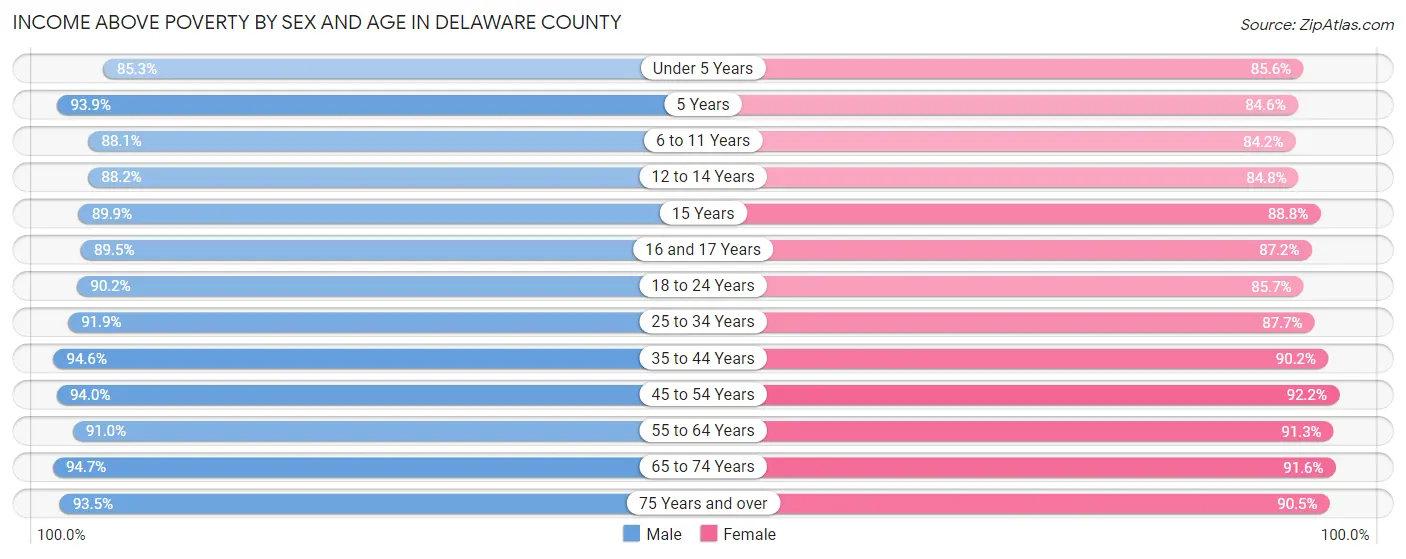
| Age Bracket | Male | Female |
| Under 5 Years | 14,237 (85.3%) | 13,492 (85.6%) |
| 5 Years | 3,351 (93.9%) | 2,413 (84.6%) |
| 6 to 11 Years | 18,382 (88.1%) | 17,500 (84.2%) |
| 12 to 14 Years | 9,976 (88.1%) | 9,152 (84.8%) |
| 15 Years | 4,256 (89.9%) | 3,549 (88.8%) |
| 16 and 17 Years | 5,875 (89.5%) | 5,739 (87.2%) |
| 18 to 24 Years | 20,373 (90.2%) | 18,368 (85.7%) |
| 25 to 34 Years | 32,764 (91.9%) | 32,809 (87.7%) |
| 35 to 44 Years | 33,135 (94.6%) | 33,327 (90.2%) |
| 45 to 54 Years | 31,845 (94.0%) | 32,733 (92.2%) |
| 55 to 64 Years | 34,121 (91.0%) | 37,220 (91.2%) |
| 65 to 74 Years | 24,297 (94.7%) | 27,319 (91.6%) |
| 75 Years and over | 13,745 (93.5%) | 20,635 (90.5%) |
| Total | 246,357 (91.7%) | 254,256 (89.1%) |
Income Below Poverty Among Married-Couple Families in Delaware County
The poverty statistics for married-couple families in Delaware County show that 2.8% or 2,827 of the total 101,042 families live below the poverty line. Families with 5 or more children have the highest poverty rate of 27.2%, comprising of 128 families. On the other hand, families with no children have the lowest poverty rate of 2.5%, which includes 1,412 families.
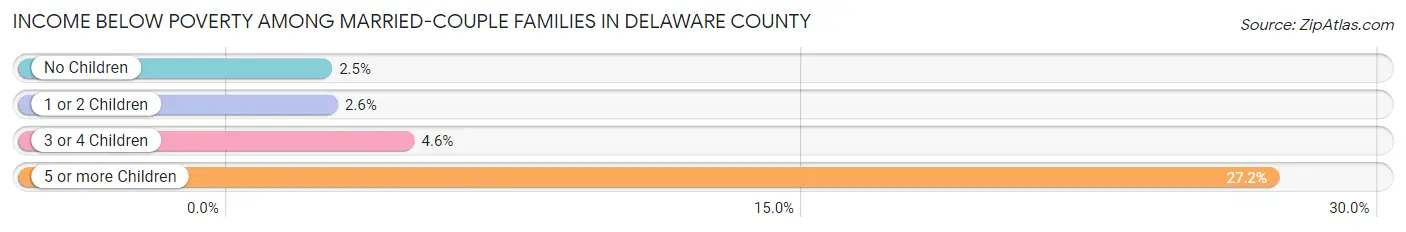
| Children | Above Poverty | Below Poverty |
| No Children | 55,947 (97.5%) | 1,412 (2.5%) |
| 1 or 2 Children | 34,334 (97.4%) | 920 (2.6%) |
| 3 or 4 Children | 7,591 (95.4%) | 367 (4.6%) |
| 5 or more Children | 343 (72.8%) | 128 (27.2%) |
| Total | 98,215 (97.2%) | 2,827 (2.8%) |
Income Below Poverty Among Single-Parent Households in Delaware County
According to the poverty data in Delaware County, 10.6% or 1,106 single-father households and 19.8% or 6,154 single-mother households are living below the poverty line. Among single-father households, those with 5 or more children have the highest poverty rate, with 20 households (100.0%) experiencing poverty. Likewise, among single-mother households, those with 5 or more children have the highest poverty rate, with 288 households (84.2%) falling below the poverty line.
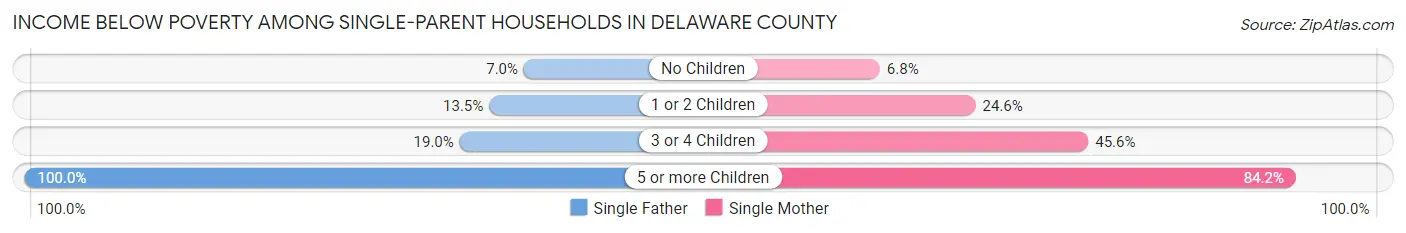
| Children | Single Father | Single Mother |
| No Children | 373 (7.0%) | 886 (6.8%) |
| 1 or 2 Children | 595 (13.5%) | 3,593 (24.6%) |
| 3 or 4 Children | 118 (19.0%) | 1,387 (45.6%) |
| 5 or more Children | 20 (100.0%) | 288 (84.2%) |
| Total | 1,106 (10.6%) | 6,154 (19.8%) |
Income Below Poverty Among Married-Couple vs Single-Parent Households in Delaware County
The poverty data for Delaware County shows that 2,827 of the married-couple family households (2.8%) and 7,260 of the single-parent households (17.5%) are living below the poverty level. Within the married-couple family households, those with 5 or more children have the highest poverty rate, with 128 households (27.2%) falling below the poverty line. Among the single-parent households, those with 5 or more children have the highest poverty rate, with 308 household (85.1%) living below poverty.
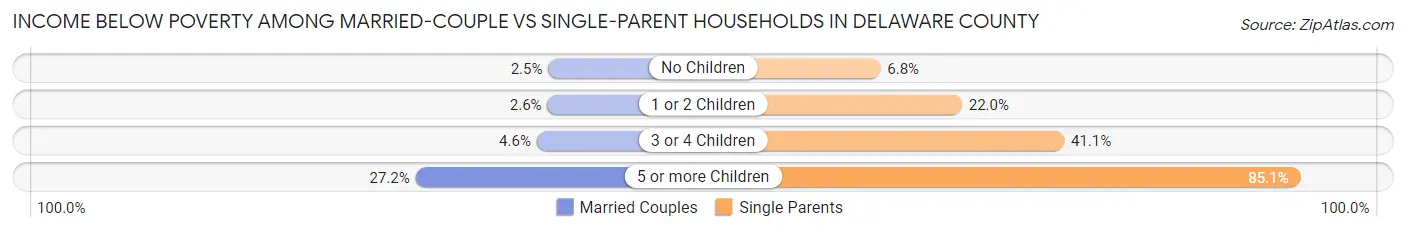
| Children | Married-Couple Families | Single-Parent Households |
| No Children | 1,412 (2.5%) | 1,259 (6.8%) |
| 1 or 2 Children | 920 (2.6%) | 4,188 (22.0%) |
| 3 or 4 Children | 367 (4.6%) | 1,505 (41.0%) |
| 5 or more Children | 128 (27.2%) | 308 (85.1%) |
| Total | 2,827 (2.8%) | 7,260 (17.5%) |
Race in Delaware County
The most populous races in Delaware County are White / Caucasian (378,134 | 65.7%), Black / African American (126,608 | 22.0%), and Asian (34,810 | 6.0%).
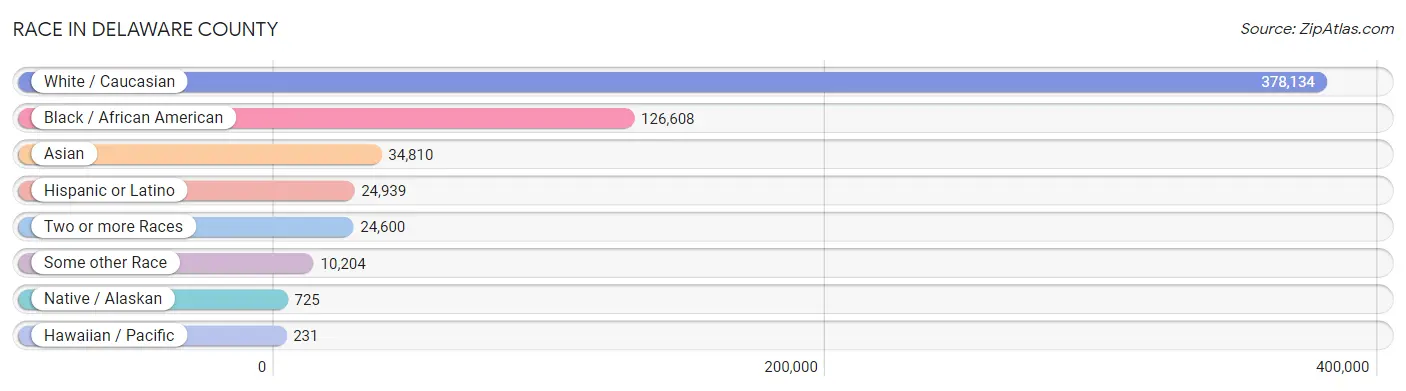
| Race | # Population | % Population |
| Asian | 34,810 | 6.0% |
| Black / African American | 126,608 | 22.0% |
| Hawaiian / Pacific | 231 | 0.0% |
| Hispanic or Latino | 24,939 | 4.3% |
| Native / Alaskan | 725 | 0.1% |
| White / Caucasian | 378,134 | 65.7% |
| Two or more Races | 24,600 | 4.3% |
| Some other Race | 10,204 | 1.8% |
| Total | 575,312 | 100.0% |
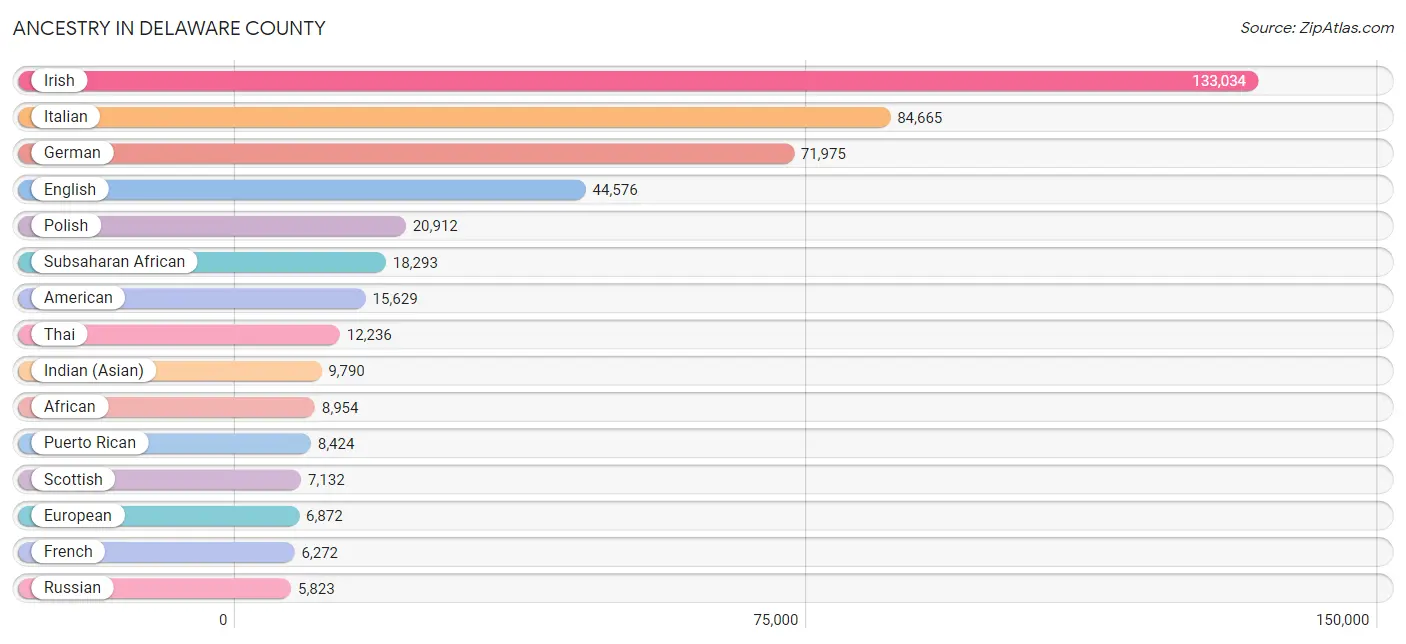
Ancestry in Delaware County
The most populous ancestries reported in Delaware County are Irish (133,034 | 23.1%), Italian (84,665 | 14.7%), German (71,975 | 12.5%), English (44,576 | 7.7%), and Polish (20,912 | 3.6%), together accounting for 61.7% of all Delaware County residents.
| Ancestry | # Population | % Population |
| Afghan | 36 | 0.0% |
| African | 8,954 | 1.6% |
| Alaska Native | 39 | 0.0% |
| Albanian | 859 | 0.2% |
| Alsatian | 26 | 0.0% |
| American | 15,629 | 2.7% |
| Apache | 54 | 0.0% |
| Arab | 3,922 | 0.7% |
| Argentinean | 517 | 0.1% |
| Armenian | 1,934 | 0.3% |
| Australian | 98 | 0.0% |
| Austrian | 1,569 | 0.3% |
| Bahamian | 18 | 0.0% |
| Bangladeshi | 10 | 0.0% |
| Barbadian | 300 | 0.1% |
| Belgian | 328 | 0.1% |
| Belizean | 31 | 0.0% |
| Bhutanese | 935 | 0.2% |
| Blackfeet | 192 | 0.0% |
| Brazilian | 280 | 0.1% |
| British | 2,735 | 0.5% |
| British West Indian | 255 | 0.0% |
| Bulgarian | 212 | 0.0% |
| Burmese | 3,153 | 0.5% |
| Cajun | 38 | 0.0% |
| Cambodian | 16 | 0.0% |
| Canadian | 730 | 0.1% |
| Carpatho Rusyn | 163 | 0.0% |
| Celtic | 29 | 0.0% |
| Central American | 2,650 | 0.5% |
| Central American Indian | 241 | 0.0% |
| Cherokee | 1,083 | 0.2% |
| Cheyenne | 30 | 0.0% |
| Chilean | 164 | 0.0% |
| Chippewa | 37 | 0.0% |
| Choctaw | 10 | 0.0% |
| Colombian | 660 | 0.1% |
| Costa Rican | 476 | 0.1% |
| Creek | 32 | 0.0% |
| Croatian | 265 | 0.1% |
| Crow | 8 | 0.0% |
| Cuban | 977 | 0.2% |
| Cypriot | 18 | 0.0% |
| Czech | 1,066 | 0.2% |
| Czechoslovakian | 363 | 0.1% |
| Danish | 748 | 0.1% |
| Delaware | 203 | 0.0% |
| Dominican | 1,397 | 0.2% |
| Dutch | 2,716 | 0.5% |
| Eastern European | 2,331 | 0.4% |
| Ecuadorian | 1,546 | 0.3% |
| Egyptian | 356 | 0.1% |
| English | 44,576 | 7.7% |
| Estonian | 9 | 0.0% |
| Ethiopian | 412 | 0.1% |
| European | 6,872 | 1.2% |
| Filipino | 326 | 0.1% |
| Finnish | 210 | 0.0% |
| French | 6,272 | 1.1% |
| French Canadian | 1,227 | 0.2% |
| German | 71,975 | 12.5% |
| German Russian | 34 | 0.0% |
| Ghanaian | 610 | 0.1% |
| Greek | 5,615 | 1.0% |
| Guamanian / Chamorro | 33 | 0.0% |
| Guatemalan | 452 | 0.1% |
| Guyanese | 184 | 0.0% |
| Haitian | 2,800 | 0.5% |
| Honduran | 997 | 0.2% |
| Hungarian | 2,579 | 0.4% |
| Icelander | 16 | 0.0% |
| Indian (Asian) | 9,790 | 1.7% |
| Indonesian | 95 | 0.0% |
| Inupiat | 17 | 0.0% |
| Iranian | 592 | 0.1% |
| Iraqi | 49 | 0.0% |
| Irish | 133,034 | 23.1% |
| Iroquois | 185 | 0.0% |
| Israeli | 172 | 0.0% |
| Italian | 84,665 | 14.7% |
| Jamaican | 3,638 | 0.6% |
| Japanese | 1,716 | 0.3% |
| Jordanian | 361 | 0.1% |
| Kenyan | 59 | 0.0% |
| Korean | 3,349 | 0.6% |
| Laotian | 266 | 0.1% |
| Latvian | 189 | 0.0% |
| Lebanese | 1,241 | 0.2% |
| Liberian | 3,734 | 0.6% |
| Lithuanian | 2,329 | 0.4% |
| Luxembourger | 109 | 0.0% |
| Macedonian | 10 | 0.0% |
| Malaysian | 453 | 0.1% |
| Maltese | 23 | 0.0% |
| Mexican | 5,356 | 0.9% |
| Mexican American Indian | 121 | 0.0% |
| Mongolian | 52 | 0.0% |
| Moroccan | 516 | 0.1% |
| Native Hawaiian | 403 | 0.1% |
| Navajo | 36 | 0.0% |
| New Zealander | 78 | 0.0% |
| Nicaraguan | 85 | 0.0% |
| Nigerian | 1,223 | 0.2% |
| Northern European | 552 | 0.1% |
| Norwegian | 1,913 | 0.3% |
| Ottawa | 7 | 0.0% |
| Pakistani | 562 | 0.1% |
| Palestinian | 135 | 0.0% |
| Panamanian | 239 | 0.0% |
| Paraguayan | 60 | 0.0% |
| Pennsylvania German | 1,390 | 0.2% |
| Peruvian | 372 | 0.1% |
| Polish | 20,912 | 3.6% |
| Portuguese | 1,017 | 0.2% |
| Pueblo | 10 | 0.0% |
| Puerto Rican | 8,424 | 1.5% |
| Romanian | 726 | 0.1% |
| Russian | 5,823 | 1.0% |
| Salvadoran | 394 | 0.1% |
| Scandinavian | 592 | 0.1% |
| Scotch-Irish | 3,731 | 0.6% |
| Scottish | 7,132 | 1.2% |
| Seminole | 31 | 0.0% |
| Senegalese | 86 | 0.0% |
| Serbian | 261 | 0.1% |
| Sierra Leonean | 1,196 | 0.2% |
| Sioux | 46 | 0.0% |
| Slavic | 325 | 0.1% |
| Slovak | 1,582 | 0.3% |
| Slovene | 125 | 0.0% |
| Somali | 89 | 0.0% |
| South African | 58 | 0.0% |
| South American | 3,434 | 0.6% |
| South American Indian | 84 | 0.0% |
| Spaniard | 631 | 0.1% |
| Spanish | 805 | 0.1% |
| Spanish American | 22 | 0.0% |
| Sri Lankan | 3,956 | 0.7% |
| Subsaharan African | 18,293 | 3.2% |
| Swedish | 3,043 | 0.5% |
| Swiss | 1,103 | 0.2% |
| Syrian | 403 | 0.1% |
| Thai | 12,236 | 2.1% |
| Trinidadian and Tobagonian | 526 | 0.1% |
| Turkish | 647 | 0.1% |
| U.S. Virgin Islander | 53 | 0.0% |
| Ugandan | 98 | 0.0% |
| Ukrainian | 3,942 | 0.7% |
| Ute | 17 | 0.0% |
| Venezuelan | 115 | 0.0% |
| Vietnamese | 1,802 | 0.3% |
| Welsh | 4,535 | 0.8% |
| West Indian | 366 | 0.1% |
| Yaqui | 4 | 0.0% |
| Yugoslavian | 226 | 0.0% |
| Zimbabwean | 9 | 0.0% | View All 156 Rows |
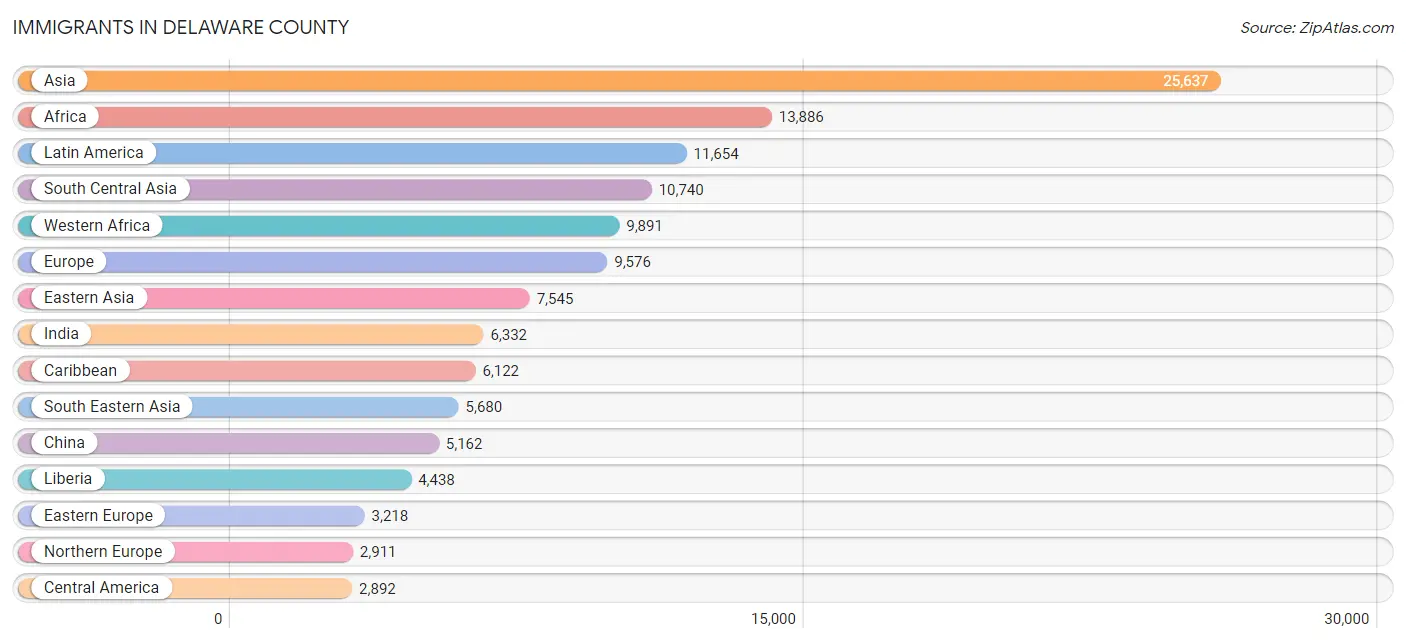
Immigrants in Delaware County
The most numerous immigrant groups reported in Delaware County came from Asia (25,637 | 4.5%), Africa (13,886 | 2.4%), Latin America (11,654 | 2.0%), South Central Asia (10,740 | 1.9%), and Western Africa (9,891 | 1.7%), together accounting for 12.5% of all Delaware County residents.
| Immigration Origin | # Population | % Population |
| Afghanistan | 98 | 0.0% |
| Africa | 13,886 | 2.4% |
| Albania | 663 | 0.1% |
| Argentina | 202 | 0.0% |
| Armenia | 50 | 0.0% |
| Asia | 25,637 | 4.5% |
| Australia | 139 | 0.0% |
| Austria | 33 | 0.0% |
| Bahamas | 13 | 0.0% |
| Bangladesh | 2,065 | 0.4% |
| Barbados | 155 | 0.0% |
| Belarus | 126 | 0.0% |
| Belgium | 21 | 0.0% |
| Belize | 83 | 0.0% |
| Bosnia and Herzegovina | 17 | 0.0% |
| Brazil | 378 | 0.1% |
| Bulgaria | 195 | 0.0% |
| Cambodia | 716 | 0.1% |
| Cameroon | 176 | 0.0% |
| Canada | 950 | 0.2% |
| Caribbean | 6,122 | 1.1% |
| Central America | 2,892 | 0.5% |
| Chile | 112 | 0.0% |
| China | 5,162 | 0.9% |
| Colombia | 319 | 0.1% |
| Costa Rica | 121 | 0.0% |
| Croatia | 87 | 0.0% |
| Cuba | 167 | 0.0% |
| Czechoslovakia | 29 | 0.0% |
| Denmark | 5 | 0.0% |
| Dominica | 5 | 0.0% |
| Dominican Republic | 449 | 0.1% |
| Eastern Africa | 910 | 0.2% |
| Eastern Asia | 7,545 | 1.3% |
| Eastern Europe | 3,218 | 0.6% |
| Ecuador | 736 | 0.1% |
| Egypt | 270 | 0.1% |
| El Salvador | 117 | 0.0% |
| England | 670 | 0.1% |
| Eritrea | 78 | 0.0% |
| Ethiopia | 284 | 0.1% |
| Europe | 9,576 | 1.7% |
| France | 129 | 0.0% |
| Germany | 625 | 0.1% |
| Ghana | 921 | 0.2% |
| Greece | 971 | 0.2% |
| Grenada | 15 | 0.0% |
| Guatemala | 350 | 0.1% |
| Guyana | 438 | 0.1% |
| Haiti | 2,163 | 0.4% |
| Honduras | 687 | 0.1% |
| Hong Kong | 241 | 0.0% |
| Hungary | 127 | 0.0% |
| India | 6,332 | 1.1% |
| Indonesia | 199 | 0.0% |
| Iran | 437 | 0.1% |
| Iraq | 108 | 0.0% |
| Ireland | 565 | 0.1% |
| Israel | 221 | 0.0% |
| Italy | 1,111 | 0.2% |
| Jamaica | 2,302 | 0.4% |
| Japan | 268 | 0.1% |
| Jordan | 354 | 0.1% |
| Kazakhstan | 64 | 0.0% |
| Kenya | 201 | 0.0% |
| Korea | 2,114 | 0.4% |
| Laos | 114 | 0.0% |
| Latin America | 11,654 | 2.0% |
| Latvia | 30 | 0.0% |
| Lebanon | 172 | 0.0% |
| Liberia | 4,438 | 0.8% |
| Lithuania | 41 | 0.0% |
| Malaysia | 53 | 0.0% |
| Mexico | 1,294 | 0.2% |
| Middle Africa | 267 | 0.1% |
| Moldova | 13 | 0.0% |
| Morocco | 545 | 0.1% |
| Nepal | 107 | 0.0% |
| Netherlands | 132 | 0.0% |
| Nicaragua | 72 | 0.0% |
| Nigeria | 1,176 | 0.2% |
| Northern Africa | 1,370 | 0.2% |
| Northern Europe | 2,911 | 0.5% |
| Oceania | 190 | 0.0% |
| Pakistan | 1,307 | 0.2% |
| Panama | 168 | 0.0% |
| Peru | 197 | 0.0% |
| Philippines | 1,413 | 0.3% |
| Poland | 511 | 0.1% |
| Portugal | 54 | 0.0% |
| Romania | 270 | 0.1% |
| Russia | 390 | 0.1% |
| Saudi Arabia | 130 | 0.0% |
| Scotland | 167 | 0.0% |
| Senegal | 135 | 0.0% |
| Serbia | 74 | 0.0% |
| Sierra Leone | 1,714 | 0.3% |
| Singapore | 102 | 0.0% |
| South Africa | 164 | 0.0% |
| South America | 2,640 | 0.5% |
| South Central Asia | 10,740 | 1.9% |
| South Eastern Asia | 5,680 | 1.0% |
| Southern Europe | 2,354 | 0.4% |
| Spain | 218 | 0.0% |
| Sri Lanka | 181 | 0.0% |
| St. Vincent and the Grenadines | 45 | 0.0% |
| Sudan | 232 | 0.0% |
| Sweden | 63 | 0.0% |
| Switzerland | 102 | 0.0% |
| Syria | 268 | 0.1% |
| Taiwan | 397 | 0.1% |
| Thailand | 431 | 0.1% |
| Trinidad and Tobago | 747 | 0.1% |
| Turkey | 225 | 0.0% |
| Uganda | 98 | 0.0% |
| Ukraine | 531 | 0.1% |
| Uzbekistan | 143 | 0.0% |
| Venezuela | 200 | 0.0% |
| Vietnam | 2,554 | 0.4% |
| West Indies | 42 | 0.0% |
| Western Africa | 9,891 | 1.7% |
| Western Asia | 1,609 | 0.3% |
| Western Europe | 1,073 | 0.2% |
| Zimbabwe | 9 | 0.0% | View All 124 Rows |
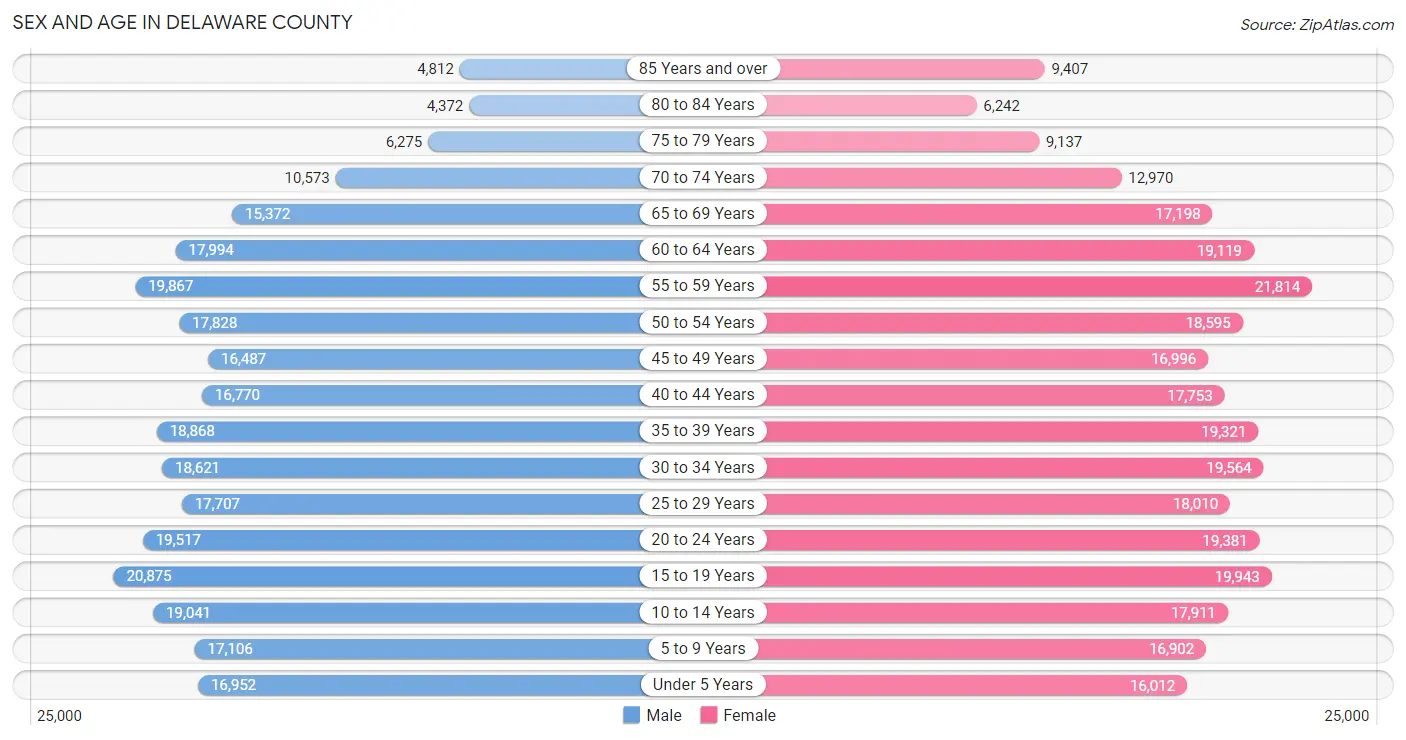
Sex and Age in Delaware County
Sex and Age in Delaware County
The most populous age groups in Delaware County are 15 to 19 Years (20,875 | 7.5%) for men and 55 to 59 Years (21,814 | 7.4%) for women.
| Age Bracket | Male | Female |
| Under 5 Years | 16,952 (6.1%) | 16,012 (5.4%) |
| 5 to 9 Years | 17,106 (6.1%) | 16,902 (5.7%) |
| 10 to 14 Years | 19,041 (6.8%) | 17,911 (6.0%) |
| 15 to 19 Years | 20,875 (7.5%) | 19,943 (6.7%) |
| 20 to 24 Years | 19,517 (7.0%) | 19,381 (6.5%) |
| 25 to 29 Years | 17,707 (6.4%) | 18,010 (6.1%) |
| 30 to 34 Years | 18,621 (6.7%) | 19,564 (6.6%) |
| 35 to 39 Years | 18,868 (6.8%) | 19,321 (6.5%) |
| 40 to 44 Years | 16,770 (6.0%) | 17,753 (6.0%) |
| 45 to 49 Years | 16,487 (5.9%) | 16,996 (5.7%) |
| 50 to 54 Years | 17,828 (6.4%) | 18,595 (6.3%) |
| 55 to 59 Years | 19,867 (7.1%) | 21,814 (7.4%) |
| 60 to 64 Years | 17,994 (6.5%) | 19,119 (6.5%) |
| 65 to 69 Years | 15,372 (5.5%) | 17,198 (5.8%) |
| 70 to 74 Years | 10,573 (3.8%) | 12,970 (4.4%) |
| 75 to 79 Years | 6,275 (2.2%) | 9,137 (3.1%) |
| 80 to 84 Years | 4,372 (1.6%) | 6,242 (2.1%) |
| 85 Years and over | 4,812 (1.7%) | 9,407 (3.2%) |
| Total | 279,037 (100.0%) | 296,275 (100.0%) |
Families and Households in Delaware County
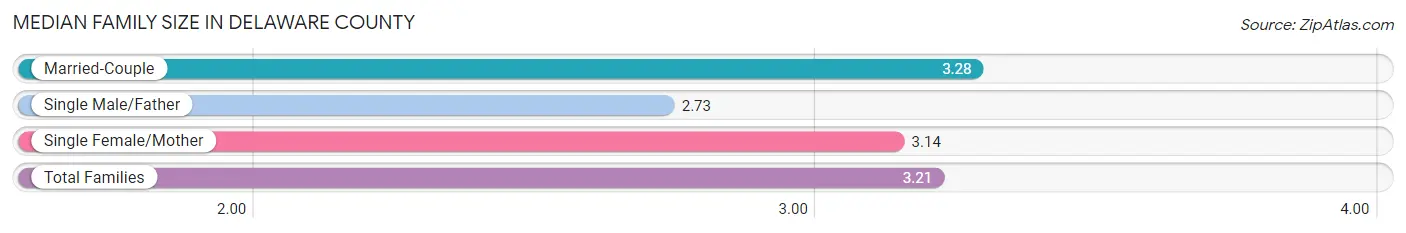
Median Family Size in Delaware County
The median family size in Delaware County is 3.21 persons per family, with married-couple families (101,042 | 70.9%) accounting for the largest median family size of 3.28 persons per family. On the other hand, single male/father families (10,383 | 7.3%) represent the smallest median family size with 2.73 persons per family.
| Family Type | # Families | Family Size |
| Married-Couple | 101,042 (70.9%) | 3.28 |
| Single Male/Father | 10,383 (7.3%) | 2.73 |
| Single Female/Mother | 31,123 (21.8%) | 3.14 |
| Total Families | 142,548 (100.0%) | 3.21 |
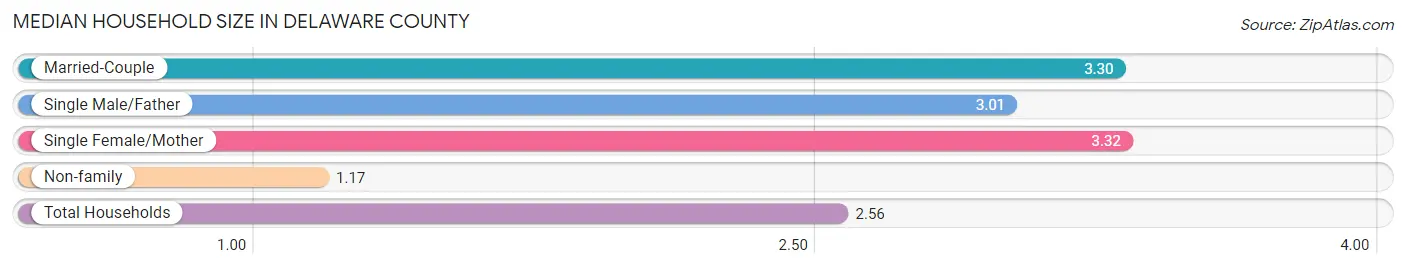
Median Household Size in Delaware County
The median household size in Delaware County is 2.56 persons per household, with single female/mother households (31,123 | 14.4%) accounting for the largest median household size of 3.32 persons per household. non-family households (73,285 | 34.0%) represent the smallest median household size with 1.17 persons per household.
| Household Type | # Households | Household Size |
| Married-Couple | 101,042 (46.8%) | 3.30 |
| Single Male/Father | 10,383 (4.8%) | 3.01 |
| Single Female/Mother | 31,123 (14.4%) | 3.32 |
| Non-family | 73,285 (34.0%) | 1.17 |
| Total Households | 215,833 (100.0%) | 2.56 |
Household Size by Marriage Status in Delaware County
Out of a total of 215,833 households in Delaware County, 142,548 (66.0%) are family households, while 73,285 (34.0%) are nonfamily households. The most numerous type of family households are 2-person households, comprising 57,153, and the most common type of nonfamily households are 1-person households, comprising 62,890.
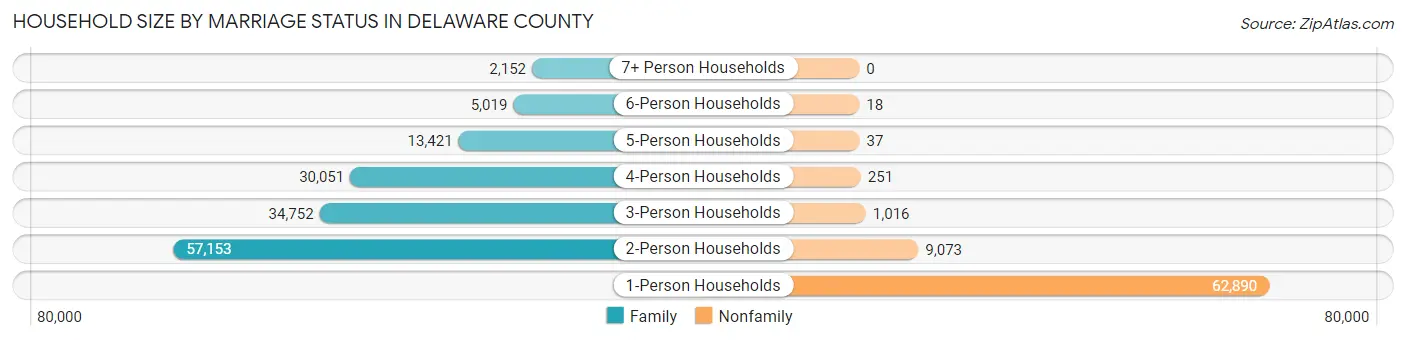
| Household Size | Family Households | Nonfamily Households |
| 1-Person Households | - | 62,890 (29.1%) |
| 2-Person Households | 57,153 (26.5%) | 9,073 (4.2%) |
| 3-Person Households | 34,752 (16.1%) | 1,016 (0.5%) |
| 4-Person Households | 30,051 (13.9%) | 251 (0.1%) |
| 5-Person Households | 13,421 (6.2%) | 37 (0.0%) |
| 6-Person Households | 5,019 (2.3%) | 18 (0.0%) |
| 7+ Person Households | 2,152 (1.0%) | 0 (0.0%) |
| Total | 142,548 (66.0%) | 73,285 (34.0%) |
Female Fertility in Delaware County
Fertility by Age in Delaware County
Average fertility rate in Delaware County is 48.0 births per 1,000 women. Women in the age bracket of 20 to 34 years have the highest fertility rate with 74.0 births per 1,000 women. Women in the age bracket of 20 to 34 years acount for 65.5% of all women with births.
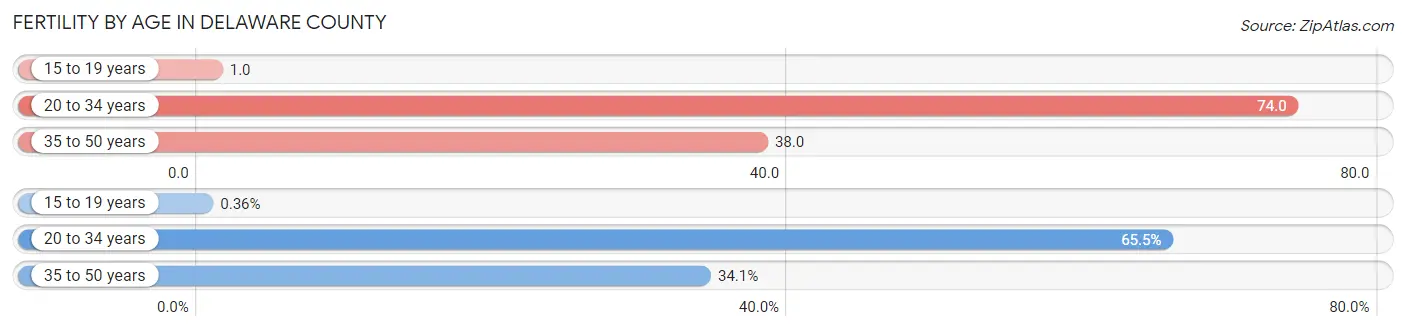
| Age Bracket | Women with Births | Births / 1,000 Women |
| 15 to 19 years | 23 (0.4%) | 1.0 |
| 20 to 34 years | 4,229 (65.5%) | 74.0 |
| 35 to 50 years | 2,204 (34.1%) | 38.0 |
| Total | 6,456 (100.0%) | 48.0 |
Fertility by Age by Marriage Status in Delaware County
70.5% of women with births (6,456) in Delaware County are married. The highest percentage of unmarried women with births falls into 15 to 19 years age bracket with 100.0% of them unmarried at the time of birth, while the lowest percentage of unmarried women with births belong to 35 to 50 years age bracket with 16.9% of them unmarried.
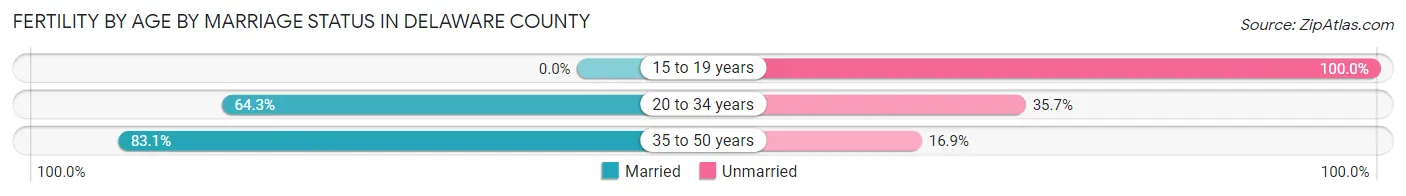
| Age Bracket | Married | Unmarried |
| 15 to 19 years | 0 (0.0%) | 23 (100.0%) |
| 20 to 34 years | 2,719 (64.3%) | 1,510 (35.7%) |
| 35 to 50 years | 1,832 (83.1%) | 372 (16.9%) |
| Total | 4,551 (70.5%) | 1,905 (29.5%) |
Fertility by Education in Delaware County
Average fertility rate in Delaware County is 48.0 births per 1,000 women. Women with the education attainment of graduate degree have the highest fertility rate of 73.0 births per 1,000 women, while women with the education attainment of less than high school have the lowest fertility at 21.0 births per 1,000 women. Women with the education attainment of bachelor's degree represent 28.8% of all women with births.
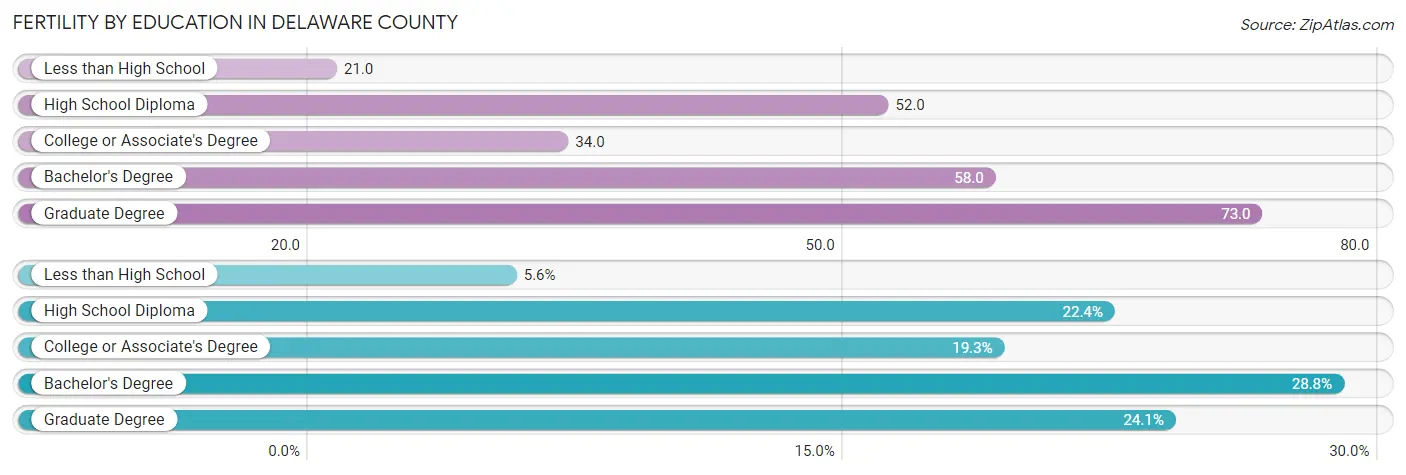
| Educational Attainment | Women with Births | Births / 1,000 Women |
| Less than High School | 358 (5.6%) | 21.0 |
| High School Diploma | 1,443 (22.4%) | 52.0 |
| College or Associate's Degree | 1,243 (19.3%) | 34.0 |
| Bachelor's Degree | 1,859 (28.8%) | 58.0 |
| Graduate Degree | 1,553 (24.1%) | 73.0 |
| Total | 6,456 (100.0%) | 48.0 |
Fertility by Education by Marriage Status in Delaware County
29.5% of women with births in Delaware County are unmarried. Women with the educational attainment of bachelor's degree are most likely to be married with 87.6% of them married at childbirth, while women with the educational attainment of high school diploma are least likely to be married with 50.2% of them unmarried at childbirth.
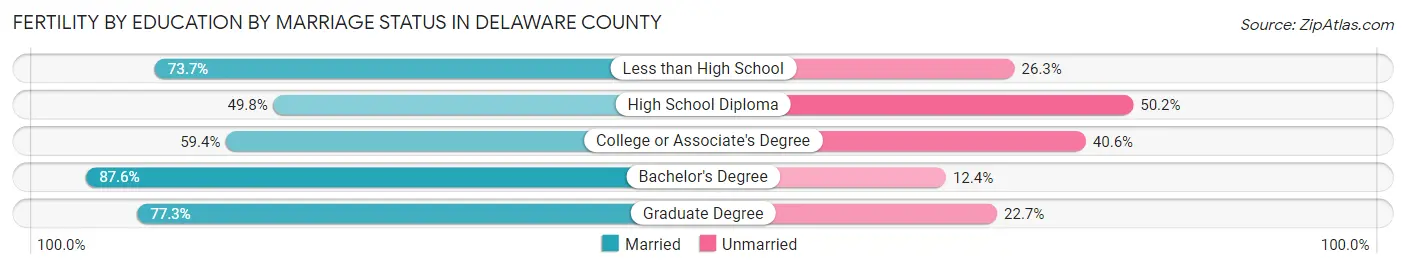
| Educational Attainment | Married | Unmarried |
| Less than High School | 264 (73.7%) | 94 (26.3%) |
| High School Diploma | 719 (49.8%) | 724 (50.2%) |
| College or Associate's Degree | 738 (59.4%) | 505 (40.6%) |
| Bachelor's Degree | 1,628 (87.6%) | 231 (12.4%) |
| Graduate Degree | 1,200 (77.3%) | 353 (22.7%) |
| Total | 4,551 (70.5%) | 1,905 (29.5%) |
Employment Characteristics in Delaware County
Employment by Class of Employer in Delaware County
Among the 279,844 employed individuals in Delaware County, private company employees (189,280 | 67.6%), not-for-profit organizations (37,609 | 13.4%), and local government employees (17,809 | 6.4%) make up the most common classes of employment.
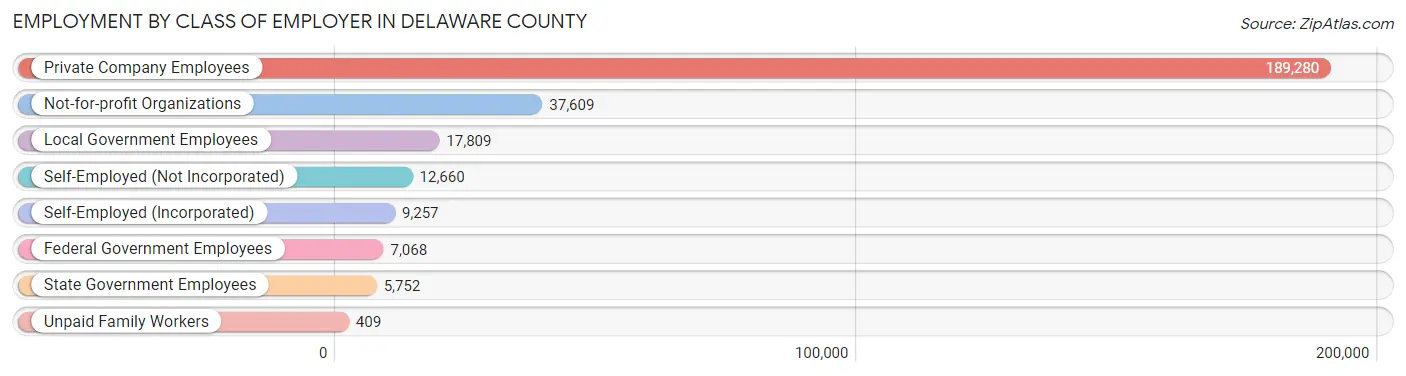
| Employer Class | # Employees | % Employees |
| Private Company Employees | 189,280 | 67.6% |
| Self-Employed (Incorporated) | 9,257 | 3.3% |
| Self-Employed (Not Incorporated) | 12,660 | 4.5% |
| Not-for-profit Organizations | 37,609 | 13.4% |
| Local Government Employees | 17,809 | 6.4% |
| State Government Employees | 5,752 | 2.1% |
| Federal Government Employees | 7,068 | 2.5% |
| Unpaid Family Workers | 409 | 0.2% |
| Total | 279,844 | 100.0% |
Employment Status by Age in Delaware County
According to the labor force statistics for Delaware County, out of the total population over 16 years of age (462,613), 66.3% or 306,712 individuals are in the labor force, with 6.8% or 20,856 of them unemployed. The age group with the highest labor force participation rate is 25 to 29 years, with 87.8% or 31,360 individuals in the labor force. Within the labor force, the 16 to 19 years age range has the highest percentage of unemployed individuals, with 20.7% or 2,361 of them being unemployed.
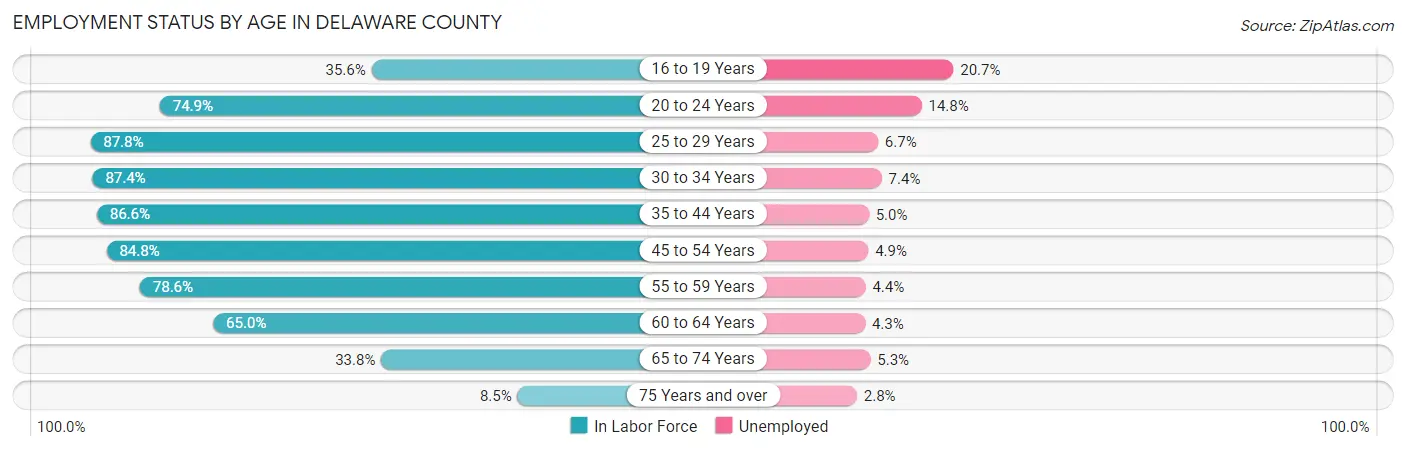
| Age Bracket | In Labor Force | Unemployed |
| 16 to 19 Years | 11,407 (35.6%) | 2,361 (20.7%) |
| 20 to 24 Years | 29,135 (74.9%) | 4,312 (14.8%) |
| 25 to 29 Years | 31,360 (87.8%) | 2,101 (6.7%) |
| 30 to 34 Years | 33,374 (87.4%) | 2,470 (7.4%) |
| 35 to 44 Years | 62,969 (86.6%) | 3,148 (5.0%) |
| 45 to 54 Years | 59,280 (84.8%) | 2,905 (4.9%) |
| 55 to 59 Years | 32,761 (78.6%) | 1,441 (4.4%) |
| 60 to 64 Years | 24,123 (65.0%) | 1,037 (4.3%) |
| 65 to 74 Years | 18,966 (33.8%) | 1,005 (5.3%) |
| 75 Years and over | 3,421 (8.5%) | 96 (2.8%) |
| Total | 306,712 (66.3%) | 20,856 (6.8%) |
Employment Status by Educational Attainment in Delaware County
According to labor force statistics for Delaware County, 82.6% of individuals (243,929) out of the total population between 25 and 64 years of age (295,314) are in the labor force, with 5.4% or 13,172 of them being unemployed. The group with the highest labor force participation rate are those with the educational attainment of bachelor's degree or higher, with 88.7% or 112,429 individuals in the labor force. Within the labor force, individuals with less than high school education have the highest percentage of unemployment, with 9.9% or 970 of them being unemployed.
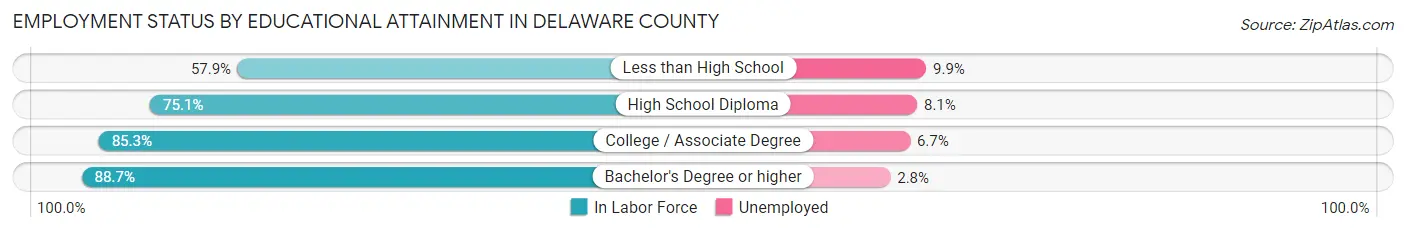
| Educational Attainment | In Labor Force | Unemployed |
| Less than High School | 9,795 (57.9%) | 1,675 (9.9%) |
| High School Diploma | 56,502 (75.1%) | 6,094 (8.1%) |
| College / Associate Degree | 65,177 (85.3%) | 5,119 (6.7%) |
| Bachelor's Degree or higher | 112,429 (88.7%) | 3,549 (2.8%) |
| Total | 243,929 (82.6%) | 15,947 (5.4%) |
Employment Occupations by Sex in Delaware County
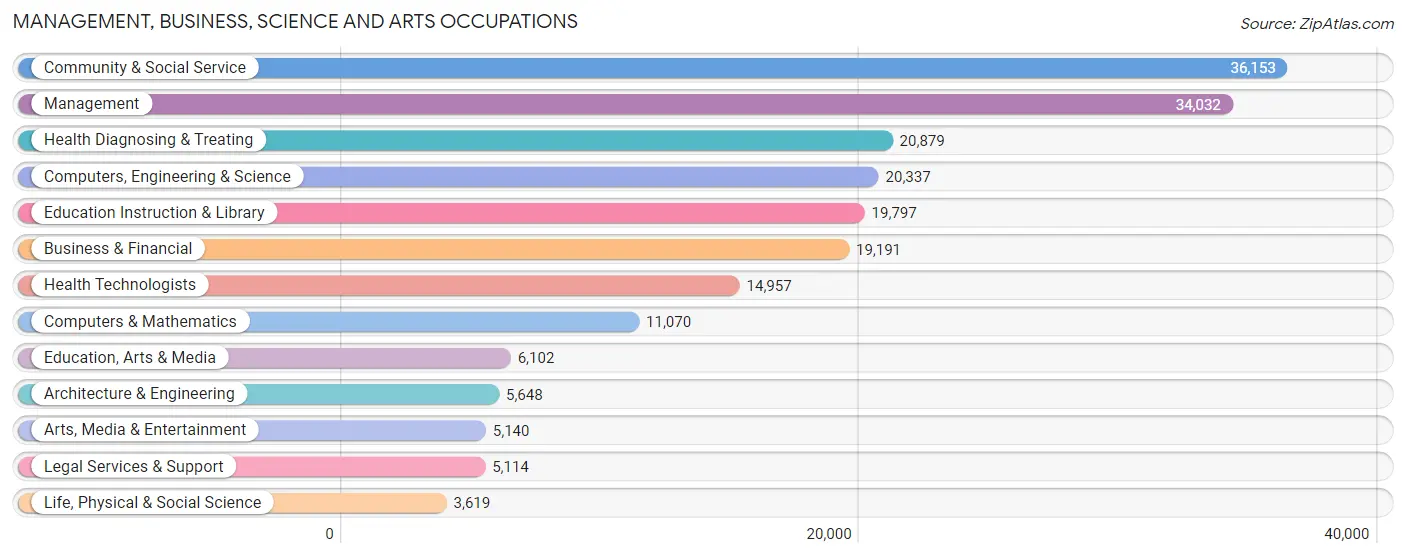
Management, Business, Science and Arts Occupations
The most common Management, Business, Science and Arts occupations in Delaware County are Community & Social Service (36,153 | 12.7%), Management (34,032 | 11.9%), Health Diagnosing & Treating (20,879 | 7.3%), Computers, Engineering & Science (20,337 | 7.1%), and Education Instruction & Library (19,797 | 6.9%).
Management, Business, Science and Arts Occupations by Sex
Within the Management, Business, Science and Arts occupations in Delaware County, the most male-oriented occupations are Architecture & Engineering (84.1%), Computers & Mathematics (70.6%), and Computers, Engineering & Science (69.8%), while the most female-oriented occupations are Health Diagnosing & Treating (75.3%), Health Technologists (74.5%), and Education Instruction & Library (70.9%).
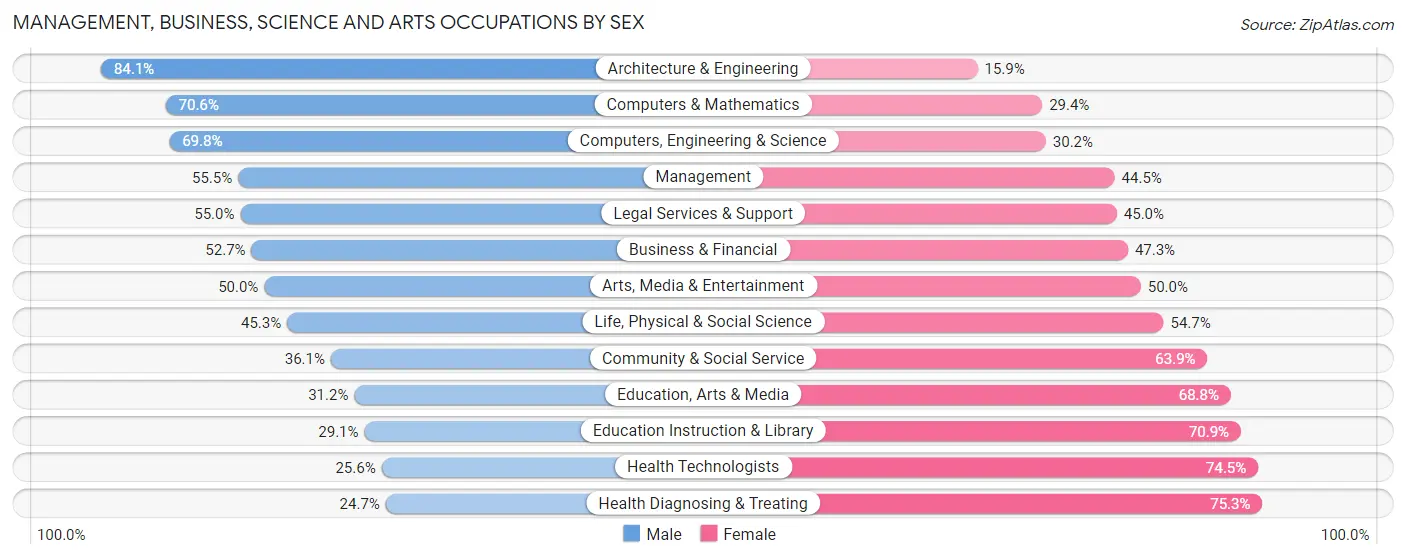
| Occupation | Male | Female |
| Management | 18,879 (55.5%) | 15,153 (44.5%) |
| Business & Financial | 10,111 (52.7%) | 9,080 (47.3%) |
| Computers, Engineering & Science | 14,199 (69.8%) | 6,138 (30.2%) |
| Computers & Mathematics | 7,813 (70.6%) | 3,257 (29.4%) |
| Architecture & Engineering | 4,748 (84.1%) | 900 (15.9%) |
| Life, Physical & Social Science | 1,638 (45.3%) | 1,981 (54.7%) |
| Community & Social Service | 13,057 (36.1%) | 23,096 (63.9%) |
| Education, Arts & Media | 1,906 (31.2%) | 4,196 (68.8%) |
| Legal Services & Support | 2,813 (55.0%) | 2,301 (45.0%) |
| Education Instruction & Library | 5,767 (29.1%) | 14,030 (70.9%) |
| Arts, Media & Entertainment | 2,571 (50.0%) | 2,569 (50.0%) |
| Health Diagnosing & Treating | 5,153 (24.7%) | 15,726 (75.3%) |
| Health Technologists | 3,822 (25.6%) | 11,135 (74.5%) |
| Total (Category) | 61,399 (47.0%) | 69,193 (53.0%) |
| Total (Overall) | 145,708 (51.0%) | 139,964 (49.0%) |
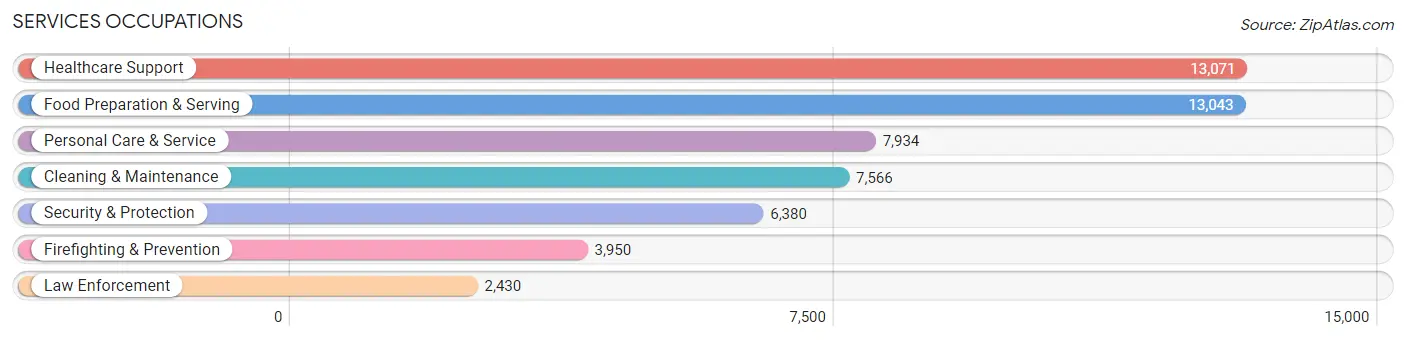
Services Occupations
The most common Services occupations in Delaware County are Healthcare Support (13,071 | 4.6%), Food Preparation & Serving (13,043 | 4.6%), Personal Care & Service (7,934 | 2.8%), Cleaning & Maintenance (7,566 | 2.6%), and Security & Protection (6,380 | 2.2%).
Services Occupations by Sex
Within the Services occupations in Delaware County, the most male-oriented occupations are Law Enforcement (80.2%), Security & Protection (74.6%), and Firefighting & Prevention (71.1%), while the most female-oriented occupations are Healthcare Support (83.8%), Personal Care & Service (76.8%), and Food Preparation & Serving (50.8%).
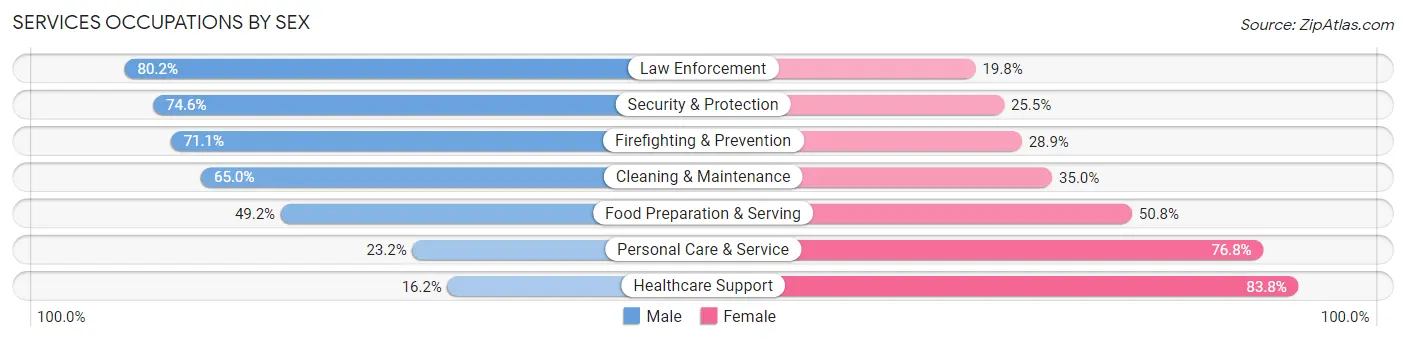
| Occupation | Male | Female |
| Healthcare Support | 2,120 (16.2%) | 10,951 (83.8%) |
| Security & Protection | 4,756 (74.6%) | 1,624 (25.5%) |
| Firefighting & Prevention | 2,807 (71.1%) | 1,143 (28.9%) |
| Law Enforcement | 1,949 (80.2%) | 481 (19.8%) |
| Food Preparation & Serving | 6,423 (49.2%) | 6,620 (50.8%) |
| Cleaning & Maintenance | 4,921 (65.0%) | 2,645 (35.0%) |
| Personal Care & Service | 1,840 (23.2%) | 6,094 (76.8%) |
| Total (Category) | 20,060 (41.8%) | 27,934 (58.2%) |
| Total (Overall) | 145,708 (51.0%) | 139,964 (49.0%) |
Sales and Office Occupations
The most common Sales and Office occupations in Delaware County are Office & Administration (31,862 | 11.2%), and Sales & Related (26,821 | 9.4%).

Sales and Office Occupations by Sex
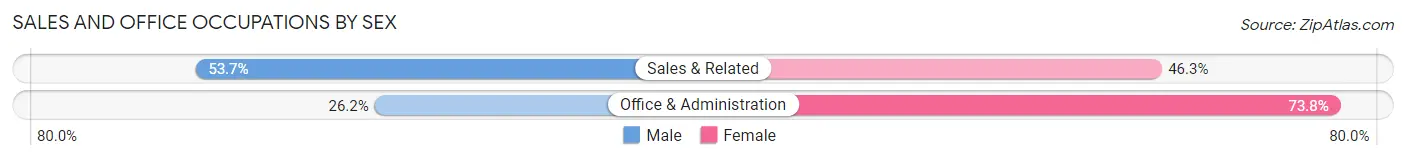
| Occupation | Male | Female |
| Sales & Related | 14,414 (53.7%) | 12,407 (46.3%) |
| Office & Administration | 8,336 (26.2%) | 23,526 (73.8%) |
| Total (Category) | 22,750 (38.8%) | 35,933 (61.2%) |
| Total (Overall) | 145,708 (51.0%) | 139,964 (49.0%) |
Natural Resources, Construction and Maintenance Occupations
The most common Natural Resources, Construction and Maintenance occupations in Delaware County are Construction & Extraction (10,145 | 3.5%), Installation, Maintenance & Repair (8,026 | 2.8%), and Farming, Fishing & Forestry (593 | 0.2%).

Natural Resources, Construction and Maintenance Occupations by Sex
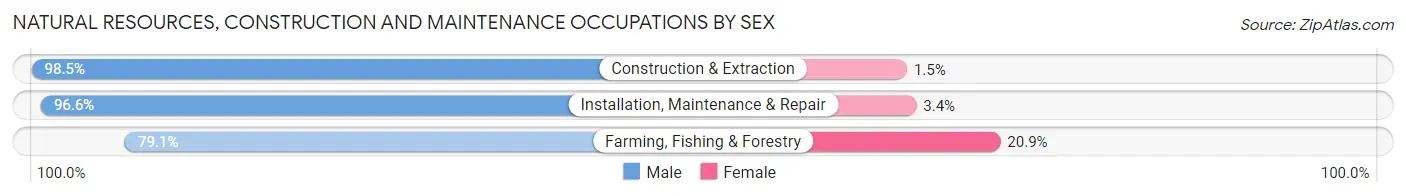
| Occupation | Male | Female |
| Farming, Fishing & Forestry | 469 (79.1%) | 124 (20.9%) |
| Construction & Extraction | 9,996 (98.5%) | 149 (1.5%) |
| Installation, Maintenance & Repair | 7,752 (96.6%) | 274 (3.4%) |
| Total (Category) | 18,217 (97.1%) | 547 (2.9%) |
| Total (Overall) | 145,708 (51.0%) | 139,964 (49.0%) |
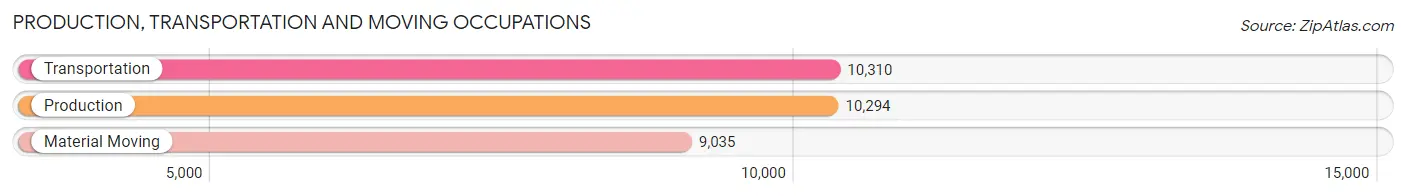
Production, Transportation and Moving Occupations
The most common Production, Transportation and Moving occupations in Delaware County are Transportation (10,310 | 3.6%), Production (10,294 | 3.6%), and Material Moving (9,035 | 3.2%).
Production, Transportation and Moving Occupations by Sex
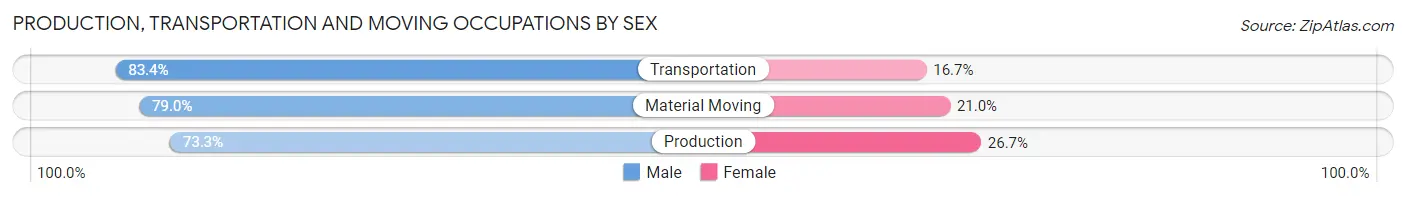
| Occupation | Male | Female |
| Production | 7,550 (73.3%) | 2,744 (26.7%) |
| Transportation | 8,593 (83.4%) | 1,717 (16.7%) |
| Material Moving | 7,139 (79.0%) | 1,896 (21.0%) |
| Total (Category) | 23,282 (78.5%) | 6,357 (21.4%) |
| Total (Overall) | 145,708 (51.0%) | 139,964 (49.0%) |
Employment Industries by Sex in Delaware County
Employment Industries in Delaware County
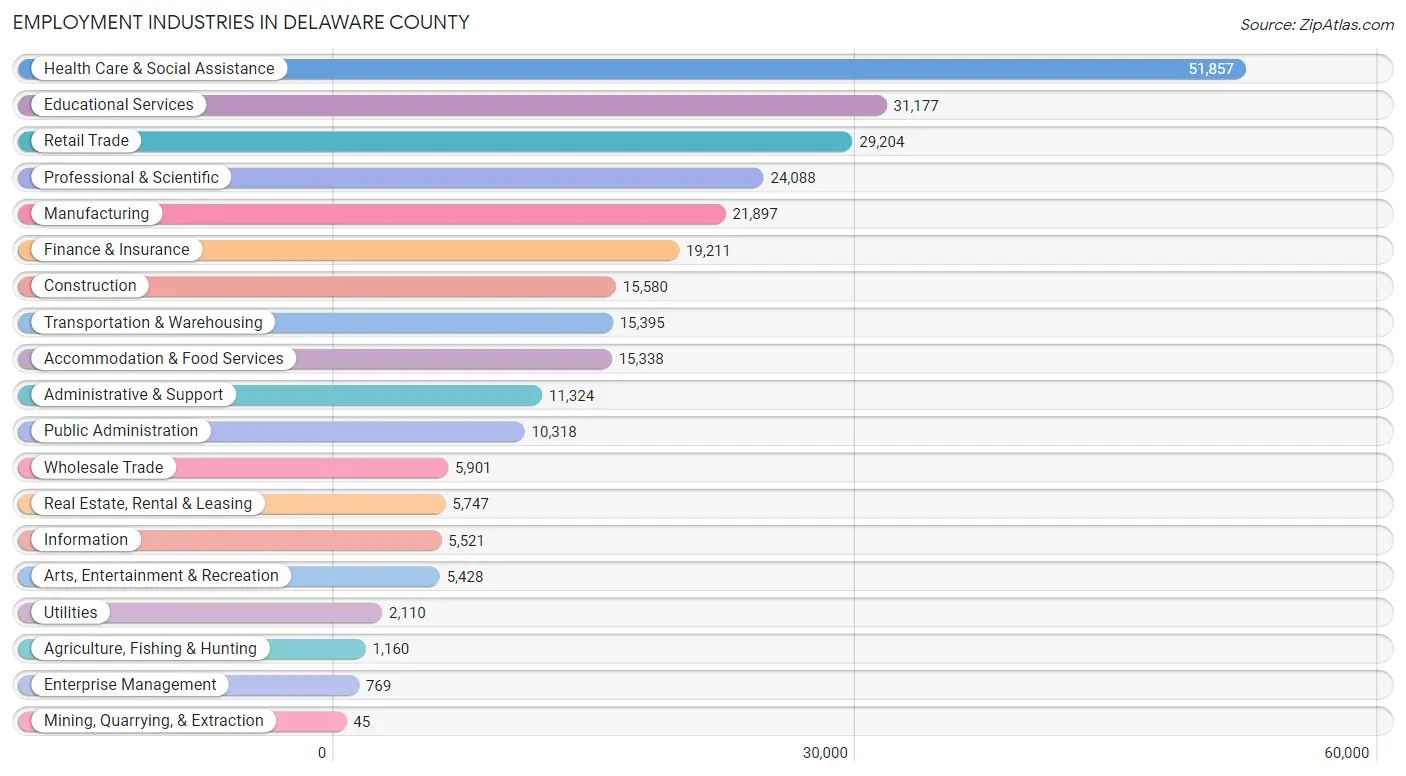
The major employment industries in Delaware County include Health Care & Social Assistance (51,857 | 18.1%), Educational Services (31,177 | 10.9%), Retail Trade (29,204 | 10.2%), Professional & Scientific (24,088 | 8.4%), and Manufacturing (21,897 | 7.7%).
Employment Industries by Sex in Delaware County
The Delaware County industries that see more men than women are Mining, Quarrying, & Extraction (100.0%), Construction (90.1%), and Utilities (79.0%), whereas the industries that tend to have a higher number of women are Health Care & Social Assistance (77.8%), Educational Services (65.2%), and Accommodation & Food Services (52.1%).
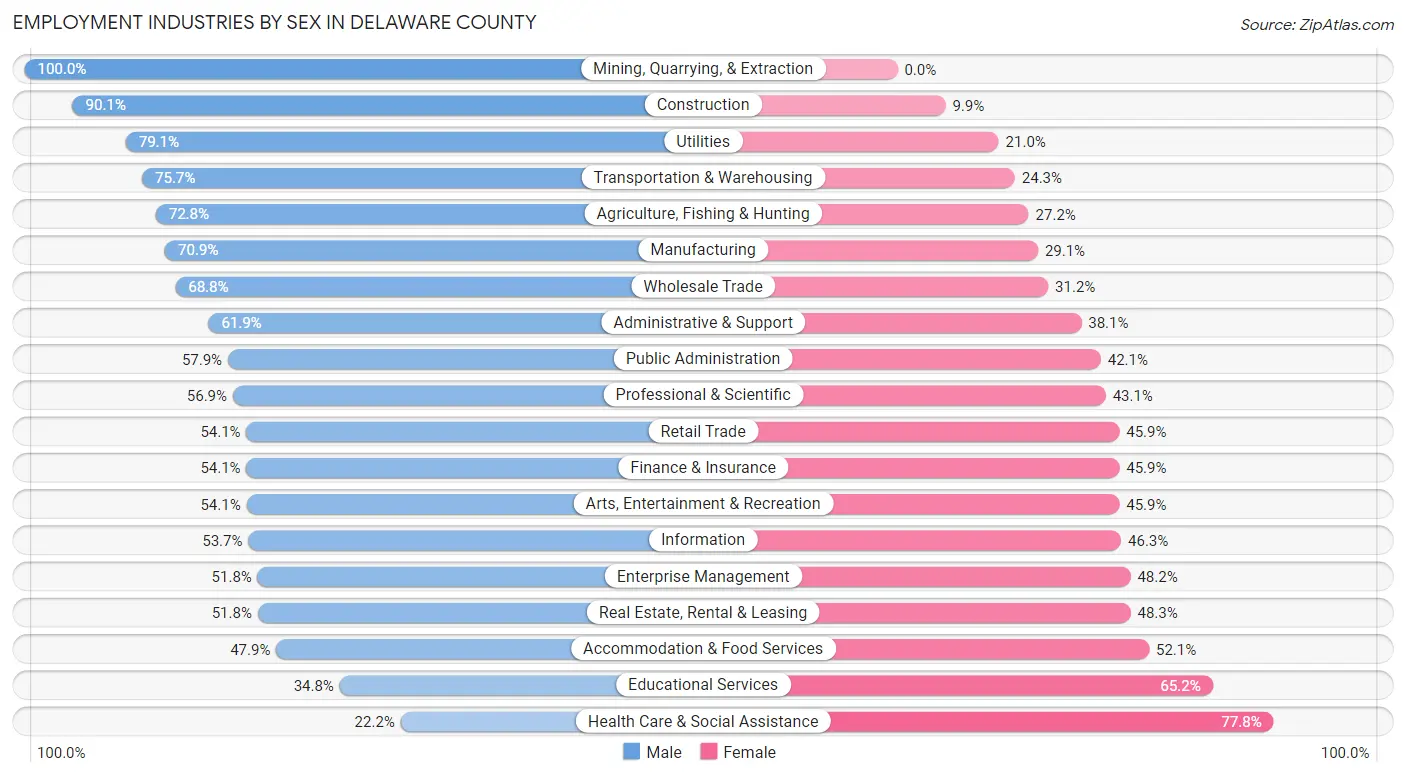
| Industry | Male | Female |
| Agriculture, Fishing & Hunting | 845 (72.8%) | 315 (27.2%) |
| Mining, Quarrying, & Extraction | 45 (100.0%) | 0 (0.0%) |
| Construction | 14,031 (90.1%) | 1,549 (9.9%) |
| Manufacturing | 15,528 (70.9%) | 6,369 (29.1%) |
| Wholesale Trade | 4,060 (68.8%) | 1,841 (31.2%) |
| Retail Trade | 15,793 (54.1%) | 13,411 (45.9%) |
| Transportation & Warehousing | 11,653 (75.7%) | 3,742 (24.3%) |
| Utilities | 1,668 (79.0%) | 442 (20.9%) |
| Information | 2,965 (53.7%) | 2,556 (46.3%) |
| Finance & Insurance | 10,390 (54.1%) | 8,821 (45.9%) |
| Real Estate, Rental & Leasing | 2,974 (51.7%) | 2,773 (48.2%) |
| Professional & Scientific | 13,703 (56.9%) | 10,385 (43.1%) |
| Enterprise Management | 398 (51.8%) | 371 (48.2%) |
| Administrative & Support | 7,014 (61.9%) | 4,310 (38.1%) |
| Educational Services | 10,844 (34.8%) | 20,333 (65.2%) |
| Health Care & Social Assistance | 11,494 (22.2%) | 40,363 (77.8%) |
| Arts, Entertainment & Recreation | 2,935 (54.1%) | 2,493 (45.9%) |
| Accommodation & Food Services | 7,348 (47.9%) | 7,990 (52.1%) |
| Public Administration | 5,975 (57.9%) | 4,343 (42.1%) |
| Total | 145,708 (51.0%) | 139,964 (49.0%) |
Education in Delaware County
School Enrollment in Delaware County
The most common levels of schooling among the 145,174 students in Delaware County are college / undergraduate (36,013 | 24.8%), high school (29,929 | 20.6%), and middle school (28,470 | 19.6%).
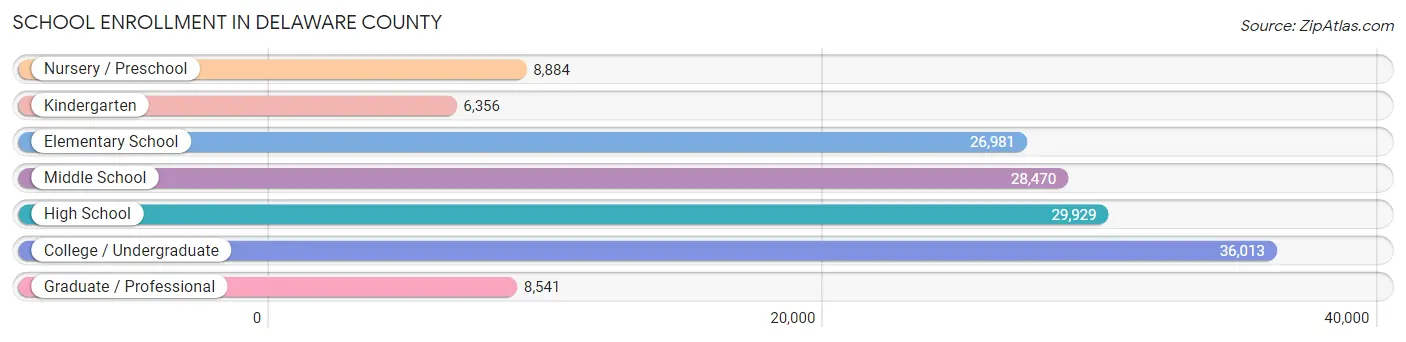
| School Level | # Students | % Students |
| Nursery / Preschool | 8,884 | 6.1% |
| Kindergarten | 6,356 | 4.4% |
| Elementary School | 26,981 | 18.6% |
| Middle School | 28,470 | 19.6% |
| High School | 29,929 | 20.6% |
| College / Undergraduate | 36,013 | 24.8% |
| Graduate / Professional | 8,541 | 5.9% |
| Total | 145,174 | 100.0% |
School Enrollment by Age by Funding Source in Delaware County
Out of a total of 145,174 students who are enrolled in schools in Delaware County, 46,311 (31.9%) attend a private institution, while the remaining 98,863 (68.1%) are enrolled in public schools. The age group of 3 to 4 year olds has the highest likelihood of being enrolled in private schools, with 4,345 (64.2% in the age bracket) enrolled. Conversely, the age group of 10 to 14 year olds has the lowest likelihood of being enrolled in a private school, with 30,554 (84.7% in the age bracket) attending a public institution.
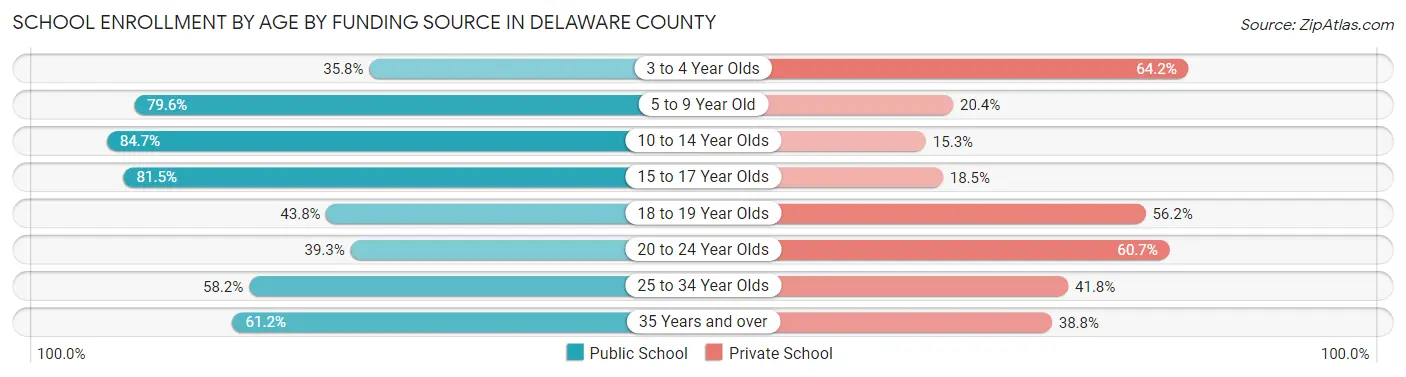
| Age Bracket | Public School | Private School |
| 3 to 4 Year Olds | 2,421 (35.8%) | 4,345 (64.2%) |
| 5 to 9 Year Old | 24,962 (79.6%) | 6,386 (20.4%) |
| 10 to 14 Year Olds | 30,554 (84.7%) | 5,529 (15.3%) |
| 15 to 17 Year Olds | 17,614 (81.5%) | 3,988 (18.5%) |
| 18 to 19 Year Olds | 6,827 (43.8%) | 8,767 (56.2%) |
| 20 to 24 Year Olds | 7,041 (39.3%) | 10,879 (60.7%) |
| 25 to 34 Year Olds | 4,936 (58.2%) | 3,546 (41.8%) |
| 35 Years and over | 4,519 (61.2%) | 2,860 (38.8%) |
| Total | 98,863 (68.1%) | 46,311 (31.9%) |
Educational Attainment by Field of Study in Delaware County
Business (35,429 | 20.5%), education (18,558 | 10.8%), science & technology (18,169 | 10.5%), social sciences (13,826 | 8.0%), and engineering (10,864 | 6.3%) are the most common fields of study among 172,362 individuals in Delaware County who have obtained a bachelor's degree or higher.
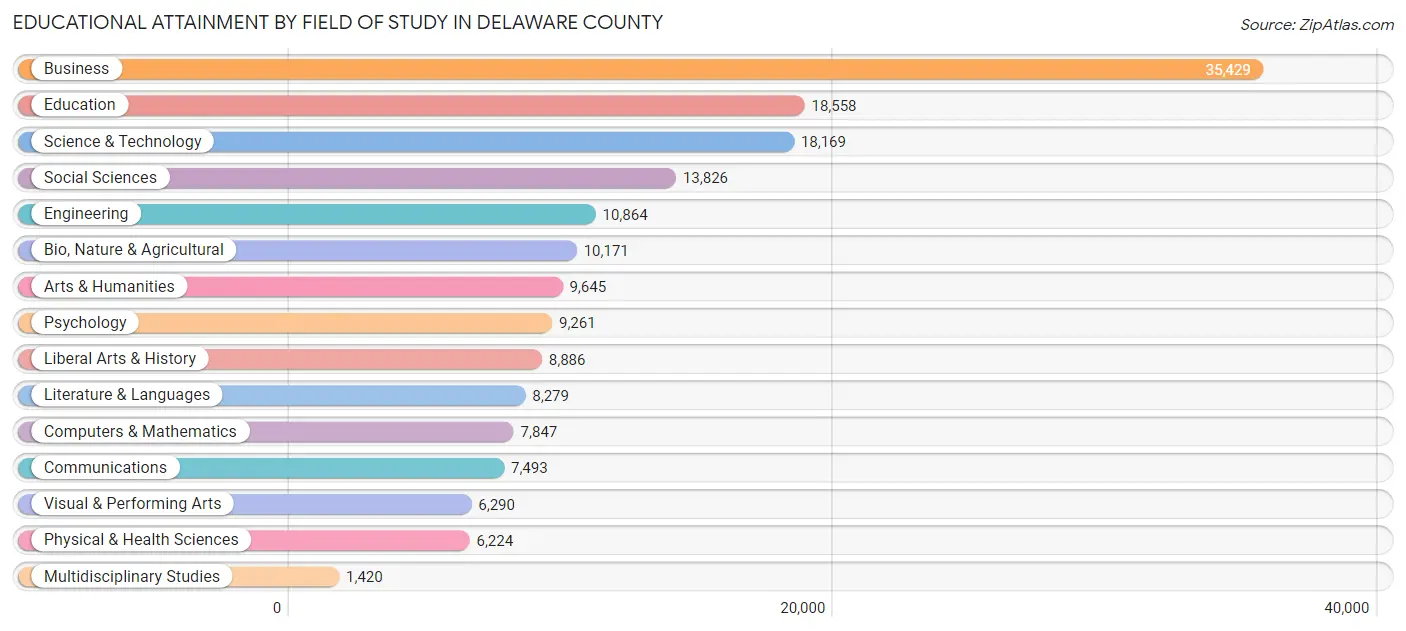
| Field of Study | # Graduates | % Graduates |
| Computers & Mathematics | 7,847 | 4.5% |
| Bio, Nature & Agricultural | 10,171 | 5.9% |
| Physical & Health Sciences | 6,224 | 3.6% |
| Psychology | 9,261 | 5.4% |
| Social Sciences | 13,826 | 8.0% |
| Engineering | 10,864 | 6.3% |
| Multidisciplinary Studies | 1,420 | 0.8% |
| Science & Technology | 18,169 | 10.5% |
| Business | 35,429 | 20.5% |
| Education | 18,558 | 10.8% |
| Literature & Languages | 8,279 | 4.8% |
| Liberal Arts & History | 8,886 | 5.2% |
| Visual & Performing Arts | 6,290 | 3.6% |
| Communications | 7,493 | 4.3% |
| Arts & Humanities | 9,645 | 5.6% |
| Total | 172,362 | 100.0% |
Transportation & Commute in Delaware County
Vehicle Availability by Sex in Delaware County
The most prevalent vehicle ownership categories in Delaware County are males with 2 vehicles (62,787, accounting for 44.4%) and females with 2 vehicles (54,914, making up 47.1%).
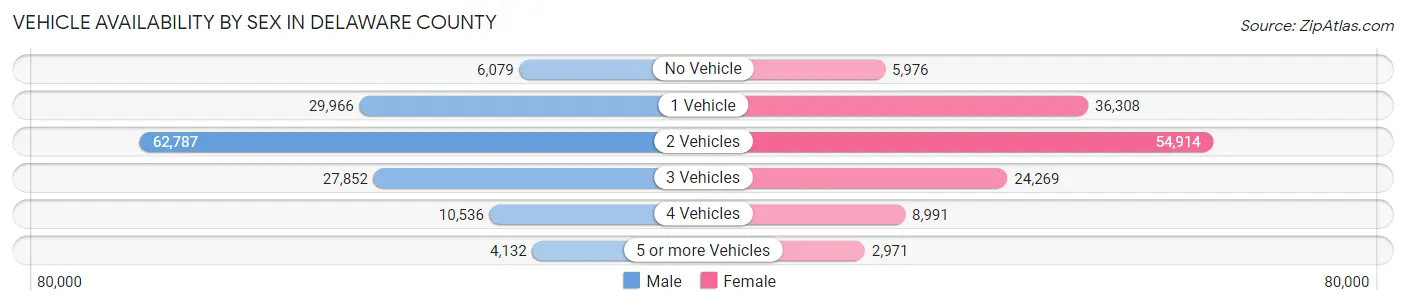
| Vehicles Available | Male | Female |
| No Vehicle | 6,079 (4.3%) | 5,976 (4.5%) |
| 1 Vehicle | 29,966 (21.2%) | 36,308 (27.2%) |
| 2 Vehicles | 62,787 (44.4%) | 54,914 (41.2%) |
| 3 Vehicles | 27,852 (19.7%) | 24,269 (18.2%) |
| 4 Vehicles | 10,536 (7.4%) | 8,991 (6.7%) |
| 5 or more Vehicles | 4,132 (2.9%) | 2,971 (2.2%) |
| Total | 141,352 (100.0%) | 133,429 (100.0%) |
Commute Time in Delaware County
The most frequently occuring commute durations in Delaware County are 30 to 34 minutes (37,640 commuters, 15.5%), 20 to 24 minutes (33,477 commuters, 13.8%), and 45 to 59 minutes (30,400 commuters, 12.5%).
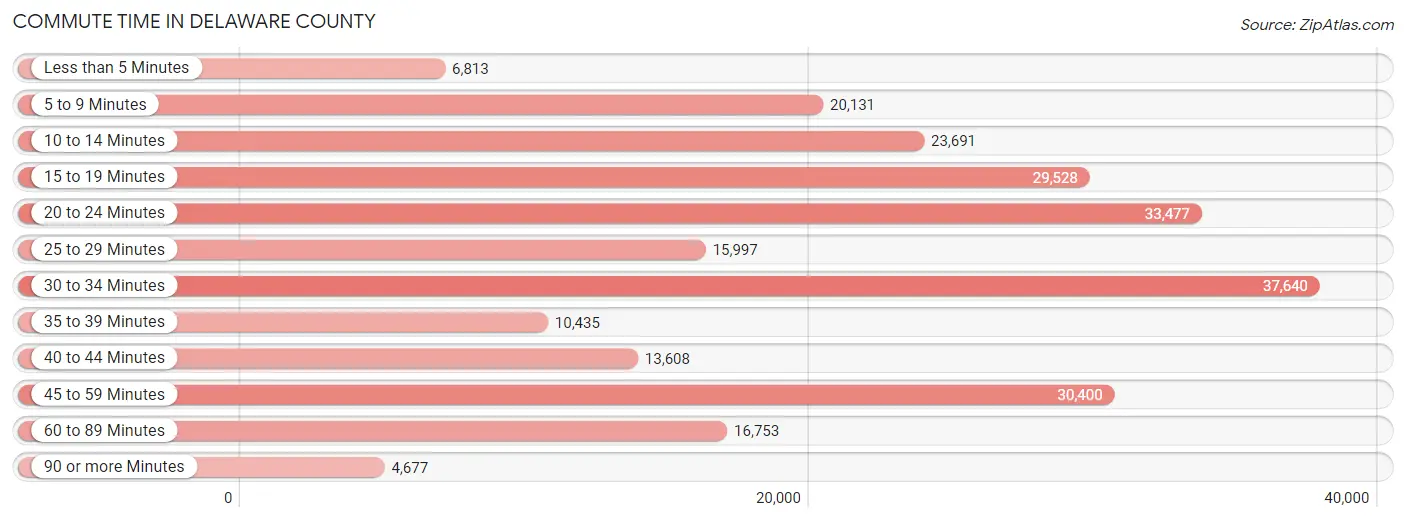
| Commute Time | # Commuters | % Commuters |
| Less than 5 Minutes | 6,813 | 2.8% |
| 5 to 9 Minutes | 20,131 | 8.3% |
| 10 to 14 Minutes | 23,691 | 9.7% |
| 15 to 19 Minutes | 29,528 | 12.1% |
| 20 to 24 Minutes | 33,477 | 13.8% |
| 25 to 29 Minutes | 15,997 | 6.6% |
| 30 to 34 Minutes | 37,640 | 15.5% |
| 35 to 39 Minutes | 10,435 | 4.3% |
| 40 to 44 Minutes | 13,608 | 5.6% |
| 45 to 59 Minutes | 30,400 | 12.5% |
| 60 to 89 Minutes | 16,753 | 6.9% |
| 90 or more Minutes | 4,677 | 1.9% |
Commute Time by Sex in Delaware County
The most common commute times in Delaware County are 30 to 34 minutes (20,234 commuters, 16.1%) for males and 30 to 34 minutes (17,406 commuters, 14.8%) for females.
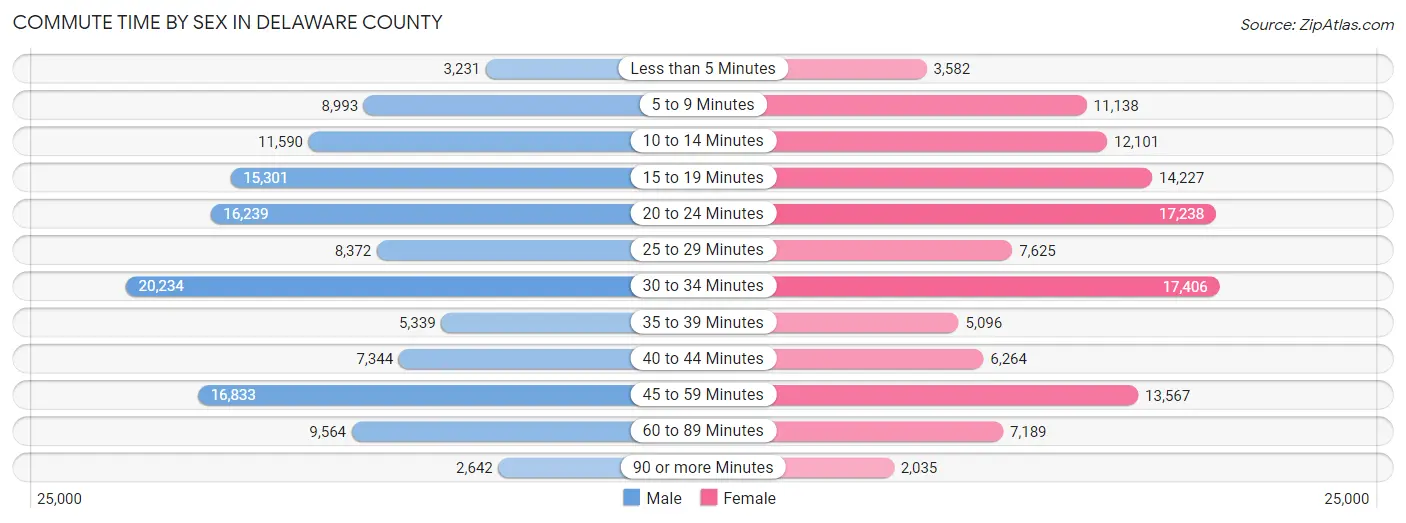
| Commute Time | Male | Female |
| Less than 5 Minutes | 3,231 (2.6%) | 3,582 (3.0%) |
| 5 to 9 Minutes | 8,993 (7.2%) | 11,138 (9.5%) |
| 10 to 14 Minutes | 11,590 (9.2%) | 12,101 (10.3%) |
| 15 to 19 Minutes | 15,301 (12.2%) | 14,227 (12.1%) |
| 20 to 24 Minutes | 16,239 (12.9%) | 17,238 (14.7%) |
| 25 to 29 Minutes | 8,372 (6.7%) | 7,625 (6.5%) |
| 30 to 34 Minutes | 20,234 (16.1%) | 17,406 (14.8%) |
| 35 to 39 Minutes | 5,339 (4.3%) | 5,096 (4.3%) |
| 40 to 44 Minutes | 7,344 (5.8%) | 6,264 (5.3%) |
| 45 to 59 Minutes | 16,833 (13.4%) | 13,567 (11.6%) |
| 60 to 89 Minutes | 9,564 (7.6%) | 7,189 (6.1%) |
| 90 or more Minutes | 2,642 (2.1%) | 2,035 (1.7%) |
Time of Departure to Work by Sex in Delaware County
The most frequent times of departure to work in Delaware County are 7:00 AM to 7:29 AM (19,616, 15.6%) for males and 8:00 AM to 8:29 AM (16,861, 14.3%) for females.
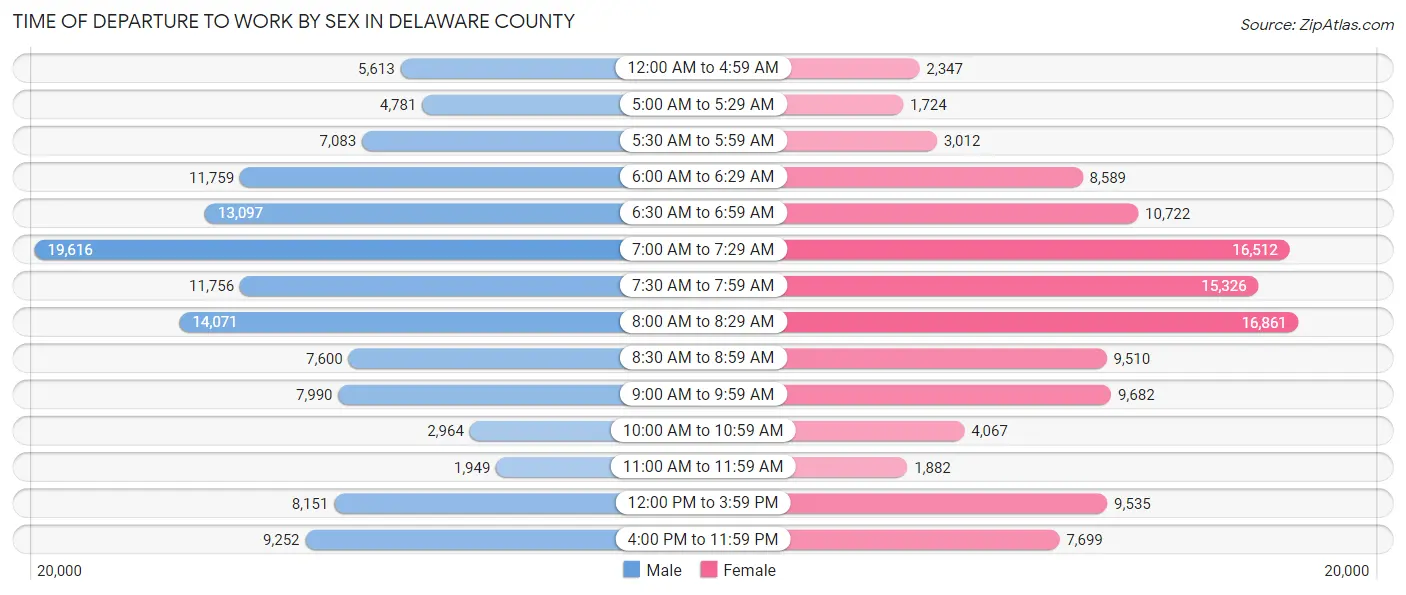
| Time of Departure | Male | Female |
| 12:00 AM to 4:59 AM | 5,613 (4.5%) | 2,347 (2.0%) |
| 5:00 AM to 5:29 AM | 4,781 (3.8%) | 1,724 (1.5%) |
| 5:30 AM to 5:59 AM | 7,083 (5.6%) | 3,012 (2.6%) |
| 6:00 AM to 6:29 AM | 11,759 (9.4%) | 8,589 (7.3%) |
| 6:30 AM to 6:59 AM | 13,097 (10.4%) | 10,722 (9.1%) |
| 7:00 AM to 7:29 AM | 19,616 (15.6%) | 16,512 (14.1%) |
| 7:30 AM to 7:59 AM | 11,756 (9.3%) | 15,326 (13.1%) |
| 8:00 AM to 8:29 AM | 14,071 (11.2%) | 16,861 (14.3%) |
| 8:30 AM to 8:59 AM | 7,600 (6.0%) | 9,510 (8.1%) |
| 9:00 AM to 9:59 AM | 7,990 (6.4%) | 9,682 (8.2%) |
| 10:00 AM to 10:59 AM | 2,964 (2.4%) | 4,067 (3.5%) |
| 11:00 AM to 11:59 AM | 1,949 (1.5%) | 1,882 (1.6%) |
| 12:00 PM to 3:59 PM | 8,151 (6.5%) | 9,535 (8.1%) |
| 4:00 PM to 11:59 PM | 9,252 (7.4%) | 7,699 (6.6%) |
| Total | 125,682 (100.0%) | 117,468 (100.0%) |
Housing Occupancy in Delaware County
Occupancy by Ownership in Delaware County
Of the total 215,833 dwellings in Delaware County, owner-occupied units account for 148,649 (68.9%), while renter-occupied units make up 67,184 (31.1%).
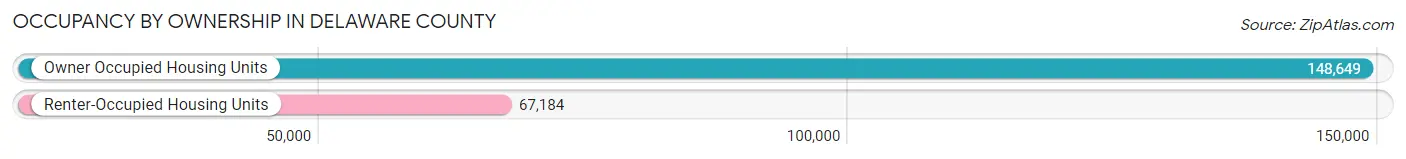
| Occupancy | # Housing Units | % Housing Units |
| Owner Occupied Housing Units | 148,649 | 68.9% |
| Renter-Occupied Housing Units | 67,184 | 31.1% |
| Total Occupied Housing Units | 215,833 | 100.0% |
Occupancy by Household Size in Delaware County
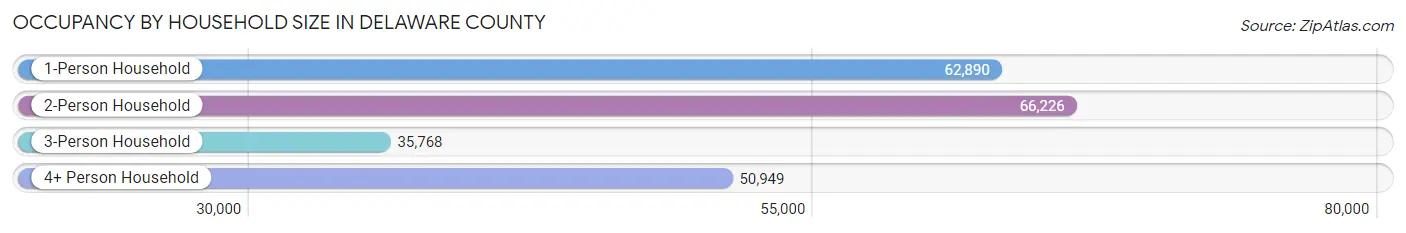
| Household Size | # Housing Units | % Housing Units |
| 1-Person Household | 62,890 | 29.1% |
| 2-Person Household | 66,226 | 30.7% |
| 3-Person Household | 35,768 | 16.6% |
| 4+ Person Household | 50,949 | 23.6% |
| Total Housing Units | 215,833 | 100.0% |
Occupancy by Ownership by Household Size in Delaware County
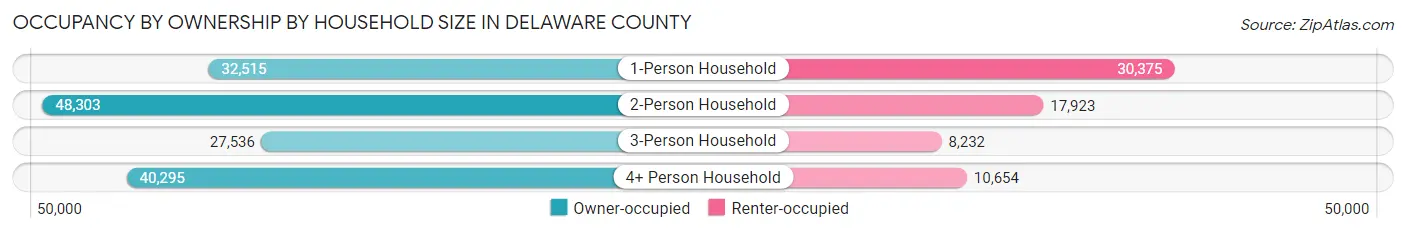
| Household Size | Owner-occupied | Renter-occupied |
| 1-Person Household | 32,515 (51.7%) | 30,375 (48.3%) |
| 2-Person Household | 48,303 (72.9%) | 17,923 (27.1%) |
| 3-Person Household | 27,536 (77.0%) | 8,232 (23.0%) |
| 4+ Person Household | 40,295 (79.1%) | 10,654 (20.9%) |
| Total Housing Units | 148,649 (68.9%) | 67,184 (31.1%) |
Occupancy by Educational Attainment in Delaware County
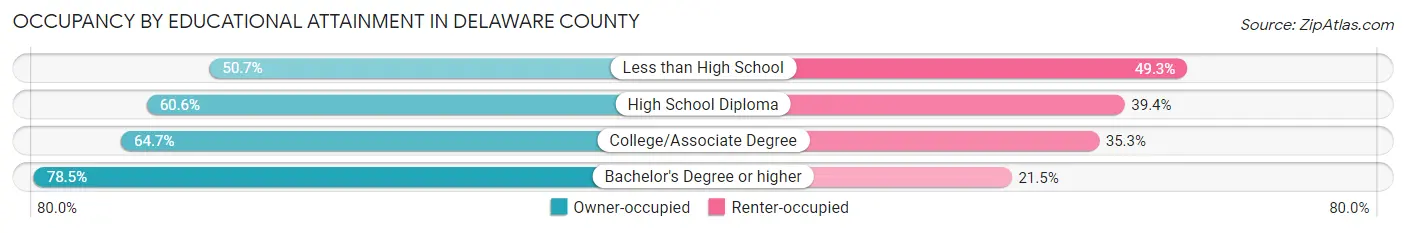
| Household Size | Owner-occupied | Renter-occupied |
| Less than High School | 5,941 (50.7%) | 5,780 (49.3%) |
| High School Diploma | 33,167 (60.6%) | 21,533 (39.4%) |
| College/Associate Degree | 36,461 (64.7%) | 19,902 (35.3%) |
| Bachelor's Degree or higher | 73,080 (78.5%) | 19,969 (21.5%) |
Occupancy by Age of Householder in Delaware County
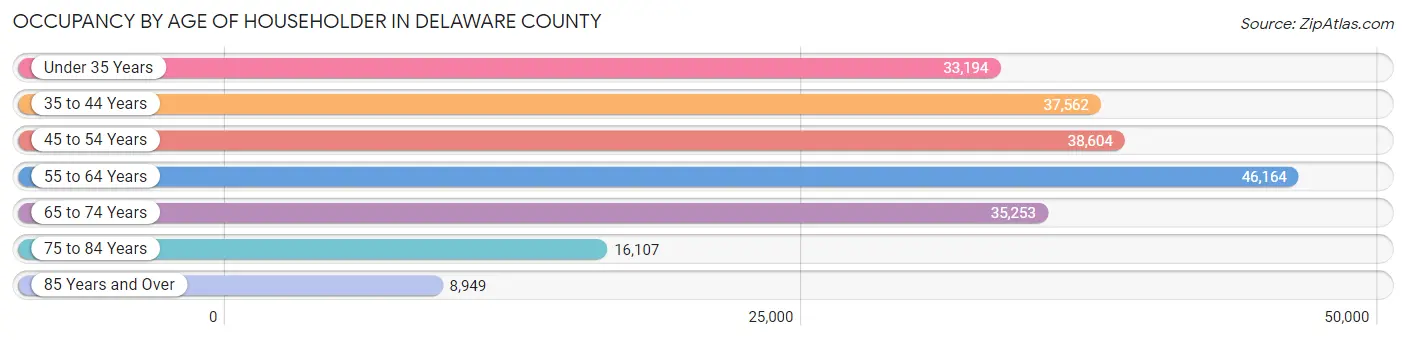
| Age Bracket | # Households | % Households |
| Under 35 Years | 33,194 | 15.4% |
| 35 to 44 Years | 37,562 | 17.4% |
| 45 to 54 Years | 38,604 | 17.9% |
| 55 to 64 Years | 46,164 | 21.4% |
| 65 to 74 Years | 35,253 | 16.3% |
| 75 to 84 Years | 16,107 | 7.5% |
| 85 Years and Over | 8,949 | 4.2% |
| Total | 215,833 | 100.0% |
Housing Finances in Delaware County
Median Income by Occupancy in Delaware County
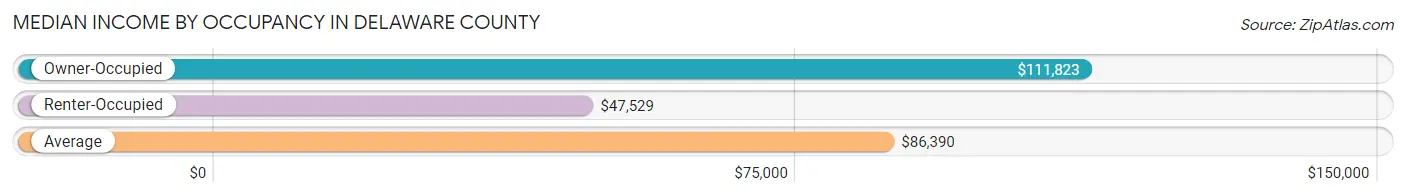
| Occupancy Type | # Households | Median Income |
| Owner-Occupied | 148,649 (68.9%) | $111,823 |
| Renter-Occupied | 67,184 (31.1%) | $47,529 |
| Average | 215,833 (100.0%) | $86,390 |
Occupancy by Householder Income Bracket in Delaware County
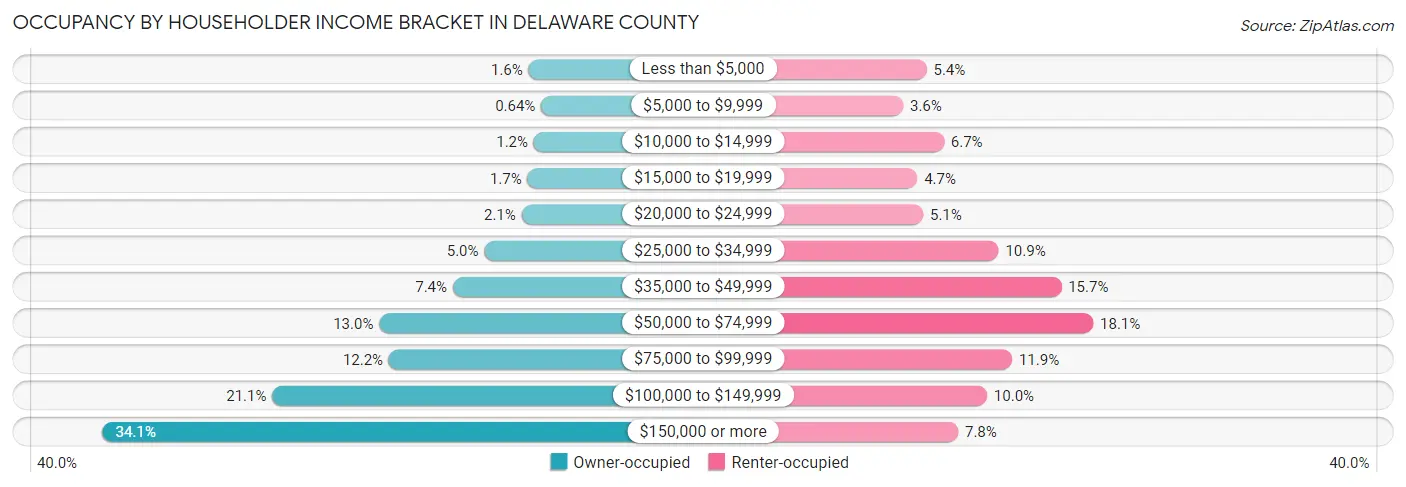
| Income Bracket | Owner-occupied | Renter-occupied |
| Less than $5,000 | 2,374 (1.6%) | 3,636 (5.4%) |
| $5,000 to $9,999 | 946 (0.6%) | 2,432 (3.6%) |
| $10,000 to $14,999 | 1,784 (1.2%) | 4,520 (6.7%) |
| $15,000 to $19,999 | 2,504 (1.7%) | 3,158 (4.7%) |
| $20,000 to $24,999 | 3,160 (2.1%) | 3,454 (5.1%) |
| $25,000 to $34,999 | 7,389 (5.0%) | 7,316 (10.9%) |
| $35,000 to $49,999 | 10,959 (7.4%) | 10,528 (15.7%) |
| $50,000 to $74,999 | 19,292 (13.0%) | 12,163 (18.1%) |
| $75,000 to $99,999 | 18,202 (12.2%) | 8,006 (11.9%) |
| $100,000 to $149,999 | 31,412 (21.1%) | 6,724 (10.0%) |
| $150,000 or more | 50,627 (34.1%) | 5,247 (7.8%) |
| Total | 148,649 (100.0%) | 67,184 (100.0%) |
Monthly Housing Cost Tiers in Delaware County
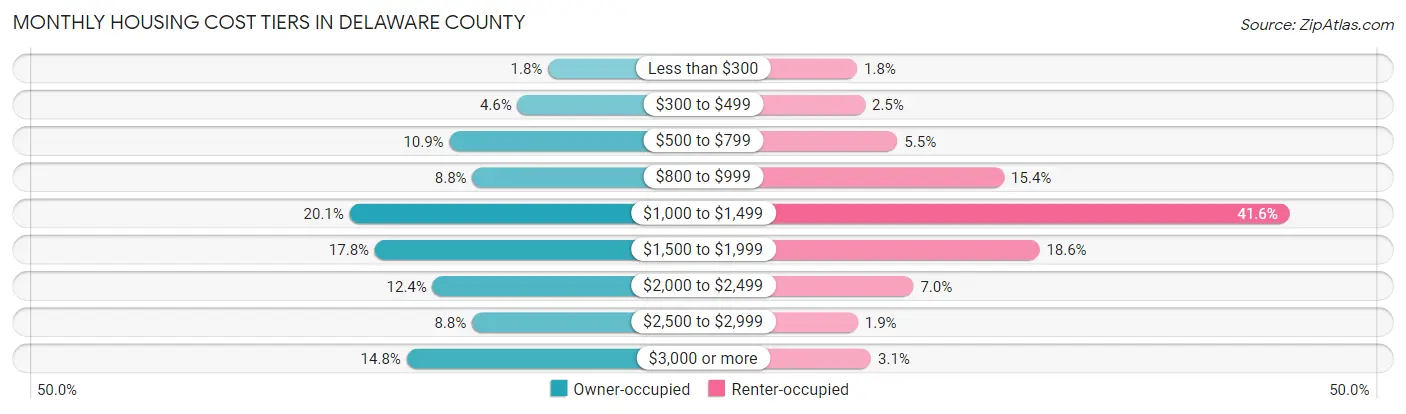
| Monthly Cost | Owner-occupied | Renter-occupied |
| Less than $300 | 2,680 (1.8%) | 1,214 (1.8%) |
| $300 to $499 | 6,868 (4.6%) | 1,707 (2.5%) |
| $500 to $799 | 16,192 (10.9%) | 3,706 (5.5%) |
| $800 to $999 | 13,040 (8.8%) | 10,313 (15.3%) |
| $1,000 to $1,499 | 29,843 (20.1%) | 27,960 (41.6%) |
| $1,500 to $1,999 | 26,385 (17.7%) | 12,494 (18.6%) |
| $2,000 to $2,499 | 18,499 (12.4%) | 4,704 (7.0%) |
| $2,500 to $2,999 | 13,091 (8.8%) | 1,265 (1.9%) |
| $3,000 or more | 22,051 (14.8%) | 2,086 (3.1%) |
| Total | 148,649 (100.0%) | 67,184 (100.0%) |
Physical Housing Characteristics in Delaware County
Housing Structures in Delaware County
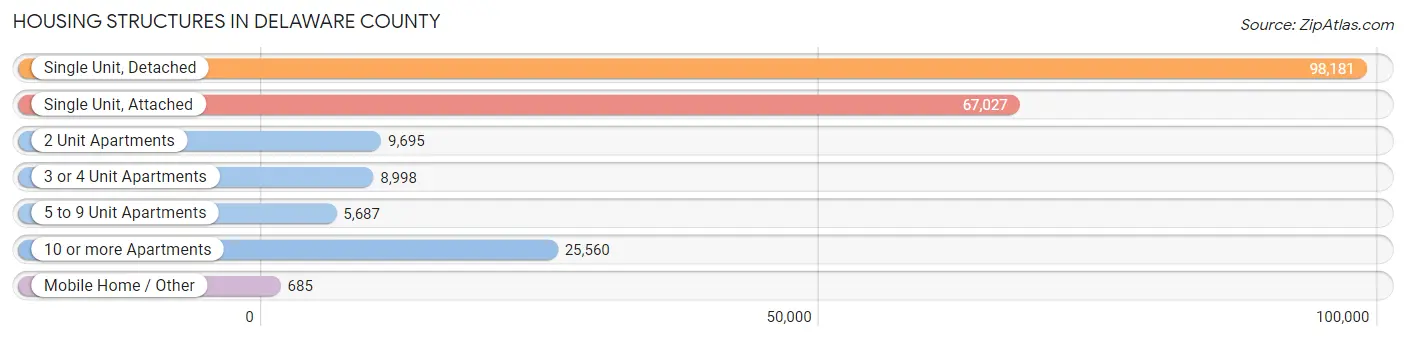
| Structure Type | # Housing Units | % Housing Units |
| Single Unit, Detached | 98,181 | 45.5% |
| Single Unit, Attached | 67,027 | 31.1% |
| 2 Unit Apartments | 9,695 | 4.5% |
| 3 or 4 Unit Apartments | 8,998 | 4.2% |
| 5 to 9 Unit Apartments | 5,687 | 2.6% |
| 10 or more Apartments | 25,560 | 11.8% |
| Mobile Home / Other | 685 | 0.3% |
| Total | 215,833 | 100.0% |
Housing Structures by Occupancy in Delaware County
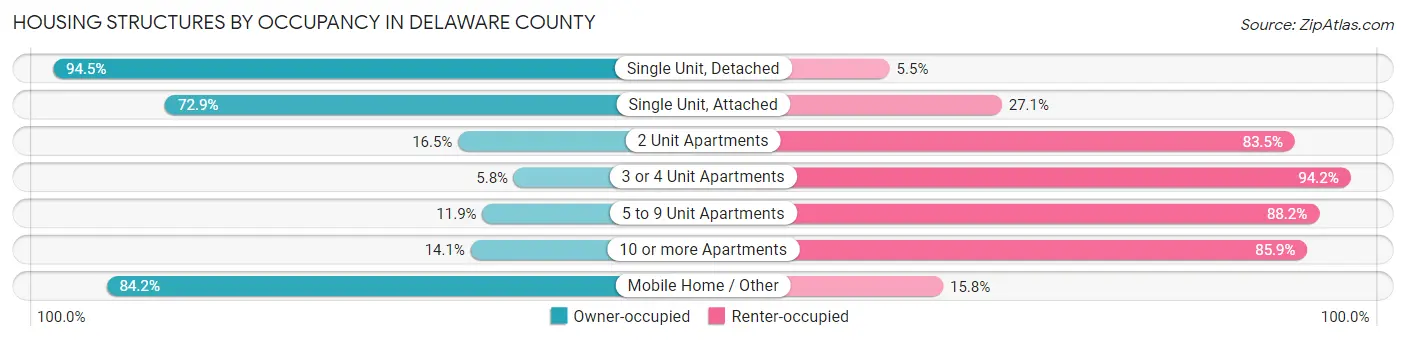
| Structure Type | Owner-occupied | Renter-occupied |
| Single Unit, Detached | 92,786 (94.5%) | 5,395 (5.5%) |
| Single Unit, Attached | 48,883 (72.9%) | 18,144 (27.1%) |
| 2 Unit Apartments | 1,602 (16.5%) | 8,093 (83.5%) |
| 3 or 4 Unit Apartments | 520 (5.8%) | 8,478 (94.2%) |
| 5 to 9 Unit Apartments | 674 (11.8%) | 5,013 (88.1%) |
| 10 or more Apartments | 3,607 (14.1%) | 21,953 (85.9%) |
| Mobile Home / Other | 577 (84.2%) | 108 (15.8%) |
| Total | 148,649 (68.9%) | 67,184 (31.1%) |
Housing Structures by Number of Rooms in Delaware County
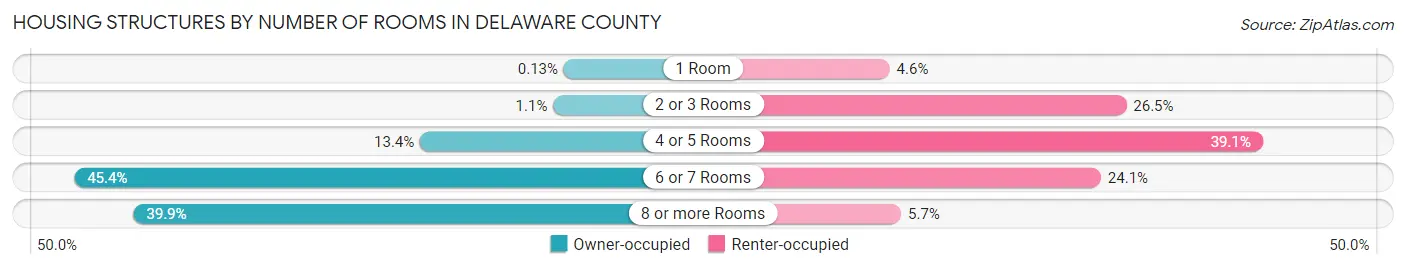
| Number of Rooms | Owner-occupied | Renter-occupied |
| 1 Room | 195 (0.1%) | 3,092 (4.6%) |
| 2 or 3 Rooms | 1,643 (1.1%) | 17,799 (26.5%) |
| 4 or 5 Rooms | 19,948 (13.4%) | 26,272 (39.1%) |
| 6 or 7 Rooms | 67,500 (45.4%) | 16,220 (24.1%) |
| 8 or more Rooms | 59,363 (39.9%) | 3,801 (5.7%) |
| Total | 148,649 (100.0%) | 67,184 (100.0%) |
Housing Structure by Heating Type in Delaware County
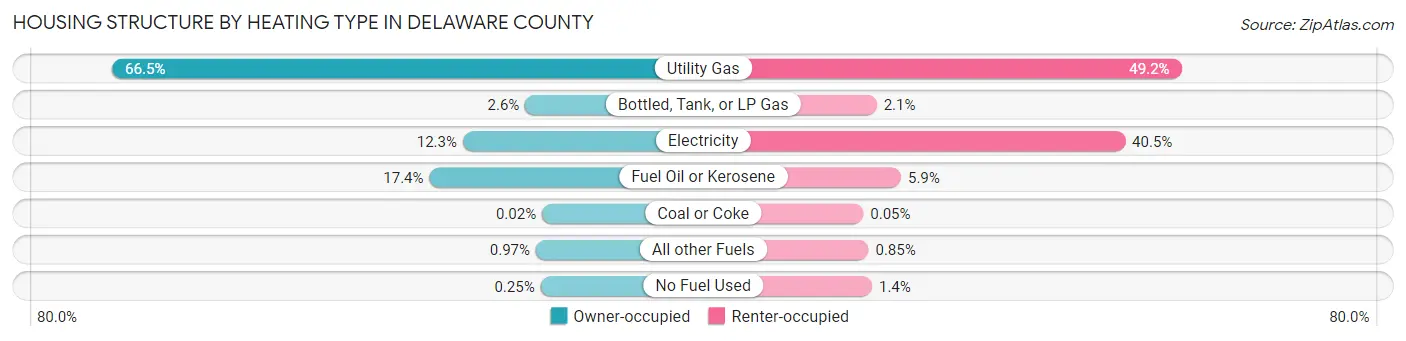
| Heating Type | Owner-occupied | Renter-occupied |
| Utility Gas | 98,788 (66.5%) | 33,061 (49.2%) |
| Bottled, Tank, or LP Gas | 3,891 (2.6%) | 1,415 (2.1%) |
| Electricity | 18,220 (12.3%) | 27,223 (40.5%) |
| Fuel Oil or Kerosene | 25,905 (17.4%) | 3,941 (5.9%) |
| Coal or Coke | 32 (0.0%) | 34 (0.1%) |
| All other Fuels | 1,443 (1.0%) | 574 (0.9%) |
| No Fuel Used | 370 (0.3%) | 936 (1.4%) |
| Total | 148,649 (100.0%) | 67,184 (100.0%) |
Household Vehicle Usage in Delaware County
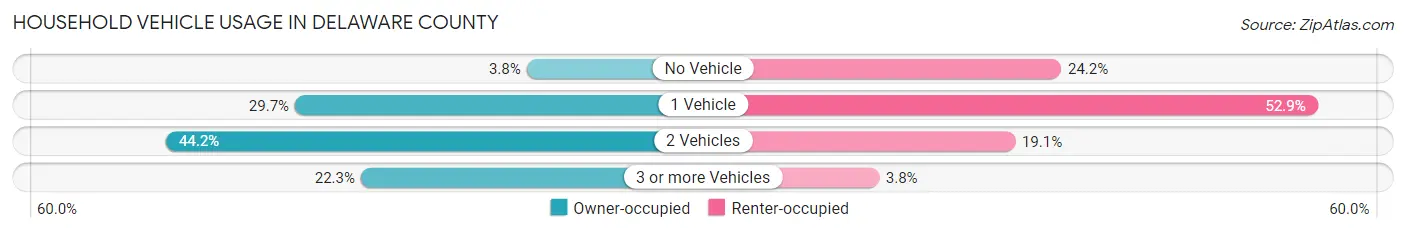
| Vehicles per Household | Owner-occupied | Renter-occupied |
| No Vehicle | 5,610 (3.8%) | 16,268 (24.2%) |
| 1 Vehicle | 44,181 (29.7%) | 35,566 (52.9%) |
| 2 Vehicles | 65,650 (44.2%) | 12,798 (19.1%) |
| 3 or more Vehicles | 33,208 (22.3%) | 2,552 (3.8%) |
| Total | 148,649 (100.0%) | 67,184 (100.0%) |
Real Estate & Mortgages in Delaware County
Real Estate and Mortgage Overview in Delaware County
| Characteristic | Without Mortgage | With Mortgage |
| Housing Units | 52,218 | 96,431 |
| Median Property Value | $270,700 | $300,200 |
| Median Household Income | $80,624 | $39,119 |
| Monthly Housing Costs | $843 | $21,441 |
| Real Estate Taxes | $5,541 | $995 |
Property Value by Mortgage Status in Delaware County
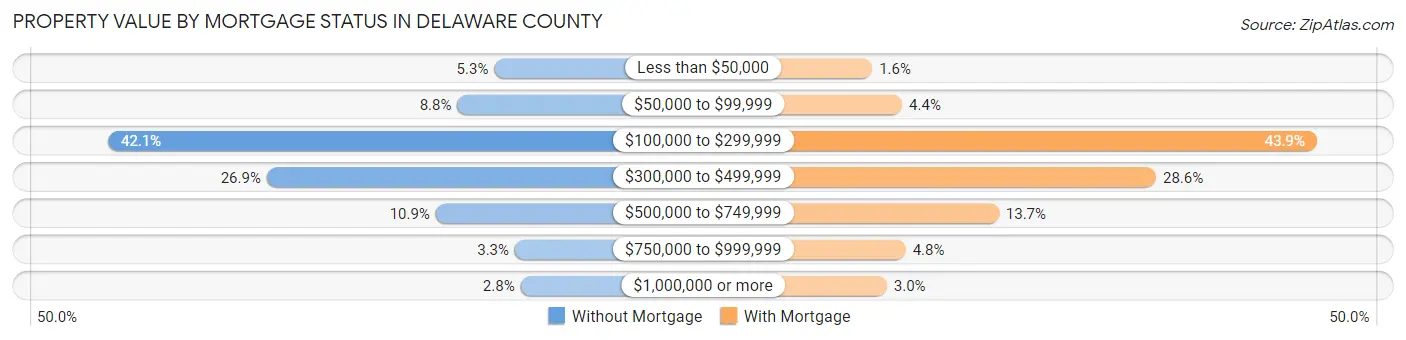
| Property Value | Without Mortgage | With Mortgage |
| Less than $50,000 | 2,754 (5.3%) | 1,537 (1.6%) |
| $50,000 to $99,999 | 4,590 (8.8%) | 4,278 (4.4%) |
| $100,000 to $299,999 | 21,965 (42.1%) | 42,365 (43.9%) |
| $300,000 to $499,999 | 14,068 (26.9%) | 27,602 (28.6%) |
| $500,000 to $749,999 | 5,667 (10.8%) | 13,163 (13.7%) |
| $750,000 to $999,999 | 1,729 (3.3%) | 4,613 (4.8%) |
| $1,000,000 or more | 1,445 (2.8%) | 2,873 (3.0%) |
| Total | 52,218 (100.0%) | 96,431 (100.0%) |
Household Income by Mortgage Status in Delaware County
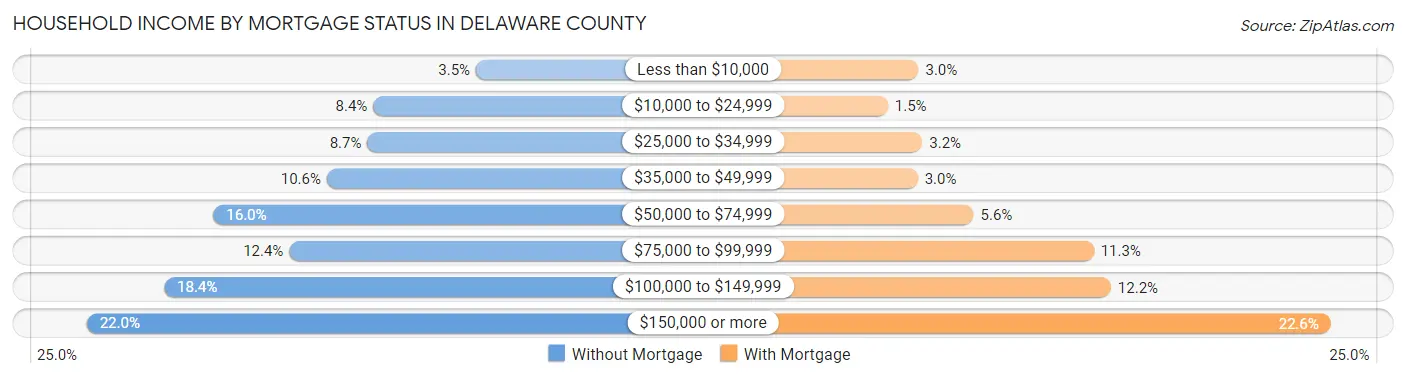
| Household Income | Without Mortgage | With Mortgage |
| Less than $10,000 | 1,832 (3.5%) | 2,889 (3.0%) |
| $10,000 to $24,999 | 4,385 (8.4%) | 1,488 (1.5%) |
| $25,000 to $34,999 | 4,534 (8.7%) | 3,063 (3.2%) |
| $35,000 to $49,999 | 5,541 (10.6%) | 2,855 (3.0%) |
| $50,000 to $74,999 | 8,358 (16.0%) | 5,418 (5.6%) |
| $75,000 to $99,999 | 6,474 (12.4%) | 10,934 (11.3%) |
| $100,000 to $149,999 | 9,586 (18.4%) | 11,728 (12.2%) |
| $150,000 or more | 11,508 (22.0%) | 21,826 (22.6%) |
| Total | 52,218 (100.0%) | 96,431 (100.0%) |
Property Value to Household Income Ratio in Delaware County
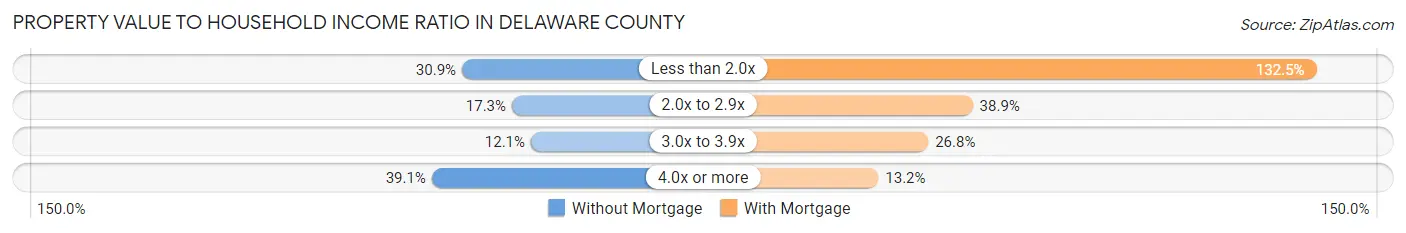
| Value-to-Income Ratio | Without Mortgage | With Mortgage |
| Less than 2.0x | 16,122 (30.9%) | 127,792 (132.5%) |
| 2.0x to 2.9x | 9,011 (17.3%) | 37,495 (38.9%) |
| 3.0x to 3.9x | 6,312 (12.1%) | 25,826 (26.8%) |
| 4.0x or more | 20,416 (39.1%) | 12,727 (13.2%) |
| Total | 52,218 (100.0%) | 96,431 (100.0%) |
Real Estate Taxes by Mortgage Status in Delaware County

| Property Taxes | Without Mortgage | With Mortgage |
| Less than $800 | 3,558 (6.8%) | 326 (0.3%) |
| $800 to $1,499 | 3,829 (7.3%) | 2,704 (2.8%) |
| $800 to $1,499 | 43,344 (83.0%) | 3,825 (4.0%) |
| Total | 52,218 (100.0%) | 96,431 (100.0%) |
Health & Disability in Delaware County
Health Insurance Coverage by Age in Delaware County
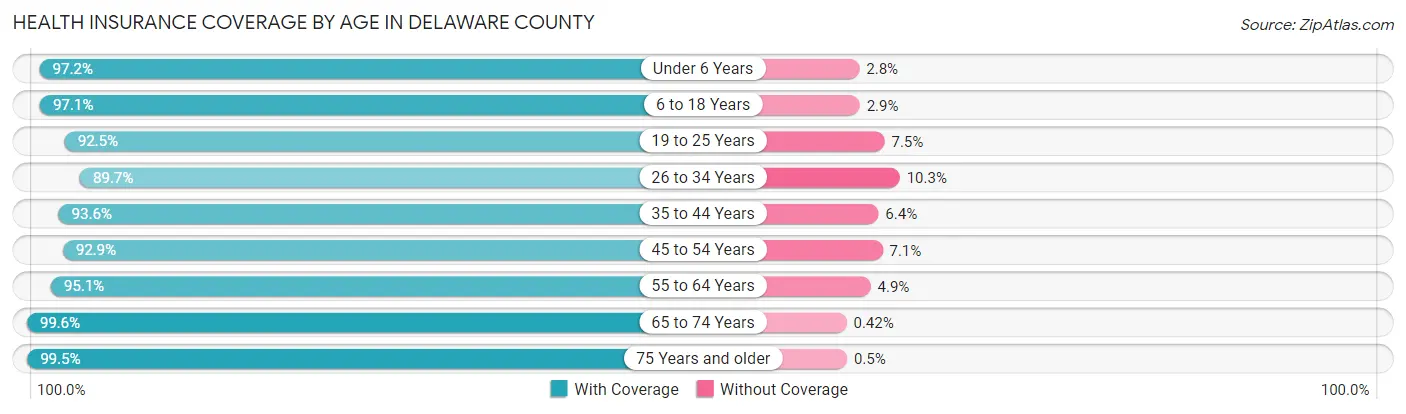
| Age Bracket | With Coverage | Without Coverage |
| Under 6 Years | 38,278 (97.2%) | 1,108 (2.8%) |
| 6 to 18 Years | 93,195 (97.1%) | 2,762 (2.9%) |
| 19 to 25 Years | 49,849 (92.5%) | 4,047 (7.5%) |
| 26 to 34 Years | 59,632 (89.7%) | 6,874 (10.3%) |
| 35 to 44 Years | 67,390 (93.6%) | 4,574 (6.4%) |
| 45 to 54 Years | 64,421 (92.9%) | 4,946 (7.1%) |
| 55 to 64 Years | 74,423 (95.1%) | 3,846 (4.9%) |
| 65 to 74 Years | 55,236 (99.6%) | 234 (0.4%) |
| 75 Years and older | 37,320 (99.5%) | 189 (0.5%) |
| Total | 539,744 (95.0%) | 28,580 (5.0%) |
Health Insurance Coverage by Citizenship Status in Delaware County
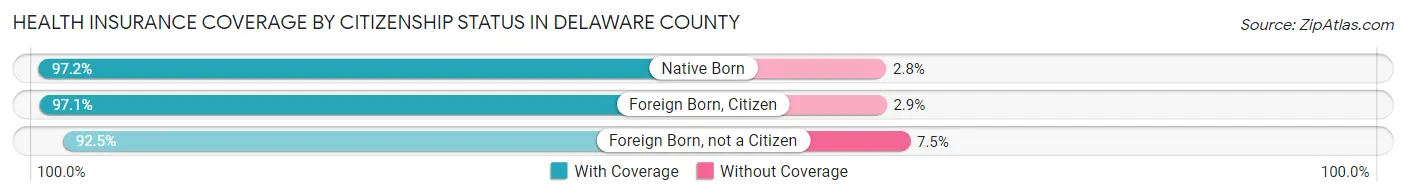
| Citizenship Status | With Coverage | Without Coverage |
| Native Born | 38,278 (97.2%) | 1,108 (2.8%) |
| Foreign Born, Citizen | 93,195 (97.1%) | 2,762 (2.9%) |
| Foreign Born, not a Citizen | 49,849 (92.5%) | 4,047 (7.5%) |
Health Insurance Coverage by Household Income in Delaware County
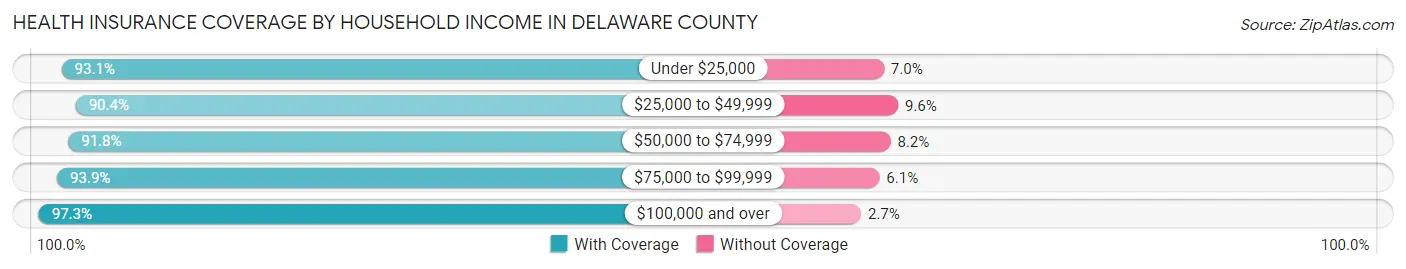
| Household Income | With Coverage | Without Coverage |
| Under $25,000 | 43,374 (93.0%) | 3,240 (7.0%) |
| $25,000 to $49,999 | 65,639 (90.4%) | 6,965 (9.6%) |
| $50,000 to $74,999 | 66,608 (91.8%) | 5,951 (8.2%) |
| $75,000 to $99,999 | 62,776 (93.9%) | 4,083 (6.1%) |
| $100,000 and over | 286,378 (97.3%) | 7,866 (2.7%) |
Public vs Private Health Insurance Coverage by Age in Delaware County
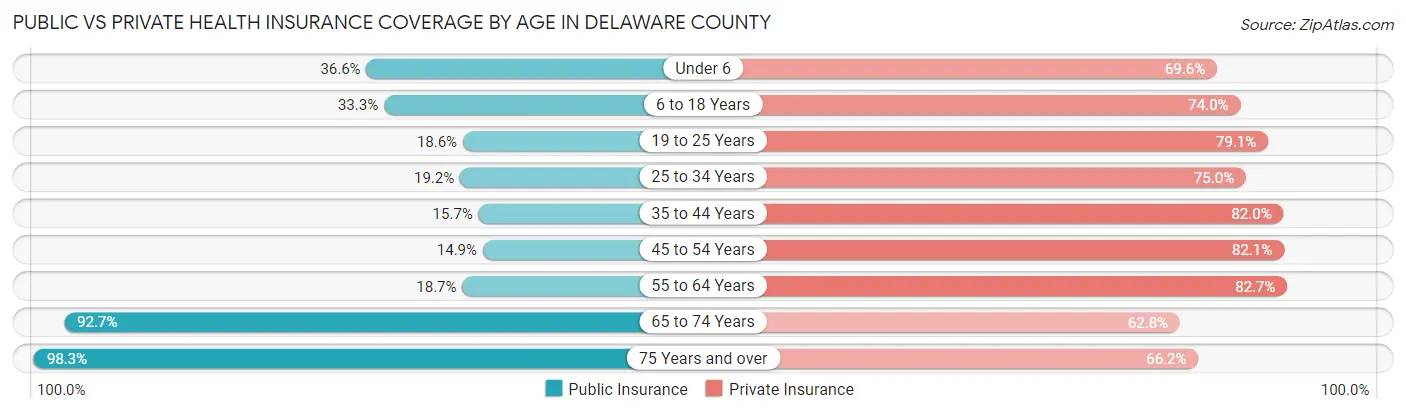
| Age Bracket | Public Insurance | Private Insurance |
| Under 6 | 14,397 (36.5%) | 27,428 (69.6%) |
| 6 to 18 Years | 31,943 (33.3%) | 70,986 (74.0%) |
| 19 to 25 Years | 10,044 (18.6%) | 42,640 (79.1%) |
| 25 to 34 Years | 12,752 (19.2%) | 49,891 (75.0%) |
| 35 to 44 Years | 11,315 (15.7%) | 58,999 (82.0%) |
| 45 to 54 Years | 10,366 (14.9%) | 56,944 (82.1%) |
| 55 to 64 Years | 14,664 (18.7%) | 64,726 (82.7%) |
| 65 to 74 Years | 51,401 (92.7%) | 34,808 (62.7%) |
| 75 Years and over | 36,863 (98.3%) | 24,815 (66.2%) |
| Total | 193,745 (34.1%) | 431,237 (75.9%) |
Disability Status by Sex by Age in Delaware County
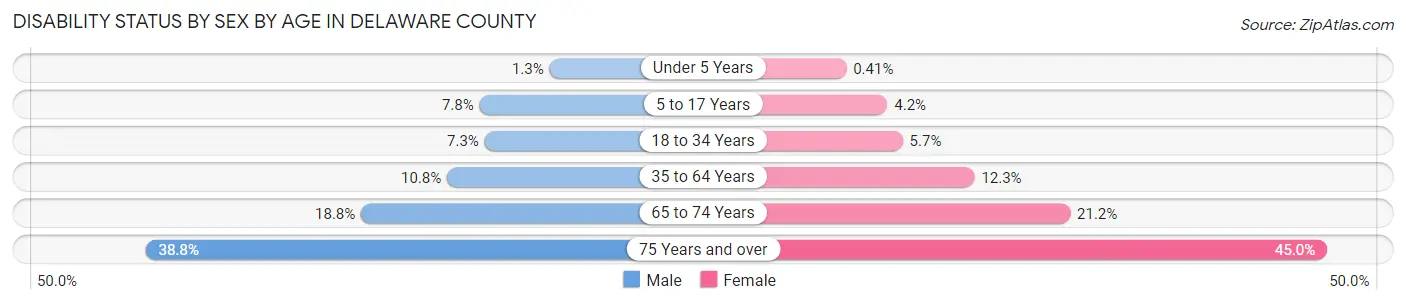
| Age Bracket | Male | Female |
| Under 5 Years | 217 (1.3%) | 65 (0.4%) |
| 5 to 17 Years | 3,690 (7.8%) | 1,920 (4.2%) |
| 18 to 34 Years | 4,667 (7.3%) | 3,728 (5.7%) |
| 35 to 64 Years | 11,477 (10.8%) | 13,934 (12.3%) |
| 65 to 74 Years | 4,815 (18.8%) | 6,318 (21.2%) |
| 75 Years and over | 5,701 (38.8%) | 10,272 (45.0%) |
Disability Class by Sex by Age in Delaware County
Disability Class: Hearing Difficulty
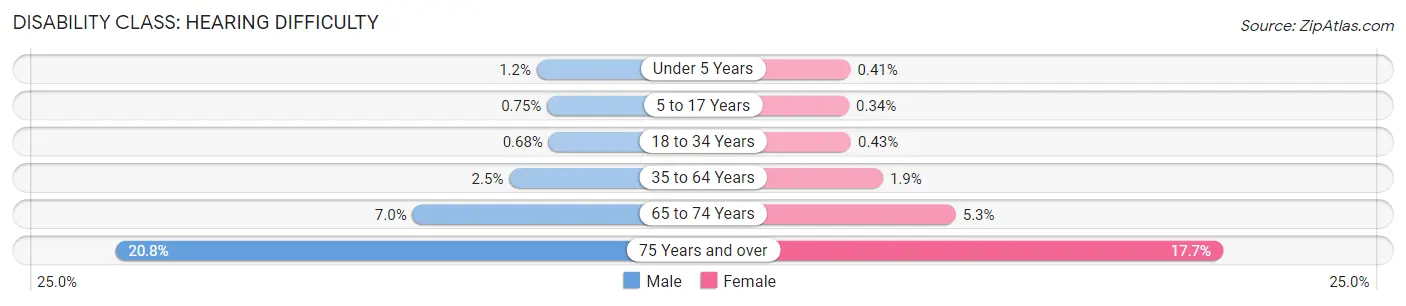
| Age Bracket | Male | Female |
| Under 5 Years | 208 (1.2%) | 65 (0.4%) |
| 5 to 17 Years | 354 (0.7%) | 153 (0.3%) |
| 18 to 34 Years | 433 (0.7%) | 284 (0.4%) |
| 35 to 64 Years | 2,666 (2.5%) | 2,157 (1.9%) |
| 65 to 74 Years | 1,795 (7.0%) | 1,577 (5.3%) |
| 75 Years and over | 3,057 (20.8%) | 4,032 (17.7%) |
Disability Class: Vision Difficulty
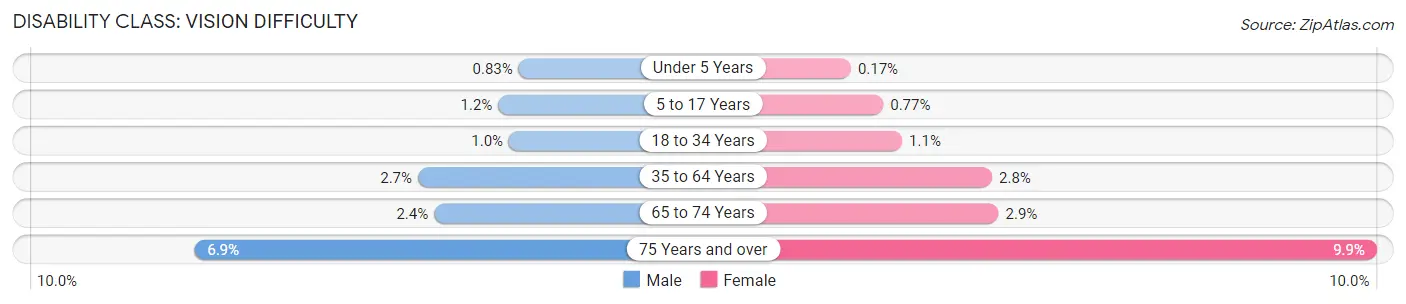
| Age Bracket | Male | Female |
| Under 5 Years | 141 (0.8%) | 27 (0.2%) |
| 5 to 17 Years | 572 (1.2%) | 351 (0.8%) |
| 18 to 34 Years | 644 (1.0%) | 741 (1.1%) |
| 35 to 64 Years | 2,868 (2.7%) | 3,159 (2.8%) |
| 65 to 74 Years | 615 (2.4%) | 867 (2.9%) |
| 75 Years and over | 1,007 (6.9%) | 2,264 (9.9%) |
Disability Class: Cognitive Difficulty
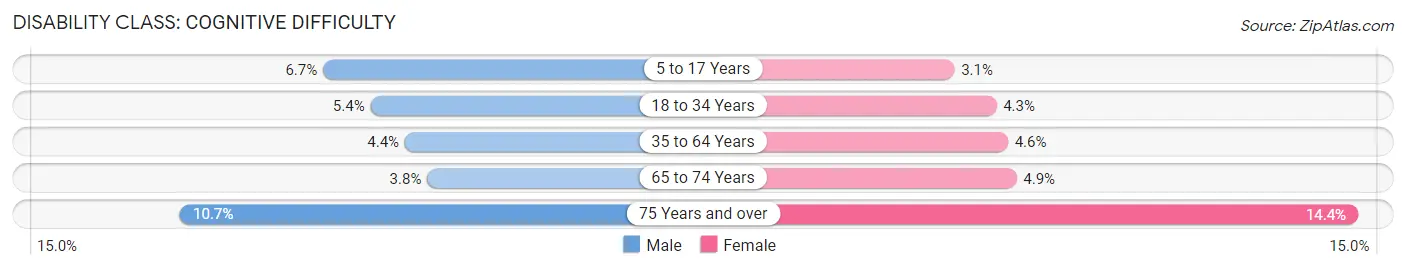
| Age Bracket | Male | Female |
| 5 to 17 Years | 3,172 (6.7%) | 1,421 (3.1%) |
| 18 to 34 Years | 3,429 (5.4%) | 2,835 (4.3%) |
| 35 to 64 Years | 4,690 (4.4%) | 5,233 (4.6%) |
| 65 to 74 Years | 971 (3.8%) | 1,449 (4.9%) |
| 75 Years and over | 1,569 (10.7%) | 3,276 (14.4%) |
Disability Class: Ambulatory Difficulty
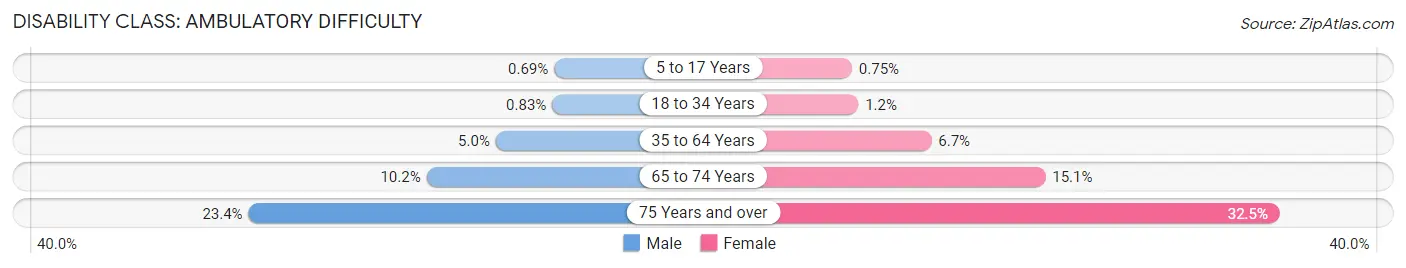
| Age Bracket | Male | Female |
| 5 to 17 Years | 328 (0.7%) | 343 (0.7%) |
| 18 to 34 Years | 529 (0.8%) | 802 (1.2%) |
| 35 to 64 Years | 5,345 (5.0%) | 7,528 (6.7%) |
| 65 to 74 Years | 2,605 (10.2%) | 4,506 (15.1%) |
| 75 Years and over | 3,438 (23.4%) | 7,417 (32.5%) |
Disability Class: Self-Care Difficulty
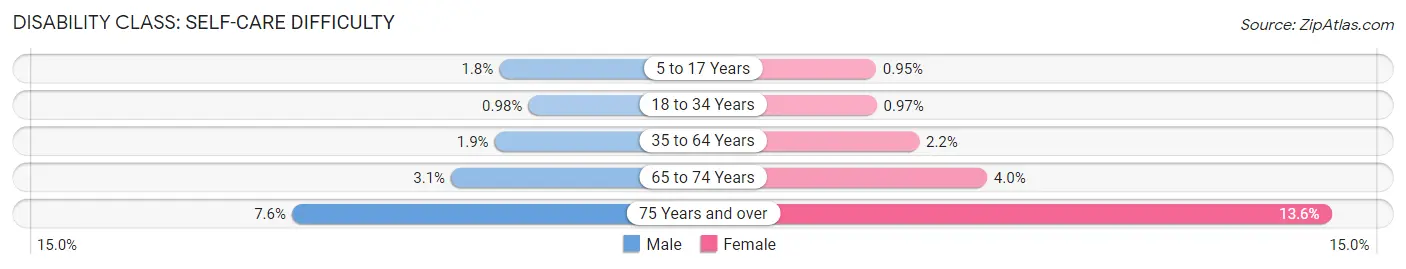
| Age Bracket | Male | Female |
| 5 to 17 Years | 848 (1.8%) | 432 (0.9%) |
| 18 to 34 Years | 626 (1.0%) | 642 (1.0%) |
| 35 to 64 Years | 2,045 (1.9%) | 2,431 (2.1%) |
| 65 to 74 Years | 803 (3.1%) | 1,204 (4.0%) |
| 75 Years and over | 1,111 (7.6%) | 3,109 (13.6%) |
Technology Access in Delaware County
Computing Device Access in Delaware County
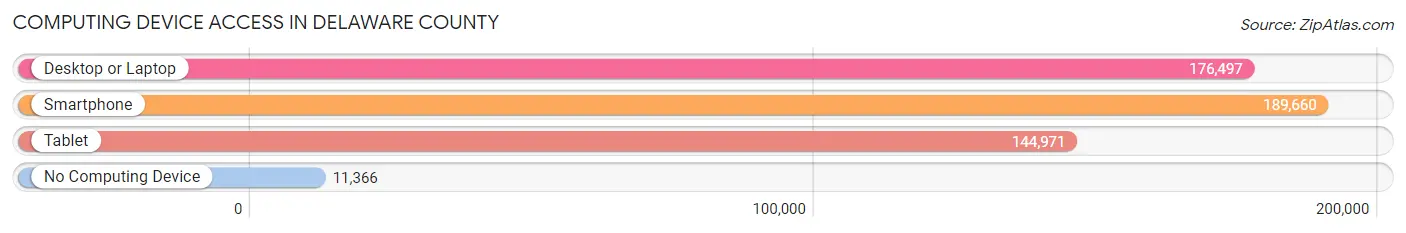
| Device Type | # Households | % Households |
| Desktop or Laptop | 176,497 | 81.8% |
| Smartphone | 189,660 | 87.9% |
| Tablet | 144,971 | 67.2% |
| No Computing Device | 11,366 | 5.3% |
| Total | 215,833 | 100.0% |
Internet Access in Delaware County
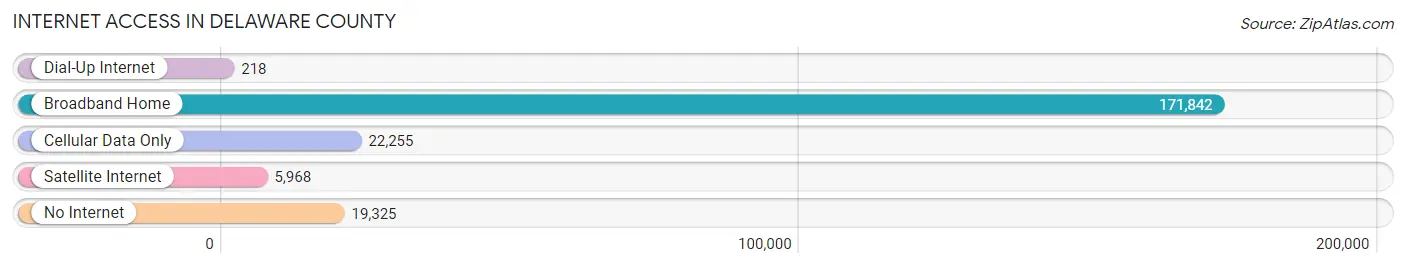
| Internet Type | # Households | % Households |
| Dial-Up Internet | 218 | 0.1% |
| Broadband Home | 171,842 | 79.6% |
| Cellular Data Only | 22,255 | 10.3% |
| Satellite Internet | 5,968 | 2.8% |
| No Internet | 19,325 | 8.9% |
| Total | 215,833 | 100.0% |
Delaware County Summary
Delaware County, Pennsylvania is located in the southeastern corner of the state and is part of the Philadelphia metropolitan area. It is the fifth most populous county in Pennsylvania, with a population of 558,979 as of the 2010 census. The county seat is Media, and the largest city is Chester.
History
Delaware County was formed in 1789 from part of Chester County. It was named after the Delaware River, which forms its eastern border. The county was originally part of the Province of Pennsylvania, and was part of the original three counties of Pennsylvania.
The county was home to many prominent figures in American history, including William Penn, who founded Pennsylvania in 1681. The county was also home to the first paper mill in the United States, which was established in 1719.
Geography
Delaware County is located in the southeastern corner of Pennsylvania, and is bordered by Philadelphia County to the north, Montgomery County to the west, Chester County to the southwest, and New Castle County, Delaware to the south and east. The county covers an area of 191 square miles, and is mostly flat, with some rolling hills in the northern and western parts of the county.
The county is drained by the Delaware River, which forms its eastern border, and by the Schuylkill River, which forms its western border. The county is home to several parks, including Ridley Creek State Park, John Heinz National Wildlife Refuge at Tinicum, and Tyler Arboretum.
Economy
Delaware County has a diverse economy, with a mix of manufacturing, retail, and service industries. The county is home to several major employers, including Boeing, Sunoco, and the Philadelphia International Airport.
The county is also home to several colleges and universities, including Widener University, Swarthmore College, and Villanova University.
Demographics
As of the 2010 census, Delaware County had a population of 558,979. The racial makeup of the county was 79.3% White, 14.2% African American, 0.3% Native American, 2.7% Asian, and 3.5% from other races. Hispanic or Latino of any race were 6.2% of the population.
The median household income in the county was $60,879, and the median family income was $71,919. The per capita income was $30,945. About 8.7% of the population was below the poverty line.
Delaware County is home to a large number of immigrants, with about 15.3% of the population being foreign-born. The largest ancestry groups in the county are Irish (17.3%), German (14.7%), Italian (10.2%), and Polish (7.2%).
Common Questions
What is Per Capita Income in Delaware County?
Per Capita income in Delaware County is $46,926.
What is the Median Family Income in Delaware County?
Median Family Income in Delaware County is $112,011.
What is the Median Household income in Delaware County?
Median Household Income in Delaware County is $86,390.
What is Income or Wage Gap in Delaware County?
Income or Wage Gap in Delaware County is 25.5%.
Women in Delaware County earn 74.5 cents for every dollar earned by a man.
What is Family Income Deficit in Delaware County?
Family Income Deficit in Delaware County is $11,031.
Families that are below poverty line in Delaware County earn $11,031 less on average than the poverty threshold level.
What is Inequality or Gini Index in Delaware County?
Inequality or Gini Index in Delaware County is 0.48.
What is the Total Population of Delaware County?
Total Population of Delaware County is 575,312.
What is the Total Male Population of Delaware County?
Total Male Population of Delaware County is 279,037.
What is the Total Female Population of Delaware County?
Total Female Population of Delaware County is 296,275.
What is the Ratio of Males per 100 Females in Delaware County?
There are 94.18 Males per 100 Females in Delaware County.
What is the Ratio of Females per 100 Males in Delaware County?
There are 106.18 Females per 100 Males in Delaware County.
What is the Median Population Age in Delaware County?
Median Population Age in Delaware County is 39.0 Years.
What is the Average Family Size in Delaware County
Average Family Size in Delaware County is 3.2 People.
What is the Average Household Size in Delaware County
Average Household Size in Delaware County is 2.6 People.
How Large is the Labor Force in Delaware County?
There are 306,712 People in the Labor Forcein in Delaware County.
What is the Percentage of People in the Labor Force in Delaware County?
66.3% of People are in the Labor Force in Delaware County.
What is the Unemployment Rate in Delaware County?
Unemployment Rate in Delaware County is 6.8%.