Chester County, PA Map & Demographics
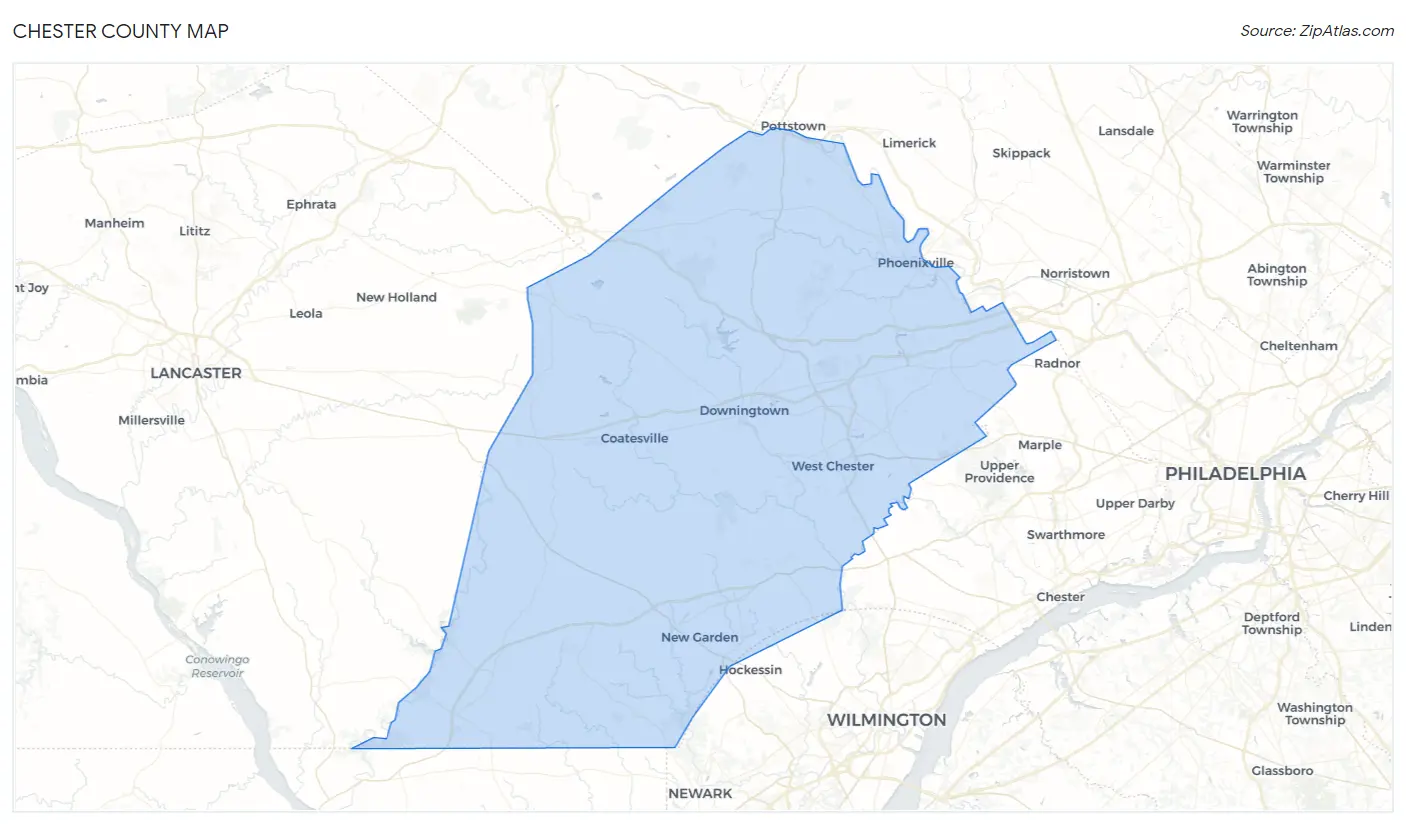
Chester County Map
Chester County Overview
$60,599
PER CAPITA INCOME
$144,484
AVG FAMILY INCOME
$118,574
AVG HOUSEHOLD INCOME
36.8%
WAGE / INCOME GAP [ % ]
63.2¢/ $1
WAGE / INCOME GAP [ $ ]
$10,908
FAMILY INCOME DEFICIT
0.45
INEQUALITY / GINI INDEX
536,474
TOTAL POPULATION
266,330
MALE POPULATION
270,144
FEMALE POPULATION
98.59
MALES / 100 FEMALES
101.43
FEMALES / 100 MALES
40.7
MEDIAN AGE
3.1
AVG FAMILY SIZE
2.6
AVG HOUSEHOLD SIZE
294,801
LABOR FORCE [ PEOPLE ]
68.2%
PERCENT IN LABOR FORCE
4.0%
UNEMPLOYMENT RATE
Income in Chester County
Income Overview in Chester County
Per Capita Income in Chester County is $60,599, while median incomes of families and households are $144,484 and $118,574 respectively.
| Characteristic | Number | Measure |
| Per Capita Income | 536,474 | $60,599 |
| Median Family Income | 141,500 | $144,484 |
| Mean Family Income | 141,500 | $186,526 |
| Median Household Income | 200,622 | $118,574 |
| Mean Household Income | 200,622 | $159,035 |
| Income Deficit | 141,500 | $10,908 |
| Wage / Income Gap (%) | 536,474 | 36.82% |
| Wage / Income Gap ($) | 536,474 | 63.18¢ per $1 |
| Gini / Inequality Index | 536,474 | 0.45 |
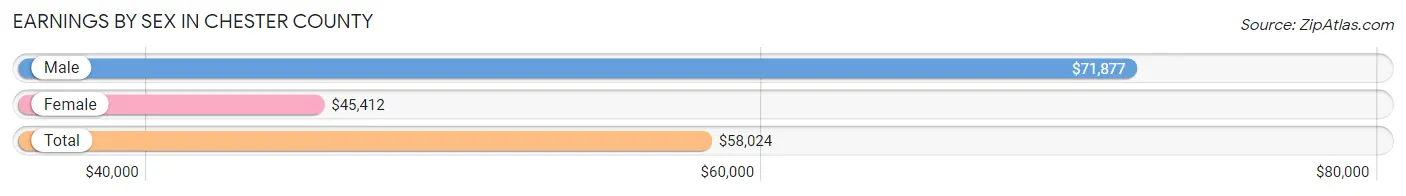
Earnings by Sex in Chester County
Average Earnings in Chester County are $58,024, $71,877 for men and $45,412 for women, a difference of 36.8%.
| Sex | Number | Average Earnings |
| Male | 167,068 (53.5%) | $71,877 |
| Female | 145,280 (46.5%) | $45,412 |
| Total | 312,348 (100.0%) | $58,024 |
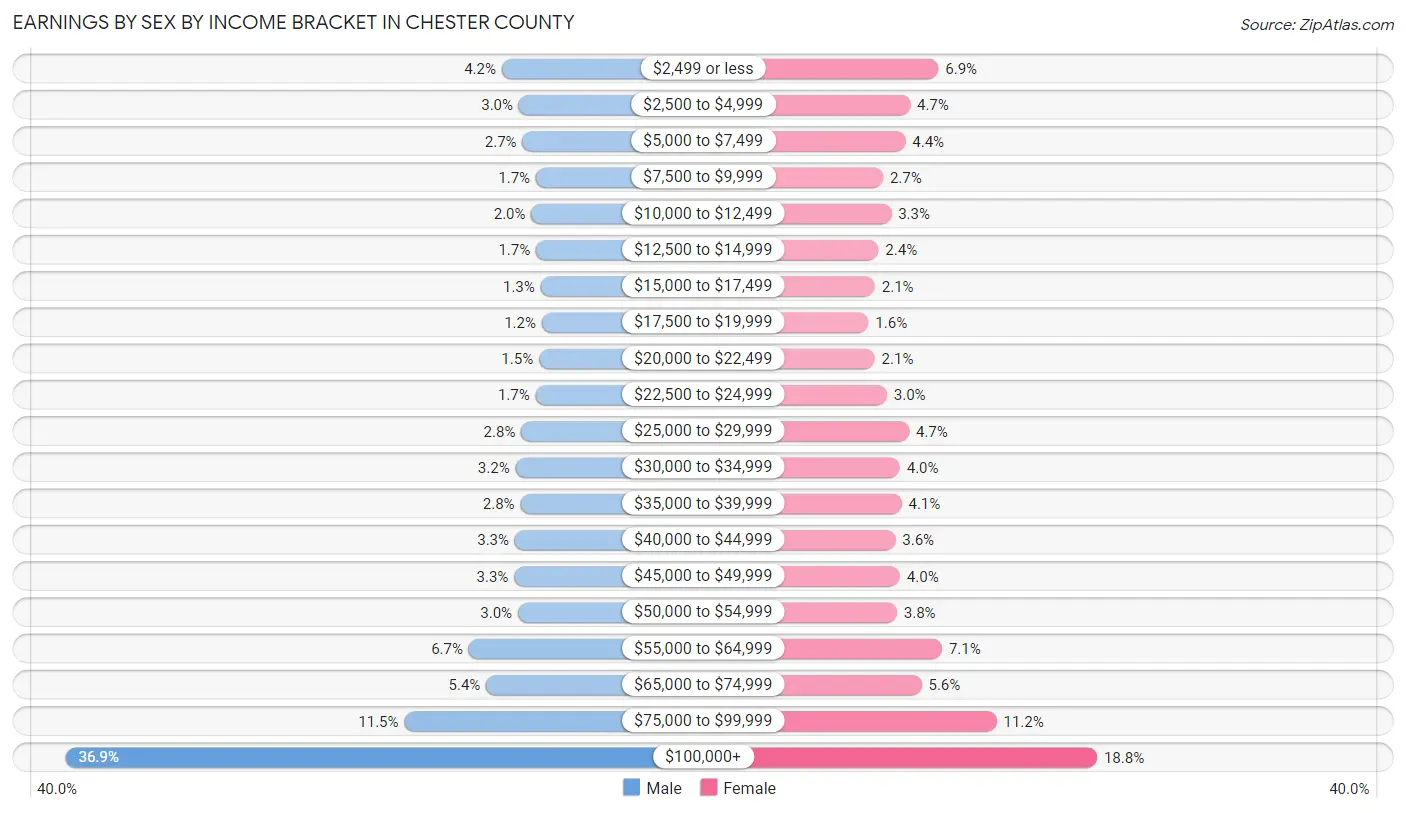
Earnings by Sex by Income Bracket in Chester County
The most common earnings brackets in Chester County are $100,000+ for men (61,692 | 36.9%) and $100,000+ for women (27,233 | 18.8%).
| Income | Male | Female |
| $2,499 or less | 7,092 (4.2%) | 9,972 (6.9%) |
| $2,500 to $4,999 | 4,942 (3.0%) | 6,880 (4.7%) |
| $5,000 to $7,499 | 4,491 (2.7%) | 6,377 (4.4%) |
| $7,500 to $9,999 | 2,812 (1.7%) | 3,937 (2.7%) |
| $10,000 to $12,499 | 3,369 (2.0%) | 4,836 (3.3%) |
| $12,500 to $14,999 | 2,789 (1.7%) | 3,438 (2.4%) |
| $15,000 to $17,499 | 2,224 (1.3%) | 3,050 (2.1%) |
| $17,500 to $19,999 | 2,066 (1.2%) | 2,351 (1.6%) |
| $20,000 to $22,499 | 2,418 (1.5%) | 3,031 (2.1%) |
| $22,500 to $24,999 | 2,852 (1.7%) | 4,365 (3.0%) |
| $25,000 to $29,999 | 4,647 (2.8%) | 6,768 (4.7%) |
| $30,000 to $34,999 | 5,362 (3.2%) | 5,769 (4.0%) |
| $35,000 to $39,999 | 4,752 (2.8%) | 5,962 (4.1%) |
| $40,000 to $44,999 | 5,441 (3.3%) | 5,292 (3.6%) |
| $45,000 to $49,999 | 5,529 (3.3%) | 5,780 (4.0%) |
| $50,000 to $54,999 | 5,069 (3.0%) | 5,442 (3.7%) |
| $55,000 to $64,999 | 11,202 (6.7%) | 10,354 (7.1%) |
| $65,000 to $74,999 | 9,041 (5.4%) | 8,140 (5.6%) |
| $75,000 to $99,999 | 19,278 (11.5%) | 16,303 (11.2%) |
| $100,000+ | 61,692 (36.9%) | 27,233 (18.8%) |
| Total | 167,068 (100.0%) | 145,280 (100.0%) |
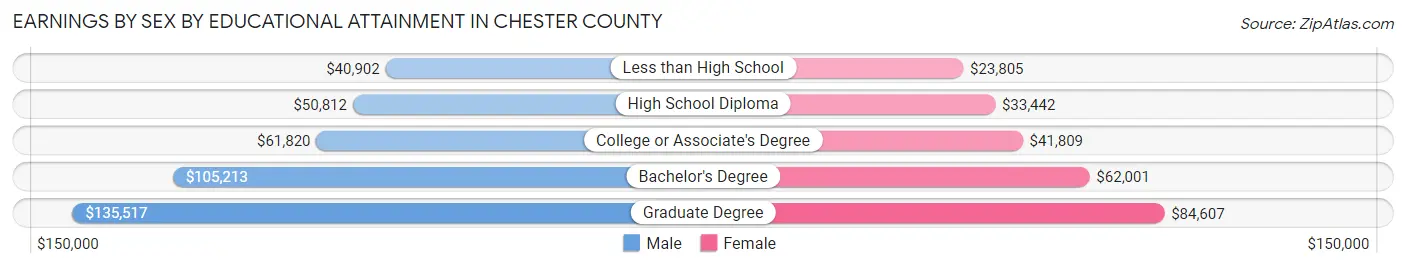
Earnings by Sex by Educational Attainment in Chester County
Average earnings in Chester County are $85,841 for men and $55,659 for women, a difference of 35.2%. Men with an educational attainment of graduate degree enjoy the highest average annual earnings of $135,517, while those with less than high school education earn the least with $40,902. Women with an educational attainment of graduate degree earn the most with the average annual earnings of $84,607, while those with less than high school education have the smallest earnings of $23,805.
| Educational Attainment | Male Income | Female Income |
| Less than High School | $40,902 | $23,805 |
| High School Diploma | $50,812 | $33,442 |
| College or Associate's Degree | $61,820 | $41,809 |
| Bachelor's Degree | $105,213 | $62,001 |
| Graduate Degree | $135,517 | $84,607 |
| Total | $85,841 | $55,659 |
Family Income in Chester County
Family Income Brackets in Chester County
According to the Chester County family income data, there are 46,412 families falling into the $200,000+ income range, which is the most common income bracket and makes up 32.8% of all families. Conversely, the $10,000 to $14,999 income bracket is the least frequent group with only 1,415 families (1.0%) belonging to this category.
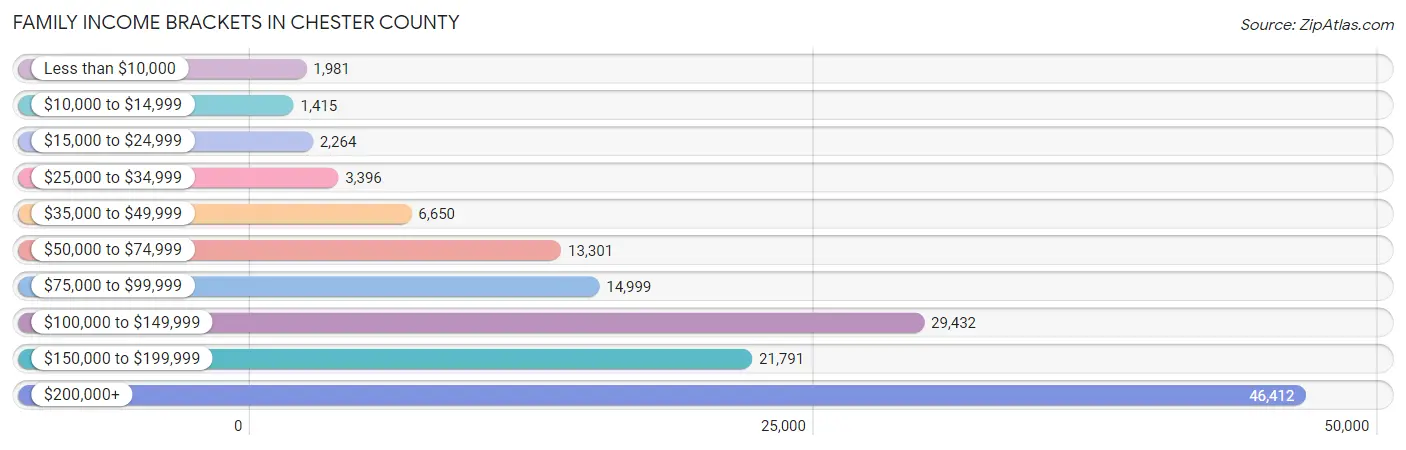
| Income Bracket | # Families | % Families |
| Less than $10,000 | 1,981 | 1.4% |
| $10,000 to $14,999 | 1,415 | 1.0% |
| $15,000 to $24,999 | 2,264 | 1.6% |
| $25,000 to $34,999 | 3,396 | 2.4% |
| $35,000 to $49,999 | 6,650 | 4.7% |
| $50,000 to $74,999 | 13,301 | 9.4% |
| $75,000 to $99,999 | 14,999 | 10.6% |
| $100,000 to $149,999 | 29,432 | 20.8% |
| $150,000 to $199,999 | 21,791 | 15.4% |
| $200,000+ | 46,412 | 32.8% |
Family Income by Famaliy Size in Chester County
4-person families (30,025 | 21.2%) account for the highest median family income in Chester County with $195,256 per family, while 2-person families (63,928 | 45.2%) have the highest median income of $59,866 per family member.
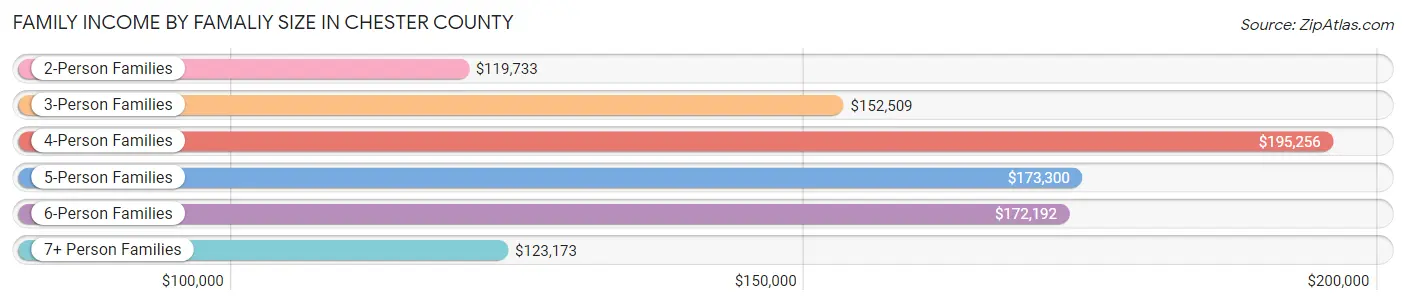
| Income Bracket | # Families | Median Income |
| 2-Person Families | 63,928 (45.2%) | $119,733 |
| 3-Person Families | 30,002 (21.2%) | $152,509 |
| 4-Person Families | 30,025 (21.2%) | $195,256 |
| 5-Person Families | 12,124 (8.6%) | $173,300 |
| 6-Person Families | 3,832 (2.7%) | $172,192 |
| 7+ Person Families | 1,589 (1.1%) | $123,173 |
| Total | 141,500 (100.0%) | $144,484 |
Family Income by Number of Earners in Chester County
The median family income in Chester County is $144,484, with families comprising 3+ earners (20,010) having the highest median family income of $204,102, while families with no earners (16,608) have the lowest median family income of $74,715, accounting for 14.1% and 11.7% of families, respectively.
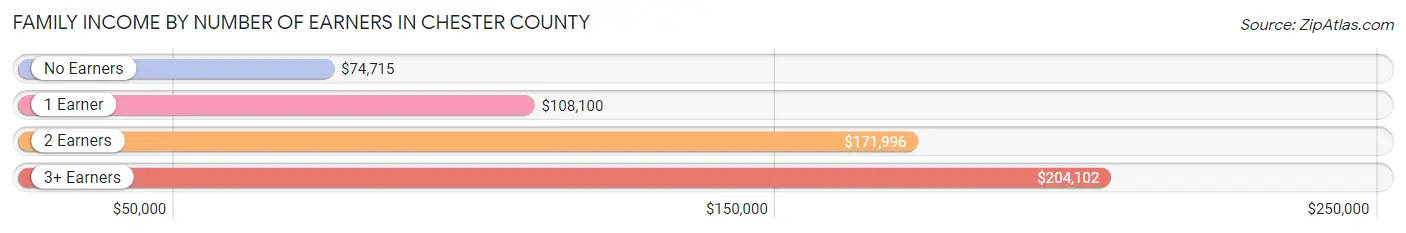
| Number of Earners | # Families | Median Income |
| No Earners | 16,608 (11.7%) | $74,715 |
| 1 Earner | 38,515 (27.2%) | $108,100 |
| 2 Earners | 66,367 (46.9%) | $171,996 |
| 3+ Earners | 20,010 (14.1%) | $204,102 |
| Total | 141,500 (100.0%) | $144,484 |
Household Income in Chester County
Household Income Brackets in Chester County
With 51,159 households falling in the category, the $200,000+ income range is the most frequent in Chester County, accounting for 25.5% of all households. In contrast, only 3,411 households (1.7%) fall into the $10,000 to $14,999 income bracket, making it the least populous group.
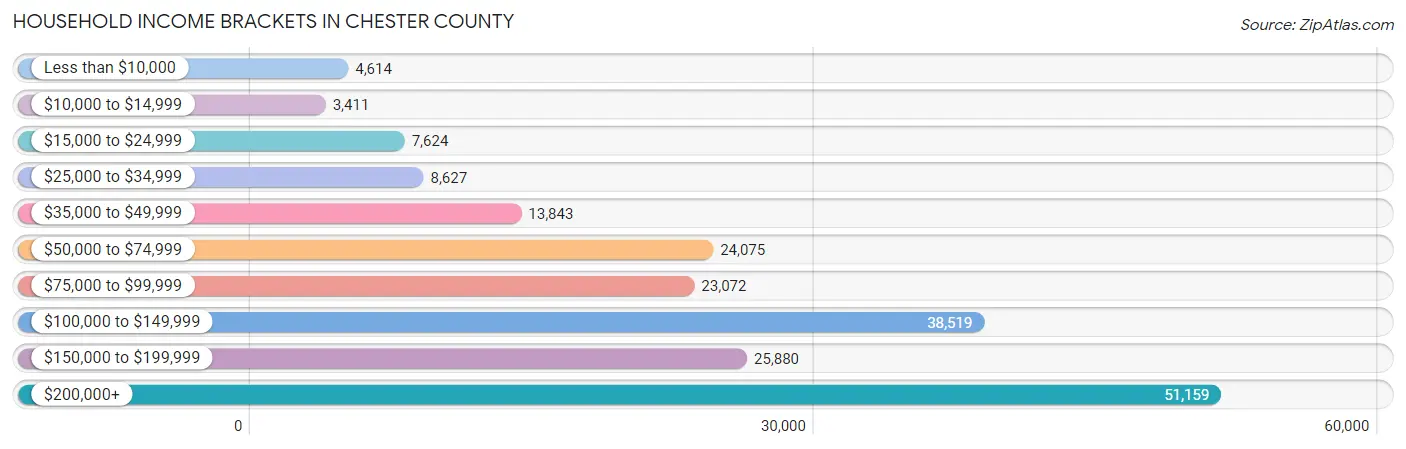
| Income Bracket | # Households | % Households |
| Less than $10,000 | 4,614 | 2.3% |
| $10,000 to $14,999 | 3,411 | 1.7% |
| $15,000 to $24,999 | 7,624 | 3.8% |
| $25,000 to $34,999 | 8,627 | 4.3% |
| $35,000 to $49,999 | 13,843 | 6.9% |
| $50,000 to $74,999 | 24,075 | 12.0% |
| $75,000 to $99,999 | 23,072 | 11.5% |
| $100,000 to $149,999 | 38,519 | 19.2% |
| $150,000 to $199,999 | 25,880 | 12.9% |
| $200,000+ | 51,159 | 25.5% |
Household Income by Householder Age in Chester County
The median household income in Chester County is $118,574, with the highest median household income of $154,294 found in the 45 to 64 years age bracket for the primary householder. A total of 80,888 households (40.3%) fall into this category. Meanwhile, the 15 to 24 years age bracket for the primary householder has the lowest median household income of $57,346, with 5,303 households (2.6%) in this group.
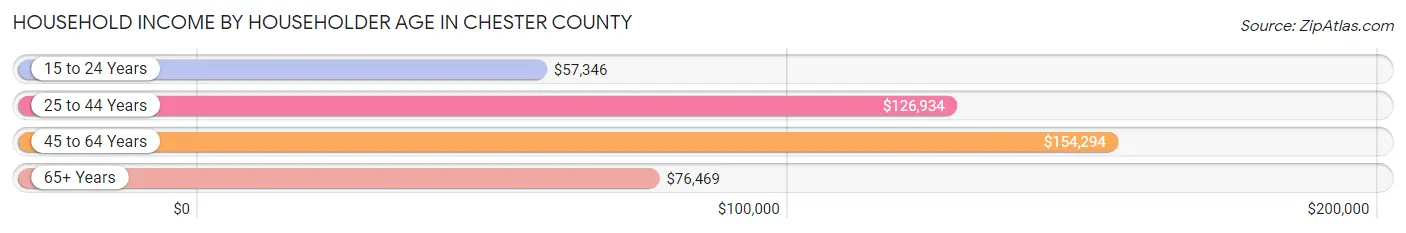
| Income Bracket | # Households | Median Income |
| 15 to 24 Years | 5,303 (2.6%) | $57,346 |
| 25 to 44 Years | 59,381 (29.6%) | $126,934 |
| 45 to 64 Years | 80,888 (40.3%) | $154,294 |
| 65+ Years | 55,050 (27.4%) | $76,469 |
| Total | 200,622 (100.0%) | $118,574 |
Poverty in Chester County
Income Below Poverty by Sex and Age in Chester County
With 5.5% poverty level for males and 6.4% for females among the residents of Chester County, 18 to 24 year old males and 18 to 24 year old females are the most vulnerable to poverty, with 2,390 males (11.3%) and 2,711 females (13.6%) in their respective age groups living below the poverty level.
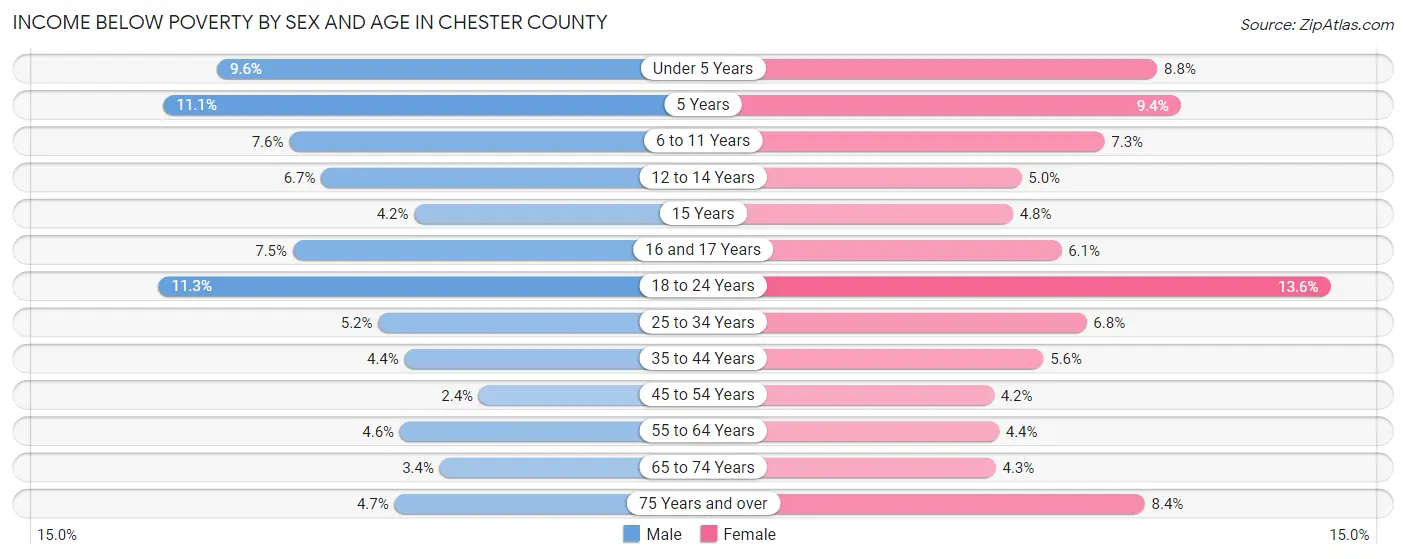
| Age Bracket | Male | Female |
| Under 5 Years | 1,390 (9.6%) | 1,233 (8.8%) |
| 5 Years | 341 (11.1%) | 307 (9.4%) |
| 6 to 11 Years | 1,564 (7.6%) | 1,396 (7.3%) |
| 12 to 14 Years | 745 (6.7%) | 538 (5.0%) |
| 15 Years | 150 (4.2%) | 167 (4.8%) |
| 16 and 17 Years | 590 (7.5%) | 448 (6.1%) |
| 18 to 24 Years | 2,390 (11.3%) | 2,711 (13.6%) |
| 25 to 34 Years | 1,596 (5.1%) | 2,016 (6.8%) |
| 35 to 44 Years | 1,515 (4.4%) | 1,880 (5.6%) |
| 45 to 54 Years | 848 (2.4%) | 1,508 (4.2%) |
| 55 to 64 Years | 1,691 (4.5%) | 1,651 (4.4%) |
| 65 to 74 Years | 872 (3.4%) | 1,186 (4.3%) |
| 75 Years and over | 699 (4.7%) | 1,738 (8.4%) |
| Total | 14,391 (5.5%) | 16,779 (6.4%) |
Income Above Poverty by Sex and Age in Chester County
According to the poverty statistics in Chester County, males aged 45 to 54 years and females aged 45 to 54 years are the age groups that are most secure financially, with 97.7% of males and 95.8% of females in these age groups living above the poverty line.
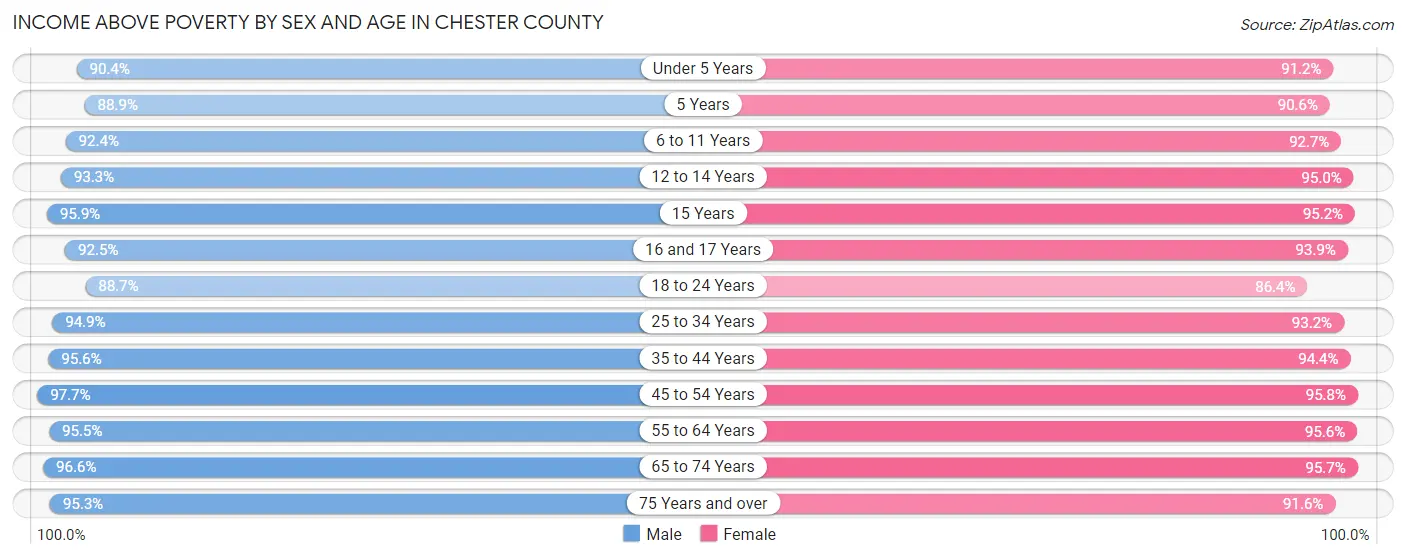
| Age Bracket | Male | Female |
| Under 5 Years | 13,022 (90.4%) | 12,813 (91.2%) |
| 5 Years | 2,722 (88.9%) | 2,947 (90.6%) |
| 6 to 11 Years | 18,937 (92.4%) | 17,696 (92.7%) |
| 12 to 14 Years | 10,310 (93.3%) | 10,213 (95.0%) |
| 15 Years | 3,468 (95.9%) | 3,344 (95.2%) |
| 16 and 17 Years | 7,247 (92.5%) | 6,880 (93.9%) |
| 18 to 24 Years | 18,820 (88.7%) | 17,216 (86.4%) |
| 25 to 34 Years | 29,412 (94.9%) | 27,596 (93.2%) |
| 35 to 44 Years | 32,794 (95.6%) | 31,606 (94.4%) |
| 45 to 54 Years | 35,168 (97.7%) | 34,134 (95.8%) |
| 55 to 64 Years | 35,445 (95.5%) | 36,120 (95.6%) |
| 65 to 74 Years | 24,485 (96.6%) | 26,495 (95.7%) |
| 75 Years and over | 14,181 (95.3%) | 18,869 (91.6%) |
| Total | 246,011 (94.5%) | 245,929 (93.6%) |
Income Below Poverty Among Married-Couple Families in Chester County
The poverty statistics for married-couple families in Chester County show that 1.9% or 2,293 of the total 118,270 families live below the poverty line. Families with 5 or more children have the highest poverty rate of 28.9%, comprising of 192 families. On the other hand, families with 1 or 2 children have the lowest poverty rate of 1.2%, which includes 478 families.
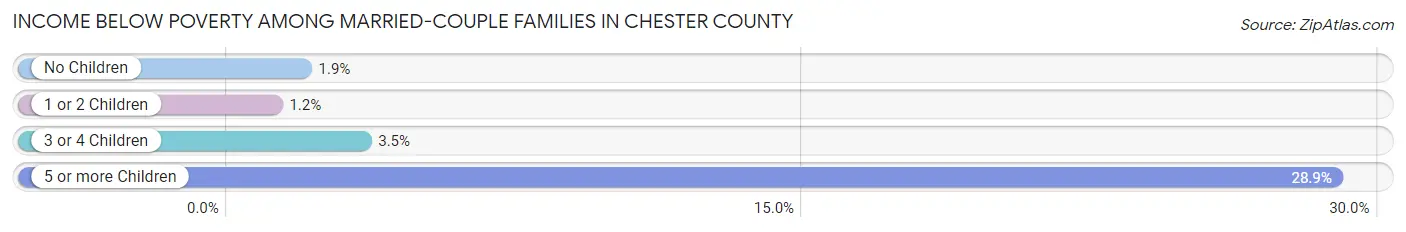
| Children | Above Poverty | Below Poverty |
| No Children | 65,616 (98.1%) | 1,287 (1.9%) |
| 1 or 2 Children | 40,562 (98.8%) | 478 (1.2%) |
| 3 or 4 Children | 9,326 (96.5%) | 336 (3.5%) |
| 5 or more Children | 473 (71.1%) | 192 (28.9%) |
| Total | 115,977 (98.1%) | 2,293 (1.9%) |
Income Below Poverty Among Single-Parent Households in Chester County
According to the poverty data in Chester County, 6.5% or 443 single-father households and 14.6% or 2,397 single-mother households are living below the poverty line. Among single-father households, those with 3 or 4 children have the highest poverty rate, with 214 households (42.9%) experiencing poverty. Likewise, among single-mother households, those with 5 or more children have the highest poverty rate, with 120 households (97.6%) falling below the poverty line.
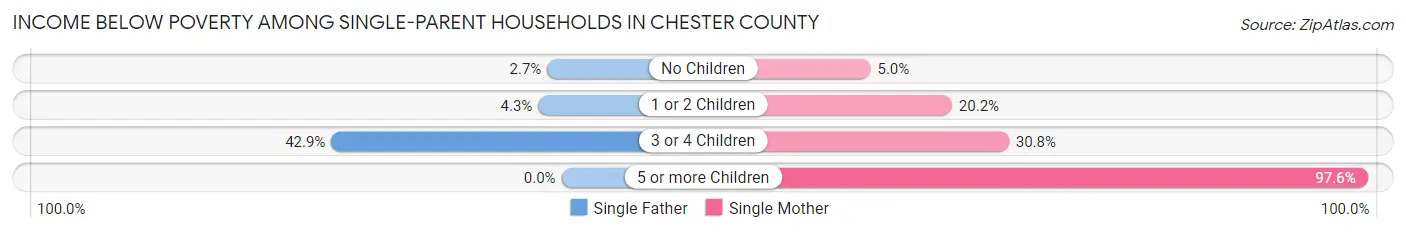
| Children | Single Father | Single Mother |
| No Children | 73 (2.7%) | 370 (5.0%) |
| 1 or 2 Children | 156 (4.3%) | 1,562 (20.2%) |
| 3 or 4 Children | 214 (42.9%) | 345 (30.7%) |
| 5 or more Children | 0 (0.0%) | 120 (97.6%) |
| Total | 443 (6.5%) | 2,397 (14.6%) |
Income Below Poverty Among Married-Couple vs Single-Parent Households in Chester County
The poverty data for Chester County shows that 2,293 of the married-couple family households (1.9%) and 2,840 of the single-parent households (12.2%) are living below the poverty level. Within the married-couple family households, those with 5 or more children have the highest poverty rate, with 192 households (28.9%) falling below the poverty line. Among the single-parent households, those with 5 or more children have the highest poverty rate, with 120 household (83.9%) living below poverty.
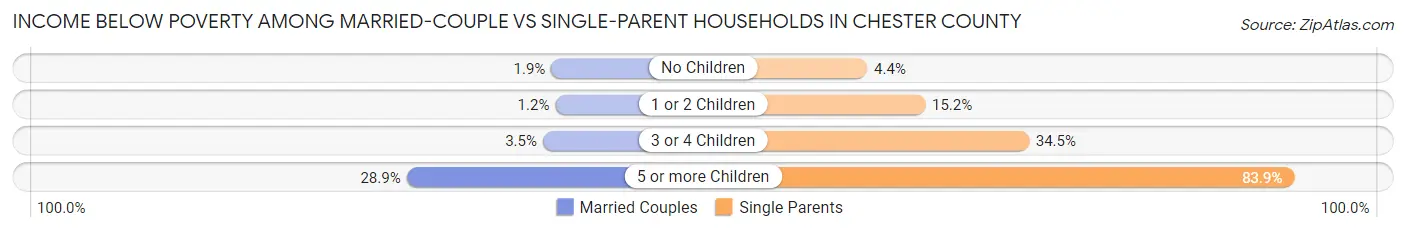
| Children | Married-Couple Families | Single-Parent Households |
| No Children | 1,287 (1.9%) | 443 (4.4%) |
| 1 or 2 Children | 478 (1.2%) | 1,718 (15.1%) |
| 3 or 4 Children | 336 (3.5%) | 559 (34.5%) |
| 5 or more Children | 192 (28.9%) | 120 (83.9%) |
| Total | 2,293 (1.9%) | 2,840 (12.2%) |
Race in Chester County
The most populous races in Chester County are White / Caucasian (431,632 | 80.5%), Hispanic or Latino (40,883 | 7.6%), and Asian (33,658 | 6.3%).
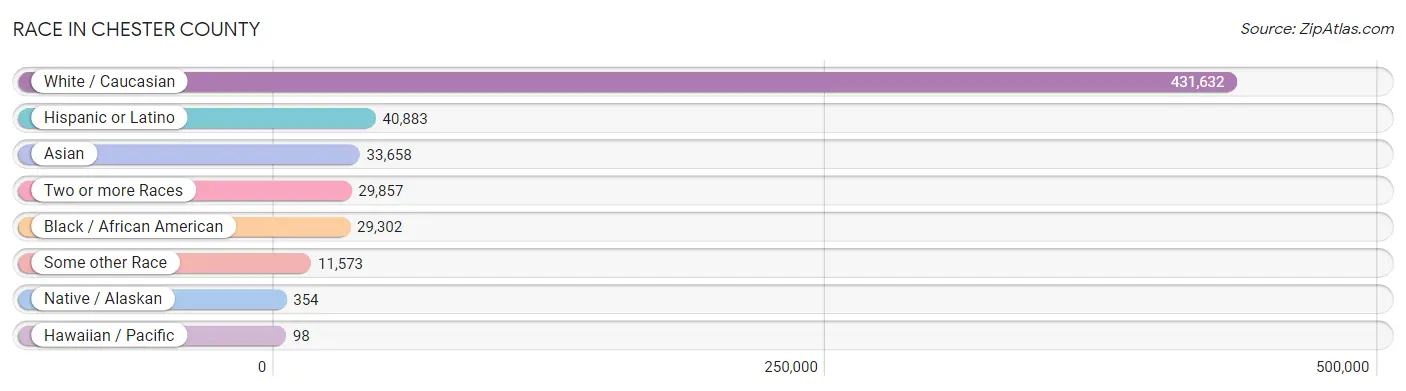
| Race | # Population | % Population |
| Asian | 33,658 | 6.3% |
| Black / African American | 29,302 | 5.5% |
| Hawaiian / Pacific | 98 | 0.0% |
| Hispanic or Latino | 40,883 | 7.6% |
| Native / Alaskan | 354 | 0.1% |
| White / Caucasian | 431,632 | 80.5% |
| Two or more Races | 29,857 | 5.6% |
| Some other Race | 11,573 | 2.2% |
| Total | 536,474 | 100.0% |
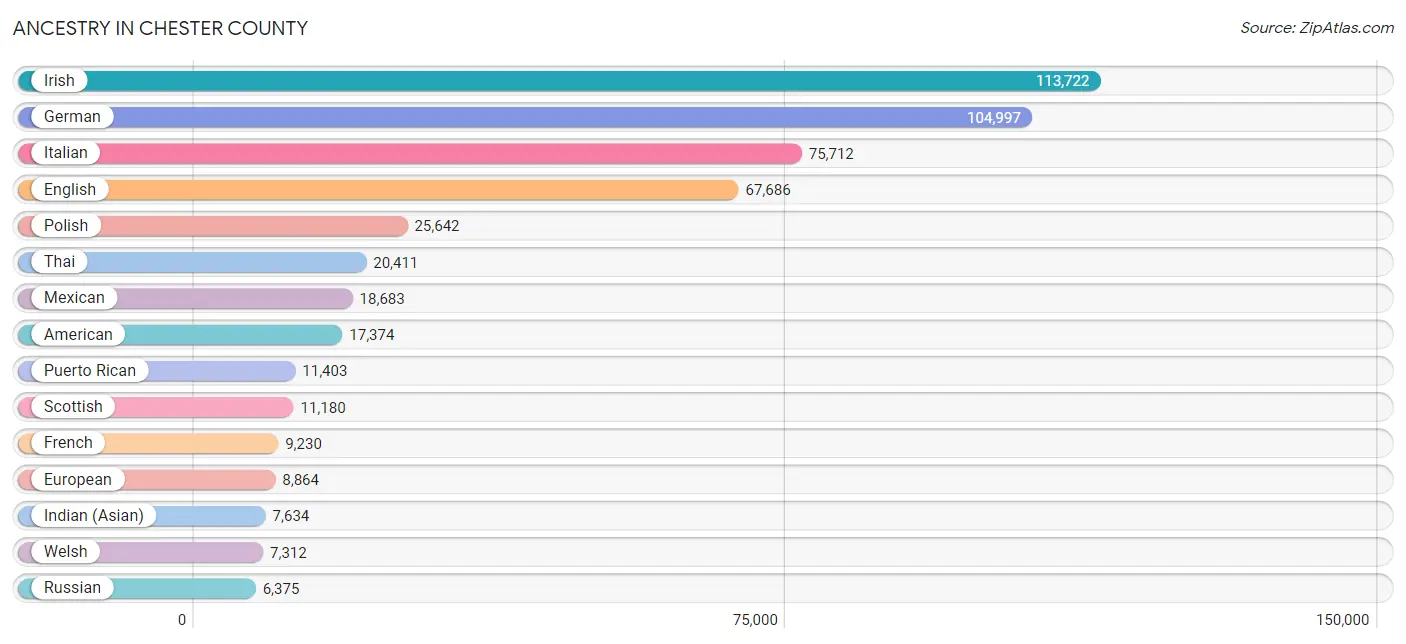
Ancestry in Chester County
The most populous ancestries reported in Chester County are Irish (113,722 | 21.2%), German (104,997 | 19.6%), Italian (75,712 | 14.1%), English (67,686 | 12.6%), and Polish (25,642 | 4.8%), together accounting for 72.3% of all Chester County residents.
| Ancestry | # Population | % Population |
| Afghan | 79 | 0.0% |
| African | 2,164 | 0.4% |
| Albanian | 407 | 0.1% |
| Alsatian | 118 | 0.0% |
| American | 17,374 | 3.2% |
| Apache | 97 | 0.0% |
| Arab | 2,772 | 0.5% |
| Arapaho | 2 | 0.0% |
| Argentinean | 296 | 0.1% |
| Armenian | 1,266 | 0.2% |
| Assyrian / Chaldean / Syriac | 27 | 0.0% |
| Australian | 303 | 0.1% |
| Austrian | 1,950 | 0.4% |
| Bahamian | 4 | 0.0% |
| Barbadian | 18 | 0.0% |
| Basque | 42 | 0.0% |
| Belgian | 551 | 0.1% |
| Belizean | 17 | 0.0% |
| Bhutanese | 1,245 | 0.2% |
| Blackfeet | 171 | 0.0% |
| Bolivian | 48 | 0.0% |
| Brazilian | 540 | 0.1% |
| British | 4,018 | 0.7% |
| British West Indian | 11 | 0.0% |
| Bulgarian | 160 | 0.0% |
| Burmese | 2,531 | 0.5% |
| Cajun | 85 | 0.0% |
| Cambodian | 12 | 0.0% |
| Canadian | 1,574 | 0.3% |
| Cape Verdean | 218 | 0.0% |
| Carpatho Rusyn | 44 | 0.0% |
| Celtic | 27 | 0.0% |
| Central American | 1,829 | 0.3% |
| Central American Indian | 245 | 0.1% |
| Cherokee | 521 | 0.1% |
| Cheyenne | 7 | 0.0% |
| Chilean | 284 | 0.1% |
| Chinese | 17 | 0.0% |
| Chippewa | 30 | 0.0% |
| Choctaw | 3 | 0.0% |
| Colombian | 824 | 0.2% |
| Costa Rican | 87 | 0.0% |
| Cree | 3 | 0.0% |
| Croatian | 574 | 0.1% |
| Crow | 7 | 0.0% |
| Cuban | 2,176 | 0.4% |
| Cypriot | 13 | 0.0% |
| Czech | 1,929 | 0.4% |
| Czechoslovakian | 500 | 0.1% |
| Danish | 1,020 | 0.2% |
| Delaware | 84 | 0.0% |
| Dominican | 1,079 | 0.2% |
| Dutch | 5,919 | 1.1% |
| Eastern European | 2,621 | 0.5% |
| Ecuadorian | 1,379 | 0.3% |
| Egyptian | 484 | 0.1% |
| English | 67,686 | 12.6% |
| Estonian | 38 | 0.0% |
| Ethiopian | 259 | 0.1% |
| European | 8,864 | 1.7% |
| Filipino | 441 | 0.1% |
| Finnish | 384 | 0.1% |
| French | 9,230 | 1.7% |
| French American Indian | 118 | 0.0% |
| French Canadian | 1,713 | 0.3% |
| German | 104,997 | 19.6% |
| Ghanaian | 4 | 0.0% |
| Greek | 3,266 | 0.6% |
| Guamanian / Chamorro | 98 | 0.0% |
| Guatemalan | 844 | 0.2% |
| Guyanese | 81 | 0.0% |
| Haitian | 165 | 0.0% |
| Honduran | 424 | 0.1% |
| Hungarian | 3,875 | 0.7% |
| Icelander | 66 | 0.0% |
| Indian (Asian) | 7,634 | 1.4% |
| Inupiat | 11 | 0.0% |
| Iranian | 485 | 0.1% |
| Iraqi | 243 | 0.1% |
| Irish | 113,722 | 21.2% |
| Iroquois | 101 | 0.0% |
| Israeli | 110 | 0.0% |
| Italian | 75,712 | 14.1% |
| Jamaican | 950 | 0.2% |
| Japanese | 457 | 0.1% |
| Jordanian | 152 | 0.0% |
| Kenyan | 116 | 0.0% |
| Korean | 2,819 | 0.5% |
| Laotian | 196 | 0.0% |
| Latvian | 370 | 0.1% |
| Lebanese | 772 | 0.1% |
| Liberian | 69 | 0.0% |
| Lithuanian | 2,901 | 0.5% |
| Luxembourger | 32 | 0.0% |
| Macedonian | 15 | 0.0% |
| Malaysian | 107 | 0.0% |
| Maltese | 163 | 0.0% |
| Mexican | 18,683 | 3.5% |
| Mexican American Indian | 227 | 0.0% |
| Mongolian | 8 | 0.0% |
| Moroccan | 151 | 0.0% |
| Native Hawaiian | 311 | 0.1% |
| Navajo | 8 | 0.0% |
| New Zealander | 15 | 0.0% |
| Nicaraguan | 23 | 0.0% |
| Nigerian | 597 | 0.1% |
| Northern European | 858 | 0.2% |
| Norwegian | 3,266 | 0.6% |
| Okinawan | 72 | 0.0% |
| Paiute | 33 | 0.0% |
| Pakistani | 112 | 0.0% |
| Palestinian | 80 | 0.0% |
| Panamanian | 57 | 0.0% |
| Pennsylvania German | 4,872 | 0.9% |
| Peruvian | 300 | 0.1% |
| Pima | 54 | 0.0% |
| Polish | 25,642 | 4.8% |
| Portuguese | 1,422 | 0.3% |
| Potawatomi | 32 | 0.0% |
| Puerto Rican | 11,403 | 2.1% |
| Romanian | 585 | 0.1% |
| Russian | 6,375 | 1.2% |
| Salvadoran | 394 | 0.1% |
| Samoan | 17 | 0.0% |
| Scandinavian | 1,224 | 0.2% |
| Scotch-Irish | 5,561 | 1.0% |
| Scottish | 11,180 | 2.1% |
| Seminole | 110 | 0.0% |
| Senegalese | 4 | 0.0% |
| Serbian | 247 | 0.1% |
| Shoshone | 7 | 0.0% |
| Sierra Leonean | 50 | 0.0% |
| Sioux | 28 | 0.0% |
| Slavic | 403 | 0.1% |
| Slovak | 2,980 | 0.6% |
| Slovene | 379 | 0.1% |
| South African | 242 | 0.1% |
| South American | 3,630 | 0.7% |
| South American Indian | 22 | 0.0% |
| Soviet Union | 13 | 0.0% |
| Spaniard | 1,006 | 0.2% |
| Spanish | 461 | 0.1% |
| Sri Lankan | 1,964 | 0.4% |
| Subsaharan African | 3,806 | 0.7% |
| Swedish | 4,519 | 0.8% |
| Swiss | 3,459 | 0.6% |
| Syrian | 453 | 0.1% |
| Taiwanese | 5 | 0.0% |
| Thai | 20,411 | 3.8% |
| Trinidadian and Tobagonian | 184 | 0.0% |
| Turkish | 491 | 0.1% |
| U.S. Virgin Islander | 46 | 0.0% |
| Ugandan | 27 | 0.0% |
| Ukrainian | 4,319 | 0.8% |
| Uruguayan | 150 | 0.0% |
| Venezuelan | 317 | 0.1% |
| Vietnamese | 59 | 0.0% |
| Welsh | 7,312 | 1.4% |
| West Indian | 108 | 0.0% |
| Yugoslavian | 208 | 0.0% | View All 160 Rows |
Immigrants in Chester County
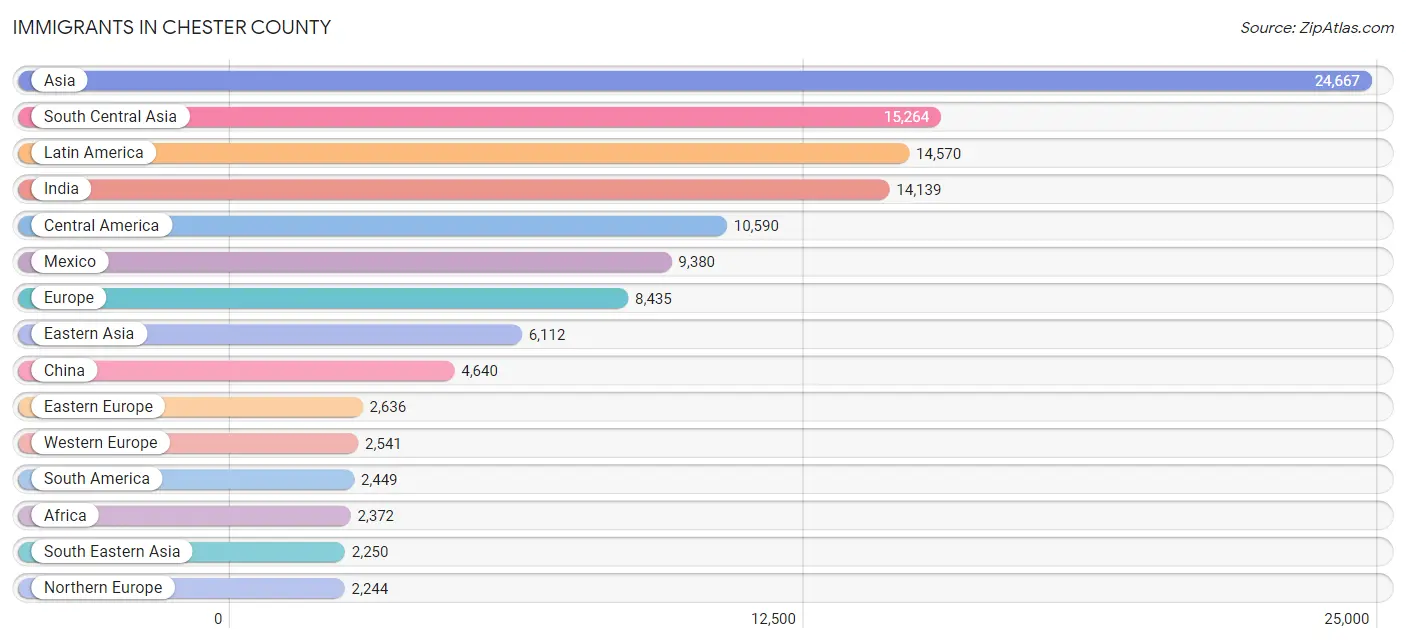
The most numerous immigrant groups reported in Chester County came from Asia (24,667 | 4.6%), South Central Asia (15,264 | 2.9%), Latin America (14,570 | 2.7%), India (14,139 | 2.6%), and Central America (10,590 | 2.0%), together accounting for 14.8% of all Chester County residents.
| Immigration Origin | # Population | % Population |
| Afghanistan | 99 | 0.0% |
| Africa | 2,372 | 0.4% |
| Albania | 145 | 0.0% |
| Argentina | 297 | 0.1% |
| Armenia | 11 | 0.0% |
| Asia | 24,667 | 4.6% |
| Australia | 208 | 0.0% |
| Austria | 64 | 0.0% |
| Azores | 41 | 0.0% |
| Bahamas | 4 | 0.0% |
| Bangladesh | 104 | 0.0% |
| Barbados | 11 | 0.0% |
| Belarus | 94 | 0.0% |
| Belgium | 25 | 0.0% |
| Bolivia | 21 | 0.0% |
| Bosnia and Herzegovina | 28 | 0.0% |
| Brazil | 706 | 0.1% |
| Bulgaria | 116 | 0.0% |
| Cabo Verde | 21 | 0.0% |
| Cambodia | 43 | 0.0% |
| Cameroon | 12 | 0.0% |
| Canada | 1,523 | 0.3% |
| Caribbean | 1,531 | 0.3% |
| Central America | 10,590 | 2.0% |
| Chile | 121 | 0.0% |
| China | 4,640 | 0.9% |
| Colombia | 263 | 0.1% |
| Costa Rica | 58 | 0.0% |
| Croatia | 22 | 0.0% |
| Cuba | 156 | 0.0% |
| Czechoslovakia | 75 | 0.0% |
| Denmark | 13 | 0.0% |
| Dominica | 36 | 0.0% |
| Dominican Republic | 356 | 0.1% |
| Eastern Africa | 568 | 0.1% |
| Eastern Asia | 6,112 | 1.1% |
| Eastern Europe | 2,636 | 0.5% |
| Ecuador | 519 | 0.1% |
| Egypt | 233 | 0.0% |
| El Salvador | 229 | 0.0% |
| England | 746 | 0.1% |
| Ethiopia | 197 | 0.0% |
| Europe | 8,435 | 1.6% |
| France | 280 | 0.1% |
| Germany | 1,864 | 0.4% |
| Ghana | 11 | 0.0% |
| Greece | 64 | 0.0% |
| Guatemala | 526 | 0.1% |
| Guyana | 72 | 0.0% |
| Haiti | 129 | 0.0% |
| Honduras | 362 | 0.1% |
| Hong Kong | 102 | 0.0% |
| Hungary | 50 | 0.0% |
| India | 14,139 | 2.6% |
| Indonesia | 190 | 0.0% |
| Iran | 330 | 0.1% |
| Iraq | 207 | 0.0% |
| Ireland | 246 | 0.1% |
| Israel | 57 | 0.0% |
| Italy | 616 | 0.1% |
| Jamaica | 624 | 0.1% |
| Japan | 290 | 0.1% |
| Jordan | 70 | 0.0% |
| Kazakhstan | 29 | 0.0% |
| Kenya | 170 | 0.0% |
| Korea | 1,182 | 0.2% |
| Kuwait | 72 | 0.0% |
| Laos | 46 | 0.0% |
| Latin America | 14,570 | 2.7% |
| Latvia | 71 | 0.0% |
| Lebanon | 143 | 0.0% |
| Liberia | 190 | 0.0% |
| Lithuania | 74 | 0.0% |
| Malaysia | 120 | 0.0% |
| Mexico | 9,380 | 1.8% |
| Middle Africa | 76 | 0.0% |
| Moldova | 20 | 0.0% |
| Morocco | 187 | 0.0% |
| Nepal | 88 | 0.0% |
| Netherlands | 222 | 0.0% |
| Nicaragua | 5 | 0.0% |
| Nigeria | 452 | 0.1% |
| Northern Africa | 496 | 0.1% |
| Northern Europe | 2,244 | 0.4% |
| Norway | 26 | 0.0% |
| Oceania | 263 | 0.1% |
| Pakistan | 358 | 0.1% |
| Panama | 30 | 0.0% |
| Peru | 127 | 0.0% |
| Philippines | 760 | 0.1% |
| Poland | 660 | 0.1% |
| Portugal | 123 | 0.0% |
| Romania | 102 | 0.0% |
| Russia | 643 | 0.1% |
| Scotland | 199 | 0.0% |
| Serbia | 15 | 0.0% |
| Sierra Leone | 37 | 0.0% |
| Singapore | 50 | 0.0% |
| Somalia | 13 | 0.0% |
| South Africa | 463 | 0.1% |
| South America | 2,449 | 0.5% |
| South Central Asia | 15,264 | 2.9% |
| South Eastern Asia | 2,250 | 0.4% |
| Southern Europe | 1,014 | 0.2% |
| Spain | 155 | 0.0% |
| Sri Lanka | 117 | 0.0% |
| Sudan | 17 | 0.0% |
| Sweden | 33 | 0.0% |
| Switzerland | 86 | 0.0% |
| Syria | 26 | 0.0% |
| Taiwan | 422 | 0.1% |
| Thailand | 130 | 0.0% |
| Trinidad and Tobago | 115 | 0.0% |
| Turkey | 306 | 0.1% |
| Uganda | 51 | 0.0% |
| Ukraine | 395 | 0.1% |
| Uruguay | 34 | 0.0% |
| Venezuela | 289 | 0.1% |
| Vietnam | 906 | 0.2% |
| West Indies | 5 | 0.0% |
| Western Africa | 711 | 0.1% |
| Western Asia | 989 | 0.2% |
| Western Europe | 2,541 | 0.5% |
| Zaire | 52 | 0.0% |
| Zimbabwe | 88 | 0.0% | View All 125 Rows |
Sex and Age in Chester County
Sex and Age in Chester County
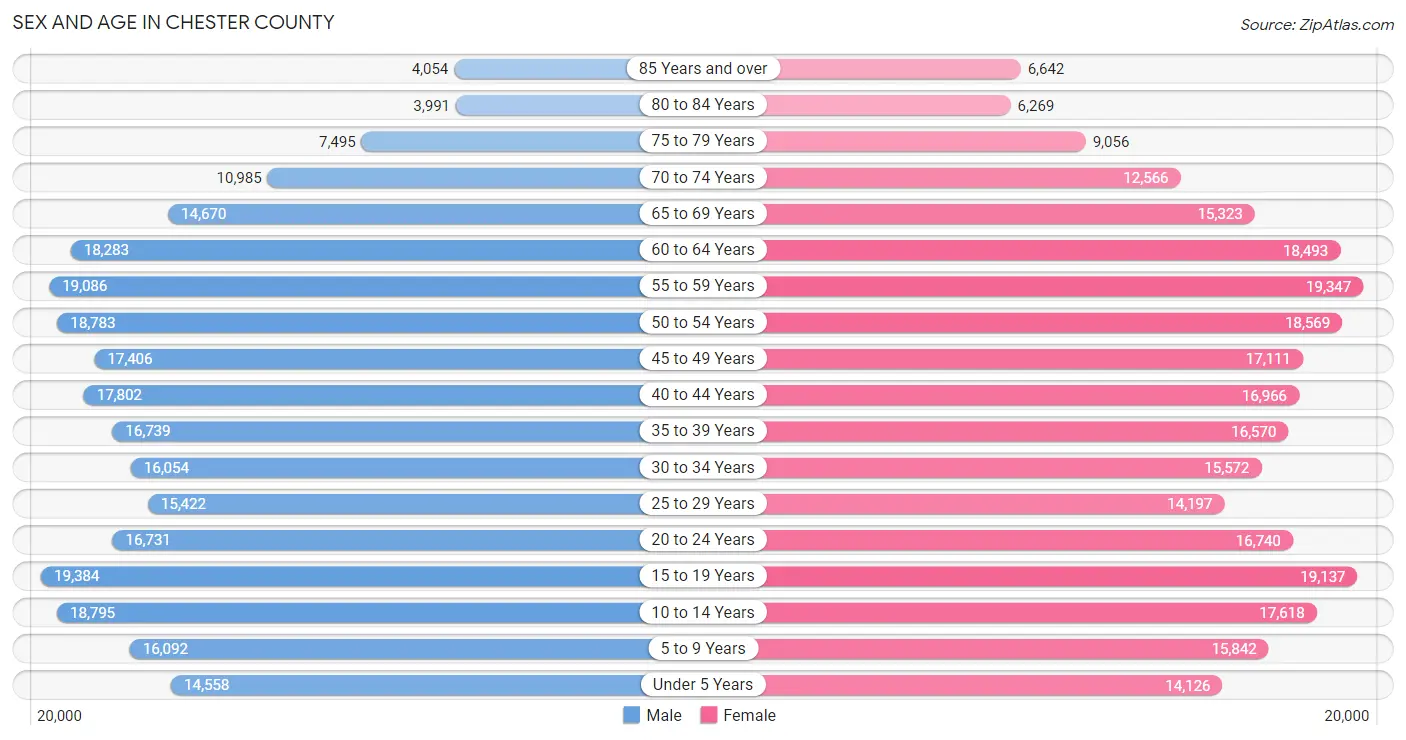
The most populous age groups in Chester County are 15 to 19 Years (19,384 | 7.3%) for men and 55 to 59 Years (19,347 | 7.2%) for women.
| Age Bracket | Male | Female |
| Under 5 Years | 14,558 (5.5%) | 14,126 (5.2%) |
| 5 to 9 Years | 16,092 (6.0%) | 15,842 (5.9%) |
| 10 to 14 Years | 18,795 (7.1%) | 17,618 (6.5%) |
| 15 to 19 Years | 19,384 (7.3%) | 19,137 (7.1%) |
| 20 to 24 Years | 16,731 (6.3%) | 16,740 (6.2%) |
| 25 to 29 Years | 15,422 (5.8%) | 14,197 (5.3%) |
| 30 to 34 Years | 16,054 (6.0%) | 15,572 (5.8%) |
| 35 to 39 Years | 16,739 (6.3%) | 16,570 (6.1%) |
| 40 to 44 Years | 17,802 (6.7%) | 16,966 (6.3%) |
| 45 to 49 Years | 17,406 (6.5%) | 17,111 (6.3%) |
| 50 to 54 Years | 18,783 (7.0%) | 18,569 (6.9%) |
| 55 to 59 Years | 19,086 (7.2%) | 19,347 (7.2%) |
| 60 to 64 Years | 18,283 (6.9%) | 18,493 (6.9%) |
| 65 to 69 Years | 14,670 (5.5%) | 15,323 (5.7%) |
| 70 to 74 Years | 10,985 (4.1%) | 12,566 (4.6%) |
| 75 to 79 Years | 7,495 (2.8%) | 9,056 (3.4%) |
| 80 to 84 Years | 3,991 (1.5%) | 6,269 (2.3%) |
| 85 Years and over | 4,054 (1.5%) | 6,642 (2.5%) |
| Total | 266,330 (100.0%) | 270,144 (100.0%) |
Families and Households in Chester County
Median Family Size in Chester County
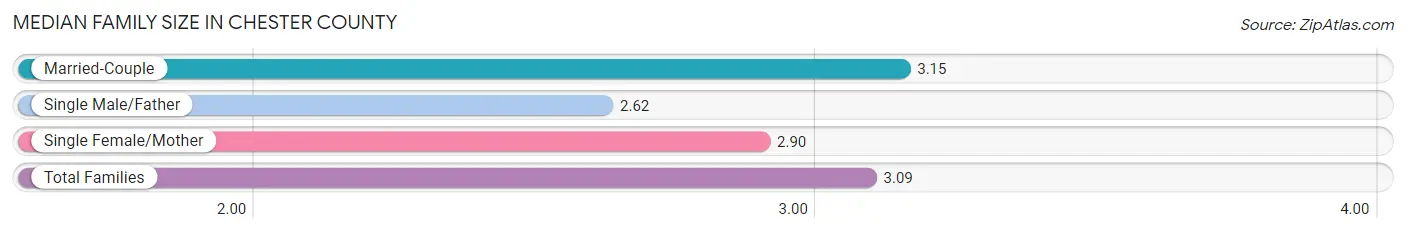
The median family size in Chester County is 3.09 persons per family, with married-couple families (118,270 | 83.6%) accounting for the largest median family size of 3.15 persons per family. On the other hand, single male/father families (6,843 | 4.8%) represent the smallest median family size with 2.62 persons per family.
| Family Type | # Families | Family Size |
| Married-Couple | 118,270 (83.6%) | 3.15 |
| Single Male/Father | 6,843 (4.8%) | 2.62 |
| Single Female/Mother | 16,387 (11.6%) | 2.90 |
| Total Families | 141,500 (100.0%) | 3.09 |
Median Household Size in Chester County
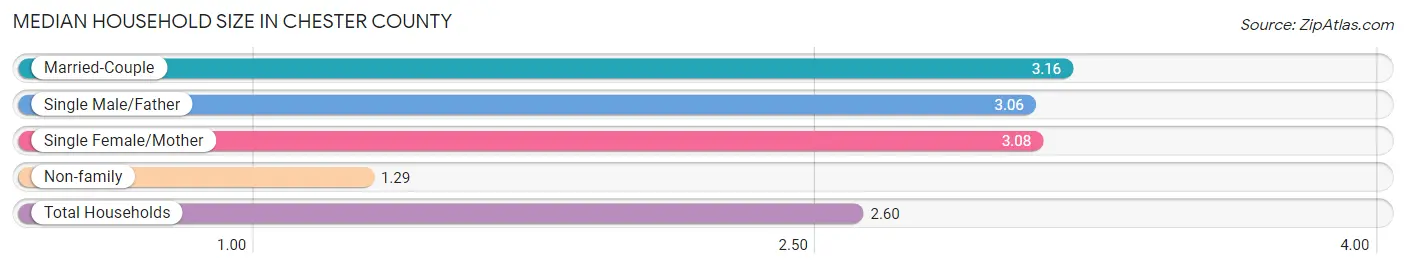
The median household size in Chester County is 2.60 persons per household, with married-couple households (118,270 | 59.0%) accounting for the largest median household size of 3.16 persons per household. non-family households (59,122 | 29.5%) represent the smallest median household size with 1.29 persons per household.
| Household Type | # Households | Household Size |
| Married-Couple | 118,270 (59.0%) | 3.16 |
| Single Male/Father | 6,843 (3.4%) | 3.06 |
| Single Female/Mother | 16,387 (8.2%) | 3.08 |
| Non-family | 59,122 (29.5%) | 1.29 |
| Total Households | 200,622 (100.0%) | 2.60 |
Household Size by Marriage Status in Chester County
Out of a total of 200,622 households in Chester County, 141,500 (70.5%) are family households, while 59,122 (29.5%) are nonfamily households. The most numerous type of family households are 2-person households, comprising 61,076, and the most common type of nonfamily households are 1-person households, comprising 46,183.
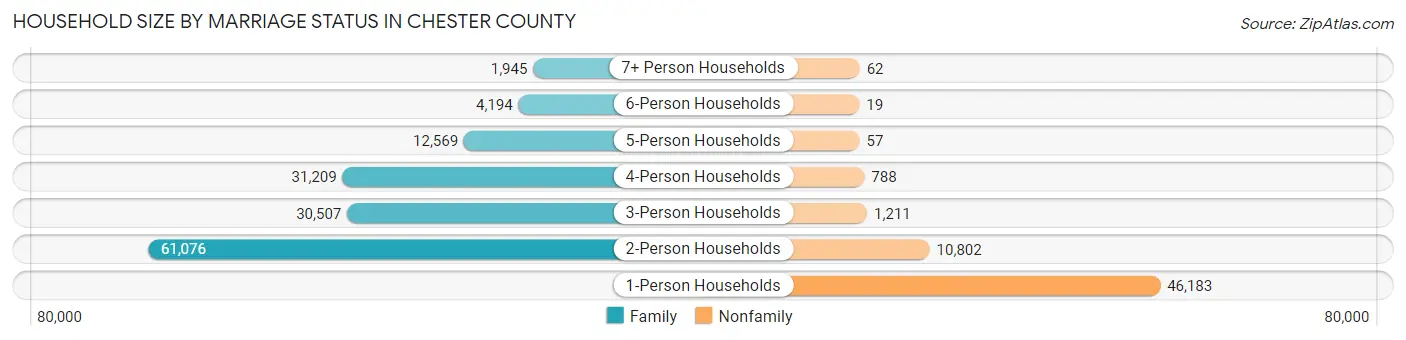
| Household Size | Family Households | Nonfamily Households |
| 1-Person Households | - | 46,183 (23.0%) |
| 2-Person Households | 61,076 (30.4%) | 10,802 (5.4%) |
| 3-Person Households | 30,507 (15.2%) | 1,211 (0.6%) |
| 4-Person Households | 31,209 (15.6%) | 788 (0.4%) |
| 5-Person Households | 12,569 (6.3%) | 57 (0.0%) |
| 6-Person Households | 4,194 (2.1%) | 19 (0.0%) |
| 7+ Person Households | 1,945 (1.0%) | 62 (0.0%) |
| Total | 141,500 (70.5%) | 59,122 (29.5%) |
Female Fertility in Chester County
Fertility by Age in Chester County
Average fertility rate in Chester County is 48.0 births per 1,000 women. Women in the age bracket of 20 to 34 years have the highest fertility rate with 77.0 births per 1,000 women. Women in the age bracket of 20 to 34 years acount for 61.9% of all women with births.
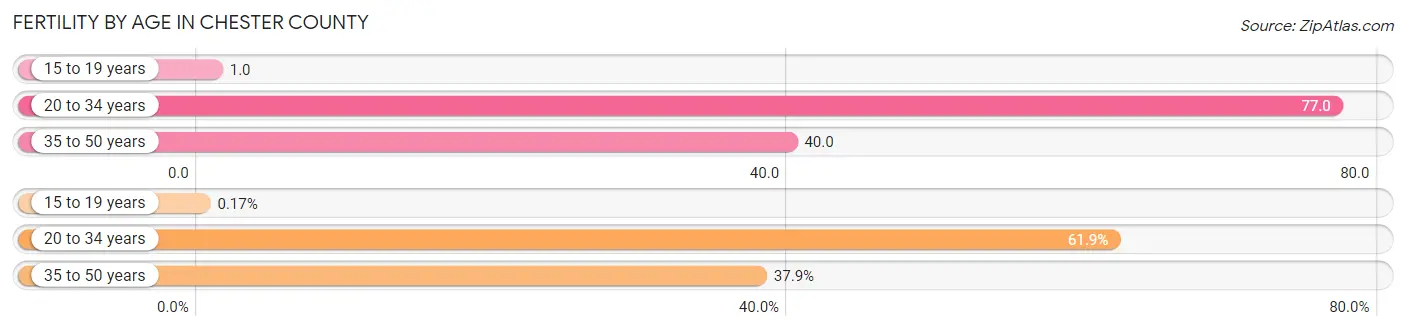
| Age Bracket | Women with Births | Births / 1,000 Women |
| 15 to 19 years | 10 (0.2%) | 1.0 |
| 20 to 34 years | 3,563 (61.9%) | 77.0 |
| 35 to 50 years | 2,183 (37.9%) | 40.0 |
| Total | 5,756 (100.0%) | 48.0 |
Fertility by Age by Marriage Status in Chester County
84.4% of women with births (5,756) in Chester County are married. The highest percentage of unmarried women with births falls into 15 to 19 years age bracket with 100.0% of them unmarried at the time of birth, while the lowest percentage of unmarried women with births belong to 35 to 50 years age bracket with 10.2% of them unmarried.
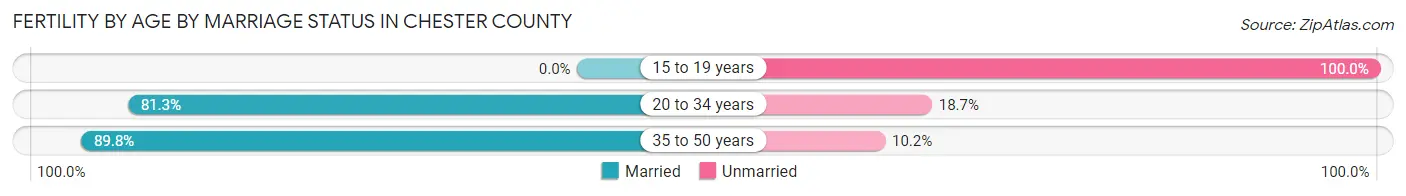
| Age Bracket | Married | Unmarried |
| 15 to 19 years | 0 (0.0%) | 10 (100.0%) |
| 20 to 34 years | 2,897 (81.3%) | 666 (18.7%) |
| 35 to 50 years | 1,960 (89.8%) | 223 (10.2%) |
| Total | 4,858 (84.4%) | 898 (15.6%) |
Fertility by Education in Chester County
Average fertility rate in Chester County is 48.0 births per 1,000 women. Women with the education attainment of graduate degree have the highest fertility rate of 68.0 births per 1,000 women, while women with the education attainment of less than high school have the lowest fertility at 35.0 births per 1,000 women. Women with the education attainment of bachelor's degree represent 28.5% of all women with births.
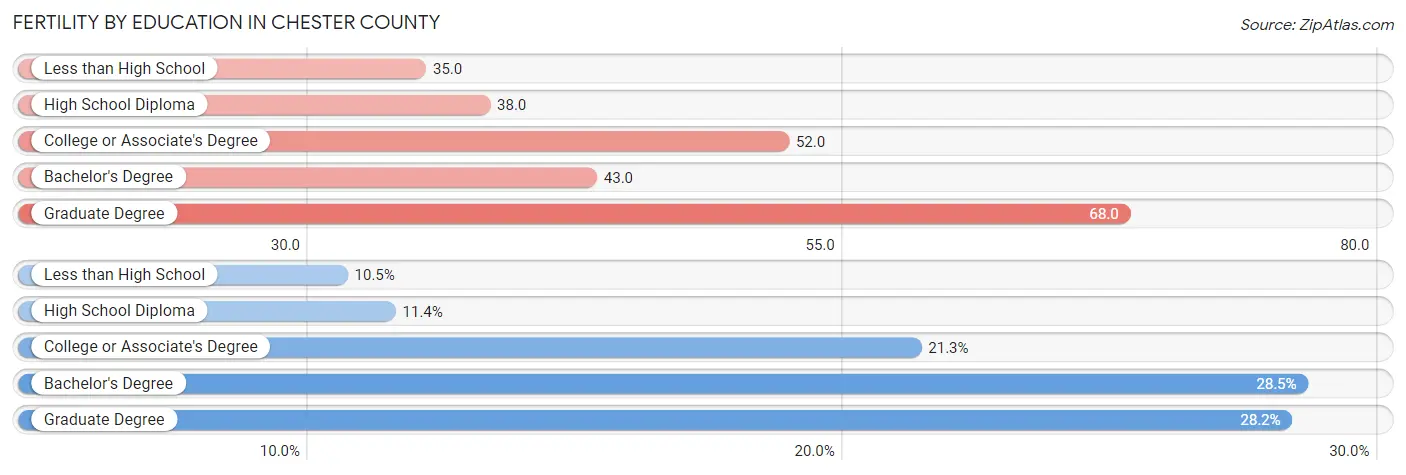
| Educational Attainment | Women with Births | Births / 1,000 Women |
| Less than High School | 606 (10.5%) | 35.0 |
| High School Diploma | 658 (11.4%) | 38.0 |
| College or Associate's Degree | 1,225 (21.3%) | 52.0 |
| Bachelor's Degree | 1,642 (28.5%) | 43.0 |
| Graduate Degree | 1,625 (28.2%) | 68.0 |
| Total | 5,756 (100.0%) | 48.0 |
Fertility by Education by Marriage Status in Chester County
15.6% of women with births in Chester County are unmarried. Women with the educational attainment of bachelor's degree are most likely to be married with 96.8% of them married at childbirth, while women with the educational attainment of high school diploma are least likely to be married with 43.6% of them unmarried at childbirth.
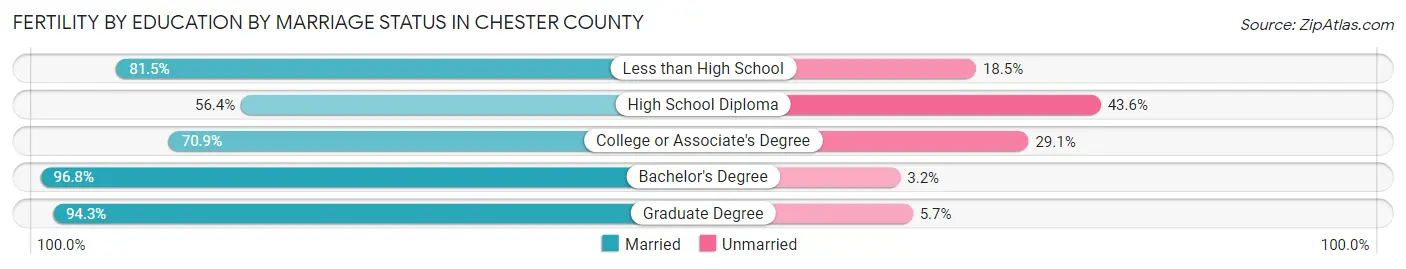
| Educational Attainment | Married | Unmarried |
| Less than High School | 494 (81.5%) | 112 (18.5%) |
| High School Diploma | 371 (56.4%) | 287 (43.6%) |
| College or Associate's Degree | 869 (70.9%) | 356 (29.1%) |
| Bachelor's Degree | 1,589 (96.8%) | 53 (3.2%) |
| Graduate Degree | 1,532 (94.3%) | 93 (5.7%) |
| Total | 4,858 (84.4%) | 898 (15.6%) |
Employment Characteristics in Chester County
Employment by Class of Employer in Chester County
Among the 278,038 employed individuals in Chester County, private company employees (196,915 | 70.8%), not-for-profit organizations (28,570 | 10.3%), and self-employed (not incorporated) (14,541 | 5.2%) make up the most common classes of employment.
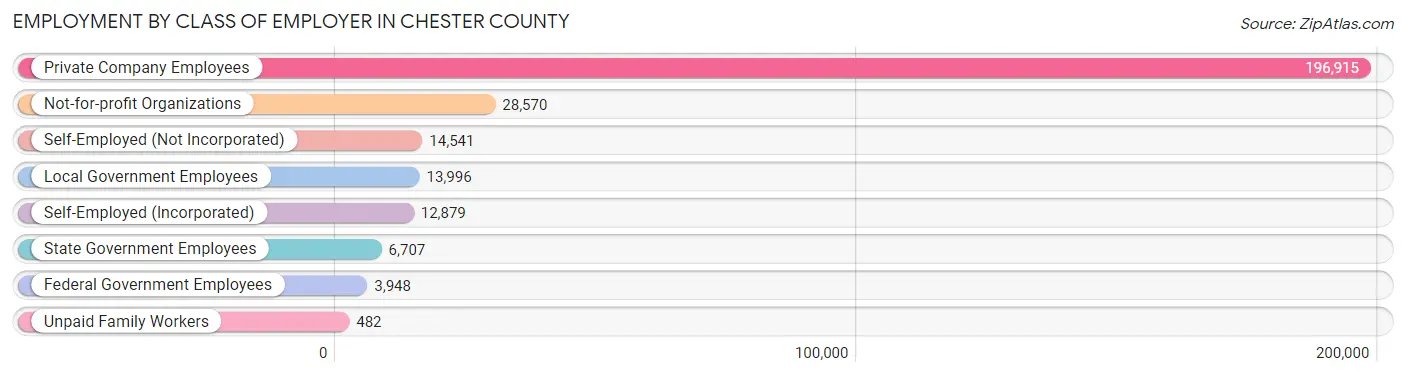
| Employer Class | # Employees | % Employees |
| Private Company Employees | 196,915 | 70.8% |
| Self-Employed (Incorporated) | 12,879 | 4.6% |
| Self-Employed (Not Incorporated) | 14,541 | 5.2% |
| Not-for-profit Organizations | 28,570 | 10.3% |
| Local Government Employees | 13,996 | 5.0% |
| State Government Employees | 6,707 | 2.4% |
| Federal Government Employees | 3,948 | 1.4% |
| Unpaid Family Workers | 482 | 0.2% |
| Total | 278,038 | 100.0% |
Employment Status by Age in Chester County
According to the labor force statistics for Chester County, out of the total population over 16 years of age (432,259), 68.2% or 294,801 individuals are in the labor force, with 4.0% or 11,792 of them unemployed. The age group with the highest labor force participation rate is 25 to 29 years, with 88.3% or 26,154 individuals in the labor force. Within the labor force, the 16 to 19 years age range has the highest percentage of unemployed individuals, with 11.1% or 1,416 of them being unemployed.
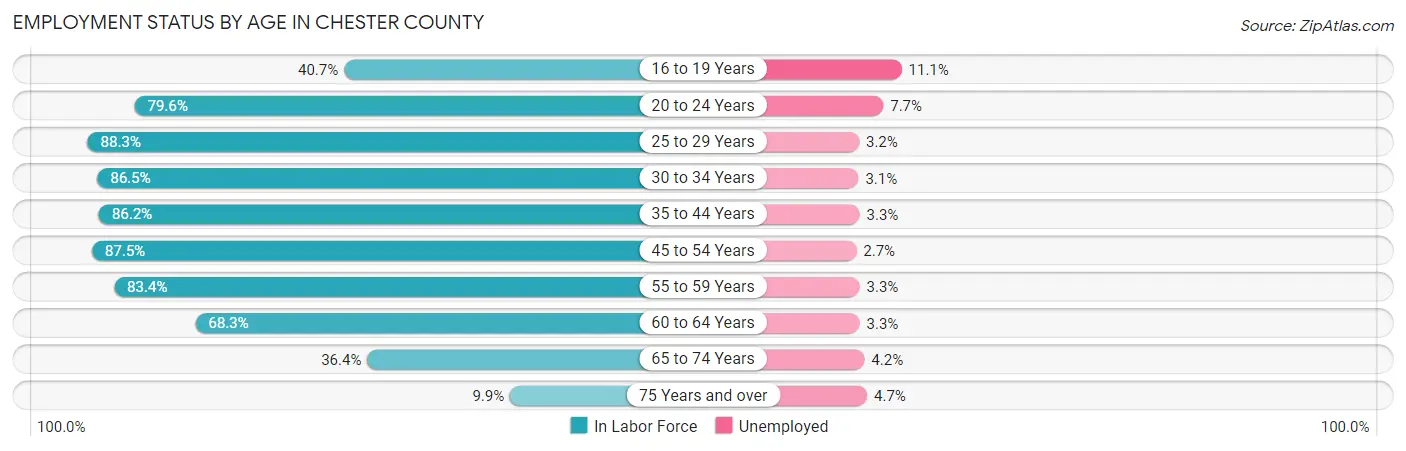
| Age Bracket | In Labor Force | Unemployed |
| 16 to 19 Years | 12,754 (40.7%) | 1,416 (11.1%) |
| 20 to 24 Years | 26,643 (79.6%) | 2,052 (7.7%) |
| 25 to 29 Years | 26,154 (88.3%) | 837 (3.2%) |
| 30 to 34 Years | 27,356 (86.5%) | 848 (3.1%) |
| 35 to 44 Years | 58,682 (86.2%) | 1,937 (3.3%) |
| 45 to 54 Years | 62,885 (87.5%) | 1,698 (2.7%) |
| 55 to 59 Years | 32,053 (83.4%) | 1,058 (3.3%) |
| 60 to 64 Years | 25,118 (68.3%) | 829 (3.3%) |
| 65 to 74 Years | 19,490 (36.4%) | 819 (4.2%) |
| 75 Years and over | 3,713 (9.9%) | 175 (4.7%) |
| Total | 294,801 (68.2%) | 11,792 (4.0%) |
Employment Status by Educational Attainment in Chester County
According to labor force statistics for Chester County, 84.0% of individuals (232,176) out of the total population between 25 and 64 years of age (276,400) are in the labor force, with 3.1% or 7,197 of them being unemployed. The group with the highest labor force participation rate are those with the educational attainment of bachelor's degree or higher, with 88.1% or 145,532 individuals in the labor force. Within the labor force, individuals with college / associate degree education have the highest percentage of unemployment, with 5.2% or 2,226 of them being unemployed.
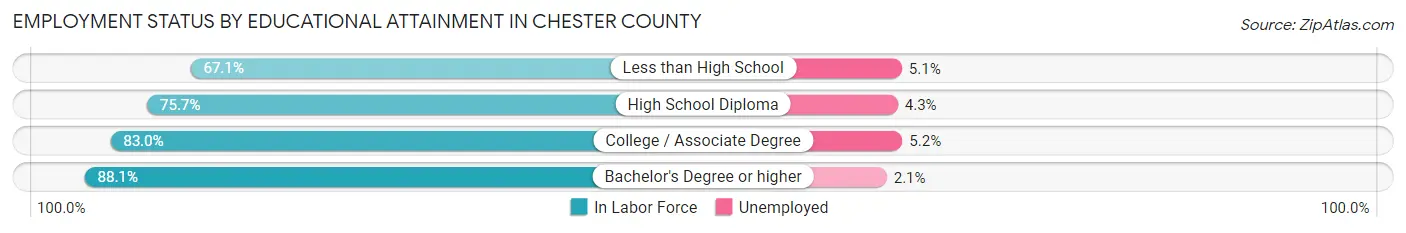
| Educational Attainment | In Labor Force | Unemployed |
| Less than High School | 9,196 (67.1%) | 699 (5.1%) |
| High School Diploma | 34,764 (75.7%) | 1,975 (4.3%) |
| College / Associate Degree | 42,814 (83.0%) | 2,682 (5.2%) |
| Bachelor's Degree or higher | 145,532 (88.1%) | 3,469 (2.1%) |
| Total | 232,176 (84.0%) | 8,568 (3.1%) |
Employment Occupations by Sex in Chester County
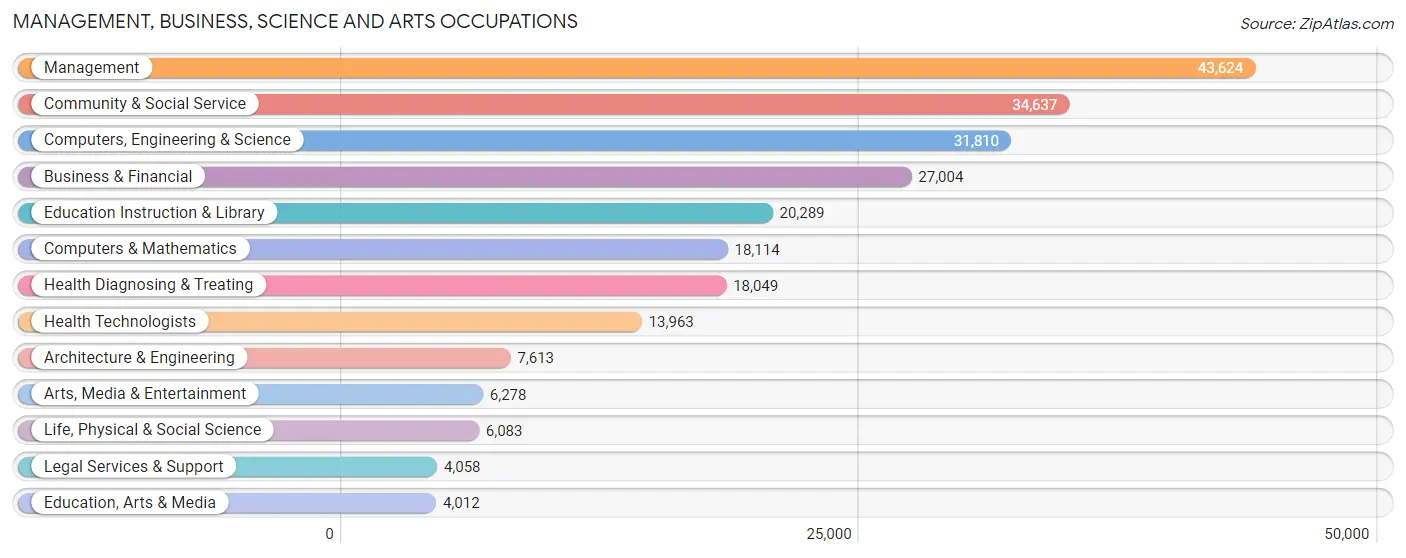
Management, Business, Science and Arts Occupations
The most common Management, Business, Science and Arts occupations in Chester County are Management (43,624 | 15.4%), Community & Social Service (34,637 | 12.2%), Computers, Engineering & Science (31,810 | 11.2%), Business & Financial (27,004 | 9.5%), and Education Instruction & Library (20,289 | 7.2%).
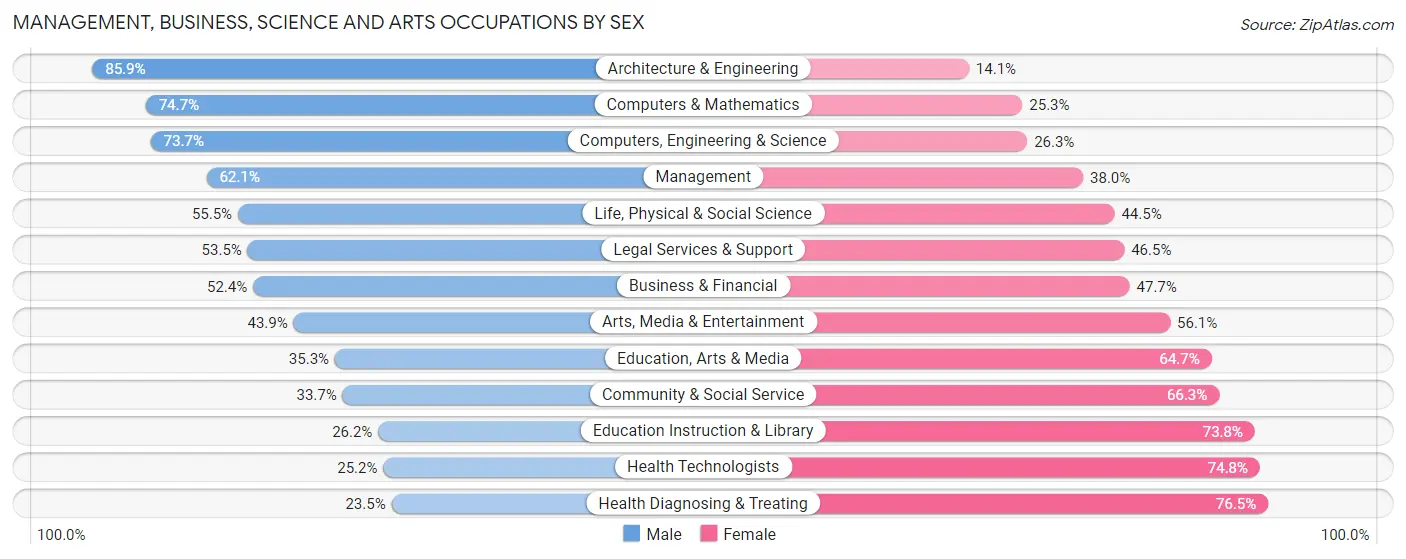
Management, Business, Science and Arts Occupations by Sex
Within the Management, Business, Science and Arts occupations in Chester County, the most male-oriented occupations are Architecture & Engineering (85.9%), Computers & Mathematics (74.7%), and Computers, Engineering & Science (73.7%), while the most female-oriented occupations are Health Diagnosing & Treating (76.5%), Health Technologists (74.8%), and Education Instruction & Library (73.8%).
| Occupation | Male | Female |
| Management | 27,069 (62.1%) | 16,555 (38.0%) |
| Business & Financial | 14,137 (52.3%) | 12,867 (47.6%) |
| Computers, Engineering & Science | 23,448 (73.7%) | 8,362 (26.3%) |
| Computers & Mathematics | 13,535 (74.7%) | 4,579 (25.3%) |
| Architecture & Engineering | 6,537 (85.9%) | 1,076 (14.1%) |
| Life, Physical & Social Science | 3,376 (55.5%) | 2,707 (44.5%) |
| Community & Social Service | 11,665 (33.7%) | 22,972 (66.3%) |
| Education, Arts & Media | 1,415 (35.3%) | 2,597 (64.7%) |
| Legal Services & Support | 2,170 (53.5%) | 1,888 (46.5%) |
| Education Instruction & Library | 5,324 (26.2%) | 14,965 (73.8%) |
| Arts, Media & Entertainment | 2,756 (43.9%) | 3,522 (56.1%) |
| Health Diagnosing & Treating | 4,236 (23.5%) | 13,813 (76.5%) |
| Health Technologists | 3,516 (25.2%) | 10,447 (74.8%) |
| Total (Category) | 80,555 (51.9%) | 74,569 (48.1%) |
| Total (Overall) | 152,168 (53.8%) | 130,780 (46.2%) |
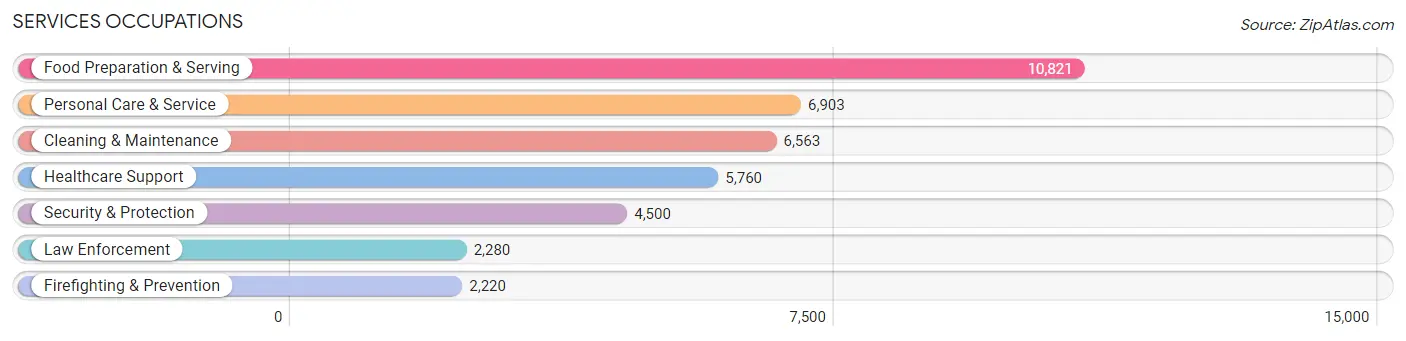
Services Occupations
The most common Services occupations in Chester County are Food Preparation & Serving (10,821 | 3.8%), Personal Care & Service (6,903 | 2.4%), Cleaning & Maintenance (6,563 | 2.3%), Healthcare Support (5,760 | 2.0%), and Security & Protection (4,500 | 1.6%).
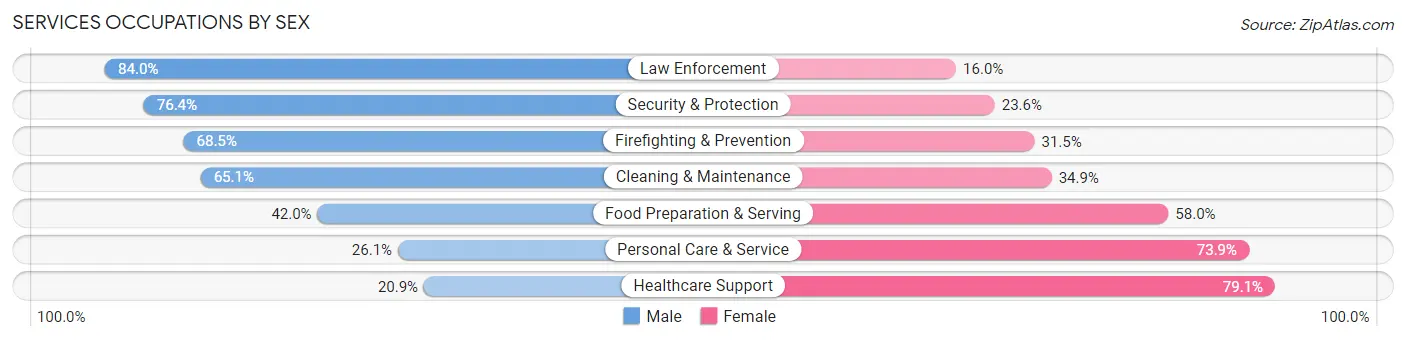
Services Occupations by Sex
Within the Services occupations in Chester County, the most male-oriented occupations are Law Enforcement (84.0%), Security & Protection (76.4%), and Firefighting & Prevention (68.5%), while the most female-oriented occupations are Healthcare Support (79.1%), Personal Care & Service (73.9%), and Food Preparation & Serving (58.0%).
| Occupation | Male | Female |
| Healthcare Support | 1,205 (20.9%) | 4,555 (79.1%) |
| Security & Protection | 3,437 (76.4%) | 1,063 (23.6%) |
| Firefighting & Prevention | 1,521 (68.5%) | 699 (31.5%) |
| Law Enforcement | 1,916 (84.0%) | 364 (16.0%) |
| Food Preparation & Serving | 4,546 (42.0%) | 6,275 (58.0%) |
| Cleaning & Maintenance | 4,274 (65.1%) | 2,289 (34.9%) |
| Personal Care & Service | 1,800 (26.1%) | 5,103 (73.9%) |
| Total (Category) | 15,262 (44.2%) | 19,285 (55.8%) |
| Total (Overall) | 152,168 (53.8%) | 130,780 (46.2%) |
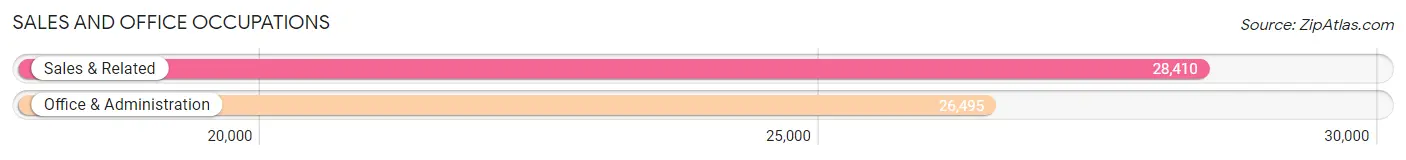
Sales and Office Occupations
The most common Sales and Office occupations in Chester County are Sales & Related (28,410 | 10.0%), and Office & Administration (26,495 | 9.4%).
Sales and Office Occupations by Sex
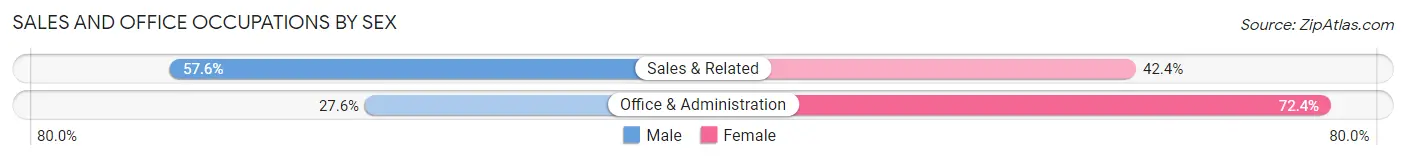
| Occupation | Male | Female |
| Sales & Related | 16,371 (57.6%) | 12,039 (42.4%) |
| Office & Administration | 7,322 (27.6%) | 19,173 (72.4%) |
| Total (Category) | 23,693 (43.1%) | 31,212 (56.9%) |
| Total (Overall) | 152,168 (53.8%) | 130,780 (46.2%) |
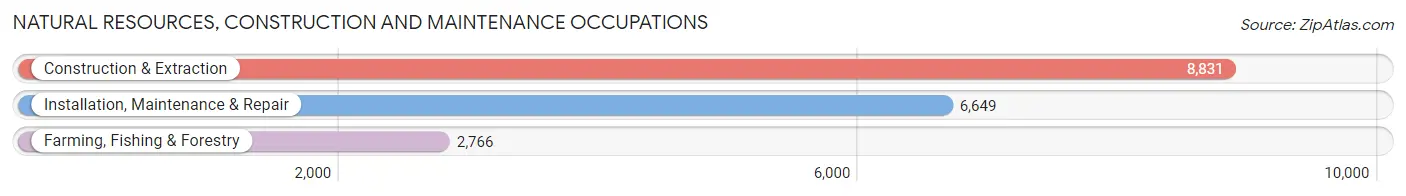
Natural Resources, Construction and Maintenance Occupations
The most common Natural Resources, Construction and Maintenance occupations in Chester County are Construction & Extraction (8,831 | 3.1%), Installation, Maintenance & Repair (6,649 | 2.4%), and Farming, Fishing & Forestry (2,766 | 1.0%).
Natural Resources, Construction and Maintenance Occupations by Sex
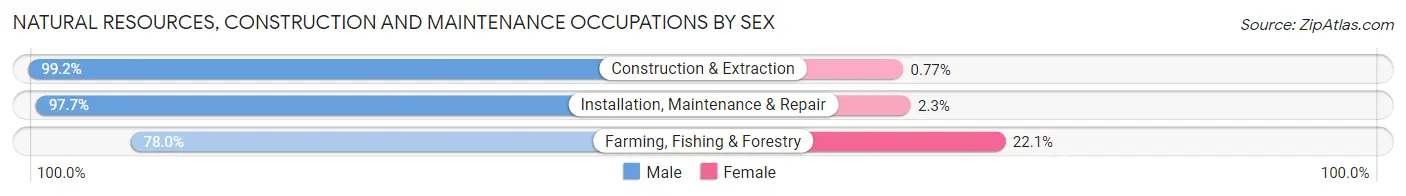
| Occupation | Male | Female |
| Farming, Fishing & Forestry | 2,156 (77.9%) | 610 (22.1%) |
| Construction & Extraction | 8,763 (99.2%) | 68 (0.8%) |
| Installation, Maintenance & Repair | 6,495 (97.7%) | 154 (2.3%) |
| Total (Category) | 17,414 (95.4%) | 832 (4.6%) |
| Total (Overall) | 152,168 (53.8%) | 130,780 (46.2%) |
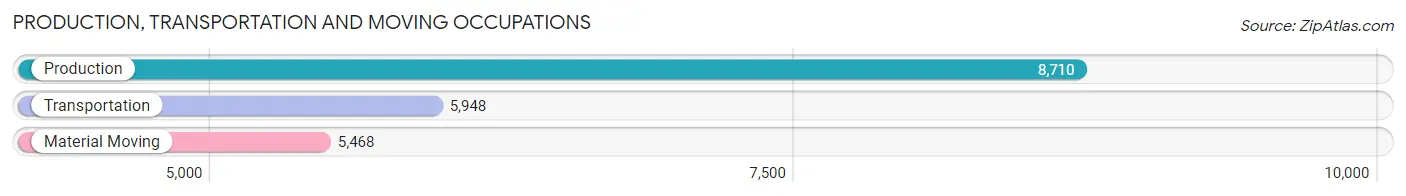
Production, Transportation and Moving Occupations
The most common Production, Transportation and Moving occupations in Chester County are Production (8,710 | 3.1%), Transportation (5,948 | 2.1%), and Material Moving (5,468 | 1.9%).
Production, Transportation and Moving Occupations by Sex
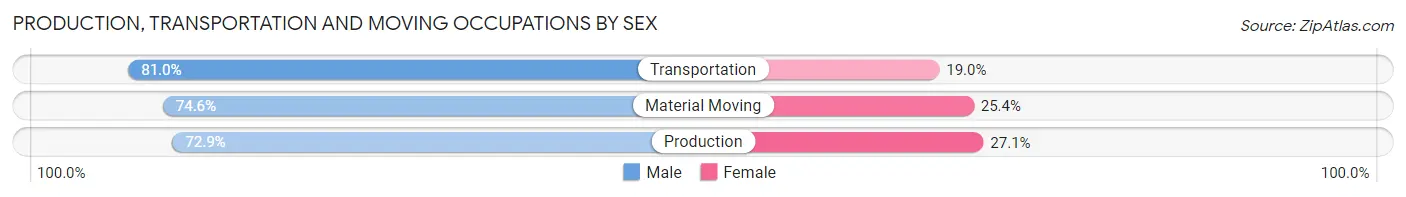
| Occupation | Male | Female |
| Production | 6,347 (72.9%) | 2,363 (27.1%) |
| Transportation | 4,816 (81.0%) | 1,132 (19.0%) |
| Material Moving | 4,081 (74.6%) | 1,387 (25.4%) |
| Total (Category) | 15,244 (75.7%) | 4,882 (24.3%) |
| Total (Overall) | 152,168 (53.8%) | 130,780 (46.2%) |
Employment Industries by Sex in Chester County
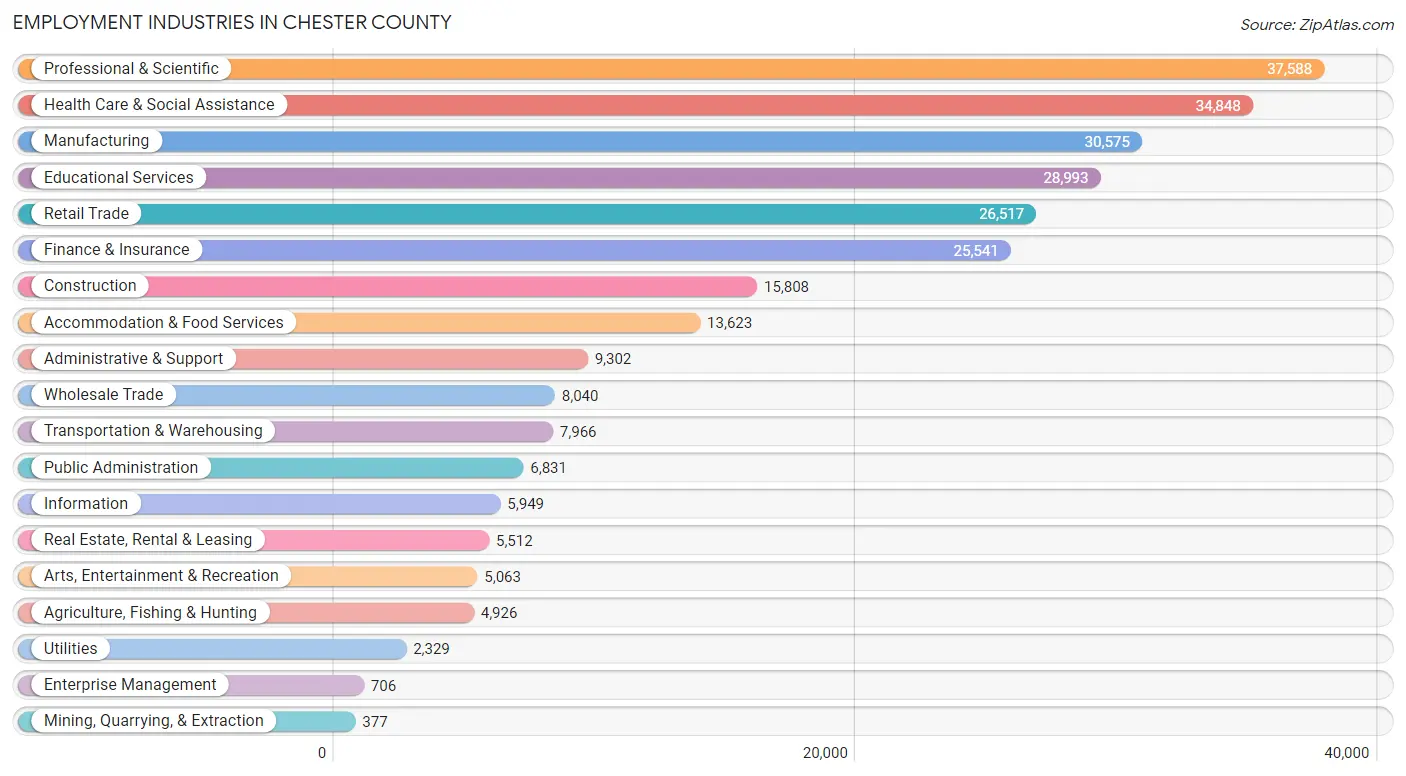
Employment Industries in Chester County
The major employment industries in Chester County include Professional & Scientific (37,588 | 13.3%), Health Care & Social Assistance (34,848 | 12.3%), Manufacturing (30,575 | 10.8%), Educational Services (28,993 | 10.2%), and Retail Trade (26,517 | 9.4%).
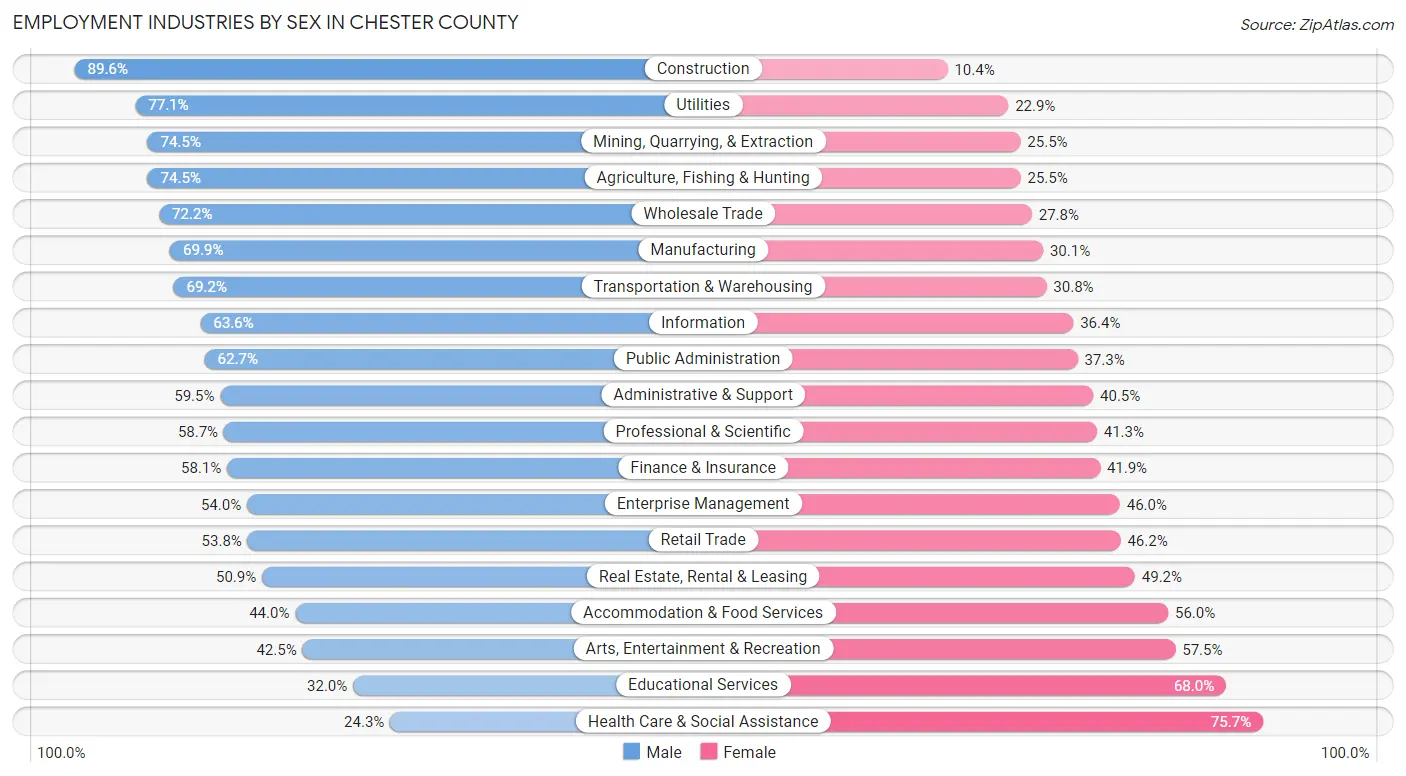
Employment Industries by Sex in Chester County
The Chester County industries that see more men than women are Construction (89.6%), Utilities (77.1%), and Mining, Quarrying, & Extraction (74.5%), whereas the industries that tend to have a higher number of women are Health Care & Social Assistance (75.7%), Educational Services (68.0%), and Arts, Entertainment & Recreation (57.5%).
| Industry | Male | Female |
| Agriculture, Fishing & Hunting | 3,671 (74.5%) | 1,255 (25.5%) |
| Mining, Quarrying, & Extraction | 281 (74.5%) | 96 (25.5%) |
| Construction | 14,170 (89.6%) | 1,638 (10.4%) |
| Manufacturing | 21,362 (69.9%) | 9,213 (30.1%) |
| Wholesale Trade | 5,803 (72.2%) | 2,237 (27.8%) |
| Retail Trade | 14,275 (53.8%) | 12,242 (46.2%) |
| Transportation & Warehousing | 5,509 (69.2%) | 2,457 (30.8%) |
| Utilities | 1,795 (77.1%) | 534 (22.9%) |
| Information | 3,784 (63.6%) | 2,165 (36.4%) |
| Finance & Insurance | 14,834 (58.1%) | 10,707 (41.9%) |
| Real Estate, Rental & Leasing | 2,803 (50.8%) | 2,709 (49.1%) |
| Professional & Scientific | 22,081 (58.7%) | 15,507 (41.3%) |
| Enterprise Management | 381 (54.0%) | 325 (46.0%) |
| Administrative & Support | 5,534 (59.5%) | 3,768 (40.5%) |
| Educational Services | 9,278 (32.0%) | 19,715 (68.0%) |
| Health Care & Social Assistance | 8,482 (24.3%) | 26,366 (75.7%) |
| Arts, Entertainment & Recreation | 2,151 (42.5%) | 2,912 (57.5%) |
| Accommodation & Food Services | 5,991 (44.0%) | 7,632 (56.0%) |
| Public Administration | 4,285 (62.7%) | 2,546 (37.3%) |
| Total | 152,168 (53.8%) | 130,780 (46.2%) |
Education in Chester County
School Enrollment in Chester County
The most common levels of schooling among the 134,135 students in Chester County are middle school (29,291 | 21.8%), high school (29,262 | 21.8%), and college / undergraduate (27,200 | 20.3%).
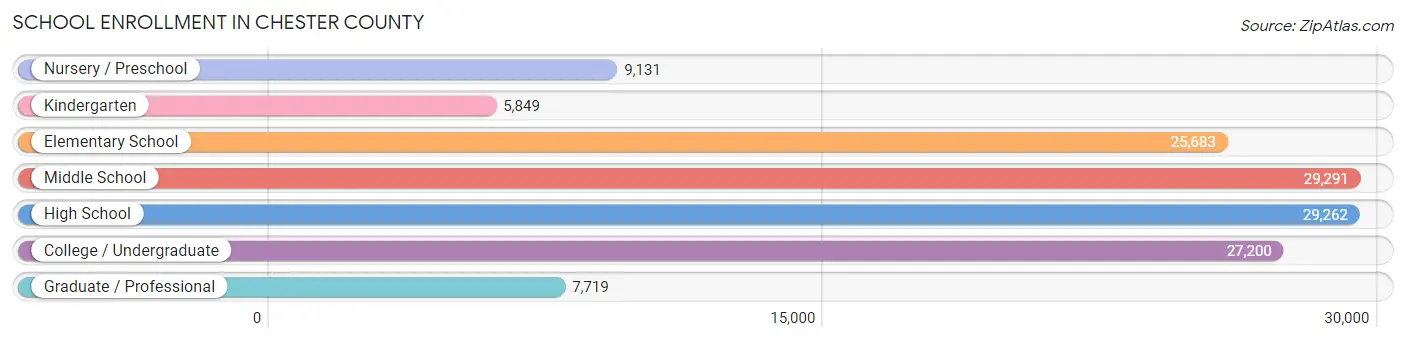
| School Level | # Students | % Students |
| Nursery / Preschool | 9,131 | 6.8% |
| Kindergarten | 5,849 | 4.4% |
| Elementary School | 25,683 | 19.2% |
| Middle School | 29,291 | 21.8% |
| High School | 29,262 | 21.8% |
| College / Undergraduate | 27,200 | 20.3% |
| Graduate / Professional | 7,719 | 5.8% |
| Total | 134,135 | 100.0% |
School Enrollment by Age by Funding Source in Chester County
Out of a total of 134,135 students who are enrolled in schools in Chester County, 30,851 (23.0%) attend a private institution, while the remaining 103,284 (77.0%) are enrolled in public schools. The age group of 3 to 4 year olds has the highest likelihood of being enrolled in private schools, with 4,000 (57.8% in the age bracket) enrolled. Conversely, the age group of 10 to 14 year olds has the lowest likelihood of being enrolled in a private school, with 30,184 (84.2% in the age bracket) attending a public institution.
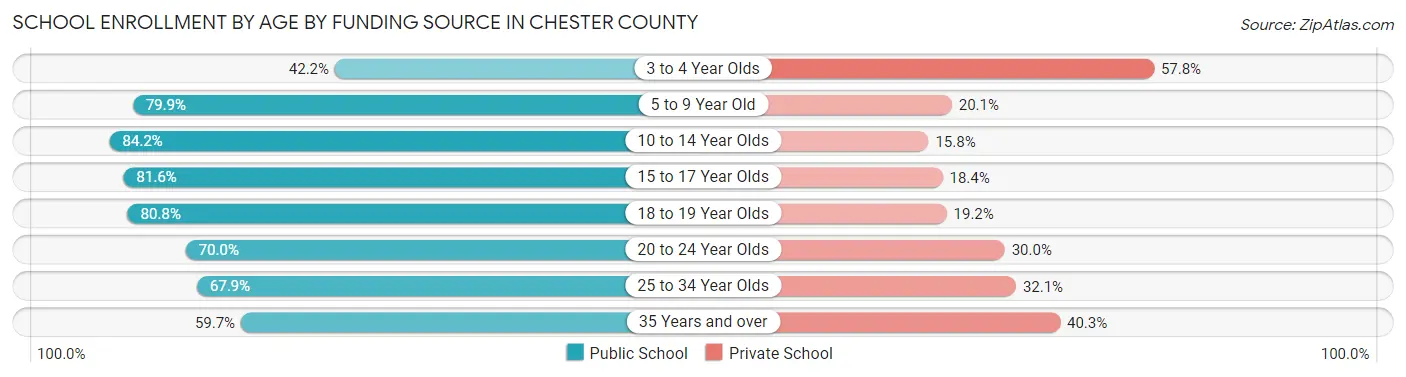
| Age Bracket | Public School | Private School |
| 3 to 4 Year Olds | 2,922 (42.2%) | 4,000 (57.8%) |
| 5 to 9 Year Old | 23,826 (79.9%) | 6,008 (20.1%) |
| 10 to 14 Year Olds | 30,184 (84.2%) | 5,665 (15.8%) |
| 15 to 17 Year Olds | 17,788 (81.6%) | 4,015 (18.4%) |
| 18 to 19 Year Olds | 10,893 (80.8%) | 2,584 (19.2%) |
| 20 to 24 Year Olds | 10,227 (70.0%) | 4,382 (30.0%) |
| 25 to 34 Year Olds | 4,210 (67.9%) | 1,989 (32.1%) |
| 35 Years and over | 3,249 (59.7%) | 2,193 (40.3%) |
| Total | 103,284 (77.0%) | 30,851 (23.0%) |
Educational Attainment by Field of Study in Chester County
Business (47,909 | 21.6%), education (21,306 | 9.6%), engineering (20,446 | 9.2%), science & technology (19,640 | 8.8%), and social sciences (17,417 | 7.8%) are the most common fields of study among 222,211 individuals in Chester County who have obtained a bachelor's degree or higher.
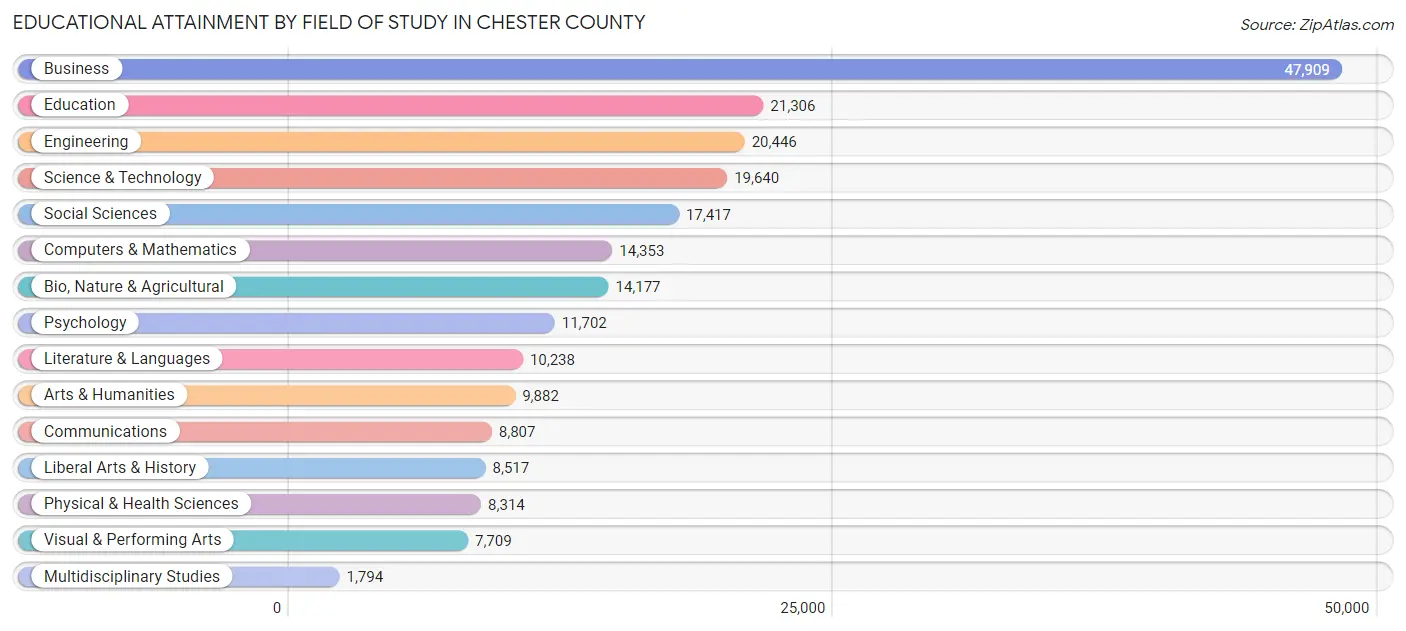
| Field of Study | # Graduates | % Graduates |
| Computers & Mathematics | 14,353 | 6.5% |
| Bio, Nature & Agricultural | 14,177 | 6.4% |
| Physical & Health Sciences | 8,314 | 3.7% |
| Psychology | 11,702 | 5.3% |
| Social Sciences | 17,417 | 7.8% |
| Engineering | 20,446 | 9.2% |
| Multidisciplinary Studies | 1,794 | 0.8% |
| Science & Technology | 19,640 | 8.8% |
| Business | 47,909 | 21.6% |
| Education | 21,306 | 9.6% |
| Literature & Languages | 10,238 | 4.6% |
| Liberal Arts & History | 8,517 | 3.8% |
| Visual & Performing Arts | 7,709 | 3.5% |
| Communications | 8,807 | 4.0% |
| Arts & Humanities | 9,882 | 4.4% |
| Total | 222,211 | 100.0% |
Transportation & Commute in Chester County
Vehicle Availability by Sex in Chester County
The most prevalent vehicle ownership categories in Chester County are males with 2 vehicles (70,417, accounting for 47.5%) and females with 2 vehicles (58,706, making up 56.2%).
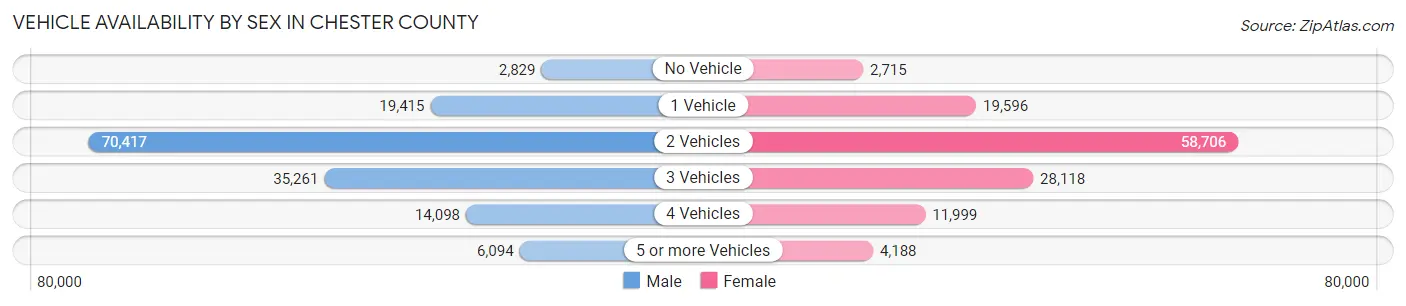
| Vehicles Available | Male | Female |
| No Vehicle | 2,829 (1.9%) | 2,715 (2.2%) |
| 1 Vehicle | 19,415 (13.1%) | 19,596 (15.6%) |
| 2 Vehicles | 70,417 (47.5%) | 58,706 (46.8%) |
| 3 Vehicles | 35,261 (23.8%) | 28,118 (22.4%) |
| 4 Vehicles | 14,098 (9.5%) | 11,999 (9.6%) |
| 5 or more Vehicles | 6,094 (4.1%) | 4,188 (3.3%) |
| Total | 148,114 (100.0%) | 125,322 (100.0%) |
Commute Time in Chester County
The most frequently occuring commute durations in Chester County are 15 to 19 minutes (31,317 commuters, 13.9%), 20 to 24 minutes (31,155 commuters, 13.8%), and 30 to 34 minutes (29,961 commuters, 13.3%).
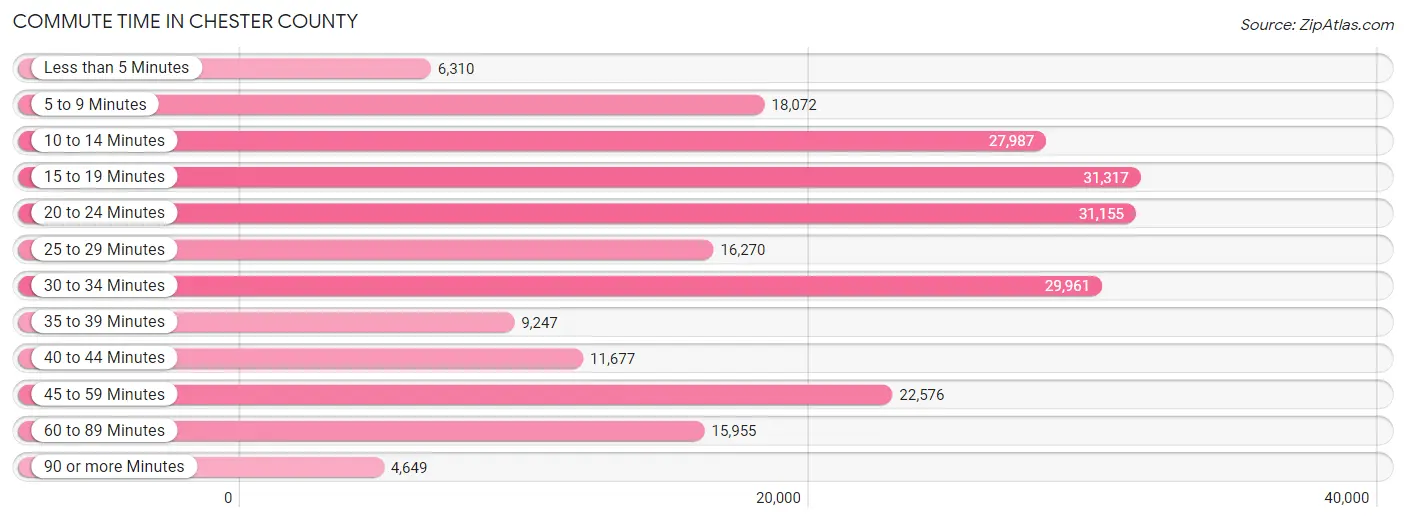
| Commute Time | # Commuters | % Commuters |
| Less than 5 Minutes | 6,310 | 2.8% |
| 5 to 9 Minutes | 18,072 | 8.0% |
| 10 to 14 Minutes | 27,987 | 12.4% |
| 15 to 19 Minutes | 31,317 | 13.9% |
| 20 to 24 Minutes | 31,155 | 13.8% |
| 25 to 29 Minutes | 16,270 | 7.2% |
| 30 to 34 Minutes | 29,961 | 13.3% |
| 35 to 39 Minutes | 9,247 | 4.1% |
| 40 to 44 Minutes | 11,677 | 5.2% |
| 45 to 59 Minutes | 22,576 | 10.0% |
| 60 to 89 Minutes | 15,955 | 7.1% |
| 90 or more Minutes | 4,649 | 2.1% |
Commute Time by Sex in Chester County
The most common commute times in Chester County are 20 to 24 minutes (16,752 commuters, 13.8%) for males and 15 to 19 minutes (14,917 commuters, 14.3%) for females.
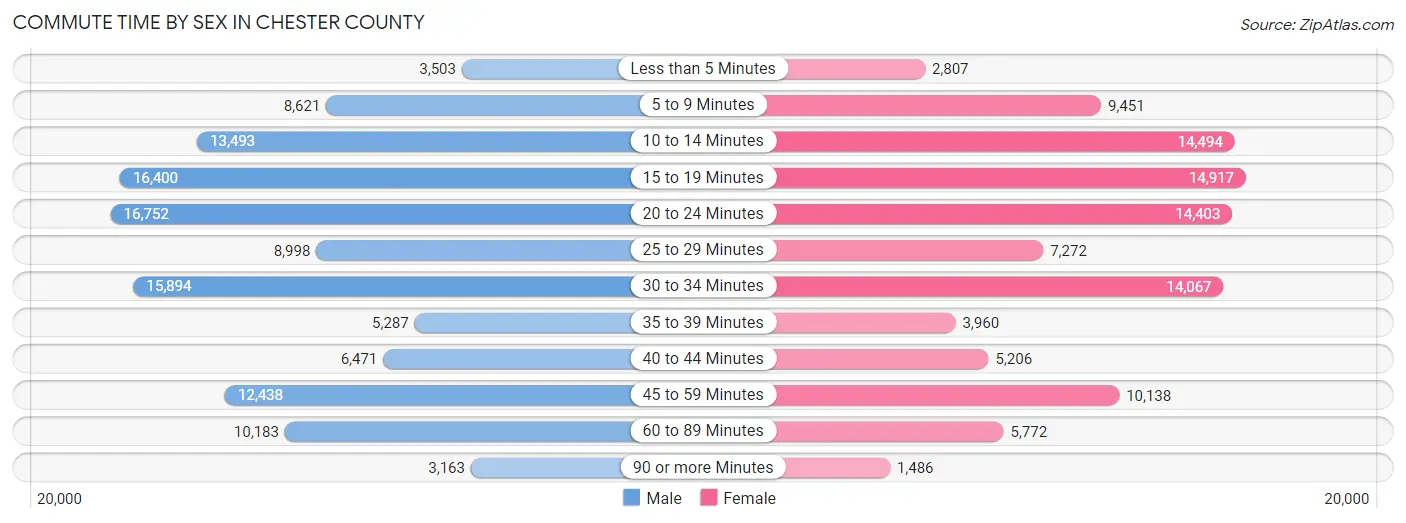
| Commute Time | Male | Female |
| Less than 5 Minutes | 3,503 (2.9%) | 2,807 (2.7%) |
| 5 to 9 Minutes | 8,621 (7.1%) | 9,451 (9.1%) |
| 10 to 14 Minutes | 13,493 (11.1%) | 14,494 (13.9%) |
| 15 to 19 Minutes | 16,400 (13.5%) | 14,917 (14.3%) |
| 20 to 24 Minutes | 16,752 (13.8%) | 14,403 (13.9%) |
| 25 to 29 Minutes | 8,998 (7.4%) | 7,272 (7.0%) |
| 30 to 34 Minutes | 15,894 (13.1%) | 14,067 (13.5%) |
| 35 to 39 Minutes | 5,287 (4.4%) | 3,960 (3.8%) |
| 40 to 44 Minutes | 6,471 (5.3%) | 5,206 (5.0%) |
| 45 to 59 Minutes | 12,438 (10.3%) | 10,138 (9.8%) |
| 60 to 89 Minutes | 10,183 (8.4%) | 5,772 (5.6%) |
| 90 or more Minutes | 3,163 (2.6%) | 1,486 (1.4%) |
Time of Departure to Work by Sex in Chester County
The most frequent times of departure to work in Chester County are 8:00 AM to 8:29 AM (17,460, 14.4%) for males and 7:00 AM to 7:29 AM (17,395, 16.7%) for females.
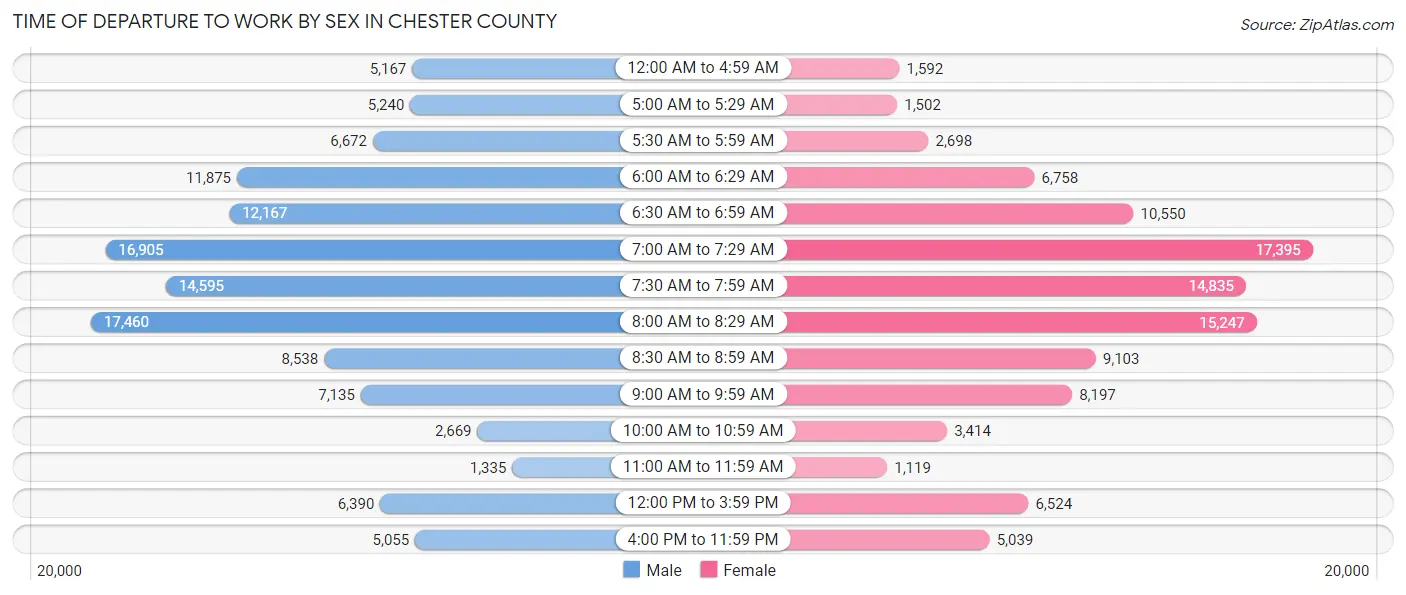
| Time of Departure | Male | Female |
| 12:00 AM to 4:59 AM | 5,167 (4.3%) | 1,592 (1.5%) |
| 5:00 AM to 5:29 AM | 5,240 (4.3%) | 1,502 (1.4%) |
| 5:30 AM to 5:59 AM | 6,672 (5.5%) | 2,698 (2.6%) |
| 6:00 AM to 6:29 AM | 11,875 (9.8%) | 6,758 (6.5%) |
| 6:30 AM to 6:59 AM | 12,167 (10.0%) | 10,550 (10.2%) |
| 7:00 AM to 7:29 AM | 16,905 (14.0%) | 17,395 (16.7%) |
| 7:30 AM to 7:59 AM | 14,595 (12.0%) | 14,835 (14.3%) |
| 8:00 AM to 8:29 AM | 17,460 (14.4%) | 15,247 (14.7%) |
| 8:30 AM to 8:59 AM | 8,538 (7.0%) | 9,103 (8.8%) |
| 9:00 AM to 9:59 AM | 7,135 (5.9%) | 8,197 (7.9%) |
| 10:00 AM to 10:59 AM | 2,669 (2.2%) | 3,414 (3.3%) |
| 11:00 AM to 11:59 AM | 1,335 (1.1%) | 1,119 (1.1%) |
| 12:00 PM to 3:59 PM | 6,390 (5.3%) | 6,524 (6.3%) |
| 4:00 PM to 11:59 PM | 5,055 (4.2%) | 5,039 (4.9%) |
| Total | 121,203 (100.0%) | 103,973 (100.0%) |
Housing Occupancy in Chester County
Occupancy by Ownership in Chester County
Of the total 200,622 dwellings in Chester County, owner-occupied units account for 149,753 (74.6%), while renter-occupied units make up 50,869 (25.4%).
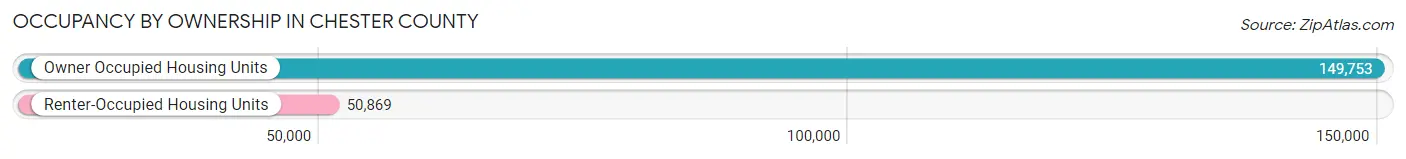
| Occupancy | # Housing Units | % Housing Units |
| Owner Occupied Housing Units | 149,753 | 74.6% |
| Renter-Occupied Housing Units | 50,869 | 25.4% |
| Total Occupied Housing Units | 200,622 | 100.0% |
Occupancy by Household Size in Chester County
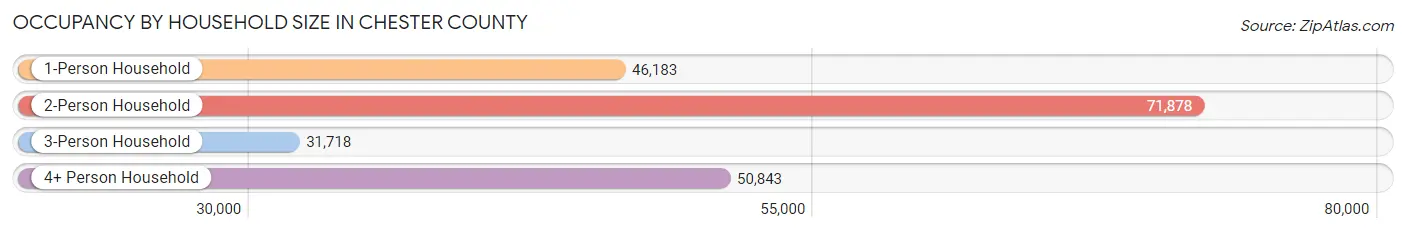
| Household Size | # Housing Units | % Housing Units |
| 1-Person Household | 46,183 | 23.0% |
| 2-Person Household | 71,878 | 35.8% |
| 3-Person Household | 31,718 | 15.8% |
| 4+ Person Household | 50,843 | 25.3% |
| Total Housing Units | 200,622 | 100.0% |
Occupancy by Ownership by Household Size in Chester County
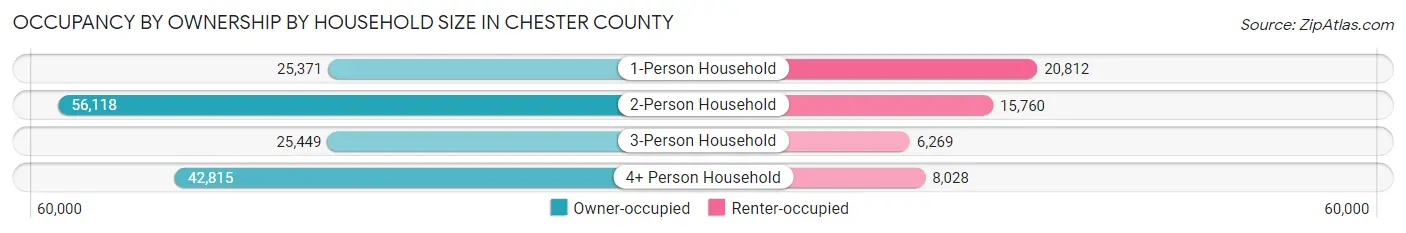
| Household Size | Owner-occupied | Renter-occupied |
| 1-Person Household | 25,371 (54.9%) | 20,812 (45.1%) |
| 2-Person Household | 56,118 (78.1%) | 15,760 (21.9%) |
| 3-Person Household | 25,449 (80.2%) | 6,269 (19.8%) |
| 4+ Person Household | 42,815 (84.2%) | 8,028 (15.8%) |
| Total Housing Units | 149,753 (74.6%) | 50,869 (25.4%) |
Occupancy by Educational Attainment in Chester County
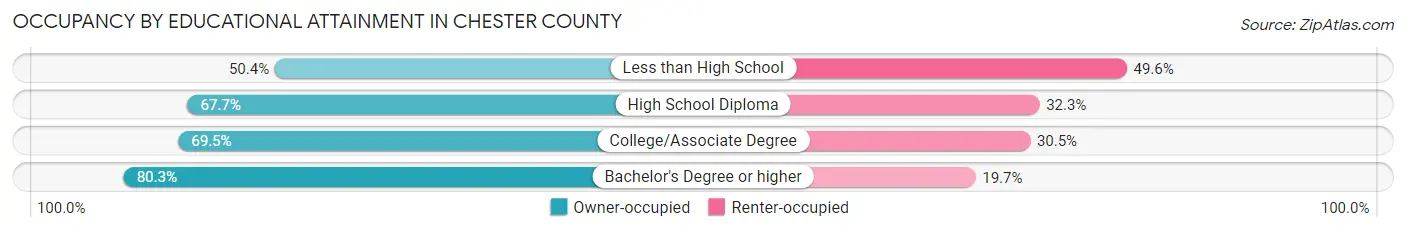
| Household Size | Owner-occupied | Renter-occupied |
| Less than High School | 4,747 (50.4%) | 4,680 (49.6%) |
| High School Diploma | 23,227 (67.7%) | 11,092 (32.3%) |
| College/Associate Degree | 27,292 (69.5%) | 11,970 (30.5%) |
| Bachelor's Degree or higher | 94,487 (80.3%) | 23,127 (19.7%) |
Occupancy by Age of Householder in Chester County
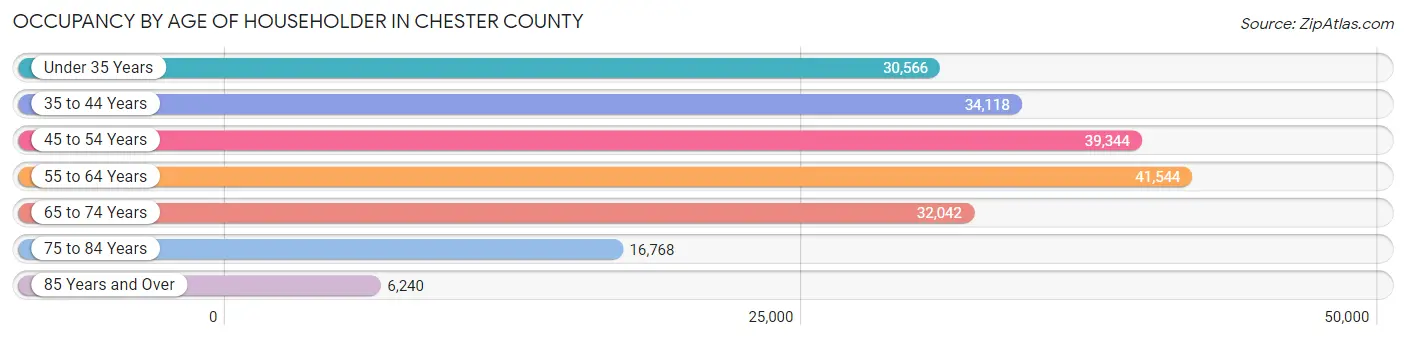
| Age Bracket | # Households | % Households |
| Under 35 Years | 30,566 | 15.2% |
| 35 to 44 Years | 34,118 | 17.0% |
| 45 to 54 Years | 39,344 | 19.6% |
| 55 to 64 Years | 41,544 | 20.7% |
| 65 to 74 Years | 32,042 | 16.0% |
| 75 to 84 Years | 16,768 | 8.4% |
| 85 Years and Over | 6,240 | 3.1% |
| Total | 200,622 | 100.0% |
Housing Finances in Chester County
Median Income by Occupancy in Chester County
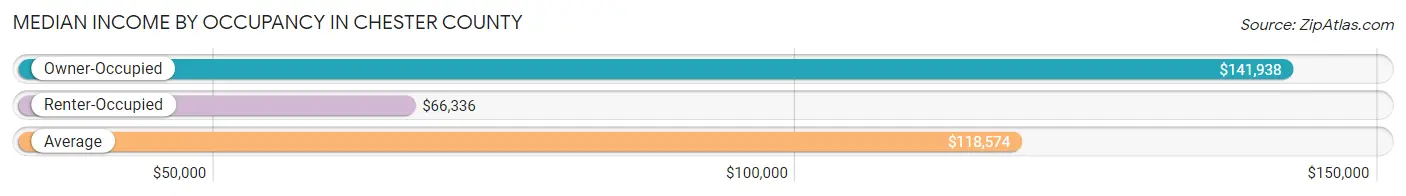
| Occupancy Type | # Households | Median Income |
| Owner-Occupied | 149,753 (74.6%) | $141,938 |
| Renter-Occupied | 50,869 (25.4%) | $66,336 |
| Average | 200,622 (100.0%) | $118,574 |
Occupancy by Householder Income Bracket in Chester County
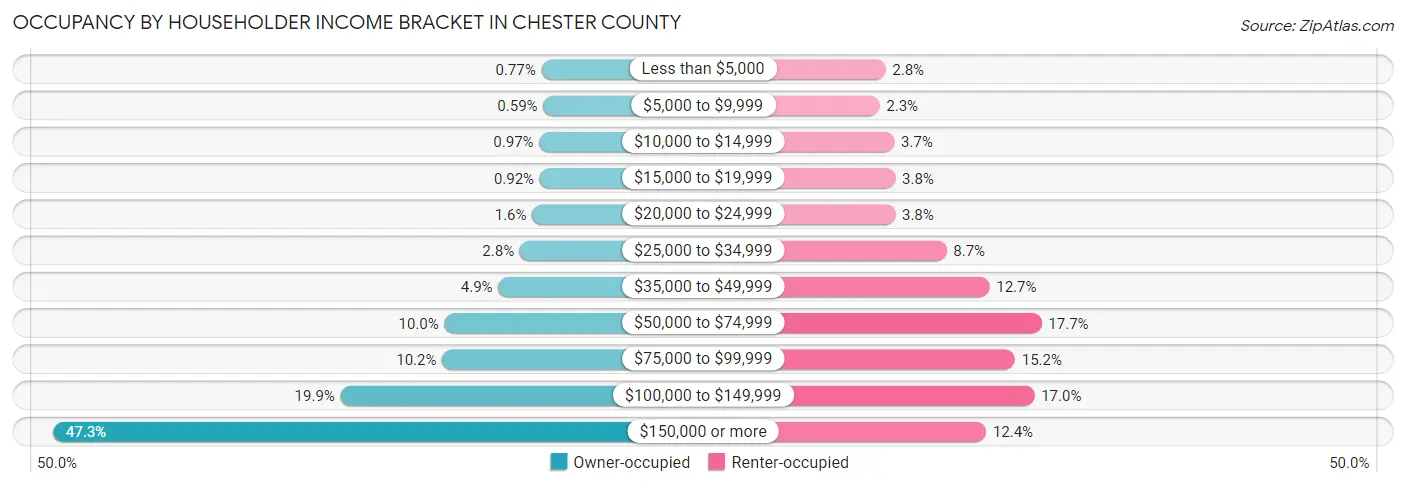
| Income Bracket | Owner-occupied | Renter-occupied |
| Less than $5,000 | 1,149 (0.8%) | 1,443 (2.8%) |
| $5,000 to $9,999 | 885 (0.6%) | 1,154 (2.3%) |
| $10,000 to $14,999 | 1,450 (1.0%) | 1,865 (3.7%) |
| $15,000 to $19,999 | 1,379 (0.9%) | 1,919 (3.8%) |
| $20,000 to $24,999 | 2,458 (1.6%) | 1,912 (3.8%) |
| $25,000 to $34,999 | 4,224 (2.8%) | 4,398 (8.6%) |
| $35,000 to $49,999 | 7,288 (4.9%) | 6,481 (12.7%) |
| $50,000 to $74,999 | 14,977 (10.0%) | 9,003 (17.7%) |
| $75,000 to $99,999 | 15,299 (10.2%) | 7,717 (15.2%) |
| $100,000 to $149,999 | 29,808 (19.9%) | 8,657 (17.0%) |
| $150,000 or more | 70,836 (47.3%) | 6,320 (12.4%) |
| Total | 149,753 (100.0%) | 50,869 (100.0%) |
Monthly Housing Cost Tiers in Chester County
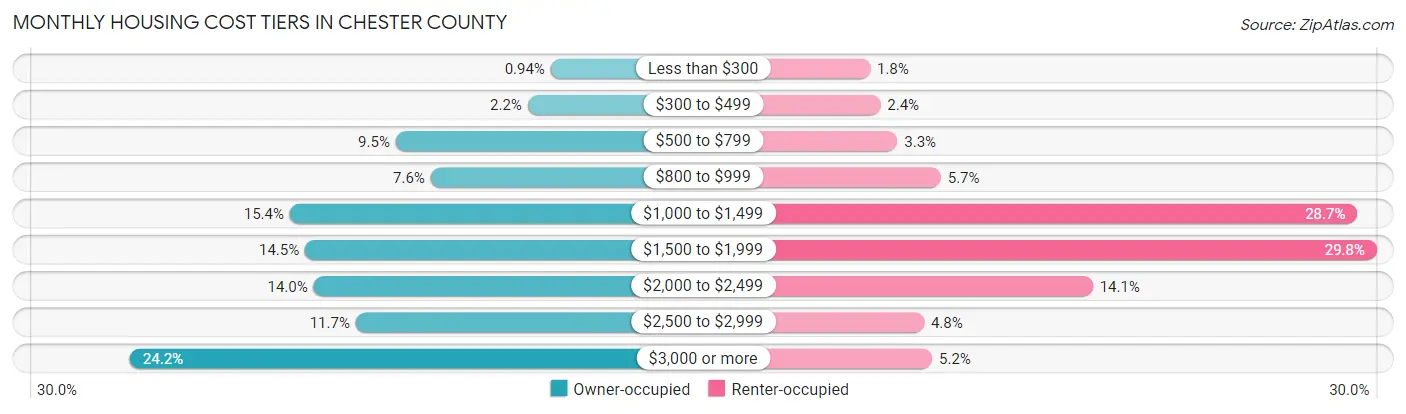
| Monthly Cost | Owner-occupied | Renter-occupied |
| Less than $300 | 1,406 (0.9%) | 917 (1.8%) |
| $300 to $499 | 3,304 (2.2%) | 1,208 (2.4%) |
| $500 to $799 | 14,228 (9.5%) | 1,683 (3.3%) |
| $800 to $999 | 11,330 (7.6%) | 2,907 (5.7%) |
| $1,000 to $1,499 | 22,990 (15.3%) | 14,604 (28.7%) |
| $1,500 to $1,999 | 21,730 (14.5%) | 15,156 (29.8%) |
| $2,000 to $2,499 | 21,020 (14.0%) | 7,171 (14.1%) |
| $2,500 to $2,999 | 17,537 (11.7%) | 2,430 (4.8%) |
| $3,000 or more | 36,208 (24.2%) | 2,661 (5.2%) |
| Total | 149,753 (100.0%) | 50,869 (100.0%) |
Physical Housing Characteristics in Chester County
Housing Structures in Chester County
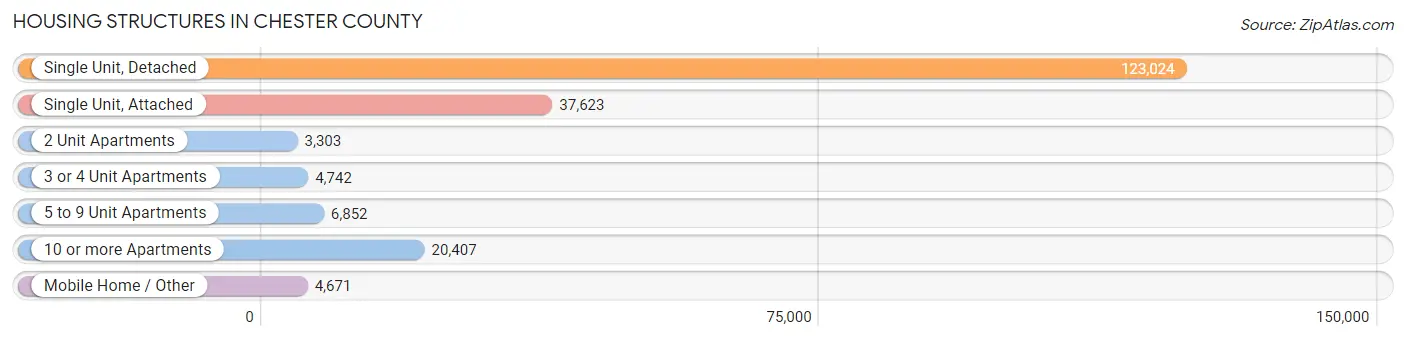
| Structure Type | # Housing Units | % Housing Units |
| Single Unit, Detached | 123,024 | 61.3% |
| Single Unit, Attached | 37,623 | 18.8% |
| 2 Unit Apartments | 3,303 | 1.7% |
| 3 or 4 Unit Apartments | 4,742 | 2.4% |
| 5 to 9 Unit Apartments | 6,852 | 3.4% |
| 10 or more Apartments | 20,407 | 10.2% |
| Mobile Home / Other | 4,671 | 2.3% |
| Total | 200,622 | 100.0% |
Housing Structures by Occupancy in Chester County
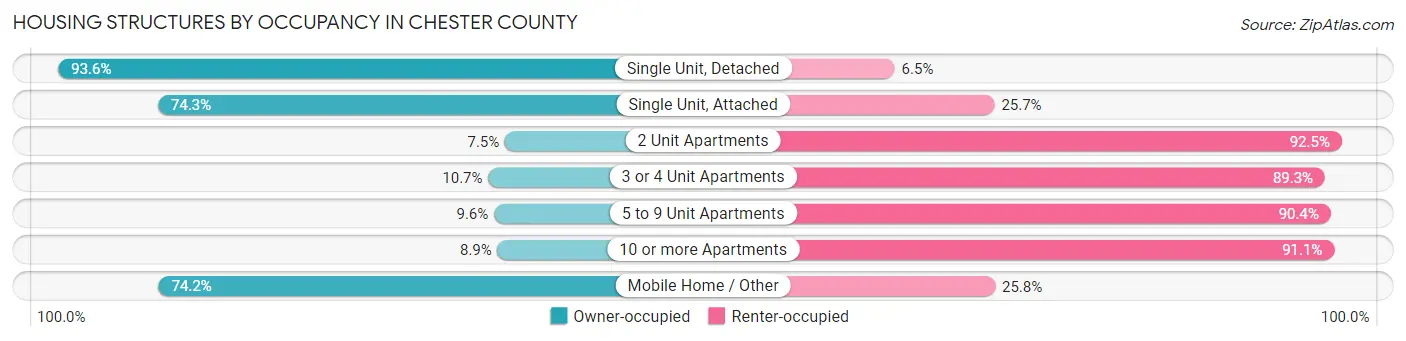
| Structure Type | Owner-occupied | Renter-occupied |
| Single Unit, Detached | 115,083 (93.5%) | 7,941 (6.5%) |
| Single Unit, Attached | 27,968 (74.3%) | 9,655 (25.7%) |
| 2 Unit Apartments | 247 (7.5%) | 3,056 (92.5%) |
| 3 or 4 Unit Apartments | 508 (10.7%) | 4,234 (89.3%) |
| 5 to 9 Unit Apartments | 658 (9.6%) | 6,194 (90.4%) |
| 10 or more Apartments | 1,822 (8.9%) | 18,585 (91.1%) |
| Mobile Home / Other | 3,467 (74.2%) | 1,204 (25.8%) |
| Total | 149,753 (74.6%) | 50,869 (25.4%) |
Housing Structures by Number of Rooms in Chester County
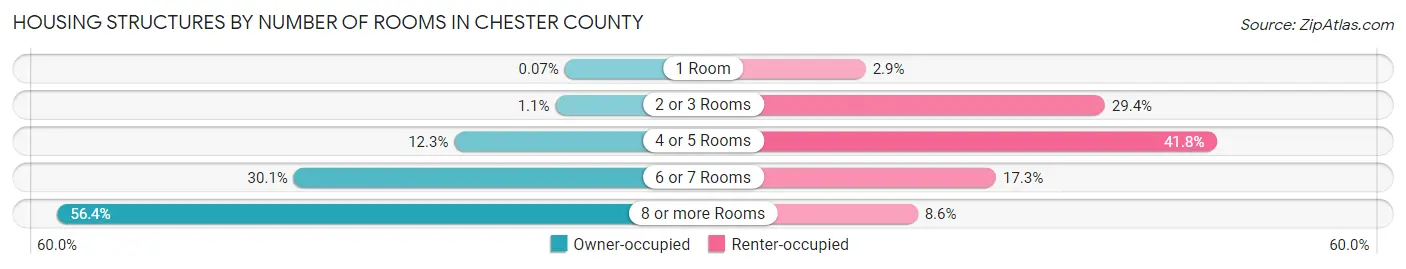
| Number of Rooms | Owner-occupied | Renter-occupied |
| 1 Room | 106 (0.1%) | 1,455 (2.9%) |
| 2 or 3 Rooms | 1,645 (1.1%) | 14,960 (29.4%) |
| 4 or 5 Rooms | 18,457 (12.3%) | 21,245 (41.8%) |
| 6 or 7 Rooms | 45,137 (30.1%) | 8,818 (17.3%) |
| 8 or more Rooms | 84,408 (56.4%) | 4,391 (8.6%) |
| Total | 149,753 (100.0%) | 50,869 (100.0%) |
Housing Structure by Heating Type in Chester County
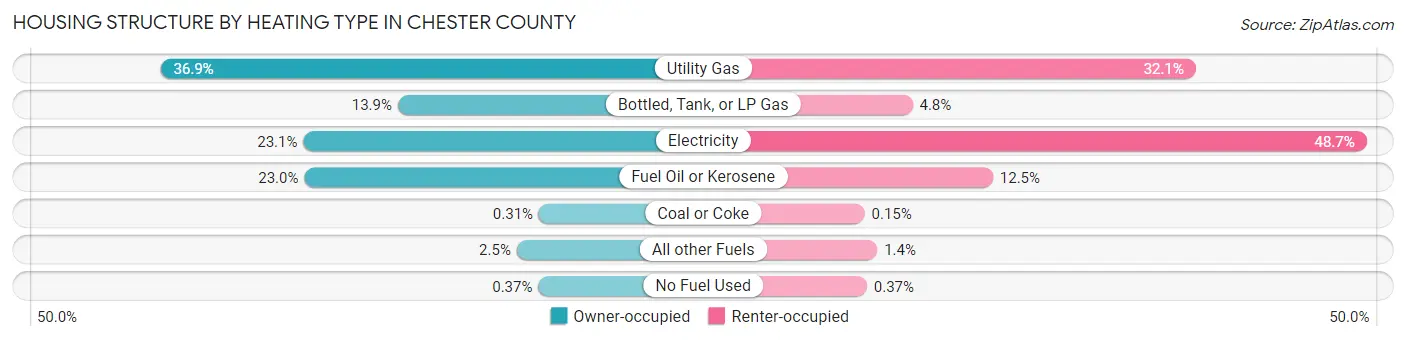
| Heating Type | Owner-occupied | Renter-occupied |
| Utility Gas | 55,215 (36.9%) | 16,347 (32.1%) |
| Bottled, Tank, or LP Gas | 20,875 (13.9%) | 2,430 (4.8%) |
| Electricity | 34,553 (23.1%) | 24,748 (48.6%) |
| Fuel Oil or Kerosene | 34,411 (23.0%) | 6,381 (12.5%) |
| Coal or Coke | 470 (0.3%) | 74 (0.2%) |
| All other Fuels | 3,672 (2.5%) | 699 (1.4%) |
| No Fuel Used | 557 (0.4%) | 190 (0.4%) |
| Total | 149,753 (100.0%) | 50,869 (100.0%) |
Household Vehicle Usage in Chester County
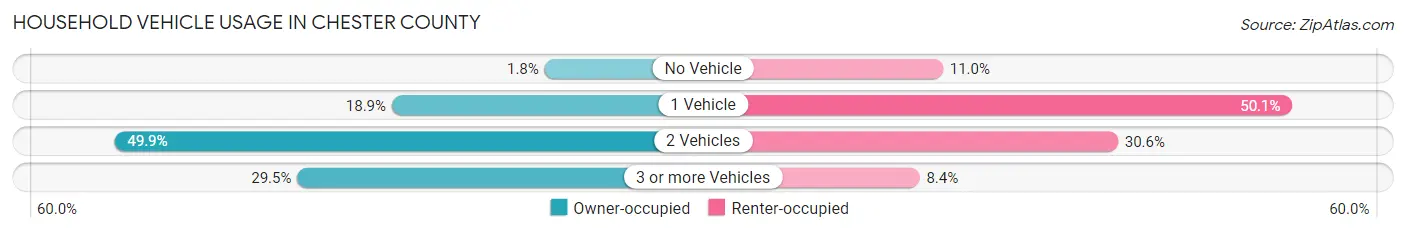
| Vehicles per Household | Owner-occupied | Renter-occupied |
| No Vehicle | 2,628 (1.8%) | 5,576 (11.0%) |
| 1 Vehicle | 28,242 (18.9%) | 25,492 (50.1%) |
| 2 Vehicles | 74,787 (49.9%) | 15,552 (30.6%) |
| 3 or more Vehicles | 44,096 (29.4%) | 4,249 (8.4%) |
| Total | 149,753 (100.0%) | 50,869 (100.0%) |
Real Estate & Mortgages in Chester County
Real Estate and Mortgage Overview in Chester County
| Characteristic | Without Mortgage | With Mortgage |
| Housing Units | 47,244 | 102,509 |
| Median Property Value | $407,500 | $445,800 |
| Median Household Income | $100,301 | $55,116 |
| Monthly Housing Costs | $917 | $35,779 |
| Real Estate Taxes | $5,651 | $798 |
Property Value by Mortgage Status in Chester County
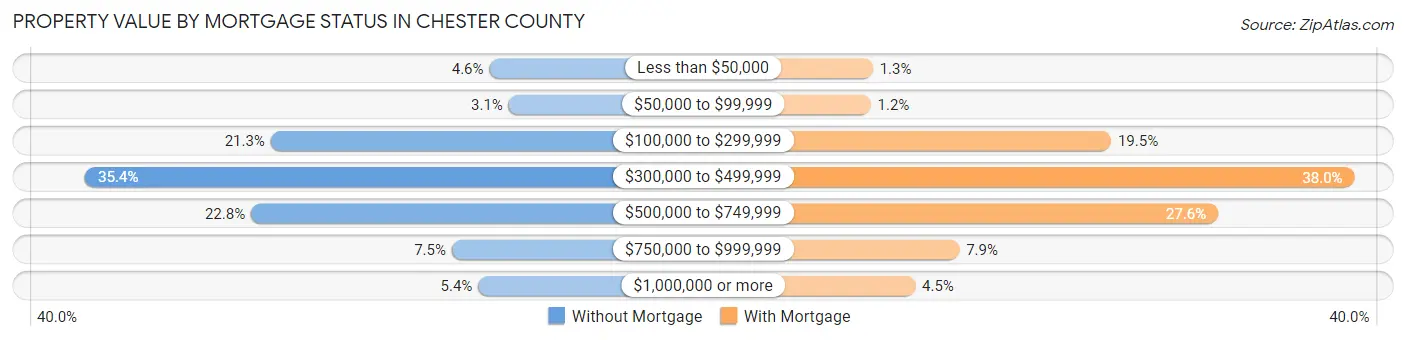
| Property Value | Without Mortgage | With Mortgage |
| Less than $50,000 | 2,169 (4.6%) | 1,346 (1.3%) |
| $50,000 to $99,999 | 1,475 (3.1%) | 1,183 (1.1%) |
| $100,000 to $299,999 | 10,040 (21.2%) | 19,946 (19.5%) |
| $300,000 to $499,999 | 16,720 (35.4%) | 38,967 (38.0%) |
| $500,000 to $749,999 | 10,749 (22.8%) | 28,309 (27.6%) |
| $750,000 to $999,999 | 3,522 (7.4%) | 8,103 (7.9%) |
| $1,000,000 or more | 2,569 (5.4%) | 4,655 (4.5%) |
| Total | 47,244 (100.0%) | 102,509 (100.0%) |
Household Income by Mortgage Status in Chester County
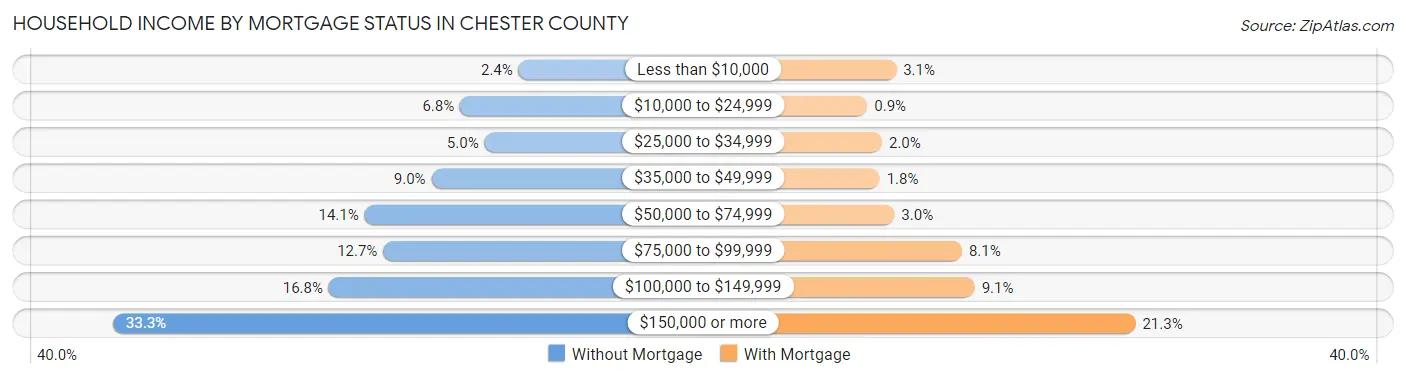
| Household Income | Without Mortgage | With Mortgage |
| Less than $10,000 | 1,115 (2.4%) | 3,178 (3.1%) |
| $10,000 to $24,999 | 3,220 (6.8%) | 919 (0.9%) |
| $25,000 to $34,999 | 2,342 (5.0%) | 2,067 (2.0%) |
| $35,000 to $49,999 | 4,250 (9.0%) | 1,882 (1.8%) |
| $50,000 to $74,999 | 6,660 (14.1%) | 3,038 (3.0%) |
| $75,000 to $99,999 | 5,991 (12.7%) | 8,317 (8.1%) |
| $100,000 to $149,999 | 7,946 (16.8%) | 9,308 (9.1%) |
| $150,000 or more | 15,720 (33.3%) | 21,862 (21.3%) |
| Total | 47,244 (100.0%) | 102,509 (100.0%) |
Property Value to Household Income Ratio in Chester County
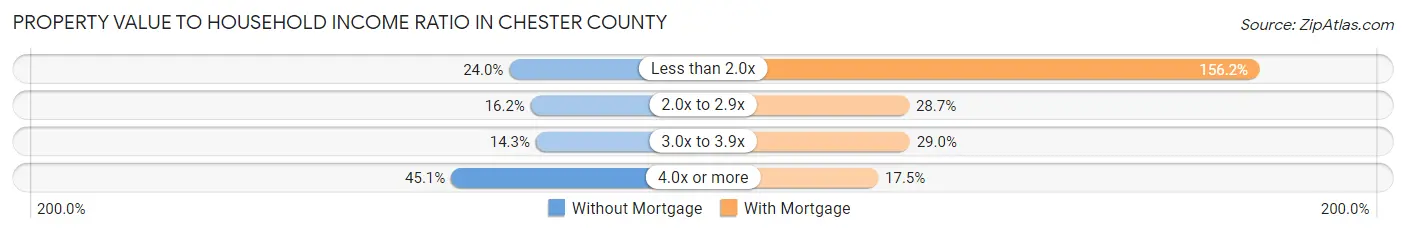
| Value-to-Income Ratio | Without Mortgage | With Mortgage |
| Less than 2.0x | 11,330 (24.0%) | 160,097 (156.2%) |
| 2.0x to 2.9x | 7,640 (16.2%) | 29,436 (28.7%) |
| 3.0x to 3.9x | 6,767 (14.3%) | 29,705 (29.0%) |
| 4.0x or more | 21,291 (45.1%) | 17,940 (17.5%) |
| Total | 47,244 (100.0%) | 102,509 (100.0%) |
Real Estate Taxes by Mortgage Status in Chester County
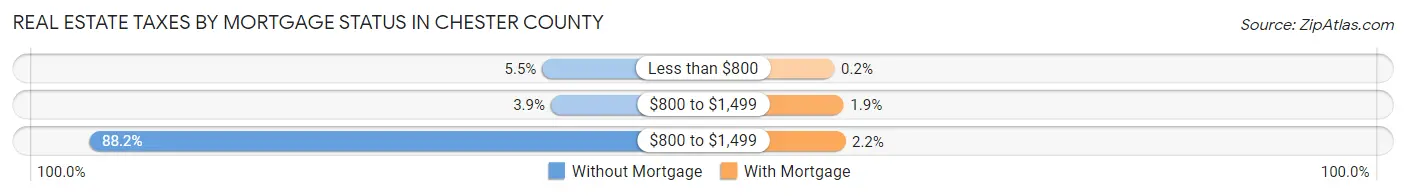
| Property Taxes | Without Mortgage | With Mortgage |
| Less than $800 | 2,579 (5.5%) | 204 (0.2%) |
| $800 to $1,499 | 1,836 (3.9%) | 1,940 (1.9%) |
| $800 to $1,499 | 41,676 (88.2%) | 2,248 (2.2%) |
| Total | 47,244 (100.0%) | 102,509 (100.0%) |
Health & Disability in Chester County
Health Insurance Coverage by Age in Chester County
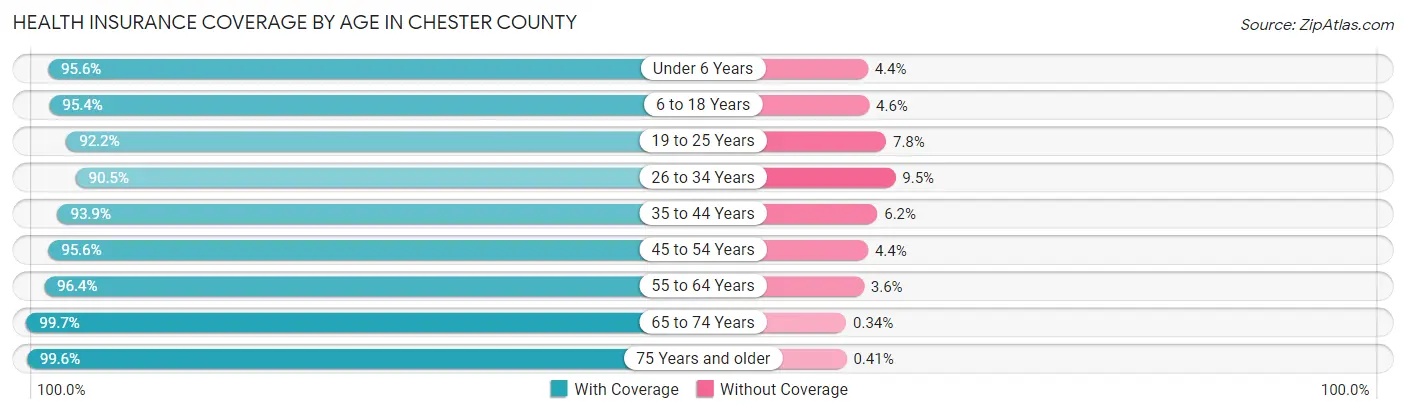
| Age Bracket | With Coverage | Without Coverage |
| Under 6 Years | 33,512 (95.6%) | 1,528 (4.4%) |
| 6 to 18 Years | 87,903 (95.4%) | 4,270 (4.6%) |
| 19 to 25 Years | 43,111 (92.2%) | 3,635 (7.8%) |
| 26 to 34 Years | 49,898 (90.5%) | 5,251 (9.5%) |
| 35 to 44 Years | 63,557 (93.9%) | 4,165 (6.1%) |
| 45 to 54 Years | 68,457 (95.6%) | 3,169 (4.4%) |
| 55 to 64 Years | 72,181 (96.4%) | 2,726 (3.6%) |
| 65 to 74 Years | 52,859 (99.7%) | 179 (0.3%) |
| 75 Years and older | 35,340 (99.6%) | 147 (0.4%) |
| Total | 506,818 (95.3%) | 25,070 (4.7%) |
Health Insurance Coverage by Citizenship Status in Chester County
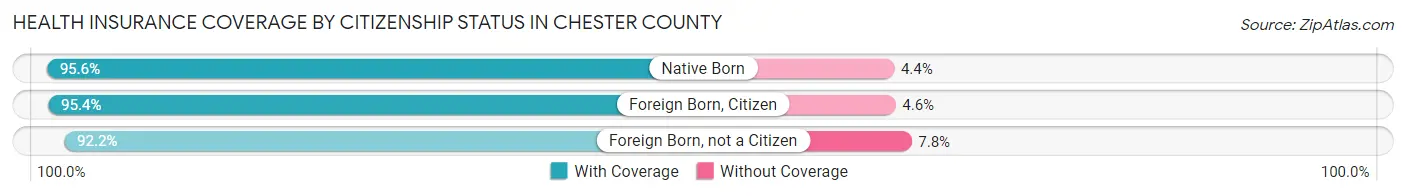
| Citizenship Status | With Coverage | Without Coverage |
| Native Born | 33,512 (95.6%) | 1,528 (4.4%) |
| Foreign Born, Citizen | 87,903 (95.4%) | 4,270 (4.6%) |
| Foreign Born, not a Citizen | 43,111 (92.2%) | 3,635 (7.8%) |
Health Insurance Coverage by Household Income in Chester County
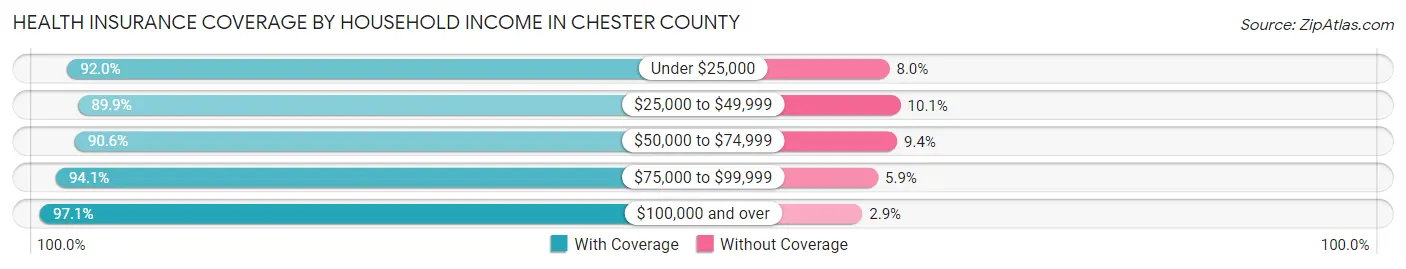
| Household Income | With Coverage | Without Coverage |
| Under $25,000 | 24,579 (92.0%) | 2,140 (8.0%) |
| $25,000 to $49,999 | 37,578 (89.9%) | 4,211 (10.1%) |
| $50,000 to $74,999 | 45,100 (90.6%) | 4,688 (9.4%) |
| $75,000 to $99,999 | 51,114 (94.1%) | 3,185 (5.9%) |
| $100,000 and over | 338,435 (97.1%) | 10,140 (2.9%) |
Public vs Private Health Insurance Coverage by Age in Chester County
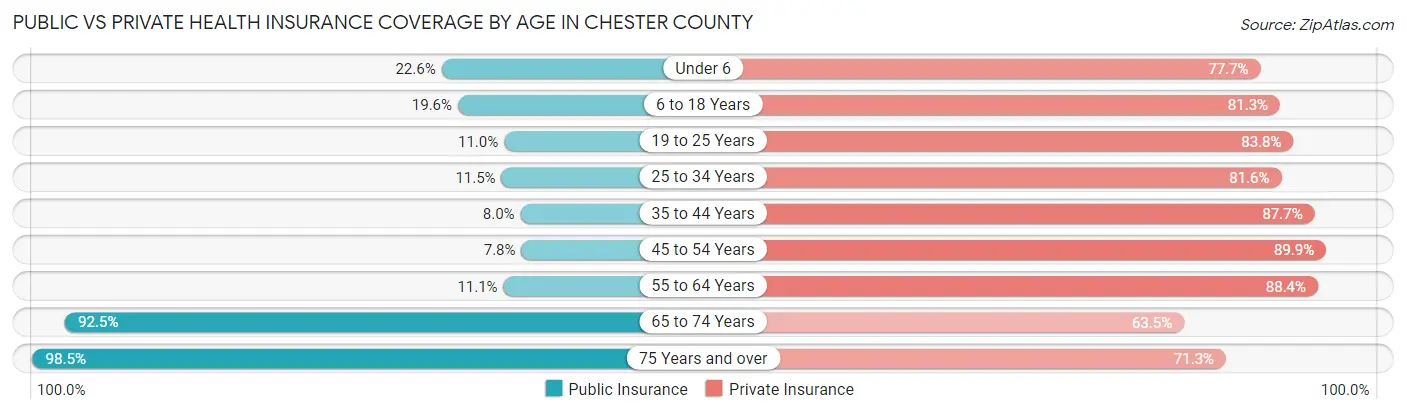
| Age Bracket | Public Insurance | Private Insurance |
| Under 6 | 7,927 (22.6%) | 27,225 (77.7%) |
| 6 to 18 Years | 18,051 (19.6%) | 74,942 (81.3%) |
| 19 to 25 Years | 5,140 (11.0%) | 39,177 (83.8%) |
| 25 to 34 Years | 6,335 (11.5%) | 44,989 (81.6%) |
| 35 to 44 Years | 5,395 (8.0%) | 59,411 (87.7%) |
| 45 to 54 Years | 5,582 (7.8%) | 64,377 (89.9%) |
| 55 to 64 Years | 8,328 (11.1%) | 66,189 (88.4%) |
| 65 to 74 Years | 49,057 (92.5%) | 33,683 (63.5%) |
| 75 Years and over | 34,955 (98.5%) | 25,300 (71.3%) |
| Total | 140,770 (26.5%) | 435,293 (81.8%) |
Disability Status by Sex by Age in Chester County
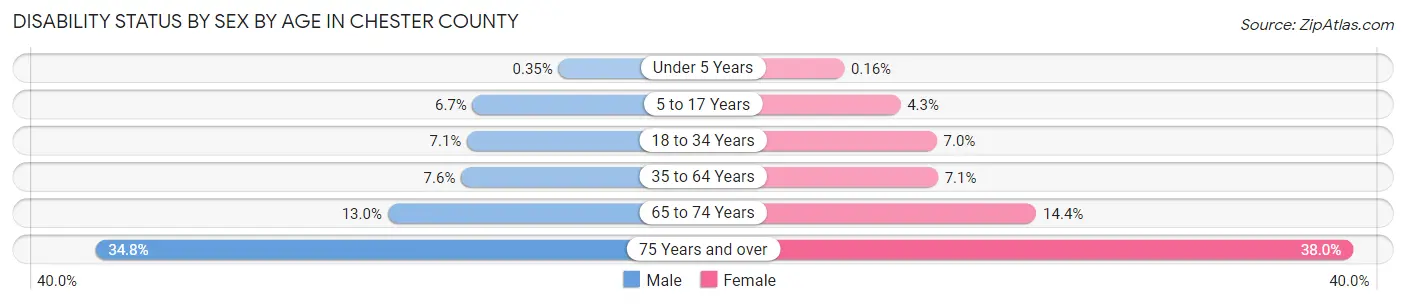
| Age Bracket | Male | Female |
| Under 5 Years | 51 (0.4%) | 23 (0.2%) |
| 5 to 17 Years | 3,112 (6.7%) | 1,923 (4.3%) |
| 18 to 34 Years | 3,948 (7.1%) | 3,844 (7.0%) |
| 35 to 64 Years | 8,140 (7.6%) | 7,613 (7.1%) |
| 65 to 74 Years | 3,307 (13.0%) | 3,994 (14.4%) |
| 75 Years and over | 5,171 (34.7%) | 7,820 (38.0%) |
Disability Class by Sex by Age in Chester County
Disability Class: Hearing Difficulty
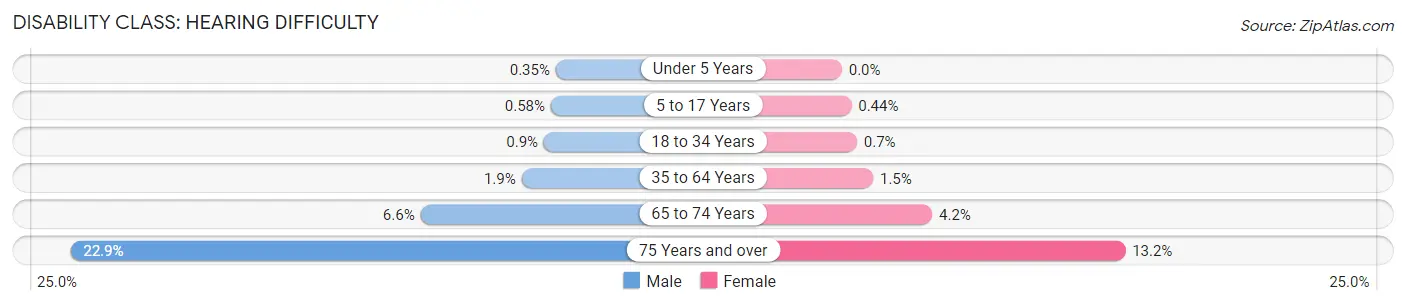
| Age Bracket | Male | Female |
| Under 5 Years | 51 (0.4%) | 0 (0.0%) |
| 5 to 17 Years | 269 (0.6%) | 196 (0.4%) |
| 18 to 34 Years | 499 (0.9%) | 380 (0.7%) |
| 35 to 64 Years | 2,081 (1.9%) | 1,548 (1.5%) |
| 65 to 74 Years | 1,681 (6.6%) | 1,159 (4.2%) |
| 75 Years and over | 3,405 (22.9%) | 2,710 (13.2%) |
Disability Class: Vision Difficulty
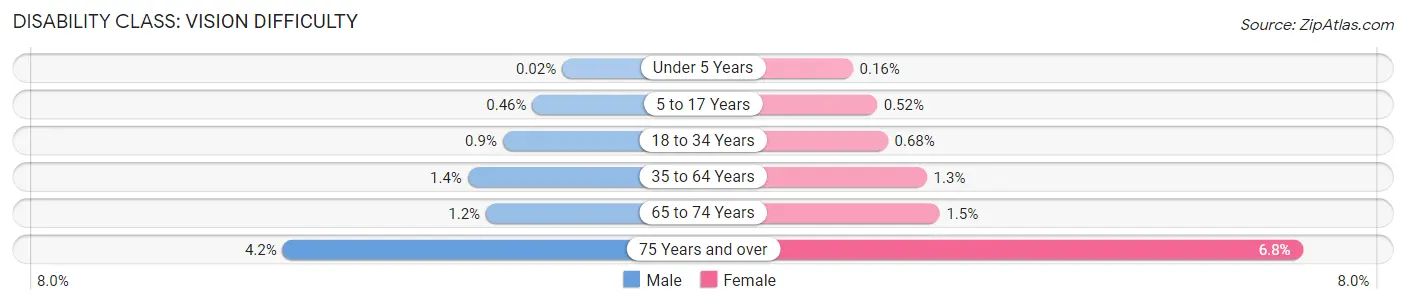
| Age Bracket | Male | Female |
| Under 5 Years | 3 (0.0%) | 23 (0.2%) |
| 5 to 17 Years | 215 (0.5%) | 232 (0.5%) |
| 18 to 34 Years | 496 (0.9%) | 371 (0.7%) |
| 35 to 64 Years | 1,524 (1.4%) | 1,345 (1.3%) |
| 65 to 74 Years | 292 (1.1%) | 400 (1.5%) |
| 75 Years and over | 620 (4.2%) | 1,409 (6.8%) |
Disability Class: Cognitive Difficulty
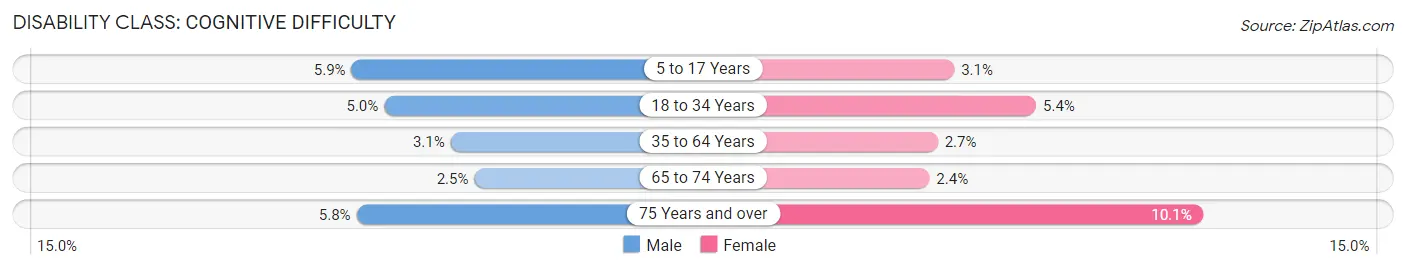
| Age Bracket | Male | Female |
| 5 to 17 Years | 2,731 (5.9%) | 1,386 (3.1%) |
| 18 to 34 Years | 2,759 (5.0%) | 2,953 (5.4%) |
| 35 to 64 Years | 3,370 (3.1%) | 2,858 (2.7%) |
| 65 to 74 Years | 629 (2.5%) | 675 (2.4%) |
| 75 Years and over | 857 (5.8%) | 2,075 (10.1%) |
Disability Class: Ambulatory Difficulty
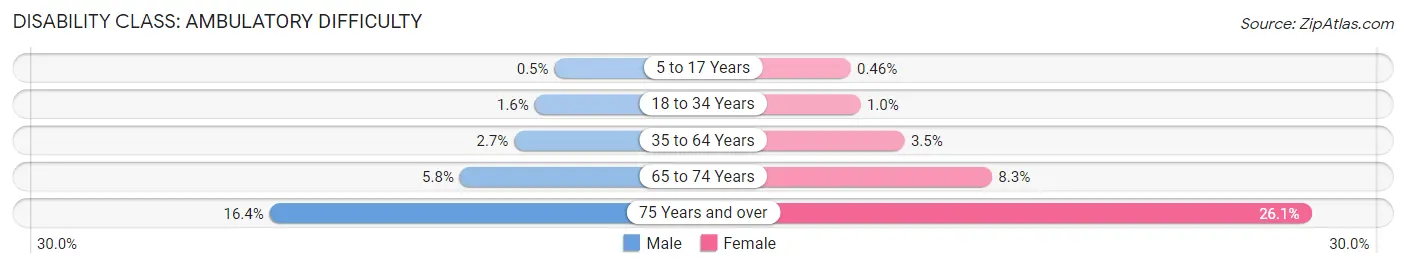
| Age Bracket | Male | Female |
| 5 to 17 Years | 232 (0.5%) | 204 (0.5%) |
| 18 to 34 Years | 885 (1.6%) | 552 (1.0%) |
| 35 to 64 Years | 2,945 (2.7%) | 3,696 (3.5%) |
| 65 to 74 Years | 1,463 (5.8%) | 2,305 (8.3%) |
| 75 Years and over | 2,434 (16.4%) | 5,387 (26.1%) |
Disability Class: Self-Care Difficulty
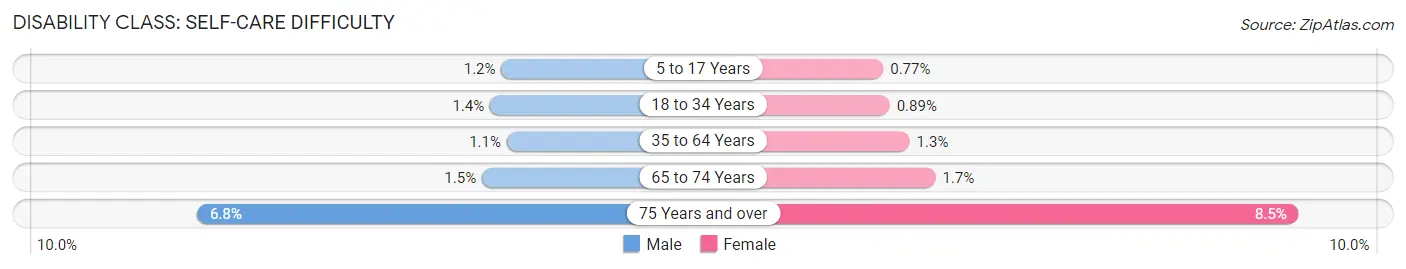
| Age Bracket | Male | Female |
| 5 to 17 Years | 532 (1.1%) | 340 (0.8%) |
| 18 to 34 Years | 753 (1.4%) | 484 (0.9%) |
| 35 to 64 Years | 1,123 (1.1%) | 1,346 (1.3%) |
| 65 to 74 Years | 383 (1.5%) | 483 (1.7%) |
| 75 Years and over | 1,012 (6.8%) | 1,748 (8.5%) |
Technology Access in Chester County
Computing Device Access in Chester County
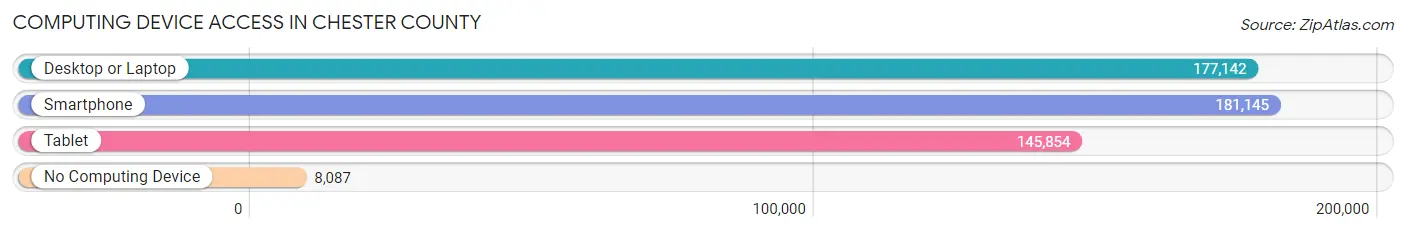
| Device Type | # Households | % Households |
| Desktop or Laptop | 177,142 | 88.3% |
| Smartphone | 181,145 | 90.3% |
| Tablet | 145,854 | 72.7% |
| No Computing Device | 8,087 | 4.0% |
| Total | 200,622 | 100.0% |
Internet Access in Chester County
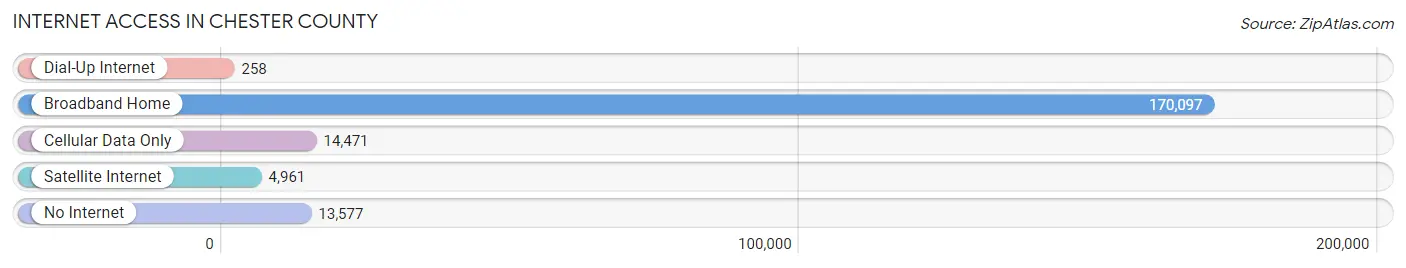
| Internet Type | # Households | % Households |
| Dial-Up Internet | 258 | 0.1% |
| Broadband Home | 170,097 | 84.8% |
| Cellular Data Only | 14,471 | 7.2% |
| Satellite Internet | 4,961 | 2.5% |
| No Internet | 13,577 | 6.8% |
| Total | 200,622 | 100.0% |
Chester County Summary
Chester County, Pennsylvania is located in the southeastern corner of the state and is part of the Philadelphia metropolitan area. It is bordered by Delaware County to the east, Montgomery County to the north, Berks County to the west, and Lancaster County to the south. The county seat is West Chester, and the largest city is Coatesville.
History
Chester County was one of the three original counties created by William Penn in 1682. It was named after Chester, England, and was one of the first counties in the United States to be established by a royal charter. The county was originally divided into ten townships, which were later divided into fifty-four boroughs and townships.
The county has a rich history, and was the site of several important events during the Revolutionary War. The Battle of Brandywine was fought in the county in 1777, and the Battle of the Clouds was fought in the county in 1778. The county was also the site of the Battle of Paoli in 1777, and the Battle of the Brandywine in 1777.
Geography
Chester County covers an area of 759 square miles and is located in the southeastern corner of Pennsylvania. It is bordered by Delaware County to the east, Montgomery County to the north, Berks County to the west, and Lancaster County to the south. The county is divided into three distinct regions: the Piedmont, the Valley, and the Ridge.
The Piedmont region is located in the northern part of the county and is characterized by rolling hills and valleys. The Valley region is located in the central part of the county and is characterized by flat land and fertile soil. The Ridge region is located in the southern part of the county and is characterized by steep hills and valleys.
Economy
Chester County has a diverse economy, with a mix of manufacturing, agriculture, and services. The county is home to several large companies, including QVC, Vanguard, and Exelon. The county is also home to several smaller companies, including the Chester County Economic Development Council, which provides resources and assistance to businesses in the county.
The county is also home to several universities and colleges, including West Chester University, Immaculata University, and Widener University. The county is also home to several hospitals, including Chester County Hospital, Paoli Hospital, and Phoenixville Hospital.
Demographics
As of the 2010 census, Chester County had a population of 498,886. The population is racially diverse, with the largest racial group being White (83.3%), followed by African American (9.2%), Asian (3.7%), and Hispanic or Latino (2.7%). The median household income in the county is $76,811, and the median age is 40.
Chester County is home to several large cities, including West Chester, Coatesville, and Phoenixville. The county is also home to several smaller towns, including Downingtown, Kennett Square, and Oxford. The county is served by several major highways, including Interstate 76, Interstate 95, and the Pennsylvania Turnpike.
Common Questions
What is Per Capita Income in Chester County?
Per Capita income in Chester County is $60,599.
What is the Median Family Income in Chester County?
Median Family Income in Chester County is $144,484.
What is the Median Household income in Chester County?
Median Household Income in Chester County is $118,574.
What is Income or Wage Gap in Chester County?
Income or Wage Gap in Chester County is 36.8%.
Women in Chester County earn 63.2 cents for every dollar earned by a man.
What is Family Income Deficit in Chester County?
Family Income Deficit in Chester County is $10,908.
Families that are below poverty line in Chester County earn $10,908 less on average than the poverty threshold level.
What is Inequality or Gini Index in Chester County?
Inequality or Gini Index in Chester County is 0.45.
What is the Total Population of Chester County?
Total Population of Chester County is 536,474.
What is the Total Male Population of Chester County?
Total Male Population of Chester County is 266,330.
What is the Total Female Population of Chester County?
Total Female Population of Chester County is 270,144.
What is the Ratio of Males per 100 Females in Chester County?
There are 98.59 Males per 100 Females in Chester County.
What is the Ratio of Females per 100 Males in Chester County?
There are 101.43 Females per 100 Males in Chester County.
What is the Median Population Age in Chester County?
Median Population Age in Chester County is 40.7 Years.
What is the Average Family Size in Chester County
Average Family Size in Chester County is 3.1 People.
What is the Average Household Size in Chester County
Average Household Size in Chester County is 2.6 People.
How Large is the Labor Force in Chester County?
There are 294,801 People in the Labor Forcein in Chester County.
What is the Percentage of People in the Labor Force in Chester County?
68.2% of People are in the Labor Force in Chester County.
What is the Unemployment Rate in Chester County?
Unemployment Rate in Chester County is 4.0%.