Zip Codes with the Highest Percentage of Families with Income Above $100,000 in Louisville, KY
RELATED REPORTS & OPTIONS
Family Income | $100k+
Louisville
Compare Zip Codes
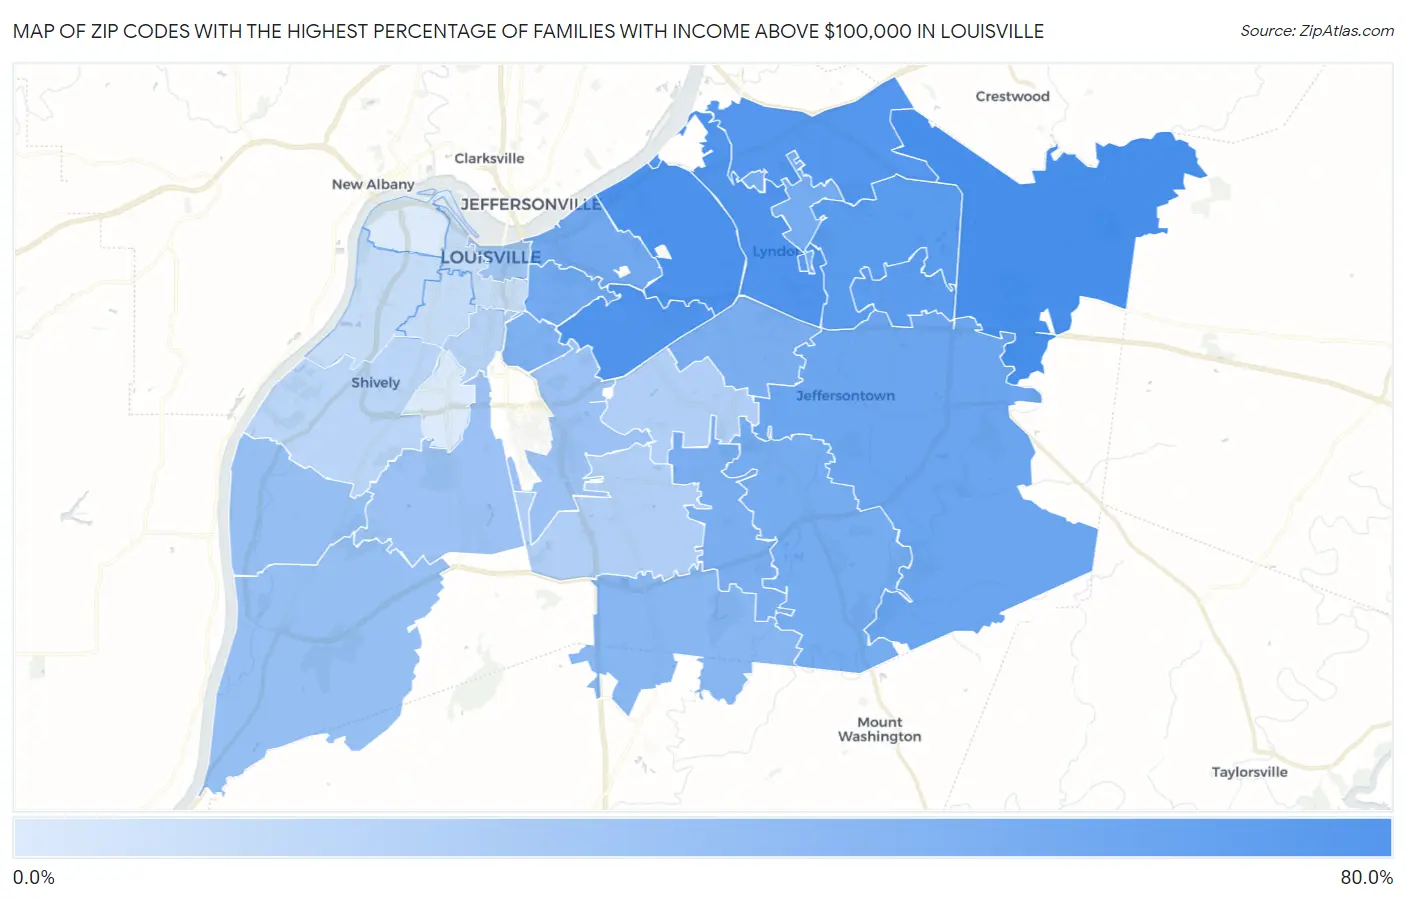
Map of Zip Codes with the Highest Percentage of Families with Income Above $100,000 in Louisville
10.0%
68.6%
Zip Codes with the Highest Percentage of Families with Income Above $100,000 in Louisville, KY
| Zip Code | Families with Income > $100k | vs State | vs National | |
| 1. | 40245 | 68.6% | 36.1%(+32.5)#20 | 46.1%(+22.5)#2,892 |
| 2. | 40207 | 66.5% | 36.1%(+30.4)#24 | 46.1%(+20.4)#3,362 |
| 3. | 40222 | 65.3% | 36.1%(+29.2)#28 | 46.1%(+19.2)#3,670 |
| 4. | 40205 | 64.2% | 36.1%(+28.1)#31 | 46.1%(+18.1)#3,944 |
| 5. | 40241 | 62.0% | 36.1%(+25.9)#39 | 46.1%(+15.9)#4,545 |
| 6. | 40223 | 61.2% | 36.1%(+25.1)#40 | 46.1%(+15.1)#4,784 |
| 7. | 40243 | 59.7% | 36.1%(+23.6)#43 | 46.1%(+13.6)#5,229 |
| 8. | 40299 | 52.2% | 36.1%(+16.1)#66 | 46.1%(+6.10)#7,878 |
| 9. | 40206 | 49.8% | 36.1%(+13.7)#78 | 46.1%(+3.70)#8,943 |
| 10. | 40204 | 48.7% | 36.1%(+12.6)#82 | 46.1%(+2.60)#9,408 |
| 11. | 40242 | 48.2% | 36.1%(+12.1)#85 | 46.1%(+2.10)#9,647 |
| 12. | 40291 | 47.5% | 36.1%(+11.4)#88 | 46.1%(+1.40)#10,022 |
| 13. | 40228 | 45.8% | 36.1%(+9.70)#97 | 46.1%(-0.300)#10,928 |
| 14. | 40220 | 45.7% | 36.1%(+9.60)#98 | 46.1%(-0.400)#10,973 |
| 15. | 40217 | 43.7% | 36.1%(+7.60)#112 | 46.1%(-2.40)#12,080 |
| 16. | 40229 | 40.2% | 36.1%(+4.10)#138 | 46.1%(-5.90)#14,234 |
| 17. | 40258 | 35.0% | 36.1%(-1.10)#202 | 46.1%(-11.1)#17,891 |
| 18. | 40272 | 34.8% | 36.1%(-1.30)#204 | 46.1%(-11.3)#18,016 |
| 19. | 40213 | 32.1% | 36.1%(-4.00)#253 | 46.1%(-14.0)#19,965 |
| 20. | 40214 | 32.0% | 36.1%(-4.10)#255 | 46.1%(-14.1)#20,017 |
| 21. | 40202 | 31.3% | 36.1%(-4.80)#267 | 46.1%(-14.8)#20,507 |
| 22. | 40218 | 24.5% | 36.1%(-11.6)#377 | 46.1%(-21.6)#24,991 |
| 23. | 40219 | 24.4% | 36.1%(-11.7)#383 | 46.1%(-21.7)#25,061 |
| 24. | 40208 | 22.6% | 36.1%(-13.5)#428 | 46.1%(-23.5)#26,012 |
| 25. | 40216 | 21.6% | 36.1%(-14.5)#448 | 46.1%(-24.5)#26,509 |
| 26. | 40203 | 17.8% | 36.1%(-18.3)#499 | 46.1%(-28.3)#28,142 |
| 27. | 40210 | 17.5% | 36.1%(-18.6)#502 | 46.1%(-28.6)#28,263 |
| 28. | 40211 | 17.4% | 36.1%(-18.7)#505 | 46.1%(-28.7)#28,299 |
| 29. | 40215 | 10.3% | 36.1%(-25.8)#599 | 46.1%(-35.8)#30,278 |
| 30. | 40212 | 10.0% | 36.1%(-26.1)#602 | 46.1%(-36.1)#30,320 |
1
Common Questions
What are the Top 10 Zip Codes with the Highest Percentage of Families with Income Above $100,000 in Louisville, KY?
Top 10 Zip Codes with the Highest Percentage of Families with Income Above $100,000 in Louisville, KY are:
What zip code has the Highest Percentage of Families with Income Above $100,000 in Louisville, KY?
40245 has the Highest Percentage of Families with Income Above $100,000 in Louisville, KY with 68.6%.
What is the Percentage of Families with Income Above $100,000 in Louisville, KY?
Percentage of Families with Income Above $100,000 in Louisville is 39.7%.
What is the Percentage of Families with Income Above $100,000 in Kentucky?
Percentage of Families with Income Above $100,000 in Kentucky is 36.1%.
What is the Percentage of Families with Income Above $100,000 in the United States?
Percentage of Families with Income Above $100,000 in the United States is 46.1%.