Zip Codes with the Highest Percentage of Families with Income Above $100,000 in Bowling Green, KY
RELATED REPORTS & OPTIONS
Family Income | $100k+
Bowling Green
Compare Zip Codes
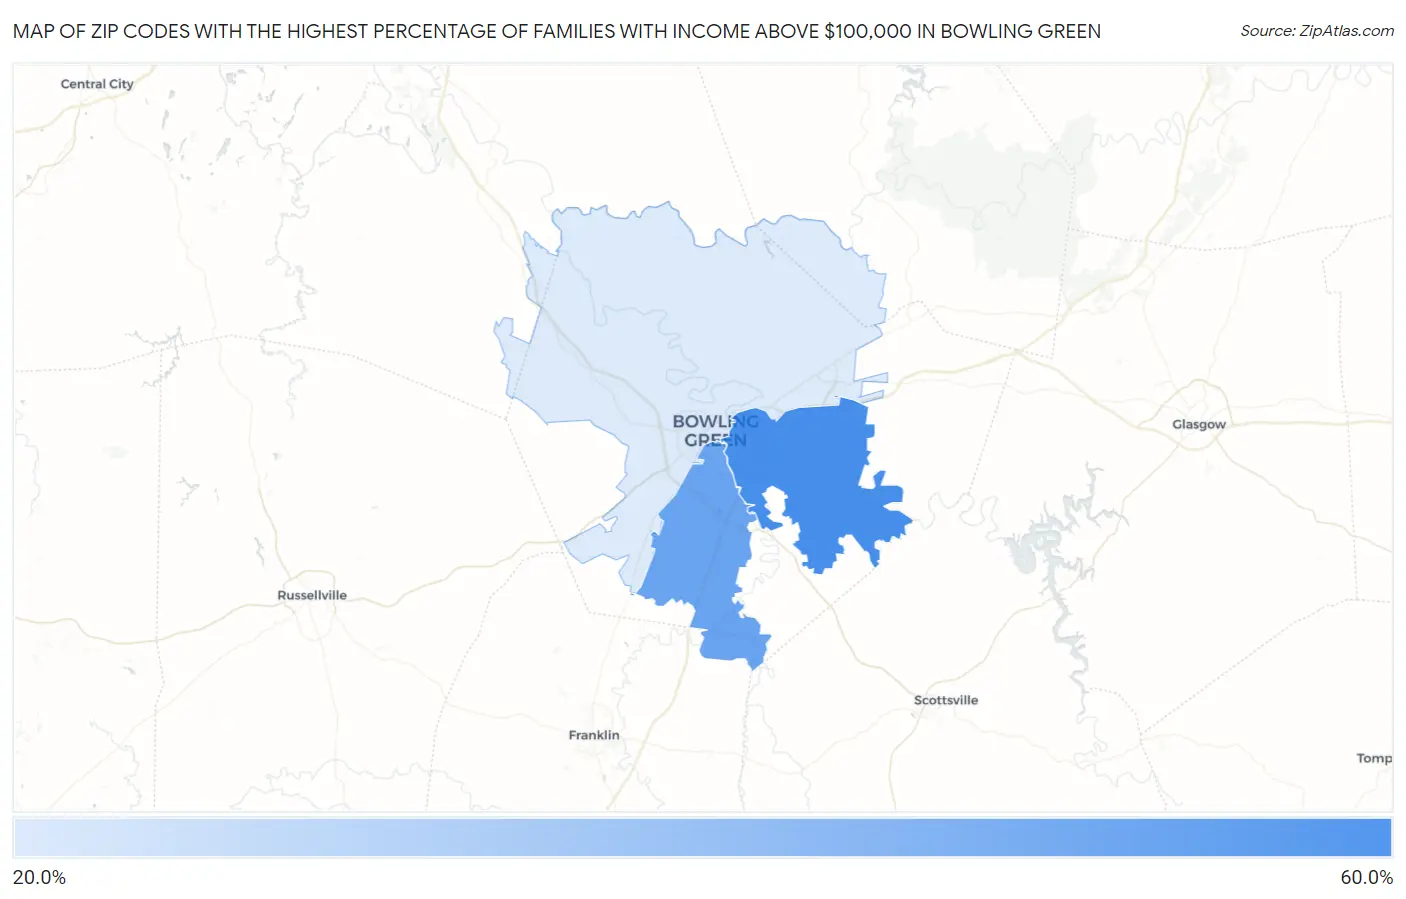
Map of Zip Codes with the Highest Percentage of Families with Income Above $100,000 in Bowling Green
22.3%
53.1%
Zip Codes with the Highest Percentage of Families with Income Above $100,000 in Bowling Green, KY
| Zip Code | Families with Income > $100k | vs State | vs National | |
| 1. | 42103 | 53.1% | 36.1%(+17.0)#63 | 46.1%(+7.00)#7,497 |
| 2. | 42104 | 45.6% | 36.1%(+9.50)#100 | 46.1%(-0.500)#11,006 |
| 3. | 42101 | 22.3% | 36.1%(-13.8)#433 | 46.1%(-23.8)#26,146 |
1
Common Questions
What are the Top Zip Codes with the Highest Percentage of Families with Income Above $100,000 in Bowling Green, KY?
Top Zip Codes with the Highest Percentage of Families with Income Above $100,000 in Bowling Green, KY are:
What zip code has the Highest Percentage of Families with Income Above $100,000 in Bowling Green, KY?
42103 has the Highest Percentage of Families with Income Above $100,000 in Bowling Green, KY with 53.1%.
What is the Percentage of Families with Income Above $100,000 in Bowling Green, KY?
Percentage of Families with Income Above $100,000 in Bowling Green is 28.3%.
What is the Percentage of Families with Income Above $100,000 in Kentucky?
Percentage of Families with Income Above $100,000 in Kentucky is 36.1%.
What is the Percentage of Families with Income Above $100,000 in the United States?
Percentage of Families with Income Above $100,000 in the United States is 46.1%.