Zip Codes with the Highest Percentage of Families with Income Above $100,000 in Kentucky
RELATED REPORTS & OPTIONS
Family Income | $100k+
Kentucky
Compare Zip Codes
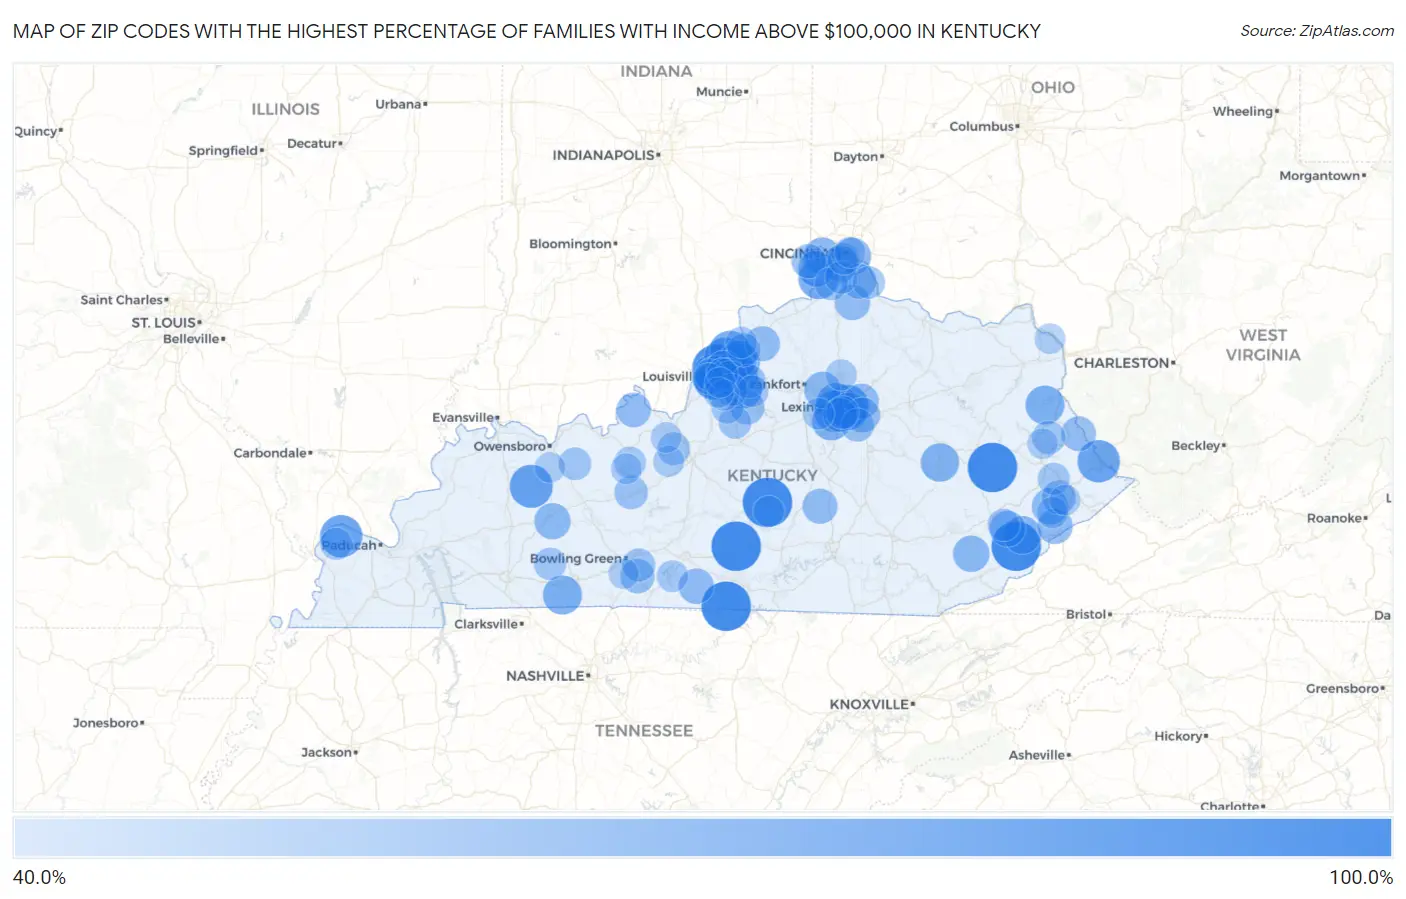
Map of Zip Codes with the Highest Percentage of Families with Income Above $100,000 in Kentucky
40.0%
100.0%
Zip Codes with the Highest Percentage of Families with Income Above $100,000 in Kentucky
| Zip Code | Families with Income > $100k | vs State | vs National | |
| 1. | 42151 | 100.0% | 36.1%(+63.9)#1 | 46.1%(+53.9)#69 |
| 2. | 41821 | 100.0% | 36.1%(+63.9)#2 | 46.1%(+53.9)#74 |
| 3. | 42742 | 100.0% | 36.1%(+63.9)#3 | 46.1%(+53.9)#137 |
| 4. | 42758 | 100.0% | 36.1%(+63.9)#4 | 46.1%(+53.9)#183 |
| 5. | 41366 | 100.0% | 36.1%(+63.9)#5 | 46.1%(+53.9)#213 |
| 6. | 40025 | 96.1% | 36.1%(+60.0)#6 | 46.1%(+50.0)#282 |
| 7. | 40041 | 88.8% | 36.1%(+52.7)#7 | 46.1%(+42.7)#399 |
| 8. | 42371 | 81.4% | 36.1%(+45.3)#8 | 46.1%(+35.3)#874 |
| 9. | 40507 | 80.0% | 36.1%(+43.9)#9 | 46.1%(+33.9)#1,031 |
| 10. | 40059 | 79.7% | 36.1%(+43.6)#10 | 46.1%(+33.6)#1,055 |
| 11. | 41503 | 79.6% | 36.1%(+43.5)#11 | 46.1%(+33.5)#1,073 |
| 12. | 42022 | 79.4% | 36.1%(+43.3)#12 | 46.1%(+33.3)#1,100 |
| 13. | 40513 | 77.2% | 36.1%(+41.1)#13 | 46.1%(+31.1)#1,379 |
| 14. | 40026 | 75.5% | 36.1%(+39.4)#14 | 46.1%(+29.4)#1,629 |
| 15. | 41091 | 74.3% | 36.1%(+38.2)#15 | 46.1%(+28.2)#1,817 |
| 16. | 40023 | 71.6% | 36.1%(+35.5)#16 | 46.1%(+25.5)#2,301 |
| 17. | 40510 | 70.3% | 36.1%(+34.2)#17 | 46.1%(+24.2)#2,550 |
| 18. | 42265 | 70.1% | 36.1%(+34.0)#18 | 46.1%(+24.0)#2,588 |
| 19. | 41201 | 69.9% | 36.1%(+33.8)#19 | 46.1%(+23.8)#2,633 |
| 20. | 40245 | 68.6% | 36.1%(+32.5)#20 | 46.1%(+22.5)#2,892 |
| 21. | 40339 | 68.4% | 36.1%(+32.3)#21 | 46.1%(+22.3)#2,949 |
| 22. | 41397 | 67.8% | 36.1%(+31.7)#22 | 46.1%(+21.7)#3,082 |
| 23. | 41832 | 66.7% | 36.1%(+30.6)#23 | 46.1%(+20.6)#3,313 |
| 24. | 40207 | 66.5% | 36.1%(+30.4)#24 | 46.1%(+20.4)#3,362 |
| 25. | 40056 | 66.0% | 36.1%(+29.9)#25 | 46.1%(+19.9)#3,503 |
| 26. | 40014 | 65.6% | 36.1%(+29.5)#26 | 46.1%(+19.5)#3,578 |
| 27. | 41048 | 65.5% | 36.1%(+29.4)#27 | 46.1%(+19.4)#3,609 |
| 28. | 40222 | 65.3% | 36.1%(+29.2)#28 | 46.1%(+19.2)#3,670 |
| 29. | 40502 | 65.2% | 36.1%(+29.1)#29 | 46.1%(+19.1)#3,695 |
| 30. | 41075 | 64.4% | 36.1%(+28.3)#30 | 46.1%(+18.3)#3,903 |
| 31. | 40205 | 64.2% | 36.1%(+28.1)#31 | 46.1%(+18.1)#3,944 |
| 32. | 40010 | 63.9% | 36.1%(+27.8)#32 | 46.1%(+17.8)#4,051 |
| 33. | 40347 | 63.2% | 36.1%(+27.1)#33 | 46.1%(+17.1)#4,236 |
| 34. | 41017 | 62.8% | 36.1%(+26.7)#34 | 46.1%(+16.7)#4,326 |
| 35. | 41005 | 62.6% | 36.1%(+26.5)#35 | 46.1%(+16.5)#4,381 |
| 36. | 40858 | 62.5% | 36.1%(+26.4)#36 | 46.1%(+16.4)#4,435 |
| 37. | 41612 | 62.2% | 36.1%(+26.1)#37 | 46.1%(+16.1)#4,512 |
| 38. | 42332 | 62.1% | 36.1%(+26.0)#38 | 46.1%(+16.0)#4,539 |
| 39. | 40241 | 62.0% | 36.1%(+25.9)#39 | 46.1%(+15.9)#4,545 |
| 40. | 40223 | 61.2% | 36.1%(+25.1)#40 | 46.1%(+15.1)#4,784 |
| 41. | 41760 | 61.2% | 36.1%(+25.1)#41 | 46.1%(+15.1)#4,807 |
| 42. | 41835 | 59.8% | 36.1%(+23.7)#42 | 46.1%(+13.7)#5,211 |
| 43. | 40243 | 59.7% | 36.1%(+23.6)#43 | 46.1%(+13.6)#5,229 |
| 44. | 42157 | 59.6% | 36.1%(+23.5)#44 | 46.1%(+13.5)#5,277 |
| 45. | 40516 | 59.3% | 36.1%(+23.2)#45 | 46.1%(+13.2)#5,361 |
| 46. | 41033 | 59.1% | 36.1%(+23.0)#46 | 46.1%(+13.0)#5,430 |
| 47. | 40442 | 58.7% | 36.1%(+22.6)#47 | 46.1%(+12.6)#5,565 |
| 48. | 40070 | 58.7% | 36.1%(+22.6)#48 | 46.1%(+12.6)#5,568 |
| 49. | 41001 | 58.4% | 36.1%(+22.3)#49 | 46.1%(+12.3)#5,646 |
| 50. | 40509 | 58.3% | 36.1%(+22.2)#50 | 46.1%(+12.2)#5,666 |
| 51. | 41203 | 57.9% | 36.1%(+21.8)#51 | 46.1%(+11.8)#5,822 |
| 52. | 40157 | 57.3% | 36.1%(+21.2)#52 | 46.1%(+11.2)#6,017 |
| 53. | 41080 | 56.4% | 36.1%(+20.3)#53 | 46.1%(+10.3)#6,289 |
| 54. | 42122 | 56.3% | 36.1%(+20.2)#54 | 46.1%(+10.2)#6,326 |
| 55. | 40071 | 55.7% | 36.1%(+19.6)#55 | 46.1%(+9.60)#6,545 |
| 56. | 41660 | 55.7% | 36.1%(+19.6)#56 | 46.1%(+9.60)#6,578 |
| 57. | 40514 | 55.4% | 36.1%(+19.3)#57 | 46.1%(+9.30)#6,659 |
| 58. | 40067 | 55.2% | 36.1%(+19.1)#58 | 46.1%(+9.10)#6,735 |
| 59. | 42762 | 54.5% | 36.1%(+18.4)#59 | 46.1%(+8.40)#7,002 |
| 60. | 40515 | 53.8% | 36.1%(+17.7)#60 | 46.1%(+7.70)#7,231 |
| 61. | 40031 | 53.8% | 36.1%(+17.7)#61 | 46.1%(+7.70)#7,236 |
| 62. | 41271 | 53.7% | 36.1%(+17.6)#62 | 46.1%(+7.60)#7,295 |
| 63. | 42103 | 53.1% | 36.1%(+17.0)#63 | 46.1%(+7.00)#7,497 |
| 64. | 41094 | 53.1% | 36.1%(+17.0)#64 | 46.1%(+7.00)#7,502 |
| 65. | 40503 | 52.6% | 36.1%(+16.5)#65 | 46.1%(+6.50)#7,701 |
| 66. | 40299 | 52.2% | 36.1%(+16.1)#66 | 46.1%(+6.10)#7,878 |
| 67. | 40162 | 52.1% | 36.1%(+16.0)#67 | 46.1%(+6.00)#7,946 |
| 68. | 42378 | 52.1% | 36.1%(+16.0)#68 | 46.1%(+6.00)#7,952 |
| 69. | 40013 | 51.6% | 36.1%(+15.5)#69 | 46.1%(+5.50)#8,160 |
| 70. | 41051 | 51.5% | 36.1%(+15.4)#70 | 46.1%(+5.40)#8,198 |
| 71. | 41007 | 51.5% | 36.1%(+15.4)#71 | 46.1%(+5.40)#8,208 |
| 72. | 40047 | 51.4% | 36.1%(+15.3)#72 | 46.1%(+5.30)#8,236 |
| 73. | 41751 | 51.1% | 36.1%(+15.0)#73 | 46.1%(+5.00)#8,391 |
| 74. | 42280 | 50.9% | 36.1%(+14.8)#74 | 46.1%(+4.80)#8,478 |
| 75. | 42056 | 50.4% | 36.1%(+14.3)#75 | 46.1%(+4.30)#8,670 |
| 76. | 41011 | 50.2% | 36.1%(+14.1)#76 | 46.1%(+4.10)#8,726 |
| 77. | 41615 | 50.0% | 36.1%(+13.9)#77 | 46.1%(+3.90)#8,836 |
| 78. | 40206 | 49.8% | 36.1%(+13.7)#78 | 46.1%(+3.70)#8,943 |
| 79. | 40022 | 49.4% | 36.1%(+13.3)#79 | 46.1%(+3.30)#9,132 |
| 80. | 40178 | 49.4% | 36.1%(+13.3)#80 | 46.1%(+3.30)#9,135 |
| 81. | 42156 | 48.9% | 36.1%(+12.8)#81 | 46.1%(+2.80)#9,339 |
| 82. | 40204 | 48.7% | 36.1%(+12.6)#82 | 46.1%(+2.60)#9,408 |
| 83. | 40077 | 48.7% | 36.1%(+12.6)#83 | 46.1%(+2.60)#9,431 |
| 84. | 40383 | 48.4% | 36.1%(+12.3)#84 | 46.1%(+2.30)#9,553 |
| 85. | 40242 | 48.2% | 36.1%(+12.1)#85 | 46.1%(+2.10)#9,647 |
| 86. | 41667 | 48.2% | 36.1%(+12.1)#86 | 46.1%(+2.10)#9,683 |
| 87. | 40324 | 47.7% | 36.1%(+11.6)#87 | 46.1%(+1.60)#9,903 |
| 88. | 40291 | 47.5% | 36.1%(+11.4)#88 | 46.1%(+1.40)#10,022 |
| 89. | 42724 | 47.4% | 36.1%(+11.3)#89 | 46.1%(+1.30)#10,088 |
| 90. | 41073 | 47.3% | 36.1%(+11.2)#90 | 46.1%(+1.20)#10,145 |
| 91. | 42733 | 47.3% | 36.1%(+11.2)#91 | 46.1%(+1.20)#10,160 |
| 92. | 41560 | 46.9% | 36.1%(+10.8)#92 | 46.1%(+0.800)#10,377 |
| 93. | 40175 | 46.7% | 36.1%(+10.6)#93 | 46.1%(+0.600)#10,451 |
| 94. | 40152 | 46.6% | 36.1%(+10.5)#94 | 46.1%(+0.500)#10,534 |
| 95. | 41169 | 46.1% | 36.1%(+10.0)#95 | 46.1%(=0.000)#10,773 |
| 96. | 41268 | 46.1% | 36.1%(+10.0)#96 | 46.1%(=0.000)#10,794 |
| 97. | 40228 | 45.8% | 36.1%(+9.70)#97 | 46.1%(-0.300)#10,928 |
| 98. | 40220 | 45.7% | 36.1%(+9.60)#98 | 46.1%(-0.400)#10,973 |
| 99. | 42376 | 45.7% | 36.1%(+9.60)#99 | 46.1%(-0.400)#10,985 |
| 100. | 42104 | 45.6% | 36.1%(+9.50)#100 | 46.1%(-0.500)#11,006 |
Common Questions
What are the Top 10 Zip Codes with the Highest Percentage of Families with Income Above $100,000 in Kentucky?
Top 10 Zip Codes with the Highest Percentage of Families with Income Above $100,000 in Kentucky are:
What zip code has the Highest Percentage of Families with Income Above $100,000 in Kentucky?
42151 has the Highest Percentage of Families with Income Above $100,000 in Kentucky with 100.0%.
What is the Percentage of Families with Income Above $100,000 in the State of Kentucky?
Percentage of Families with Income Above $100,000 in Kentucky is 36.1%.
What is the Percentage of Families with Income Above $100,000 in the United States?
Percentage of Families with Income Above $100,000 in the United States is 46.1%.