Belleview, KY Map & Demographics
Belleview Map
Belleview Overview
$71,263
PER CAPITA INCOME
$106,635
AVG FAMILY INCOME
0.63
INEQUALITY / GINI INDEX
223
TOTAL POPULATION
107
MALE POPULATION
116
FEMALE POPULATION
92.24
MALES / 100 FEMALES
108.41
FEMALES / 100 MALES
61.0
MEDIAN AGE
3.0
AVG FAMILY SIZE
2.5
AVG HOUSEHOLD SIZE
80
LABOR FORCE [ PEOPLE ]
43.2%
PERCENT IN LABOR FORCE
Income in Belleview
Income Overview in Belleview
| Characteristic | Number | Measure |
| Per Capita Income | 223 | $71,263 |
| Median Family Income | 39 | $106,635 |
| Mean Family Income | 39 | $105,590 |
| Median Household Income | 88 | $0 |
| Mean Household Income | 88 | $177,793 |
| Income Deficit | 39 | $0 |
| Wage / Income Gap (%) | 223 | 0.00% |
| Wage / Income Gap ($) | 223 | 100.00¢ per $1 |
| Gini / Inequality Index | 223 | 0.63 |
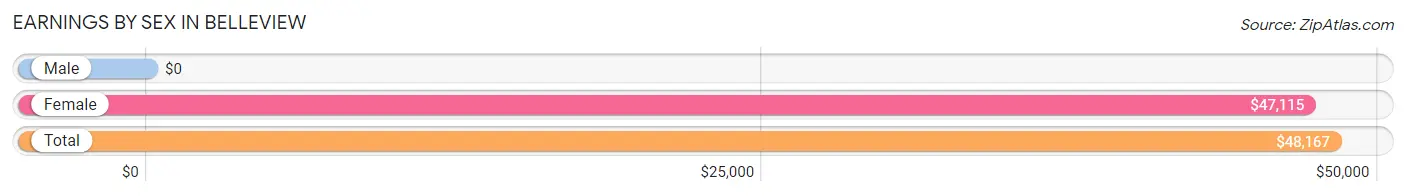
Earnings by Sex in Belleview
| Sex | Number | Average Earnings |
| Male | 56 (52.8%) | $0 |
| Female | 50 (47.2%) | $47,115 |
| Total | 106 (100.0%) | $48,167 |
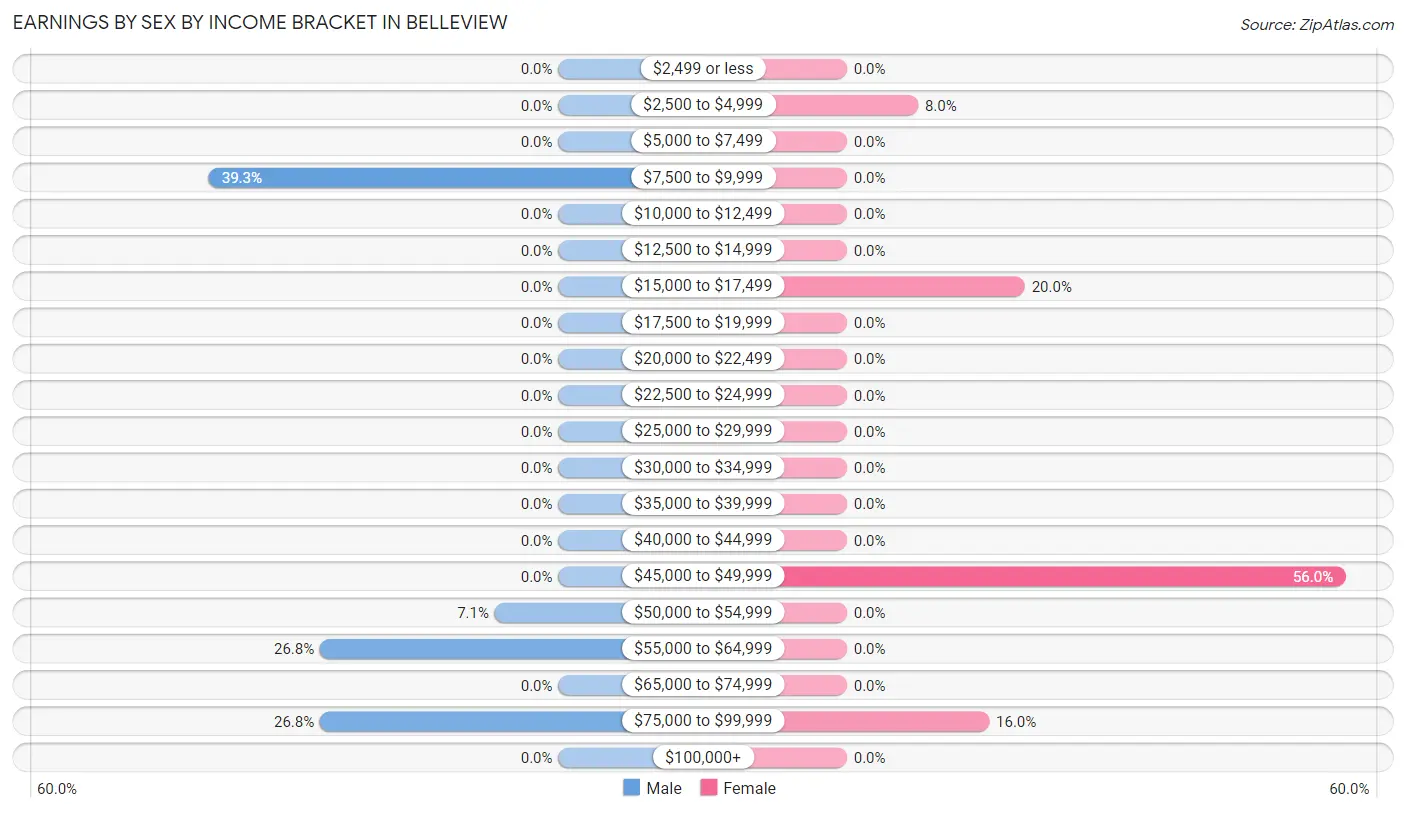
Earnings by Sex by Income Bracket in Belleview
The most common earnings brackets in Belleview are $7,500 to $9,999 for men (22 | 39.3%) and $45,000 to $49,999 for women (28 | 56.0%).
| Income | Male | Female |
| $2,499 or less | 0 (0.0%) | 0 (0.0%) |
| $2,500 to $4,999 | 0 (0.0%) | 4 (8.0%) |
| $5,000 to $7,499 | 0 (0.0%) | 0 (0.0%) |
| $7,500 to $9,999 | 22 (39.3%) | 0 (0.0%) |
| $10,000 to $12,499 | 0 (0.0%) | 0 (0.0%) |
| $12,500 to $14,999 | 0 (0.0%) | 0 (0.0%) |
| $15,000 to $17,499 | 0 (0.0%) | 10 (20.0%) |
| $17,500 to $19,999 | 0 (0.0%) | 0 (0.0%) |
| $20,000 to $22,499 | 0 (0.0%) | 0 (0.0%) |
| $22,500 to $24,999 | 0 (0.0%) | 0 (0.0%) |
| $25,000 to $29,999 | 0 (0.0%) | 0 (0.0%) |
| $30,000 to $34,999 | 0 (0.0%) | 0 (0.0%) |
| $35,000 to $39,999 | 0 (0.0%) | 0 (0.0%) |
| $40,000 to $44,999 | 0 (0.0%) | 0 (0.0%) |
| $45,000 to $49,999 | 0 (0.0%) | 28 (56.0%) |
| $50,000 to $54,999 | 4 (7.1%) | 0 (0.0%) |
| $55,000 to $64,999 | 15 (26.8%) | 0 (0.0%) |
| $65,000 to $74,999 | 0 (0.0%) | 0 (0.0%) |
| $75,000 to $99,999 | 15 (26.8%) | 8 (16.0%) |
| $100,000+ | 0 (0.0%) | 0 (0.0%) |
| Total | 56 (100.0%) | 50 (100.0%) |
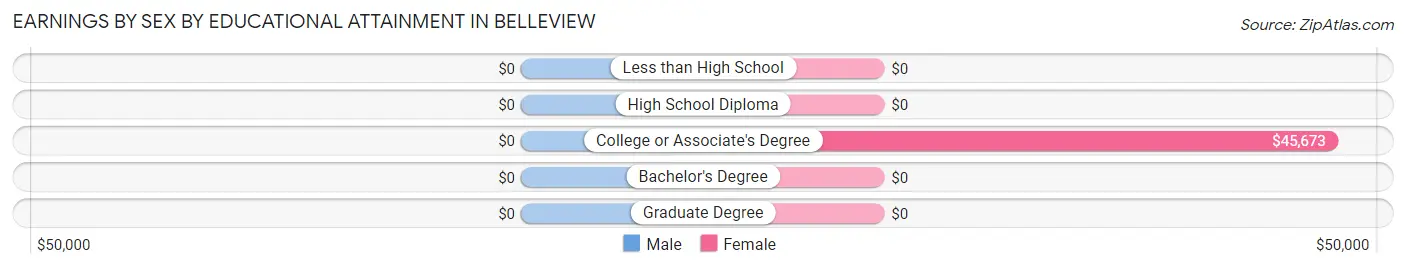
Earnings by Sex by Educational Attainment in Belleview
| Educational Attainment | Male Income | Female Income |
| Less than High School | - | - |
| High School Diploma | - | - |
| College or Associate's Degree | - | - |
| Bachelor's Degree | - | - |
| Graduate Degree | - | - |
| Total | - | - |
Family Income in Belleview
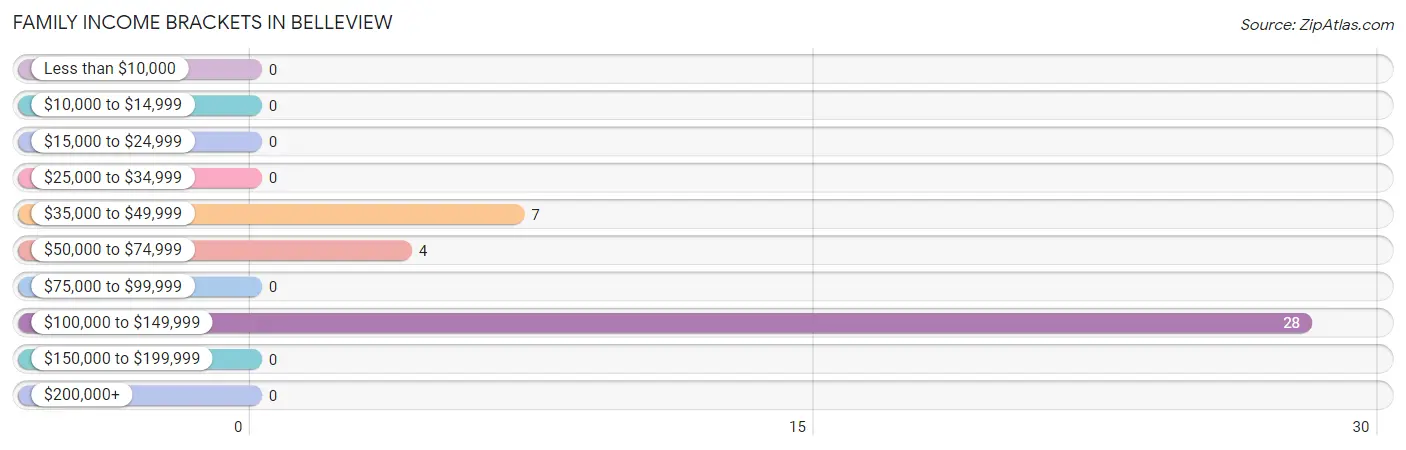
Family Income Brackets in Belleview
According to the Belleview family income data, there are 28 families falling into the $100,000 to $149,999 income range, which is the most common income bracket and makes up 71.8% of all families.
| Income Bracket | # Families | % Families |
| Less than $10,000 | 0 | 0.0% |
| $10,000 to $14,999 | 0 | 0.0% |
| $15,000 to $24,999 | 0 | 0.0% |
| $25,000 to $34,999 | 0 | 0.0% |
| $35,000 to $49,999 | 7 | 17.9% |
| $50,000 to $74,999 | 4 | 10.3% |
| $75,000 to $99,999 | 0 | 0.0% |
| $100,000 to $149,999 | 28 | 71.8% |
| $150,000 to $199,999 | 0 | 0.0% |
| $200,000+ | 0 | 0.0% |
Family Income by Famaliy Size in Belleview
| Income Bracket | # Families | Median Income |
| 2-Person Families | 22 (56.4%) | $0 |
| 3-Person Families | 4 (10.3%) | $0 |
| 4-Person Families | 13 (33.3%) | $0 |
| 5-Person Families | 0 (0.0%) | $0 |
| 6-Person Families | 0 (0.0%) | $0 |
| 7+ Person Families | 0 (0.0%) | $0 |
| Total | 39 (100.0%) | $106,635 |
Family Income by Number of Earners in Belleview
| Number of Earners | # Families | Median Income |
| No Earners | 7 (17.9%) | $0 |
| 1 Earner | 4 (10.3%) | $0 |
| 2 Earners | 28 (71.8%) | $0 |
| 3+ Earners | 0 (0.0%) | $0 |
| Total | 39 (100.0%) | $106,635 |
Household Income in Belleview
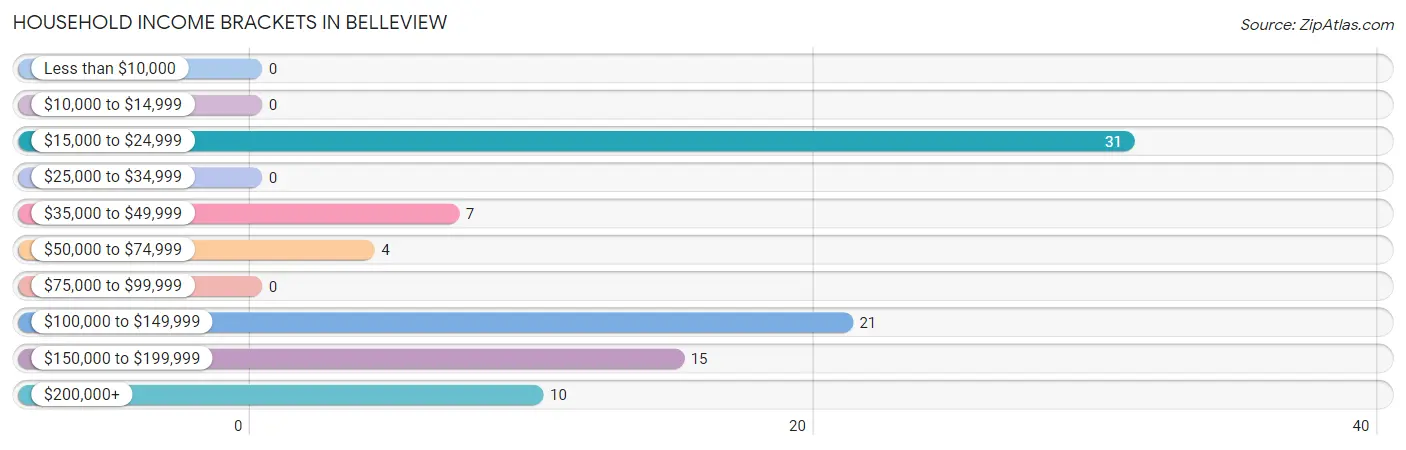
Household Income Brackets in Belleview
With 31 households falling in the category, the $15,000 to $24,999 income range is the most frequent in Belleview, accounting for 35.2% of all households.
| Income Bracket | # Households | % Households |
| Less than $10,000 | 0 | 0.0% |
| $10,000 to $14,999 | 0 | 0.0% |
| $15,000 to $24,999 | 31 | 35.2% |
| $25,000 to $34,999 | 0 | 0.0% |
| $35,000 to $49,999 | 7 | 8.0% |
| $50,000 to $74,999 | 4 | 4.5% |
| $75,000 to $99,999 | 0 | 0.0% |
| $100,000 to $149,999 | 21 | 23.9% |
| $150,000 to $199,999 | 15 | 17.0% |
| $200,000+ | 10 | 11.4% |
Household Income by Householder Age in Belleview
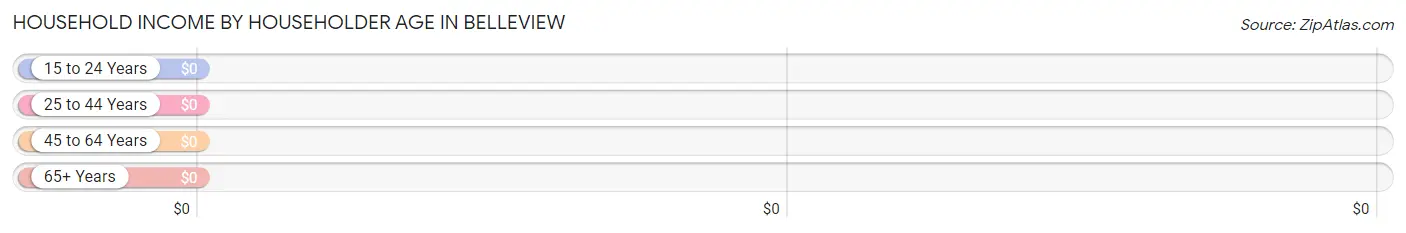
| Income Bracket | # Households | Median Income |
| 15 to 24 Years | 0 (0.0%) | $0 |
| 25 to 44 Years | 17 (19.3%) | $0 |
| 45 to 64 Years | 45 (51.1%) | $0 |
| 65+ Years | 26 (29.5%) | $0 |
| Total | 88 (100.0%) | $0 |
Poverty in Belleview
Income Below Poverty by Sex and Age in Belleview
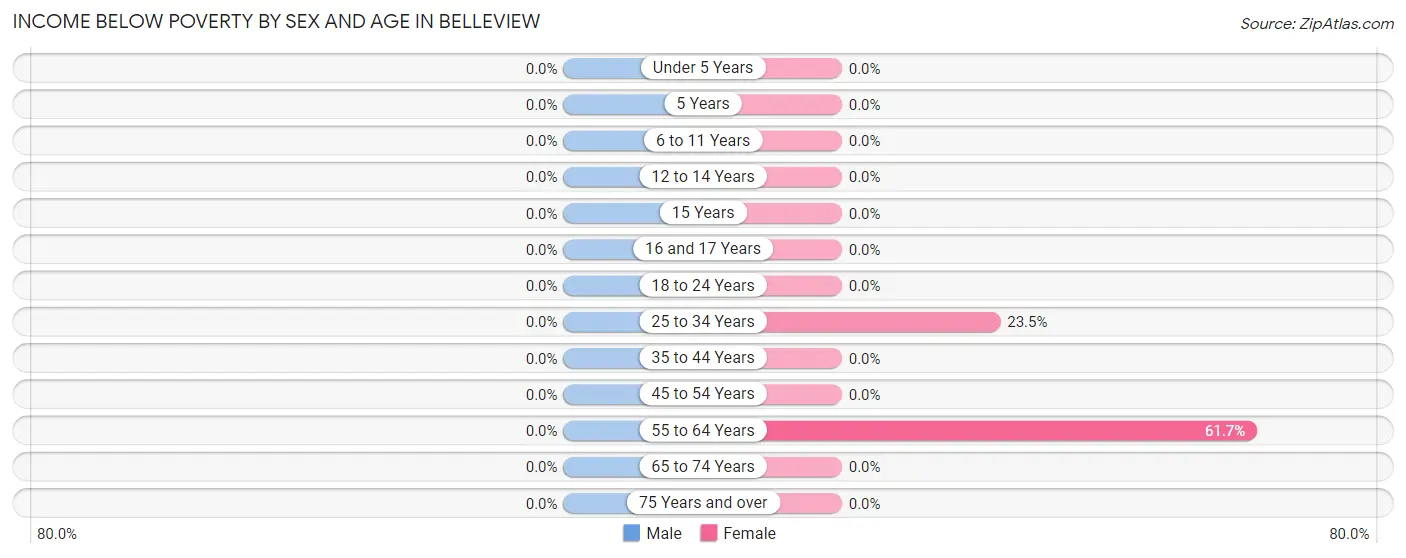
| Age Bracket | Male | Female |
| Under 5 Years | 0 (0.0%) | 0 (0.0%) |
| 5 Years | 0 (0.0%) | 0 (0.0%) |
| 6 to 11 Years | 0 (0.0%) | 0 (0.0%) |
| 12 to 14 Years | 0 (0.0%) | 0 (0.0%) |
| 15 Years | 0 (0.0%) | 0 (0.0%) |
| 16 and 17 Years | 0 (0.0%) | 0 (0.0%) |
| 18 to 24 Years | 0 (0.0%) | 0 (0.0%) |
| 25 to 34 Years | 0 (0.0%) | 4 (23.5%) |
| 35 to 44 Years | 0 (0.0%) | 0 (0.0%) |
| 45 to 54 Years | 0 (0.0%) | 0 (0.0%) |
| 55 to 64 Years | 0 (0.0%) | 37 (61.7%) |
| 65 to 74 Years | 0 (0.0%) | 0 (0.0%) |
| 75 Years and over | 0 (0.0%) | 0 (0.0%) |
| Total | 0 (0.0%) | 41 (35.3%) |
Income Above Poverty by Sex and Age in Belleview
According to the poverty statistics in Belleview, males aged 6 to 11 years and females aged under 5 years are the age groups that are most secure financially, with 100.0% of males and 100.0% of females in these age groups living above the poverty line.
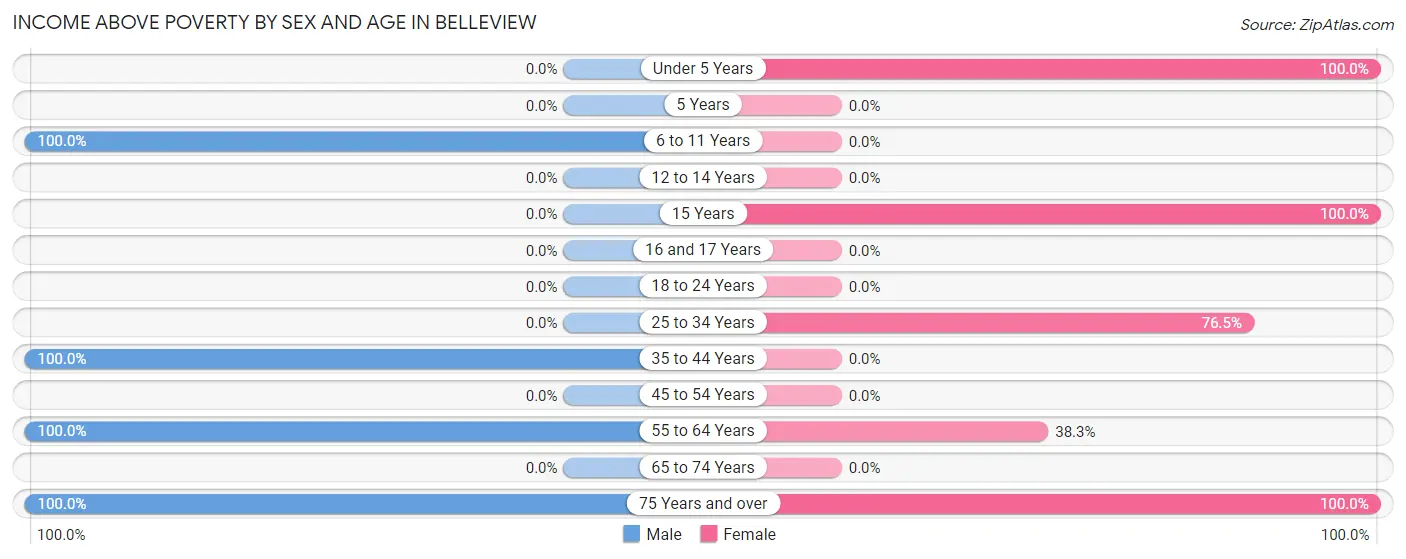
| Age Bracket | Male | Female |
| Under 5 Years | 0 (0.0%) | 11 (100.0%) |
| 5 Years | 0 (0.0%) | 0 (0.0%) |
| 6 to 11 Years | 17 (100.0%) | 0 (0.0%) |
| 12 to 14 Years | 0 (0.0%) | 0 (0.0%) |
| 15 Years | 0 (0.0%) | 10 (100.0%) |
| 16 and 17 Years | 0 (0.0%) | 0 (0.0%) |
| 18 to 24 Years | 0 (0.0%) | 0 (0.0%) |
| 25 to 34 Years | 0 (0.0%) | 13 (76.5%) |
| 35 to 44 Years | 19 (100.0%) | 0 (0.0%) |
| 45 to 54 Years | 0 (0.0%) | 0 (0.0%) |
| 55 to 64 Years | 55 (100.0%) | 23 (38.3%) |
| 65 to 74 Years | 0 (0.0%) | 0 (0.0%) |
| 75 Years and over | 16 (100.0%) | 18 (100.0%) |
| Total | 107 (100.0%) | 75 (64.7%) |
Income Below Poverty Among Married-Couple Families in Belleview
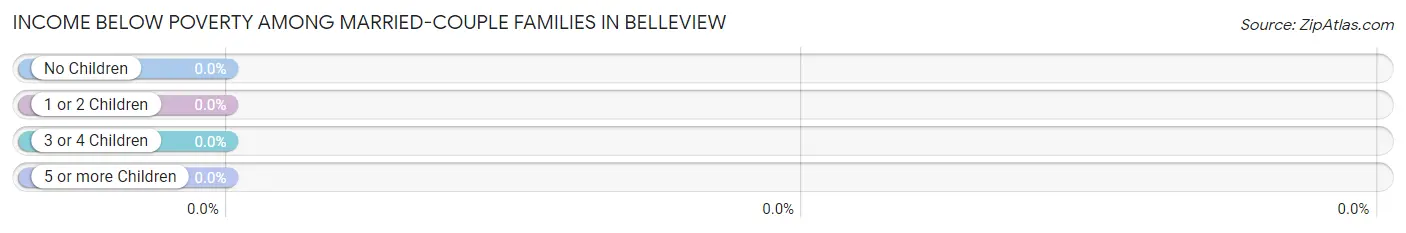
| Children | Above Poverty | Below Poverty |
| No Children | 22 (100.0%) | 0 (0.0%) |
| 1 or 2 Children | 13 (100.0%) | 0 (0.0%) |
| 3 or 4 Children | 0 (0.0%) | 0 (0.0%) |
| 5 or more Children | 0 (0.0%) | 0 (0.0%) |
| Total | 35 (100.0%) | 0 (0.0%) |
Income Below Poverty Among Single-Parent Households in Belleview
| Children | Single Father | Single Mother |
| No Children | 0 (0.0%) | 0 (0.0%) |
| 1 or 2 Children | 0 (0.0%) | 0 (0.0%) |
| 3 or 4 Children | 0 (0.0%) | 0 (0.0%) |
| 5 or more Children | 0 (0.0%) | 0 (0.0%) |
| Total | 0 (0.0%) | 0 (0.0%) |
Income Below Poverty Among Married-Couple vs Single-Parent Households in Belleview
| Children | Married-Couple Families | Single-Parent Households |
| No Children | 0 (0.0%) | 0 (0.0%) |
| 1 or 2 Children | 0 (0.0%) | 0 (0.0%) |
| 3 or 4 Children | 0 (0.0%) | 0 (0.0%) |
| 5 or more Children | 0 (0.0%) | 0 (0.0%) |
| Total | 0 (0.0%) | 0 (0.0%) |
Race in Belleview
The most populous races in Belleview are , and White / Caucasian (223 | 100.0%).
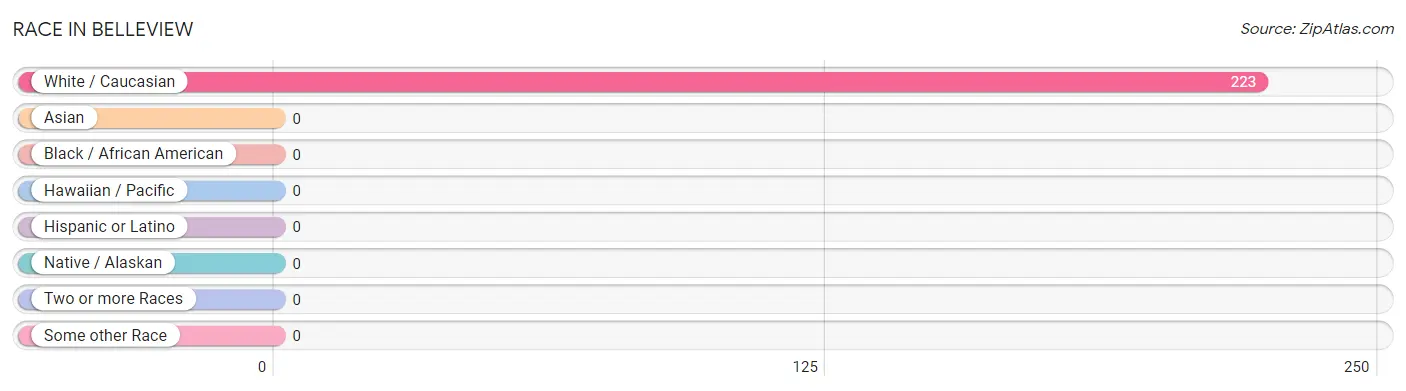
| Race | # Population | % Population |
| Asian | 0 | 0.0% |
| Black / African American | 0 | 0.0% |
| Hawaiian / Pacific | 0 | 0.0% |
| Hispanic or Latino | 0 | 0.0% |
| Native / Alaskan | 0 | 0.0% |
| White / Caucasian | 223 | 100.0% |
| Two or more Races | 0 | 0.0% |
| Some other Race | 0 | 0.0% |
| Total | 223 | 100.0% |
Ancestry in Belleview
The most populous ancestries reported in Belleview are German (41 | 18.4%), Irish (41 | 18.4%), American (17 | 7.6%), Austrian (15 | 6.7%), and English (9 | 4.0%), together accounting for 55.2% of all Belleview residents.
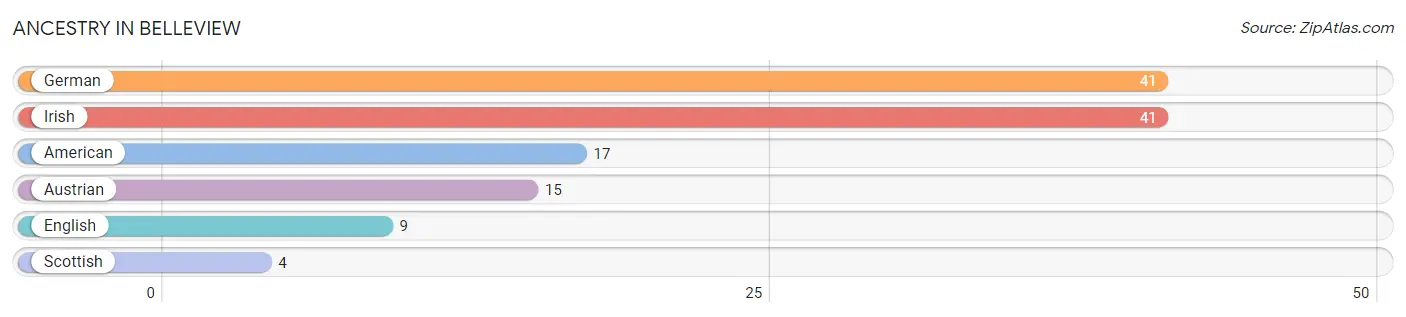
| Ancestry | # Population | % Population |
| American | 17 | 7.6% |
| Austrian | 15 | 6.7% |
| English | 9 | 4.0% |
| German | 41 | 18.4% |
| Irish | 41 | 18.4% |
| Scottish | 4 | 1.8% | View All 6 Rows |
Immigrants in Belleview

| Immigration Origin | # Population | % Population | View All 0 Rows |
Sex and Age in Belleview
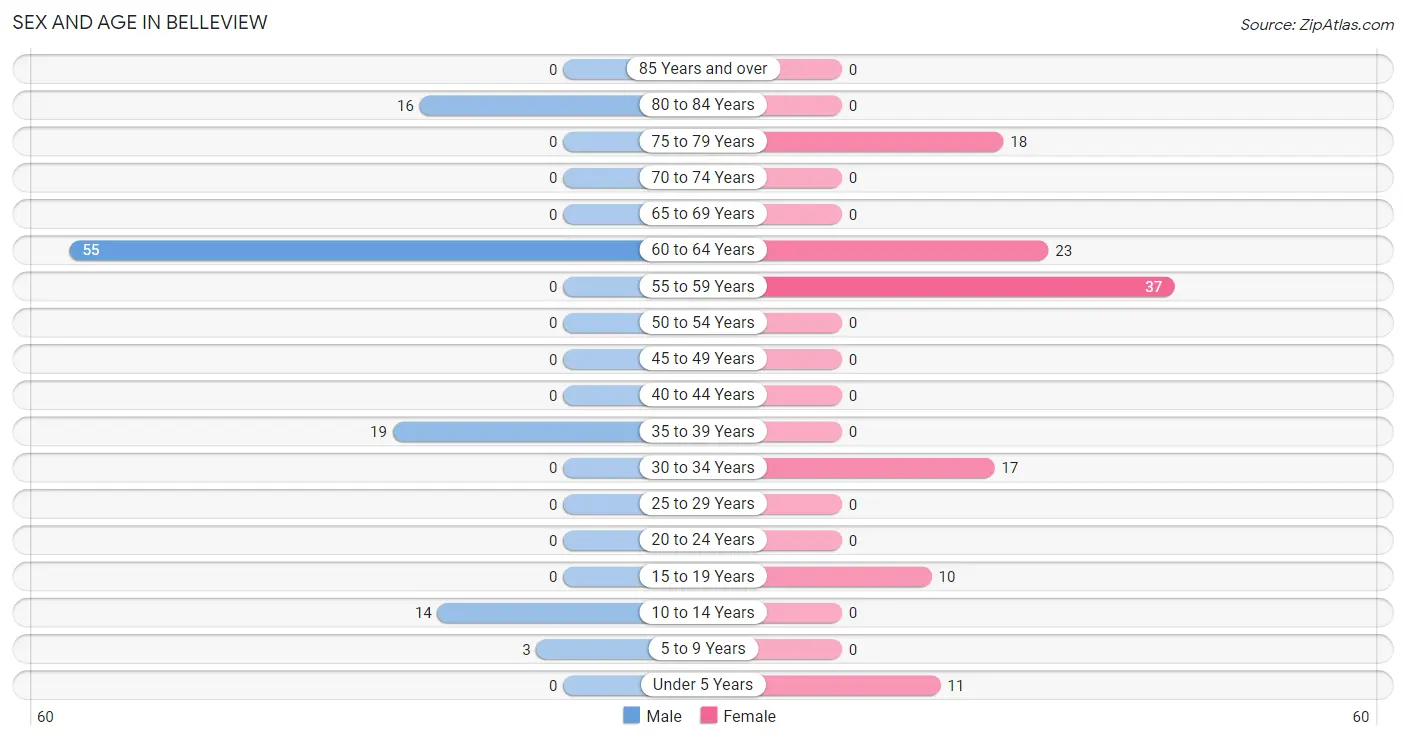
Sex and Age in Belleview
The most populous age groups in Belleview are 60 to 64 Years (55 | 51.4%) for men and 55 to 59 Years (37 | 31.9%) for women.
| Age Bracket | Male | Female |
| Under 5 Years | 0 (0.0%) | 11 (9.5%) |
| 5 to 9 Years | 3 (2.8%) | 0 (0.0%) |
| 10 to 14 Years | 14 (13.1%) | 0 (0.0%) |
| 15 to 19 Years | 0 (0.0%) | 10 (8.6%) |
| 20 to 24 Years | 0 (0.0%) | 0 (0.0%) |
| 25 to 29 Years | 0 (0.0%) | 0 (0.0%) |
| 30 to 34 Years | 0 (0.0%) | 17 (14.7%) |
| 35 to 39 Years | 19 (17.8%) | 0 (0.0%) |
| 40 to 44 Years | 0 (0.0%) | 0 (0.0%) |
| 45 to 49 Years | 0 (0.0%) | 0 (0.0%) |
| 50 to 54 Years | 0 (0.0%) | 0 (0.0%) |
| 55 to 59 Years | 0 (0.0%) | 37 (31.9%) |
| 60 to 64 Years | 55 (51.4%) | 23 (19.8%) |
| 65 to 69 Years | 0 (0.0%) | 0 (0.0%) |
| 70 to 74 Years | 0 (0.0%) | 0 (0.0%) |
| 75 to 79 Years | 0 (0.0%) | 18 (15.5%) |
| 80 to 84 Years | 16 (14.9%) | 0 (0.0%) |
| 85 Years and over | 0 (0.0%) | 0 (0.0%) |
| Total | 107 (100.0%) | 116 (100.0%) |
Families and Households in Belleview
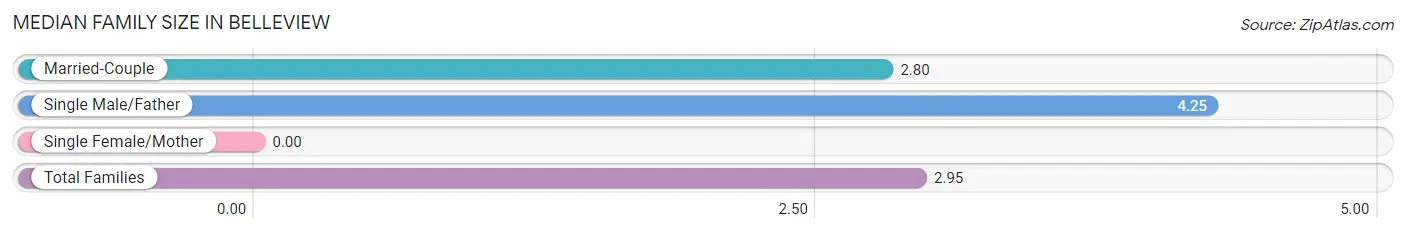
Median Family Size in Belleview
| Family Type | # Families | Family Size |
| Married-Couple | 35 (89.7%) | 2.80 |
| Single Male/Father | 4 (10.3%) | 4.25 |
| Single Female/Mother | 0 (0.0%) | - |
| Total Families | 39 (100.0%) | 2.95 |
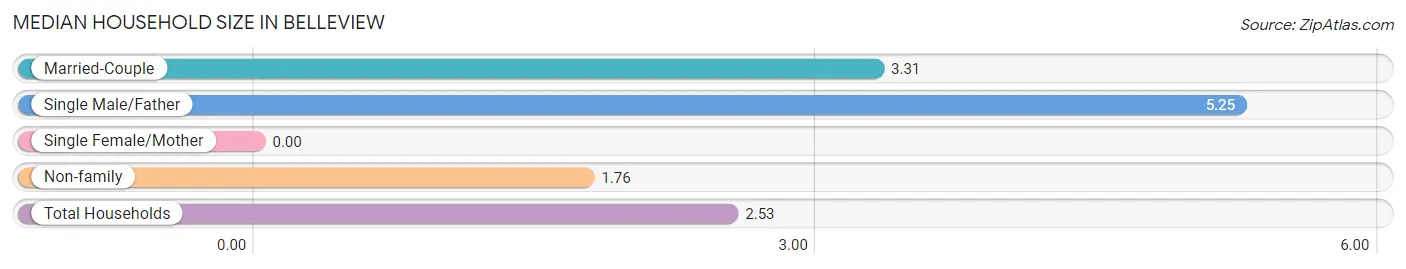
Median Household Size in Belleview
| Household Type | # Households | Household Size |
| Married-Couple | 35 (39.8%) | 3.31 |
| Single Male/Father | 4 (4.5%) | 5.25 |
| Single Female/Mother | 0 (0.0%) | - |
| Non-family | 49 (55.7%) | 1.76 |
| Total Households | 88 (100.0%) | 2.53 |
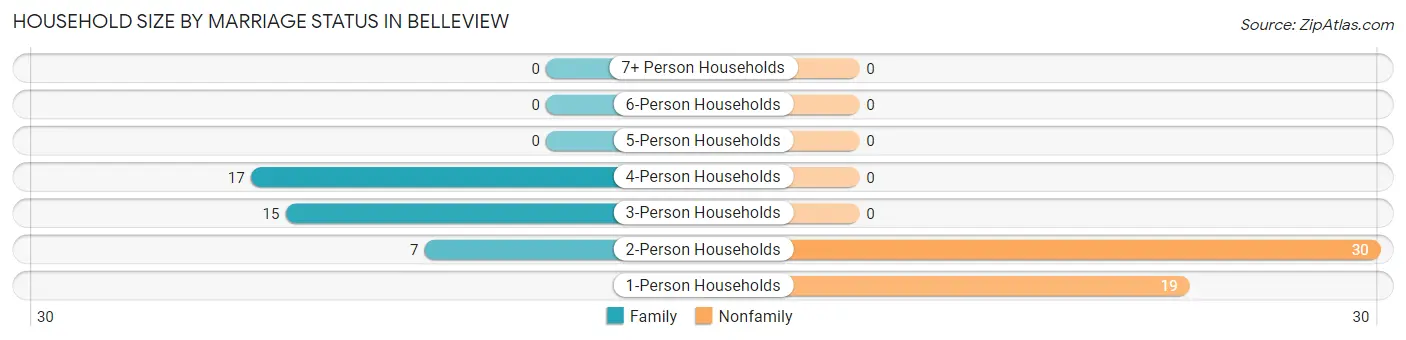
Household Size by Marriage Status in Belleview
Out of a total of 88 households in Belleview, 39 (44.3%) are family households, while 49 (55.7%) are nonfamily households. The most numerous type of family households are 4-person households, comprising 17, and the most common type of nonfamily households are 2-person households, comprising 30.
| Household Size | Family Households | Nonfamily Households |
| 1-Person Households | - | 19 (21.6%) |
| 2-Person Households | 7 (8.0%) | 30 (34.1%) |
| 3-Person Households | 15 (17.1%) | 0 (0.0%) |
| 4-Person Households | 17 (19.3%) | 0 (0.0%) |
| 5-Person Households | 0 (0.0%) | 0 (0.0%) |
| 6-Person Households | 0 (0.0%) | 0 (0.0%) |
| 7+ Person Households | 0 (0.0%) | 0 (0.0%) |
| Total | 39 (44.3%) | 49 (55.7%) |
Female Fertility in Belleview
Fertility by Age in Belleview
| Age Bracket | Women with Births | Births / 1,000 Women |
| 15 to 19 years | 0 (0.0%) | 0.0 |
| 20 to 34 years | 0 (0.0%) | 0.0 |
| 35 to 50 years | 0 (0.0%) | 0.0 |
| Total | 0 (0.0%) | 0.0 |
Fertility by Age by Marriage Status in Belleview
| Age Bracket | Married | Unmarried |
| 15 to 19 years | 0 (0.0%) | 0 (0.0%) |
| 20 to 34 years | 0 (0.0%) | 0 (0.0%) |
| 35 to 50 years | 0 (0.0%) | 0 (0.0%) |
| Total | 0 (0.0%) | 0 (0.0%) |
Fertility by Education in Belleview
| Educational Attainment | Women with Births | Births / 1,000 Women |
| Less than High School | 0 (0.0%) | 0.0 |
| High School Diploma | 0 (0.0%) | 0.0 |
| College or Associate's Degree | 0 (0.0%) | 0.0 |
| Bachelor's Degree | 0 (0.0%) | 0.0 |
| Graduate Degree | 0 (0.0%) | 0.0 |
| Total | 0 (0.0%) | 0.0 |
Fertility by Education by Marriage Status in Belleview
| Educational Attainment | Married | Unmarried |
| Less than High School | 0 (0.0%) | 0 (0.0%) |
| High School Diploma | 0 (0.0%) | 0 (0.0%) |
| College or Associate's Degree | 0 (0.0%) | 0 (0.0%) |
| Bachelor's Degree | 0 (0.0%) | 0 (0.0%) |
| Graduate Degree | 0 (0.0%) | 0 (0.0%) |
| Total | 0 (0.0%) | 0 (0.0%) |
Employment Characteristics in Belleview
Employment by Class of Employer in Belleview
Among the 80 employed individuals in Belleview, private company employees (42 | 52.5%), self-employed (incorporated) (30 | 37.5%), and not-for-profit organizations (8 | 10.0%) make up the most common classes of employment.
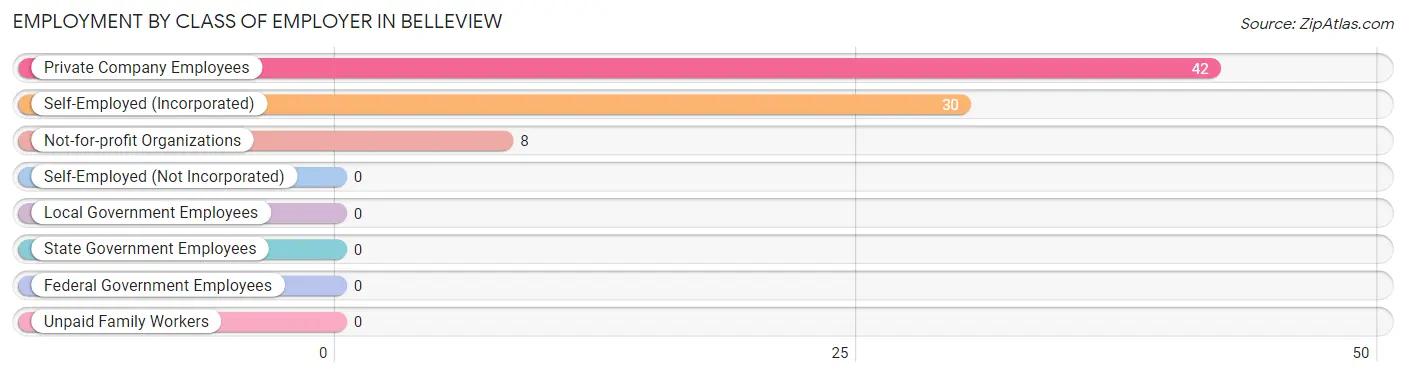
| Employer Class | # Employees | % Employees |
| Private Company Employees | 42 | 52.5% |
| Self-Employed (Incorporated) | 30 | 37.5% |
| Self-Employed (Not Incorporated) | 0 | 0.0% |
| Not-for-profit Organizations | 8 | 10.0% |
| Local Government Employees | 0 | 0.0% |
| State Government Employees | 0 | 0.0% |
| Federal Government Employees | 0 | 0.0% |
| Unpaid Family Workers | 0 | 0.0% |
| Total | 80 | 100.0% |
Employment Status by Age in Belleview
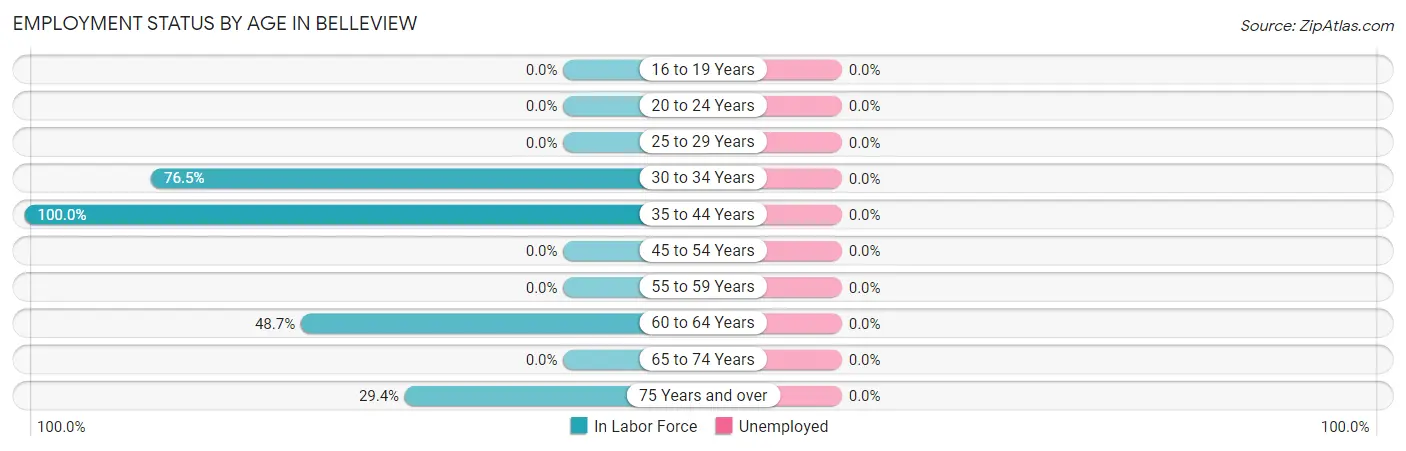
| Age Bracket | In Labor Force | Unemployed |
| 16 to 19 Years | 0 (0.0%) | 0 (0.0%) |
| 20 to 24 Years | 0 (0.0%) | 0 (0.0%) |
| 25 to 29 Years | 0 (0.0%) | 0 (0.0%) |
| 30 to 34 Years | 13 (76.5%) | 0 (0.0%) |
| 35 to 44 Years | 19 (100.0%) | 0 (0.0%) |
| 45 to 54 Years | 0 (0.0%) | 0 (0.0%) |
| 55 to 59 Years | 0 (0.0%) | 0 (0.0%) |
| 60 to 64 Years | 38 (48.7%) | 0 (0.0%) |
| 65 to 74 Years | 0 (0.0%) | 0 (0.0%) |
| 75 Years and over | 10 (29.4%) | 0 (0.0%) |
| Total | 80 (43.2%) | 0 (0.0%) |
Employment Status by Educational Attainment in Belleview
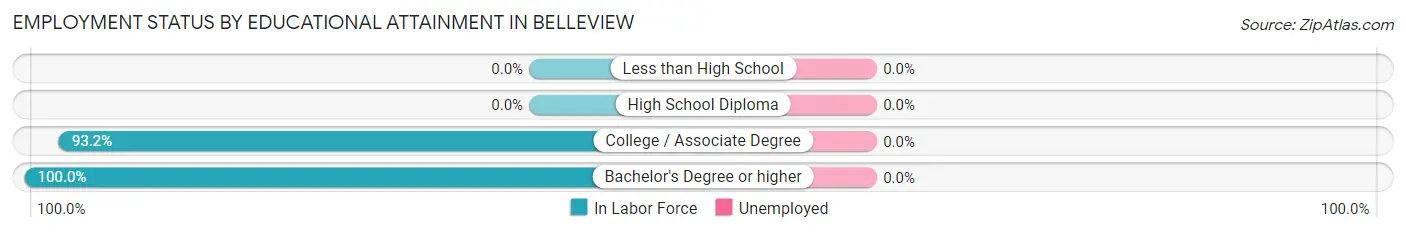
| Educational Attainment | In Labor Force | Unemployed |
| Less than High School | 0 (0.0%) | 0 (0.0%) |
| High School Diploma | 0 (0.0%) | 0 (0.0%) |
| College / Associate Degree | 55 (93.2%) | 0 (0.0%) |
| Bachelor's Degree or higher | 15 (100.0%) | 0 (0.0%) |
| Total | 70 (46.4%) | 0 (0.0%) |
Employment Occupations by Sex in Belleview
Management, Business, Science and Arts Occupations
The most common Management, Business, Science and Arts occupations in Belleview are Health Diagnosing & Treating (21 | 26.3%), Health Technologists (8 | 10.0%), Community & Social Service (4 | 5.0%), and Education Instruction & Library (4 | 5.0%).
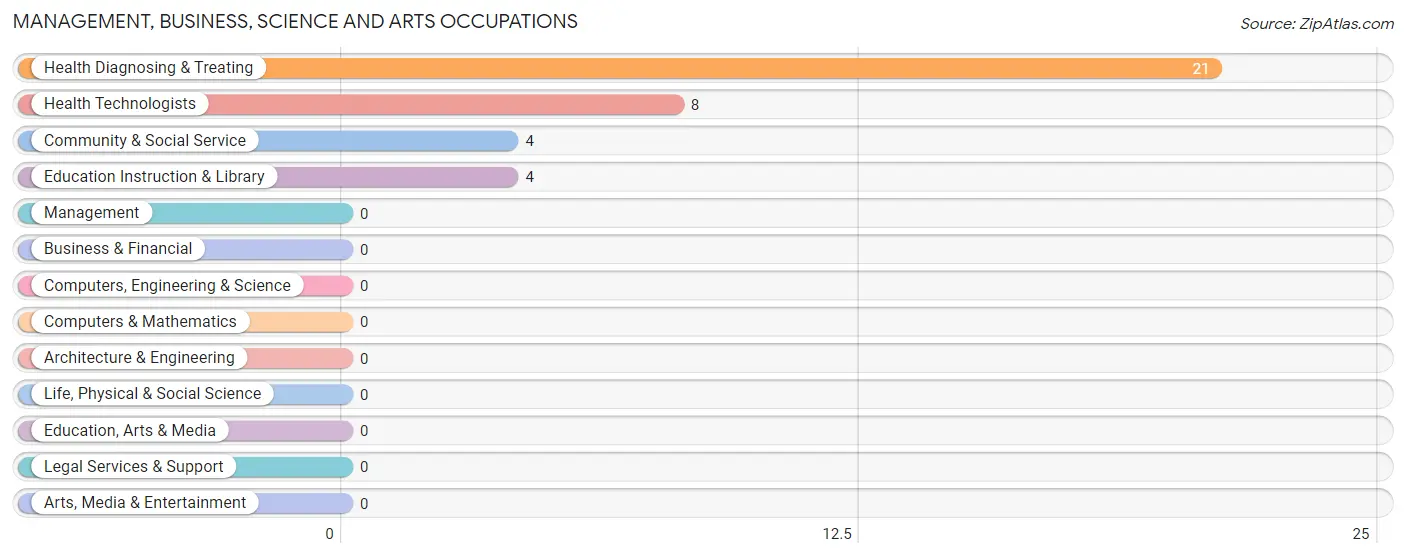
Management, Business, Science and Arts Occupations by Sex
Within the Management, Business, Science and Arts occupations in Belleview, the most male-oriented occupations are Community & Social Service (100.0%), and Education Instruction & Library (100.0%), while the most female-oriented occupations are Health Diagnosing & Treating (100.0%), and Health Technologists (100.0%).
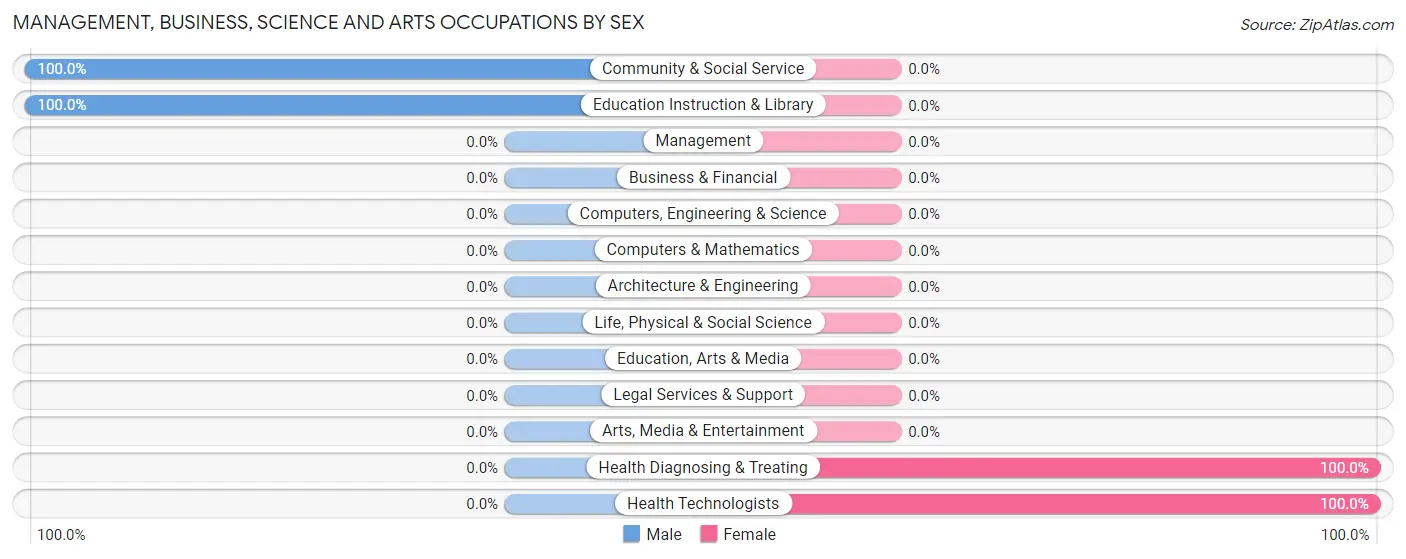
| Occupation | Male | Female |
| Management | 0 (0.0%) | 0 (0.0%) |
| Business & Financial | 0 (0.0%) | 0 (0.0%) |
| Computers, Engineering & Science | 0 (0.0%) | 0 (0.0%) |
| Computers & Mathematics | 0 (0.0%) | 0 (0.0%) |
| Architecture & Engineering | 0 (0.0%) | 0 (0.0%) |
| Life, Physical & Social Science | 0 (0.0%) | 0 (0.0%) |
| Community & Social Service | 4 (100.0%) | 0 (0.0%) |
| Education, Arts & Media | 0 (0.0%) | 0 (0.0%) |
| Legal Services & Support | 0 (0.0%) | 0 (0.0%) |
| Education Instruction & Library | 4 (100.0%) | 0 (0.0%) |
| Arts, Media & Entertainment | 0 (0.0%) | 0 (0.0%) |
| Health Diagnosing & Treating | 0 (0.0%) | 21 (100.0%) |
| Health Technologists | 0 (0.0%) | 8 (100.0%) |
| Total (Category) | 4 (16.0%) | 21 (84.0%) |
| Total (Overall) | 34 (42.5%) | 46 (57.5%) |
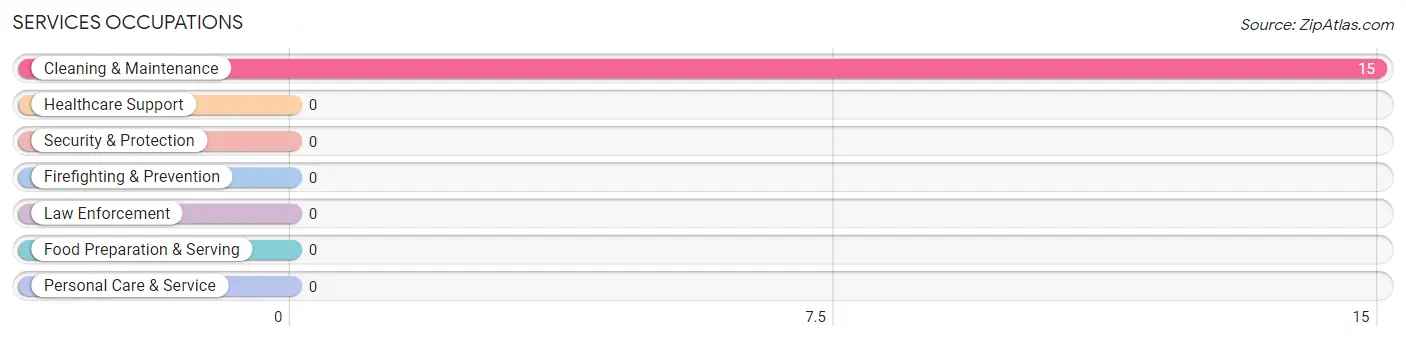
Services Occupations
The most common Services occupations in Belleview are , and Cleaning & Maintenance (15 | 18.8%).
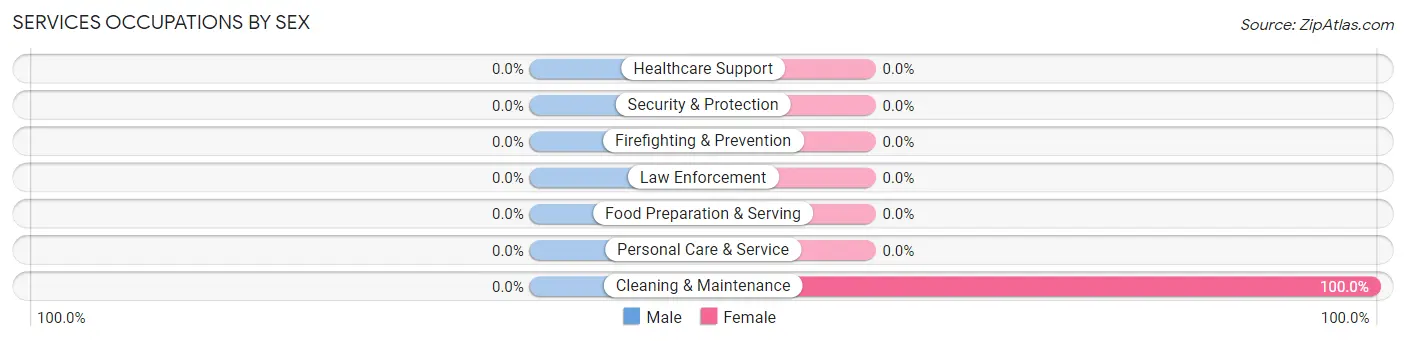
Services Occupations by Sex
| Occupation | Male | Female |
| Healthcare Support | 0 (0.0%) | 0 (0.0%) |
| Security & Protection | 0 (0.0%) | 0 (0.0%) |
| Firefighting & Prevention | 0 (0.0%) | 0 (0.0%) |
| Law Enforcement | 0 (0.0%) | 0 (0.0%) |
| Food Preparation & Serving | 0 (0.0%) | 0 (0.0%) |
| Cleaning & Maintenance | 0 (0.0%) | 15 (100.0%) |
| Personal Care & Service | 0 (0.0%) | 0 (0.0%) |
| Total (Category) | 0 (0.0%) | 15 (100.0%) |
| Total (Overall) | 34 (42.5%) | 46 (57.5%) |
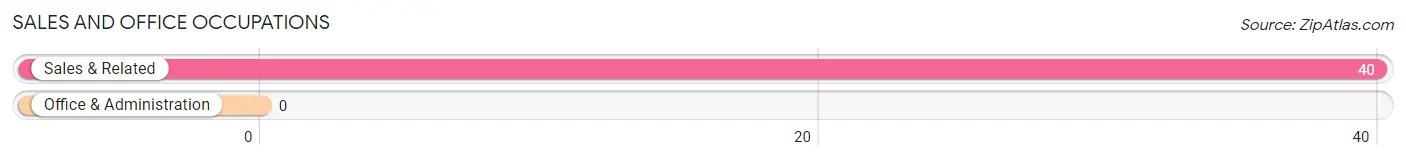
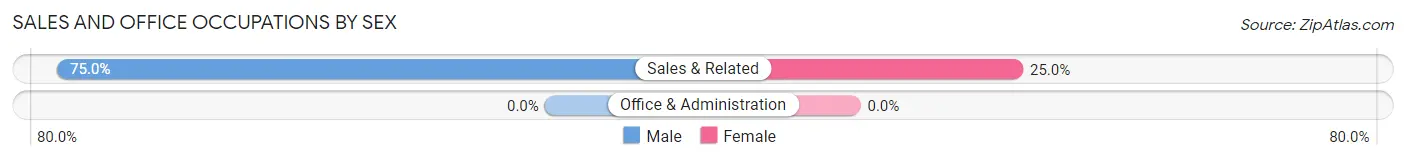
Sales and Office Occupations
The most common Sales and Office occupations in Belleview are , and Sales & Related (40 | 50.0%).
Sales and Office Occupations by Sex
| Occupation | Male | Female |
| Sales & Related | 30 (75.0%) | 10 (25.0%) |
| Office & Administration | 0 (0.0%) | 0 (0.0%) |
| Total (Category) | 30 (75.0%) | 10 (25.0%) |
| Total (Overall) | 34 (42.5%) | 46 (57.5%) |
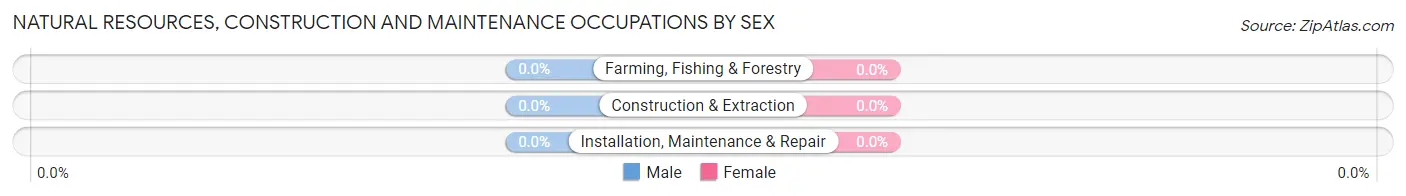
Natural Resources, Construction and Maintenance Occupations

Natural Resources, Construction and Maintenance Occupations by Sex
| Occupation | Male | Female |
| Farming, Fishing & Forestry | 0 (0.0%) | 0 (0.0%) |
| Construction & Extraction | 0 (0.0%) | 0 (0.0%) |
| Installation, Maintenance & Repair | 0 (0.0%) | 0 (0.0%) |
| Total (Category) | 0 (0.0%) | 0 (0.0%) |
| Total (Overall) | 34 (42.5%) | 46 (57.5%) |
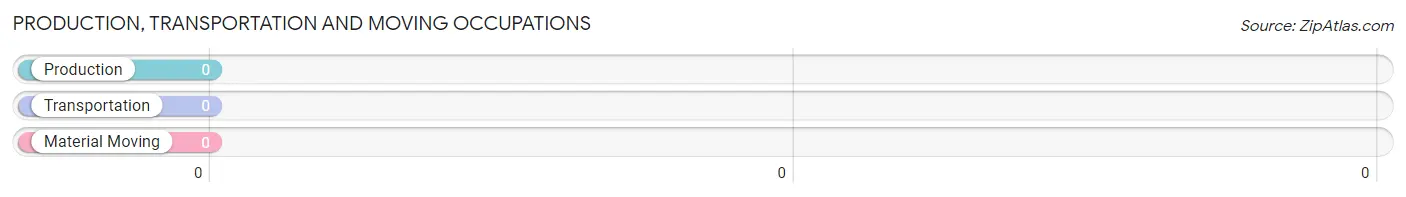
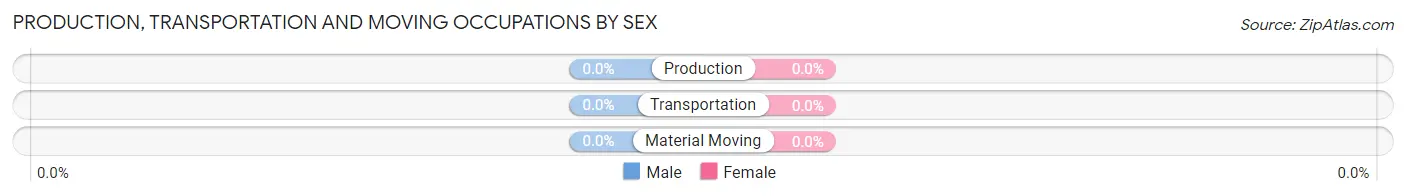
Production, Transportation and Moving Occupations
Production, Transportation and Moving Occupations by Sex
| Occupation | Male | Female |
| Production | 0 (0.0%) | 0 (0.0%) |
| Transportation | 0 (0.0%) | 0 (0.0%) |
| Material Moving | 0 (0.0%) | 0 (0.0%) |
| Total (Category) | 0 (0.0%) | 0 (0.0%) |
| Total (Overall) | 34 (42.5%) | 46 (57.5%) |
Employment Industries by Sex in Belleview
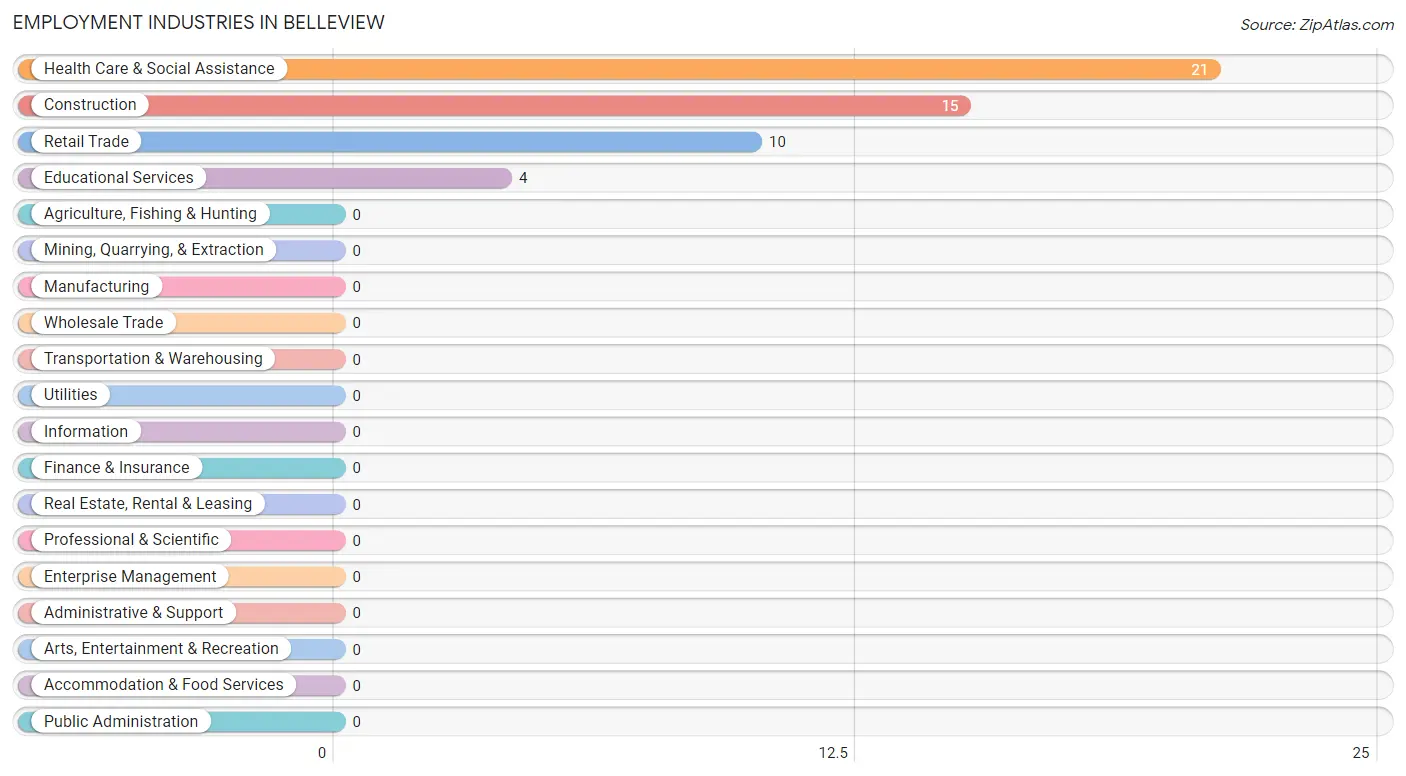
Employment Industries in Belleview
The major employment industries in Belleview include Health Care & Social Assistance (21 | 26.3%), Construction (15 | 18.8%), Retail Trade (10 | 12.5%), and Educational Services (4 | 5.0%).
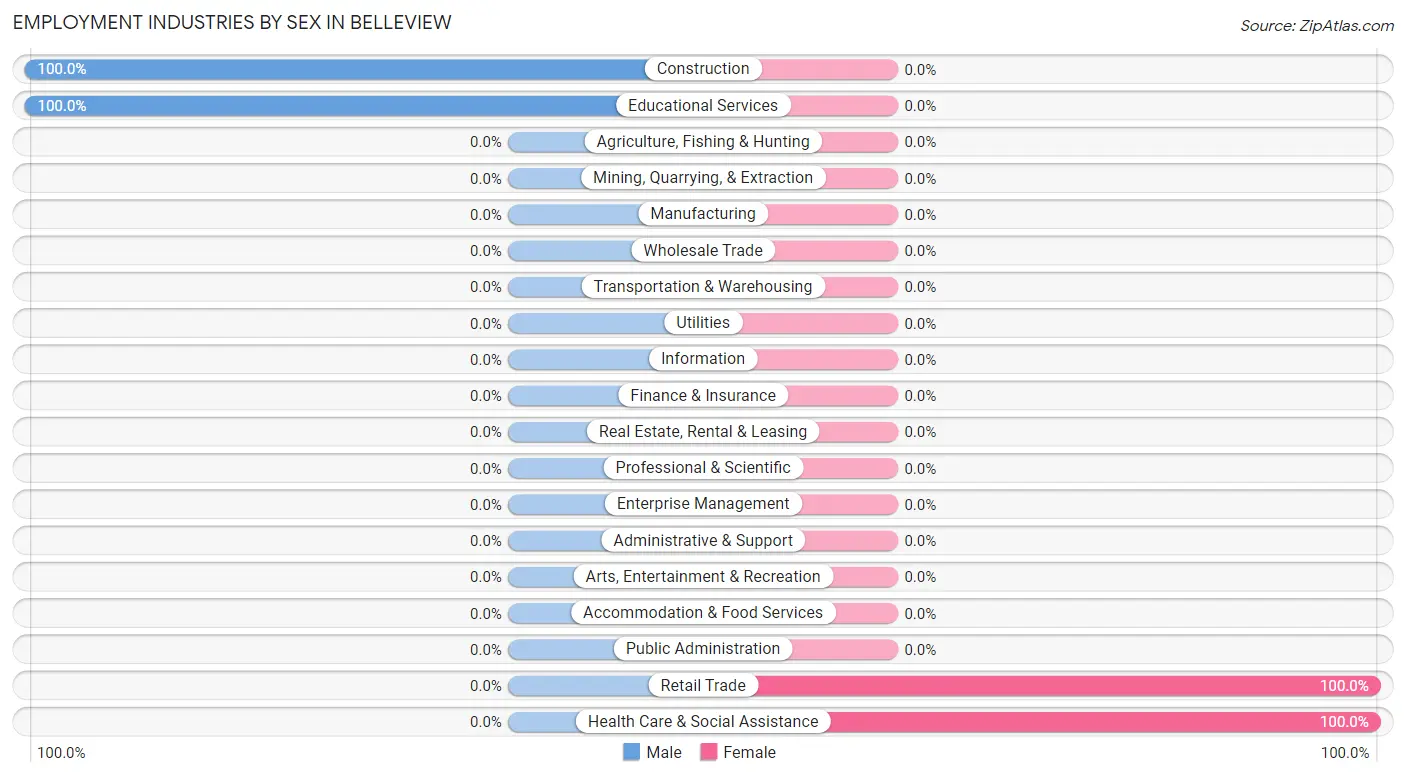
Employment Industries by Sex in Belleview
The Belleview industries that see more men than women are Construction (100.0%), and Educational Services (100.0%), whereas the industries that tend to have a higher number of women are Retail Trade (100.0%), and Health Care & Social Assistance (100.0%).
| Industry | Male | Female |
| Agriculture, Fishing & Hunting | 0 (0.0%) | 0 (0.0%) |
| Mining, Quarrying, & Extraction | 0 (0.0%) | 0 (0.0%) |
| Construction | 15 (100.0%) | 0 (0.0%) |
| Manufacturing | 0 (0.0%) | 0 (0.0%) |
| Wholesale Trade | 0 (0.0%) | 0 (0.0%) |
| Retail Trade | 0 (0.0%) | 10 (100.0%) |
| Transportation & Warehousing | 0 (0.0%) | 0 (0.0%) |
| Utilities | 0 (0.0%) | 0 (0.0%) |
| Information | 0 (0.0%) | 0 (0.0%) |
| Finance & Insurance | 0 (0.0%) | 0 (0.0%) |
| Real Estate, Rental & Leasing | 0 (0.0%) | 0 (0.0%) |
| Professional & Scientific | 0 (0.0%) | 0 (0.0%) |
| Enterprise Management | 0 (0.0%) | 0 (0.0%) |
| Administrative & Support | 0 (0.0%) | 0 (0.0%) |
| Educational Services | 4 (100.0%) | 0 (0.0%) |
| Health Care & Social Assistance | 0 (0.0%) | 21 (100.0%) |
| Arts, Entertainment & Recreation | 0 (0.0%) | 0 (0.0%) |
| Accommodation & Food Services | 0 (0.0%) | 0 (0.0%) |
| Public Administration | 0 (0.0%) | 0 (0.0%) |
| Total | 34 (42.5%) | 46 (57.5%) |
Education in Belleview
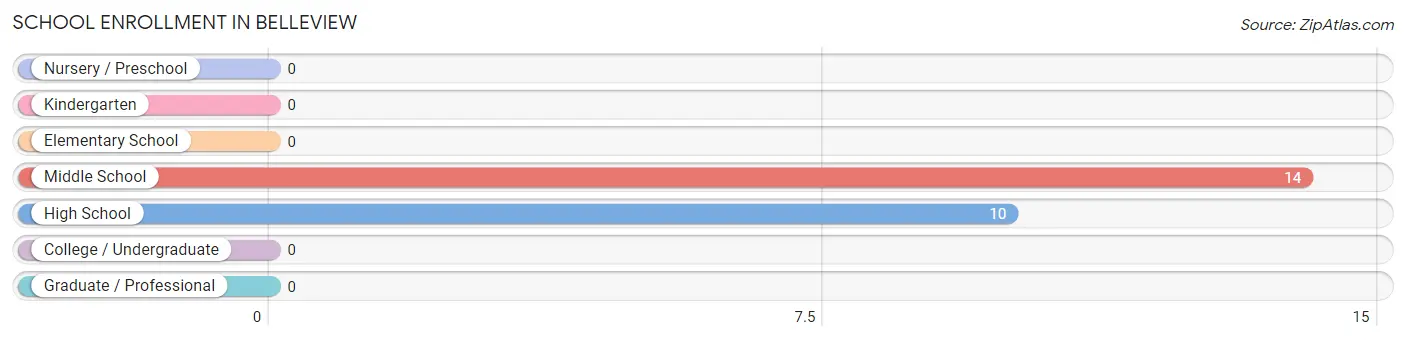
School Enrollment in Belleview
The most common levels of schooling among the 24 students in Belleview are middle school (14 | 58.3%), and high school (10 | 41.7%).
| School Level | # Students | % Students |
| Nursery / Preschool | 0 | 0.0% |
| Kindergarten | 0 | 0.0% |
| Elementary School | 0 | 0.0% |
| Middle School | 14 | 58.3% |
| High School | 10 | 41.7% |
| College / Undergraduate | 0 | 0.0% |
| Graduate / Professional | 0 | 0.0% |
| Total | 24 | 100.0% |
School Enrollment by Age by Funding Source in Belleview
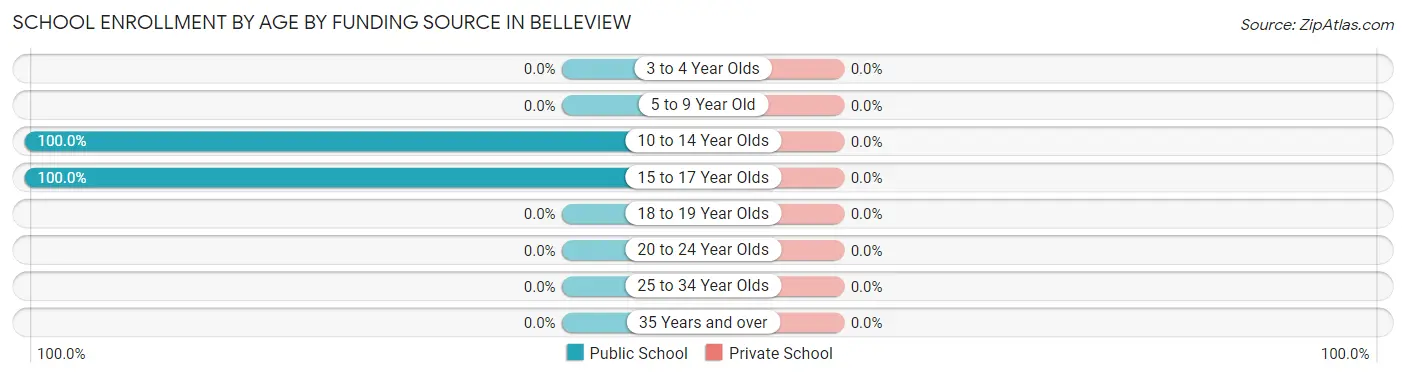
| Age Bracket | Public School | Private School |
| 3 to 4 Year Olds | 0 (0.0%) | 0 (0.0%) |
| 5 to 9 Year Old | 0 (0.0%) | 0 (0.0%) |
| 10 to 14 Year Olds | 14 (100.0%) | 0 (0.0%) |
| 15 to 17 Year Olds | 10 (100.0%) | 0 (0.0%) |
| 18 to 19 Year Olds | 0 (0.0%) | 0 (0.0%) |
| 20 to 24 Year Olds | 0 (0.0%) | 0 (0.0%) |
| 25 to 34 Year Olds | 0 (0.0%) | 0 (0.0%) |
| 35 Years and over | 0 (0.0%) | 0 (0.0%) |
| Total | 24 (100.0%) | 0 (0.0%) |
Educational Attainment by Field of Study in Belleview
Bio, nature & agricultural (15 | 50.0%), and business (15 | 50.0%) are the most common fields of study among 30 individuals in Belleview who have obtained a bachelor's degree or higher.
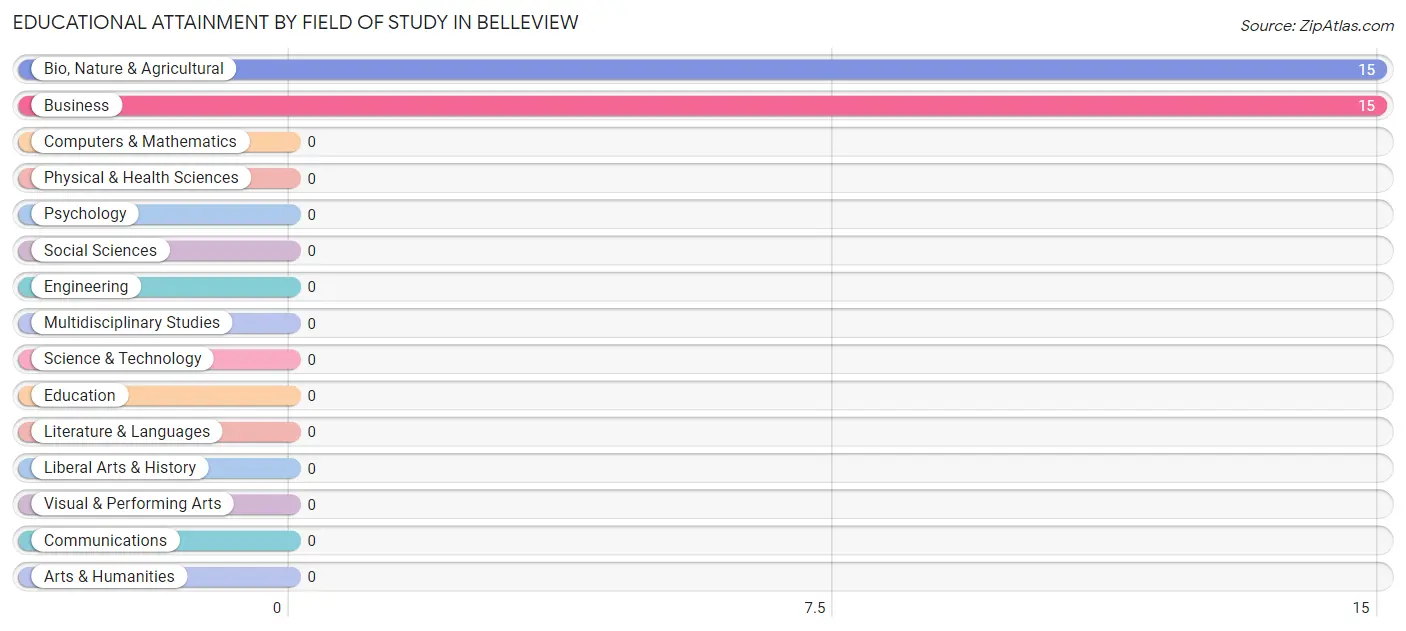
| Field of Study | # Graduates | % Graduates |
| Computers & Mathematics | 0 | 0.0% |
| Bio, Nature & Agricultural | 15 | 50.0% |
| Physical & Health Sciences | 0 | 0.0% |
| Psychology | 0 | 0.0% |
| Social Sciences | 0 | 0.0% |
| Engineering | 0 | 0.0% |
| Multidisciplinary Studies | 0 | 0.0% |
| Science & Technology | 0 | 0.0% |
| Business | 15 | 50.0% |
| Education | 0 | 0.0% |
| Literature & Languages | 0 | 0.0% |
| Liberal Arts & History | 0 | 0.0% |
| Visual & Performing Arts | 0 | 0.0% |
| Communications | 0 | 0.0% |
| Arts & Humanities | 0 | 0.0% |
| Total | 30 | 100.0% |
Transportation & Commute in Belleview
Vehicle Availability by Sex in Belleview
The most prevalent vehicle ownership categories in Belleview are males with 4 vehicles (19, accounting for 55.9%) and females with 4 vehicles (15, making up 41.3%).
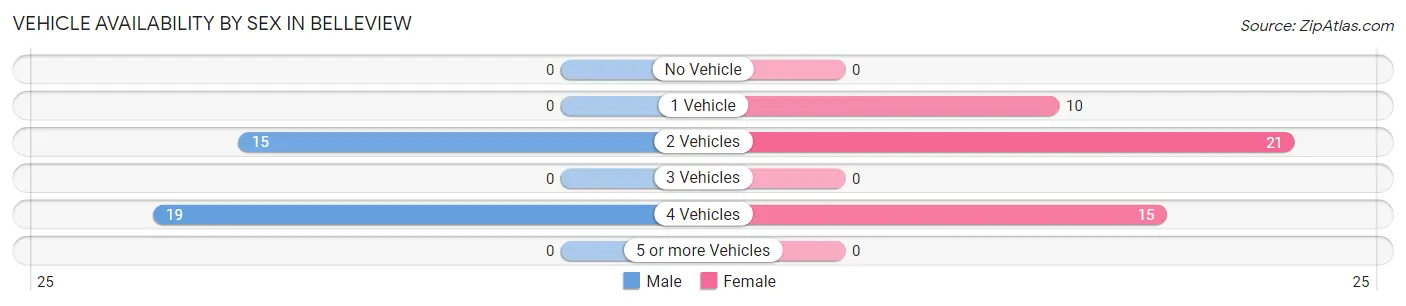
| Vehicles Available | Male | Female |
| No Vehicle | 0 (0.0%) | 0 (0.0%) |
| 1 Vehicle | 0 (0.0%) | 10 (21.7%) |
| 2 Vehicles | 15 (44.1%) | 21 (45.7%) |
| 3 Vehicles | 0 (0.0%) | 0 (0.0%) |
| 4 Vehicles | 19 (55.9%) | 15 (32.6%) |
| 5 or more Vehicles | 0 (0.0%) | 0 (0.0%) |
| Total | 34 (100.0%) | 46 (100.0%) |
Commute Time in Belleview
The most frequently occuring commute durations in Belleview are 15 to 19 minutes (30 commuters, 37.5%), 20 to 24 minutes (23 commuters, 28.7%), and 45 to 59 minutes (13 commuters, 16.3%).
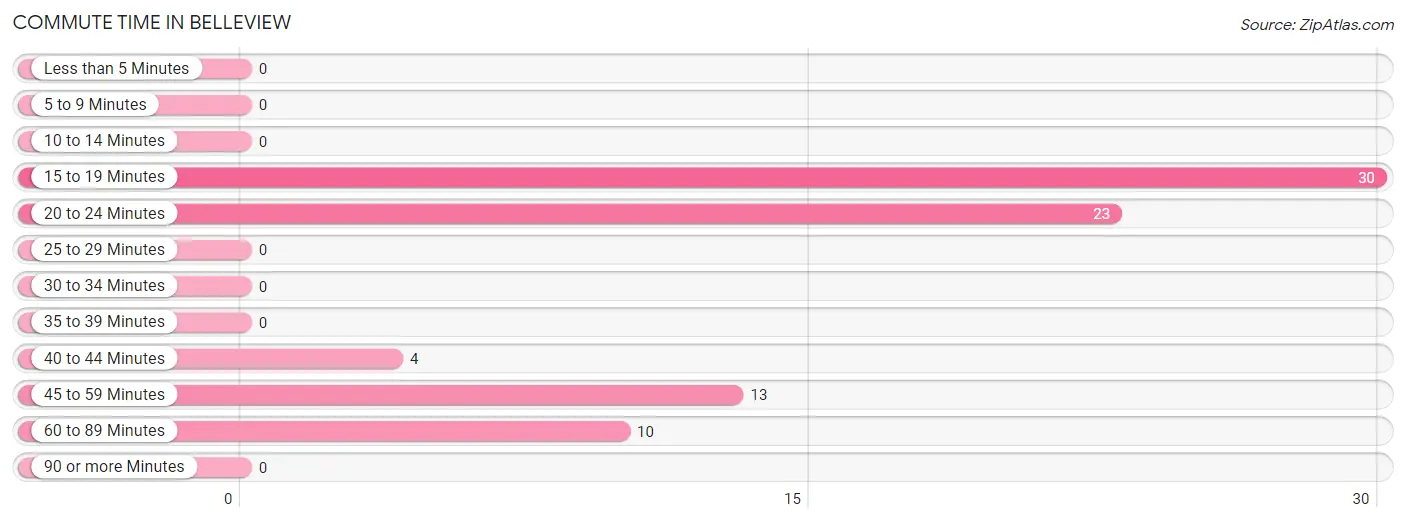
| Commute Time | # Commuters | % Commuters |
| Less than 5 Minutes | 0 | 0.0% |
| 5 to 9 Minutes | 0 | 0.0% |
| 10 to 14 Minutes | 0 | 0.0% |
| 15 to 19 Minutes | 30 | 37.5% |
| 20 to 24 Minutes | 23 | 28.7% |
| 25 to 29 Minutes | 0 | 0.0% |
| 30 to 34 Minutes | 0 | 0.0% |
| 35 to 39 Minutes | 0 | 0.0% |
| 40 to 44 Minutes | 4 | 5.0% |
| 45 to 59 Minutes | 13 | 16.3% |
| 60 to 89 Minutes | 10 | 12.5% |
| 90 or more Minutes | 0 | 0.0% |
Commute Time by Sex in Belleview
The most common commute times in Belleview are 15 to 19 minutes (15 commuters, 44.1%) for males and 15 to 19 minutes (15 commuters, 32.6%) for females.
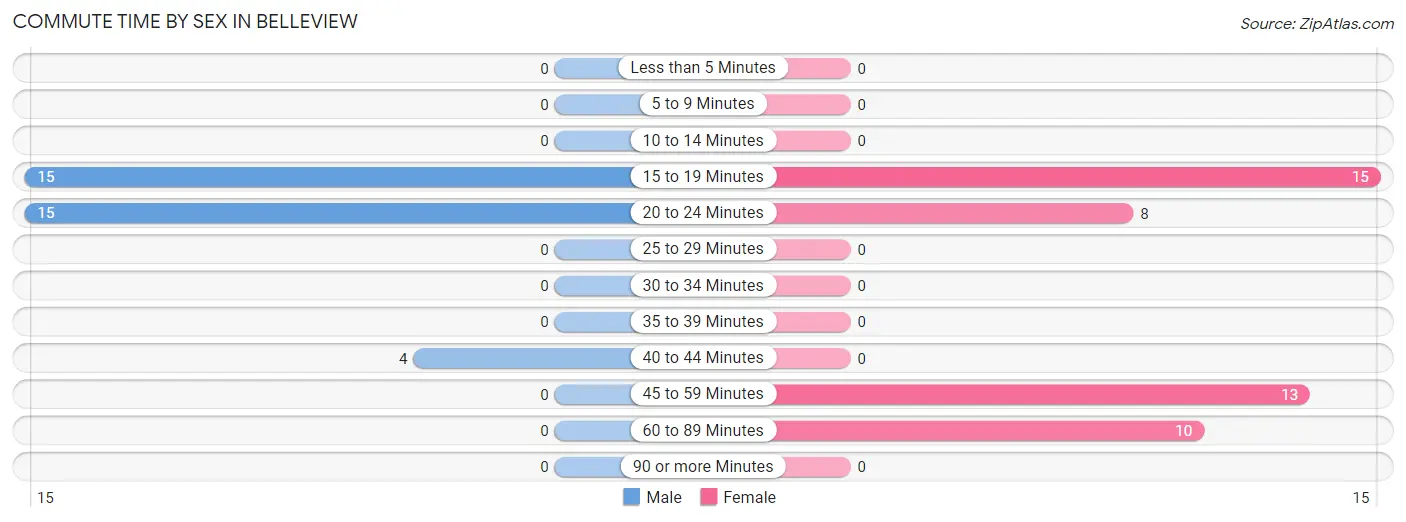
| Commute Time | Male | Female |
| Less than 5 Minutes | 0 (0.0%) | 0 (0.0%) |
| 5 to 9 Minutes | 0 (0.0%) | 0 (0.0%) |
| 10 to 14 Minutes | 0 (0.0%) | 0 (0.0%) |
| 15 to 19 Minutes | 15 (44.1%) | 15 (32.6%) |
| 20 to 24 Minutes | 15 (44.1%) | 8 (17.4%) |
| 25 to 29 Minutes | 0 (0.0%) | 0 (0.0%) |
| 30 to 34 Minutes | 0 (0.0%) | 0 (0.0%) |
| 35 to 39 Minutes | 0 (0.0%) | 0 (0.0%) |
| 40 to 44 Minutes | 4 (11.8%) | 0 (0.0%) |
| 45 to 59 Minutes | 0 (0.0%) | 13 (28.3%) |
| 60 to 89 Minutes | 0 (0.0%) | 10 (21.7%) |
| 90 or more Minutes | 0 (0.0%) | 0 (0.0%) |
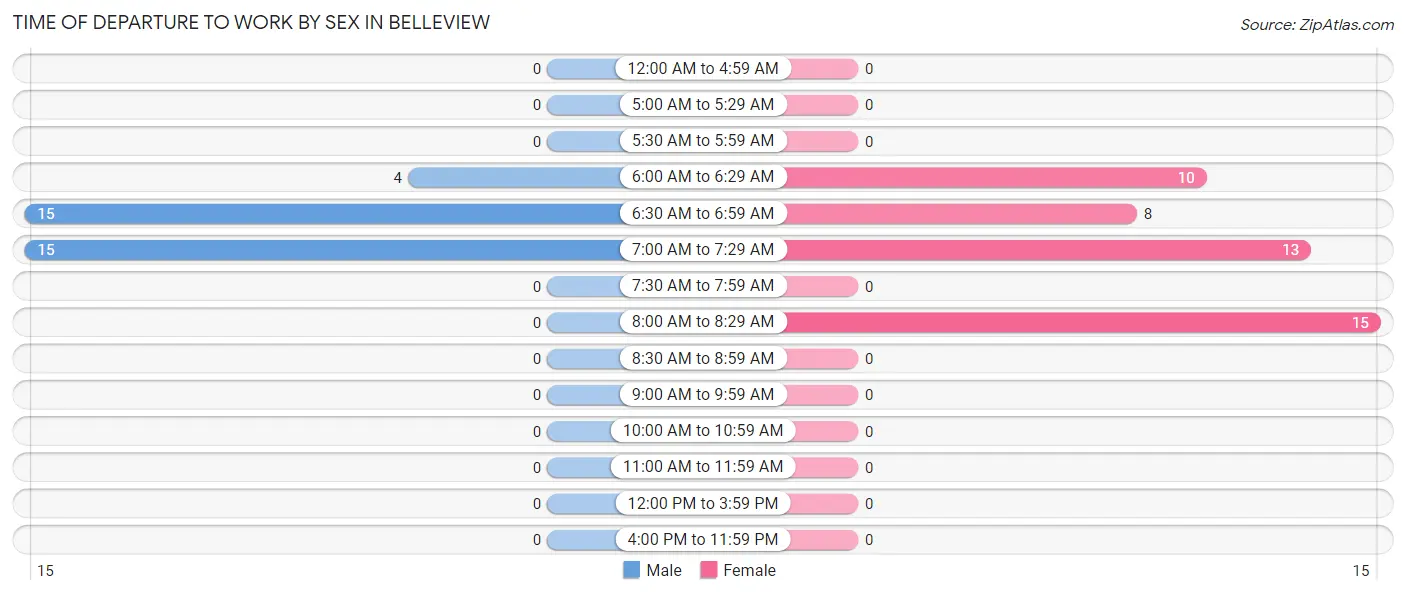
Time of Departure to Work by Sex in Belleview
The most frequent times of departure to work in Belleview are 6:30 AM to 6:59 AM (15, 44.1%) for males and 8:00 AM to 8:29 AM (15, 32.6%) for females.
| Time of Departure | Male | Female |
| 12:00 AM to 4:59 AM | 0 (0.0%) | 0 (0.0%) |
| 5:00 AM to 5:29 AM | 0 (0.0%) | 0 (0.0%) |
| 5:30 AM to 5:59 AM | 0 (0.0%) | 0 (0.0%) |
| 6:00 AM to 6:29 AM | 4 (11.8%) | 10 (21.7%) |
| 6:30 AM to 6:59 AM | 15 (44.1%) | 8 (17.4%) |
| 7:00 AM to 7:29 AM | 15 (44.1%) | 13 (28.3%) |
| 7:30 AM to 7:59 AM | 0 (0.0%) | 0 (0.0%) |
| 8:00 AM to 8:29 AM | 0 (0.0%) | 15 (32.6%) |
| 8:30 AM to 8:59 AM | 0 (0.0%) | 0 (0.0%) |
| 9:00 AM to 9:59 AM | 0 (0.0%) | 0 (0.0%) |
| 10:00 AM to 10:59 AM | 0 (0.0%) | 0 (0.0%) |
| 11:00 AM to 11:59 AM | 0 (0.0%) | 0 (0.0%) |
| 12:00 PM to 3:59 PM | 0 (0.0%) | 0 (0.0%) |
| 4:00 PM to 11:59 PM | 0 (0.0%) | 0 (0.0%) |
| Total | 34 (100.0%) | 46 (100.0%) |
Housing Occupancy in Belleview
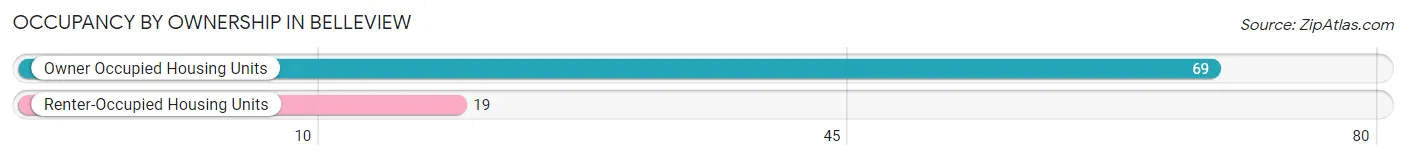
Occupancy by Ownership in Belleview
Of the total 88 dwellings in Belleview, owner-occupied units account for 69 (78.4%), while renter-occupied units make up 19 (21.6%).
| Occupancy | # Housing Units | % Housing Units |
| Owner Occupied Housing Units | 69 | 78.4% |
| Renter-Occupied Housing Units | 19 | 21.6% |
| Total Occupied Housing Units | 88 | 100.0% |
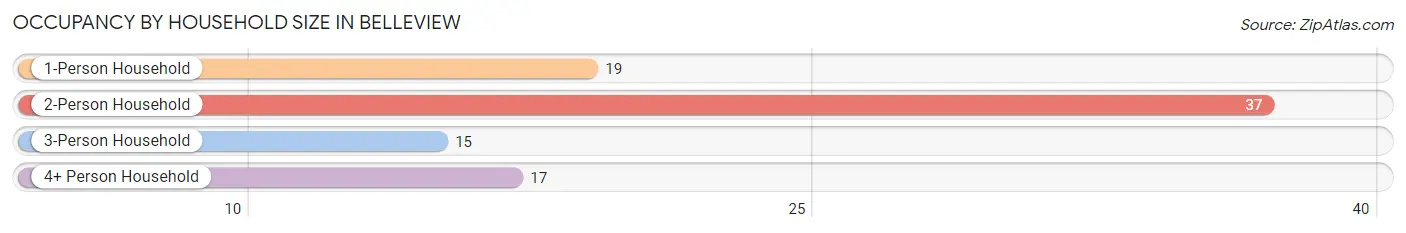
Occupancy by Household Size in Belleview
| Household Size | # Housing Units | % Housing Units |
| 1-Person Household | 19 | 21.6% |
| 2-Person Household | 37 | 42.0% |
| 3-Person Household | 15 | 17.1% |
| 4+ Person Household | 17 | 19.3% |
| Total Housing Units | 88 | 100.0% |
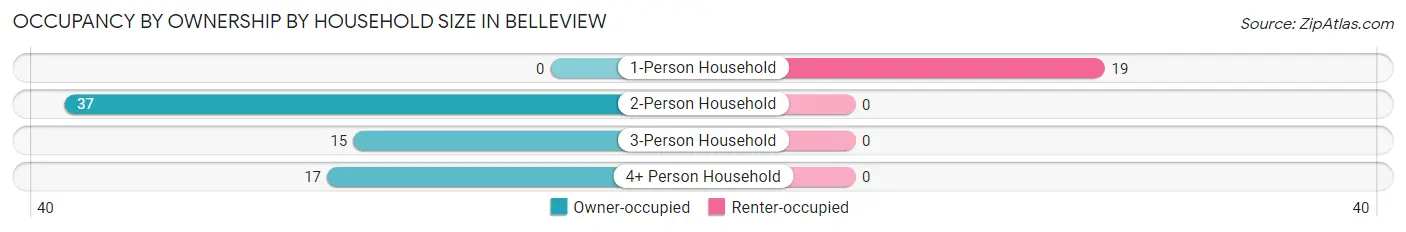
Occupancy by Ownership by Household Size in Belleview
| Household Size | Owner-occupied | Renter-occupied |
| 1-Person Household | 0 (0.0%) | 19 (100.0%) |
| 2-Person Household | 37 (100.0%) | 0 (0.0%) |
| 3-Person Household | 15 (100.0%) | 0 (0.0%) |
| 4+ Person Household | 17 (100.0%) | 0 (0.0%) |
| Total Housing Units | 69 (78.4%) | 19 (21.6%) |
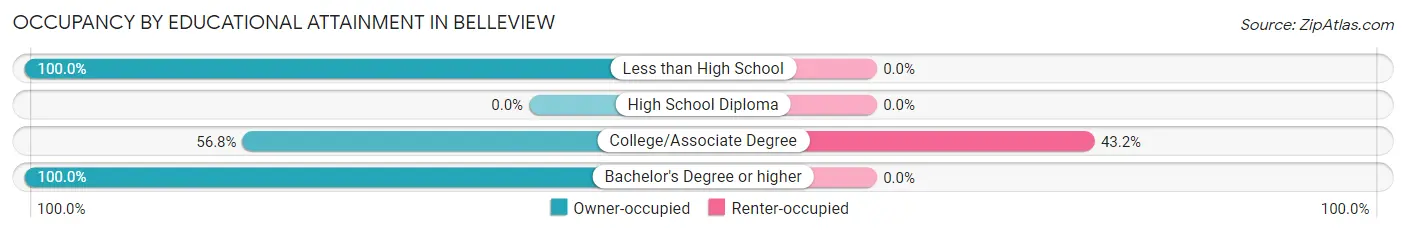
Occupancy by Educational Attainment in Belleview
| Household Size | Owner-occupied | Renter-occupied |
| Less than High School | 29 (100.0%) | 0 (0.0%) |
| High School Diploma | 0 (0.0%) | 0 (0.0%) |
| College/Associate Degree | 25 (56.8%) | 19 (43.2%) |
| Bachelor's Degree or higher | 15 (100.0%) | 0 (0.0%) |
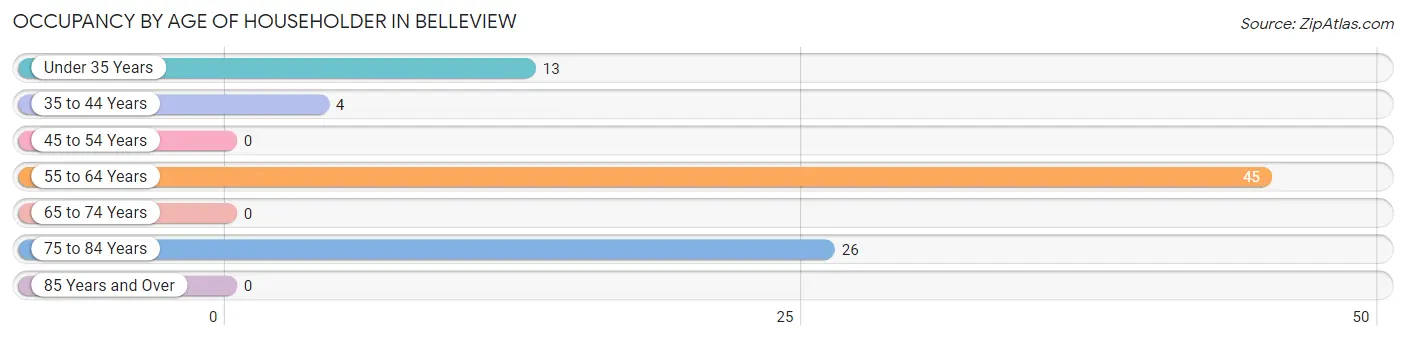
Occupancy by Age of Householder in Belleview
| Age Bracket | # Households | % Households |
| Under 35 Years | 13 | 14.8% |
| 35 to 44 Years | 4 | 4.5% |
| 45 to 54 Years | 0 | 0.0% |
| 55 to 64 Years | 45 | 51.1% |
| 65 to 74 Years | 0 | 0.0% |
| 75 to 84 Years | 26 | 29.5% |
| 85 Years and Over | 0 | 0.0% |
| Total | 88 | 100.0% |
Housing Finances in Belleview
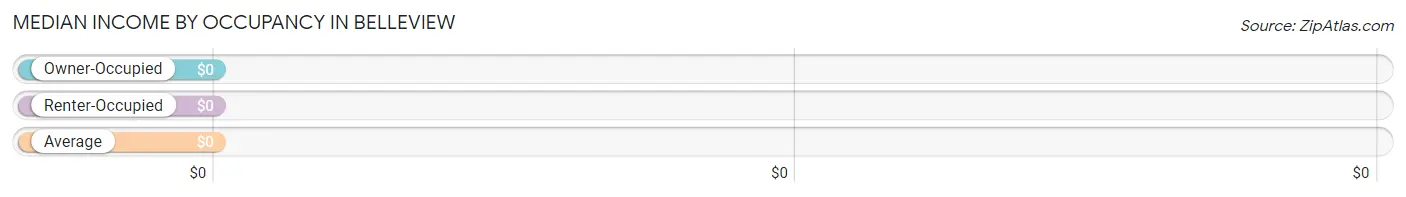
Median Income by Occupancy in Belleview
| Occupancy Type | # Households | Median Income |
| Owner-Occupied | 69 (78.4%) | $0 |
| Renter-Occupied | 19 (21.6%) | $0 |
| Average | 88 (100.0%) | $0 |
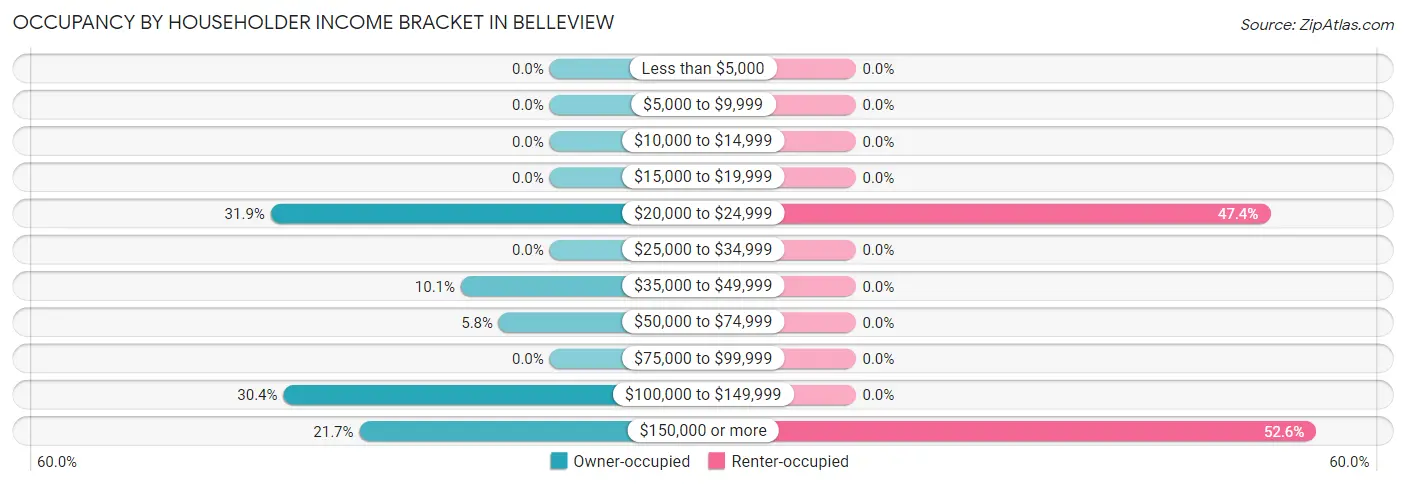
Occupancy by Householder Income Bracket in Belleview
| Income Bracket | Owner-occupied | Renter-occupied |
| Less than $5,000 | 0 (0.0%) | 0 (0.0%) |
| $5,000 to $9,999 | 0 (0.0%) | 0 (0.0%) |
| $10,000 to $14,999 | 0 (0.0%) | 0 (0.0%) |
| $15,000 to $19,999 | 0 (0.0%) | 0 (0.0%) |
| $20,000 to $24,999 | 22 (31.9%) | 9 (47.4%) |
| $25,000 to $34,999 | 0 (0.0%) | 0 (0.0%) |
| $35,000 to $49,999 | 7 (10.1%) | 0 (0.0%) |
| $50,000 to $74,999 | 4 (5.8%) | 0 (0.0%) |
| $75,000 to $99,999 | 0 (0.0%) | 0 (0.0%) |
| $100,000 to $149,999 | 21 (30.4%) | 0 (0.0%) |
| $150,000 or more | 15 (21.7%) | 10 (52.6%) |
| Total | 69 (100.0%) | 19 (100.0%) |
Monthly Housing Cost Tiers in Belleview
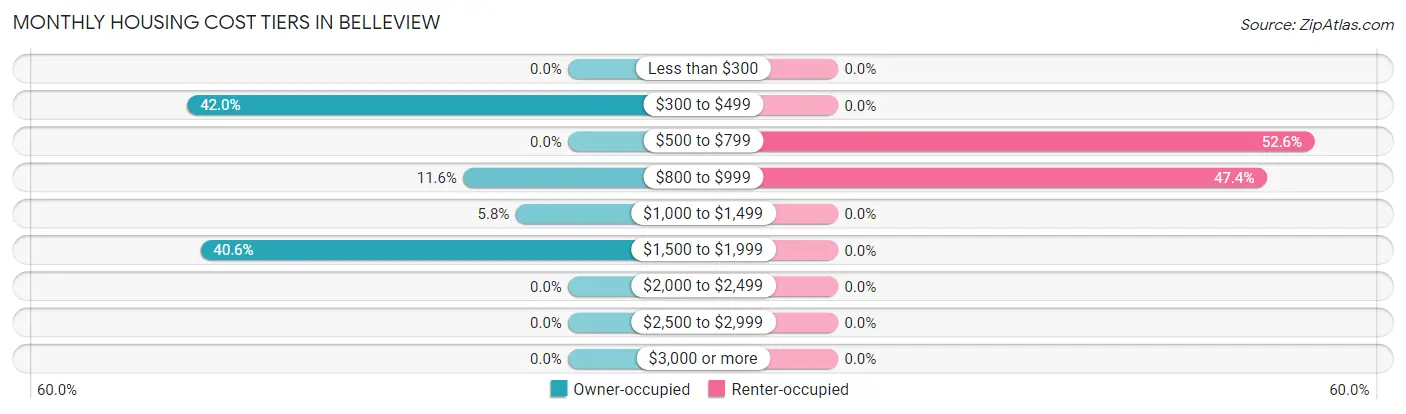
| Monthly Cost | Owner-occupied | Renter-occupied |
| Less than $300 | 0 (0.0%) | 0 (0.0%) |
| $300 to $499 | 29 (42.0%) | 0 (0.0%) |
| $500 to $799 | 0 (0.0%) | 10 (52.6%) |
| $800 to $999 | 8 (11.6%) | 9 (47.4%) |
| $1,000 to $1,499 | 4 (5.8%) | 0 (0.0%) |
| $1,500 to $1,999 | 28 (40.6%) | 0 (0.0%) |
| $2,000 to $2,499 | 0 (0.0%) | 0 (0.0%) |
| $2,500 to $2,999 | 0 (0.0%) | 0 (0.0%) |
| $3,000 or more | 0 (0.0%) | 0 (0.0%) |
| Total | 69 (100.0%) | 19 (100.0%) |
Physical Housing Characteristics in Belleview
Housing Structures in Belleview
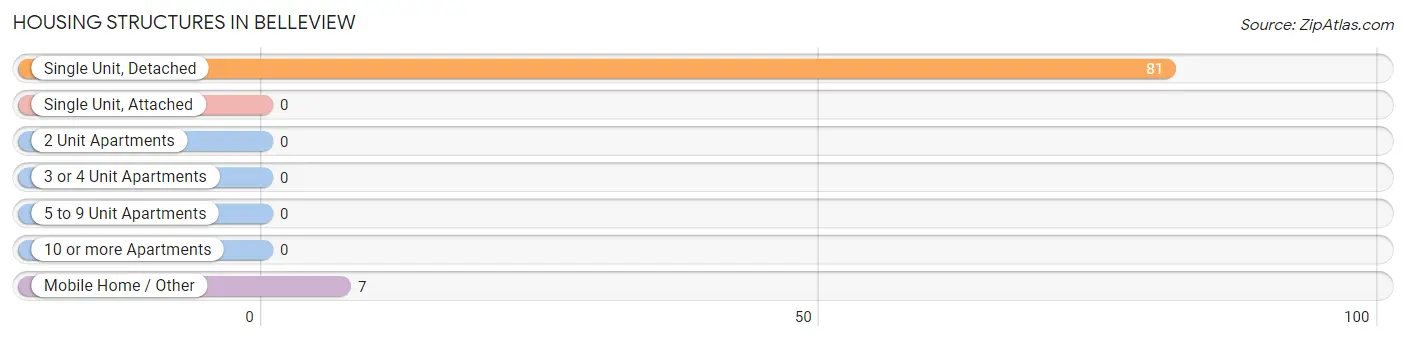
| Structure Type | # Housing Units | % Housing Units |
| Single Unit, Detached | 81 | 92.0% |
| Single Unit, Attached | 0 | 0.0% |
| 2 Unit Apartments | 0 | 0.0% |
| 3 or 4 Unit Apartments | 0 | 0.0% |
| 5 to 9 Unit Apartments | 0 | 0.0% |
| 10 or more Apartments | 0 | 0.0% |
| Mobile Home / Other | 7 | 8.0% |
| Total | 88 | 100.0% |
Housing Structures by Occupancy in Belleview
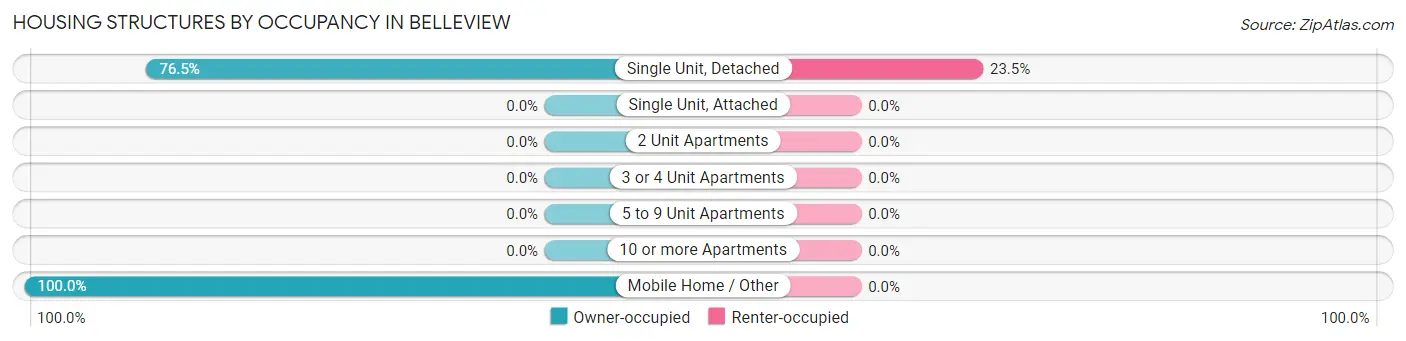
| Structure Type | Owner-occupied | Renter-occupied |
| Single Unit, Detached | 62 (76.5%) | 19 (23.5%) |
| Single Unit, Attached | 0 (0.0%) | 0 (0.0%) |
| 2 Unit Apartments | 0 (0.0%) | 0 (0.0%) |
| 3 or 4 Unit Apartments | 0 (0.0%) | 0 (0.0%) |
| 5 to 9 Unit Apartments | 0 (0.0%) | 0 (0.0%) |
| 10 or more Apartments | 0 (0.0%) | 0 (0.0%) |
| Mobile Home / Other | 7 (100.0%) | 0 (0.0%) |
| Total | 69 (78.4%) | 19 (21.6%) |
Housing Structures by Number of Rooms in Belleview
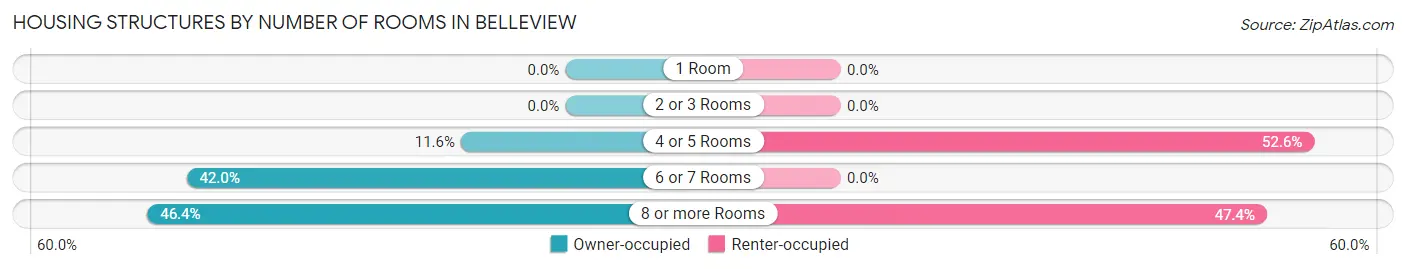
| Number of Rooms | Owner-occupied | Renter-occupied |
| 1 Room | 0 (0.0%) | 0 (0.0%) |
| 2 or 3 Rooms | 0 (0.0%) | 0 (0.0%) |
| 4 or 5 Rooms | 8 (11.6%) | 10 (52.6%) |
| 6 or 7 Rooms | 29 (42.0%) | 0 (0.0%) |
| 8 or more Rooms | 32 (46.4%) | 9 (47.4%) |
| Total | 69 (100.0%) | 19 (100.0%) |
Housing Structure by Heating Type in Belleview
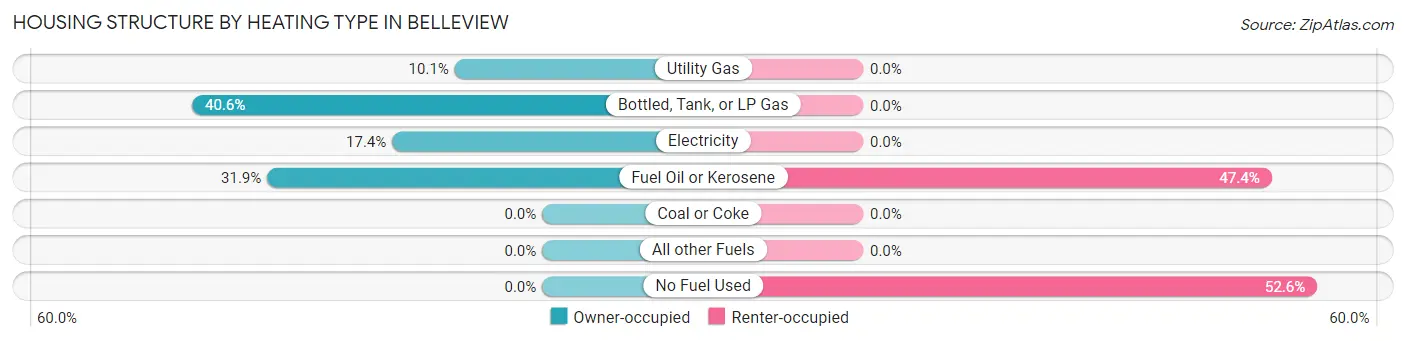
| Heating Type | Owner-occupied | Renter-occupied |
| Utility Gas | 7 (10.1%) | 0 (0.0%) |
| Bottled, Tank, or LP Gas | 28 (40.6%) | 0 (0.0%) |
| Electricity | 12 (17.4%) | 0 (0.0%) |
| Fuel Oil or Kerosene | 22 (31.9%) | 9 (47.4%) |
| Coal or Coke | 0 (0.0%) | 0 (0.0%) |
| All other Fuels | 0 (0.0%) | 0 (0.0%) |
| No Fuel Used | 0 (0.0%) | 10 (52.6%) |
| Total | 69 (100.0%) | 19 (100.0%) |
Household Vehicle Usage in Belleview
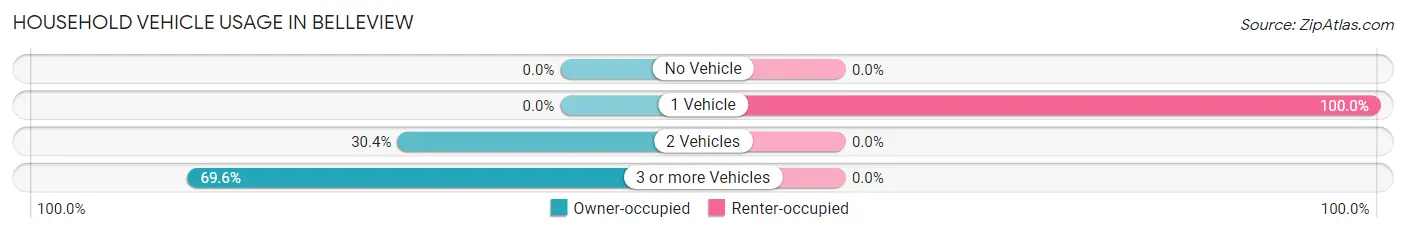
| Vehicles per Household | Owner-occupied | Renter-occupied |
| No Vehicle | 0 (0.0%) | 0 (0.0%) |
| 1 Vehicle | 0 (0.0%) | 19 (100.0%) |
| 2 Vehicles | 21 (30.4%) | 0 (0.0%) |
| 3 or more Vehicles | 48 (69.6%) | 0 (0.0%) |
| Total | 69 (100.0%) | 19 (100.0%) |
Real Estate & Mortgages in Belleview
Real Estate and Mortgage Overview in Belleview
| Characteristic | Without Mortgage | With Mortgage |
| Housing Units | 29 | 40 |
| Median Property Value | - | - |
| Median Household Income | - | - |
| Monthly Housing Costs | - | - |
| Real Estate Taxes | - | - |
Property Value by Mortgage Status in Belleview
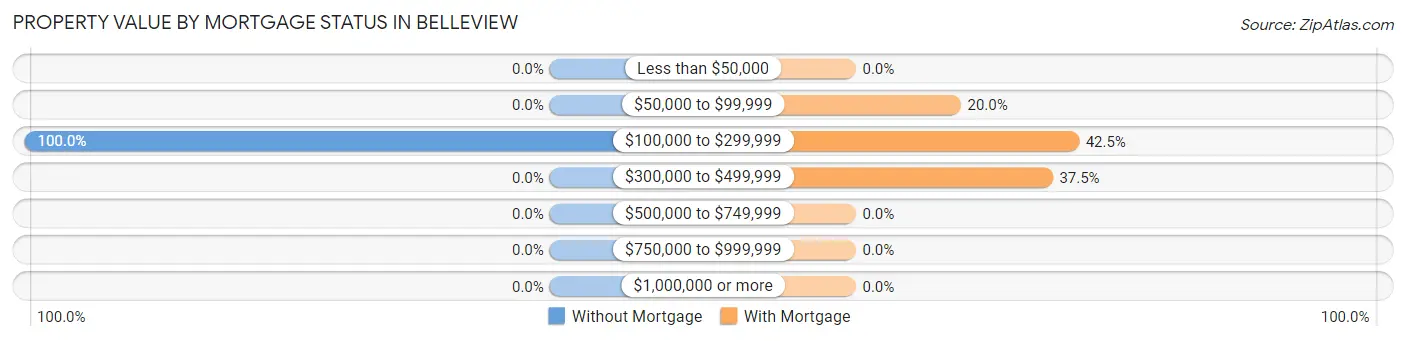
| Property Value | Without Mortgage | With Mortgage |
| Less than $50,000 | 0 (0.0%) | 0 (0.0%) |
| $50,000 to $99,999 | 0 (0.0%) | 8 (20.0%) |
| $100,000 to $299,999 | 29 (100.0%) | 17 (42.5%) |
| $300,000 to $499,999 | 0 (0.0%) | 15 (37.5%) |
| $500,000 to $749,999 | 0 (0.0%) | 0 (0.0%) |
| $750,000 to $999,999 | 0 (0.0%) | 0 (0.0%) |
| $1,000,000 or more | 0 (0.0%) | 0 (0.0%) |
| Total | 29 (100.0%) | 40 (100.0%) |
Household Income by Mortgage Status in Belleview
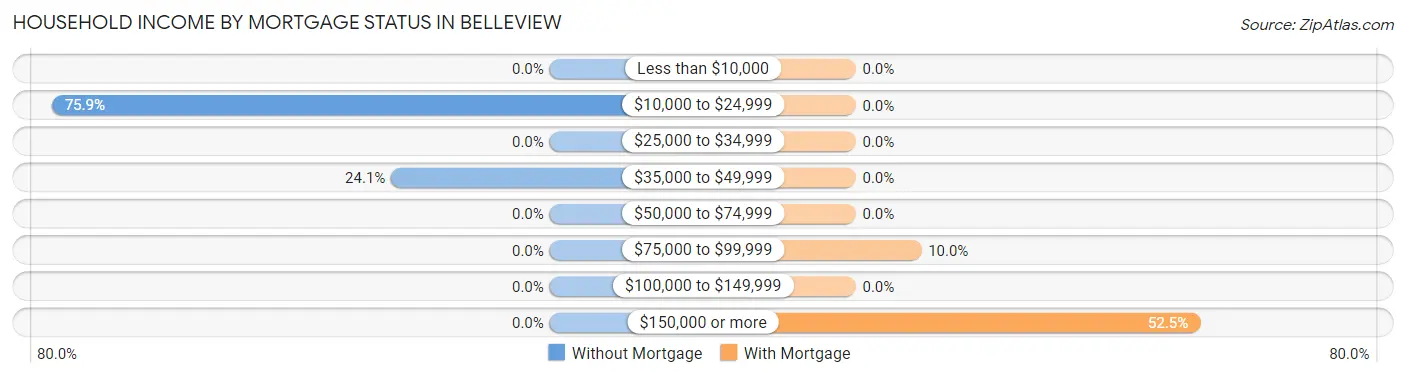
| Household Income | Without Mortgage | With Mortgage |
| Less than $10,000 | 0 (0.0%) | 0 (0.0%) |
| $10,000 to $24,999 | 22 (75.9%) | 0 (0.0%) |
| $25,000 to $34,999 | 0 (0.0%) | 0 (0.0%) |
| $35,000 to $49,999 | 7 (24.1%) | 0 (0.0%) |
| $50,000 to $74,999 | 0 (0.0%) | 0 (0.0%) |
| $75,000 to $99,999 | 0 (0.0%) | 4 (10.0%) |
| $100,000 to $149,999 | 0 (0.0%) | 0 (0.0%) |
| $150,000 or more | 0 (0.0%) | 21 (52.5%) |
| Total | 29 (100.0%) | 40 (100.0%) |
Property Value to Household Income Ratio in Belleview
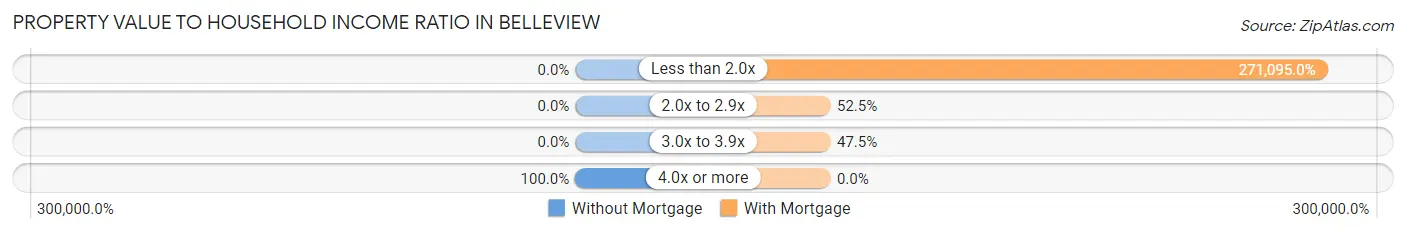
| Value-to-Income Ratio | Without Mortgage | With Mortgage |
| Less than 2.0x | 0 (0.0%) | 108,438 (271,095.0%) |
| 2.0x to 2.9x | 0 (0.0%) | 21 (52.5%) |
| 3.0x to 3.9x | 0 (0.0%) | 19 (47.5%) |
| 4.0x or more | 29 (100.0%) | 0 (0.0%) |
| Total | 29 (100.0%) | 40 (100.0%) |
Real Estate Taxes by Mortgage Status in Belleview
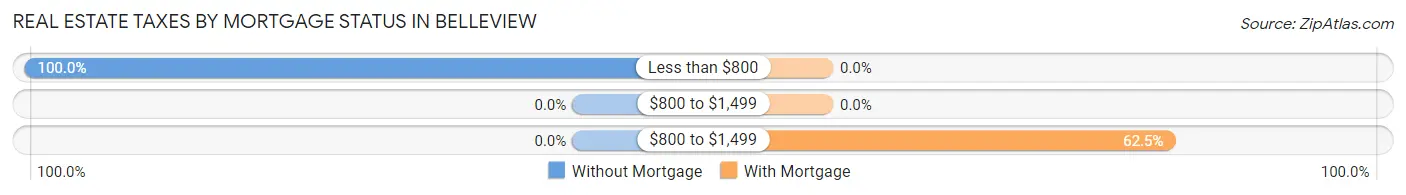
| Property Taxes | Without Mortgage | With Mortgage |
| Less than $800 | 29 (100.0%) | 0 (0.0%) |
| $800 to $1,499 | 0 (0.0%) | 0 (0.0%) |
| $800 to $1,499 | 0 (0.0%) | 25 (62.5%) |
| Total | 29 (100.0%) | 40 (100.0%) |
Health & Disability in Belleview
Health Insurance Coverage by Age in Belleview
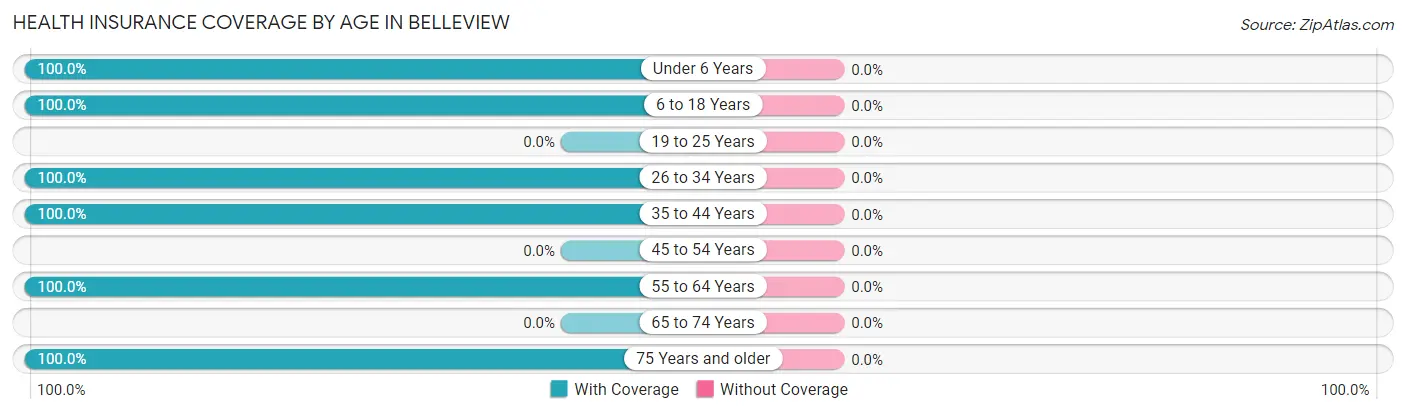
| Age Bracket | With Coverage | Without Coverage |
| Under 6 Years | 11 (100.0%) | 0 (0.0%) |
| 6 to 18 Years | 27 (100.0%) | 0 (0.0%) |
| 19 to 25 Years | 0 (0.0%) | 0 (0.0%) |
| 26 to 34 Years | 17 (100.0%) | 0 (0.0%) |
| 35 to 44 Years | 19 (100.0%) | 0 (0.0%) |
| 45 to 54 Years | 0 (0.0%) | 0 (0.0%) |
| 55 to 64 Years | 115 (100.0%) | 0 (0.0%) |
| 65 to 74 Years | 0 (0.0%) | 0 (0.0%) |
| 75 Years and older | 34 (100.0%) | 0 (0.0%) |
| Total | 223 (100.0%) | 0 (0.0%) |
Health Insurance Coverage by Citizenship Status in Belleview

| Citizenship Status | With Coverage | Without Coverage |
| Native Born | 11 (100.0%) | 0 (0.0%) |
| Foreign Born, Citizen | 27 (100.0%) | 0 (0.0%) |
| Foreign Born, not a Citizen | 0 (0.0%) | 0 (0.0%) |
Health Insurance Coverage by Household Income in Belleview
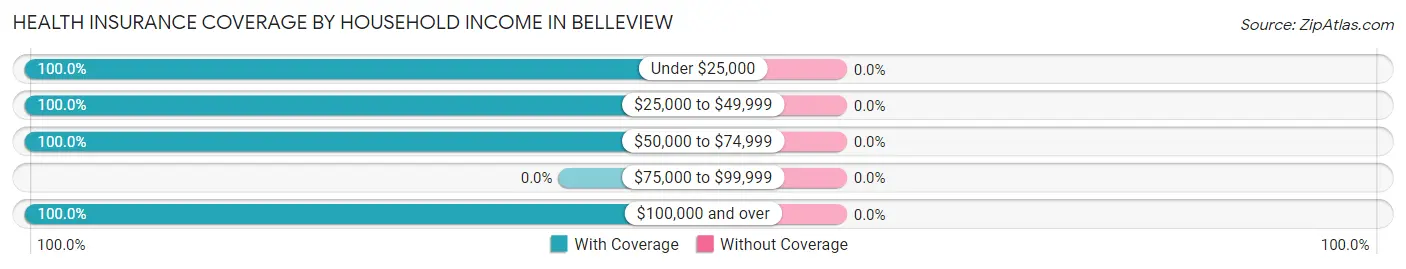
| Household Income | With Coverage | Without Coverage |
| Under $25,000 | 57 (100.0%) | 0 (0.0%) |
| $25,000 to $49,999 | 15 (100.0%) | 0 (0.0%) |
| $50,000 to $74,999 | 21 (100.0%) | 0 (0.0%) |
| $75,000 to $99,999 | 0 (0.0%) | 0 (0.0%) |
| $100,000 and over | 130 (100.0%) | 0 (0.0%) |
Public vs Private Health Insurance Coverage by Age in Belleview
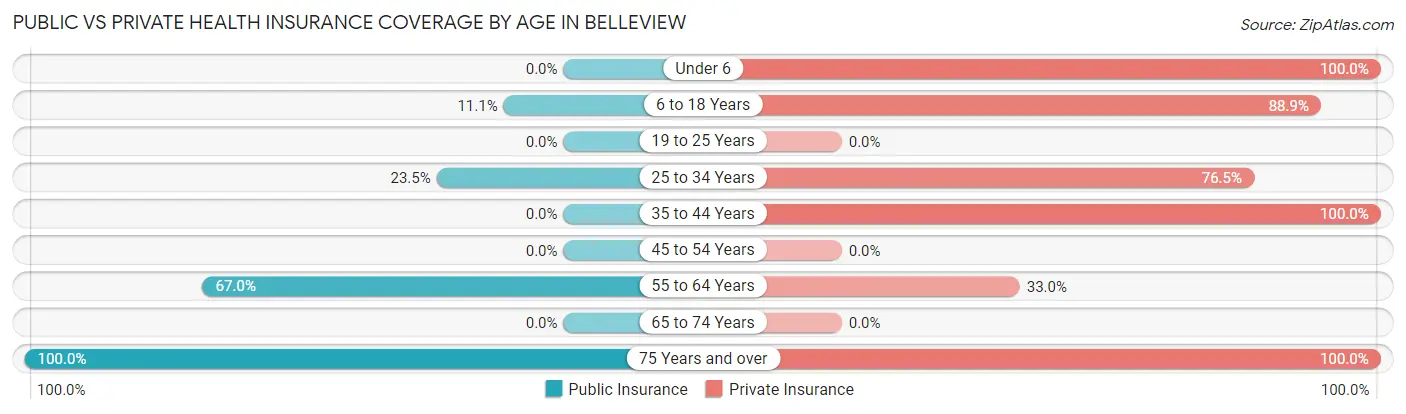
| Age Bracket | Public Insurance | Private Insurance |
| Under 6 | 0 (0.0%) | 11 (100.0%) |
| 6 to 18 Years | 3 (11.1%) | 24 (88.9%) |
| 19 to 25 Years | 0 (0.0%) | 0 (0.0%) |
| 25 to 34 Years | 4 (23.5%) | 13 (76.5%) |
| 35 to 44 Years | 0 (0.0%) | 19 (100.0%) |
| 45 to 54 Years | 0 (0.0%) | 0 (0.0%) |
| 55 to 64 Years | 77 (67.0%) | 38 (33.0%) |
| 65 to 74 Years | 0 (0.0%) | 0 (0.0%) |
| 75 Years and over | 34 (100.0%) | 34 (100.0%) |
| Total | 118 (52.9%) | 139 (62.3%) |
Disability Status by Sex by Age in Belleview
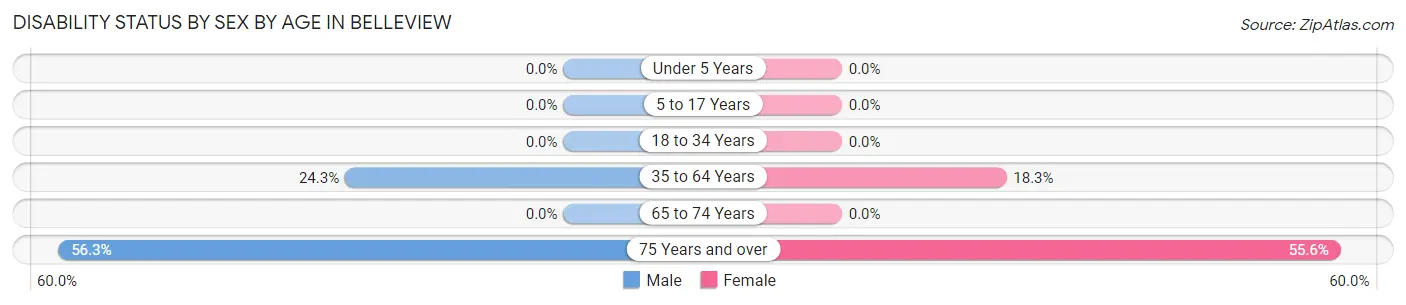
| Age Bracket | Male | Female |
| Under 5 Years | 0 (0.0%) | 0 (0.0%) |
| 5 to 17 Years | 0 (0.0%) | 0 (0.0%) |
| 18 to 34 Years | 0 (0.0%) | 0 (0.0%) |
| 35 to 64 Years | 18 (24.3%) | 11 (18.3%) |
| 65 to 74 Years | 0 (0.0%) | 0 (0.0%) |
| 75 Years and over | 9 (56.2%) | 10 (55.6%) |
Disability Class by Sex by Age in Belleview
Disability Class: Hearing Difficulty
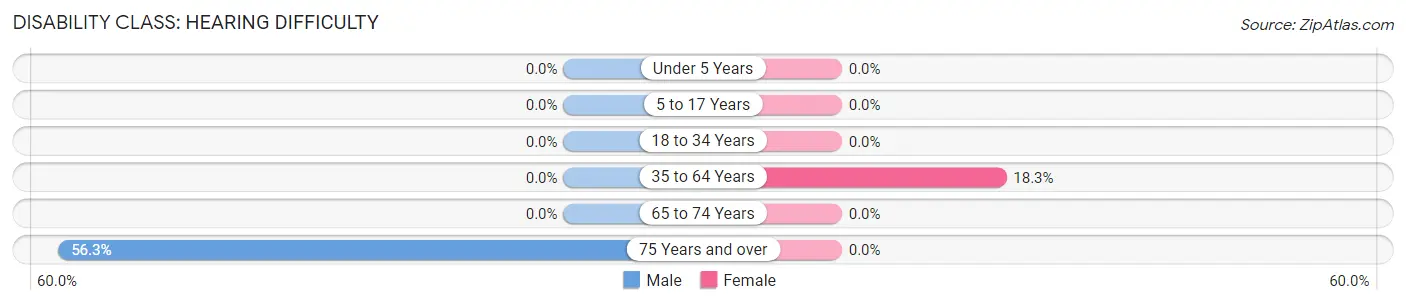
| Age Bracket | Male | Female |
| Under 5 Years | 0 (0.0%) | 0 (0.0%) |
| 5 to 17 Years | 0 (0.0%) | 0 (0.0%) |
| 18 to 34 Years | 0 (0.0%) | 0 (0.0%) |
| 35 to 64 Years | 0 (0.0%) | 11 (18.3%) |
| 65 to 74 Years | 0 (0.0%) | 0 (0.0%) |
| 75 Years and over | 9 (56.2%) | 0 (0.0%) |
Disability Class: Vision Difficulty
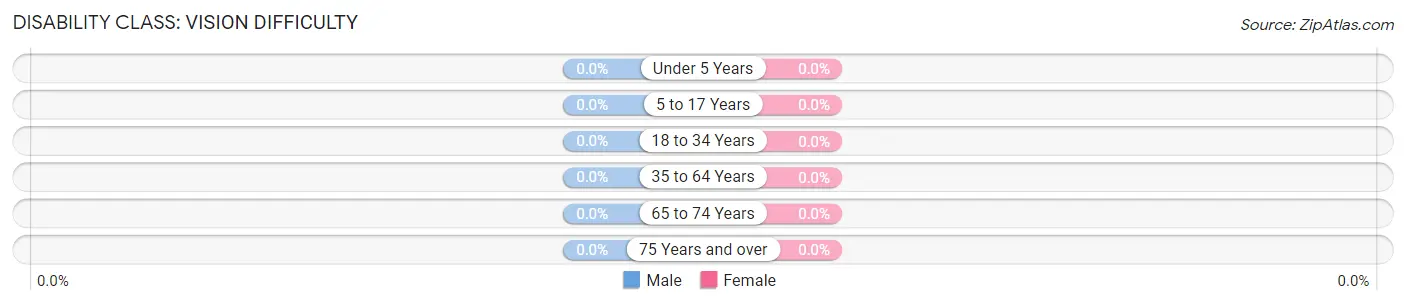
| Age Bracket | Male | Female |
| Under 5 Years | 0 (0.0%) | 0 (0.0%) |
| 5 to 17 Years | 0 (0.0%) | 0 (0.0%) |
| 18 to 34 Years | 0 (0.0%) | 0 (0.0%) |
| 35 to 64 Years | 0 (0.0%) | 0 (0.0%) |
| 65 to 74 Years | 0 (0.0%) | 0 (0.0%) |
| 75 Years and over | 0 (0.0%) | 0 (0.0%) |
Disability Class: Cognitive Difficulty
| Age Bracket | Male | Female |
| 5 to 17 Years | 0 (0.0%) | 0 (0.0%) |
| 18 to 34 Years | 0 (0.0%) | 0 (0.0%) |
| 35 to 64 Years | 0 (0.0%) | 0 (0.0%) |
| 65 to 74 Years | 0 (0.0%) | 0 (0.0%) |
| 75 Years and over | 0 (0.0%) | 0 (0.0%) |
Disability Class: Ambulatory Difficulty
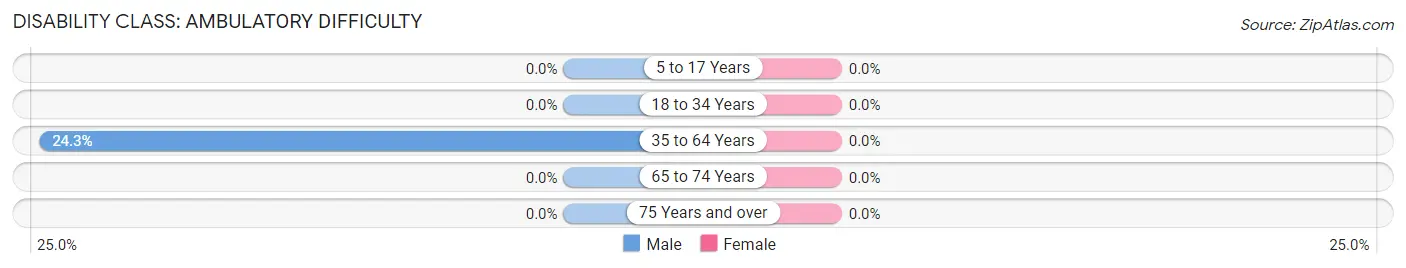
| Age Bracket | Male | Female |
| 5 to 17 Years | 0 (0.0%) | 0 (0.0%) |
| 18 to 34 Years | 0 (0.0%) | 0 (0.0%) |
| 35 to 64 Years | 18 (24.3%) | 0 (0.0%) |
| 65 to 74 Years | 0 (0.0%) | 0 (0.0%) |
| 75 Years and over | 0 (0.0%) | 0 (0.0%) |
Disability Class: Self-Care Difficulty
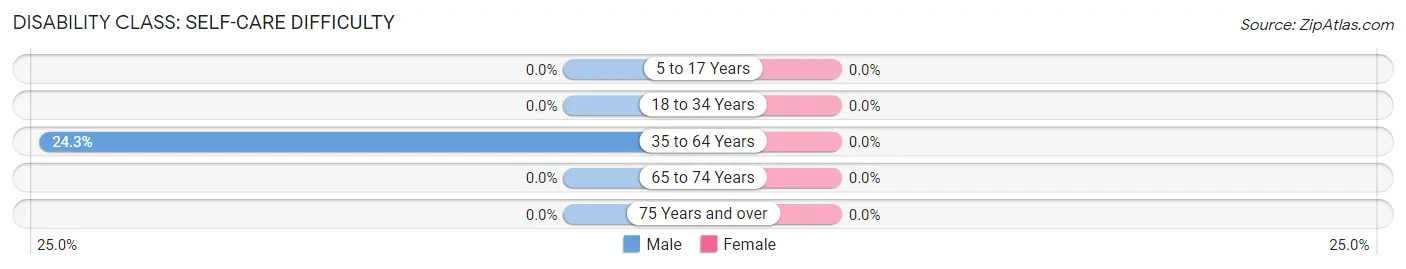
| Age Bracket | Male | Female |
| 5 to 17 Years | 0 (0.0%) | 0 (0.0%) |
| 18 to 34 Years | 0 (0.0%) | 0 (0.0%) |
| 35 to 64 Years | 18 (24.3%) | 0 (0.0%) |
| 65 to 74 Years | 0 (0.0%) | 0 (0.0%) |
| 75 Years and over | 0 (0.0%) | 0 (0.0%) |
Technology Access in Belleview
Computing Device Access in Belleview
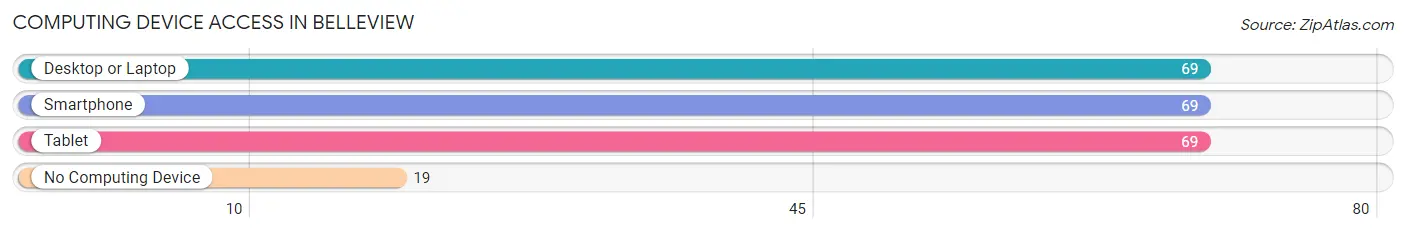
| Device Type | # Households | % Households |
| Desktop or Laptop | 69 | 78.4% |
| Smartphone | 69 | 78.4% |
| Tablet | 69 | 78.4% |
| No Computing Device | 19 | 21.6% |
| Total | 88 | 100.0% |
Internet Access in Belleview
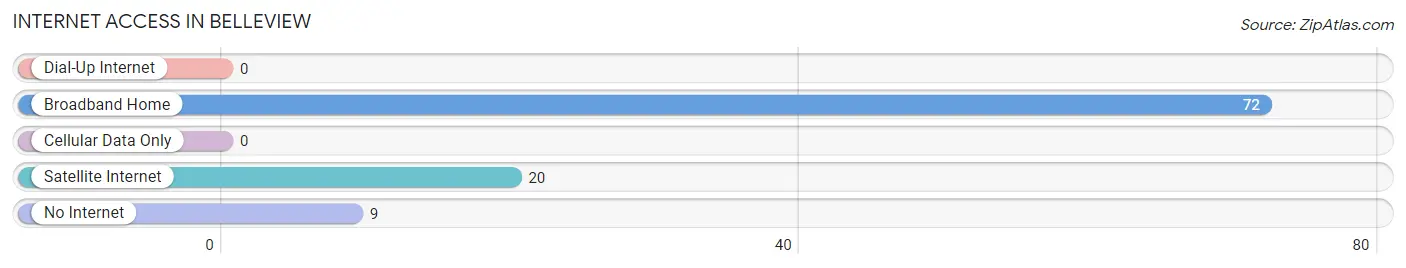
| Internet Type | # Households | % Households |
| Dial-Up Internet | 0 | 0.0% |
| Broadband Home | 72 | 81.8% |
| Cellular Data Only | 0 | 0.0% |
| Satellite Internet | 20 | 22.7% |
| No Internet | 9 | 10.2% |
| Total | 88 | 100.0% |
Belleview Summary
Belleview, Kentucky is a small town located in the western part of the state, in the foothills of the Appalachian Mountains. It is situated in the county of Bell County, and is part of the Middlesboro Micropolitan Statistical Area. The town has a population of approximately 1,000 people, and is known for its rural charm and friendly atmosphere.
History
Belleview was founded in 1883 by a group of settlers from the nearby town of Pineville. The town was named after the nearby Belleview Hotel, which was built in 1882. The hotel was a popular destination for travelers, and the town quickly grew around it. The town was incorporated in 1887, and the first post office was established in 1888.
In the early 1900s, Belleview was a thriving community, with a variety of businesses and services. The town had a bank, a newspaper, a hotel, a general store, a blacksmith, a livery stable, and a variety of other businesses. The town also had a school, which was established in 1891.
In the 1920s, the town began to decline, as the railroad bypassed Belleview and the nearby town of Pineville began to grow. The Great Depression also had a negative impact on the town, and many businesses closed. In the 1940s, the town began to recover, and the population began to grow again.
Geography
Belleview is located in the western part of Bell County, in the foothills of the Appalachian Mountains. The town is situated at an elevation of 1,000 feet, and is surrounded by rolling hills and forests. The town is located near the Cumberland Gap National Historical Park, which is a popular tourist destination.
The town is located along the Cumberland River, and is approximately 25 miles from the Kentucky-Tennessee border. The nearest major cities are Lexington, Kentucky and Knoxville, Tennessee, which are both about two hours away.
Economy
The economy of Belleview is largely based on agriculture and tourism. The town is home to several farms, which produce a variety of crops, including corn, soybeans, and hay. The town is also home to several tourist attractions, including the Cumberland Gap National Historical Park, which attracts visitors from all over the world.
The town also has a variety of small businesses, including restaurants, shops, and other services. The town is also home to a number of manufacturing companies, which produce a variety of products, including furniture, clothing, and automotive parts.
Demographics
As of the 2010 census, the population of Belleview was 1,000 people. The racial makeup of the town was 97.2% White, 0.7% African American, 0.2% Native American, 0.2% Asian, 0.2% from other races, and 1.7% from two or more races. Hispanic or Latino of any race were 0.7% of the population.
The median income for a household in Belleview was $30,000, and the median income for a family was $35,000. The per capita income for the town was $14,000. About 17.5% of the population was below the poverty line.
Common Questions
What is Per Capita Income in Belleview?
Per Capita income in Belleview is $71,263.
What is the Median Family Income in Belleview?
Median Family Income in Belleview is $106,635.
What is Inequality or Gini Index in Belleview?
Inequality or Gini Index in Belleview is 0.63.
What is the Total Population of Belleview?
Total Population of Belleview is 223.
What is the Total Male Population of Belleview?
Total Male Population of Belleview is 107.
What is the Total Female Population of Belleview?
Total Female Population of Belleview is 116.
What is the Ratio of Males per 100 Females in Belleview?
There are 92.24 Males per 100 Females in Belleview.
What is the Ratio of Females per 100 Males in Belleview?
There are 108.41 Females per 100 Males in Belleview.
What is the Median Population Age in Belleview?
Median Population Age in Belleview is 61.0 Years.
What is the Average Family Size in Belleview
Average Family Size in Belleview is 3.0 People.
What is the Average Household Size in Belleview
Average Household Size in Belleview is 2.5 People.
How Large is the Labor Force in Belleview?
There are 80 People in the Labor Forcein in Belleview.
What is the Percentage of People in the Labor Force in Belleview?
43.2% of People are in the Labor Force in Belleview.