Zip Codes with the Highest Percentage of Families with Income Above $100,000 in Owensboro, KY
RELATED REPORTS & OPTIONS
Family Income | $100k+
Owensboro
Compare Zip Codes
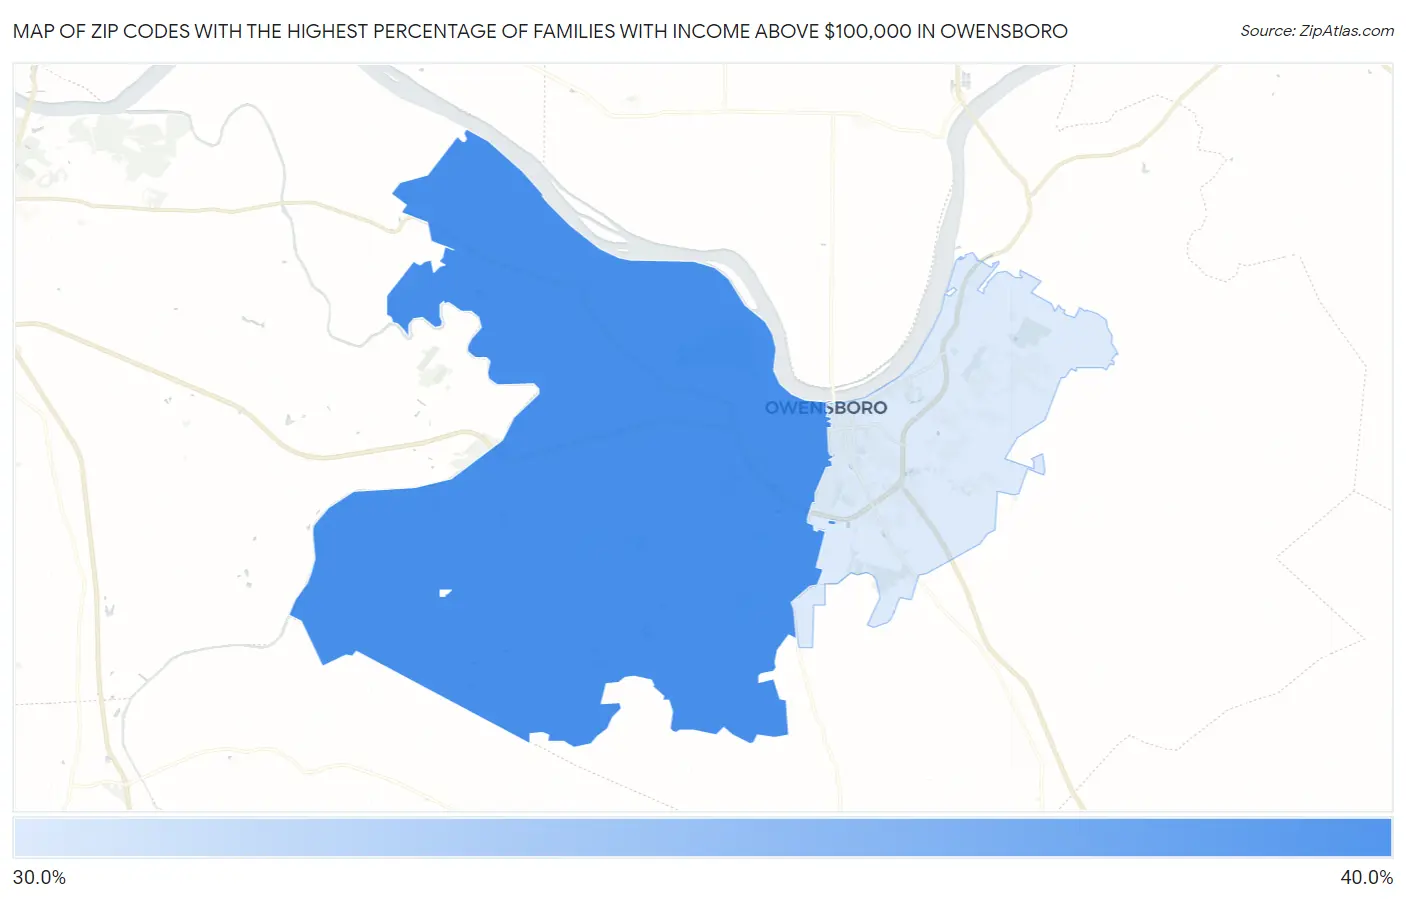
Map of Zip Codes with the Highest Percentage of Families with Income Above $100,000 in Owensboro
36.4%
36.9%
Zip Codes with the Highest Percentage of Families with Income Above $100,000 in Owensboro, KY
| Zip Code | Families with Income > $100k | vs State | vs National | |
| 1. | 42301 | 36.9% | 36.1%(+0.800)#179 | 46.1%(-9.20)#16,568 |
| 2. | 42303 | 36.4% | 36.1%(+0.300)#191 | 46.1%(-9.70)#16,874 |
1
Common Questions
What are the Top Zip Codes with the Highest Percentage of Families with Income Above $100,000 in Owensboro, KY?
Top Zip Codes with the Highest Percentage of Families with Income Above $100,000 in Owensboro, KY are:
What zip code has the Highest Percentage of Families with Income Above $100,000 in Owensboro, KY?
42301 has the Highest Percentage of Families with Income Above $100,000 in Owensboro, KY with 36.9%.
What is the Percentage of Families with Income Above $100,000 in Owensboro, KY?
Percentage of Families with Income Above $100,000 in Owensboro is 32.3%.
What is the Percentage of Families with Income Above $100,000 in Kentucky?
Percentage of Families with Income Above $100,000 in Kentucky is 36.1%.
What is the Percentage of Families with Income Above $100,000 in the United States?
Percentage of Families with Income Above $100,000 in the United States is 46.1%.