Zip Codes with the Highest Percentage of Families with Income Above $100,000 in Newport, KY
RELATED REPORTS & OPTIONS
Family Income | $100k+
Newport
Compare Zip Codes
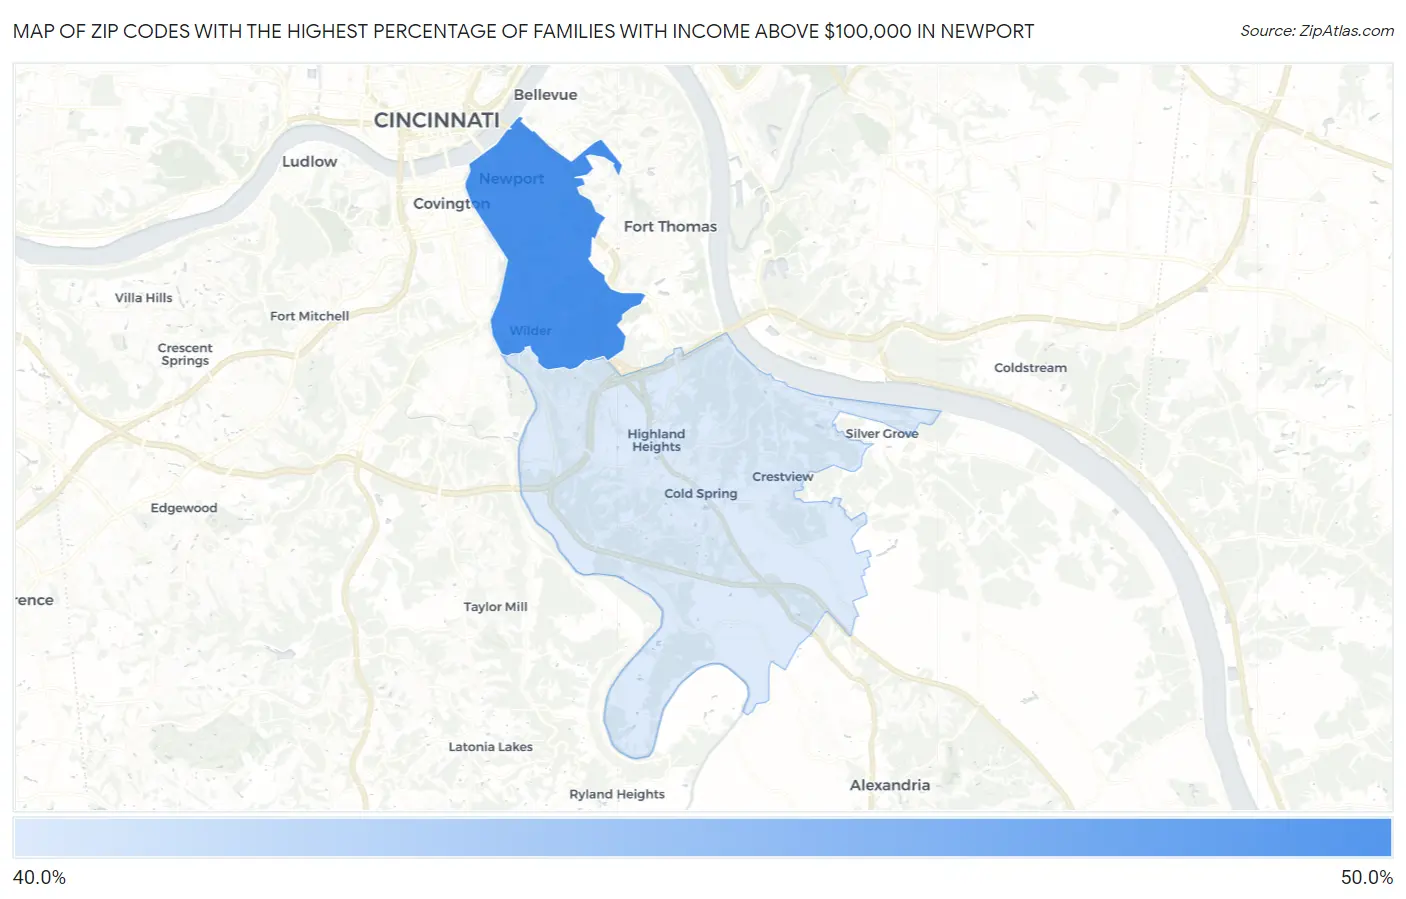
Map of Zip Codes with the Highest Percentage of Families with Income Above $100,000 in Newport
44.3%
44.4%
Zip Codes with the Highest Percentage of Families with Income Above $100,000 in Newport, KY
| Zip Code | Families with Income > $100k | vs State | vs National | |
| 1. | 41071 | 44.4% | 36.1%(+8.30)#108 | 46.1%(-1.70)#11,662 |
| 2. | 41076 | 44.3% | 36.1%(+8.20)#109 | 46.1%(-1.80)#11,759 |
1
Common Questions
What are the Top Zip Codes with the Highest Percentage of Families with Income Above $100,000 in Newport, KY?
Top Zip Codes with the Highest Percentage of Families with Income Above $100,000 in Newport, KY are:
What zip code has the Highest Percentage of Families with Income Above $100,000 in Newport, KY?
41071 has the Highest Percentage of Families with Income Above $100,000 in Newport, KY with 44.4%.
What is the Percentage of Families with Income Above $100,000 in Newport, KY?
Percentage of Families with Income Above $100,000 in Newport is 51.0%.
What is the Percentage of Families with Income Above $100,000 in Kentucky?
Percentage of Families with Income Above $100,000 in Kentucky is 36.1%.
What is the Percentage of Families with Income Above $100,000 in the United States?
Percentage of Families with Income Above $100,000 in the United States is 46.1%.