Hustonville, KY Map & Demographics
Hustonville Map
Hustonville Overview
$25,207
PER CAPITA INCOME
$46,591
AVG FAMILY INCOME
$45,625
AVG HOUSEHOLD INCOME
25.1%
WAGE / INCOME GAP [ % ]
74.9¢/ $1
WAGE / INCOME GAP [ $ ]
0.39
INEQUALITY / GINI INDEX
612
TOTAL POPULATION
284
MALE POPULATION
328
FEMALE POPULATION
86.59
MALES / 100 FEMALES
115.49
FEMALES / 100 MALES
44.5
MEDIAN AGE
2.7
AVG FAMILY SIZE
2.1
AVG HOUSEHOLD SIZE
250
LABOR FORCE [ PEOPLE ]
46.7%
PERCENT IN LABOR FORCE
10.0%
UNEMPLOYMENT RATE
Hustonville Zip Codes
Hustonville Area Codes
Income in Hustonville
Income Overview in Hustonville
Per Capita Income in Hustonville is $25,207, while median incomes of families and households are $46,591 and $45,625 respectively.
| Characteristic | Number | Measure |
| Per Capita Income | 612 | $25,207 |
| Median Family Income | 164 | $46,591 |
| Mean Family Income | 164 | $63,435 |
| Median Household Income | 294 | $45,625 |
| Mean Household Income | 294 | $53,464 |
| Income Deficit | 164 | $0 |
| Wage / Income Gap (%) | 612 | 25.13% |
| Wage / Income Gap ($) | 612 | 74.87¢ per $1 |
| Gini / Inequality Index | 612 | 0.39 |
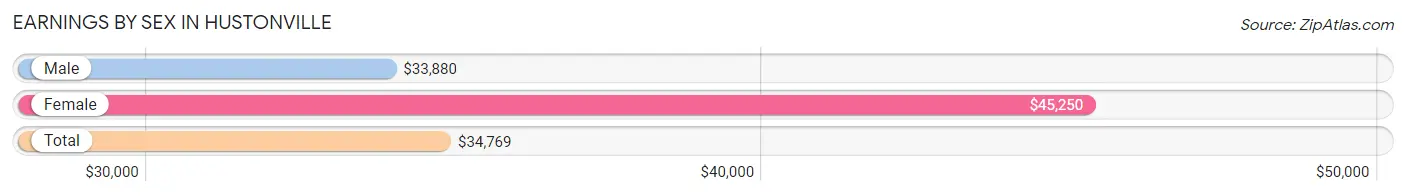
Earnings by Sex in Hustonville
Average Earnings in Hustonville are $34,769, $33,880 for men and $45,250 for women, a difference of 25.1%.
| Sex | Number | Average Earnings |
| Male | 127 (49.6%) | $33,880 |
| Female | 129 (50.4%) | $45,250 |
| Total | 256 (100.0%) | $34,769 |
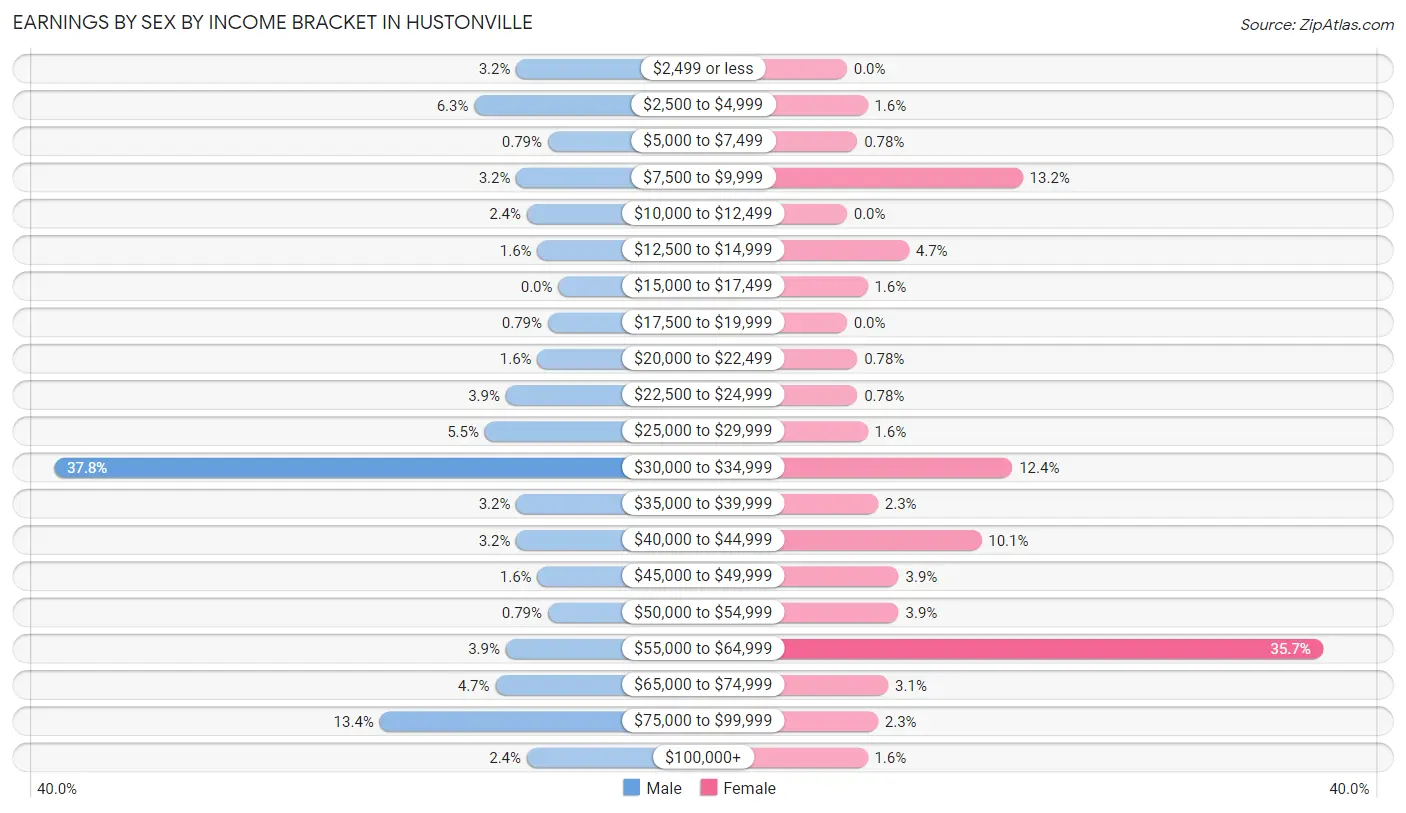
Earnings by Sex by Income Bracket in Hustonville
The most common earnings brackets in Hustonville are $30,000 to $34,999 for men (48 | 37.8%) and $55,000 to $64,999 for women (46 | 35.7%).
| Income | Male | Female |
| $2,499 or less | 4 (3.2%) | 0 (0.0%) |
| $2,500 to $4,999 | 8 (6.3%) | 2 (1.5%) |
| $5,000 to $7,499 | 1 (0.8%) | 1 (0.8%) |
| $7,500 to $9,999 | 4 (3.2%) | 17 (13.2%) |
| $10,000 to $12,499 | 3 (2.4%) | 0 (0.0%) |
| $12,500 to $14,999 | 2 (1.6%) | 6 (4.6%) |
| $15,000 to $17,499 | 0 (0.0%) | 2 (1.5%) |
| $17,500 to $19,999 | 1 (0.8%) | 0 (0.0%) |
| $20,000 to $22,499 | 2 (1.6%) | 1 (0.8%) |
| $22,500 to $24,999 | 5 (3.9%) | 1 (0.8%) |
| $25,000 to $29,999 | 7 (5.5%) | 2 (1.5%) |
| $30,000 to $34,999 | 48 (37.8%) | 16 (12.4%) |
| $35,000 to $39,999 | 4 (3.2%) | 3 (2.3%) |
| $40,000 to $44,999 | 4 (3.2%) | 13 (10.1%) |
| $45,000 to $49,999 | 2 (1.6%) | 5 (3.9%) |
| $50,000 to $54,999 | 1 (0.8%) | 5 (3.9%) |
| $55,000 to $64,999 | 5 (3.9%) | 46 (35.7%) |
| $65,000 to $74,999 | 6 (4.7%) | 4 (3.1%) |
| $75,000 to $99,999 | 17 (13.4%) | 3 (2.3%) |
| $100,000+ | 3 (2.4%) | 2 (1.5%) |
| Total | 127 (100.0%) | 129 (100.0%) |
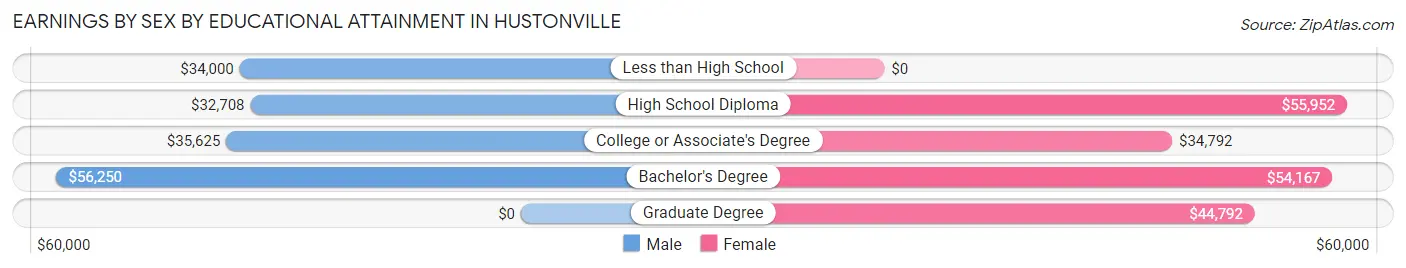
Earnings by Sex by Educational Attainment in Hustonville
Average earnings in Hustonville are $34,089 for men and $55,109 for women, a difference of 38.1%. Men with an educational attainment of bachelor's degree enjoy the highest average annual earnings of $56,250, while those with high school diploma education earn the least with $32,708. Women with an educational attainment of high school diploma earn the most with the average annual earnings of $55,952, while those with college or associate's degree education have the smallest earnings of $34,792.
| Educational Attainment | Male Income | Female Income |
| Less than High School | $34,000 | $0 |
| High School Diploma | $32,708 | $55,952 |
| College or Associate's Degree | $35,625 | $34,792 |
| Bachelor's Degree | $56,250 | $54,167 |
| Graduate Degree | - | - |
| Total | $34,089 | $55,109 |
Family Income in Hustonville
Family Income Brackets in Hustonville
According to the Hustonville family income data, there are 58 families falling into the $25,000 to $34,999 income range, which is the most common income bracket and makes up 35.4% of all families. Conversely, the $150,000 to $199,999 income bracket is the least frequent group with only 1 families (0.6%) belonging to this category.
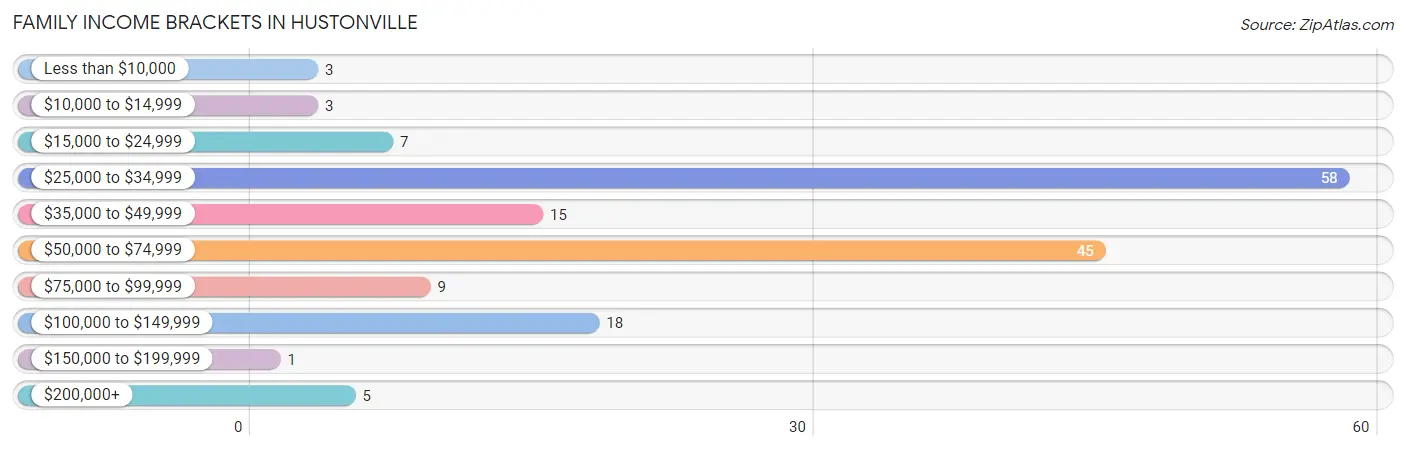
| Income Bracket | # Families | % Families |
| Less than $10,000 | 3 | 1.8% |
| $10,000 to $14,999 | 3 | 1.8% |
| $15,000 to $24,999 | 7 | 4.3% |
| $25,000 to $34,999 | 58 | 35.4% |
| $35,000 to $49,999 | 15 | 9.1% |
| $50,000 to $74,999 | 45 | 27.4% |
| $75,000 to $99,999 | 9 | 5.5% |
| $100,000 to $149,999 | 18 | 11.0% |
| $150,000 to $199,999 | 1 | 0.6% |
| $200,000+ | 5 | 3.0% |
Family Income by Famaliy Size in Hustonville
5-person families (10 | 6.1%) account for the highest median family income in Hustonville with $98,125 per family, while 2-person families (66 | 40.2%) have the highest median income of $28,250 per family member.
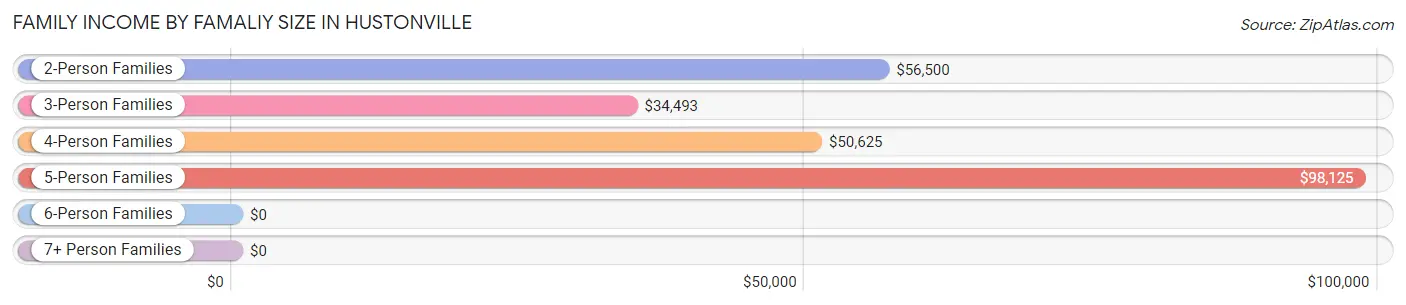
| Income Bracket | # Families | Median Income |
| 2-Person Families | 66 (40.2%) | $56,500 |
| 3-Person Families | 67 (40.8%) | $34,493 |
| 4-Person Families | 15 (9.1%) | $50,625 |
| 5-Person Families | 10 (6.1%) | $98,125 |
| 6-Person Families | 6 (3.7%) | $0 |
| 7+ Person Families | 0 (0.0%) | $0 |
| Total | 164 (100.0%) | $46,591 |
Family Income by Number of Earners in Hustonville
The median family income in Hustonville is $46,591, with families comprising 3+ earners (8) having the highest median family income of $127,500, while families with no earners (35) have the lowest median family income of $27,125, accounting for 4.9% and 21.3% of families, respectively.
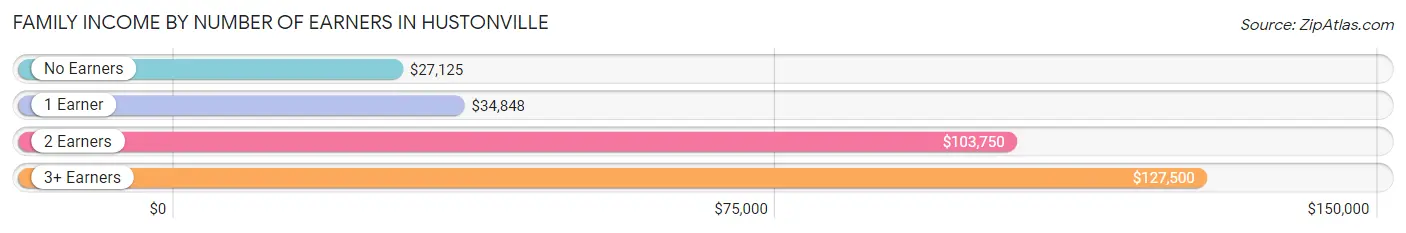
| Number of Earners | # Families | Median Income |
| No Earners | 35 (21.3%) | $27,125 |
| 1 Earner | 89 (54.3%) | $34,848 |
| 2 Earners | 32 (19.5%) | $103,750 |
| 3+ Earners | 8 (4.9%) | $127,500 |
| Total | 164 (100.0%) | $46,591 |
Household Income in Hustonville
Household Income Brackets in Hustonville
With 92 households falling in the category, the $50,000 to $74,999 income range is the most frequent in Hustonville, accounting for 31.3% of all households. In contrast, only 1 households (0.3%) fall into the $150,000 to $199,999 income bracket, making it the least populous group.
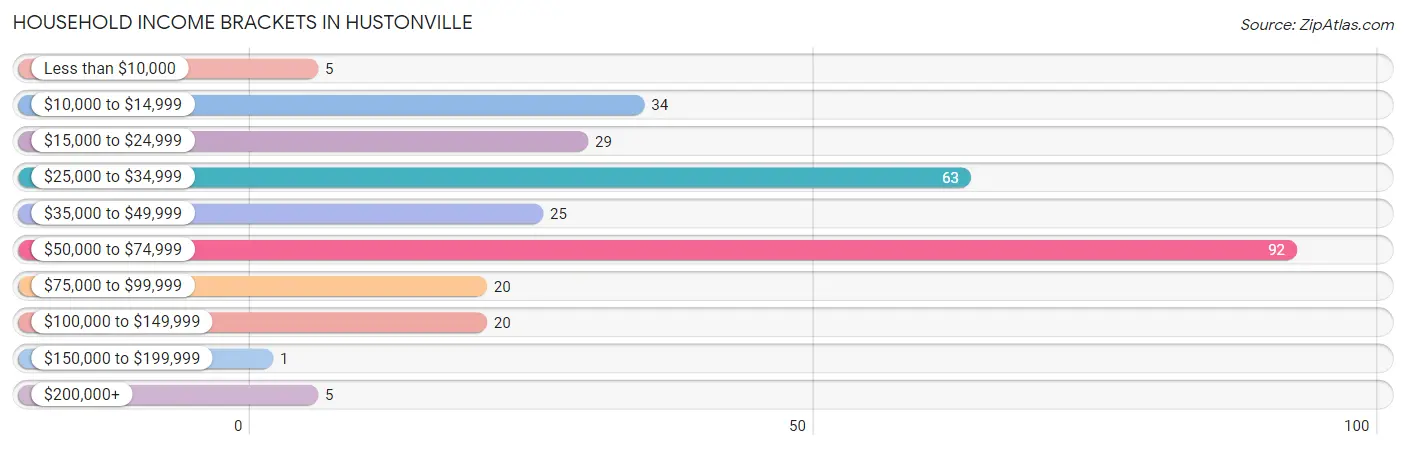
| Income Bracket | # Households | % Households |
| Less than $10,000 | 5 | 1.7% |
| $10,000 to $14,999 | 34 | 11.6% |
| $15,000 to $24,999 | 29 | 9.9% |
| $25,000 to $34,999 | 63 | 21.4% |
| $35,000 to $49,999 | 25 | 8.5% |
| $50,000 to $74,999 | 92 | 31.3% |
| $75,000 to $99,999 | 20 | 6.8% |
| $100,000 to $149,999 | 20 | 6.8% |
| $150,000 to $199,999 | 1 | 0.3% |
| $200,000+ | 5 | 1.7% |
Household Income by Householder Age in Hustonville
The median household income in Hustonville is $45,625, with the highest median household income of $60,313 found in the 45 to 64 years age bracket for the primary householder. A total of 87 households (29.6%) fall into this category. Meanwhile, the 15 to 24 years age bracket for the primary householder has the lowest median household income of $0, with 6 households (2.0%) in this group.
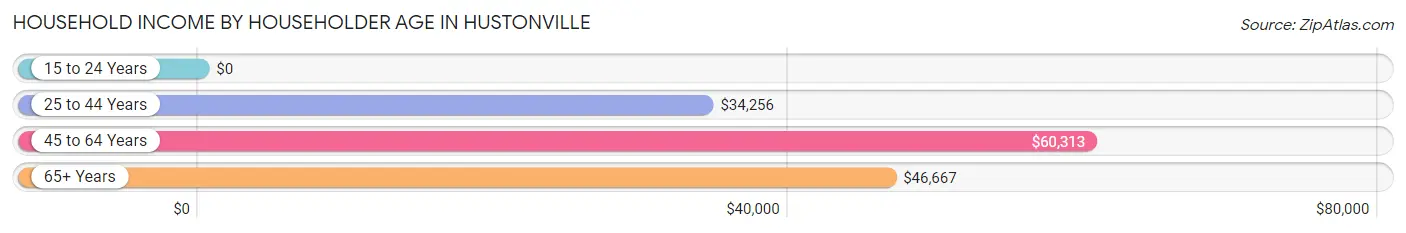
| Income Bracket | # Households | Median Income |
| 15 to 24 Years | 6 (2.0%) | $0 |
| 25 to 44 Years | 75 (25.5%) | $34,256 |
| 45 to 64 Years | 87 (29.6%) | $60,313 |
| 65+ Years | 126 (42.9%) | $46,667 |
| Total | 294 (100.0%) | $45,625 |
Poverty in Hustonville
Income Below Poverty by Sex and Age in Hustonville
With 18.3% poverty level for males and 19.5% for females among the residents of Hustonville, 45 to 54 year old males and under 5 year old females are the most vulnerable to poverty, with 13 males (56.5%) and 7 females (50.0%) in their respective age groups living below the poverty level.
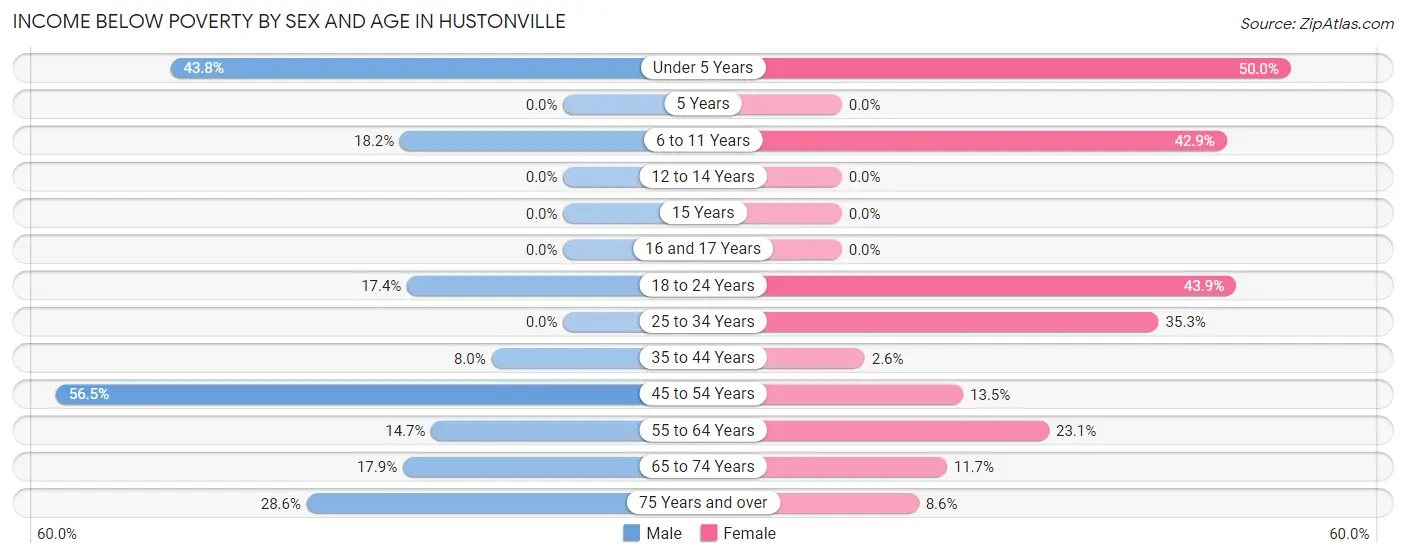
| Age Bracket | Male | Female |
| Under 5 Years | 7 (43.8%) | 7 (50.0%) |
| 5 Years | 0 (0.0%) | 0 (0.0%) |
| 6 to 11 Years | 2 (18.2%) | 6 (42.9%) |
| 12 to 14 Years | 0 (0.0%) | 0 (0.0%) |
| 15 Years | 0 (0.0%) | 0 (0.0%) |
| 16 and 17 Years | 0 (0.0%) | 0 (0.0%) |
| 18 to 24 Years | 12 (17.4%) | 18 (43.9%) |
| 25 to 34 Years | 0 (0.0%) | 6 (35.3%) |
| 35 to 44 Years | 4 (8.0%) | 1 (2.6%) |
| 45 to 54 Years | 13 (56.5%) | 5 (13.5%) |
| 55 to 64 Years | 5 (14.7%) | 9 (23.1%) |
| 65 to 74 Years | 5 (17.9%) | 9 (11.7%) |
| 75 Years and over | 4 (28.6%) | 3 (8.6%) |
| Total | 52 (18.3%) | 64 (19.5%) |
Income Above Poverty by Sex and Age in Hustonville
According to the poverty statistics in Hustonville, males aged 12 to 14 years and females aged 12 to 14 years are the age groups that are most secure financially, with 100.0% of males and 100.0% of females in these age groups living above the poverty line.
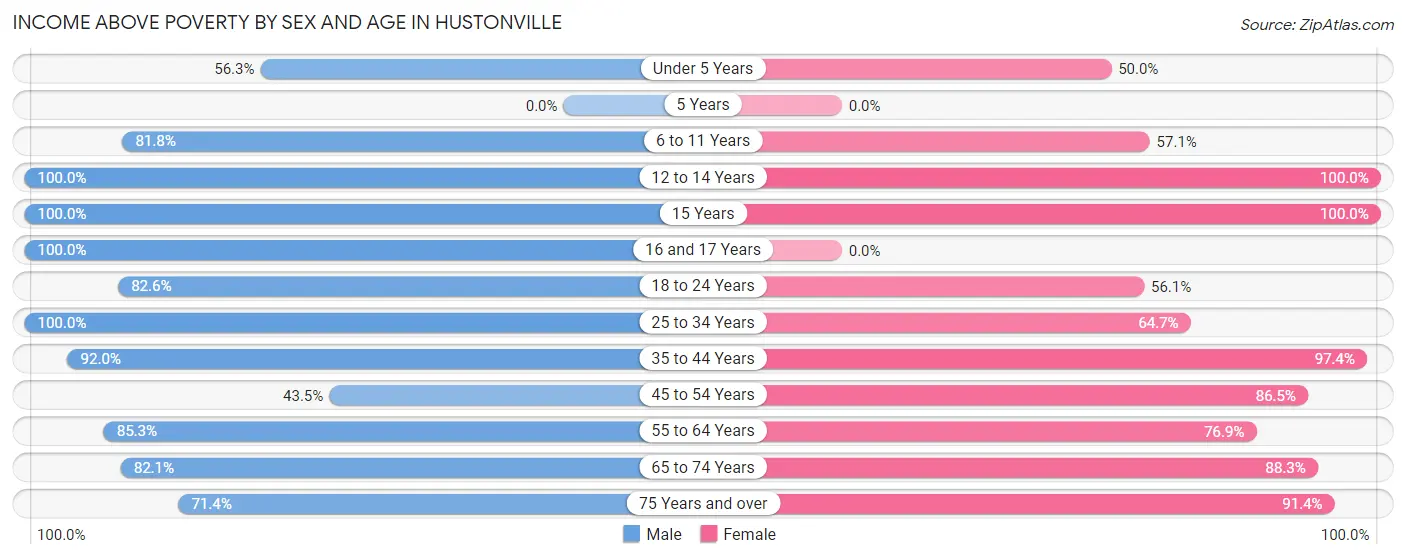
| Age Bracket | Male | Female |
| Under 5 Years | 9 (56.2%) | 7 (50.0%) |
| 5 Years | 0 (0.0%) | 0 (0.0%) |
| 6 to 11 Years | 9 (81.8%) | 8 (57.1%) |
| 12 to 14 Years | 5 (100.0%) | 10 (100.0%) |
| 15 Years | 2 (100.0%) | 5 (100.0%) |
| 16 and 17 Years | 4 (100.0%) | 0 (0.0%) |
| 18 to 24 Years | 57 (82.6%) | 23 (56.1%) |
| 25 to 34 Years | 28 (100.0%) | 11 (64.7%) |
| 35 to 44 Years | 46 (92.0%) | 38 (97.4%) |
| 45 to 54 Years | 10 (43.5%) | 32 (86.5%) |
| 55 to 64 Years | 29 (85.3%) | 30 (76.9%) |
| 65 to 74 Years | 23 (82.1%) | 68 (88.3%) |
| 75 Years and over | 10 (71.4%) | 32 (91.4%) |
| Total | 232 (81.7%) | 264 (80.5%) |
Income Below Poverty Among Married-Couple Families in Hustonville
The poverty statistics for married-couple families in Hustonville show that 3.5% or 4 of the total 116 families live below the poverty line. Families with no children have the highest poverty rate of 4.3%, comprising of 4 families. On the other hand, families with 1 or 2 children have the lowest poverty rate of 0.0%, which includes 0 families.
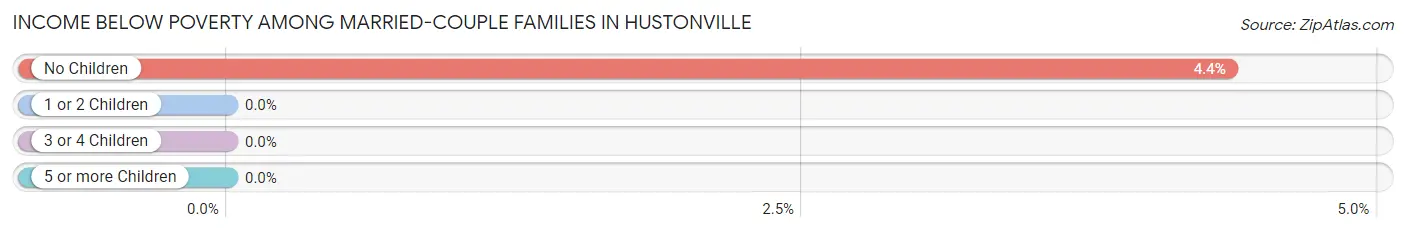
| Children | Above Poverty | Below Poverty |
| No Children | 88 (95.7%) | 4 (4.3%) |
| 1 or 2 Children | 17 (100.0%) | 0 (0.0%) |
| 3 or 4 Children | 7 (100.0%) | 0 (0.0%) |
| 5 or more Children | 0 (0.0%) | 0 (0.0%) |
| Total | 112 (96.6%) | 4 (3.5%) |
Income Below Poverty Among Single-Parent Households in Hustonville
According to the poverty data in Hustonville, 46.2% or 6 single-father households and 14.3% or 5 single-mother households are living below the poverty line. Among single-father households, those with 3 or 4 children have the highest poverty rate, with 6 households (100.0%) experiencing poverty. Likewise, among single-mother households, those with 3 or 4 children have the highest poverty rate, with 2 households (100.0%) falling below the poverty line.
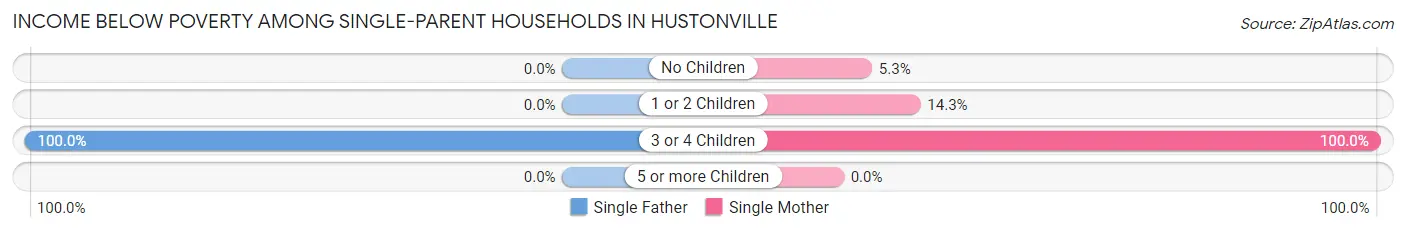
| Children | Single Father | Single Mother |
| No Children | 0 (0.0%) | 1 (5.3%) |
| 1 or 2 Children | 0 (0.0%) | 2 (14.3%) |
| 3 or 4 Children | 6 (100.0%) | 2 (100.0%) |
| 5 or more Children | 0 (0.0%) | 0 (0.0%) |
| Total | 6 (46.2%) | 5 (14.3%) |
Income Below Poverty Among Married-Couple vs Single-Parent Households in Hustonville
The poverty data for Hustonville shows that 4 of the married-couple family households (3.5%) and 11 of the single-parent households (22.9%) are living below the poverty level. Within the married-couple family households, those with no children have the highest poverty rate, with 4 households (4.3%) falling below the poverty line. Among the single-parent households, those with 3 or 4 children have the highest poverty rate, with 8 household (100.0%) living below poverty.
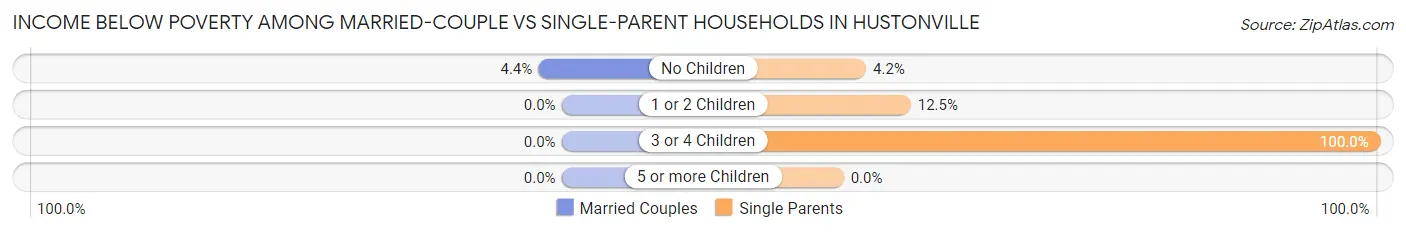
| Children | Married-Couple Families | Single-Parent Households |
| No Children | 4 (4.3%) | 1 (4.2%) |
| 1 or 2 Children | 0 (0.0%) | 2 (12.5%) |
| 3 or 4 Children | 0 (0.0%) | 8 (100.0%) |
| 5 or more Children | 0 (0.0%) | 0 (0.0%) |
| Total | 4 (3.5%) | 11 (22.9%) |
Race in Hustonville
The most populous races in Hustonville are White / Caucasian (553 | 90.4%), Some other Race (42 | 6.9%), and Two or more Races (17 | 2.8%).
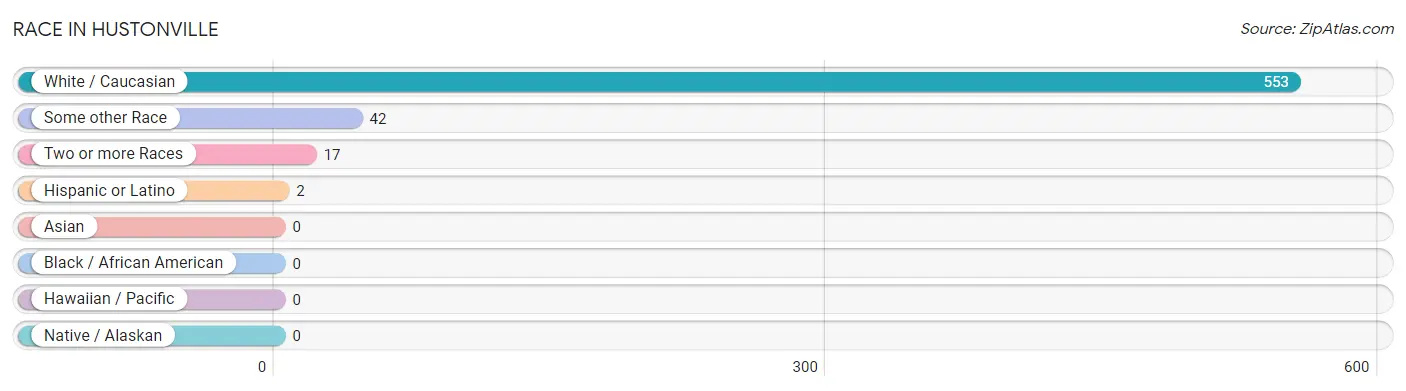
| Race | # Population | % Population |
| Asian | 0 | 0.0% |
| Black / African American | 0 | 0.0% |
| Hawaiian / Pacific | 0 | 0.0% |
| Hispanic or Latino | 2 | 0.3% |
| Native / Alaskan | 0 | 0.0% |
| White / Caucasian | 553 | 90.4% |
| Two or more Races | 17 | 2.8% |
| Some other Race | 42 | 6.9% |
| Total | 612 | 100.0% |
Ancestry in Hustonville
The most populous ancestries reported in Hustonville are American (202 | 33.0%), English (60 | 9.8%), Irish (56 | 9.1%), Scotch-Irish (45 | 7.3%), and German (42 | 6.9%), together accounting for 66.2% of all Hustonville residents.
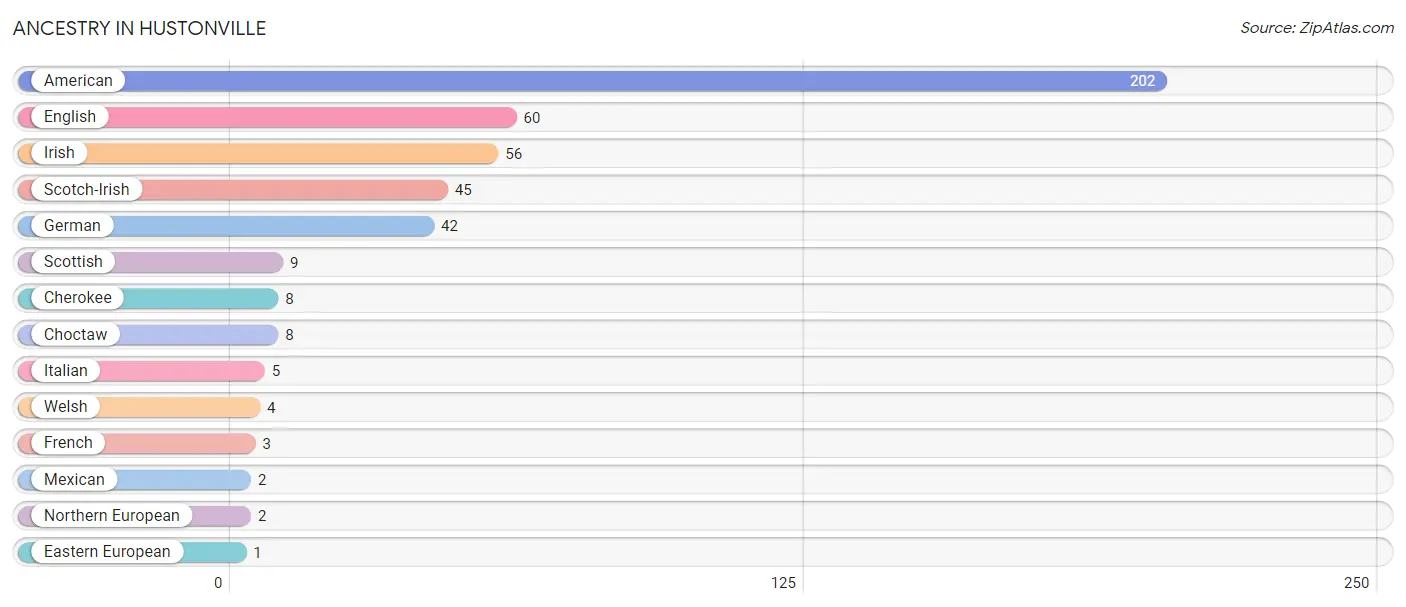
| Ancestry | # Population | % Population |
| American | 202 | 33.0% |
| Cherokee | 8 | 1.3% |
| Choctaw | 8 | 1.3% |
| Eastern European | 1 | 0.2% |
| English | 60 | 9.8% |
| French | 3 | 0.5% |
| German | 42 | 6.9% |
| Irish | 56 | 9.1% |
| Italian | 5 | 0.8% |
| Mexican | 2 | 0.3% |
| Northern European | 2 | 0.3% |
| Scotch-Irish | 45 | 7.3% |
| Scottish | 9 | 1.5% |
| Welsh | 4 | 0.6% | View All 14 Rows |
Immigrants in Hustonville

| Immigration Origin | # Population | % Population | View All 0 Rows |
Sex and Age in Hustonville
Sex and Age in Hustonville
The most populous age groups in Hustonville are 20 to 24 Years (68 | 23.9%) for men and 65 to 69 Years (55 | 16.8%) for women.
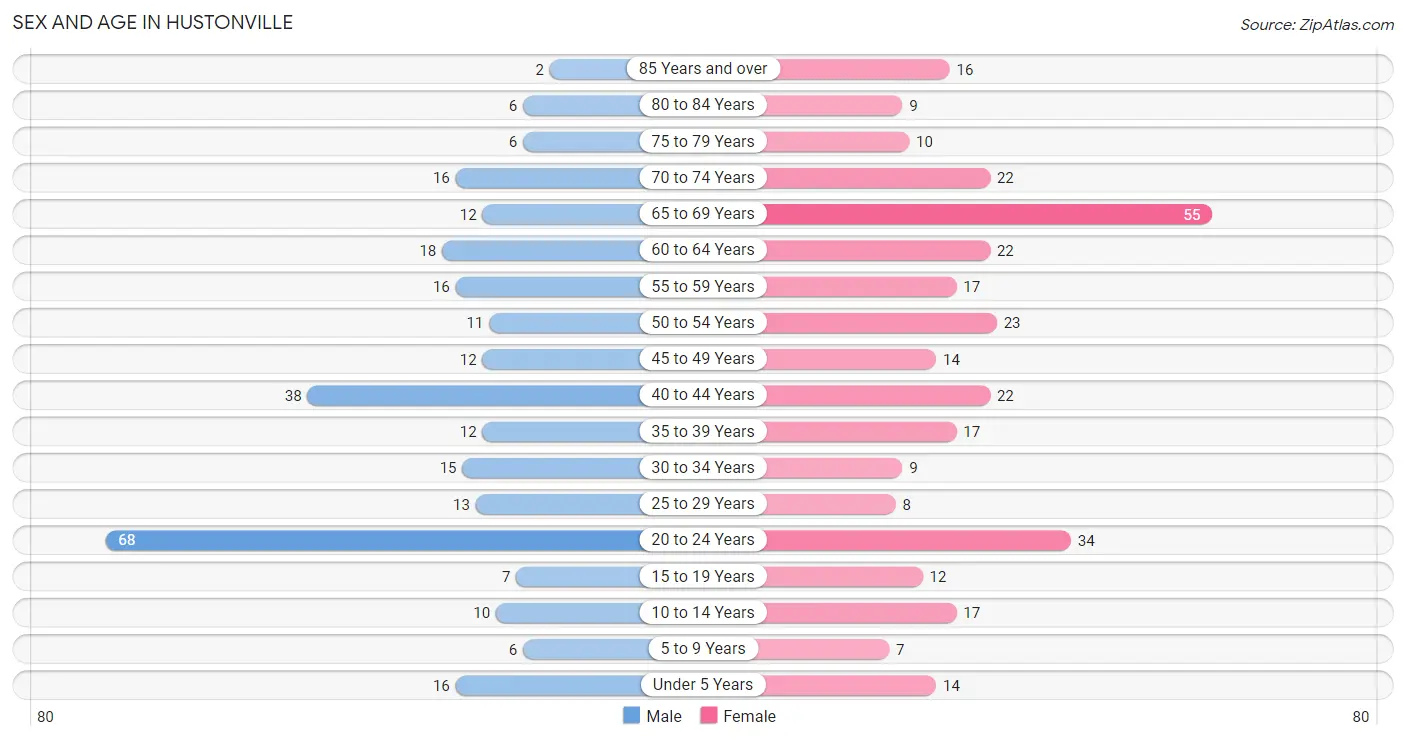
| Age Bracket | Male | Female |
| Under 5 Years | 16 (5.6%) | 14 (4.3%) |
| 5 to 9 Years | 6 (2.1%) | 7 (2.1%) |
| 10 to 14 Years | 10 (3.5%) | 17 (5.2%) |
| 15 to 19 Years | 7 (2.5%) | 12 (3.7%) |
| 20 to 24 Years | 68 (23.9%) | 34 (10.4%) |
| 25 to 29 Years | 13 (4.6%) | 8 (2.4%) |
| 30 to 34 Years | 15 (5.3%) | 9 (2.7%) |
| 35 to 39 Years | 12 (4.2%) | 17 (5.2%) |
| 40 to 44 Years | 38 (13.4%) | 22 (6.7%) |
| 45 to 49 Years | 12 (4.2%) | 14 (4.3%) |
| 50 to 54 Years | 11 (3.9%) | 23 (7.0%) |
| 55 to 59 Years | 16 (5.6%) | 17 (5.2%) |
| 60 to 64 Years | 18 (6.3%) | 22 (6.7%) |
| 65 to 69 Years | 12 (4.2%) | 55 (16.8%) |
| 70 to 74 Years | 16 (5.6%) | 22 (6.7%) |
| 75 to 79 Years | 6 (2.1%) | 10 (3.0%) |
| 80 to 84 Years | 6 (2.1%) | 9 (2.7%) |
| 85 Years and over | 2 (0.7%) | 16 (4.9%) |
| Total | 284 (100.0%) | 328 (100.0%) |
Families and Households in Hustonville
Median Family Size in Hustonville
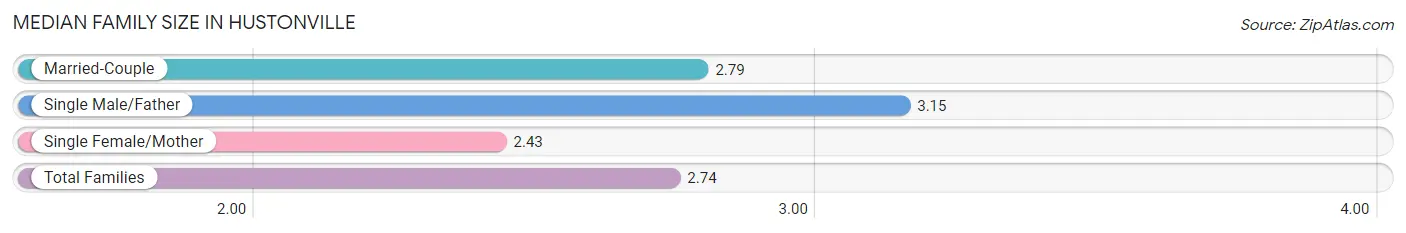
The median family size in Hustonville is 2.74 persons per family, with single male/father families (13 | 7.9%) accounting for the largest median family size of 3.15 persons per family. On the other hand, single female/mother families (35 | 21.3%) represent the smallest median family size with 2.43 persons per family.
| Family Type | # Families | Family Size |
| Married-Couple | 116 (70.7%) | 2.79 |
| Single Male/Father | 13 (7.9%) | 3.15 |
| Single Female/Mother | 35 (21.3%) | 2.43 |
| Total Families | 164 (100.0%) | 2.74 |
Median Household Size in Hustonville
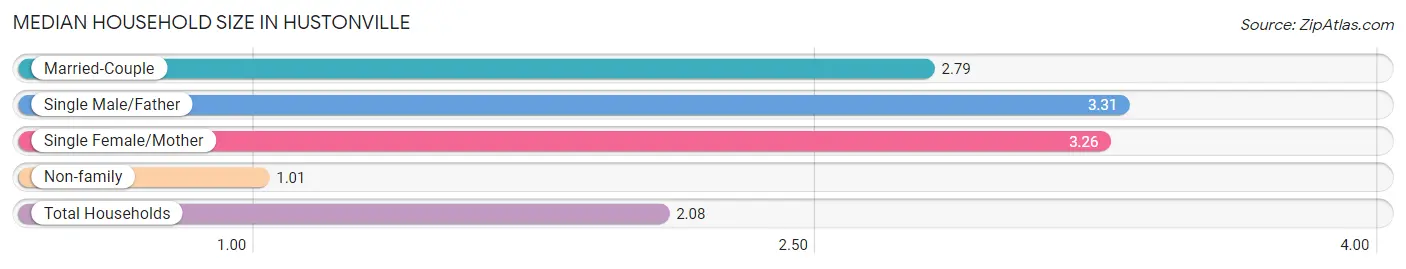
The median household size in Hustonville is 2.08 persons per household, with single male/father households (13 | 4.4%) accounting for the largest median household size of 3.31 persons per household. non-family households (130 | 44.2%) represent the smallest median household size with 1.01 persons per household.
| Household Type | # Households | Household Size |
| Married-Couple | 116 (39.5%) | 2.79 |
| Single Male/Father | 13 (4.4%) | 3.31 |
| Single Female/Mother | 35 (11.9%) | 3.26 |
| Non-family | 130 (44.2%) | 1.01 |
| Total Households | 294 (100.0%) | 2.08 |
Household Size by Marriage Status in Hustonville
Out of a total of 294 households in Hustonville, 164 (55.8%) are family households, while 130 (44.2%) are nonfamily households. The most numerous type of family households are 3-person households, comprising 65, and the most common type of nonfamily households are 1-person households, comprising 128.
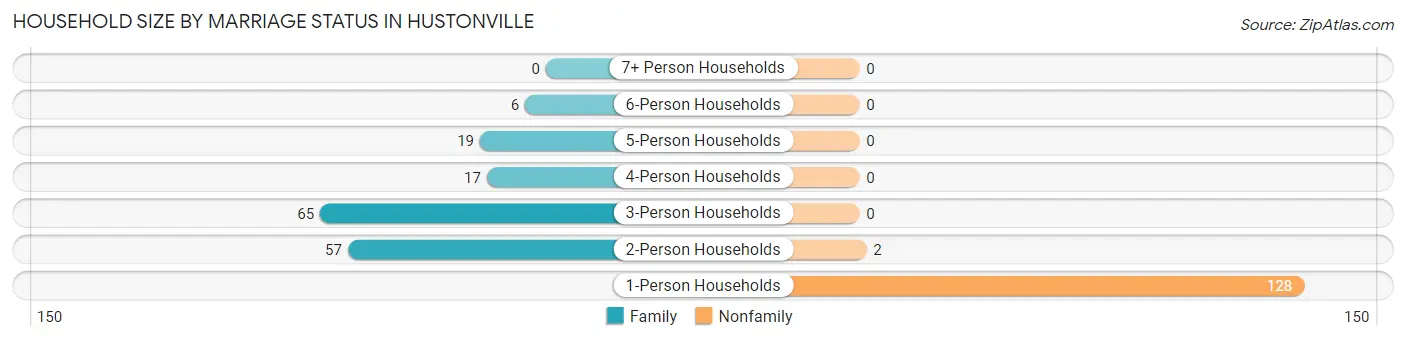
| Household Size | Family Households | Nonfamily Households |
| 1-Person Households | - | 128 (43.5%) |
| 2-Person Households | 57 (19.4%) | 2 (0.7%) |
| 3-Person Households | 65 (22.1%) | 0 (0.0%) |
| 4-Person Households | 17 (5.8%) | 0 (0.0%) |
| 5-Person Households | 19 (6.5%) | 0 (0.0%) |
| 6-Person Households | 6 (2.0%) | 0 (0.0%) |
| 7+ Person Households | 0 (0.0%) | 0 (0.0%) |
| Total | 164 (55.8%) | 130 (44.2%) |
Female Fertility in Hustonville
Fertility by Age in Hustonville
Average fertility rate in Hustonville is 167.0 births per 1,000 women. Women in the age bracket of 35 to 50 years have the highest fertility rate with 290.0 births per 1,000 women. Women in the age bracket of 35 to 50 years acount for 90.9% of all women with births.
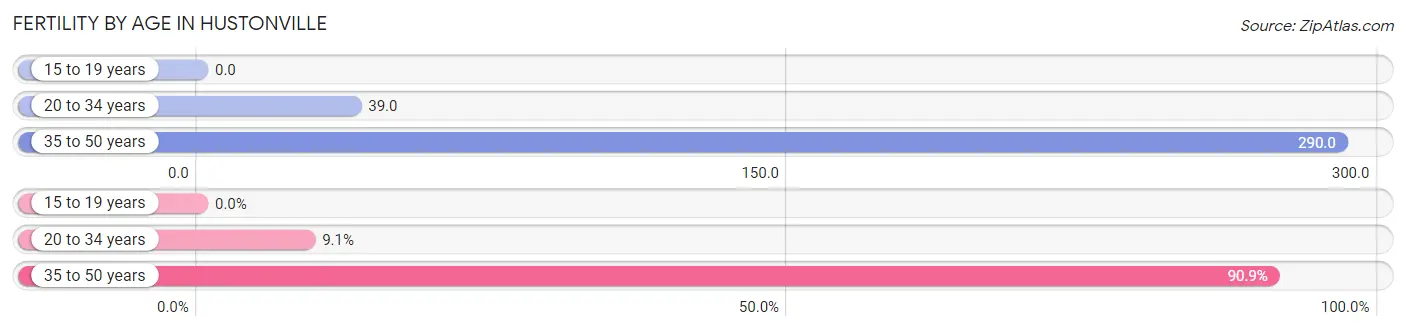
| Age Bracket | Women with Births | Births / 1,000 Women |
| 15 to 19 years | 0 (0.0%) | 0.0 |
| 20 to 34 years | 2 (9.1%) | 39.0 |
| 35 to 50 years | 20 (90.9%) | 290.0 |
| Total | 22 (100.0%) | 167.0 |
Fertility by Age by Marriage Status in Hustonville
90.9% of women with births (22) in Hustonville are married. The highest percentage of unmarried women with births falls into 20 to 34 years age bracket with 100.0% of them unmarried at the time of birth, while the lowest percentage of unmarried women with births belong to 35 to 50 years age bracket with 0.0% of them unmarried.
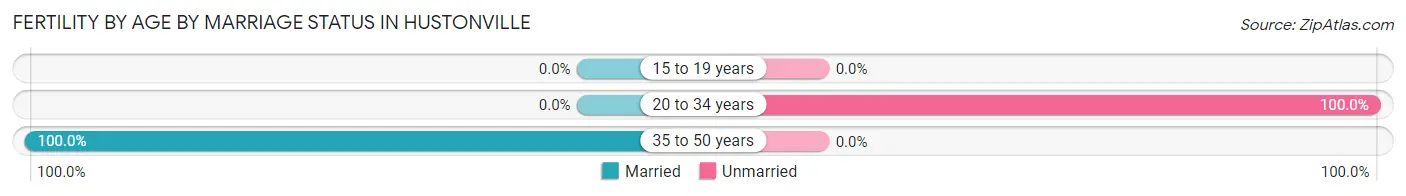
| Age Bracket | Married | Unmarried |
| 15 to 19 years | 0 (0.0%) | 0 (0.0%) |
| 20 to 34 years | 0 (0.0%) | 2 (100.0%) |
| 35 to 50 years | 20 (100.0%) | 0 (0.0%) |
| Total | 20 (90.9%) | 2 (9.1%) |
Fertility by Education in Hustonville
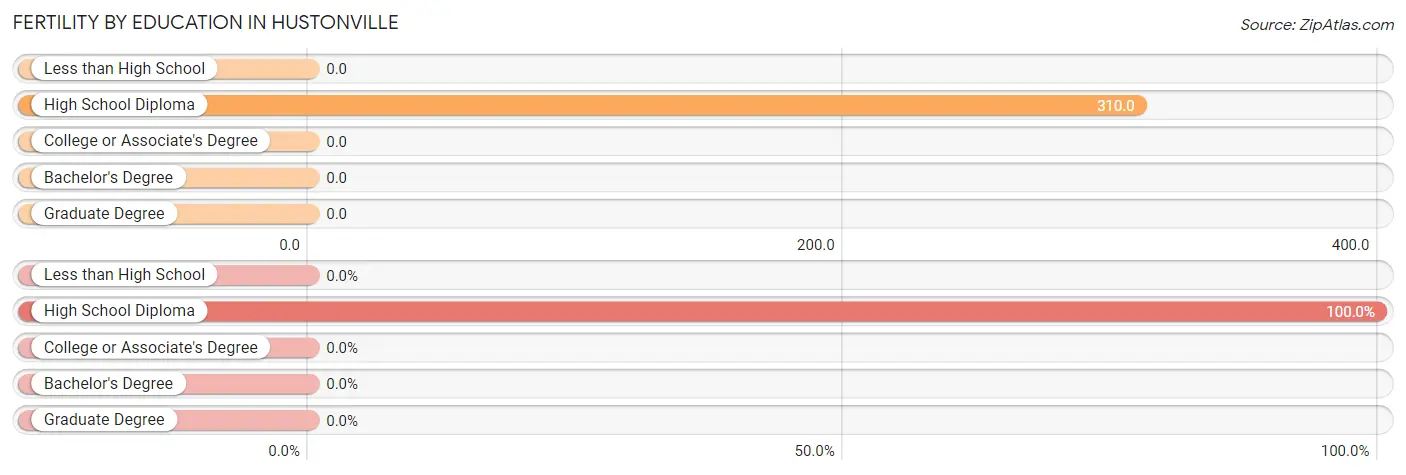
| Educational Attainment | Women with Births | Births / 1,000 Women |
| Less than High School | 0 (0.0%) | 0.0 |
| High School Diploma | 22 (100.0%) | 310.0 |
| College or Associate's Degree | 0 (0.0%) | 0.0 |
| Bachelor's Degree | 0 (0.0%) | 0.0 |
| Graduate Degree | 0 (0.0%) | 0.0 |
| Total | 22 (100.0%) | 167.0 |
Fertility by Education by Marriage Status in Hustonville
9.1% of women with births in Hustonville are unmarried. Women with the educational attainment of high school diploma are most likely to be married with 90.9% of them married at childbirth, while women with the educational attainment of high school diploma are least likely to be married with 9.1% of them unmarried at childbirth.
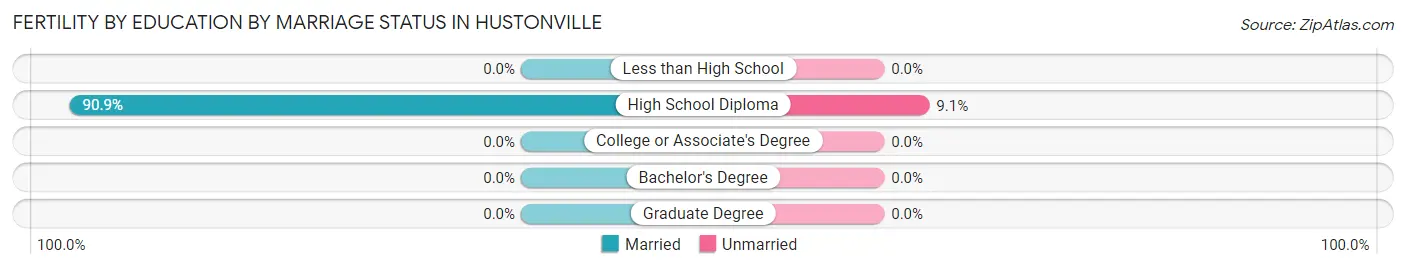
| Educational Attainment | Married | Unmarried |
| Less than High School | 0 (0.0%) | 0 (0.0%) |
| High School Diploma | 20 (90.9%) | 2 (9.1%) |
| College or Associate's Degree | 0 (0.0%) | 0 (0.0%) |
| Bachelor's Degree | 0 (0.0%) | 0 (0.0%) |
| Graduate Degree | 0 (0.0%) | 0 (0.0%) |
| Total | 20 (90.9%) | 2 (9.1%) |
Employment Characteristics in Hustonville
Employment by Class of Employer in Hustonville
Among the 223 employed individuals in Hustonville, private company employees (149 | 66.8%), local government employees (45 | 20.2%), and self-employed (not incorporated) (10 | 4.5%) make up the most common classes of employment.
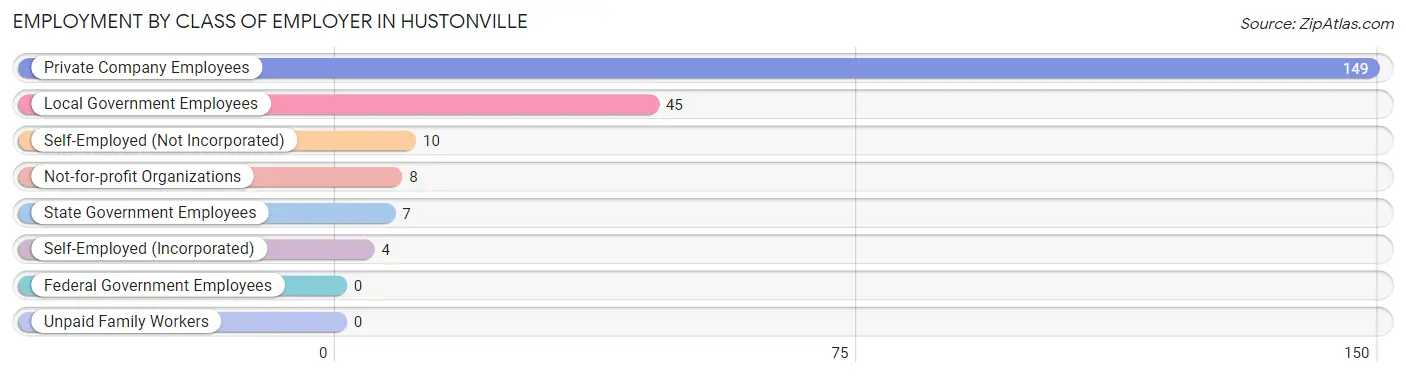
| Employer Class | # Employees | % Employees |
| Private Company Employees | 149 | 66.8% |
| Self-Employed (Incorporated) | 4 | 1.8% |
| Self-Employed (Not Incorporated) | 10 | 4.5% |
| Not-for-profit Organizations | 8 | 3.6% |
| Local Government Employees | 45 | 20.2% |
| State Government Employees | 7 | 3.1% |
| Federal Government Employees | 0 | 0.0% |
| Unpaid Family Workers | 0 | 0.0% |
| Total | 223 | 100.0% |
Employment Status by Age in Hustonville
According to the labor force statistics for Hustonville, out of the total population over 16 years of age (535), 46.7% or 250 individuals are in the labor force, with 10.0% or 25 of them unemployed. The age group with the highest labor force participation rate is 25 to 29 years, with 100.0% or 21 individuals in the labor force. Within the labor force, the 75 years and over age range has the highest percentage of unemployed individuals, with 100.0% or 2 of them being unemployed.
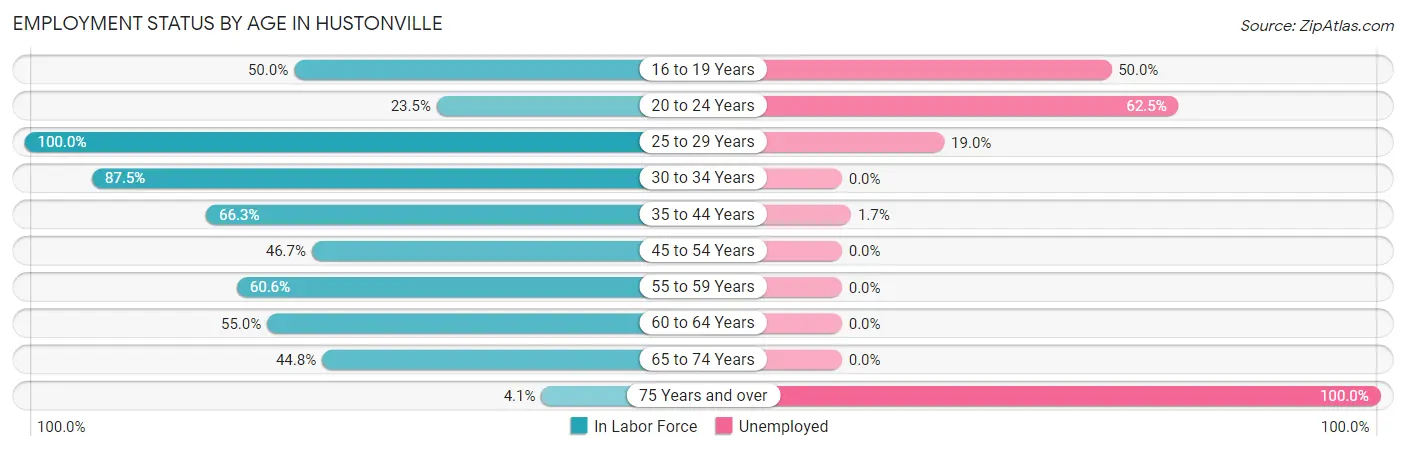
| Age Bracket | In Labor Force | Unemployed |
| 16 to 19 Years | 6 (50.0%) | 3 (50.0%) |
| 20 to 24 Years | 24 (23.5%) | 15 (62.5%) |
| 25 to 29 Years | 21 (100.0%) | 4 (19.0%) |
| 30 to 34 Years | 21 (87.5%) | 0 (0.0%) |
| 35 to 44 Years | 59 (66.3%) | 1 (1.7%) |
| 45 to 54 Years | 28 (46.7%) | 0 (0.0%) |
| 55 to 59 Years | 20 (60.6%) | 0 (0.0%) |
| 60 to 64 Years | 22 (55.0%) | 0 (0.0%) |
| 65 to 74 Years | 47 (44.8%) | 0 (0.0%) |
| 75 Years and over | 2 (4.1%) | 2 (100.0%) |
| Total | 250 (46.7%) | 25 (10.0%) |
Employment Status by Educational Attainment in Hustonville
According to labor force statistics for Hustonville, 64.0% of individuals (171) out of the total population between 25 and 64 years of age (267) are in the labor force, with 2.9% or 5 of them being unemployed. The group with the highest labor force participation rate are those with the educational attainment of bachelor's degree or higher, with 90.0% or 27 individuals in the labor force. Within the labor force, individuals with bachelor's degree or higher education have the highest percentage of unemployment, with 7.4% or 2 of them being unemployed.
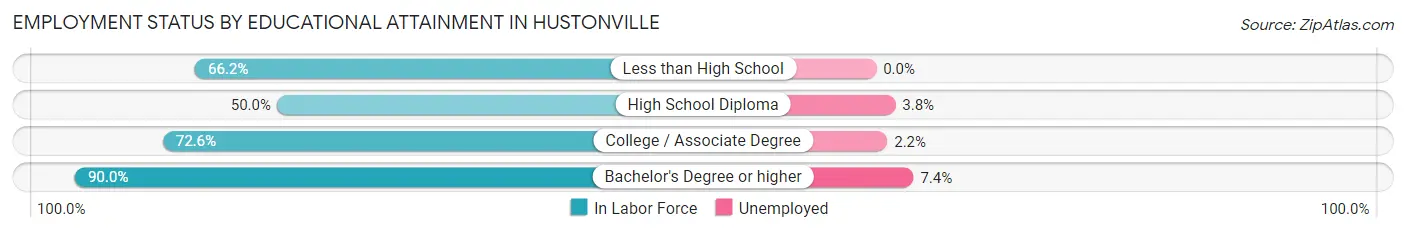
| Educational Attainment | In Labor Force | Unemployed |
| Less than High School | 47 (66.2%) | 0 (0.0%) |
| High School Diploma | 52 (50.0%) | 4 (3.8%) |
| College / Associate Degree | 45 (72.6%) | 1 (2.2%) |
| Bachelor's Degree or higher | 27 (90.0%) | 2 (7.4%) |
| Total | 171 (64.0%) | 8 (2.9%) |
Employment Occupations by Sex in Hustonville
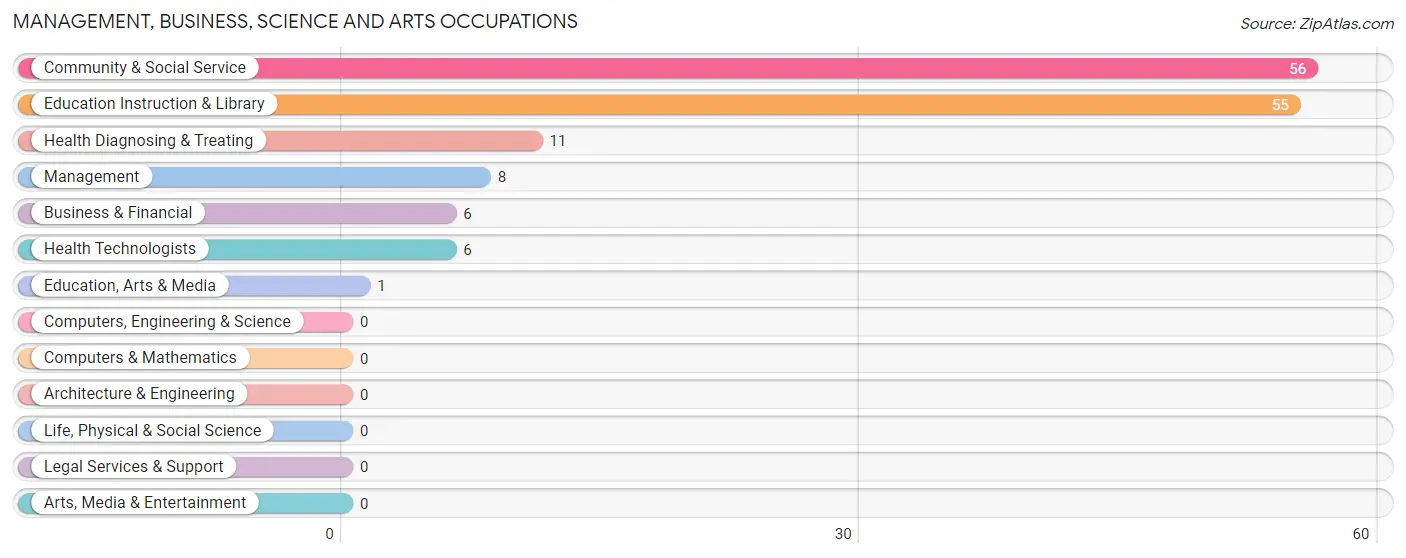
Management, Business, Science and Arts Occupations
The most common Management, Business, Science and Arts occupations in Hustonville are Community & Social Service (56 | 24.9%), Education Instruction & Library (55 | 24.4%), Health Diagnosing & Treating (11 | 4.9%), Management (8 | 3.6%), and Business & Financial (6 | 2.7%).
Management, Business, Science and Arts Occupations by Sex
Within the Management, Business, Science and Arts occupations in Hustonville, the most male-oriented occupations are Education, Arts & Media (100.0%), Management (25.0%), and Health Technologists (16.7%), while the most female-oriented occupations are Business & Financial (100.0%), Education Instruction & Library (92.7%), and Community & Social Service (91.1%).
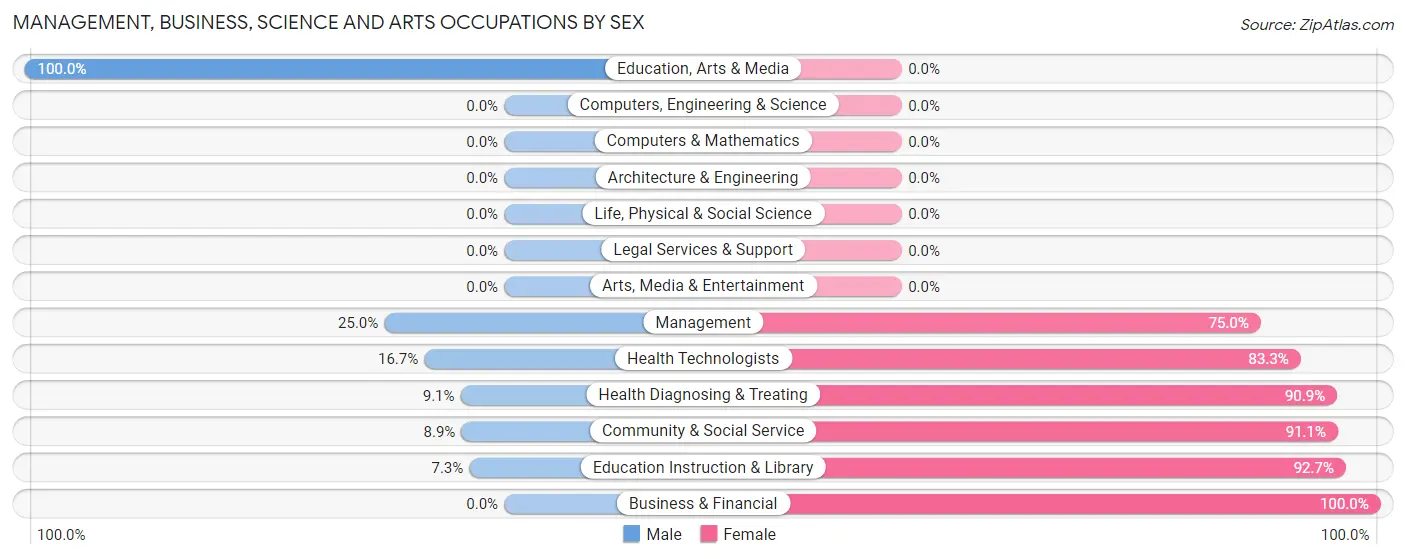
| Occupation | Male | Female |
| Management | 2 (25.0%) | 6 (75.0%) |
| Business & Financial | 0 (0.0%) | 6 (100.0%) |
| Computers, Engineering & Science | 0 (0.0%) | 0 (0.0%) |
| Computers & Mathematics | 0 (0.0%) | 0 (0.0%) |
| Architecture & Engineering | 0 (0.0%) | 0 (0.0%) |
| Life, Physical & Social Science | 0 (0.0%) | 0 (0.0%) |
| Community & Social Service | 5 (8.9%) | 51 (91.1%) |
| Education, Arts & Media | 1 (100.0%) | 0 (0.0%) |
| Legal Services & Support | 0 (0.0%) | 0 (0.0%) |
| Education Instruction & Library | 4 (7.3%) | 51 (92.7%) |
| Arts, Media & Entertainment | 0 (0.0%) | 0 (0.0%) |
| Health Diagnosing & Treating | 1 (9.1%) | 10 (90.9%) |
| Health Technologists | 1 (16.7%) | 5 (83.3%) |
| Total (Category) | 8 (9.9%) | 73 (90.1%) |
| Total (Overall) | 116 (51.6%) | 109 (48.4%) |
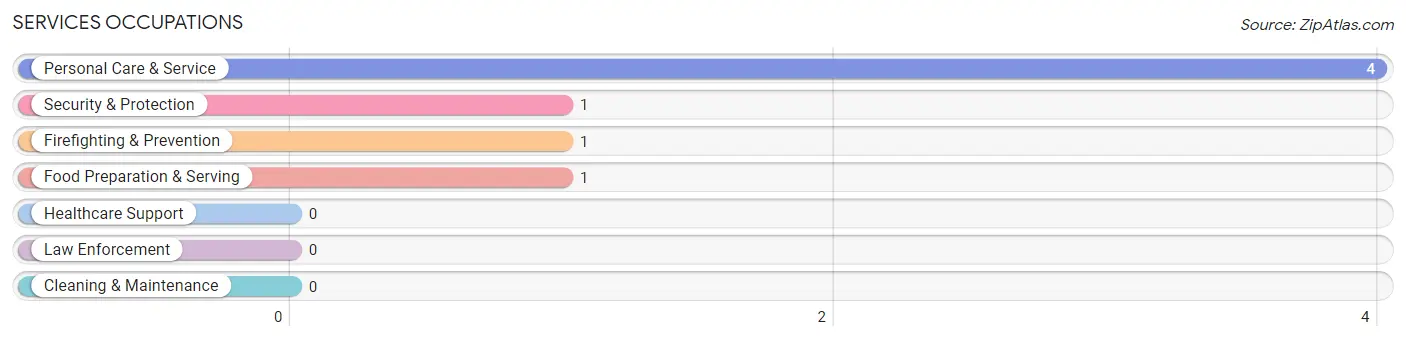
Services Occupations
The most common Services occupations in Hustonville are Personal Care & Service (4 | 1.8%), Security & Protection (1 | 0.4%), Firefighting & Prevention (1 | 0.4%), and Food Preparation & Serving (1 | 0.4%).
Services Occupations by Sex
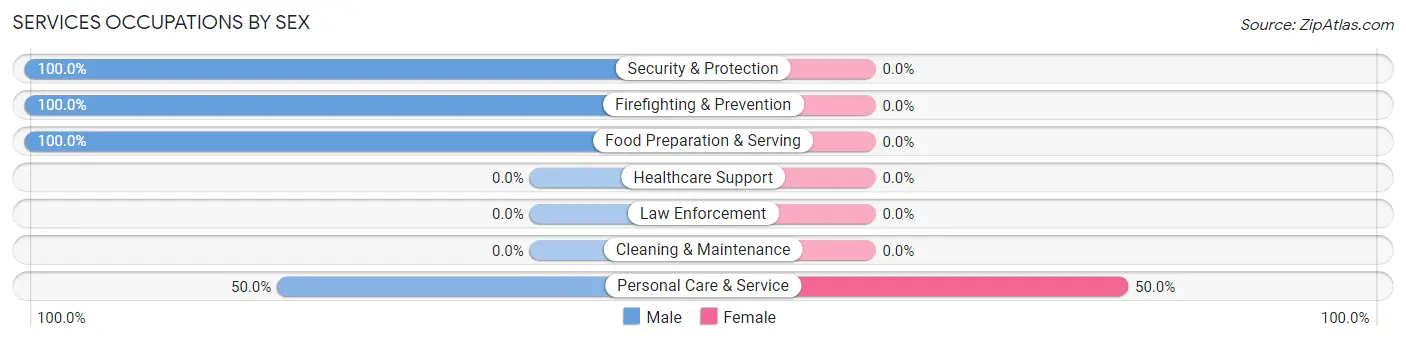
| Occupation | Male | Female |
| Healthcare Support | 0 (0.0%) | 0 (0.0%) |
| Security & Protection | 1 (100.0%) | 0 (0.0%) |
| Firefighting & Prevention | 1 (100.0%) | 0 (0.0%) |
| Law Enforcement | 0 (0.0%) | 0 (0.0%) |
| Food Preparation & Serving | 1 (100.0%) | 0 (0.0%) |
| Cleaning & Maintenance | 0 (0.0%) | 0 (0.0%) |
| Personal Care & Service | 2 (50.0%) | 2 (50.0%) |
| Total (Category) | 4 (66.7%) | 2 (33.3%) |
| Total (Overall) | 116 (51.6%) | 109 (48.4%) |
Sales and Office Occupations
The most common Sales and Office occupations in Hustonville are Office & Administration (19 | 8.4%), and Sales & Related (10 | 4.4%).

Sales and Office Occupations by Sex

| Occupation | Male | Female |
| Sales & Related | 8 (80.0%) | 2 (20.0%) |
| Office & Administration | 5 (26.3%) | 14 (73.7%) |
| Total (Category) | 13 (44.8%) | 16 (55.2%) |
| Total (Overall) | 116 (51.6%) | 109 (48.4%) |
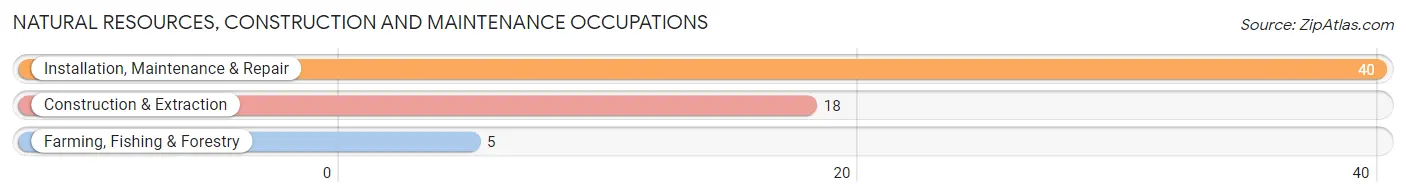
Natural Resources, Construction and Maintenance Occupations
The most common Natural Resources, Construction and Maintenance occupations in Hustonville are Installation, Maintenance & Repair (40 | 17.8%), Construction & Extraction (18 | 8.0%), and Farming, Fishing & Forestry (5 | 2.2%).
Natural Resources, Construction and Maintenance Occupations by Sex
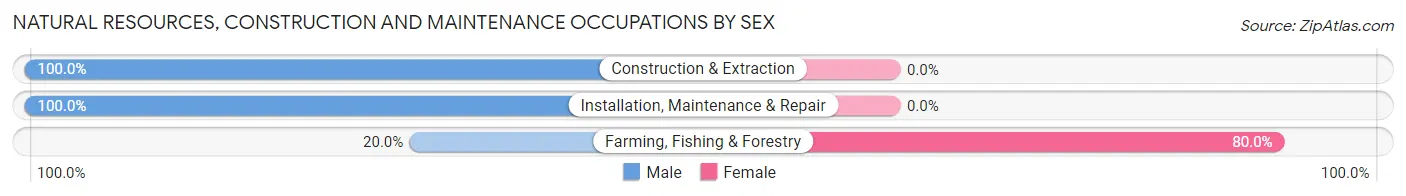
| Occupation | Male | Female |
| Farming, Fishing & Forestry | 1 (20.0%) | 4 (80.0%) |
| Construction & Extraction | 18 (100.0%) | 0 (0.0%) |
| Installation, Maintenance & Repair | 40 (100.0%) | 0 (0.0%) |
| Total (Category) | 59 (93.6%) | 4 (6.4%) |
| Total (Overall) | 116 (51.6%) | 109 (48.4%) |
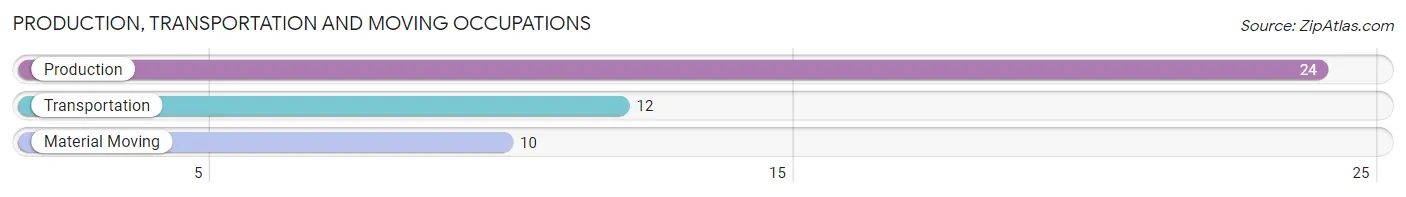
Production, Transportation and Moving Occupations
The most common Production, Transportation and Moving occupations in Hustonville are Production (24 | 10.7%), Transportation (12 | 5.3%), and Material Moving (10 | 4.4%).
Production, Transportation and Moving Occupations by Sex
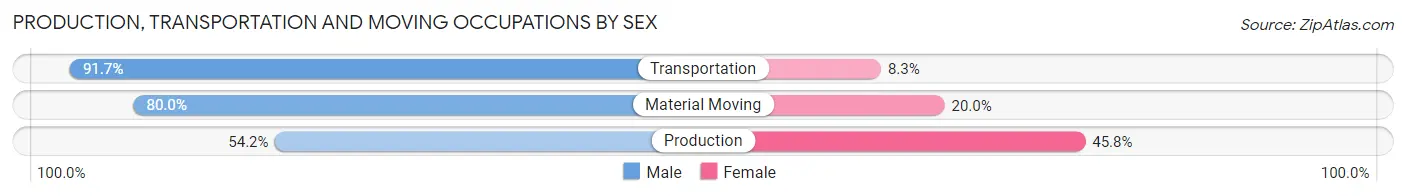
| Occupation | Male | Female |
| Production | 13 (54.2%) | 11 (45.8%) |
| Transportation | 11 (91.7%) | 1 (8.3%) |
| Material Moving | 8 (80.0%) | 2 (20.0%) |
| Total (Category) | 32 (69.6%) | 14 (30.4%) |
| Total (Overall) | 116 (51.6%) | 109 (48.4%) |
Employment Industries by Sex in Hustonville
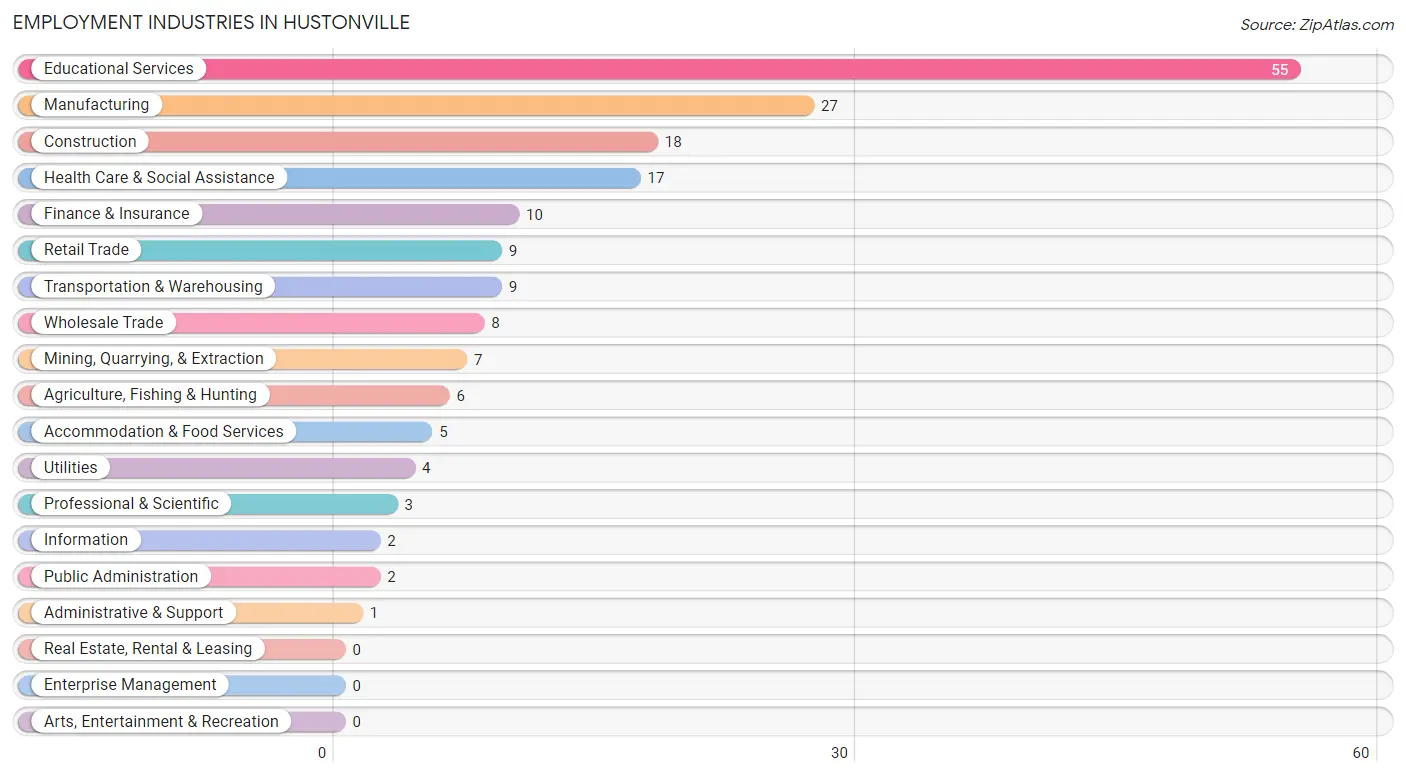
Employment Industries in Hustonville
The major employment industries in Hustonville include Educational Services (55 | 24.4%), Manufacturing (27 | 12.0%), Construction (18 | 8.0%), Health Care & Social Assistance (17 | 7.6%), and Finance & Insurance (10 | 4.4%).
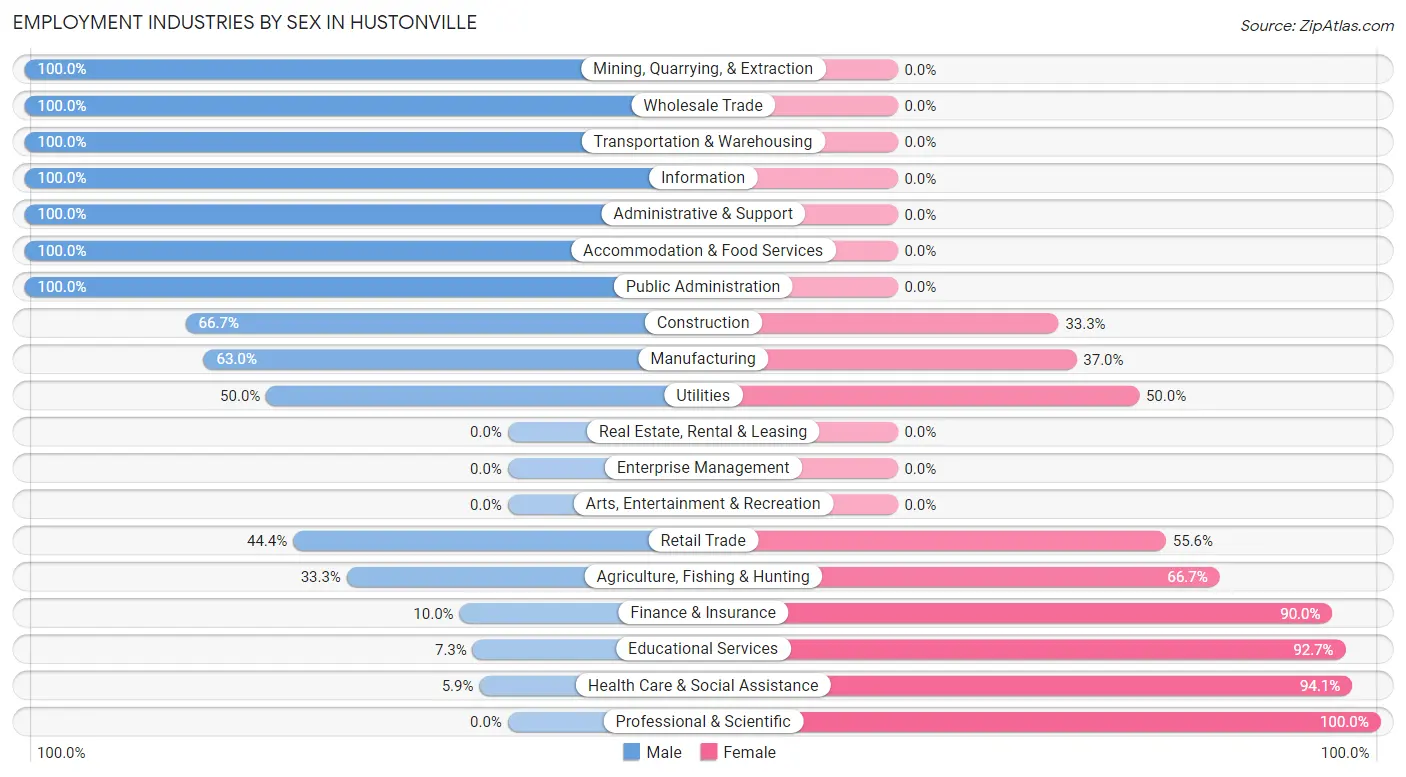
Employment Industries by Sex in Hustonville
The Hustonville industries that see more men than women are Mining, Quarrying, & Extraction (100.0%), Wholesale Trade (100.0%), and Transportation & Warehousing (100.0%), whereas the industries that tend to have a higher number of women are Professional & Scientific (100.0%), Health Care & Social Assistance (94.1%), and Educational Services (92.7%).
| Industry | Male | Female |
| Agriculture, Fishing & Hunting | 2 (33.3%) | 4 (66.7%) |
| Mining, Quarrying, & Extraction | 7 (100.0%) | 0 (0.0%) |
| Construction | 12 (66.7%) | 6 (33.3%) |
| Manufacturing | 17 (63.0%) | 10 (37.0%) |
| Wholesale Trade | 8 (100.0%) | 0 (0.0%) |
| Retail Trade | 4 (44.4%) | 5 (55.6%) |
| Transportation & Warehousing | 9 (100.0%) | 0 (0.0%) |
| Utilities | 2 (50.0%) | 2 (50.0%) |
| Information | 2 (100.0%) | 0 (0.0%) |
| Finance & Insurance | 1 (10.0%) | 9 (90.0%) |
| Real Estate, Rental & Leasing | 0 (0.0%) | 0 (0.0%) |
| Professional & Scientific | 0 (0.0%) | 3 (100.0%) |
| Enterprise Management | 0 (0.0%) | 0 (0.0%) |
| Administrative & Support | 1 (100.0%) | 0 (0.0%) |
| Educational Services | 4 (7.3%) | 51 (92.7%) |
| Health Care & Social Assistance | 1 (5.9%) | 16 (94.1%) |
| Arts, Entertainment & Recreation | 0 (0.0%) | 0 (0.0%) |
| Accommodation & Food Services | 5 (100.0%) | 0 (0.0%) |
| Public Administration | 2 (100.0%) | 0 (0.0%) |
| Total | 116 (51.6%) | 109 (48.4%) |
Education in Hustonville
School Enrollment in Hustonville
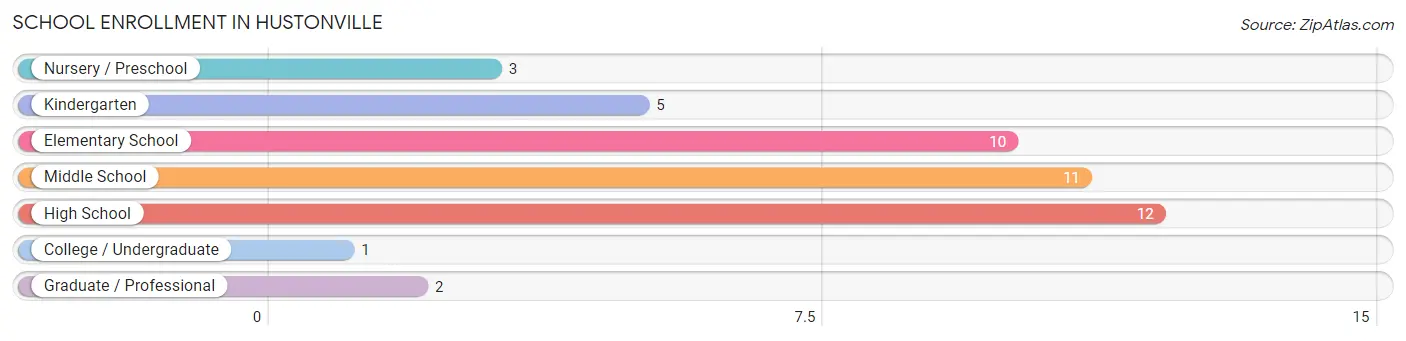
The most common levels of schooling among the 44 students in Hustonville are high school (12 | 27.3%), middle school (11 | 25.0%), and elementary school (10 | 22.7%).
| School Level | # Students | % Students |
| Nursery / Preschool | 3 | 6.8% |
| Kindergarten | 5 | 11.4% |
| Elementary School | 10 | 22.7% |
| Middle School | 11 | 25.0% |
| High School | 12 | 27.3% |
| College / Undergraduate | 1 | 2.3% |
| Graduate / Professional | 2 | 4.5% |
| Total | 44 | 100.0% |
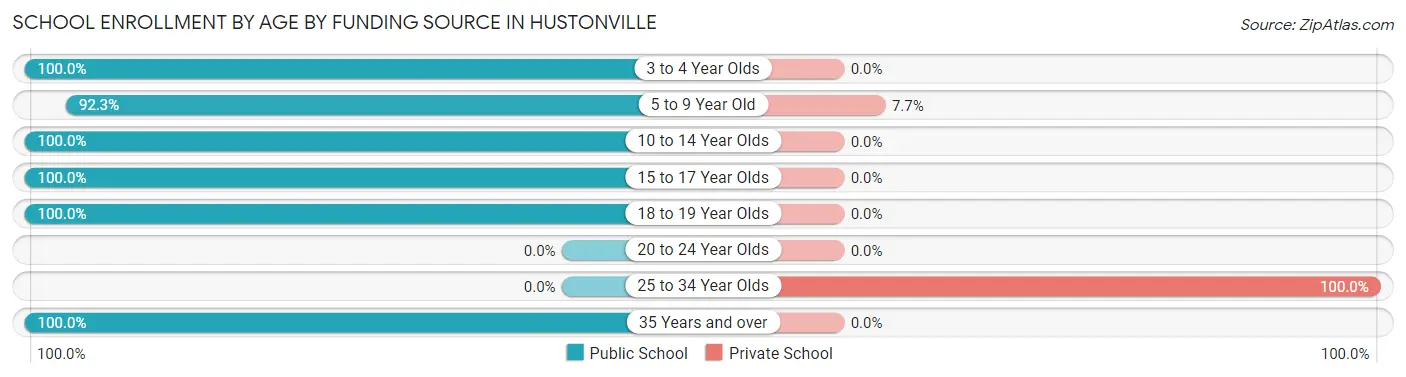
School Enrollment by Age by Funding Source in Hustonville
Out of a total of 44 students who are enrolled in schools in Hustonville, 3 (6.8%) attend a private institution, while the remaining 41 (93.2%) are enrolled in public schools. The age group of 25 to 34 year olds has the highest likelihood of being enrolled in private schools, with 2 (100.0% in the age bracket) enrolled. Conversely, the age group of 3 to 4 year olds has the lowest likelihood of being enrolled in a private school, with 3 (100.0% in the age bracket) attending a public institution.
| Age Bracket | Public School | Private School |
| 3 to 4 Year Olds | 3 (100.0%) | 0 (0.0%) |
| 5 to 9 Year Old | 12 (92.3%) | 1 (7.7%) |
| 10 to 14 Year Olds | 16 (100.0%) | 0 (0.0%) |
| 15 to 17 Year Olds | 6 (100.0%) | 0 (0.0%) |
| 18 to 19 Year Olds | 3 (100.0%) | 0 (0.0%) |
| 20 to 24 Year Olds | 0 (0.0%) | 0 (0.0%) |
| 25 to 34 Year Olds | 0 (0.0%) | 2 (100.0%) |
| 35 Years and over | 1 (100.0%) | 0 (0.0%) |
| Total | 41 (93.2%) | 3 (6.8%) |
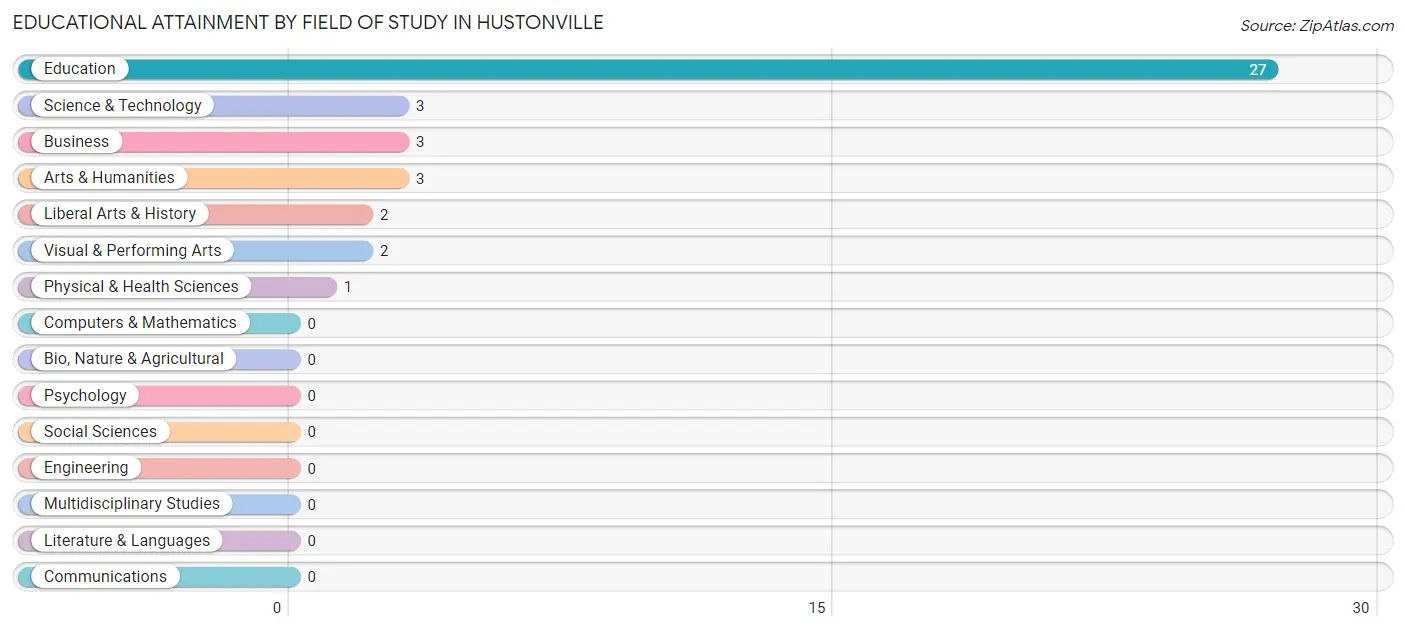
Educational Attainment by Field of Study in Hustonville
Education (27 | 65.8%), science & technology (3 | 7.3%), business (3 | 7.3%), arts & humanities (3 | 7.3%), and liberal arts & history (2 | 4.9%) are the most common fields of study among 41 individuals in Hustonville who have obtained a bachelor's degree or higher.
| Field of Study | # Graduates | % Graduates |
| Computers & Mathematics | 0 | 0.0% |
| Bio, Nature & Agricultural | 0 | 0.0% |
| Physical & Health Sciences | 1 | 2.4% |
| Psychology | 0 | 0.0% |
| Social Sciences | 0 | 0.0% |
| Engineering | 0 | 0.0% |
| Multidisciplinary Studies | 0 | 0.0% |
| Science & Technology | 3 | 7.3% |
| Business | 3 | 7.3% |
| Education | 27 | 65.8% |
| Literature & Languages | 0 | 0.0% |
| Liberal Arts & History | 2 | 4.9% |
| Visual & Performing Arts | 2 | 4.9% |
| Communications | 0 | 0.0% |
| Arts & Humanities | 3 | 7.3% |
| Total | 41 | 100.0% |
Transportation & Commute in Hustonville
Vehicle Availability by Sex in Hustonville
The most prevalent vehicle ownership categories in Hustonville are males with 5 or more vehicles (38, accounting for 33.3%) and females with 5 or more vehicles (2, making up 34.9%).
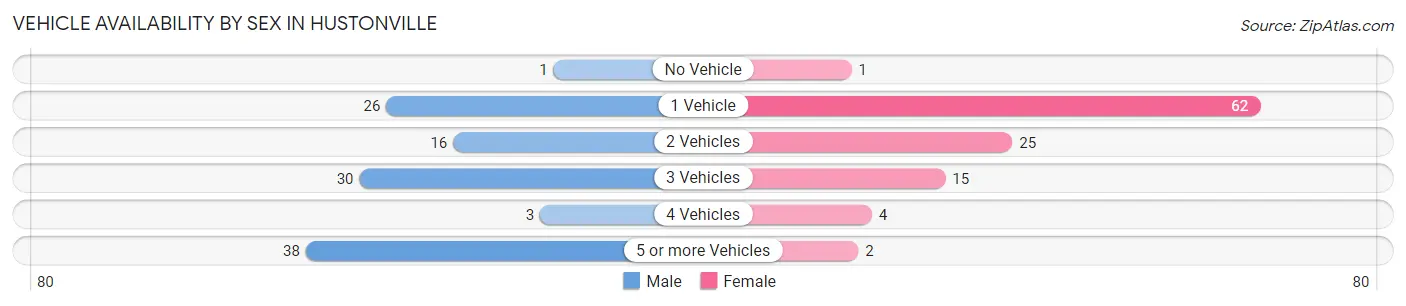
| Vehicles Available | Male | Female |
| No Vehicle | 1 (0.9%) | 1 (0.9%) |
| 1 Vehicle | 26 (22.8%) | 62 (56.9%) |
| 2 Vehicles | 16 (14.0%) | 25 (22.9%) |
| 3 Vehicles | 30 (26.3%) | 15 (13.8%) |
| 4 Vehicles | 3 (2.6%) | 4 (3.7%) |
| 5 or more Vehicles | 38 (33.3%) | 2 (1.8%) |
| Total | 114 (100.0%) | 109 (100.0%) |
Commute Time in Hustonville
The most frequently occuring commute durations in Hustonville are 15 to 19 minutes (42 commuters, 20.3%), 90 or more minutes (42 commuters, 20.3%), and 20 to 24 minutes (29 commuters, 14.0%).
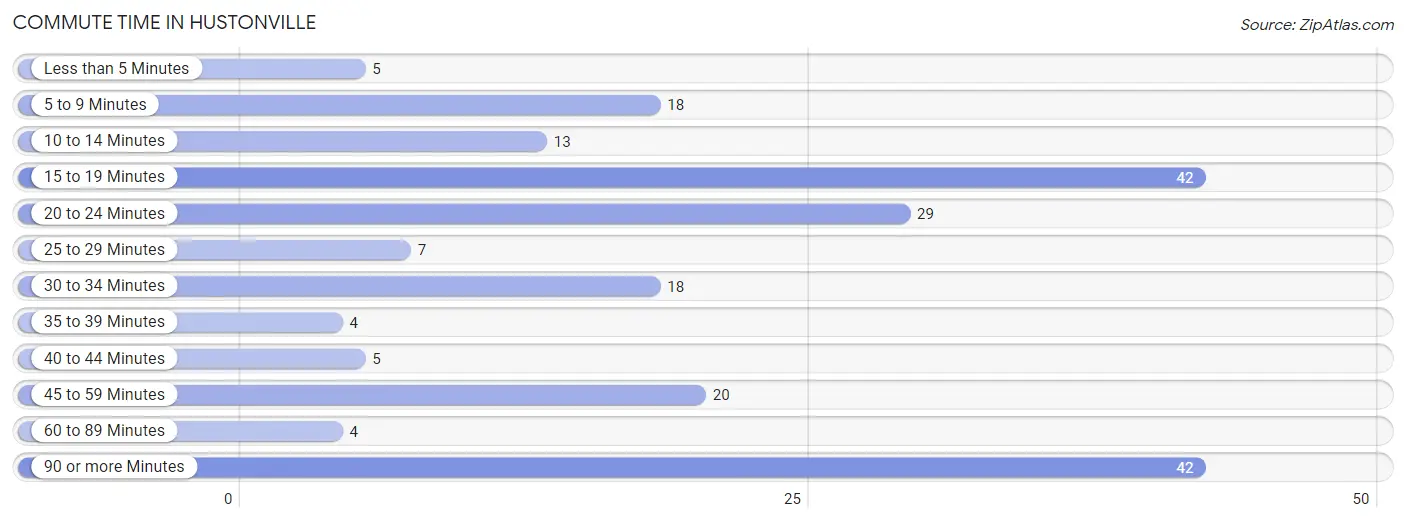
| Commute Time | # Commuters | % Commuters |
| Less than 5 Minutes | 5 | 2.4% |
| 5 to 9 Minutes | 18 | 8.7% |
| 10 to 14 Minutes | 13 | 6.3% |
| 15 to 19 Minutes | 42 | 20.3% |
| 20 to 24 Minutes | 29 | 14.0% |
| 25 to 29 Minutes | 7 | 3.4% |
| 30 to 34 Minutes | 18 | 8.7% |
| 35 to 39 Minutes | 4 | 1.9% |
| 40 to 44 Minutes | 5 | 2.4% |
| 45 to 59 Minutes | 20 | 9.7% |
| 60 to 89 Minutes | 4 | 1.9% |
| 90 or more Minutes | 42 | 20.3% |
Commute Time by Sex in Hustonville
The most common commute times in Hustonville are 15 to 19 minutes (37 commuters, 33.0%) for males and 90 or more minutes (42 commuters, 44.2%) for females.
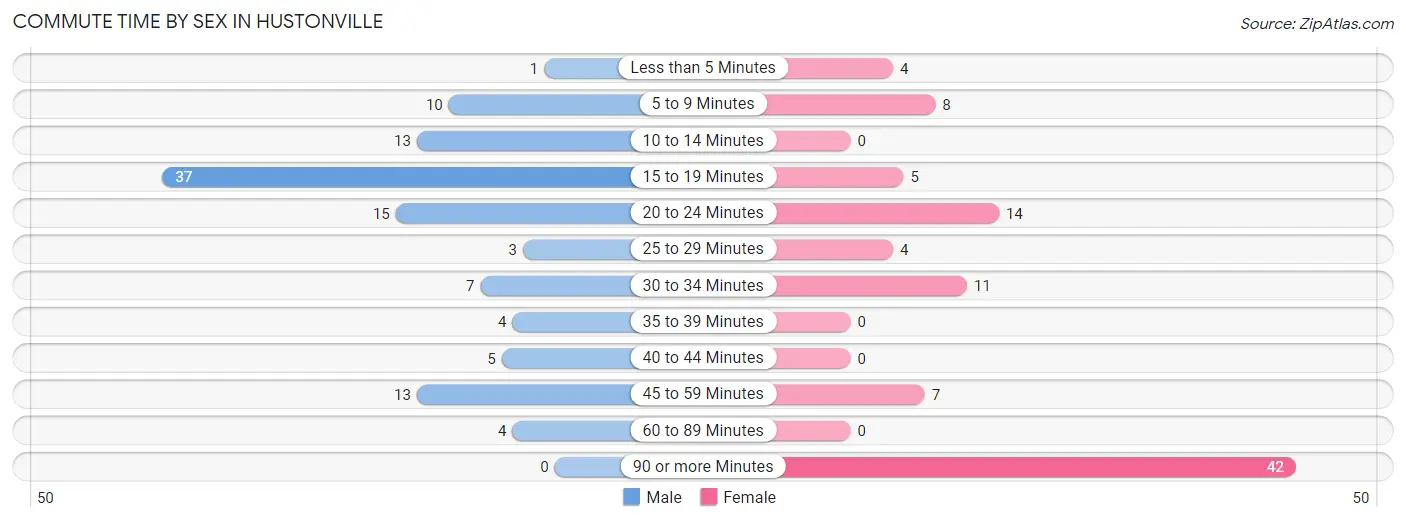
| Commute Time | Male | Female |
| Less than 5 Minutes | 1 (0.9%) | 4 (4.2%) |
| 5 to 9 Minutes | 10 (8.9%) | 8 (8.4%) |
| 10 to 14 Minutes | 13 (11.6%) | 0 (0.0%) |
| 15 to 19 Minutes | 37 (33.0%) | 5 (5.3%) |
| 20 to 24 Minutes | 15 (13.4%) | 14 (14.7%) |
| 25 to 29 Minutes | 3 (2.7%) | 4 (4.2%) |
| 30 to 34 Minutes | 7 (6.2%) | 11 (11.6%) |
| 35 to 39 Minutes | 4 (3.6%) | 0 (0.0%) |
| 40 to 44 Minutes | 5 (4.5%) | 0 (0.0%) |
| 45 to 59 Minutes | 13 (11.6%) | 7 (7.4%) |
| 60 to 89 Minutes | 4 (3.6%) | 0 (0.0%) |
| 90 or more Minutes | 0 (0.0%) | 42 (44.2%) |
Time of Departure to Work by Sex in Hustonville
The most frequent times of departure to work in Hustonville are 6:00 AM to 6:29 AM (62, 55.4%) for males and 7:30 AM to 7:59 AM (51, 53.7%) for females.
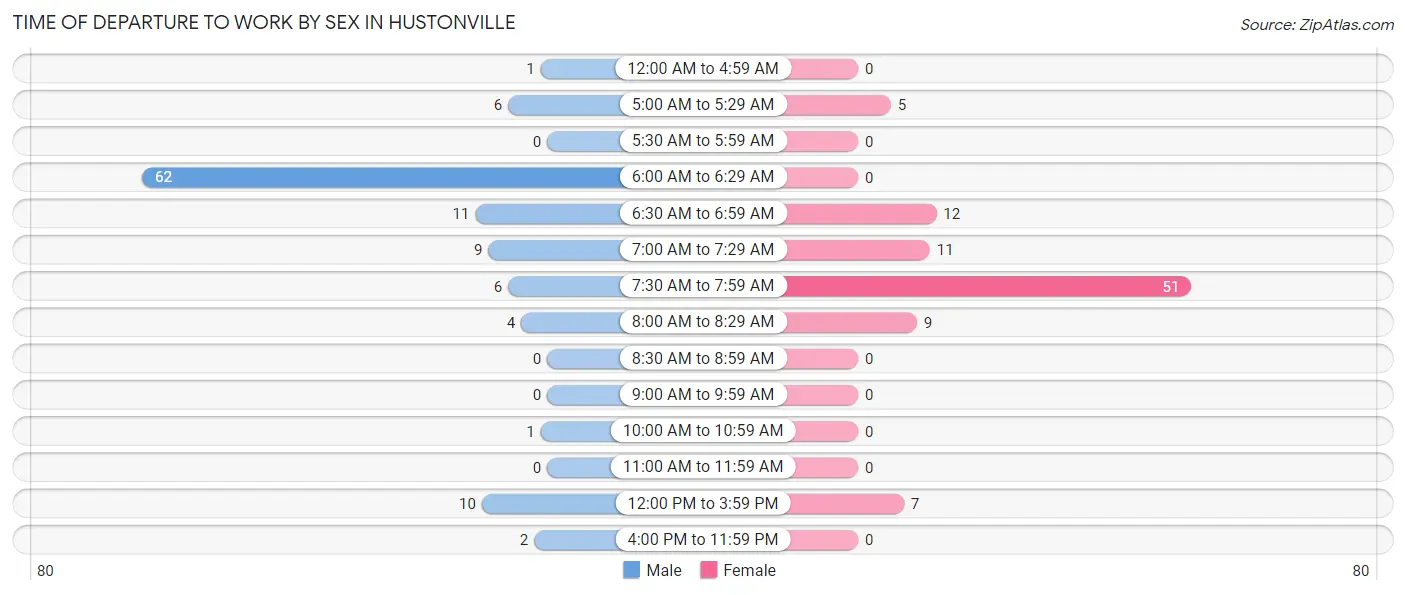
| Time of Departure | Male | Female |
| 12:00 AM to 4:59 AM | 1 (0.9%) | 0 (0.0%) |
| 5:00 AM to 5:29 AM | 6 (5.4%) | 5 (5.3%) |
| 5:30 AM to 5:59 AM | 0 (0.0%) | 0 (0.0%) |
| 6:00 AM to 6:29 AM | 62 (55.4%) | 0 (0.0%) |
| 6:30 AM to 6:59 AM | 11 (9.8%) | 12 (12.6%) |
| 7:00 AM to 7:29 AM | 9 (8.0%) | 11 (11.6%) |
| 7:30 AM to 7:59 AM | 6 (5.4%) | 51 (53.7%) |
| 8:00 AM to 8:29 AM | 4 (3.6%) | 9 (9.5%) |
| 8:30 AM to 8:59 AM | 0 (0.0%) | 0 (0.0%) |
| 9:00 AM to 9:59 AM | 0 (0.0%) | 0 (0.0%) |
| 10:00 AM to 10:59 AM | 1 (0.9%) | 0 (0.0%) |
| 11:00 AM to 11:59 AM | 0 (0.0%) | 0 (0.0%) |
| 12:00 PM to 3:59 PM | 10 (8.9%) | 7 (7.4%) |
| 4:00 PM to 11:59 PM | 2 (1.8%) | 0 (0.0%) |
| Total | 112 (100.0%) | 95 (100.0%) |
Housing Occupancy in Hustonville
Occupancy by Ownership in Hustonville
Of the total 294 dwellings in Hustonville, owner-occupied units account for 232 (78.9%), while renter-occupied units make up 62 (21.1%).
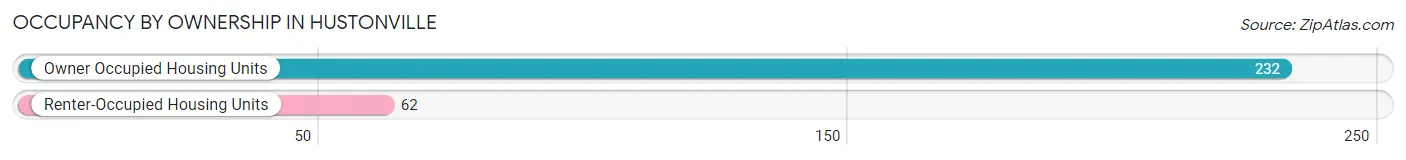
| Occupancy | # Housing Units | % Housing Units |
| Owner Occupied Housing Units | 232 | 78.9% |
| Renter-Occupied Housing Units | 62 | 21.1% |
| Total Occupied Housing Units | 294 | 100.0% |
Occupancy by Household Size in Hustonville
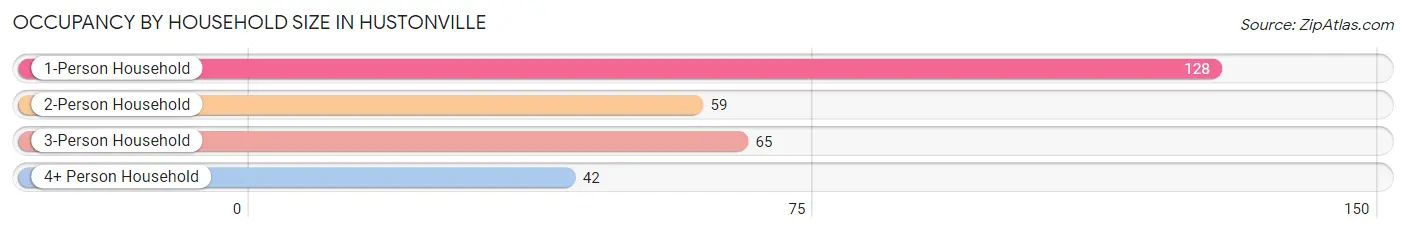
| Household Size | # Housing Units | % Housing Units |
| 1-Person Household | 128 | 43.5% |
| 2-Person Household | 59 | 20.1% |
| 3-Person Household | 65 | 22.1% |
| 4+ Person Household | 42 | 14.3% |
| Total Housing Units | 294 | 100.0% |
Occupancy by Ownership by Household Size in Hustonville
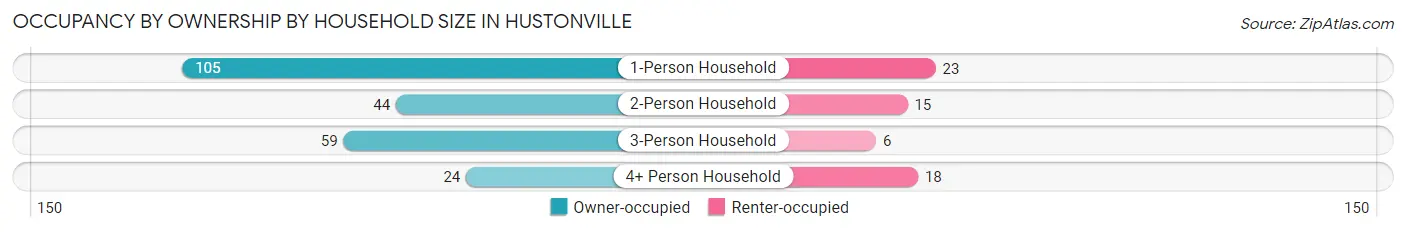
| Household Size | Owner-occupied | Renter-occupied |
| 1-Person Household | 105 (82.0%) | 23 (18.0%) |
| 2-Person Household | 44 (74.6%) | 15 (25.4%) |
| 3-Person Household | 59 (90.8%) | 6 (9.2%) |
| 4+ Person Household | 24 (57.1%) | 18 (42.9%) |
| Total Housing Units | 232 (78.9%) | 62 (21.1%) |
Occupancy by Educational Attainment in Hustonville
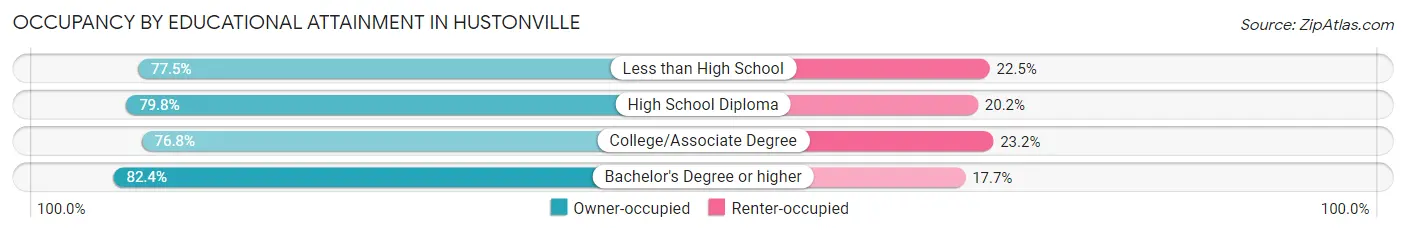
| Household Size | Owner-occupied | Renter-occupied |
| Less than High School | 62 (77.5%) | 18 (22.5%) |
| High School Diploma | 99 (79.8%) | 25 (20.2%) |
| College/Associate Degree | 43 (76.8%) | 13 (23.2%) |
| Bachelor's Degree or higher | 28 (82.4%) | 6 (17.6%) |
Occupancy by Age of Householder in Hustonville
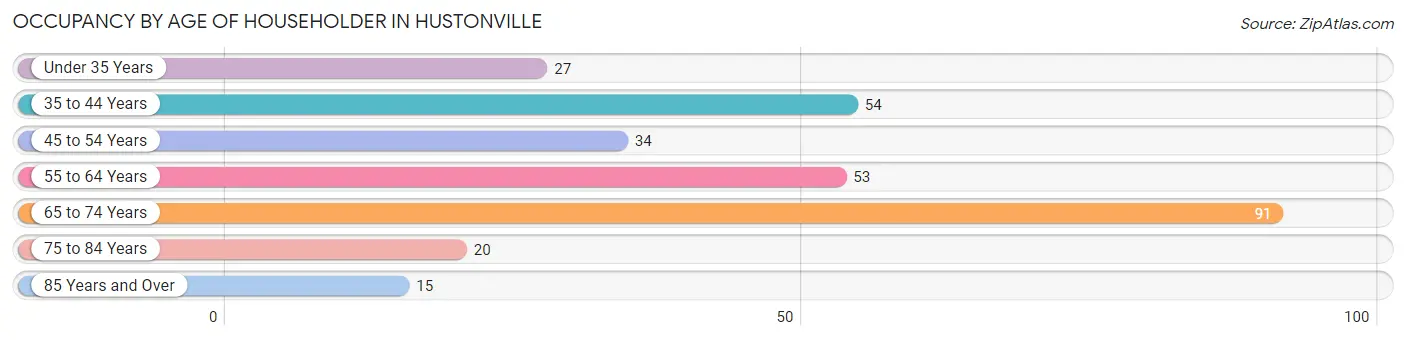
| Age Bracket | # Households | % Households |
| Under 35 Years | 27 | 9.2% |
| 35 to 44 Years | 54 | 18.4% |
| 45 to 54 Years | 34 | 11.6% |
| 55 to 64 Years | 53 | 18.0% |
| 65 to 74 Years | 91 | 30.9% |
| 75 to 84 Years | 20 | 6.8% |
| 85 Years and Over | 15 | 5.1% |
| Total | 294 | 100.0% |
Housing Finances in Hustonville
Median Income by Occupancy in Hustonville
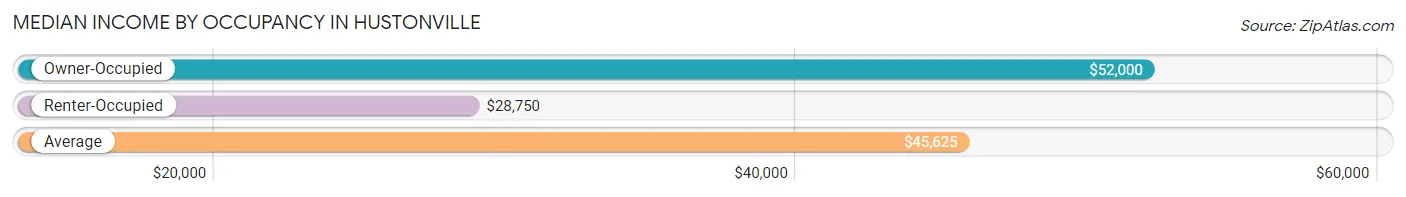
| Occupancy Type | # Households | Median Income |
| Owner-Occupied | 232 (78.9%) | $52,000 |
| Renter-Occupied | 62 (21.1%) | $28,750 |
| Average | 294 (100.0%) | $45,625 |
Occupancy by Householder Income Bracket in Hustonville
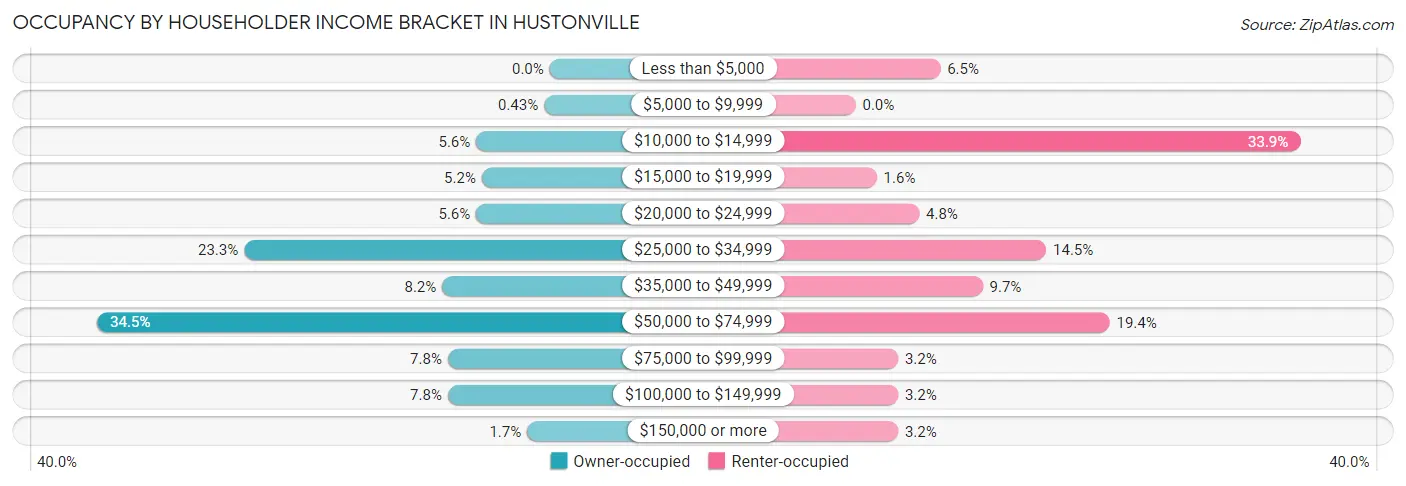
| Income Bracket | Owner-occupied | Renter-occupied |
| Less than $5,000 | 0 (0.0%) | 4 (6.5%) |
| $5,000 to $9,999 | 1 (0.4%) | 0 (0.0%) |
| $10,000 to $14,999 | 13 (5.6%) | 21 (33.9%) |
| $15,000 to $19,999 | 12 (5.2%) | 1 (1.6%) |
| $20,000 to $24,999 | 13 (5.6%) | 3 (4.8%) |
| $25,000 to $34,999 | 54 (23.3%) | 9 (14.5%) |
| $35,000 to $49,999 | 19 (8.2%) | 6 (9.7%) |
| $50,000 to $74,999 | 80 (34.5%) | 12 (19.4%) |
| $75,000 to $99,999 | 18 (7.8%) | 2 (3.2%) |
| $100,000 to $149,999 | 18 (7.8%) | 2 (3.2%) |
| $150,000 or more | 4 (1.7%) | 2 (3.2%) |
| Total | 232 (100.0%) | 62 (100.0%) |
Monthly Housing Cost Tiers in Hustonville
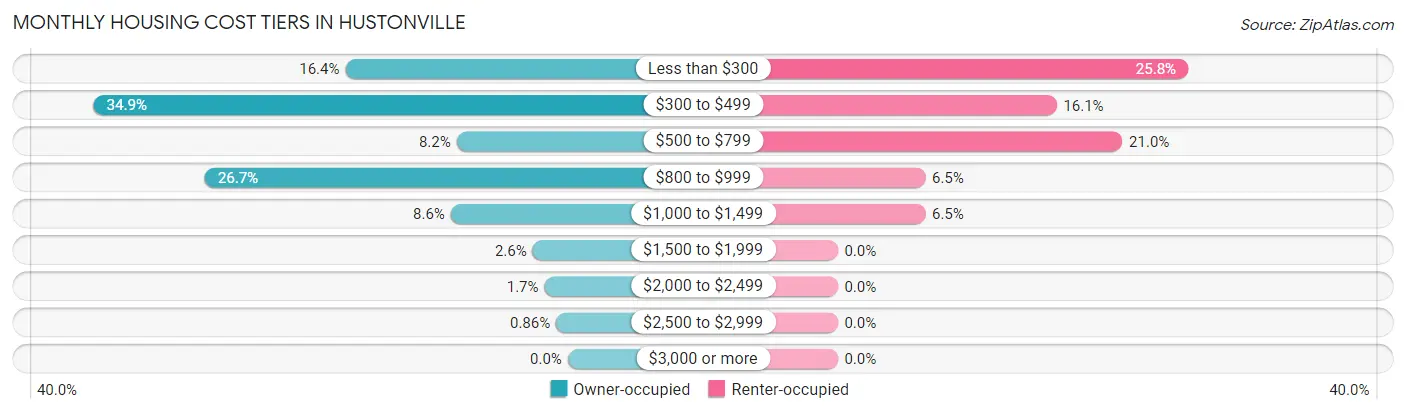
| Monthly Cost | Owner-occupied | Renter-occupied |
| Less than $300 | 38 (16.4%) | 16 (25.8%) |
| $300 to $499 | 81 (34.9%) | 10 (16.1%) |
| $500 to $799 | 19 (8.2%) | 13 (21.0%) |
| $800 to $999 | 62 (26.7%) | 4 (6.5%) |
| $1,000 to $1,499 | 20 (8.6%) | 4 (6.5%) |
| $1,500 to $1,999 | 6 (2.6%) | 0 (0.0%) |
| $2,000 to $2,499 | 4 (1.7%) | 0 (0.0%) |
| $2,500 to $2,999 | 2 (0.9%) | 0 (0.0%) |
| $3,000 or more | 0 (0.0%) | 0 (0.0%) |
| Total | 232 (100.0%) | 62 (100.0%) |
Physical Housing Characteristics in Hustonville
Housing Structures in Hustonville
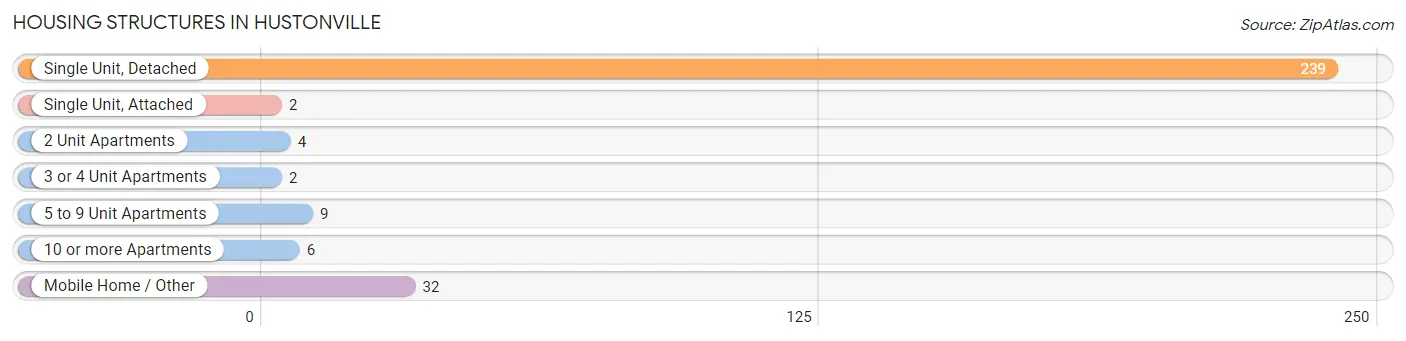
| Structure Type | # Housing Units | % Housing Units |
| Single Unit, Detached | 239 | 81.3% |
| Single Unit, Attached | 2 | 0.7% |
| 2 Unit Apartments | 4 | 1.4% |
| 3 or 4 Unit Apartments | 2 | 0.7% |
| 5 to 9 Unit Apartments | 9 | 3.1% |
| 10 or more Apartments | 6 | 2.0% |
| Mobile Home / Other | 32 | 10.9% |
| Total | 294 | 100.0% |
Housing Structures by Occupancy in Hustonville
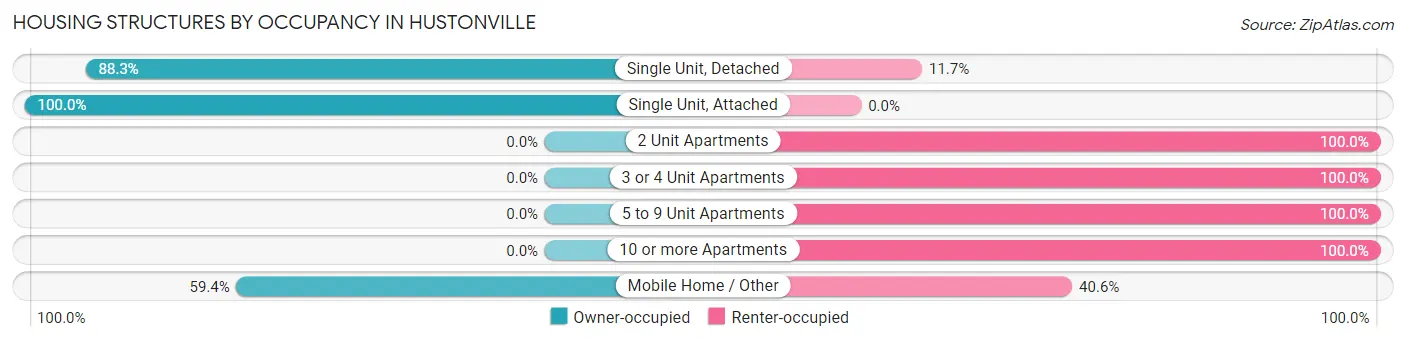
| Structure Type | Owner-occupied | Renter-occupied |
| Single Unit, Detached | 211 (88.3%) | 28 (11.7%) |
| Single Unit, Attached | 2 (100.0%) | 0 (0.0%) |
| 2 Unit Apartments | 0 (0.0%) | 4 (100.0%) |
| 3 or 4 Unit Apartments | 0 (0.0%) | 2 (100.0%) |
| 5 to 9 Unit Apartments | 0 (0.0%) | 9 (100.0%) |
| 10 or more Apartments | 0 (0.0%) | 6 (100.0%) |
| Mobile Home / Other | 19 (59.4%) | 13 (40.6%) |
| Total | 232 (78.9%) | 62 (21.1%) |
Housing Structures by Number of Rooms in Hustonville
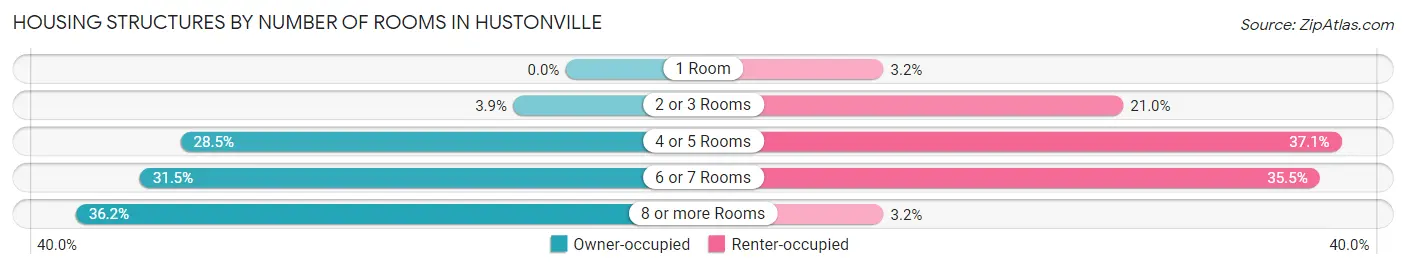
| Number of Rooms | Owner-occupied | Renter-occupied |
| 1 Room | 0 (0.0%) | 2 (3.2%) |
| 2 or 3 Rooms | 9 (3.9%) | 13 (21.0%) |
| 4 or 5 Rooms | 66 (28.4%) | 23 (37.1%) |
| 6 or 7 Rooms | 73 (31.5%) | 22 (35.5%) |
| 8 or more Rooms | 84 (36.2%) | 2 (3.2%) |
| Total | 232 (100.0%) | 62 (100.0%) |
Housing Structure by Heating Type in Hustonville
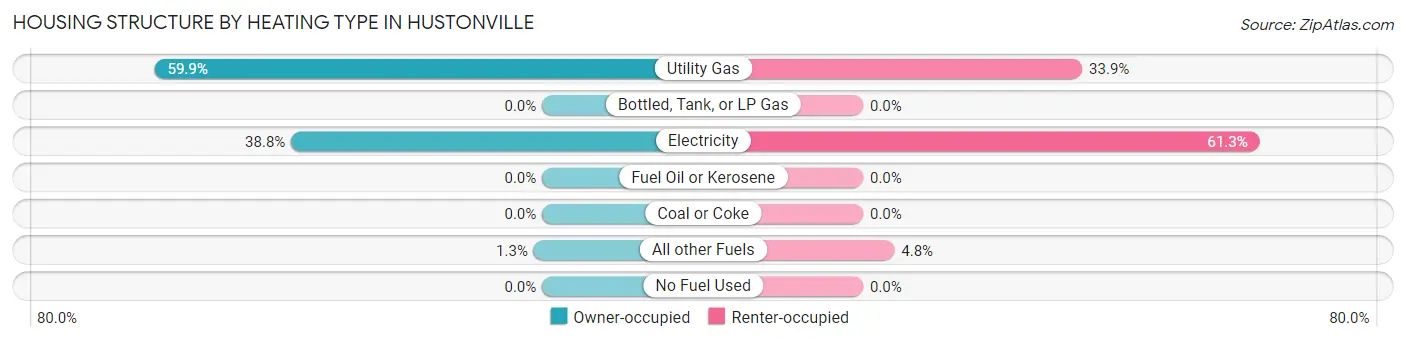
| Heating Type | Owner-occupied | Renter-occupied |
| Utility Gas | 139 (59.9%) | 21 (33.9%) |
| Bottled, Tank, or LP Gas | 0 (0.0%) | 0 (0.0%) |
| Electricity | 90 (38.8%) | 38 (61.3%) |
| Fuel Oil or Kerosene | 0 (0.0%) | 0 (0.0%) |
| Coal or Coke | 0 (0.0%) | 0 (0.0%) |
| All other Fuels | 3 (1.3%) | 3 (4.8%) |
| No Fuel Used | 0 (0.0%) | 0 (0.0%) |
| Total | 232 (100.0%) | 62 (100.0%) |
Household Vehicle Usage in Hustonville
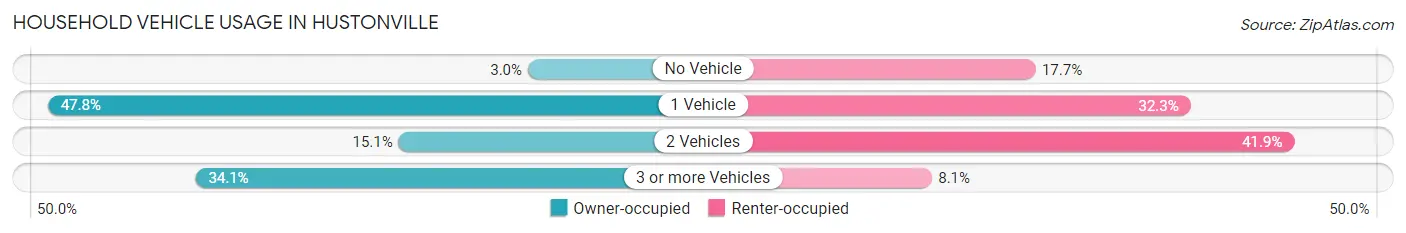
| Vehicles per Household | Owner-occupied | Renter-occupied |
| No Vehicle | 7 (3.0%) | 11 (17.7%) |
| 1 Vehicle | 111 (47.8%) | 20 (32.3%) |
| 2 Vehicles | 35 (15.1%) | 26 (41.9%) |
| 3 or more Vehicles | 79 (34.1%) | 5 (8.1%) |
| Total | 232 (100.0%) | 62 (100.0%) |
Real Estate & Mortgages in Hustonville
Real Estate and Mortgage Overview in Hustonville
| Characteristic | Without Mortgage | With Mortgage |
| Housing Units | 127 | 105 |
| Median Property Value | $112,800 | $78,100 |
| Median Household Income | $55,268 | $3 |
| Monthly Housing Costs | $327 | $0 |
| Real Estate Taxes | $544 | $4 |
Property Value by Mortgage Status in Hustonville

| Property Value | Without Mortgage | With Mortgage |
| Less than $50,000 | 15 (11.8%) | 14 (13.3%) |
| $50,000 to $99,999 | 25 (19.7%) | 56 (53.3%) |
| $100,000 to $299,999 | 85 (66.9%) | 29 (27.6%) |
| $300,000 to $499,999 | 2 (1.6%) | 6 (5.7%) |
| $500,000 to $749,999 | 0 (0.0%) | 0 (0.0%) |
| $750,000 to $999,999 | 0 (0.0%) | 0 (0.0%) |
| $1,000,000 or more | 0 (0.0%) | 0 (0.0%) |
| Total | 127 (100.0%) | 105 (100.0%) |
Household Income by Mortgage Status in Hustonville
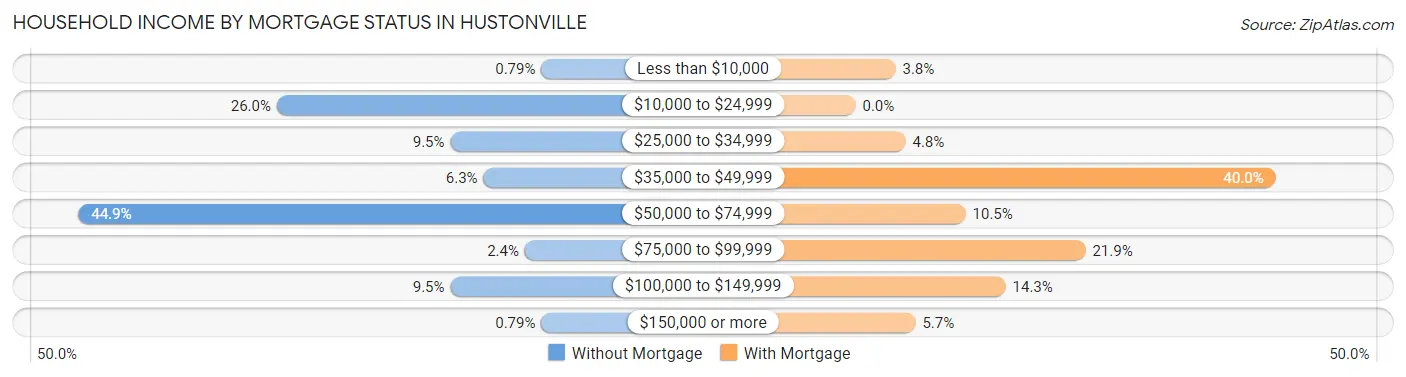
| Household Income | Without Mortgage | With Mortgage |
| Less than $10,000 | 1 (0.8%) | 4 (3.8%) |
| $10,000 to $24,999 | 33 (26.0%) | 0 (0.0%) |
| $25,000 to $34,999 | 12 (9.5%) | 5 (4.8%) |
| $35,000 to $49,999 | 8 (6.3%) | 42 (40.0%) |
| $50,000 to $74,999 | 57 (44.9%) | 11 (10.5%) |
| $75,000 to $99,999 | 3 (2.4%) | 23 (21.9%) |
| $100,000 to $149,999 | 12 (9.5%) | 15 (14.3%) |
| $150,000 or more | 1 (0.8%) | 6 (5.7%) |
| Total | 127 (100.0%) | 105 (100.0%) |
Property Value to Household Income Ratio in Hustonville
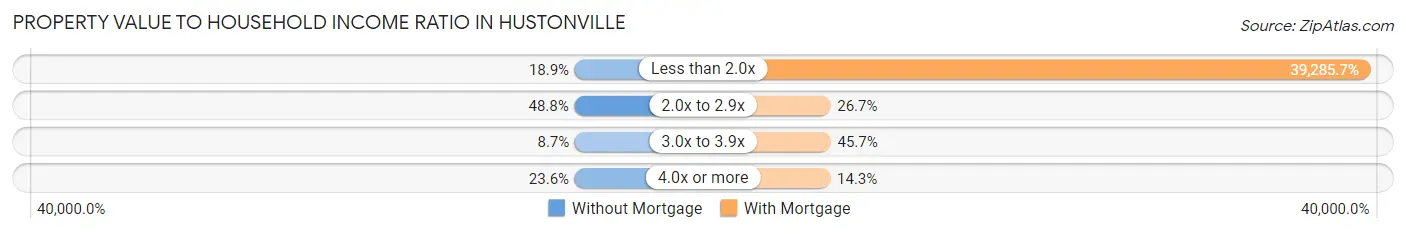
| Value-to-Income Ratio | Without Mortgage | With Mortgage |
| Less than 2.0x | 24 (18.9%) | 41,250 (39,285.7%) |
| 2.0x to 2.9x | 62 (48.8%) | 28 (26.7%) |
| 3.0x to 3.9x | 11 (8.7%) | 48 (45.7%) |
| 4.0x or more | 30 (23.6%) | 15 (14.3%) |
| Total | 127 (100.0%) | 105 (100.0%) |
Real Estate Taxes by Mortgage Status in Hustonville
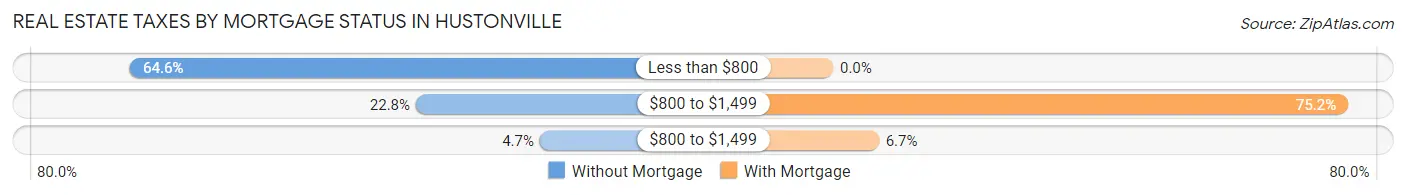
| Property Taxes | Without Mortgage | With Mortgage |
| Less than $800 | 82 (64.6%) | 0 (0.0%) |
| $800 to $1,499 | 29 (22.8%) | 79 (75.2%) |
| $800 to $1,499 | 6 (4.7%) | 7 (6.7%) |
| Total | 127 (100.0%) | 105 (100.0%) |
Health & Disability in Hustonville
Health Insurance Coverage by Age in Hustonville
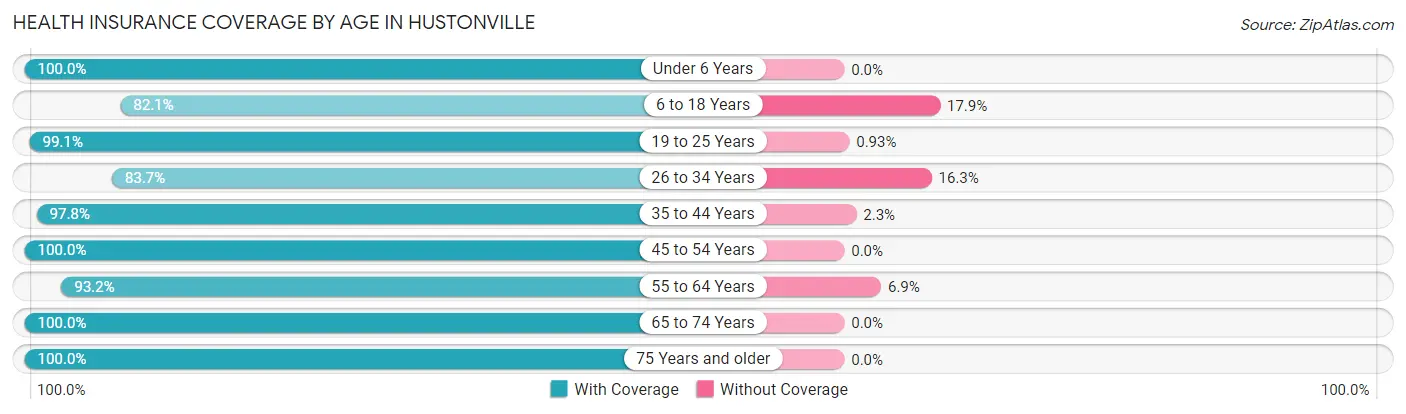
| Age Bracket | With Coverage | Without Coverage |
| Under 6 Years | 30 (100.0%) | 0 (0.0%) |
| 6 to 18 Years | 46 (82.1%) | 10 (17.9%) |
| 19 to 25 Years | 106 (99.1%) | 1 (0.9%) |
| 26 to 34 Years | 36 (83.7%) | 7 (16.3%) |
| 35 to 44 Years | 87 (97.8%) | 2 (2.2%) |
| 45 to 54 Years | 60 (100.0%) | 0 (0.0%) |
| 55 to 64 Years | 68 (93.1%) | 5 (6.9%) |
| 65 to 74 Years | 105 (100.0%) | 0 (0.0%) |
| 75 Years and older | 49 (100.0%) | 0 (0.0%) |
| Total | 587 (95.9%) | 25 (4.1%) |
Health Insurance Coverage by Citizenship Status in Hustonville
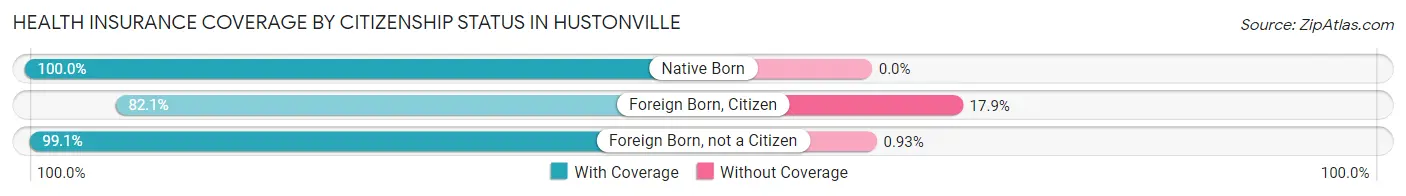
| Citizenship Status | With Coverage | Without Coverage |
| Native Born | 30 (100.0%) | 0 (0.0%) |
| Foreign Born, Citizen | 46 (82.1%) | 10 (17.9%) |
| Foreign Born, not a Citizen | 106 (99.1%) | 1 (0.9%) |
Health Insurance Coverage by Household Income in Hustonville
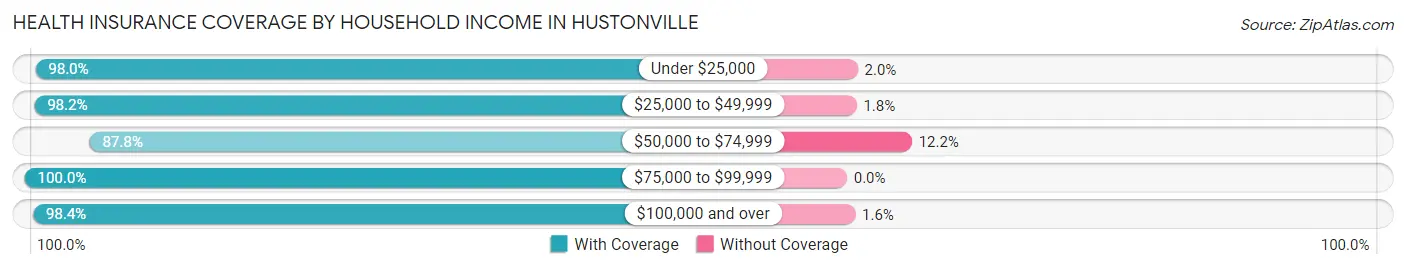
| Household Income | With Coverage | Without Coverage |
| Under $25,000 | 97 (98.0%) | 2 (2.0%) |
| $25,000 to $49,999 | 217 (98.2%) | 4 (1.8%) |
| $50,000 to $74,999 | 130 (87.8%) | 18 (12.2%) |
| $75,000 to $99,999 | 80 (100.0%) | 0 (0.0%) |
| $100,000 and over | 63 (98.4%) | 1 (1.6%) |
Public vs Private Health Insurance Coverage by Age in Hustonville
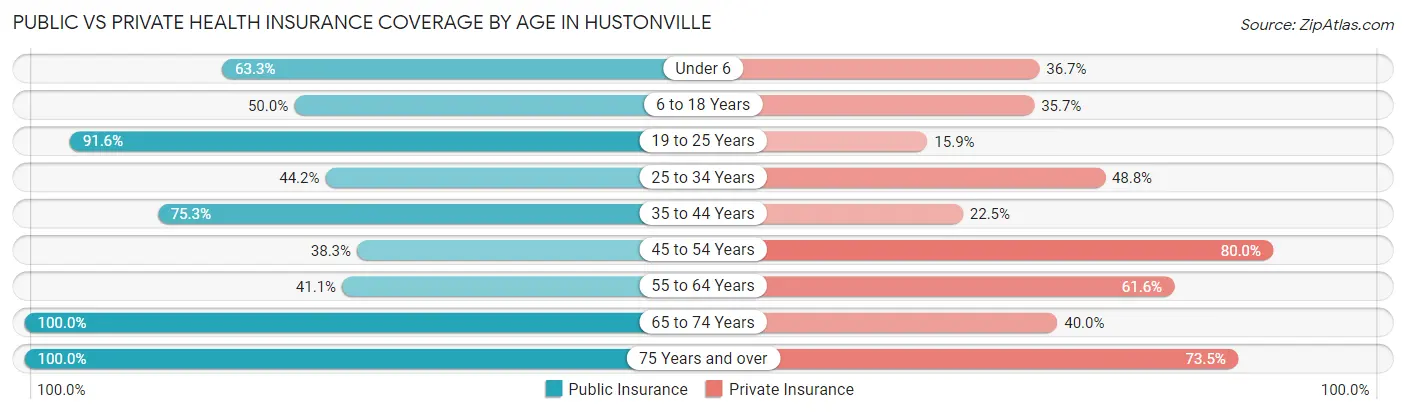
| Age Bracket | Public Insurance | Private Insurance |
| Under 6 | 19 (63.3%) | 11 (36.7%) |
| 6 to 18 Years | 28 (50.0%) | 20 (35.7%) |
| 19 to 25 Years | 98 (91.6%) | 17 (15.9%) |
| 25 to 34 Years | 19 (44.2%) | 21 (48.8%) |
| 35 to 44 Years | 67 (75.3%) | 20 (22.5%) |
| 45 to 54 Years | 23 (38.3%) | 48 (80.0%) |
| 55 to 64 Years | 30 (41.1%) | 45 (61.6%) |
| 65 to 74 Years | 105 (100.0%) | 42 (40.0%) |
| 75 Years and over | 49 (100.0%) | 36 (73.5%) |
| Total | 438 (71.6%) | 260 (42.5%) |
Disability Status by Sex by Age in Hustonville
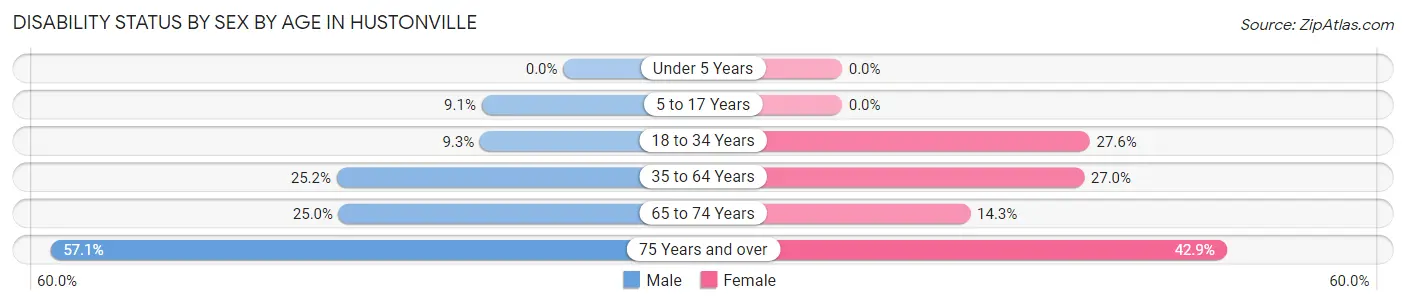
| Age Bracket | Male | Female |
| Under 5 Years | 0 (0.0%) | 0 (0.0%) |
| 5 to 17 Years | 2 (9.1%) | 0 (0.0%) |
| 18 to 34 Years | 9 (9.3%) | 16 (27.6%) |
| 35 to 64 Years | 27 (25.2%) | 31 (27.0%) |
| 65 to 74 Years | 7 (25.0%) | 11 (14.3%) |
| 75 Years and over | 8 (57.1%) | 15 (42.9%) |
Disability Class by Sex by Age in Hustonville
Disability Class: Hearing Difficulty
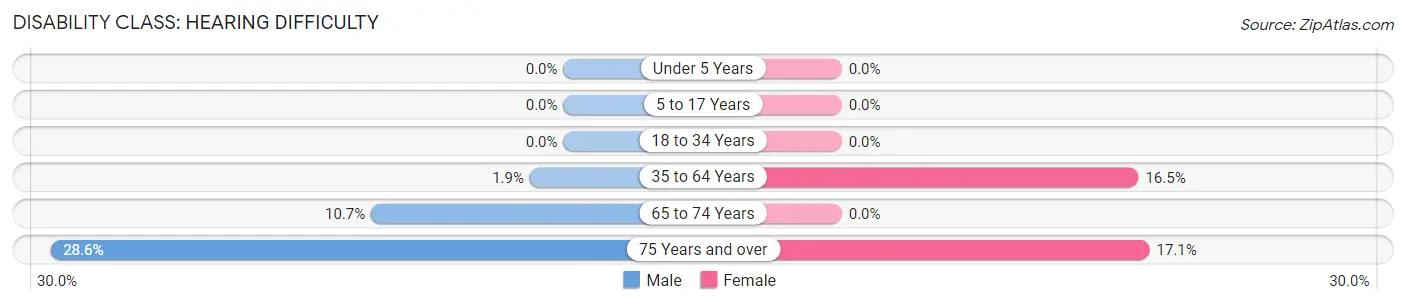
| Age Bracket | Male | Female |
| Under 5 Years | 0 (0.0%) | 0 (0.0%) |
| 5 to 17 Years | 0 (0.0%) | 0 (0.0%) |
| 18 to 34 Years | 0 (0.0%) | 0 (0.0%) |
| 35 to 64 Years | 2 (1.9%) | 19 (16.5%) |
| 65 to 74 Years | 3 (10.7%) | 0 (0.0%) |
| 75 Years and over | 4 (28.6%) | 6 (17.1%) |
Disability Class: Vision Difficulty
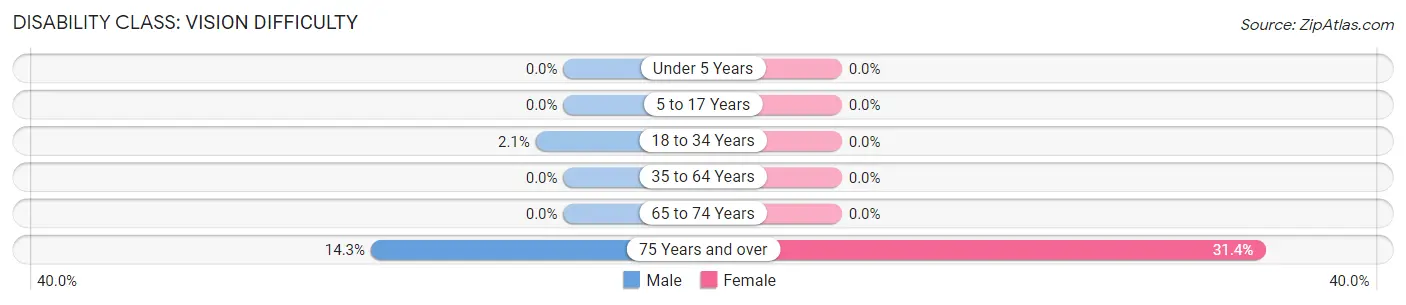
| Age Bracket | Male | Female |
| Under 5 Years | 0 (0.0%) | 0 (0.0%) |
| 5 to 17 Years | 0 (0.0%) | 0 (0.0%) |
| 18 to 34 Years | 2 (2.1%) | 0 (0.0%) |
| 35 to 64 Years | 0 (0.0%) | 0 (0.0%) |
| 65 to 74 Years | 0 (0.0%) | 0 (0.0%) |
| 75 Years and over | 2 (14.3%) | 11 (31.4%) |
Disability Class: Cognitive Difficulty
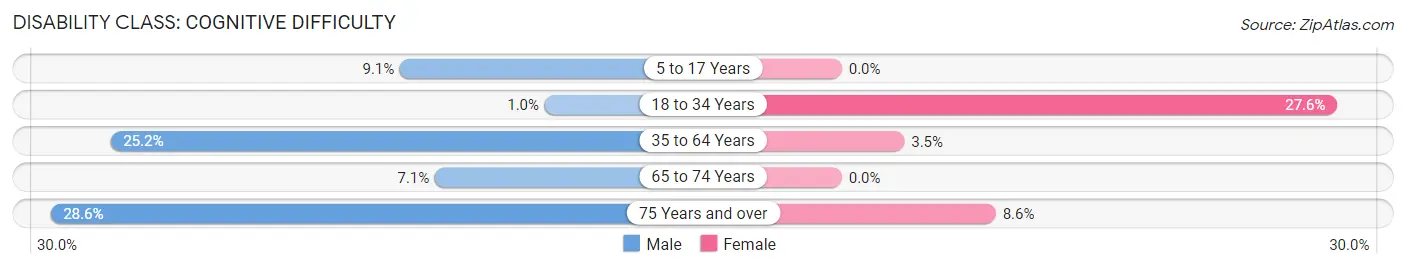
| Age Bracket | Male | Female |
| 5 to 17 Years | 2 (9.1%) | 0 (0.0%) |
| 18 to 34 Years | 1 (1.0%) | 16 (27.6%) |
| 35 to 64 Years | 27 (25.2%) | 4 (3.5%) |
| 65 to 74 Years | 2 (7.1%) | 0 (0.0%) |
| 75 Years and over | 4 (28.6%) | 3 (8.6%) |
Disability Class: Ambulatory Difficulty
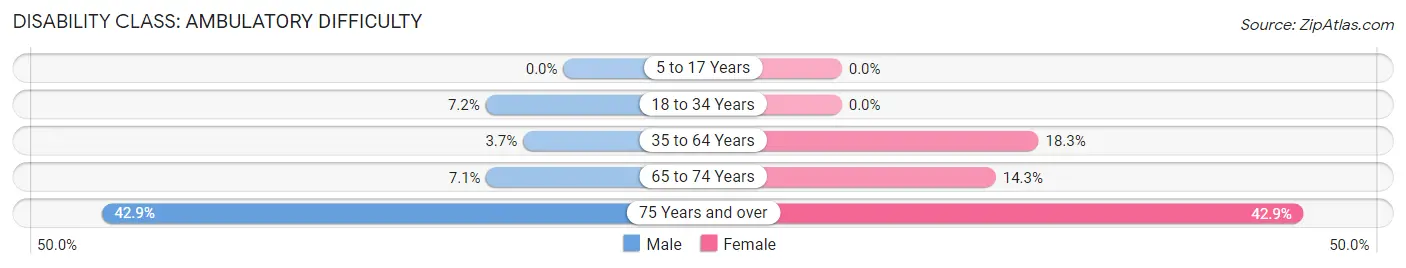
| Age Bracket | Male | Female |
| 5 to 17 Years | 0 (0.0%) | 0 (0.0%) |
| 18 to 34 Years | 7 (7.2%) | 0 (0.0%) |
| 35 to 64 Years | 4 (3.7%) | 21 (18.3%) |
| 65 to 74 Years | 2 (7.1%) | 11 (14.3%) |
| 75 Years and over | 6 (42.9%) | 15 (42.9%) |
Disability Class: Self-Care Difficulty
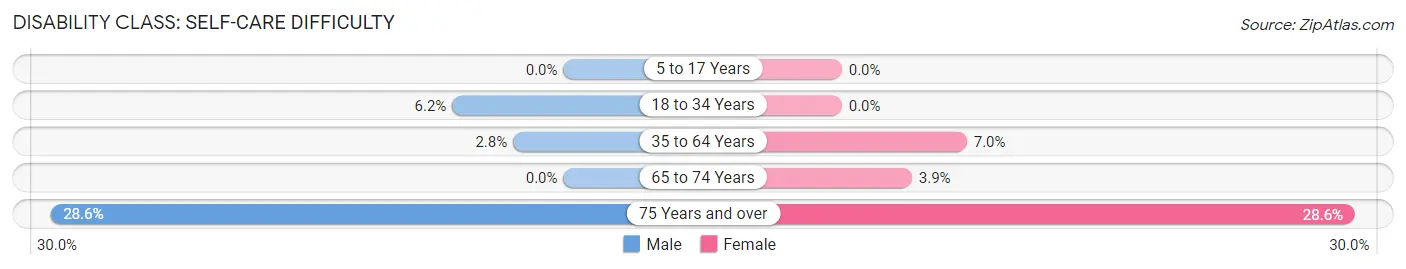
| Age Bracket | Male | Female |
| 5 to 17 Years | 0 (0.0%) | 0 (0.0%) |
| 18 to 34 Years | 6 (6.2%) | 0 (0.0%) |
| 35 to 64 Years | 3 (2.8%) | 8 (7.0%) |
| 65 to 74 Years | 0 (0.0%) | 3 (3.9%) |
| 75 Years and over | 4 (28.6%) | 10 (28.6%) |
Technology Access in Hustonville
Computing Device Access in Hustonville
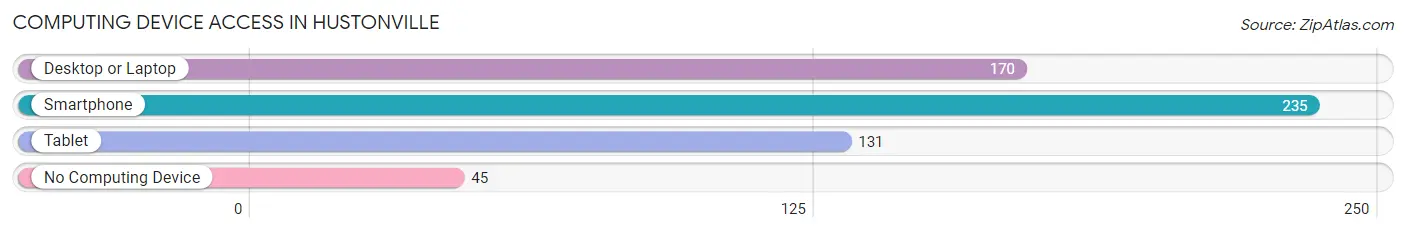
| Device Type | # Households | % Households |
| Desktop or Laptop | 170 | 57.8% |
| Smartphone | 235 | 79.9% |
| Tablet | 131 | 44.6% |
| No Computing Device | 45 | 15.3% |
| Total | 294 | 100.0% |
Internet Access in Hustonville
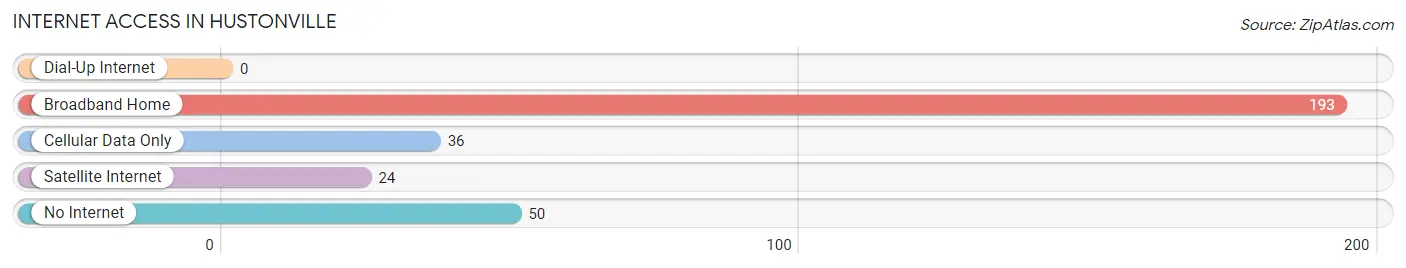
| Internet Type | # Households | % Households |
| Dial-Up Internet | 0 | 0.0% |
| Broadband Home | 193 | 65.6% |
| Cellular Data Only | 36 | 12.2% |
| Satellite Internet | 24 | 8.2% |
| No Internet | 50 | 17.0% |
| Total | 294 | 100.0% |
Hustonville Summary
Hustonville is a small unincorporated community located in Lincoln County, Kentucky. It is situated in the rolling hills of the Bluegrass region of the state, approximately 25 miles south of Lexington. The population of Hustonville was estimated to be around 500 in 2020.
History
Hustonville was founded in 1817 by William Huston, a Revolutionary War veteran. The town was named after him and was originally known as Huston’s Crossroads. The town was incorporated in 1820 and was the county seat of Lincoln County until 1866.
Hustonville was a major stop on the Louisville and Nashville Railroad, which was completed in 1859. The railroad brought economic growth to the area and helped to make Hustonville a thriving community. The town was also home to several businesses, including a flour mill, a sawmill, a blacksmith shop, and a general store.
In the late 19th century, Hustonville was a popular destination for tourists. The town was known for its mineral springs, which were believed to have healing properties. The springs were a popular attraction for visitors from all over the country.
Geography
Hustonville is located in the rolling hills of the Bluegrass region of Kentucky. The town is situated in the western part of Lincoln County, approximately 25 miles south of Lexington. The town is bordered by the towns of Stanford and Waynesburg to the north, and by the towns of Crab Orchard and Kings Mountain to the south.
The climate in Hustonville is humid subtropical, with hot summers and mild winters. The average annual temperature is around 60 degrees Fahrenheit. The average annual precipitation is around 45 inches.
Economy
The economy of Hustonville is largely based on agriculture. The town is home to several farms, which produce a variety of crops, including corn, soybeans, wheat, and hay. The town is also home to several small businesses, including a grocery store, a hardware store, and a restaurant.
Demographics
The population of Hustonville was estimated to be around 500 in 2020. The town is predominantly white, with a small African American population. The median household income in Hustonville is around $35,000. The median home value is around $100,000.
Conclusion
Hustonville is a small unincorporated community located in Lincoln County, Kentucky. It is situated in the rolling hills of the Bluegrass region of the state, approximately 25 miles south of Lexington. The town was founded in 1817 by William Huston and was originally known as Huston’s Crossroads. The town was a major stop on the Louisville and Nashville Railroad, which brought economic growth to the area. The town is predominantly white, with a small African American population. The economy of Hustonville is largely based on agriculture, and the town is home to several small businesses. The population of Hustonville was estimated to be around 500 in 2020.
Common Questions
What is Per Capita Income in Hustonville?
Per Capita income in Hustonville is $25,207.
What is the Median Family Income in Hustonville?
Median Family Income in Hustonville is $46,591.
What is the Median Household income in Hustonville?
Median Household Income in Hustonville is $45,625.
What is Income or Wage Gap in Hustonville?
Income or Wage Gap in Hustonville is 25.1%.
Women in Hustonville earn 74.9 cents for every dollar earned by a man.
What is Inequality or Gini Index in Hustonville?
Inequality or Gini Index in Hustonville is 0.39.
What is the Total Population of Hustonville?
Total Population of Hustonville is 612.
What is the Total Male Population of Hustonville?
Total Male Population of Hustonville is 284.
What is the Total Female Population of Hustonville?
Total Female Population of Hustonville is 328.
What is the Ratio of Males per 100 Females in Hustonville?
There are 86.59 Males per 100 Females in Hustonville.
What is the Ratio of Females per 100 Males in Hustonville?
There are 115.49 Females per 100 Males in Hustonville.
What is the Median Population Age in Hustonville?
Median Population Age in Hustonville is 44.5 Years.
What is the Average Family Size in Hustonville
Average Family Size in Hustonville is 2.7 People.
What is the Average Household Size in Hustonville
Average Household Size in Hustonville is 2.1 People.
How Large is the Labor Force in Hustonville?
There are 250 People in the Labor Forcein in Hustonville.
What is the Percentage of People in the Labor Force in Hustonville?
46.7% of People are in the Labor Force in Hustonville.
What is the Unemployment Rate in Hustonville?
Unemployment Rate in Hustonville is 10.0%.