Horse Cave, KY Map & Demographics
Horse Cave Map
Horse Cave Overview
$22,435
PER CAPITA INCOME
$50,028
AVG FAMILY INCOME
$46,971
AVG HOUSEHOLD INCOME
41.7%
WAGE / INCOME GAP [ % ]
58.3¢/ $1
WAGE / INCOME GAP [ $ ]
0.39
INEQUALITY / GINI INDEX
2,353
TOTAL POPULATION
1,129
MALE POPULATION
1,224
FEMALE POPULATION
92.24
MALES / 100 FEMALES
108.41
FEMALES / 100 MALES
42.3
MEDIAN AGE
2.7
AVG FAMILY SIZE
2.2
AVG HOUSEHOLD SIZE
794
LABOR FORCE [ PEOPLE ]
40.8%
PERCENT IN LABOR FORCE
7.8%
UNEMPLOYMENT RATE
Horse Cave Zip Codes
Horse Cave Area Codes
Income in Horse Cave
Income Overview in Horse Cave
Per Capita Income in Horse Cave is $22,435, while median incomes of families and households are $50,028 and $46,971 respectively.
| Characteristic | Number | Measure |
| Per Capita Income | 2,353 | $22,435 |
| Median Family Income | 561 | $50,028 |
| Mean Family Income | 561 | $51,150 |
| Median Household Income | 1,013 | $46,971 |
| Mean Household Income | 1,013 | $49,263 |
| Income Deficit | 561 | $0 |
| Wage / Income Gap (%) | 2,353 | 41.72% |
| Wage / Income Gap ($) | 2,353 | 58.28¢ per $1 |
| Gini / Inequality Index | 2,353 | 0.39 |
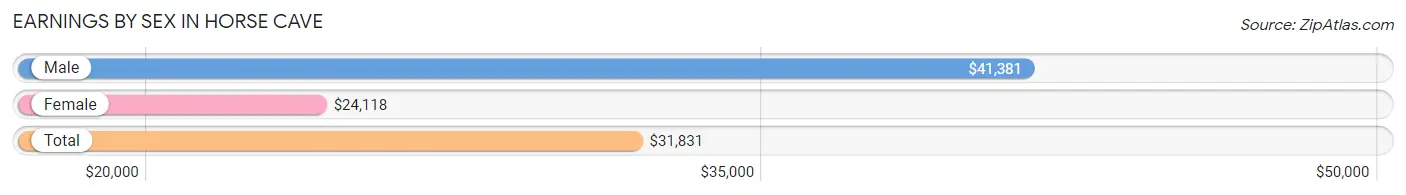
Earnings by Sex in Horse Cave
Average Earnings in Horse Cave are $31,831, $41,381 for men and $24,118 for women, a difference of 41.7%.
| Sex | Number | Average Earnings |
| Male | 416 (47.7%) | $41,381 |
| Female | 456 (52.3%) | $24,118 |
| Total | 872 (100.0%) | $31,831 |
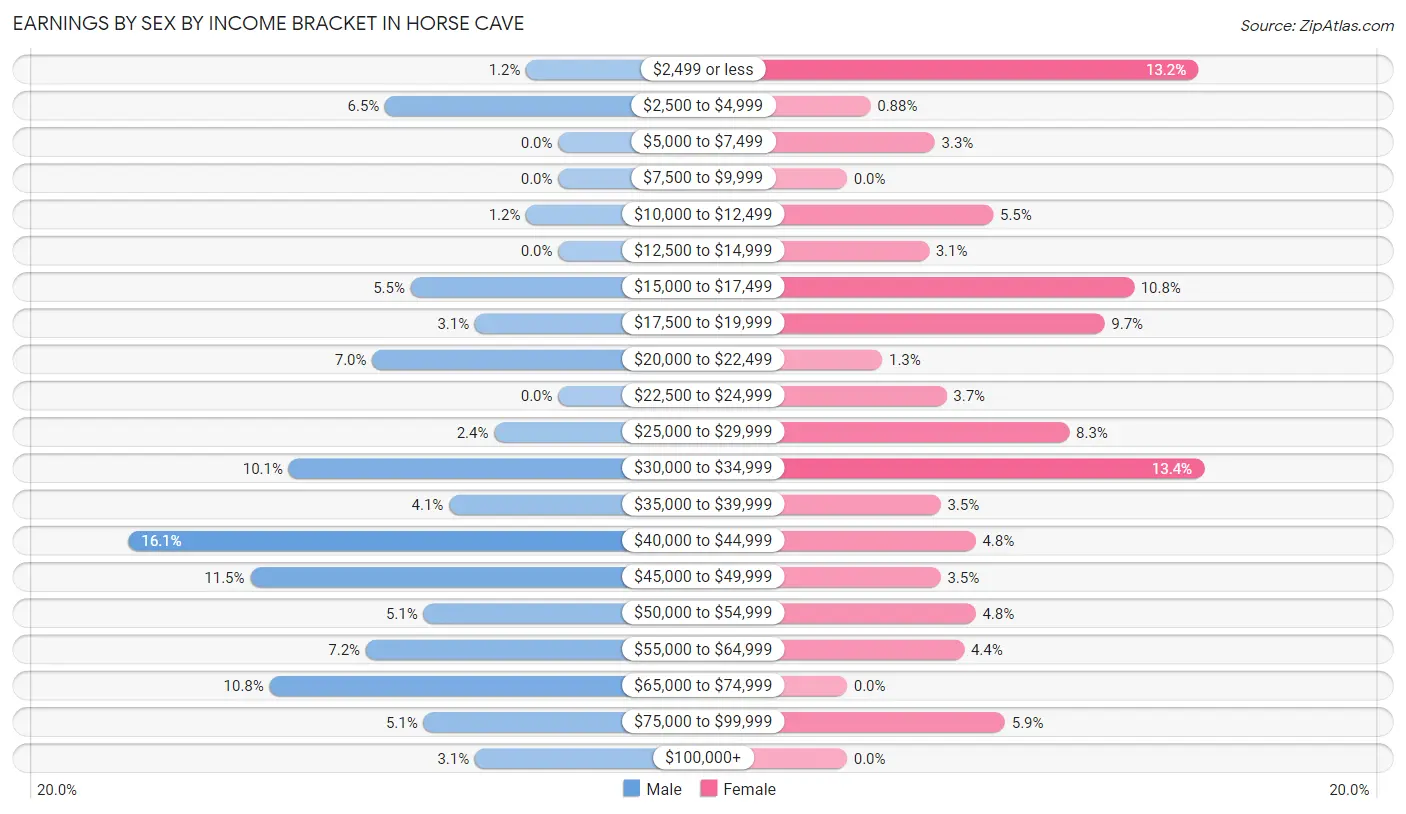
Earnings by Sex by Income Bracket in Horse Cave
The most common earnings brackets in Horse Cave are $40,000 to $44,999 for men (67 | 16.1%) and $30,000 to $34,999 for women (61 | 13.4%).
| Income | Male | Female |
| $2,499 or less | 5 (1.2%) | 60 (13.2%) |
| $2,500 to $4,999 | 27 (6.5%) | 4 (0.9%) |
| $5,000 to $7,499 | 0 (0.0%) | 15 (3.3%) |
| $7,500 to $9,999 | 0 (0.0%) | 0 (0.0%) |
| $10,000 to $12,499 | 5 (1.2%) | 25 (5.5%) |
| $12,500 to $14,999 | 0 (0.0%) | 14 (3.1%) |
| $15,000 to $17,499 | 23 (5.5%) | 49 (10.7%) |
| $17,500 to $19,999 | 13 (3.1%) | 44 (9.7%) |
| $20,000 to $22,499 | 29 (7.0%) | 6 (1.3%) |
| $22,500 to $24,999 | 0 (0.0%) | 17 (3.7%) |
| $25,000 to $29,999 | 10 (2.4%) | 38 (8.3%) |
| $30,000 to $34,999 | 42 (10.1%) | 61 (13.4%) |
| $35,000 to $39,999 | 17 (4.1%) | 16 (3.5%) |
| $40,000 to $44,999 | 67 (16.1%) | 22 (4.8%) |
| $45,000 to $49,999 | 48 (11.5%) | 16 (3.5%) |
| $50,000 to $54,999 | 21 (5.1%) | 22 (4.8%) |
| $55,000 to $64,999 | 30 (7.2%) | 20 (4.4%) |
| $65,000 to $74,999 | 45 (10.8%) | 0 (0.0%) |
| $75,000 to $99,999 | 21 (5.1%) | 27 (5.9%) |
| $100,000+ | 13 (3.1%) | 0 (0.0%) |
| Total | 416 (100.0%) | 456 (100.0%) |
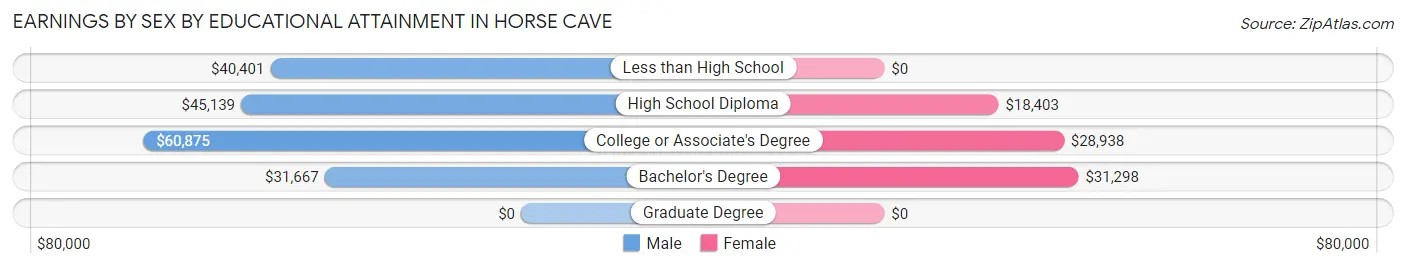
Earnings by Sex by Educational Attainment in Horse Cave
Average earnings in Horse Cave are $41,679 for men and $28,362 for women, a difference of 32.0%. Men with an educational attainment of college or associate's degree enjoy the highest average annual earnings of $60,875, while those with bachelor's degree education earn the least with $31,667. Women with an educational attainment of bachelor's degree earn the most with the average annual earnings of $31,298, while those with high school diploma education have the smallest earnings of $18,403.
| Educational Attainment | Male Income | Female Income |
| Less than High School | $40,401 | $0 |
| High School Diploma | $45,139 | $18,403 |
| College or Associate's Degree | $60,875 | $28,938 |
| Bachelor's Degree | $31,667 | $31,298 |
| Graduate Degree | - | - |
| Total | $41,679 | $28,362 |
Family Income in Horse Cave
Family Income Brackets in Horse Cave
According to the Horse Cave family income data, there are 135 families falling into the $50,000 to $74,999 income range, which is the most common income bracket and makes up 24.1% of all families.
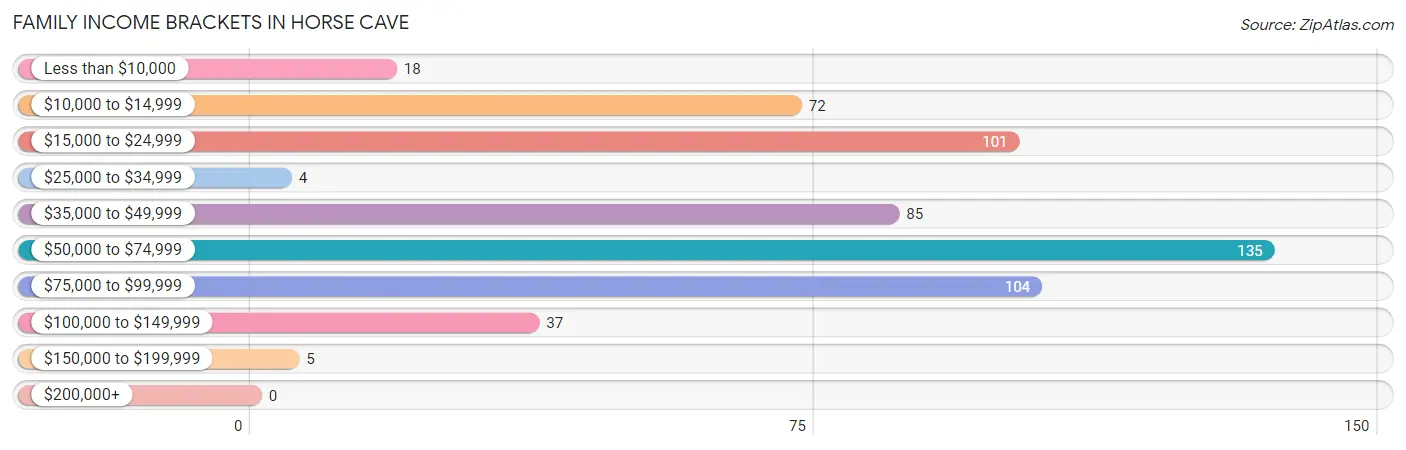
| Income Bracket | # Families | % Families |
| Less than $10,000 | 18 | 3.2% |
| $10,000 to $14,999 | 72 | 12.8% |
| $15,000 to $24,999 | 101 | 18.0% |
| $25,000 to $34,999 | 4 | 0.7% |
| $35,000 to $49,999 | 85 | 15.2% |
| $50,000 to $74,999 | 135 | 24.1% |
| $75,000 to $99,999 | 104 | 18.5% |
| $100,000 to $149,999 | 37 | 6.6% |
| $150,000 to $199,999 | 5 | 0.9% |
| $200,000+ | 0 | 0.0% |
Family Income by Famaliy Size in Horse Cave
4-person families (74 | 13.2%) account for the highest median family income in Horse Cave with $66,000 per family, while 2-person families (394 | 70.2%) have the highest median income of $24,166 per family member.
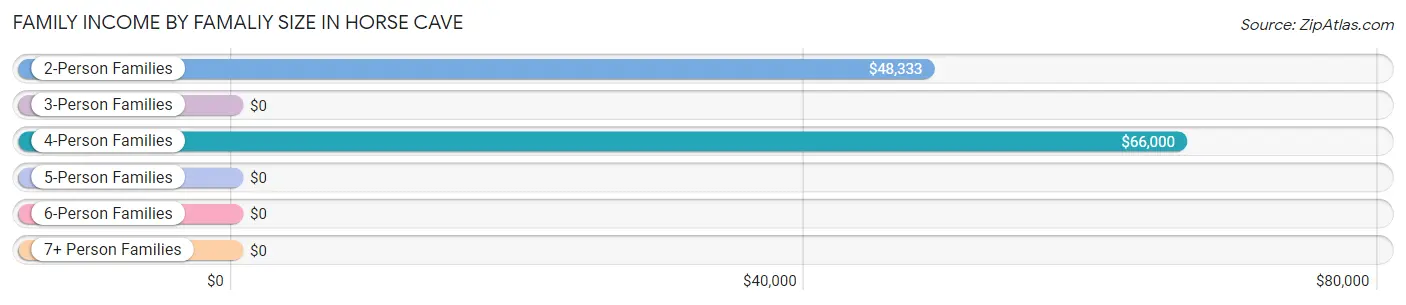
| Income Bracket | # Families | Median Income |
| 2-Person Families | 394 (70.2%) | $48,333 |
| 3-Person Families | 81 (14.4%) | $0 |
| 4-Person Families | 74 (13.2%) | $66,000 |
| 5-Person Families | 12 (2.1%) | $0 |
| 6-Person Families | 0 (0.0%) | $0 |
| 7+ Person Families | 0 (0.0%) | $0 |
| Total | 561 (100.0%) | $50,028 |
Family Income by Number of Earners in Horse Cave
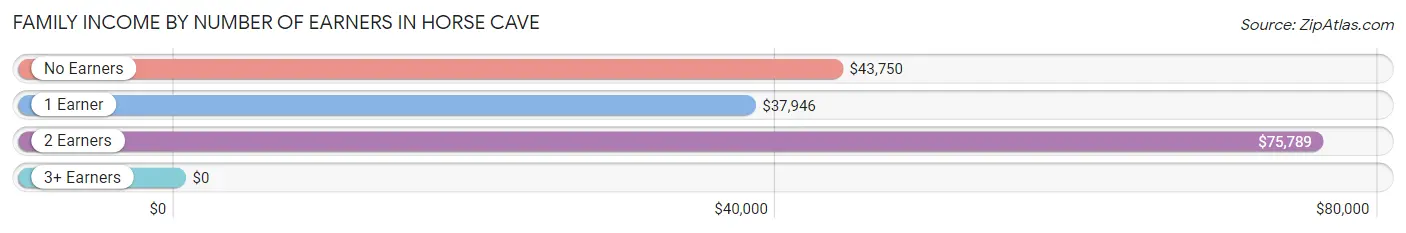
| Number of Earners | # Families | Median Income |
| No Earners | 170 (30.3%) | $43,750 |
| 1 Earner | 257 (45.8%) | $37,946 |
| 2 Earners | 128 (22.8%) | $75,789 |
| 3+ Earners | 6 (1.1%) | $0 |
| Total | 561 (100.0%) | $50,028 |
Household Income in Horse Cave
Household Income Brackets in Horse Cave
With 219 households falling in the category, the $50,000 to $74,999 income range is the most frequent in Horse Cave, accounting for 21.6% of all households.
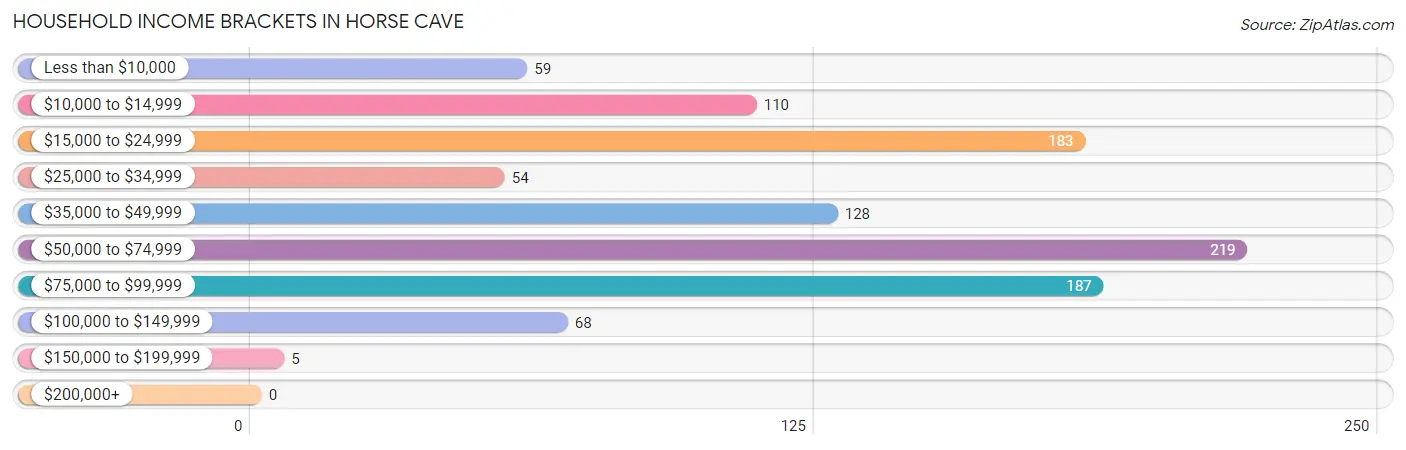
| Income Bracket | # Households | % Households |
| Less than $10,000 | 59 | 5.8% |
| $10,000 to $14,999 | 110 | 10.9% |
| $15,000 to $24,999 | 183 | 18.1% |
| $25,000 to $34,999 | 54 | 5.3% |
| $35,000 to $49,999 | 128 | 12.6% |
| $50,000 to $74,999 | 219 | 21.6% |
| $75,000 to $99,999 | 187 | 18.5% |
| $100,000 to $149,999 | 68 | 6.7% |
| $150,000 to $199,999 | 5 | 0.5% |
| $200,000+ | 0 | 0.0% |
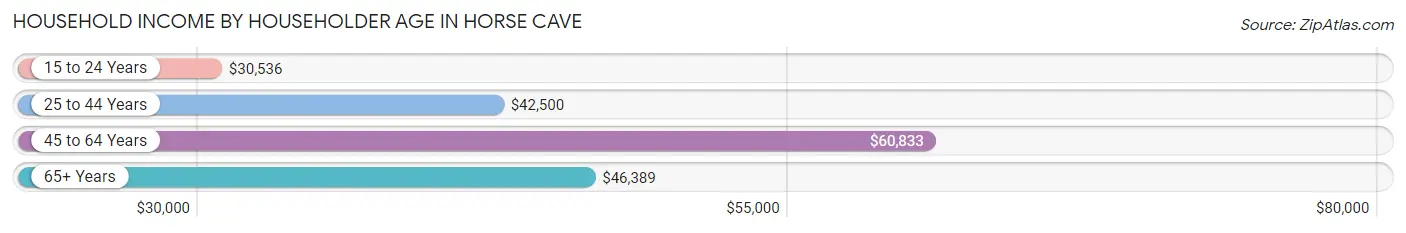
Household Income by Householder Age in Horse Cave
The median household income in Horse Cave is $46,971, with the highest median household income of $60,833 found in the 45 to 64 years age bracket for the primary householder. A total of 360 households (35.5%) fall into this category. Meanwhile, the 15 to 24 years age bracket for the primary householder has the lowest median household income of $30,536, with 19 households (1.9%) in this group.
| Income Bracket | # Households | Median Income |
| 15 to 24 Years | 19 (1.9%) | $30,536 |
| 25 to 44 Years | 404 (39.9%) | $42,500 |
| 45 to 64 Years | 360 (35.5%) | $60,833 |
| 65+ Years | 230 (22.7%) | $46,389 |
| Total | 1,013 (100.0%) | $46,971 |
Poverty in Horse Cave
Income Below Poverty by Sex and Age in Horse Cave
With 35.7% poverty level for males and 32.6% for females among the residents of Horse Cave, 12 to 14 year old males and 5 year old females are the most vulnerable to poverty, with 7 males (100.0%) and 4 females (100.0%) in their respective age groups living below the poverty level.
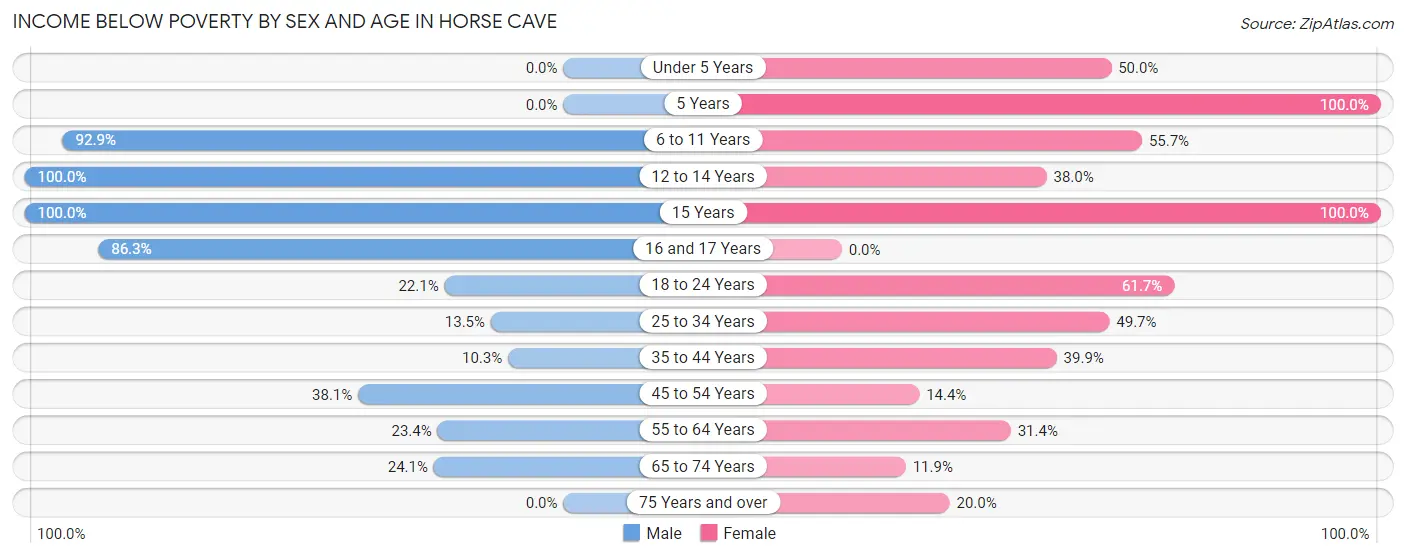
| Age Bracket | Male | Female |
| Under 5 Years | 0 (0.0%) | 22 (50.0%) |
| 5 Years | 0 (0.0%) | 4 (100.0%) |
| 6 to 11 Years | 92 (92.9%) | 39 (55.7%) |
| 12 to 14 Years | 7 (100.0%) | 19 (38.0%) |
| 15 Years | 32 (100.0%) | 4 (100.0%) |
| 16 and 17 Years | 82 (86.3%) | 0 (0.0%) |
| 18 to 24 Years | 15 (22.1%) | 37 (61.7%) |
| 25 to 34 Years | 28 (13.5%) | 76 (49.7%) |
| 35 to 44 Years | 4 (10.3%) | 67 (39.9%) |
| 45 to 54 Years | 32 (38.1%) | 24 (14.4%) |
| 55 to 64 Years | 60 (23.4%) | 37 (31.4%) |
| 65 to 74 Years | 19 (24.0%) | 26 (11.9%) |
| 75 Years and over | 0 (0.0%) | 17 (20.0%) |
| Total | 371 (35.7%) | 372 (32.6%) |
Income Above Poverty by Sex and Age in Horse Cave
According to the poverty statistics in Horse Cave, males aged under 5 years and females aged 65 to 74 years are the age groups that are most secure financially, with 100.0% of males and 88.1% of females in these age groups living above the poverty line.
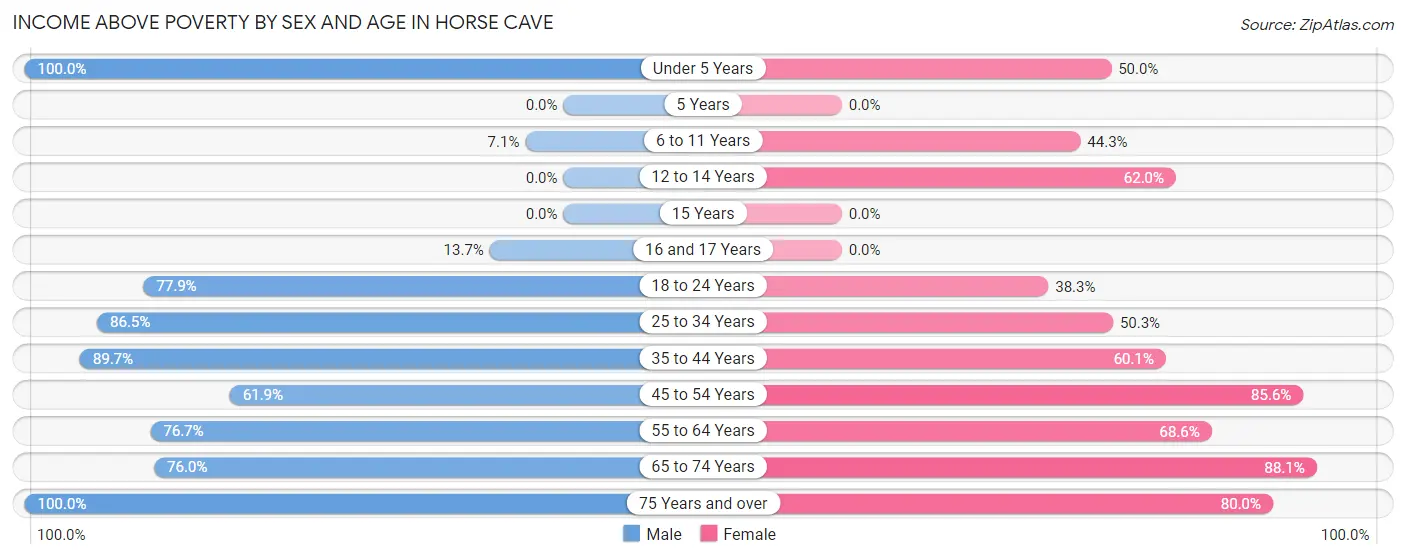
| Age Bracket | Male | Female |
| Under 5 Years | 29 (100.0%) | 22 (50.0%) |
| 5 Years | 0 (0.0%) | 0 (0.0%) |
| 6 to 11 Years | 7 (7.1%) | 31 (44.3%) |
| 12 to 14 Years | 0 (0.0%) | 31 (62.0%) |
| 15 Years | 0 (0.0%) | 0 (0.0%) |
| 16 and 17 Years | 13 (13.7%) | 0 (0.0%) |
| 18 to 24 Years | 53 (77.9%) | 23 (38.3%) |
| 25 to 34 Years | 180 (86.5%) | 77 (50.3%) |
| 35 to 44 Years | 35 (89.7%) | 101 (60.1%) |
| 45 to 54 Years | 52 (61.9%) | 143 (85.6%) |
| 55 to 64 Years | 197 (76.6%) | 81 (68.6%) |
| 65 to 74 Years | 60 (75.9%) | 193 (88.1%) |
| 75 Years and over | 43 (100.0%) | 68 (80.0%) |
| Total | 669 (64.3%) | 770 (67.4%) |
Income Below Poverty Among Married-Couple Families in Horse Cave
The poverty statistics for married-couple families in Horse Cave show that 7.7% or 22 of the total 284 families live below the poverty line. Families with 3 or 4 children have the highest poverty rate of 100.0%, comprising of 6 families. On the other hand, families with no children have the lowest poverty rate of 3.1%, which includes 7 families.
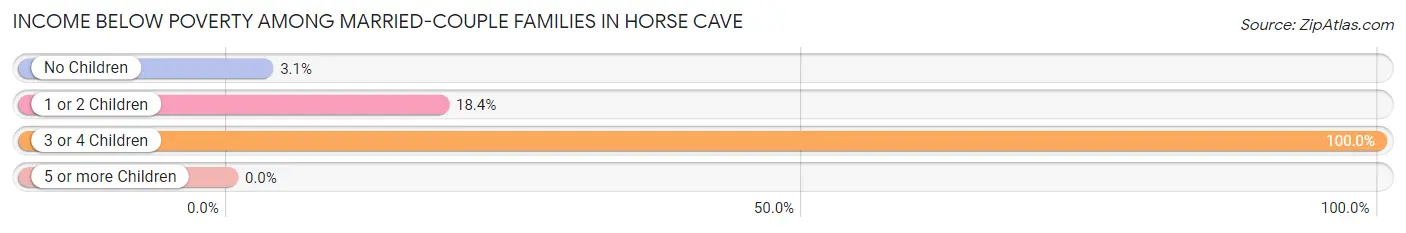
| Children | Above Poverty | Below Poverty |
| No Children | 222 (96.9%) | 7 (3.1%) |
| 1 or 2 Children | 40 (81.6%) | 9 (18.4%) |
| 3 or 4 Children | 0 (0.0%) | 6 (100.0%) |
| 5 or more Children | 0 (0.0%) | 0 (0.0%) |
| Total | 262 (92.2%) | 22 (7.7%) |
Income Below Poverty Among Single-Parent Households in Horse Cave
According to the poverty data in Horse Cave, 45.3% or 29 single-father households and 50.2% or 107 single-mother households are living below the poverty line. Among single-father households, those with no children have the highest poverty rate, with 29 households (100.0%) experiencing poverty. Likewise, among single-mother households, those with 1 or 2 children have the highest poverty rate, with 104 households (69.3%) falling below the poverty line.
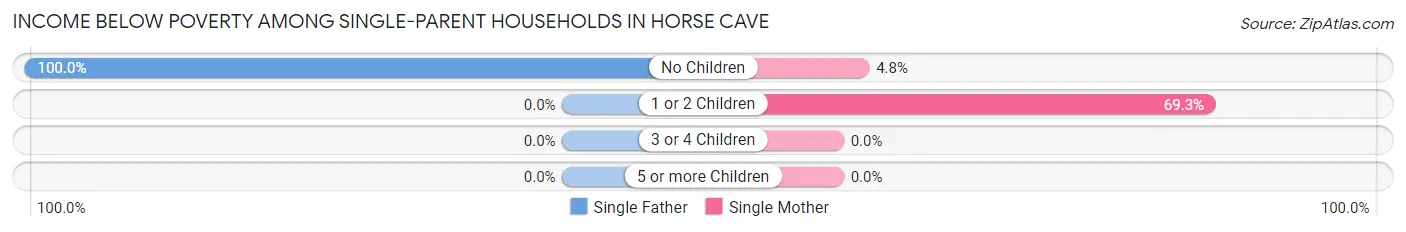
| Children | Single Father | Single Mother |
| No Children | 29 (100.0%) | 3 (4.8%) |
| 1 or 2 Children | 0 (0.0%) | 104 (69.3%) |
| 3 or 4 Children | 0 (0.0%) | 0 (0.0%) |
| 5 or more Children | 0 (0.0%) | 0 (0.0%) |
| Total | 29 (45.3%) | 107 (50.2%) |
Income Below Poverty Among Married-Couple vs Single-Parent Households in Horse Cave
The poverty data for Horse Cave shows that 22 of the married-couple family households (7.7%) and 136 of the single-parent households (49.1%) are living below the poverty level. Within the married-couple family households, those with 3 or 4 children have the highest poverty rate, with 6 households (100.0%) falling below the poverty line. Among the single-parent households, those with 1 or 2 children have the highest poverty rate, with 104 household (56.2%) living below poverty.
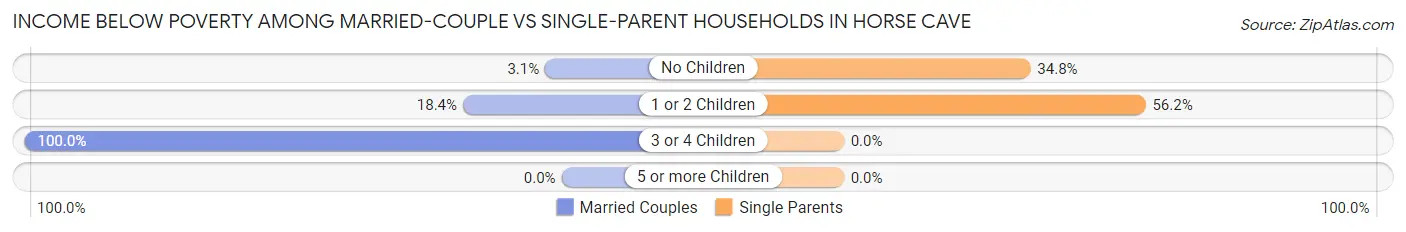
| Children | Married-Couple Families | Single-Parent Households |
| No Children | 7 (3.1%) | 32 (34.8%) |
| 1 or 2 Children | 9 (18.4%) | 104 (56.2%) |
| 3 or 4 Children | 6 (100.0%) | 0 (0.0%) |
| 5 or more Children | 0 (0.0%) | 0 (0.0%) |
| Total | 22 (7.7%) | 136 (49.1%) |
Race in Horse Cave
The most populous races in Horse Cave are White / Caucasian (1,653 | 70.3%), Black / African American (470 | 20.0%), and Two or more Races (211 | 9.0%).
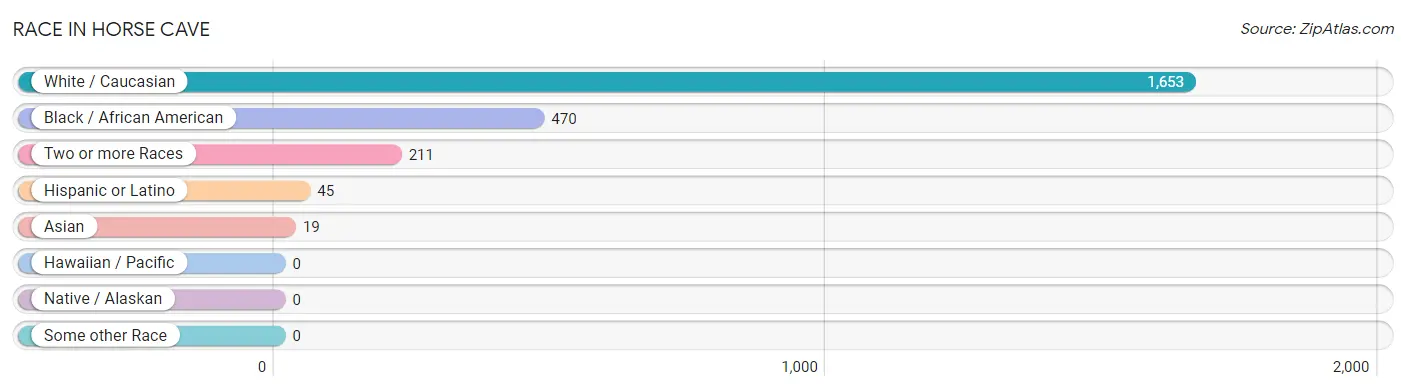
| Race | # Population | % Population |
| Asian | 19 | 0.8% |
| Black / African American | 470 | 20.0% |
| Hawaiian / Pacific | 0 | 0.0% |
| Hispanic or Latino | 45 | 1.9% |
| Native / Alaskan | 0 | 0.0% |
| White / Caucasian | 1,653 | 70.3% |
| Two or more Races | 211 | 9.0% |
| Some other Race | 0 | 0.0% |
| Total | 2,353 | 100.0% |
Ancestry in Horse Cave
The most populous ancestries reported in Horse Cave are American (280 | 11.9%), English (241 | 10.2%), German (181 | 7.7%), Irish (178 | 7.6%), and Puerto Rican (45 | 1.9%), together accounting for 39.3% of all Horse Cave residents.
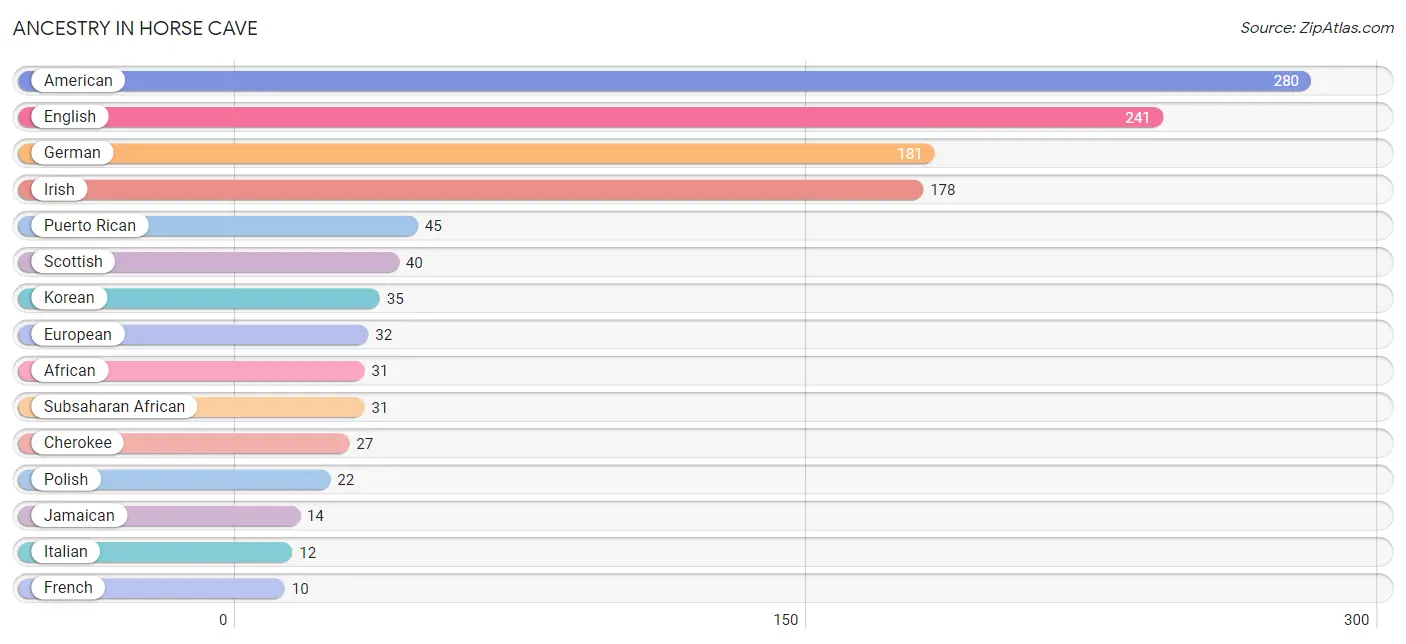
| Ancestry | # Population | % Population |
| African | 31 | 1.3% |
| American | 280 | 11.9% |
| Arab | 5 | 0.2% |
| Cherokee | 27 | 1.1% |
| English | 241 | 10.2% |
| European | 32 | 1.4% |
| French | 10 | 0.4% |
| German | 181 | 7.7% |
| Irish | 178 | 7.6% |
| Israeli | 5 | 0.2% |
| Italian | 12 | 0.5% |
| Jamaican | 14 | 0.6% |
| Korean | 35 | 1.5% |
| Norwegian | 4 | 0.2% |
| Palestinian | 5 | 0.2% |
| Polish | 22 | 0.9% |
| Puerto Rican | 45 | 1.9% |
| Russian | 10 | 0.4% |
| Scotch-Irish | 3 | 0.1% |
| Scottish | 40 | 1.7% |
| Slavic | 5 | 0.2% |
| Subsaharan African | 31 | 1.3% |
| Swiss | 6 | 0.3% |
| Welsh | 8 | 0.3% | View All 24 Rows |
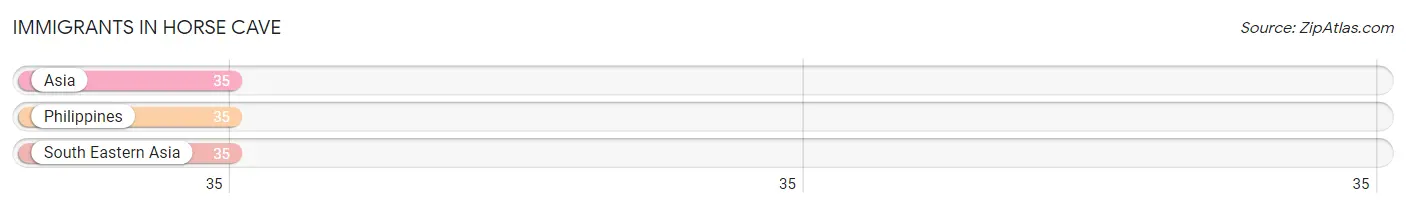
Immigrants in Horse Cave
The most numerous immigrant groups reported in Horse Cave came from Asia (35 | 1.5%), Philippines (35 | 1.5%), and South Eastern Asia (35 | 1.5%), together accounting for 4.5% of all Horse Cave residents.
| Immigration Origin | # Population | % Population |
| Asia | 35 | 1.5% |
| Philippines | 35 | 1.5% |
| South Eastern Asia | 35 | 1.5% | View All 3 Rows |
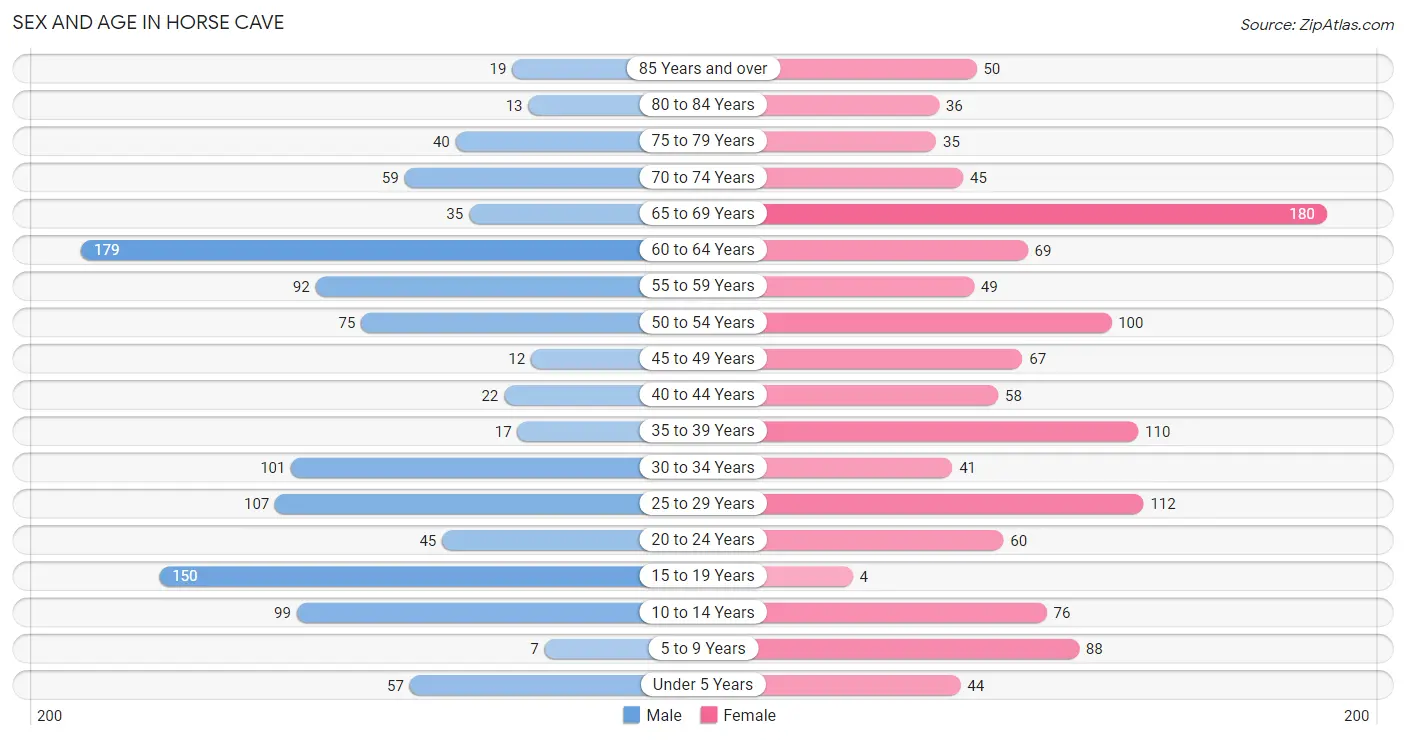
Sex and Age in Horse Cave
Sex and Age in Horse Cave
The most populous age groups in Horse Cave are 60 to 64 Years (179 | 15.9%) for men and 65 to 69 Years (180 | 14.7%) for women.
| Age Bracket | Male | Female |
| Under 5 Years | 57 (5.1%) | 44 (3.6%) |
| 5 to 9 Years | 7 (0.6%) | 88 (7.2%) |
| 10 to 14 Years | 99 (8.8%) | 76 (6.2%) |
| 15 to 19 Years | 150 (13.3%) | 4 (0.3%) |
| 20 to 24 Years | 45 (4.0%) | 60 (4.9%) |
| 25 to 29 Years | 107 (9.5%) | 112 (9.1%) |
| 30 to 34 Years | 101 (8.9%) | 41 (3.4%) |
| 35 to 39 Years | 17 (1.5%) | 110 (9.0%) |
| 40 to 44 Years | 22 (1.9%) | 58 (4.7%) |
| 45 to 49 Years | 12 (1.1%) | 67 (5.5%) |
| 50 to 54 Years | 75 (6.6%) | 100 (8.2%) |
| 55 to 59 Years | 92 (8.2%) | 49 (4.0%) |
| 60 to 64 Years | 179 (15.9%) | 69 (5.6%) |
| 65 to 69 Years | 35 (3.1%) | 180 (14.7%) |
| 70 to 74 Years | 59 (5.2%) | 45 (3.7%) |
| 75 to 79 Years | 40 (3.5%) | 35 (2.9%) |
| 80 to 84 Years | 13 (1.1%) | 36 (2.9%) |
| 85 Years and over | 19 (1.7%) | 50 (4.1%) |
| Total | 1,129 (100.0%) | 1,224 (100.0%) |
Families and Households in Horse Cave
Median Family Size in Horse Cave
The median family size in Horse Cave is 2.67 persons per family, with single female/mother families (213 | 38.0%) accounting for the largest median family size of 2.89 persons per family. On the other hand, single male/father families (64 | 11.4%) represent the smallest median family size with 2.23 persons per family.
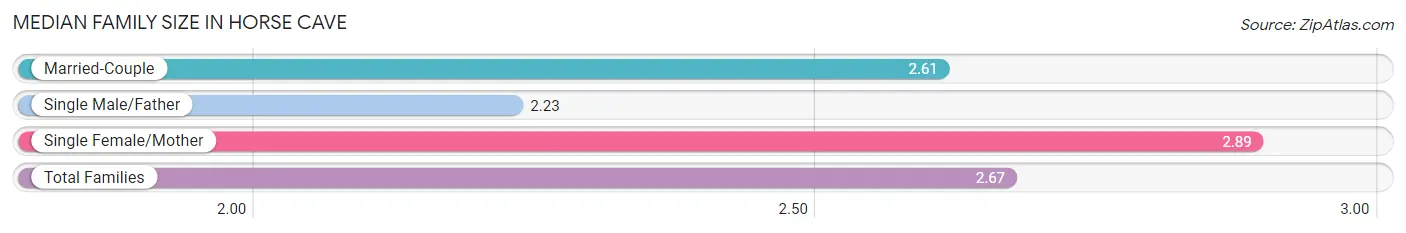
| Family Type | # Families | Family Size |
| Married-Couple | 284 (50.6%) | 2.61 |
| Single Male/Father | 64 (11.4%) | 2.23 |
| Single Female/Mother | 213 (38.0%) | 2.89 |
| Total Families | 561 (100.0%) | 2.67 |
Median Household Size in Horse Cave
The median household size in Horse Cave is 2.22 persons per household, with single female/mother households (213 | 21.0%) accounting for the largest median household size of 3.01 persons per household. non-family households (452 | 44.6%) represent the smallest median household size with 1.56 persons per household.
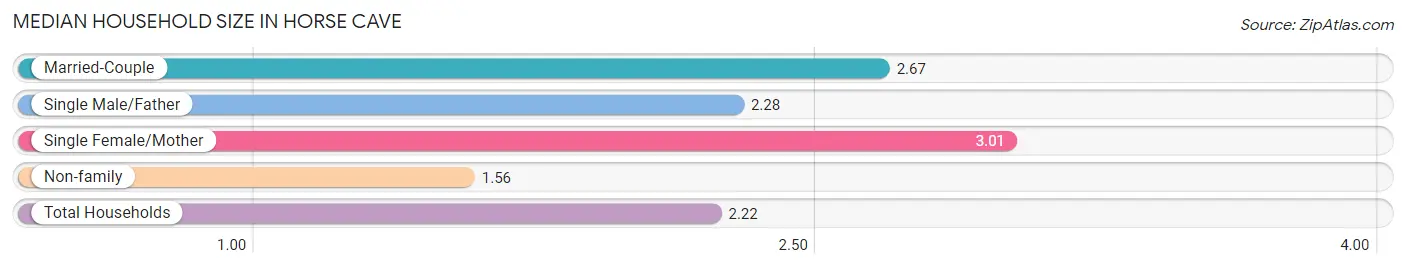
| Household Type | # Households | Household Size |
| Married-Couple | 284 (28.0%) | 2.67 |
| Single Male/Father | 64 (6.3%) | 2.28 |
| Single Female/Mother | 213 (21.0%) | 3.01 |
| Non-family | 452 (44.6%) | 1.56 |
| Total Households | 1,013 (100.0%) | 2.22 |
Household Size by Marriage Status in Horse Cave
Out of a total of 1,013 households in Horse Cave, 561 (55.4%) are family households, while 452 (44.6%) are nonfamily households. The most numerous type of family households are 2-person households, comprising 355, and the most common type of nonfamily households are 1-person households, comprising 258.
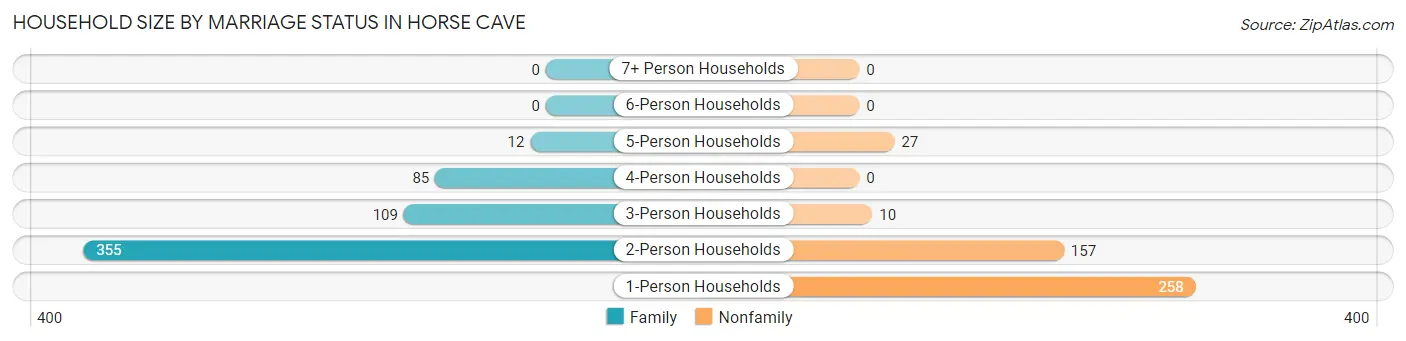
| Household Size | Family Households | Nonfamily Households |
| 1-Person Households | - | 258 (25.5%) |
| 2-Person Households | 355 (35.0%) | 157 (15.5%) |
| 3-Person Households | 109 (10.8%) | 10 (1.0%) |
| 4-Person Households | 85 (8.4%) | 0 (0.0%) |
| 5-Person Households | 12 (1.2%) | 27 (2.7%) |
| 6-Person Households | 0 (0.0%) | 0 (0.0%) |
| 7+ Person Households | 0 (0.0%) | 0 (0.0%) |
| Total | 561 (55.4%) | 452 (44.6%) |
Female Fertility in Horse Cave
Fertility by Age in Horse Cave
Average fertility rate in Horse Cave is 38.0 births per 1,000 women. Women in the age bracket of 20 to 34 years have the highest fertility rate with 85.0 births per 1,000 women. Women in the age bracket of 20 to 34 years acount for 100.0% of all women with births.
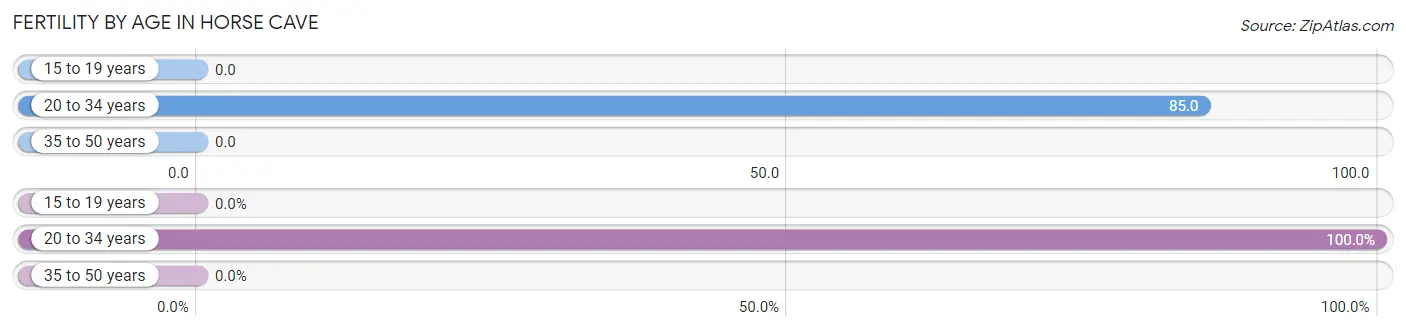
| Age Bracket | Women with Births | Births / 1,000 Women |
| 15 to 19 years | 0 (0.0%) | 0.0 |
| 20 to 34 years | 18 (100.0%) | 85.0 |
| 35 to 50 years | 0 (0.0%) | 0.0 |
| Total | 18 (100.0%) | 38.0 |
Fertility by Age by Marriage Status in Horse Cave
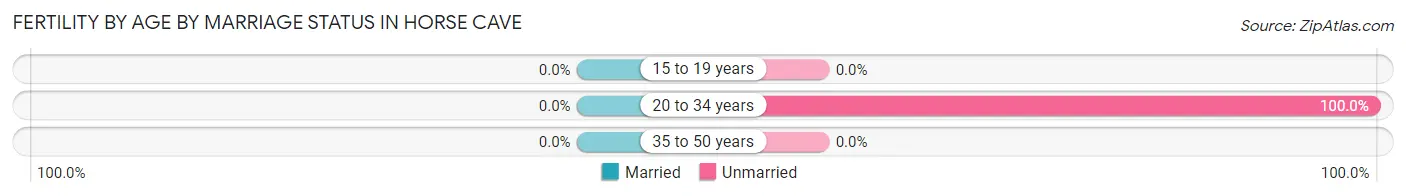
| Age Bracket | Married | Unmarried |
| 15 to 19 years | 0 (0.0%) | 0 (0.0%) |
| 20 to 34 years | 0 (0.0%) | 18 (100.0%) |
| 35 to 50 years | 0 (0.0%) | 0 (0.0%) |
| Total | 0 (0.0%) | 18 (100.0%) |
Fertility by Education in Horse Cave
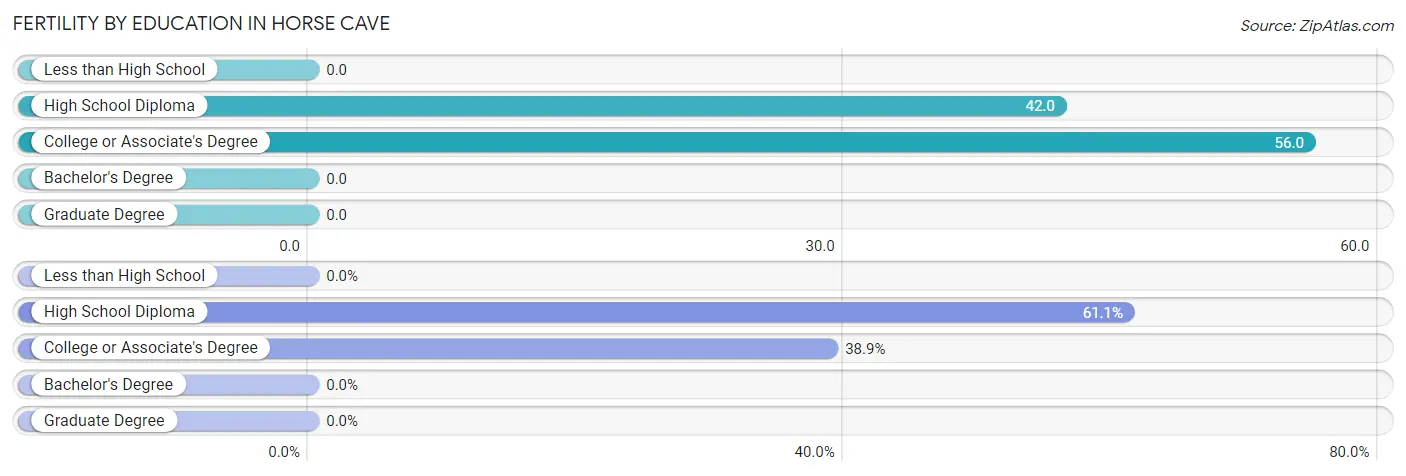
| Educational Attainment | Women with Births | Births / 1,000 Women |
| Less than High School | 0 (0.0%) | 0.0 |
| High School Diploma | 11 (61.1%) | 42.0 |
| College or Associate's Degree | 7 (38.9%) | 56.0 |
| Bachelor's Degree | 0 (0.0%) | 0.0 |
| Graduate Degree | 0 (0.0%) | 0.0 |
| Total | 18 (100.0%) | 38.0 |
Fertility by Education by Marriage Status in Horse Cave
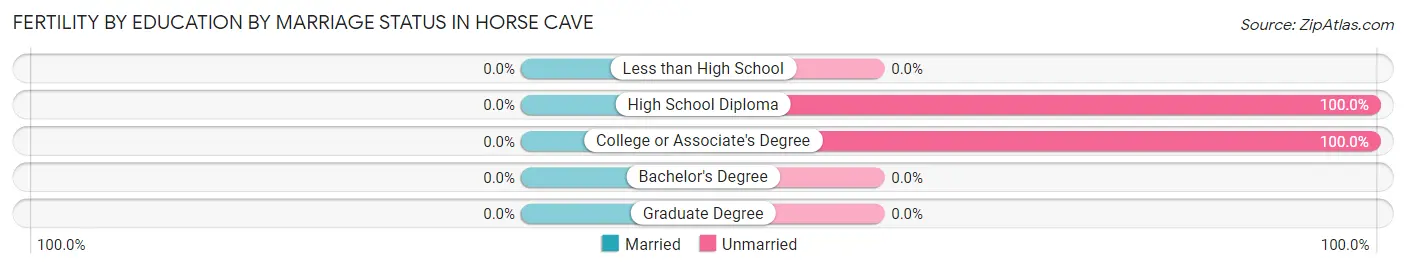
| Educational Attainment | Married | Unmarried |
| Less than High School | 0 (0.0%) | 0 (0.0%) |
| High School Diploma | 0 (0.0%) | 11 (100.0%) |
| College or Associate's Degree | 0 (0.0%) | 7 (100.0%) |
| Bachelor's Degree | 0 (0.0%) | 0 (0.0%) |
| Graduate Degree | 0 (0.0%) | 0 (0.0%) |
| Total | 0 (0.0%) | 18 (100.0%) |
Employment Characteristics in Horse Cave
Employment by Class of Employer in Horse Cave
Among the 715 employed individuals in Horse Cave, private company employees (523 | 73.2%), not-for-profit organizations (65 | 9.1%), and state government employees (49 | 6.9%) make up the most common classes of employment.
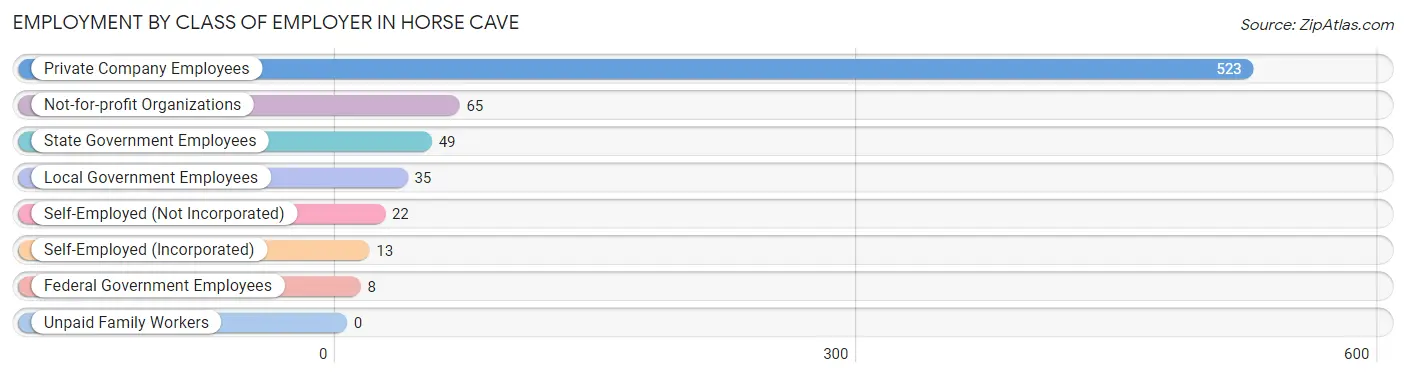
| Employer Class | # Employees | % Employees |
| Private Company Employees | 523 | 73.2% |
| Self-Employed (Incorporated) | 13 | 1.8% |
| Self-Employed (Not Incorporated) | 22 | 3.1% |
| Not-for-profit Organizations | 65 | 9.1% |
| Local Government Employees | 35 | 4.9% |
| State Government Employees | 49 | 6.9% |
| Federal Government Employees | 8 | 1.1% |
| Unpaid Family Workers | 0 | 0.0% |
| Total | 715 | 100.0% |
Employment Status by Age in Horse Cave
According to the labor force statistics for Horse Cave, out of the total population over 16 years of age (1,946), 40.8% or 794 individuals are in the labor force, with 7.8% or 62 of them unemployed. The age group with the highest labor force participation rate is 30 to 34 years, with 91.5% or 130 individuals in the labor force. Within the labor force, the 20 to 24 years age range has the highest percentage of unemployed individuals, with 25.5% or 24 of them being unemployed.
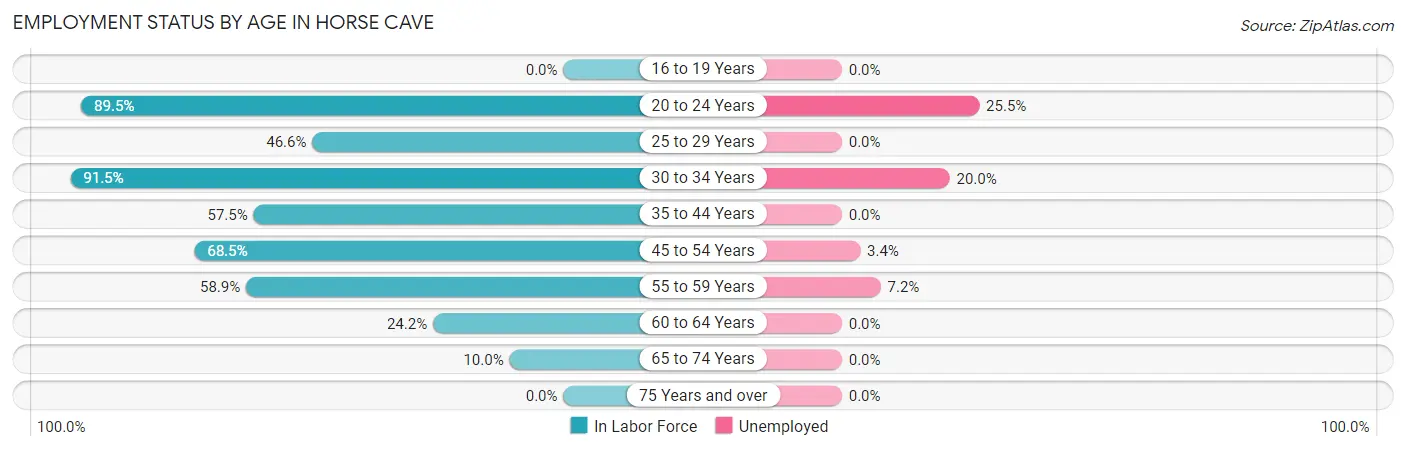
| Age Bracket | In Labor Force | Unemployed |
| 16 to 19 Years | 0 (0.0%) | 0 (0.0%) |
| 20 to 24 Years | 94 (89.5%) | 24 (25.5%) |
| 25 to 29 Years | 102 (46.6%) | 0 (0.0%) |
| 30 to 34 Years | 130 (91.5%) | 26 (20.0%) |
| 35 to 44 Years | 119 (57.5%) | 0 (0.0%) |
| 45 to 54 Years | 174 (68.5%) | 6 (3.4%) |
| 55 to 59 Years | 83 (58.9%) | 6 (7.2%) |
| 60 to 64 Years | 60 (24.2%) | 0 (0.0%) |
| 65 to 74 Years | 32 (10.0%) | 0 (0.0%) |
| 75 Years and over | 0 (0.0%) | 0 (0.0%) |
| Total | 794 (40.8%) | 62 (7.8%) |
Employment Status by Educational Attainment in Horse Cave
According to labor force statistics for Horse Cave, 55.2% of individuals (668) out of the total population between 25 and 64 years of age (1,211) are in the labor force, with 5.7% or 38 of them being unemployed. The group with the highest labor force participation rate are those with the educational attainment of college / associate degree, with 91.1% or 236 individuals in the labor force. Within the labor force, individuals with less than high school education have the highest percentage of unemployment, with 25.0% or 17 of them being unemployed.
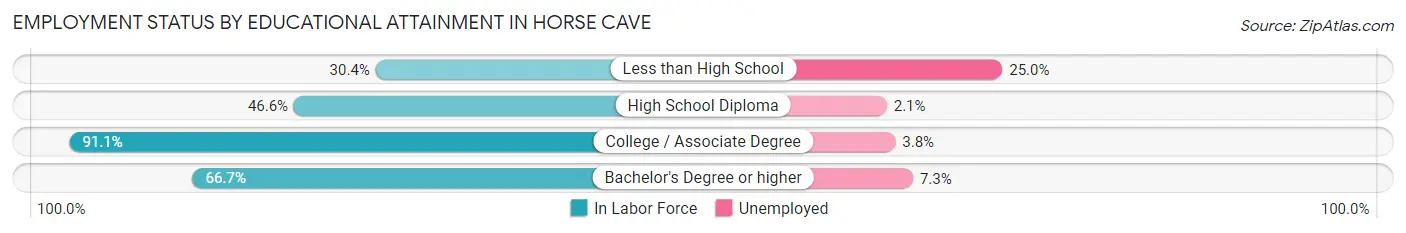
| Educational Attainment | In Labor Force | Unemployed |
| Less than High School | 68 (30.4%) | 56 (25.0%) |
| High School Diploma | 282 (46.6%) | 13 (2.1%) |
| College / Associate Degree | 236 (91.1%) | 10 (3.8%) |
| Bachelor's Degree or higher | 82 (66.7%) | 9 (7.3%) |
| Total | 668 (55.2%) | 69 (5.7%) |
Employment Occupations by Sex in Horse Cave
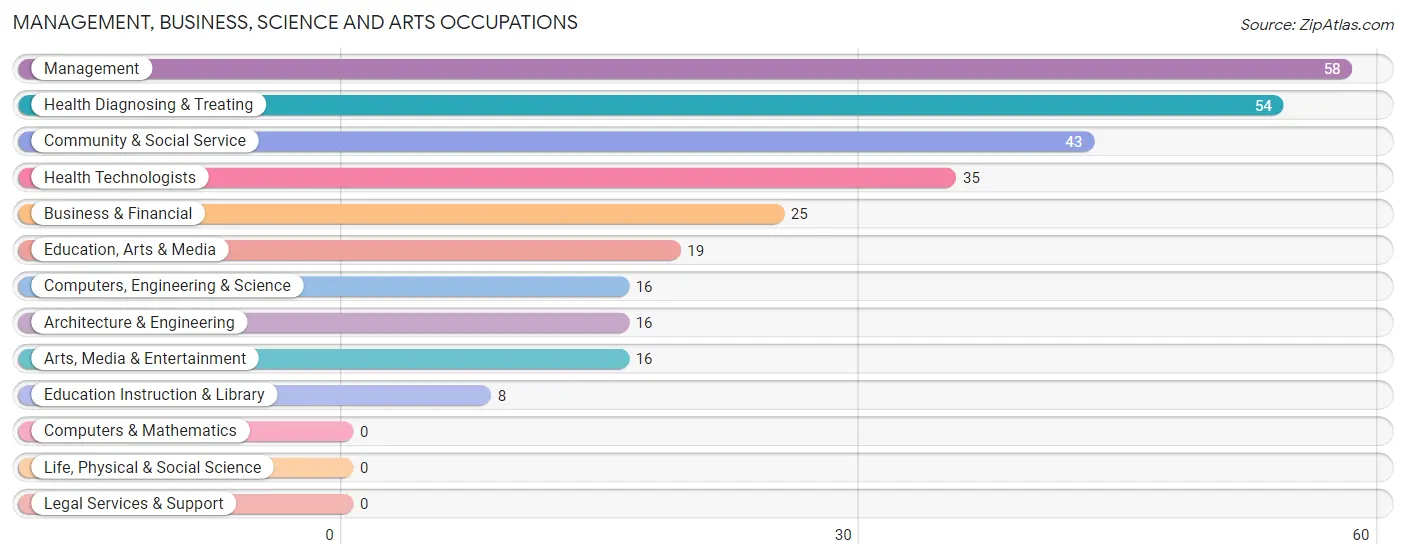
Management, Business, Science and Arts Occupations
The most common Management, Business, Science and Arts occupations in Horse Cave are Management (58 | 7.9%), Health Diagnosing & Treating (54 | 7.4%), Community & Social Service (43 | 5.9%), Health Technologists (35 | 4.8%), and Business & Financial (25 | 3.4%).
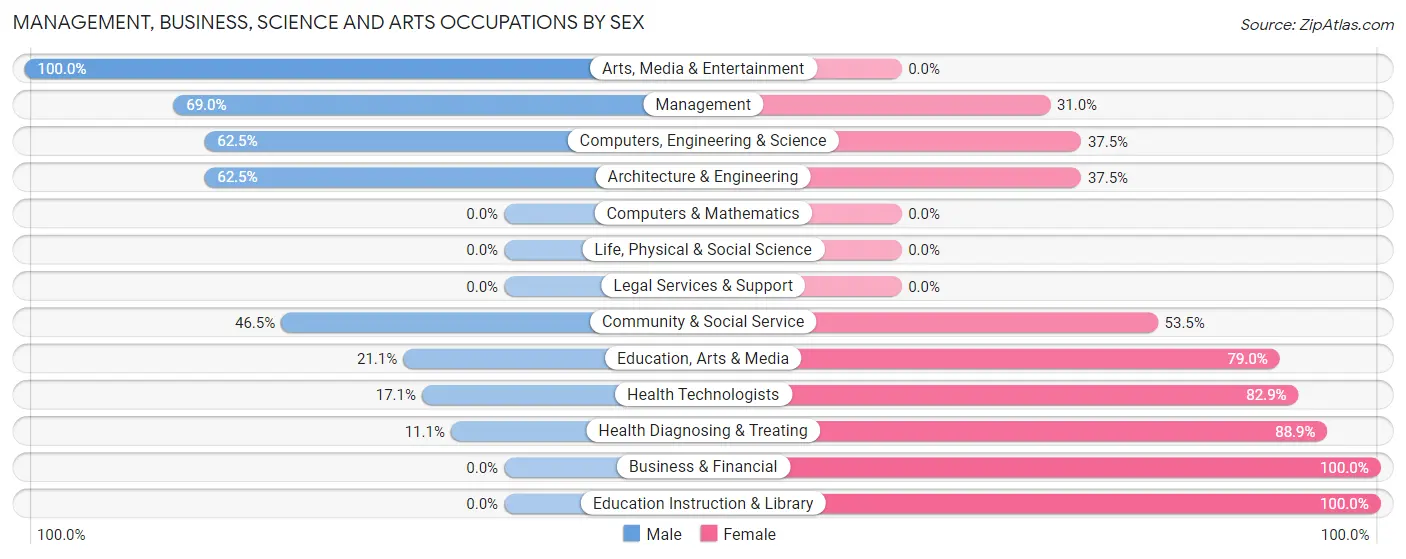
Management, Business, Science and Arts Occupations by Sex
Within the Management, Business, Science and Arts occupations in Horse Cave, the most male-oriented occupations are Arts, Media & Entertainment (100.0%), Management (69.0%), and Computers, Engineering & Science (62.5%), while the most female-oriented occupations are Business & Financial (100.0%), Education Instruction & Library (100.0%), and Health Diagnosing & Treating (88.9%).
| Occupation | Male | Female |
| Management | 40 (69.0%) | 18 (31.0%) |
| Business & Financial | 0 (0.0%) | 25 (100.0%) |
| Computers, Engineering & Science | 10 (62.5%) | 6 (37.5%) |
| Computers & Mathematics | 0 (0.0%) | 0 (0.0%) |
| Architecture & Engineering | 10 (62.5%) | 6 (37.5%) |
| Life, Physical & Social Science | 0 (0.0%) | 0 (0.0%) |
| Community & Social Service | 20 (46.5%) | 23 (53.5%) |
| Education, Arts & Media | 4 (21.0%) | 15 (78.9%) |
| Legal Services & Support | 0 (0.0%) | 0 (0.0%) |
| Education Instruction & Library | 0 (0.0%) | 8 (100.0%) |
| Arts, Media & Entertainment | 16 (100.0%) | 0 (0.0%) |
| Health Diagnosing & Treating | 6 (11.1%) | 48 (88.9%) |
| Health Technologists | 6 (17.1%) | 29 (82.9%) |
| Total (Category) | 76 (38.8%) | 120 (61.2%) |
| Total (Overall) | 354 (48.4%) | 378 (51.6%) |
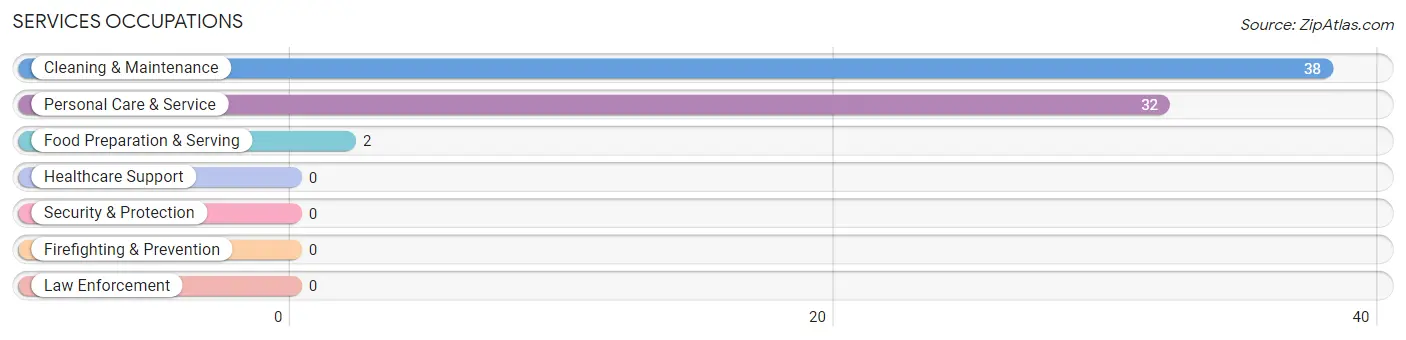
Services Occupations
The most common Services occupations in Horse Cave are Cleaning & Maintenance (38 | 5.2%), Personal Care & Service (32 | 4.4%), and Food Preparation & Serving (2 | 0.3%).
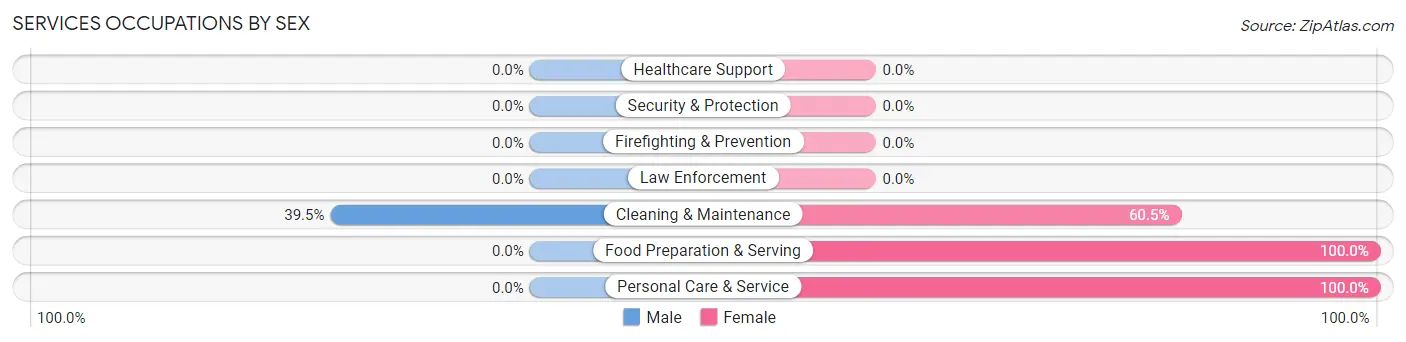
Services Occupations by Sex
| Occupation | Male | Female |
| Healthcare Support | 0 (0.0%) | 0 (0.0%) |
| Security & Protection | 0 (0.0%) | 0 (0.0%) |
| Firefighting & Prevention | 0 (0.0%) | 0 (0.0%) |
| Law Enforcement | 0 (0.0%) | 0 (0.0%) |
| Food Preparation & Serving | 0 (0.0%) | 2 (100.0%) |
| Cleaning & Maintenance | 15 (39.5%) | 23 (60.5%) |
| Personal Care & Service | 0 (0.0%) | 32 (100.0%) |
| Total (Category) | 15 (20.8%) | 57 (79.2%) |
| Total (Overall) | 354 (48.4%) | 378 (51.6%) |
Sales and Office Occupations
The most common Sales and Office occupations in Horse Cave are Office & Administration (101 | 13.8%), and Sales & Related (31 | 4.2%).
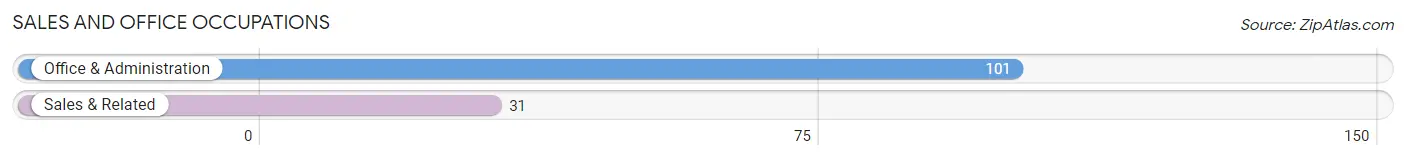
Sales and Office Occupations by Sex
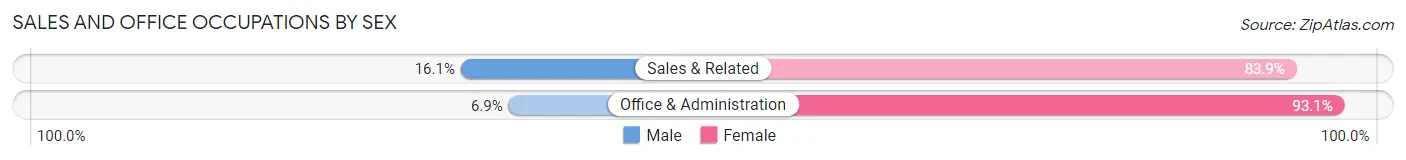
| Occupation | Male | Female |
| Sales & Related | 5 (16.1%) | 26 (83.9%) |
| Office & Administration | 7 (6.9%) | 94 (93.1%) |
| Total (Category) | 12 (9.1%) | 120 (90.9%) |
| Total (Overall) | 354 (48.4%) | 378 (51.6%) |
Natural Resources, Construction and Maintenance Occupations
The most common Natural Resources, Construction and Maintenance occupations in Horse Cave are Installation, Maintenance & Repair (44 | 6.0%), and Construction & Extraction (13 | 1.8%).
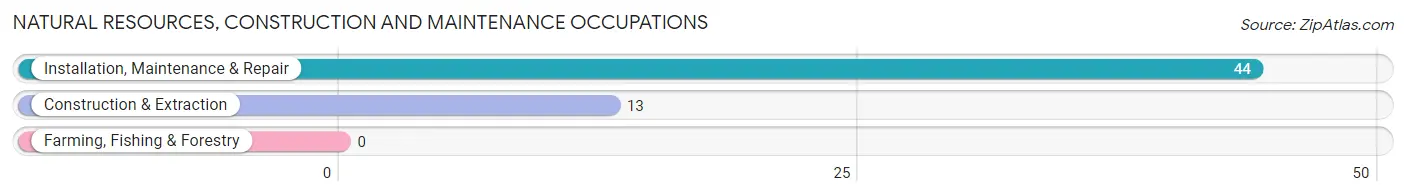
Natural Resources, Construction and Maintenance Occupations by Sex
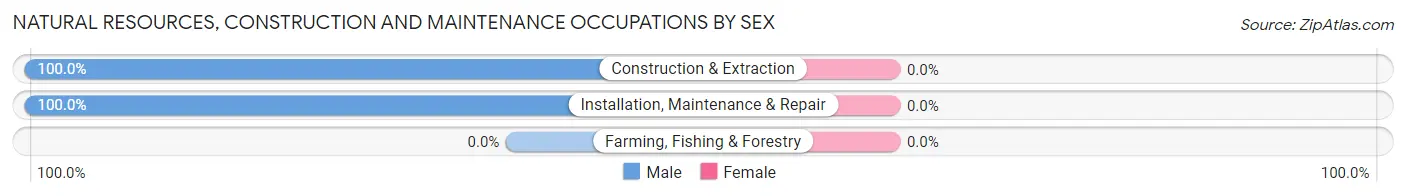
| Occupation | Male | Female |
| Farming, Fishing & Forestry | 0 (0.0%) | 0 (0.0%) |
| Construction & Extraction | 13 (100.0%) | 0 (0.0%) |
| Installation, Maintenance & Repair | 44 (100.0%) | 0 (0.0%) |
| Total (Category) | 57 (100.0%) | 0 (0.0%) |
| Total (Overall) | 354 (48.4%) | 378 (51.6%) |
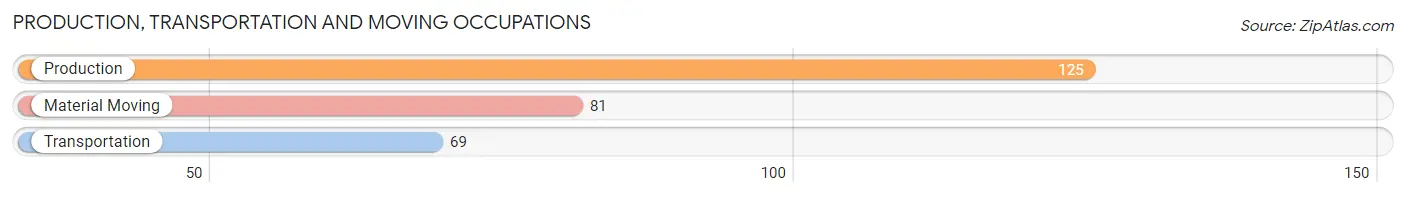
Production, Transportation and Moving Occupations
The most common Production, Transportation and Moving occupations in Horse Cave are Production (125 | 17.1%), Material Moving (81 | 11.1%), and Transportation (69 | 9.4%).
Production, Transportation and Moving Occupations by Sex
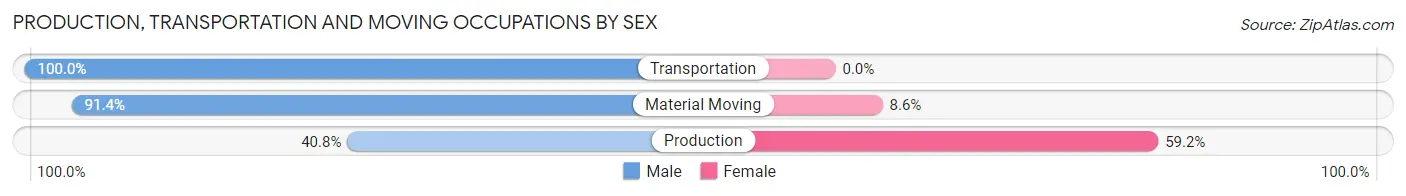
| Occupation | Male | Female |
| Production | 51 (40.8%) | 74 (59.2%) |
| Transportation | 69 (100.0%) | 0 (0.0%) |
| Material Moving | 74 (91.4%) | 7 (8.6%) |
| Total (Category) | 194 (70.6%) | 81 (29.4%) |
| Total (Overall) | 354 (48.4%) | 378 (51.6%) |
Employment Industries by Sex in Horse Cave
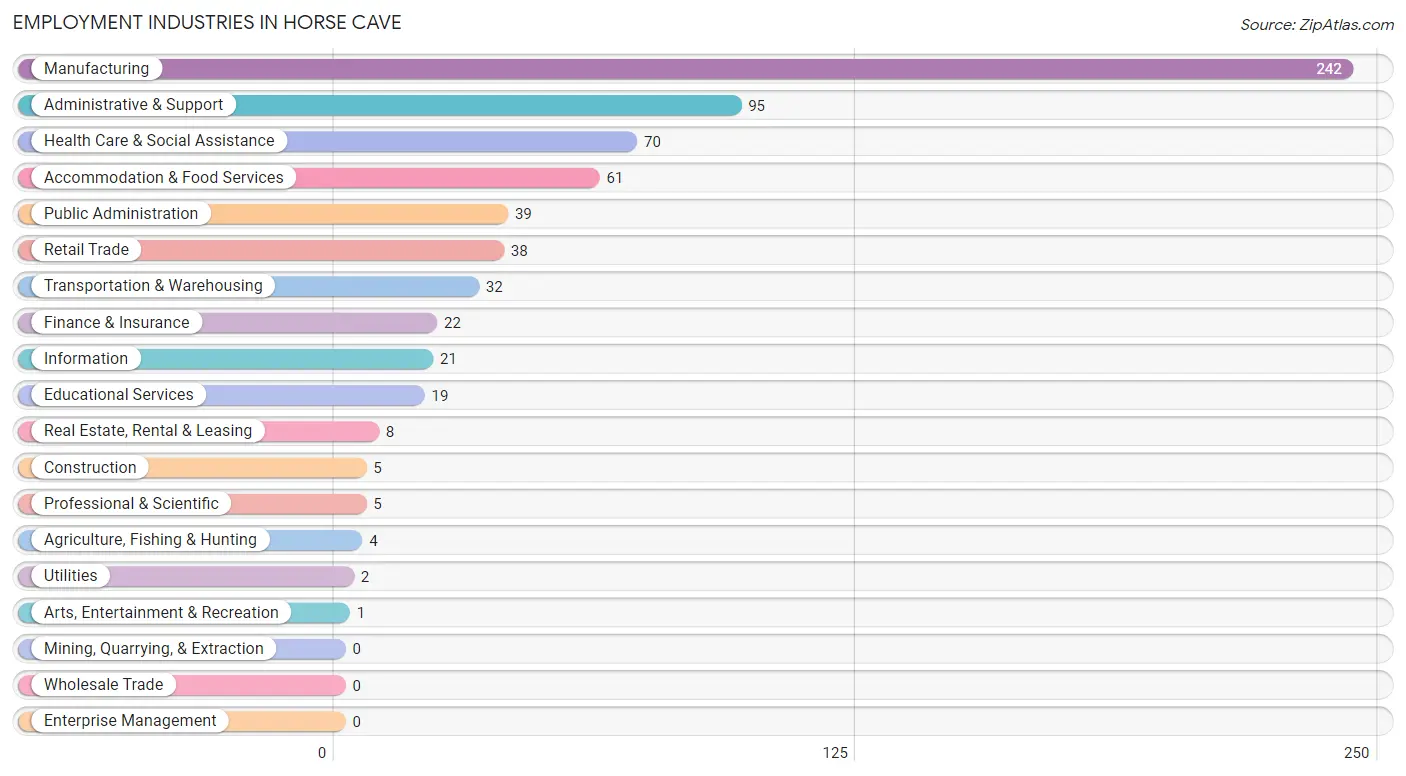
Employment Industries in Horse Cave
The major employment industries in Horse Cave include Manufacturing (242 | 33.1%), Administrative & Support (95 | 13.0%), Health Care & Social Assistance (70 | 9.6%), Accommodation & Food Services (61 | 8.3%), and Public Administration (39 | 5.3%).
Employment Industries by Sex in Horse Cave
The Horse Cave industries that see more men than women are Agriculture, Fishing & Hunting (100.0%), Construction (100.0%), and Transportation & Warehousing (100.0%), whereas the industries that tend to have a higher number of women are Utilities (100.0%), Information (100.0%), and Finance & Insurance (100.0%).
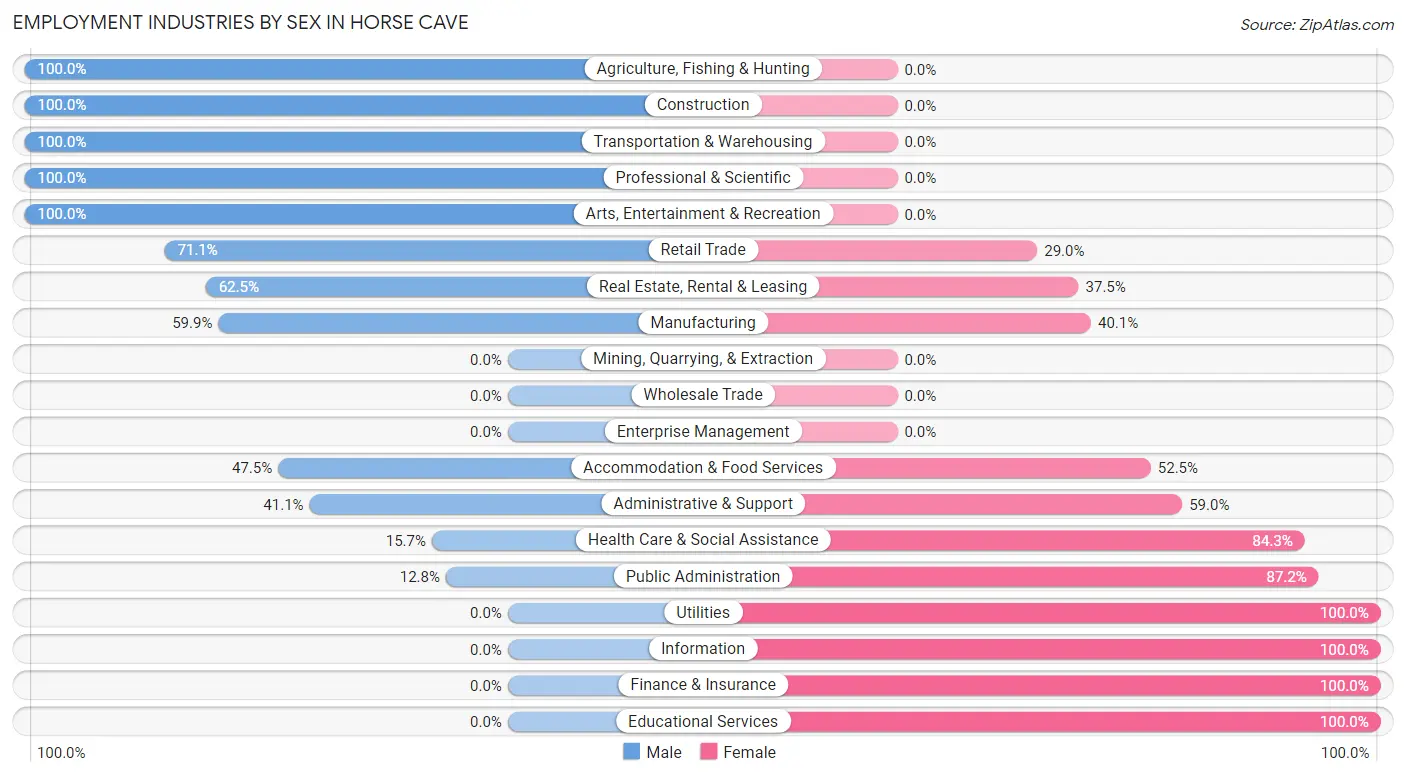
| Industry | Male | Female |
| Agriculture, Fishing & Hunting | 4 (100.0%) | 0 (0.0%) |
| Mining, Quarrying, & Extraction | 0 (0.0%) | 0 (0.0%) |
| Construction | 5 (100.0%) | 0 (0.0%) |
| Manufacturing | 145 (59.9%) | 97 (40.1%) |
| Wholesale Trade | 0 (0.0%) | 0 (0.0%) |
| Retail Trade | 27 (71.1%) | 11 (28.9%) |
| Transportation & Warehousing | 32 (100.0%) | 0 (0.0%) |
| Utilities | 0 (0.0%) | 2 (100.0%) |
| Information | 0 (0.0%) | 21 (100.0%) |
| Finance & Insurance | 0 (0.0%) | 22 (100.0%) |
| Real Estate, Rental & Leasing | 5 (62.5%) | 3 (37.5%) |
| Professional & Scientific | 5 (100.0%) | 0 (0.0%) |
| Enterprise Management | 0 (0.0%) | 0 (0.0%) |
| Administrative & Support | 39 (41.0%) | 56 (59.0%) |
| Educational Services | 0 (0.0%) | 19 (100.0%) |
| Health Care & Social Assistance | 11 (15.7%) | 59 (84.3%) |
| Arts, Entertainment & Recreation | 1 (100.0%) | 0 (0.0%) |
| Accommodation & Food Services | 29 (47.5%) | 32 (52.5%) |
| Public Administration | 5 (12.8%) | 34 (87.2%) |
| Total | 354 (48.4%) | 378 (51.6%) |
Education in Horse Cave
School Enrollment in Horse Cave
The most common levels of schooling among the 455 students in Horse Cave are middle school (154 | 33.9%), high school (152 | 33.4%), and elementary school (64 | 14.1%).
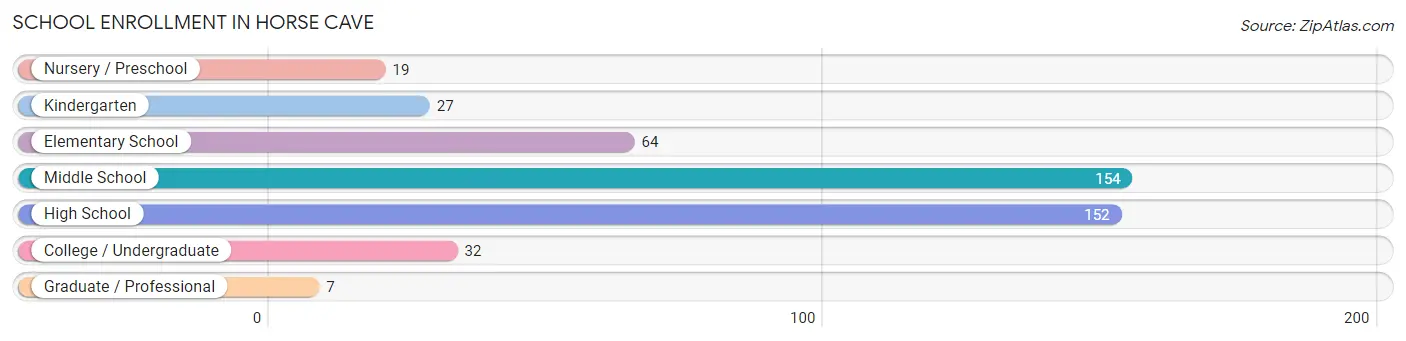
| School Level | # Students | % Students |
| Nursery / Preschool | 19 | 4.2% |
| Kindergarten | 27 | 5.9% |
| Elementary School | 64 | 14.1% |
| Middle School | 154 | 33.9% |
| High School | 152 | 33.4% |
| College / Undergraduate | 32 | 7.0% |
| Graduate / Professional | 7 | 1.5% |
| Total | 455 | 100.0% |
School Enrollment by Age by Funding Source in Horse Cave
Out of a total of 455 students who are enrolled in schools in Horse Cave, 17 (3.7%) attend a private institution, while the remaining 438 (96.3%) are enrolled in public schools. The age group of 18 to 19 year olds has the highest likelihood of being enrolled in private schools, with 7 (41.2% in the age bracket) enrolled. Conversely, the age group of 3 to 4 year olds has the lowest likelihood of being enrolled in a private school, with 15 (100.0% in the age bracket) attending a public institution.
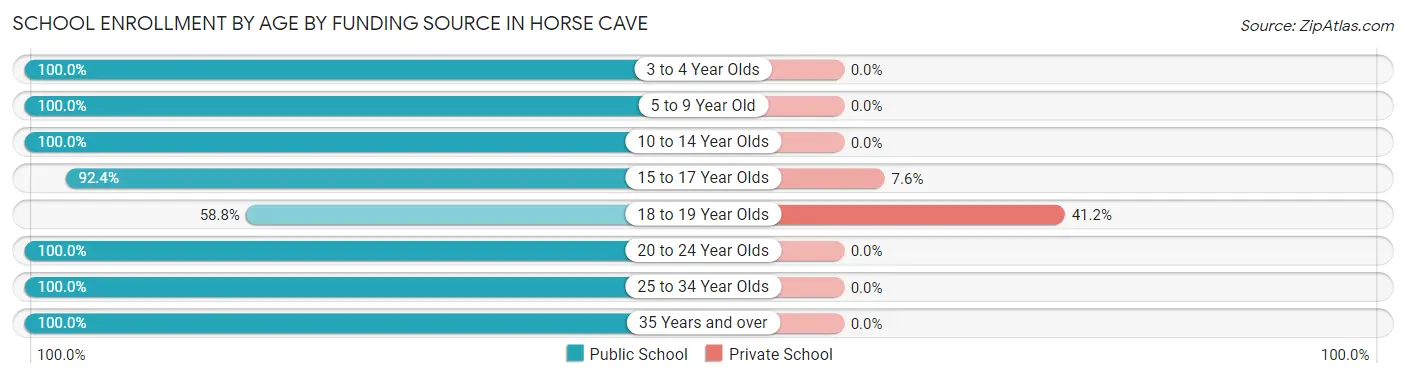
| Age Bracket | Public School | Private School |
| 3 to 4 Year Olds | 15 (100.0%) | 0 (0.0%) |
| 5 to 9 Year Old | 95 (100.0%) | 0 (0.0%) |
| 10 to 14 Year Olds | 168 (100.0%) | 0 (0.0%) |
| 15 to 17 Year Olds | 121 (92.4%) | 10 (7.6%) |
| 18 to 19 Year Olds | 10 (58.8%) | 7 (41.2%) |
| 20 to 24 Year Olds | 12 (100.0%) | 0 (0.0%) |
| 25 to 34 Year Olds | 10 (100.0%) | 0 (0.0%) |
| 35 Years and over | 7 (100.0%) | 0 (0.0%) |
| Total | 438 (96.3%) | 17 (3.7%) |
Educational Attainment by Field of Study in Horse Cave
Education (63 | 39.1%), social sciences (26 | 16.2%), business (18 | 11.2%), visual & performing arts (16 | 9.9%), and psychology (12 | 7.4%) are the most common fields of study among 161 individuals in Horse Cave who have obtained a bachelor's degree or higher.
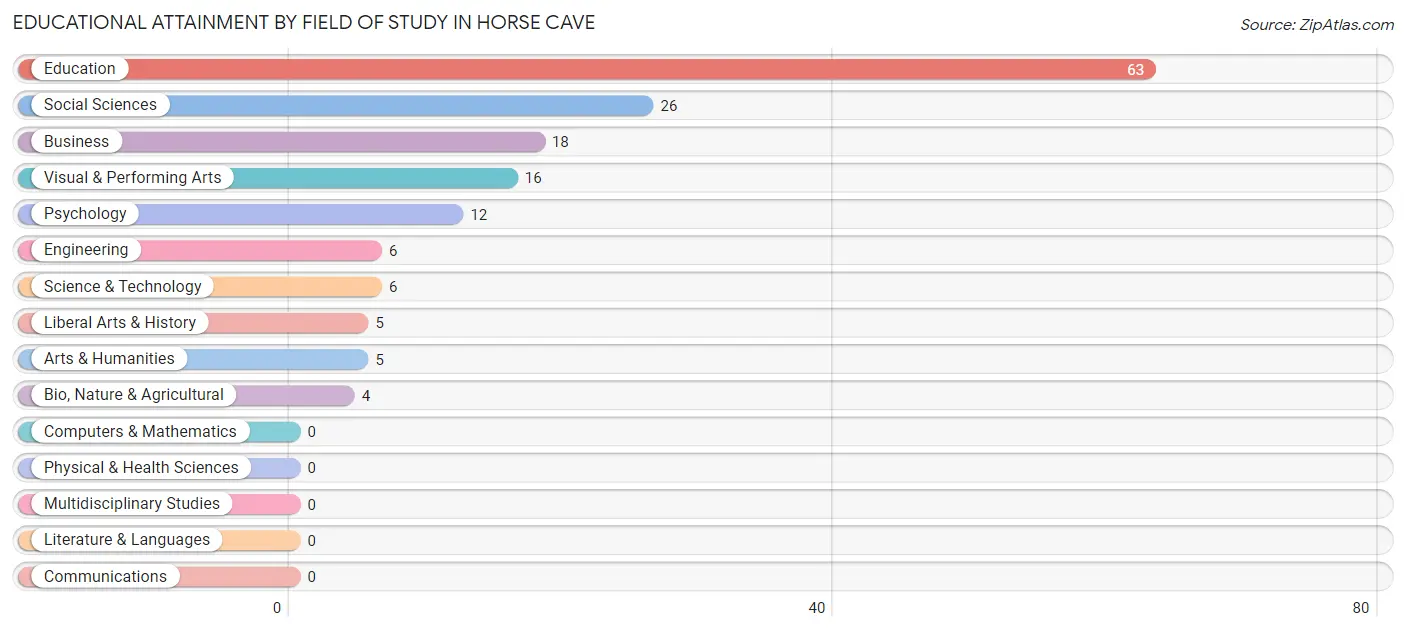
| Field of Study | # Graduates | % Graduates |
| Computers & Mathematics | 0 | 0.0% |
| Bio, Nature & Agricultural | 4 | 2.5% |
| Physical & Health Sciences | 0 | 0.0% |
| Psychology | 12 | 7.4% |
| Social Sciences | 26 | 16.2% |
| Engineering | 6 | 3.7% |
| Multidisciplinary Studies | 0 | 0.0% |
| Science & Technology | 6 | 3.7% |
| Business | 18 | 11.2% |
| Education | 63 | 39.1% |
| Literature & Languages | 0 | 0.0% |
| Liberal Arts & History | 5 | 3.1% |
| Visual & Performing Arts | 16 | 9.9% |
| Communications | 0 | 0.0% |
| Arts & Humanities | 5 | 3.1% |
| Total | 161 | 100.0% |
Transportation & Commute in Horse Cave
Vehicle Availability by Sex in Horse Cave
The most prevalent vehicle ownership categories in Horse Cave are males with 2 vehicles (170, accounting for 49.0%) and females with 2 vehicles (167, making up 46.2%).
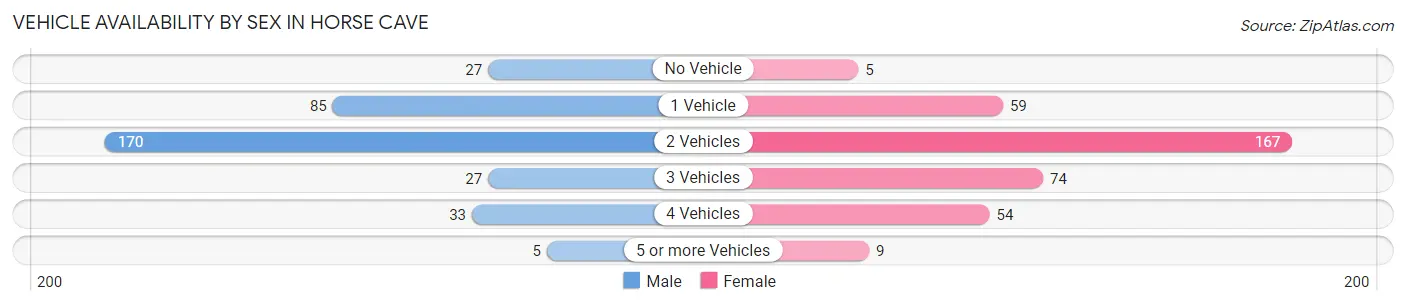
| Vehicles Available | Male | Female |
| No Vehicle | 27 (7.8%) | 5 (1.4%) |
| 1 Vehicle | 85 (24.5%) | 59 (16.0%) |
| 2 Vehicles | 170 (49.0%) | 167 (45.4%) |
| 3 Vehicles | 27 (7.8%) | 74 (20.1%) |
| 4 Vehicles | 33 (9.5%) | 54 (14.7%) |
| 5 or more Vehicles | 5 (1.4%) | 9 (2.5%) |
| Total | 347 (100.0%) | 368 (100.0%) |
Commute Time in Horse Cave
The most frequently occuring commute durations in Horse Cave are 5 to 9 minutes (212 commuters, 30.8%), 10 to 14 minutes (94 commuters, 13.6%), and 15 to 19 minutes (91 commuters, 13.2%).
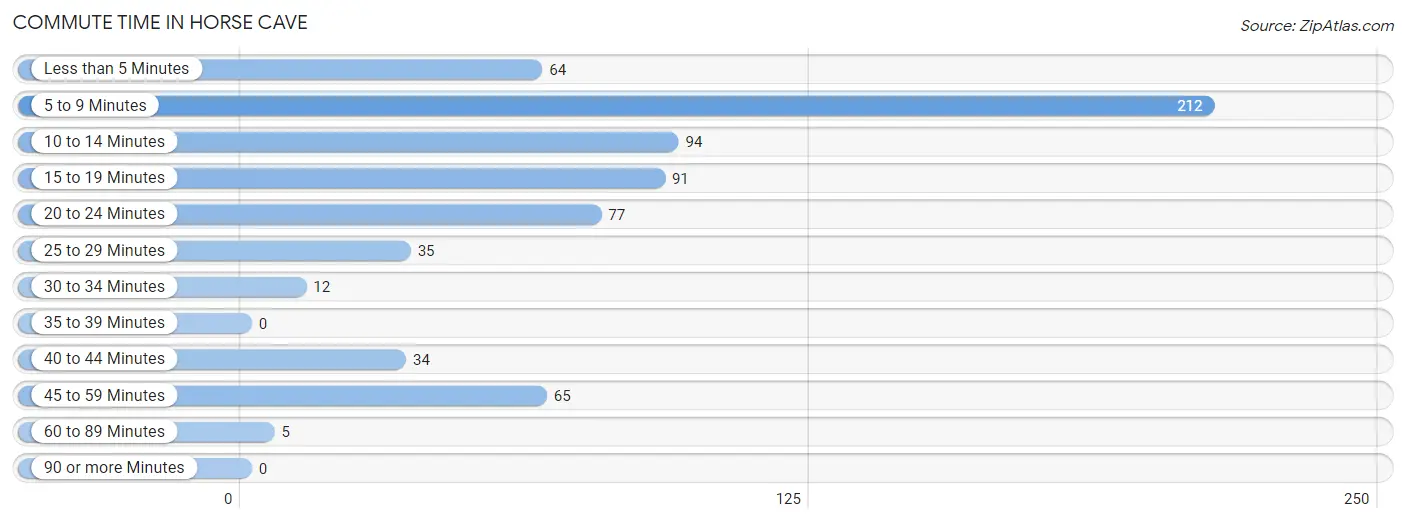
| Commute Time | # Commuters | % Commuters |
| Less than 5 Minutes | 64 | 9.3% |
| 5 to 9 Minutes | 212 | 30.8% |
| 10 to 14 Minutes | 94 | 13.6% |
| 15 to 19 Minutes | 91 | 13.2% |
| 20 to 24 Minutes | 77 | 11.2% |
| 25 to 29 Minutes | 35 | 5.1% |
| 30 to 34 Minutes | 12 | 1.7% |
| 35 to 39 Minutes | 0 | 0.0% |
| 40 to 44 Minutes | 34 | 4.9% |
| 45 to 59 Minutes | 65 | 9.4% |
| 60 to 89 Minutes | 5 | 0.7% |
| 90 or more Minutes | 0 | 0.0% |
Commute Time by Sex in Horse Cave
The most common commute times in Horse Cave are 5 to 9 minutes (73 commuters, 21.0%) for males and 5 to 9 minutes (139 commuters, 40.6%) for females.
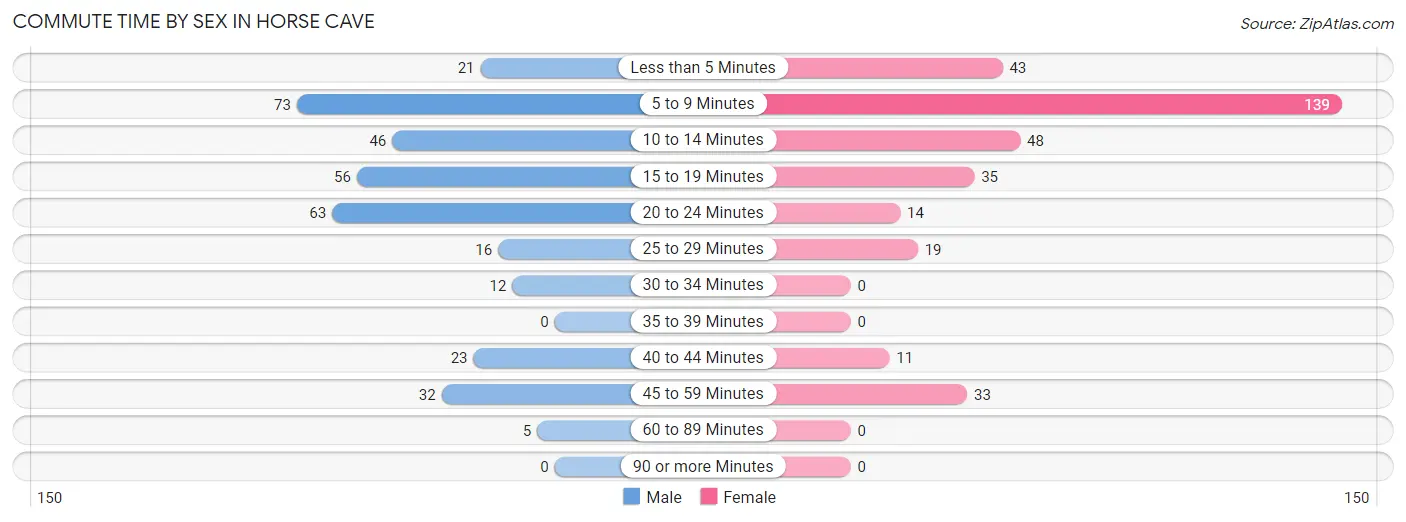
| Commute Time | Male | Female |
| Less than 5 Minutes | 21 (6.0%) | 43 (12.6%) |
| 5 to 9 Minutes | 73 (21.0%) | 139 (40.6%) |
| 10 to 14 Minutes | 46 (13.3%) | 48 (14.0%) |
| 15 to 19 Minutes | 56 (16.1%) | 35 (10.2%) |
| 20 to 24 Minutes | 63 (18.2%) | 14 (4.1%) |
| 25 to 29 Minutes | 16 (4.6%) | 19 (5.6%) |
| 30 to 34 Minutes | 12 (3.5%) | 0 (0.0%) |
| 35 to 39 Minutes | 0 (0.0%) | 0 (0.0%) |
| 40 to 44 Minutes | 23 (6.6%) | 11 (3.2%) |
| 45 to 59 Minutes | 32 (9.2%) | 33 (9.7%) |
| 60 to 89 Minutes | 5 (1.4%) | 0 (0.0%) |
| 90 or more Minutes | 0 (0.0%) | 0 (0.0%) |
Time of Departure to Work by Sex in Horse Cave
The most frequent times of departure to work in Horse Cave are 4:00 PM to 11:59 PM (91, 26.2%) for males and 6:30 AM to 6:59 AM (77, 22.5%) for females.
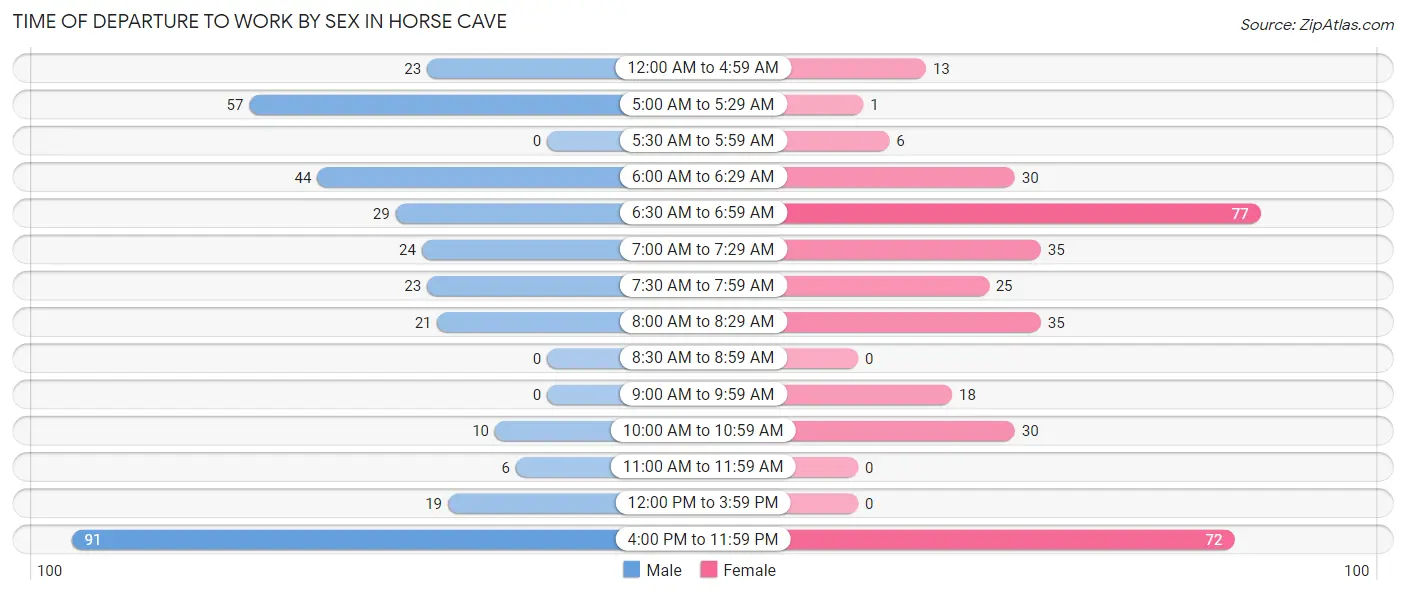
| Time of Departure | Male | Female |
| 12:00 AM to 4:59 AM | 23 (6.6%) | 13 (3.8%) |
| 5:00 AM to 5:29 AM | 57 (16.4%) | 1 (0.3%) |
| 5:30 AM to 5:59 AM | 0 (0.0%) | 6 (1.8%) |
| 6:00 AM to 6:29 AM | 44 (12.7%) | 30 (8.8%) |
| 6:30 AM to 6:59 AM | 29 (8.4%) | 77 (22.5%) |
| 7:00 AM to 7:29 AM | 24 (6.9%) | 35 (10.2%) |
| 7:30 AM to 7:59 AM | 23 (6.6%) | 25 (7.3%) |
| 8:00 AM to 8:29 AM | 21 (6.0%) | 35 (10.2%) |
| 8:30 AM to 8:59 AM | 0 (0.0%) | 0 (0.0%) |
| 9:00 AM to 9:59 AM | 0 (0.0%) | 18 (5.3%) |
| 10:00 AM to 10:59 AM | 10 (2.9%) | 30 (8.8%) |
| 11:00 AM to 11:59 AM | 6 (1.7%) | 0 (0.0%) |
| 12:00 PM to 3:59 PM | 19 (5.5%) | 0 (0.0%) |
| 4:00 PM to 11:59 PM | 91 (26.2%) | 72 (21.0%) |
| Total | 347 (100.0%) | 342 (100.0%) |
Housing Occupancy in Horse Cave
Occupancy by Ownership in Horse Cave
Of the total 1,013 dwellings in Horse Cave, owner-occupied units account for 585 (57.8%), while renter-occupied units make up 428 (42.2%).
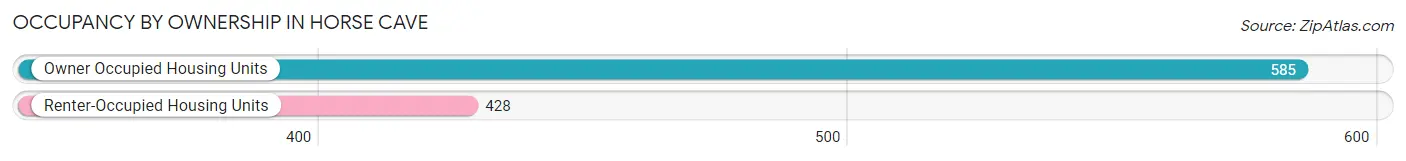
| Occupancy | # Housing Units | % Housing Units |
| Owner Occupied Housing Units | 585 | 57.8% |
| Renter-Occupied Housing Units | 428 | 42.2% |
| Total Occupied Housing Units | 1,013 | 100.0% |
Occupancy by Household Size in Horse Cave
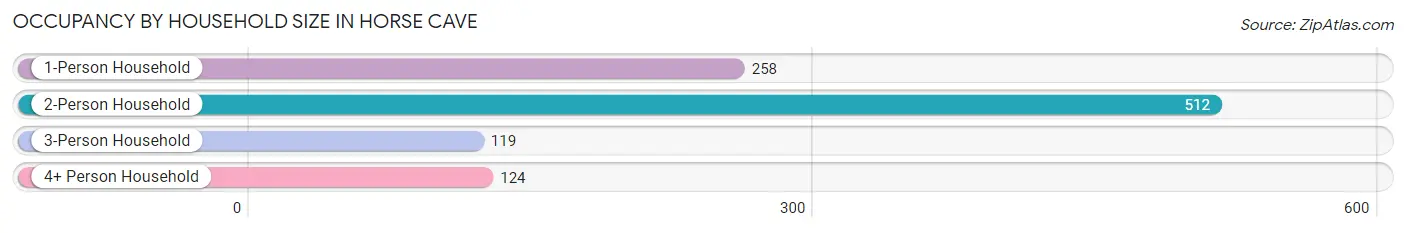
| Household Size | # Housing Units | % Housing Units |
| 1-Person Household | 258 | 25.5% |
| 2-Person Household | 512 | 50.5% |
| 3-Person Household | 119 | 11.7% |
| 4+ Person Household | 124 | 12.2% |
| Total Housing Units | 1,013 | 100.0% |
Occupancy by Ownership by Household Size in Horse Cave
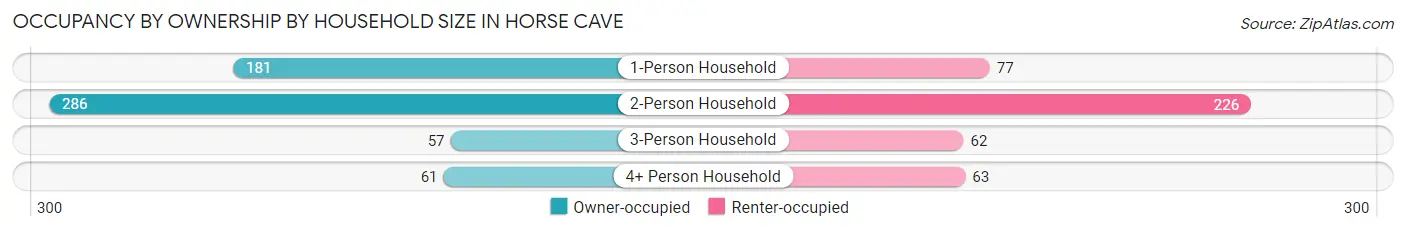
| Household Size | Owner-occupied | Renter-occupied |
| 1-Person Household | 181 (70.2%) | 77 (29.8%) |
| 2-Person Household | 286 (55.9%) | 226 (44.1%) |
| 3-Person Household | 57 (47.9%) | 62 (52.1%) |
| 4+ Person Household | 61 (49.2%) | 63 (50.8%) |
| Total Housing Units | 585 (57.8%) | 428 (42.2%) |
Occupancy by Educational Attainment in Horse Cave
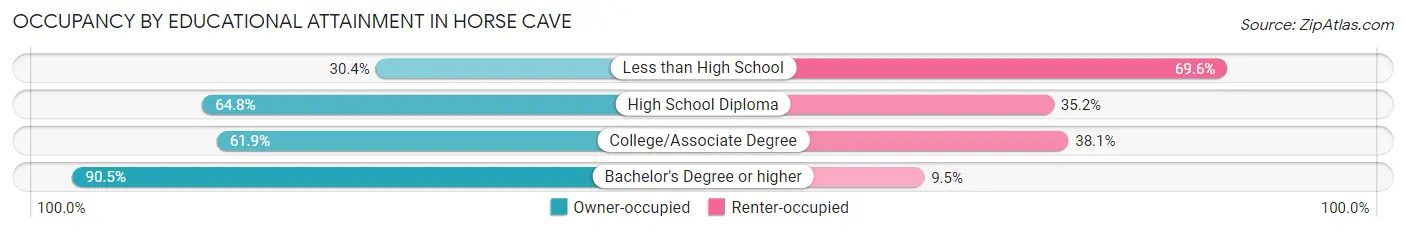
| Household Size | Owner-occupied | Renter-occupied |
| Less than High School | 73 (30.4%) | 167 (69.6%) |
| High School Diploma | 351 (64.8%) | 191 (35.2%) |
| College/Associate Degree | 104 (61.9%) | 64 (38.1%) |
| Bachelor's Degree or higher | 57 (90.5%) | 6 (9.5%) |
Occupancy by Age of Householder in Horse Cave
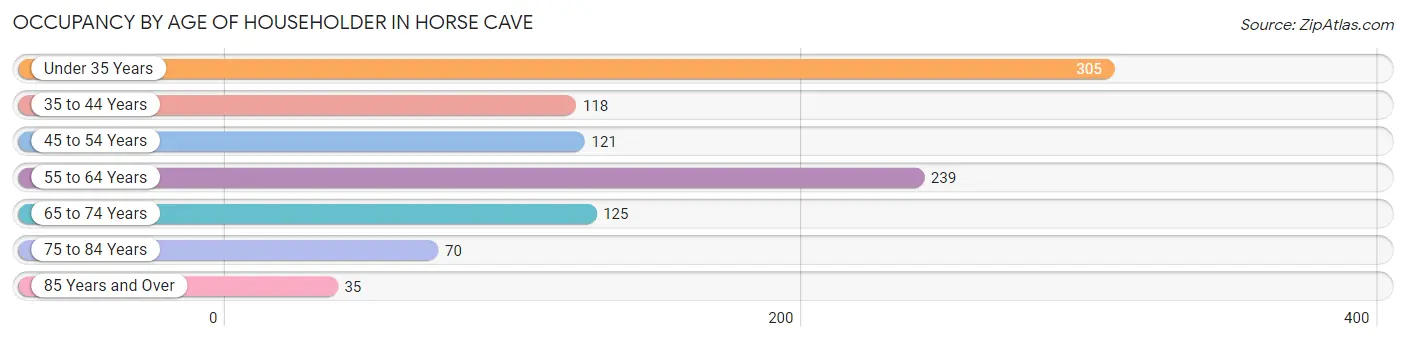
| Age Bracket | # Households | % Households |
| Under 35 Years | 305 | 30.1% |
| 35 to 44 Years | 118 | 11.7% |
| 45 to 54 Years | 121 | 11.9% |
| 55 to 64 Years | 239 | 23.6% |
| 65 to 74 Years | 125 | 12.3% |
| 75 to 84 Years | 70 | 6.9% |
| 85 Years and Over | 35 | 3.5% |
| Total | 1,013 | 100.0% |
Housing Finances in Horse Cave
Median Income by Occupancy in Horse Cave
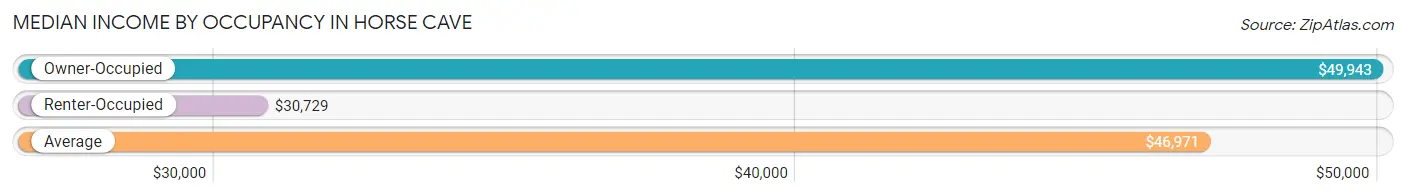
| Occupancy Type | # Households | Median Income |
| Owner-Occupied | 585 (57.8%) | $49,943 |
| Renter-Occupied | 428 (42.2%) | $30,729 |
| Average | 1,013 (100.0%) | $46,971 |
Occupancy by Householder Income Bracket in Horse Cave
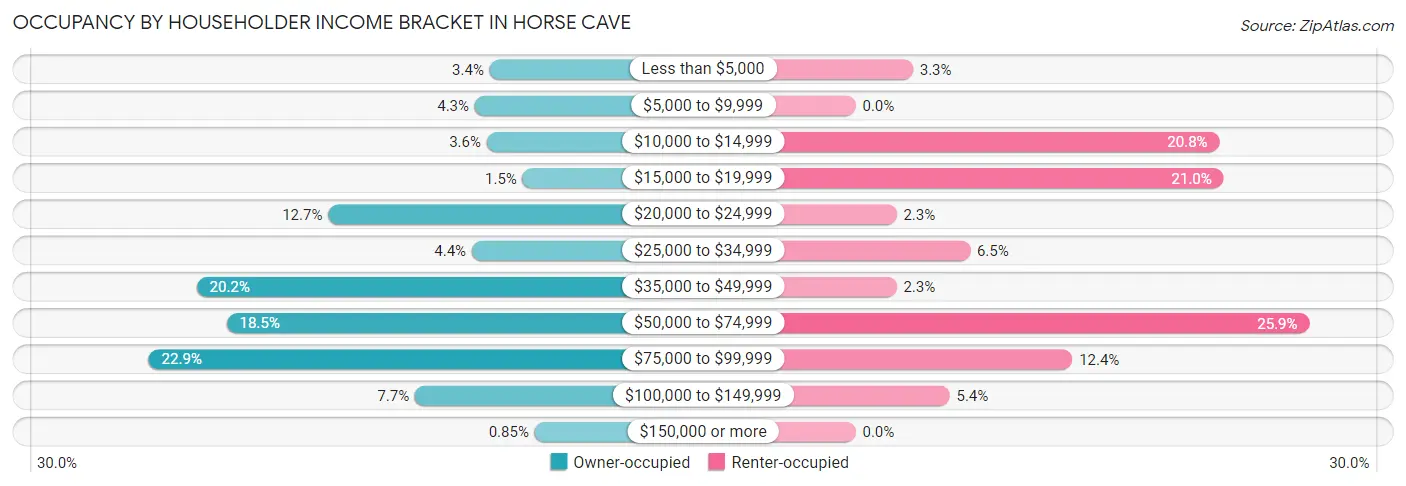
| Income Bracket | Owner-occupied | Renter-occupied |
| Less than $5,000 | 20 (3.4%) | 14 (3.3%) |
| $5,000 to $9,999 | 25 (4.3%) | 0 (0.0%) |
| $10,000 to $14,999 | 21 (3.6%) | 89 (20.8%) |
| $15,000 to $19,999 | 9 (1.5%) | 90 (21.0%) |
| $20,000 to $24,999 | 74 (12.7%) | 10 (2.3%) |
| $25,000 to $34,999 | 26 (4.4%) | 28 (6.5%) |
| $35,000 to $49,999 | 118 (20.2%) | 10 (2.3%) |
| $50,000 to $74,999 | 108 (18.5%) | 111 (25.9%) |
| $75,000 to $99,999 | 134 (22.9%) | 53 (12.4%) |
| $100,000 to $149,999 | 45 (7.7%) | 23 (5.4%) |
| $150,000 or more | 5 (0.9%) | 0 (0.0%) |
| Total | 585 (100.0%) | 428 (100.0%) |
Monthly Housing Cost Tiers in Horse Cave
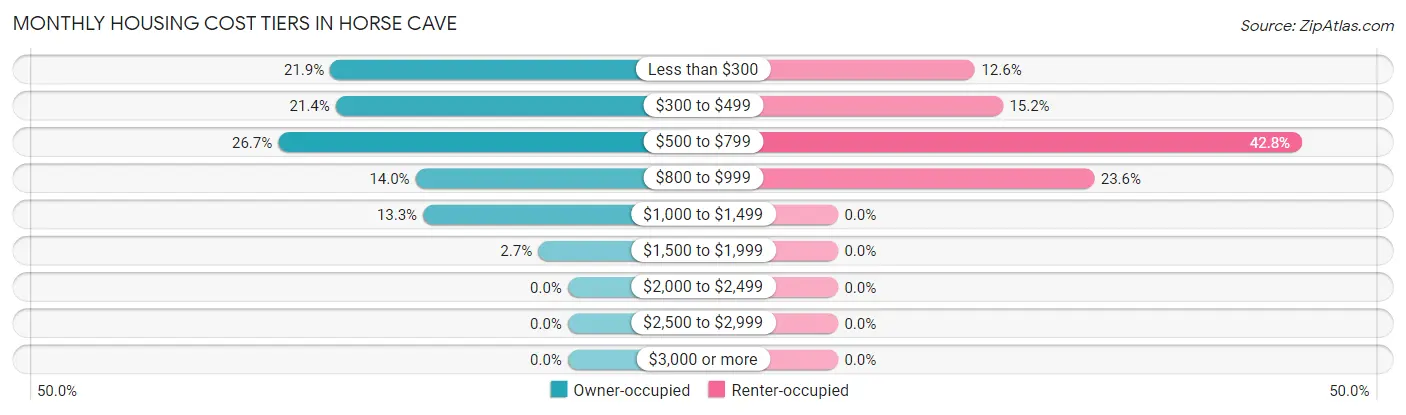
| Monthly Cost | Owner-occupied | Renter-occupied |
| Less than $300 | 128 (21.9%) | 54 (12.6%) |
| $300 to $499 | 125 (21.4%) | 65 (15.2%) |
| $500 to $799 | 156 (26.7%) | 183 (42.8%) |
| $800 to $999 | 82 (14.0%) | 101 (23.6%) |
| $1,000 to $1,499 | 78 (13.3%) | 0 (0.0%) |
| $1,500 to $1,999 | 16 (2.7%) | 0 (0.0%) |
| $2,000 to $2,499 | 0 (0.0%) | 0 (0.0%) |
| $2,500 to $2,999 | 0 (0.0%) | 0 (0.0%) |
| $3,000 or more | 0 (0.0%) | 0 (0.0%) |
| Total | 585 (100.0%) | 428 (100.0%) |
Physical Housing Characteristics in Horse Cave
Housing Structures in Horse Cave
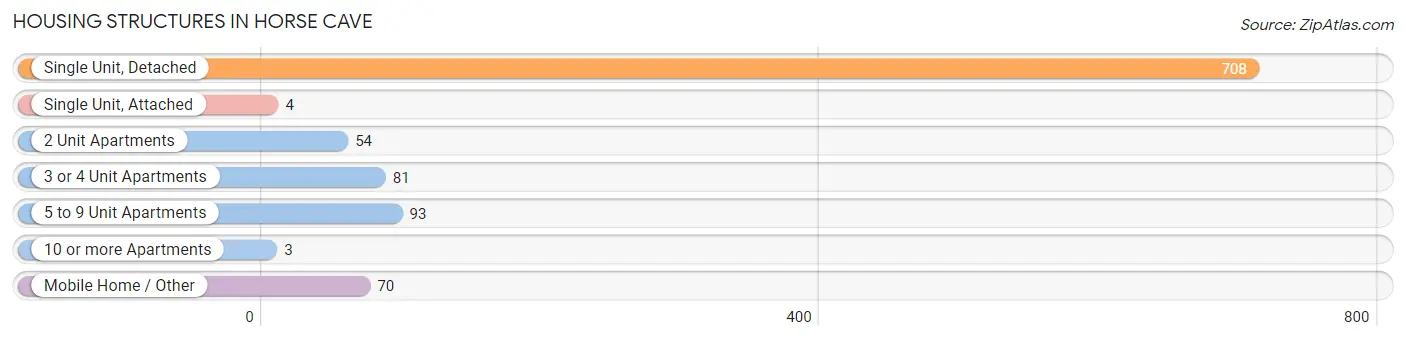
| Structure Type | # Housing Units | % Housing Units |
| Single Unit, Detached | 708 | 69.9% |
| Single Unit, Attached | 4 | 0.4% |
| 2 Unit Apartments | 54 | 5.3% |
| 3 or 4 Unit Apartments | 81 | 8.0% |
| 5 to 9 Unit Apartments | 93 | 9.2% |
| 10 or more Apartments | 3 | 0.3% |
| Mobile Home / Other | 70 | 6.9% |
| Total | 1,013 | 100.0% |
Housing Structures by Occupancy in Horse Cave
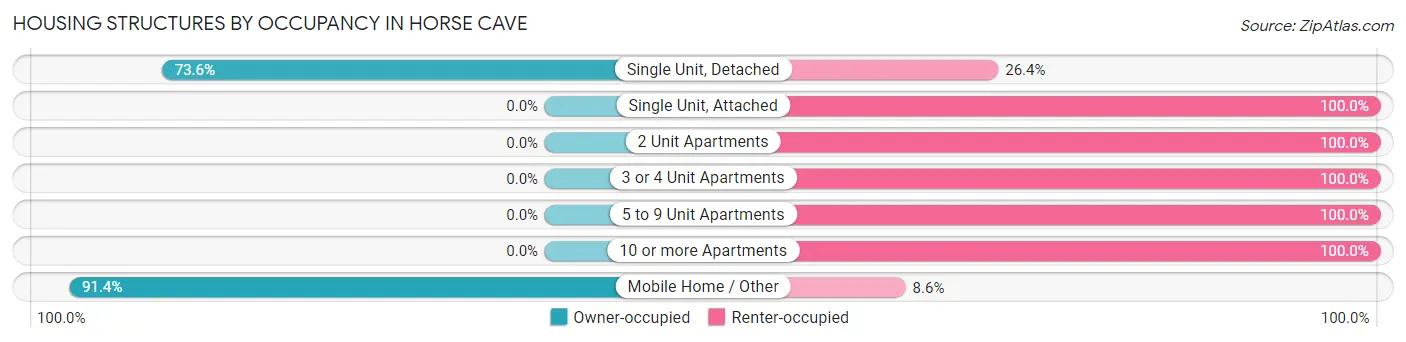
| Structure Type | Owner-occupied | Renter-occupied |
| Single Unit, Detached | 521 (73.6%) | 187 (26.4%) |
| Single Unit, Attached | 0 (0.0%) | 4 (100.0%) |
| 2 Unit Apartments | 0 (0.0%) | 54 (100.0%) |
| 3 or 4 Unit Apartments | 0 (0.0%) | 81 (100.0%) |
| 5 to 9 Unit Apartments | 0 (0.0%) | 93 (100.0%) |
| 10 or more Apartments | 0 (0.0%) | 3 (100.0%) |
| Mobile Home / Other | 64 (91.4%) | 6 (8.6%) |
| Total | 585 (57.8%) | 428 (42.2%) |
Housing Structures by Number of Rooms in Horse Cave
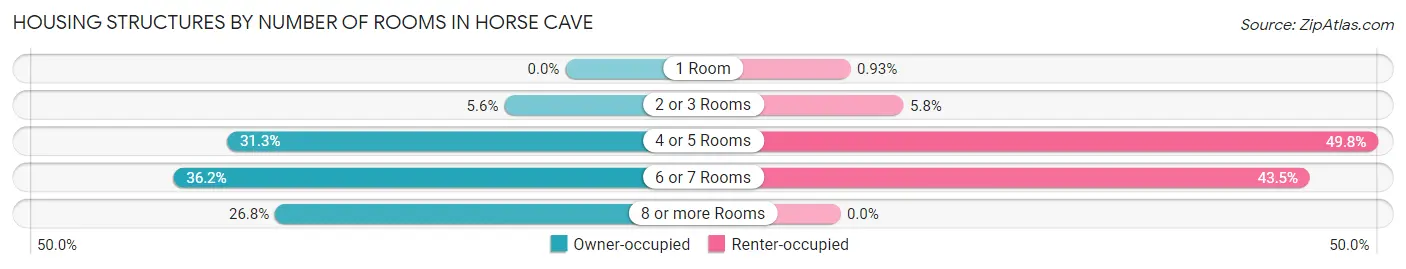
| Number of Rooms | Owner-occupied | Renter-occupied |
| 1 Room | 0 (0.0%) | 4 (0.9%) |
| 2 or 3 Rooms | 33 (5.6%) | 25 (5.8%) |
| 4 or 5 Rooms | 183 (31.3%) | 213 (49.8%) |
| 6 or 7 Rooms | 212 (36.2%) | 186 (43.5%) |
| 8 or more Rooms | 157 (26.8%) | 0 (0.0%) |
| Total | 585 (100.0%) | 428 (100.0%) |
Housing Structure by Heating Type in Horse Cave
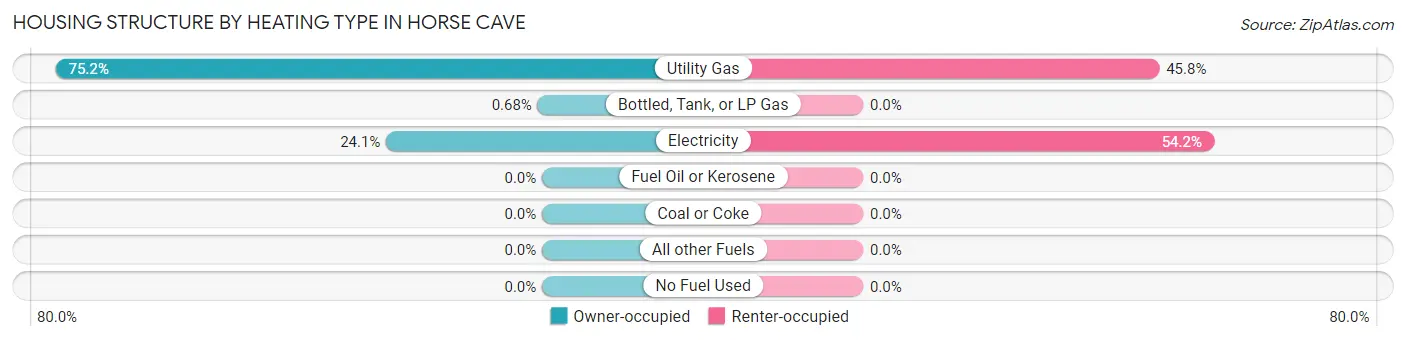
| Heating Type | Owner-occupied | Renter-occupied |
| Utility Gas | 440 (75.2%) | 196 (45.8%) |
| Bottled, Tank, or LP Gas | 4 (0.7%) | 0 (0.0%) |
| Electricity | 141 (24.1%) | 232 (54.2%) |
| Fuel Oil or Kerosene | 0 (0.0%) | 0 (0.0%) |
| Coal or Coke | 0 (0.0%) | 0 (0.0%) |
| All other Fuels | 0 (0.0%) | 0 (0.0%) |
| No Fuel Used | 0 (0.0%) | 0 (0.0%) |
| Total | 585 (100.0%) | 428 (100.0%) |
Household Vehicle Usage in Horse Cave
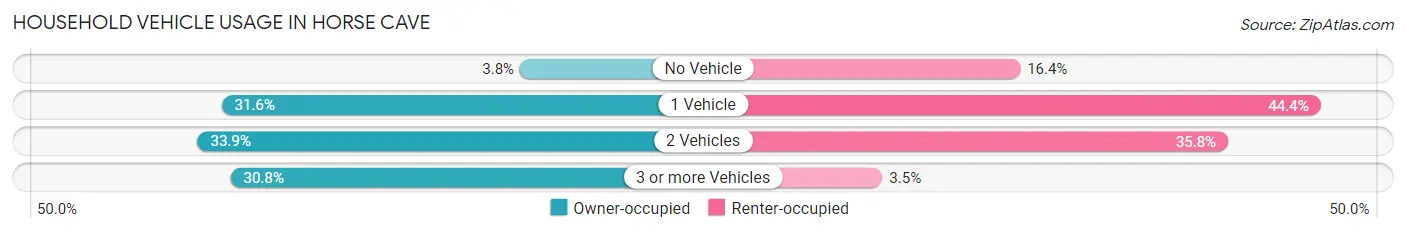
| Vehicles per Household | Owner-occupied | Renter-occupied |
| No Vehicle | 22 (3.8%) | 70 (16.4%) |
| 1 Vehicle | 185 (31.6%) | 190 (44.4%) |
| 2 Vehicles | 198 (33.9%) | 153 (35.7%) |
| 3 or more Vehicles | 180 (30.8%) | 15 (3.5%) |
| Total | 585 (100.0%) | 428 (100.0%) |
Real Estate & Mortgages in Horse Cave
Real Estate and Mortgage Overview in Horse Cave
| Characteristic | Without Mortgage | With Mortgage |
| Housing Units | 307 | 278 |
| Median Property Value | $62,600 | $89,300 |
| Median Household Income | $49,148 | $5 |
| Monthly Housing Costs | $341 | $0 |
| Real Estate Taxes | $291 | $29 |
Property Value by Mortgage Status in Horse Cave
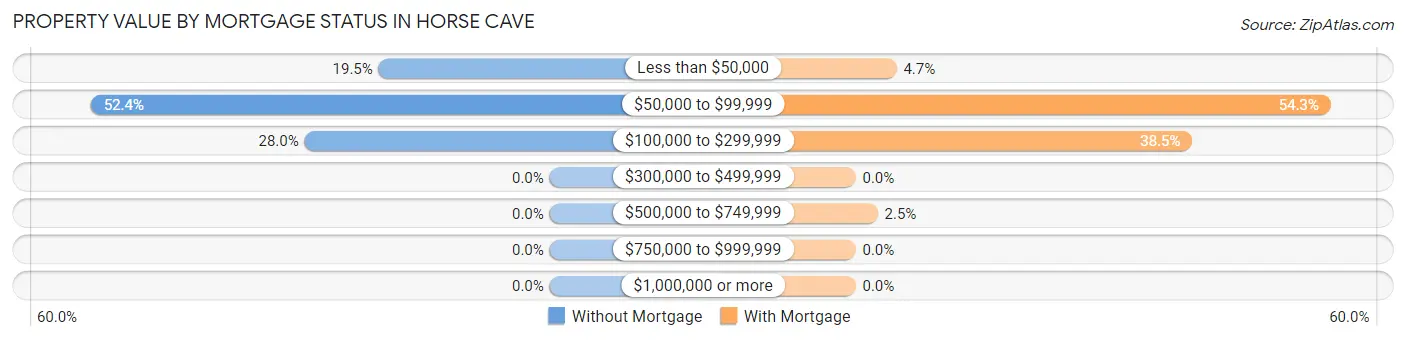
| Property Value | Without Mortgage | With Mortgage |
| Less than $50,000 | 60 (19.5%) | 13 (4.7%) |
| $50,000 to $99,999 | 161 (52.4%) | 151 (54.3%) |
| $100,000 to $299,999 | 86 (28.0%) | 107 (38.5%) |
| $300,000 to $499,999 | 0 (0.0%) | 0 (0.0%) |
| $500,000 to $749,999 | 0 (0.0%) | 7 (2.5%) |
| $750,000 to $999,999 | 0 (0.0%) | 0 (0.0%) |
| $1,000,000 or more | 0 (0.0%) | 0 (0.0%) |
| Total | 307 (100.0%) | 278 (100.0%) |
Household Income by Mortgage Status in Horse Cave
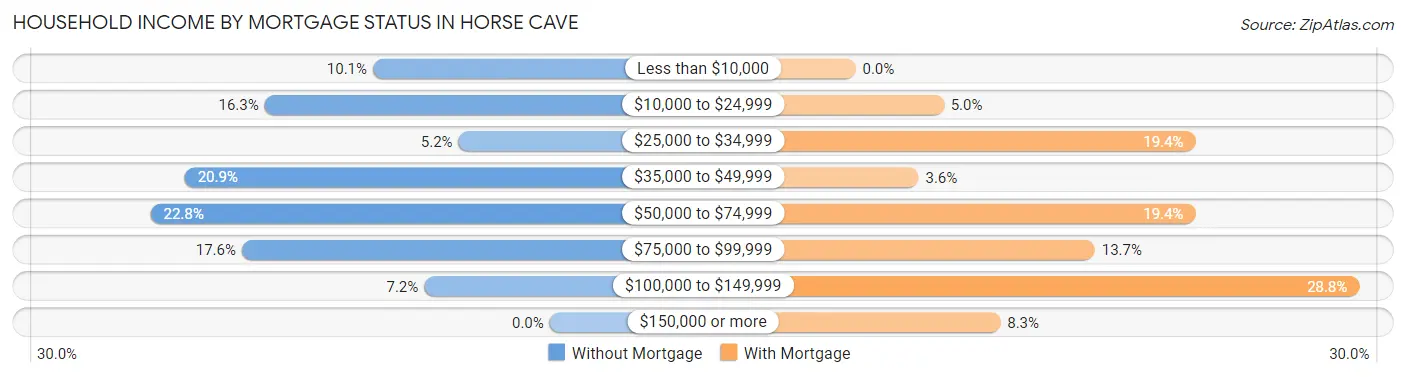
| Household Income | Without Mortgage | With Mortgage |
| Less than $10,000 | 31 (10.1%) | 0 (0.0%) |
| $10,000 to $24,999 | 50 (16.3%) | 14 (5.0%) |
| $25,000 to $34,999 | 16 (5.2%) | 54 (19.4%) |
| $35,000 to $49,999 | 64 (20.8%) | 10 (3.6%) |
| $50,000 to $74,999 | 70 (22.8%) | 54 (19.4%) |
| $75,000 to $99,999 | 54 (17.6%) | 38 (13.7%) |
| $100,000 to $149,999 | 22 (7.2%) | 80 (28.8%) |
| $150,000 or more | 0 (0.0%) | 23 (8.3%) |
| Total | 307 (100.0%) | 278 (100.0%) |
Property Value to Household Income Ratio in Horse Cave
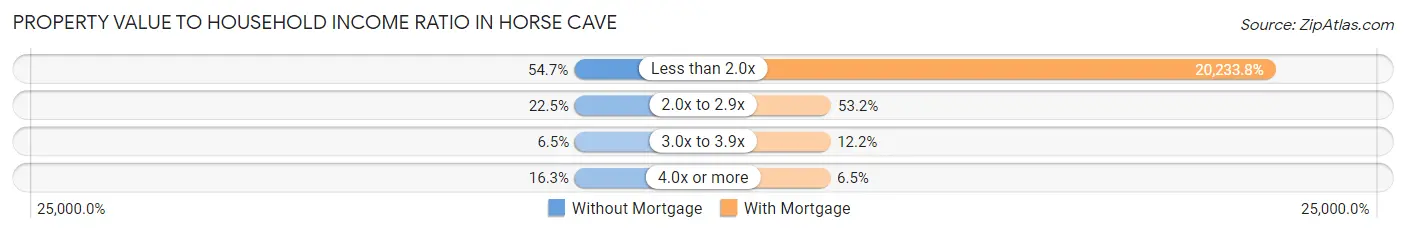
| Value-to-Income Ratio | Without Mortgage | With Mortgage |
| Less than 2.0x | 168 (54.7%) | 56,250 (20,233.8%) |
| 2.0x to 2.9x | 69 (22.5%) | 148 (53.2%) |
| 3.0x to 3.9x | 20 (6.5%) | 34 (12.2%) |
| 4.0x or more | 50 (16.3%) | 18 (6.5%) |
| Total | 307 (100.0%) | 278 (100.0%) |
Real Estate Taxes by Mortgage Status in Horse Cave
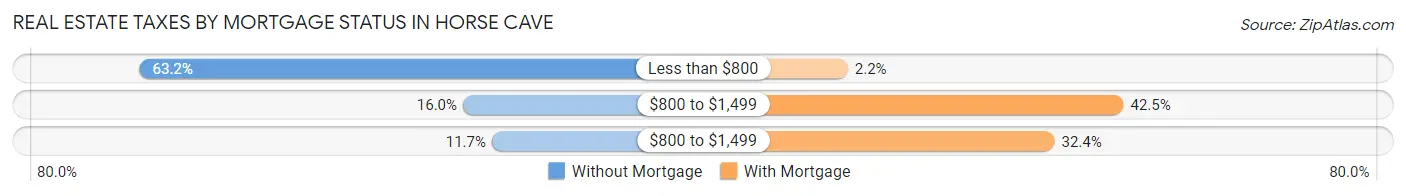
| Property Taxes | Without Mortgage | With Mortgage |
| Less than $800 | 194 (63.2%) | 6 (2.2%) |
| $800 to $1,499 | 49 (16.0%) | 118 (42.4%) |
| $800 to $1,499 | 36 (11.7%) | 90 (32.4%) |
| Total | 307 (100.0%) | 278 (100.0%) |
Health & Disability in Horse Cave
Health Insurance Coverage by Age in Horse Cave
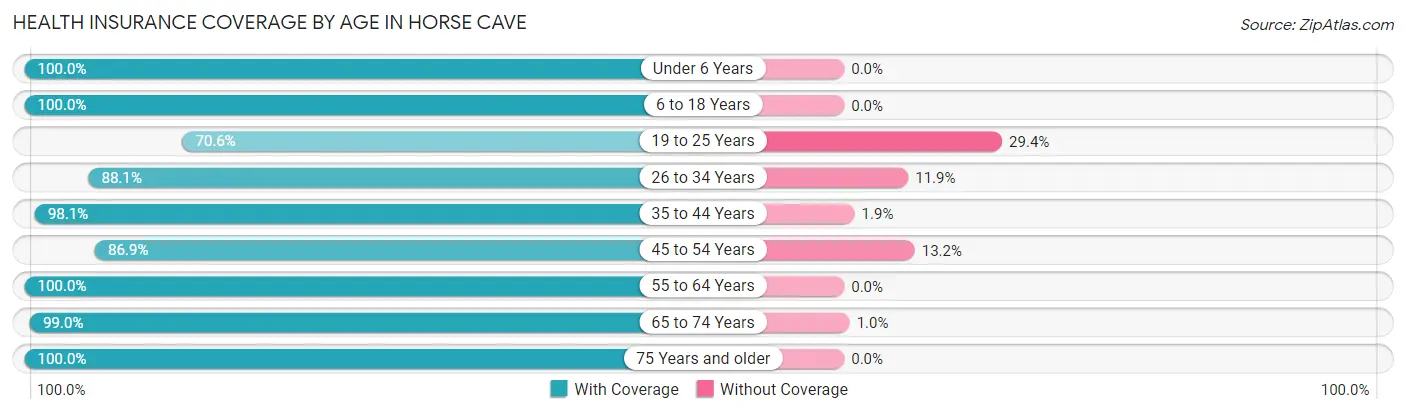
| Age Bracket | With Coverage | Without Coverage |
| Under 6 Years | 105 (100.0%) | 0 (0.0%) |
| 6 to 18 Years | 404 (100.0%) | 0 (0.0%) |
| 19 to 25 Years | 139 (70.6%) | 58 (29.4%) |
| 26 to 34 Years | 251 (88.1%) | 34 (11.9%) |
| 35 to 44 Years | 203 (98.1%) | 4 (1.9%) |
| 45 to 54 Years | 218 (86.9%) | 33 (13.2%) |
| 55 to 64 Years | 375 (100.0%) | 0 (0.0%) |
| 65 to 74 Years | 295 (99.0%) | 3 (1.0%) |
| 75 Years and older | 128 (100.0%) | 0 (0.0%) |
| Total | 2,118 (94.1%) | 132 (5.9%) |
Health Insurance Coverage by Citizenship Status in Horse Cave
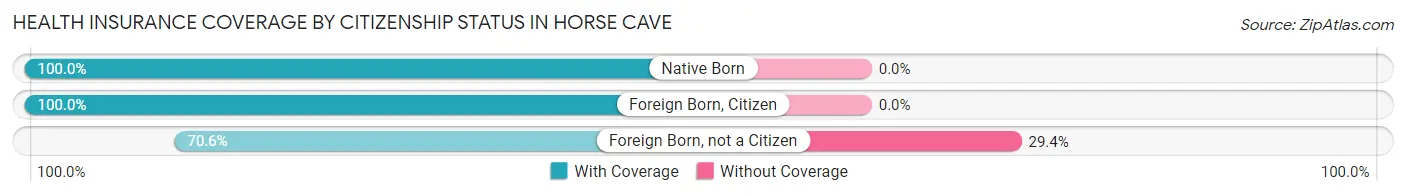
| Citizenship Status | With Coverage | Without Coverage |
| Native Born | 105 (100.0%) | 0 (0.0%) |
| Foreign Born, Citizen | 404 (100.0%) | 0 (0.0%) |
| Foreign Born, not a Citizen | 139 (70.6%) | 58 (29.4%) |
Health Insurance Coverage by Household Income in Horse Cave
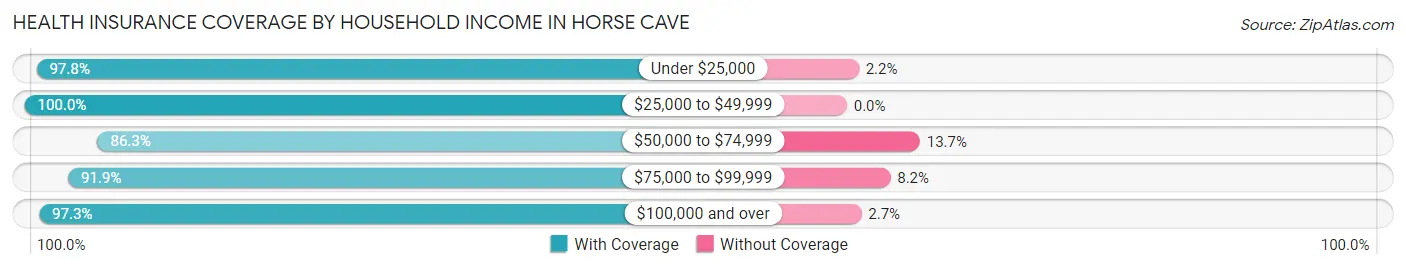
| Household Income | With Coverage | Without Coverage |
| Under $25,000 | 746 (97.8%) | 17 (2.2%) |
| $25,000 to $49,999 | 336 (100.0%) | 0 (0.0%) |
| $50,000 to $74,999 | 486 (86.3%) | 77 (13.7%) |
| $75,000 to $99,999 | 372 (91.8%) | 33 (8.2%) |
| $100,000 and over | 178 (97.3%) | 5 (2.7%) |
Public vs Private Health Insurance Coverage by Age in Horse Cave
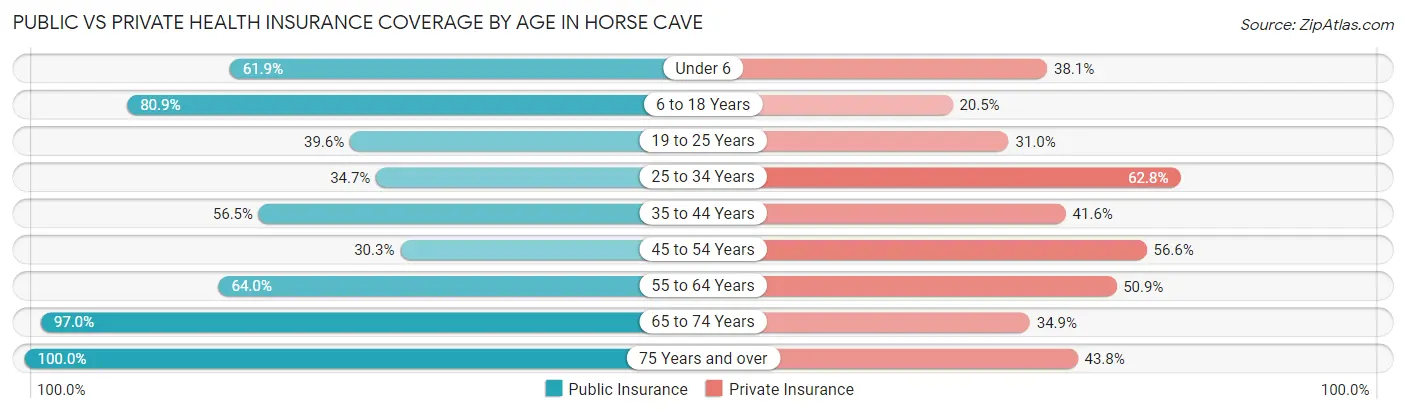
| Age Bracket | Public Insurance | Private Insurance |
| Under 6 | 65 (61.9%) | 40 (38.1%) |
| 6 to 18 Years | 327 (80.9%) | 83 (20.5%) |
| 19 to 25 Years | 78 (39.6%) | 61 (31.0%) |
| 25 to 34 Years | 99 (34.7%) | 179 (62.8%) |
| 35 to 44 Years | 117 (56.5%) | 86 (41.5%) |
| 45 to 54 Years | 76 (30.3%) | 142 (56.6%) |
| 55 to 64 Years | 240 (64.0%) | 191 (50.9%) |
| 65 to 74 Years | 289 (97.0%) | 104 (34.9%) |
| 75 Years and over | 128 (100.0%) | 56 (43.8%) |
| Total | 1,419 (63.1%) | 942 (41.9%) |
Disability Status by Sex by Age in Horse Cave
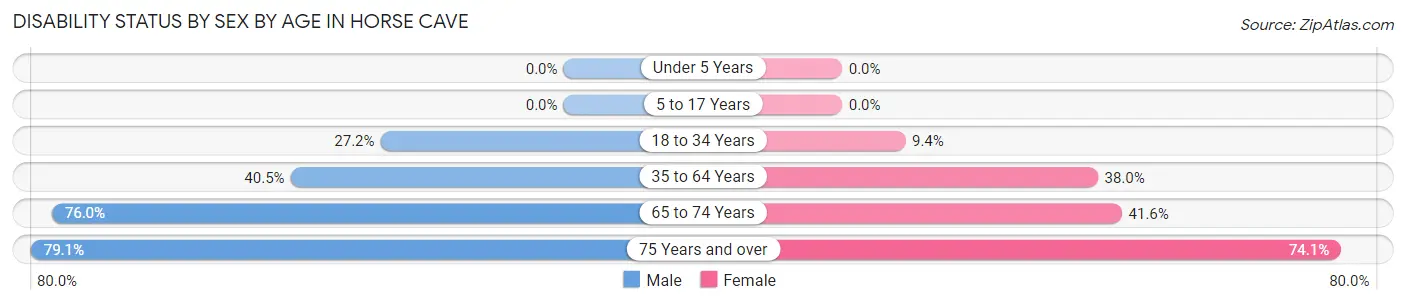
| Age Bracket | Male | Female |
| Under 5 Years | 0 (0.0%) | 0 (0.0%) |
| 5 to 17 Years | 0 (0.0%) | 0 (0.0%) |
| 18 to 34 Years | 75 (27.2%) | 20 (9.4%) |
| 35 to 64 Years | 154 (40.5%) | 172 (38.0%) |
| 65 to 74 Years | 60 (75.9%) | 91 (41.5%) |
| 75 Years and over | 34 (79.1%) | 63 (74.1%) |
Disability Class by Sex by Age in Horse Cave
Disability Class: Hearing Difficulty
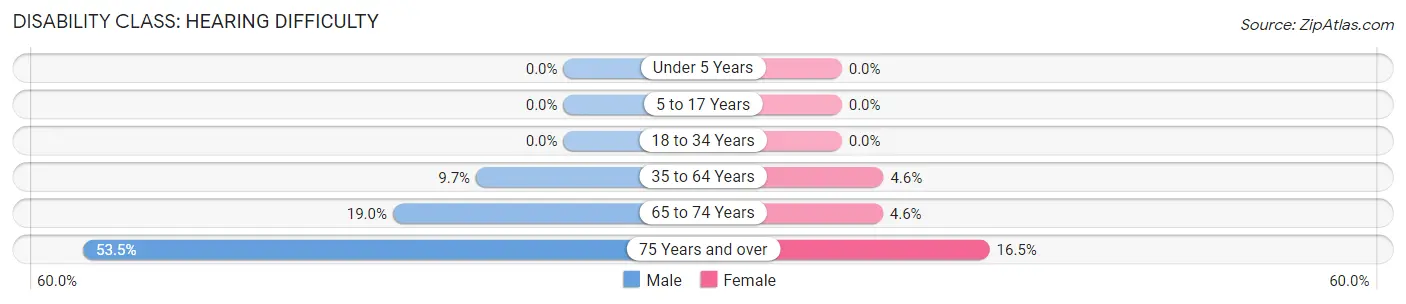
| Age Bracket | Male | Female |
| Under 5 Years | 0 (0.0%) | 0 (0.0%) |
| 5 to 17 Years | 0 (0.0%) | 0 (0.0%) |
| 18 to 34 Years | 0 (0.0%) | 0 (0.0%) |
| 35 to 64 Years | 37 (9.7%) | 21 (4.6%) |
| 65 to 74 Years | 15 (19.0%) | 10 (4.6%) |
| 75 Years and over | 23 (53.5%) | 14 (16.5%) |
Disability Class: Vision Difficulty
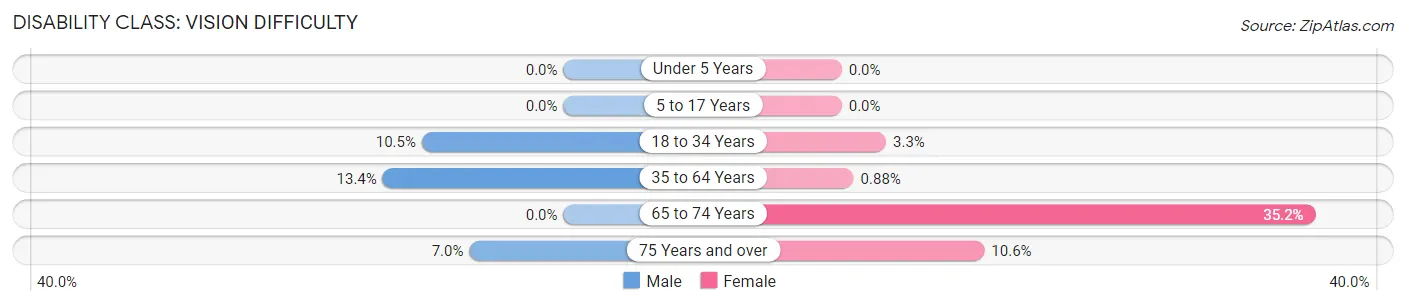
| Age Bracket | Male | Female |
| Under 5 Years | 0 (0.0%) | 0 (0.0%) |
| 5 to 17 Years | 0 (0.0%) | 0 (0.0%) |
| 18 to 34 Years | 29 (10.5%) | 7 (3.3%) |
| 35 to 64 Years | 51 (13.4%) | 4 (0.9%) |
| 65 to 74 Years | 0 (0.0%) | 77 (35.2%) |
| 75 Years and over | 3 (7.0%) | 9 (10.6%) |
Disability Class: Cognitive Difficulty
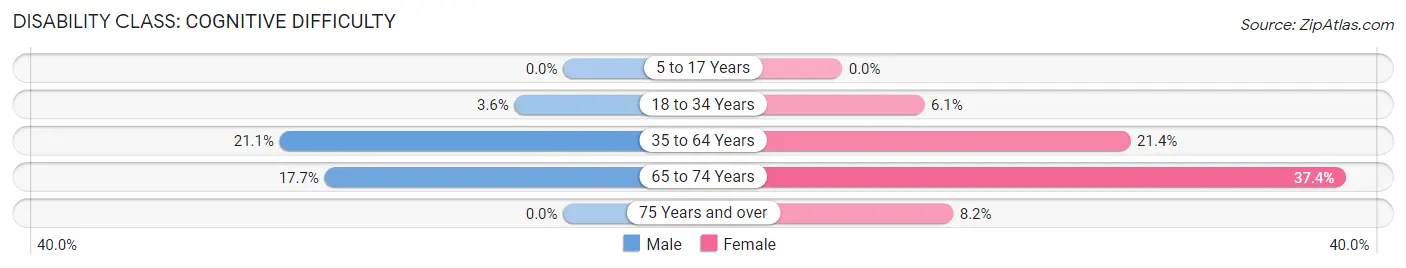
| Age Bracket | Male | Female |
| 5 to 17 Years | 0 (0.0%) | 0 (0.0%) |
| 18 to 34 Years | 10 (3.6%) | 13 (6.1%) |
| 35 to 64 Years | 80 (21.0%) | 97 (21.4%) |
| 65 to 74 Years | 14 (17.7%) | 82 (37.4%) |
| 75 Years and over | 0 (0.0%) | 7 (8.2%) |
Disability Class: Ambulatory Difficulty
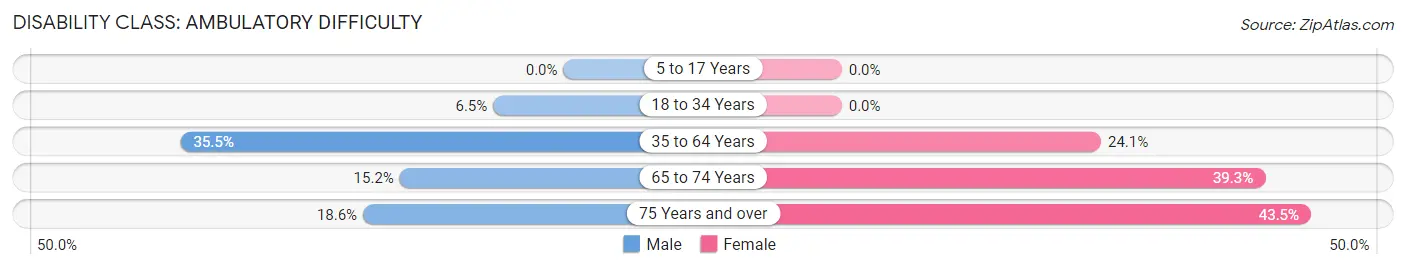
| Age Bracket | Male | Female |
| 5 to 17 Years | 0 (0.0%) | 0 (0.0%) |
| 18 to 34 Years | 18 (6.5%) | 0 (0.0%) |
| 35 to 64 Years | 135 (35.5%) | 109 (24.1%) |
| 65 to 74 Years | 12 (15.2%) | 86 (39.3%) |
| 75 Years and over | 8 (18.6%) | 37 (43.5%) |
Disability Class: Self-Care Difficulty
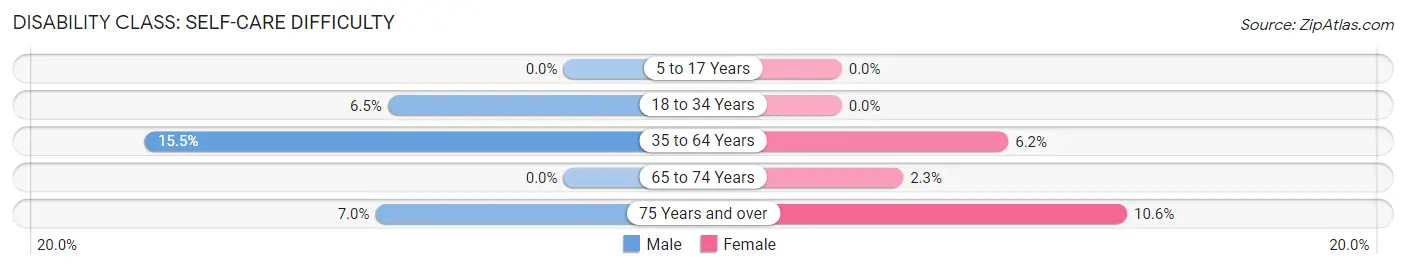
| Age Bracket | Male | Female |
| 5 to 17 Years | 0 (0.0%) | 0 (0.0%) |
| 18 to 34 Years | 18 (6.5%) | 0 (0.0%) |
| 35 to 64 Years | 59 (15.5%) | 28 (6.2%) |
| 65 to 74 Years | 0 (0.0%) | 5 (2.3%) |
| 75 Years and over | 3 (7.0%) | 9 (10.6%) |
Technology Access in Horse Cave
Computing Device Access in Horse Cave
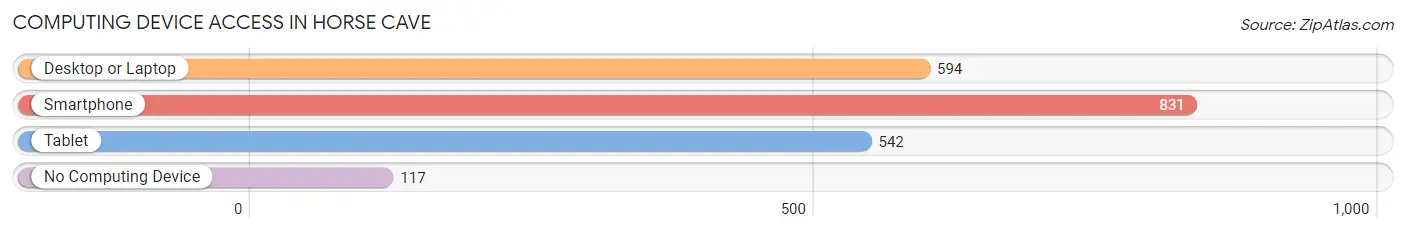
| Device Type | # Households | % Households |
| Desktop or Laptop | 594 | 58.6% |
| Smartphone | 831 | 82.0% |
| Tablet | 542 | 53.5% |
| No Computing Device | 117 | 11.6% |
| Total | 1,013 | 100.0% |
Internet Access in Horse Cave
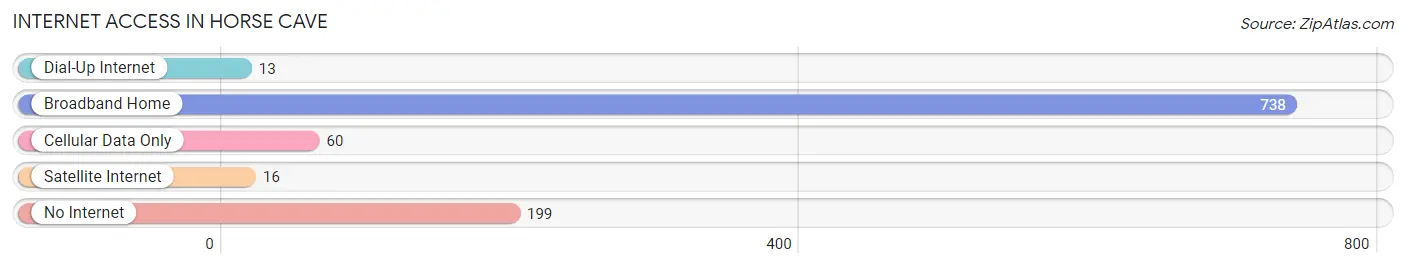
| Internet Type | # Households | % Households |
| Dial-Up Internet | 13 | 1.3% |
| Broadband Home | 738 | 72.9% |
| Cellular Data Only | 60 | 5.9% |
| Satellite Internet | 16 | 1.6% |
| No Internet | 199 | 19.6% |
| Total | 1,013 | 100.0% |
Horse Cave Summary
Horse Cave is a small city located in Hart County, Kentucky, United States. It is situated along the Green River, approximately 20 miles south of Cave City and 25 miles north of Munfordville. The population was 2,311 at the 2010 census.
History
Horse Cave was founded in 1852 by the Louisville and Nashville Railroad. The city was named for a nearby cave, which was said to have been used by Native Americans to shelter their horses. The cave was also used as a hideout by Confederate soldiers during the Civil War.
In the late 19th century, Horse Cave became a popular tourist destination due to its natural beauty and the presence of a large cave. The city was incorporated in 1891 and the first mayor was elected in 1892.
In the early 20th century, Horse Cave was a thriving industrial center, with several factories producing furniture, clothing, and other goods. The city also had a large number of hotels and restaurants.
In the 1950s, the city began to decline as the factories closed and the tourist trade declined. The city was declared a “blighted area” in the 1970s and received federal funds to help revitalize the downtown area.
Geography
Horse Cave is located at 37°10'25" North, 86°7'25" West (37.173611, -86.123611). According to the United States Census Bureau, the city has a total area of 2.2 square miles (5.7 km2), all land.
Economy
Horse Cave’s economy is largely based on tourism. The city is home to the Kentucky Caverns, a popular tourist attraction. The city also has several antique stores, restaurants, and other businesses catering to tourists.
The city is also home to several manufacturing companies, including a furniture factory and a clothing factory.
Demographics
As of the census of 2000, there were 2,311 people, 990 households, and 645 families residing in the city. The population density was 1,039.2 people per square mile (400.7/km2). There were 1,093 housing units at an average density of 487.2 per square mile (188.2/km2). The racial makeup of the city was 97.17% White, 0.87% African American, 0.17% Native American, 0.17% Asian, 0.09% Pacific Islander, 0.87% from other races, and 0.65% from two or more races. Hispanic or Latino of any race were 1.30% of the population.
There were 990 households, out of which 28.2% had children under the age of 18 living with them, 48.3% were married couples living together, 13.3% had a female householder with no husband present, and 34.7% were non-families. 30.7% of all households were made up of individuals, and 15.2% had someone living alone who was 65 years of age or older. The average household size was 2.32 and the average family size was 2.88.
In the city, the population was spread out, with 23.2% under the age of 18, 8.2% from 18 to 24, 27.2% from 25 to 44, 22.7% from 45 to 64, and 18.7% who were 65 years of age or older. The median age was 38 years. For every 100 females, there were 87.2 males. For every 100 females age 18 and over, there were 82.2 males.
The median income for a household in the city was $25,938, and the median income for a family was $31,250. Males had a median income of $27,500 versus $20,000 for females. The per capita income for the city was $14,945. About 15.2% of families and 17.7% of the population were below the poverty line, including 22.2% of those under age 18 and 16.2% of those age 65 or over.
Common Questions
What is Per Capita Income in Horse Cave?
Per Capita income in Horse Cave is $22,435.
What is the Median Family Income in Horse Cave?
Median Family Income in Horse Cave is $50,028.
What is the Median Household income in Horse Cave?
Median Household Income in Horse Cave is $46,971.
What is Income or Wage Gap in Horse Cave?
Income or Wage Gap in Horse Cave is 41.7%.
Women in Horse Cave earn 58.3 cents for every dollar earned by a man.
What is Inequality or Gini Index in Horse Cave?
Inequality or Gini Index in Horse Cave is 0.39.
What is the Total Population of Horse Cave?
Total Population of Horse Cave is 2,353.
What is the Total Male Population of Horse Cave?
Total Male Population of Horse Cave is 1,129.
What is the Total Female Population of Horse Cave?
Total Female Population of Horse Cave is 1,224.
What is the Ratio of Males per 100 Females in Horse Cave?
There are 92.24 Males per 100 Females in Horse Cave.
What is the Ratio of Females per 100 Males in Horse Cave?
There are 108.41 Females per 100 Males in Horse Cave.
What is the Median Population Age in Horse Cave?
Median Population Age in Horse Cave is 42.3 Years.
What is the Average Family Size in Horse Cave
Average Family Size in Horse Cave is 2.7 People.
What is the Average Household Size in Horse Cave
Average Household Size in Horse Cave is 2.2 People.
How Large is the Labor Force in Horse Cave?
There are 794 People in the Labor Forcein in Horse Cave.
What is the Percentage of People in the Labor Force in Horse Cave?
40.8% of People are in the Labor Force in Horse Cave.
What is the Unemployment Rate in Horse Cave?
Unemployment Rate in Horse Cave is 7.8%.