Danville, KY Map & Demographics
Danville Map
Danville Overview
$27,118
PER CAPITA INCOME
$59,643
AVG FAMILY INCOME
$48,038
AVG HOUSEHOLD INCOME
25.9%
WAGE / INCOME GAP [ % ]
74.1¢/ $1
WAGE / INCOME GAP [ $ ]
$12,523
FAMILY INCOME DEFICIT
0.46
INEQUALITY / GINI INDEX
17,191
TOTAL POPULATION
8,404
MALE POPULATION
8,787
FEMALE POPULATION
95.64
MALES / 100 FEMALES
104.56
FEMALES / 100 MALES
36.4
MEDIAN AGE
2.9
AVG FAMILY SIZE
2.3
AVG HOUSEHOLD SIZE
7,699
LABOR FORCE [ PEOPLE ]
54.2%
PERCENT IN LABOR FORCE
8.2%
UNEMPLOYMENT RATE
Danville Zip Codes
Income in Danville
Income Overview in Danville
Per Capita Income in Danville is $27,118, while median incomes of families and households are $59,643 and $48,038 respectively.
| Characteristic | Number | Measure |
| Per Capita Income | 17,191 | $27,118 |
| Median Family Income | 3,910 | $59,643 |
| Mean Family Income | 3,910 | $78,168 |
| Median Household Income | 6,663 | $48,038 |
| Mean Household Income | 6,663 | $65,969 |
| Income Deficit | 3,910 | $12,523 |
| Wage / Income Gap (%) | 17,191 | 25.95% |
| Wage / Income Gap ($) | 17,191 | 74.05¢ per $1 |
| Gini / Inequality Index | 17,191 | 0.46 |
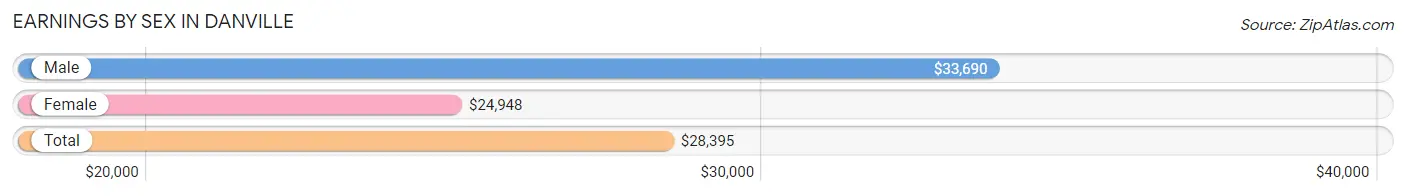
Earnings by Sex in Danville
Average Earnings in Danville are $28,395, $33,690 for men and $24,948 for women, a difference of 26.0%.
| Sex | Number | Average Earnings |
| Male | 4,468 (52.6%) | $33,690 |
| Female | 4,026 (47.4%) | $24,948 |
| Total | 8,494 (100.0%) | $28,395 |
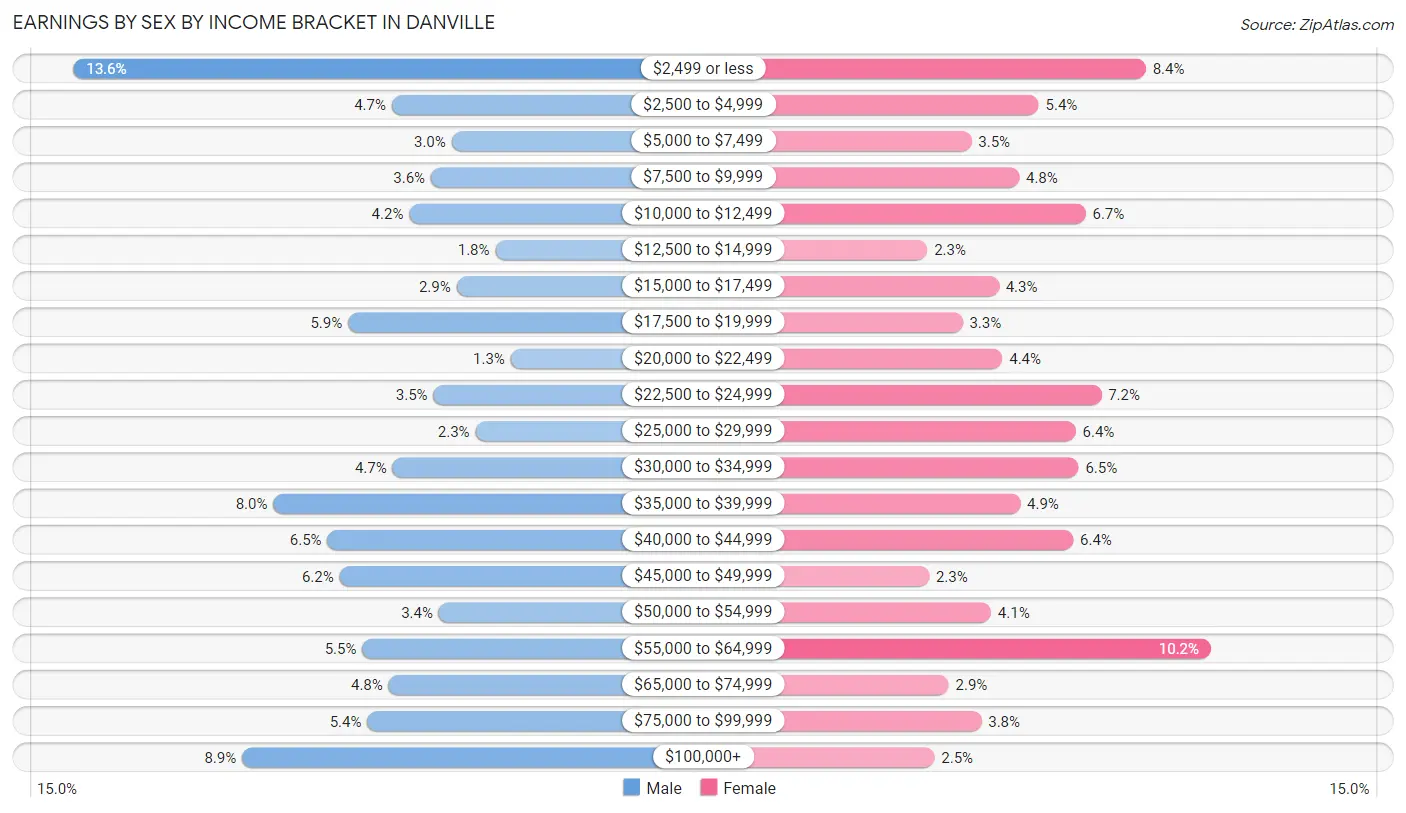
Earnings by Sex by Income Bracket in Danville
The most common earnings brackets in Danville are $2,499 or less for men (609 | 13.6%) and $55,000 to $64,999 for women (412 | 10.2%).
| Income | Male | Female |
| $2,499 or less | 609 (13.6%) | 338 (8.4%) |
| $2,500 to $4,999 | 209 (4.7%) | 217 (5.4%) |
| $5,000 to $7,499 | 134 (3.0%) | 141 (3.5%) |
| $7,500 to $9,999 | 160 (3.6%) | 195 (4.8%) |
| $10,000 to $12,499 | 187 (4.2%) | 270 (6.7%) |
| $12,500 to $14,999 | 79 (1.8%) | 91 (2.3%) |
| $15,000 to $17,499 | 128 (2.9%) | 172 (4.3%) |
| $17,500 to $19,999 | 264 (5.9%) | 131 (3.3%) |
| $20,000 to $22,499 | 60 (1.3%) | 176 (4.4%) |
| $22,500 to $24,999 | 157 (3.5%) | 288 (7.1%) |
| $25,000 to $29,999 | 104 (2.3%) | 259 (6.4%) |
| $30,000 to $34,999 | 208 (4.7%) | 262 (6.5%) |
| $35,000 to $39,999 | 358 (8.0%) | 196 (4.9%) |
| $40,000 to $44,999 | 290 (6.5%) | 256 (6.4%) |
| $45,000 to $49,999 | 275 (6.1%) | 93 (2.3%) |
| $50,000 to $54,999 | 150 (3.4%) | 163 (4.1%) |
| $55,000 to $64,999 | 246 (5.5%) | 412 (10.2%) |
| $65,000 to $74,999 | 213 (4.8%) | 115 (2.9%) |
| $75,000 to $99,999 | 240 (5.4%) | 152 (3.8%) |
| $100,000+ | 397 (8.9%) | 99 (2.5%) |
| Total | 4,468 (100.0%) | 4,026 (100.0%) |
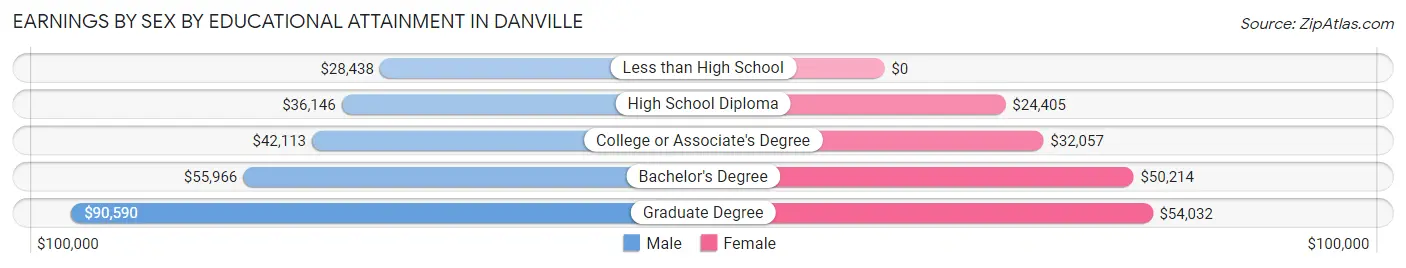
Earnings by Sex by Educational Attainment in Danville
Average earnings in Danville are $41,250 for men and $33,701 for women, a difference of 18.3%. Men with an educational attainment of graduate degree enjoy the highest average annual earnings of $90,590, while those with less than high school education earn the least with $28,438. Women with an educational attainment of graduate degree earn the most with the average annual earnings of $54,032, while those with high school diploma education have the smallest earnings of $24,405.
| Educational Attainment | Male Income | Female Income |
| Less than High School | $28,438 | $0 |
| High School Diploma | $36,146 | $24,405 |
| College or Associate's Degree | $42,113 | $32,057 |
| Bachelor's Degree | $55,966 | $50,214 |
| Graduate Degree | $90,590 | $54,032 |
| Total | $41,250 | $33,701 |
Family Income in Danville
Family Income Brackets in Danville
According to the Danville family income data, there are 778 families falling into the $100,000 to $149,999 income range, which is the most common income bracket and makes up 19.9% of all families. Conversely, the $200,000+ income bracket is the least frequent group with only 74 families (1.9%) belonging to this category.
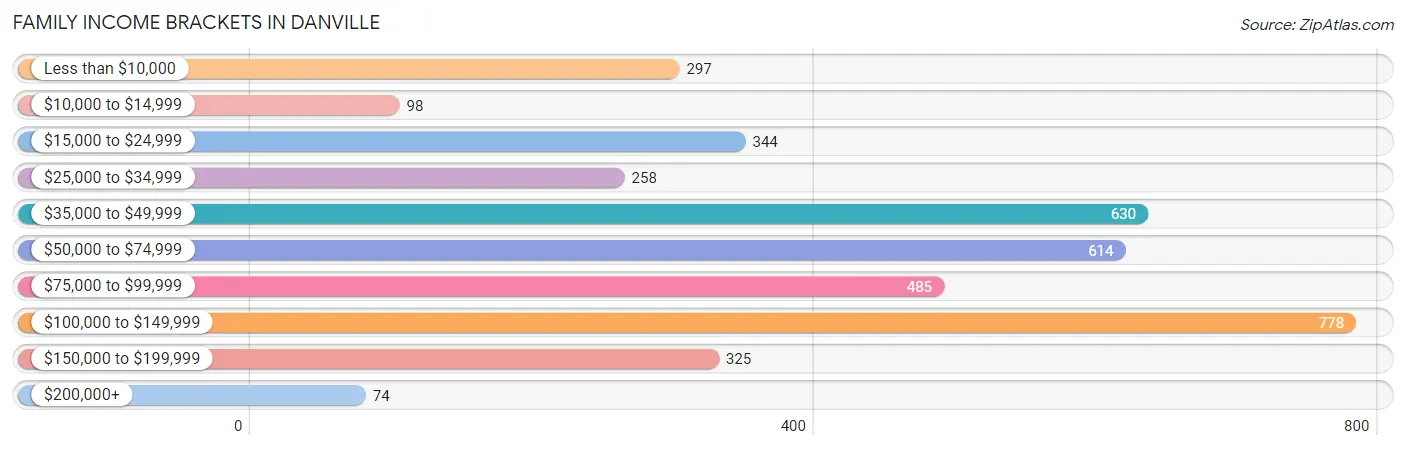
| Income Bracket | # Families | % Families |
| Less than $10,000 | 297 | 7.6% |
| $10,000 to $14,999 | 98 | 2.5% |
| $15,000 to $24,999 | 344 | 8.8% |
| $25,000 to $34,999 | 258 | 6.6% |
| $35,000 to $49,999 | 630 | 16.1% |
| $50,000 to $74,999 | 614 | 15.7% |
| $75,000 to $99,999 | 485 | 12.4% |
| $100,000 to $149,999 | 778 | 19.9% |
| $150,000 to $199,999 | 325 | 8.3% |
| $200,000+ | 74 | 1.9% |
Family Income by Famaliy Size in Danville
5-person families (179 | 4.6%) account for the highest median family income in Danville with $131,140 per family, while 2-person families (2,293 | 58.6%) have the highest median income of $26,875 per family member.
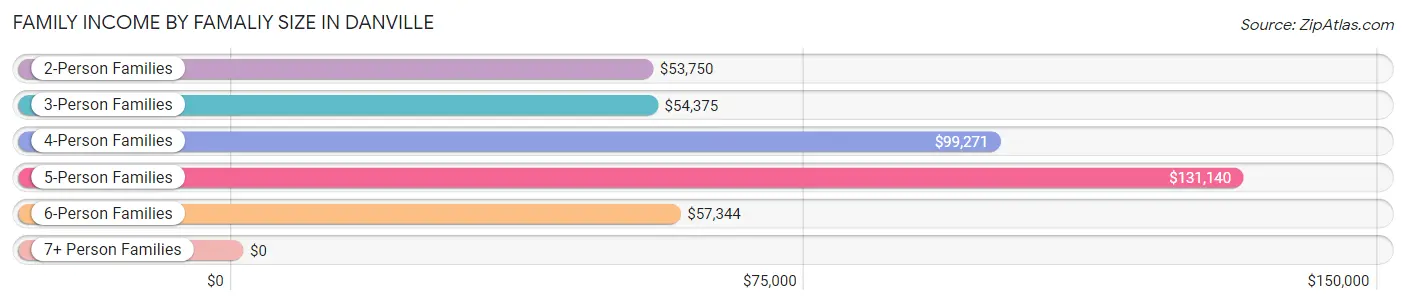
| Income Bracket | # Families | Median Income |
| 2-Person Families | 2,293 (58.6%) | $53,750 |
| 3-Person Families | 674 (17.2%) | $54,375 |
| 4-Person Families | 611 (15.6%) | $99,271 |
| 5-Person Families | 179 (4.6%) | $131,140 |
| 6-Person Families | 153 (3.9%) | $57,344 |
| 7+ Person Families | 0 (0.0%) | $0 |
| Total | 3,910 (100.0%) | $59,643 |
Family Income by Number of Earners in Danville
The median family income in Danville is $59,643, with families comprising 3+ earners (178) having the highest median family income of $135,463, while families with 1 earner (1,642) have the lowest median family income of $40,417, accounting for 4.5% and 42.0% of families, respectively.
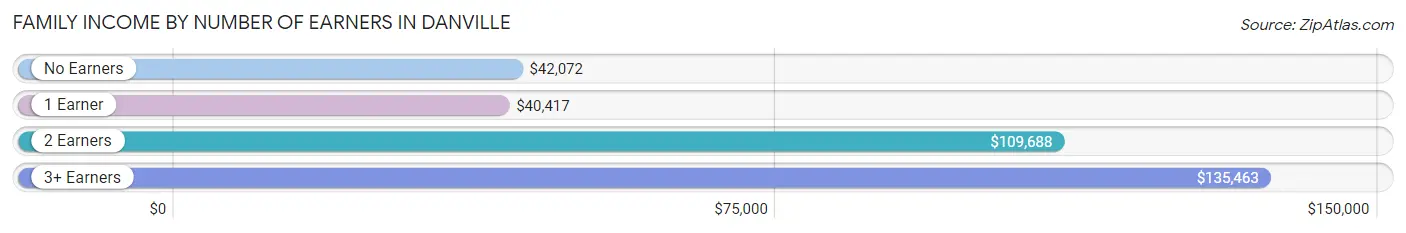
| Number of Earners | # Families | Median Income |
| No Earners | 725 (18.5%) | $42,072 |
| 1 Earner | 1,642 (42.0%) | $40,417 |
| 2 Earners | 1,365 (34.9%) | $109,688 |
| 3+ Earners | 178 (4.5%) | $135,463 |
| Total | 3,910 (100.0%) | $59,643 |
Household Income in Danville
Household Income Brackets in Danville
With 1,059 households falling in the category, the $35,000 to $49,999 income range is the most frequent in Danville, accounting for 15.9% of all households. In contrast, only 160 households (2.4%) fall into the $200,000+ income bracket, making it the least populous group.
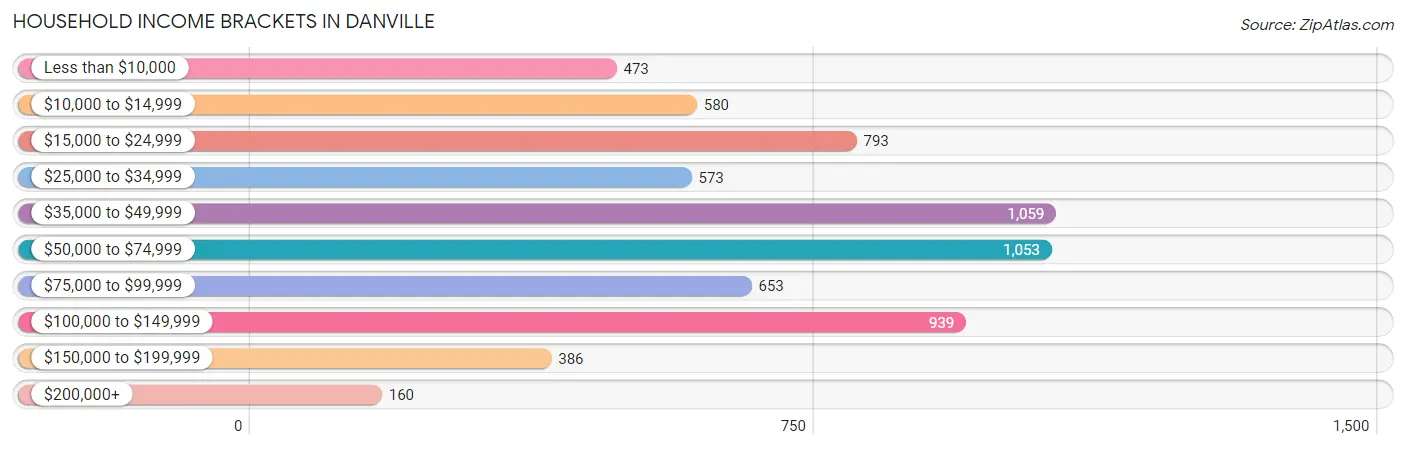
| Income Bracket | # Households | % Households |
| Less than $10,000 | 473 | 7.1% |
| $10,000 to $14,999 | 580 | 8.7% |
| $15,000 to $24,999 | 793 | 11.9% |
| $25,000 to $34,999 | 573 | 8.6% |
| $35,000 to $49,999 | 1,059 | 15.9% |
| $50,000 to $74,999 | 1,053 | 15.8% |
| $75,000 to $99,999 | 653 | 9.8% |
| $100,000 to $149,999 | 939 | 14.1% |
| $150,000 to $199,999 | 386 | 5.8% |
| $200,000+ | 160 | 2.4% |
Household Income by Householder Age in Danville
The median household income in Danville is $48,038, with the highest median household income of $57,121 found in the 25 to 44 years age bracket for the primary householder. A total of 1,952 households (29.3%) fall into this category. Meanwhile, the 15 to 24 years age bracket for the primary householder has the lowest median household income of $0, with 399 households (6.0%) in this group.
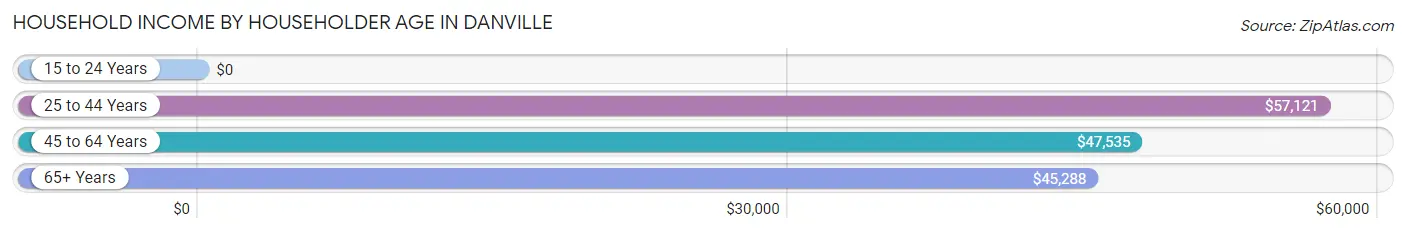
| Income Bracket | # Households | Median Income |
| 15 to 24 Years | 399 (6.0%) | $0 |
| 25 to 44 Years | 1,952 (29.3%) | $57,121 |
| 45 to 64 Years | 2,189 (32.9%) | $47,535 |
| 65+ Years | 2,123 (31.9%) | $45,288 |
| Total | 6,663 (100.0%) | $48,038 |
Poverty in Danville
Income Below Poverty by Sex and Age in Danville
With 14.3% poverty level for males and 19.3% for females among the residents of Danville, 6 to 11 year old males and 18 to 24 year old females are the most vulnerable to poverty, with 177 males (22.1%) and 270 females (36.5%) in their respective age groups living below the poverty level.
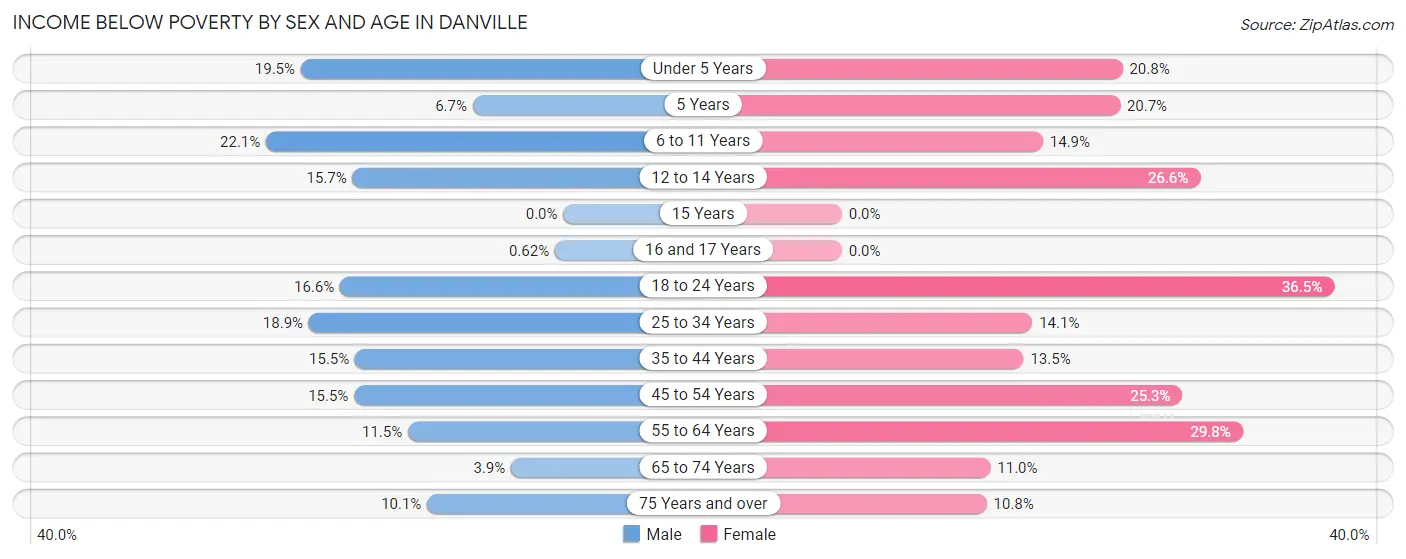
| Age Bracket | Male | Female |
| Under 5 Years | 76 (19.5%) | 79 (20.8%) |
| 5 Years | 9 (6.7%) | 19 (20.6%) |
| 6 to 11 Years | 177 (22.1%) | 89 (14.9%) |
| 12 to 14 Years | 23 (15.7%) | 83 (26.6%) |
| 15 Years | 0 (0.0%) | 0 (0.0%) |
| 16 and 17 Years | 1 (0.6%) | 0 (0.0%) |
| 18 to 24 Years | 93 (16.6%) | 270 (36.5%) |
| 25 to 34 Years | 197 (18.9%) | 143 (14.1%) |
| 35 to 44 Years | 124 (15.5%) | 104 (13.5%) |
| 45 to 54 Years | 157 (15.5%) | 269 (25.3%) |
| 55 to 64 Years | 95 (11.5%) | 285 (29.7%) |
| 65 to 74 Years | 30 (3.9%) | 125 (11.0%) |
| 75 Years and over | 45 (10.1%) | 85 (10.7%) |
| Total | 1,027 (14.3%) | 1,551 (19.3%) |
Income Above Poverty by Sex and Age in Danville
According to the poverty statistics in Danville, males aged 15 years and females aged 15 years are the age groups that are most secure financially, with 100.0% of males and 100.0% of females in these age groups living above the poverty line.
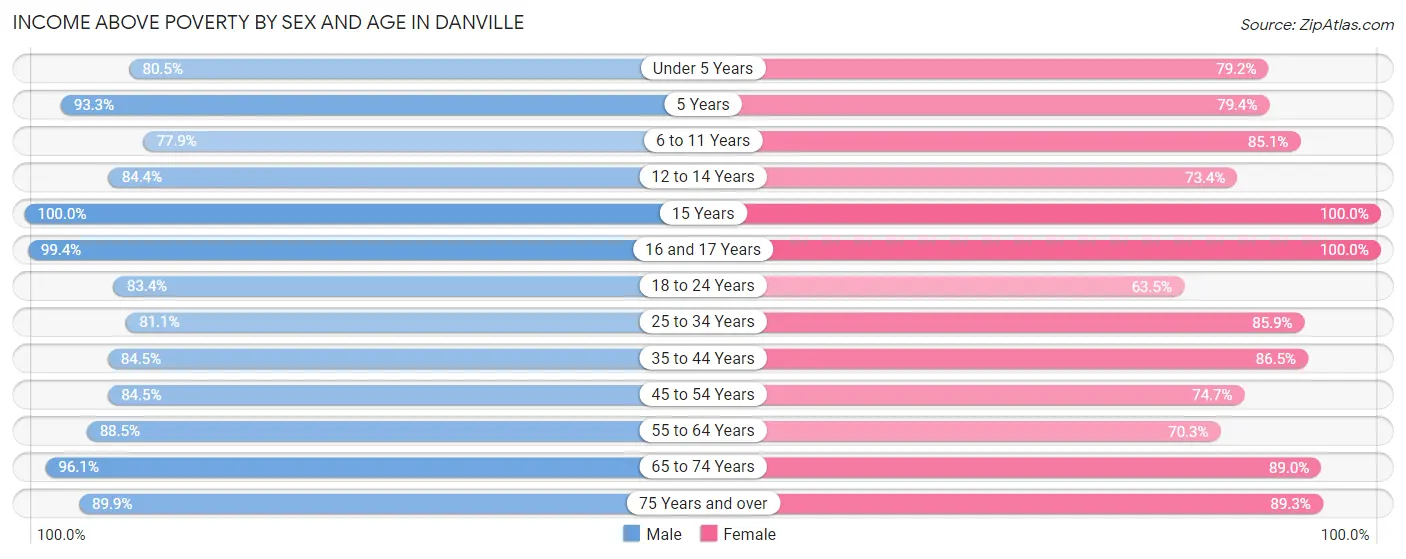
| Age Bracket | Male | Female |
| Under 5 Years | 314 (80.5%) | 300 (79.2%) |
| 5 Years | 125 (93.3%) | 73 (79.3%) |
| 6 to 11 Years | 625 (77.9%) | 507 (85.1%) |
| 12 to 14 Years | 124 (84.4%) | 229 (73.4%) |
| 15 Years | 79 (100.0%) | 22 (100.0%) |
| 16 and 17 Years | 159 (99.4%) | 177 (100.0%) |
| 18 to 24 Years | 468 (83.4%) | 469 (63.5%) |
| 25 to 34 Years | 846 (81.1%) | 868 (85.9%) |
| 35 to 44 Years | 678 (84.5%) | 667 (86.5%) |
| 45 to 54 Years | 854 (84.5%) | 795 (74.7%) |
| 55 to 64 Years | 729 (88.5%) | 673 (70.3%) |
| 65 to 74 Years | 743 (96.1%) | 1,008 (89.0%) |
| 75 Years and over | 400 (89.9%) | 706 (89.2%) |
| Total | 6,144 (85.7%) | 6,494 (80.7%) |
Income Below Poverty Among Married-Couple Families in Danville
The poverty statistics for married-couple families in Danville show that 3.9% or 98 of the total 2,517 families live below the poverty line. Families with 3 or 4 children have the highest poverty rate of 5.9%, comprising of 14 families. On the other hand, families with no children have the lowest poverty rate of 2.7%, which includes 41 families.
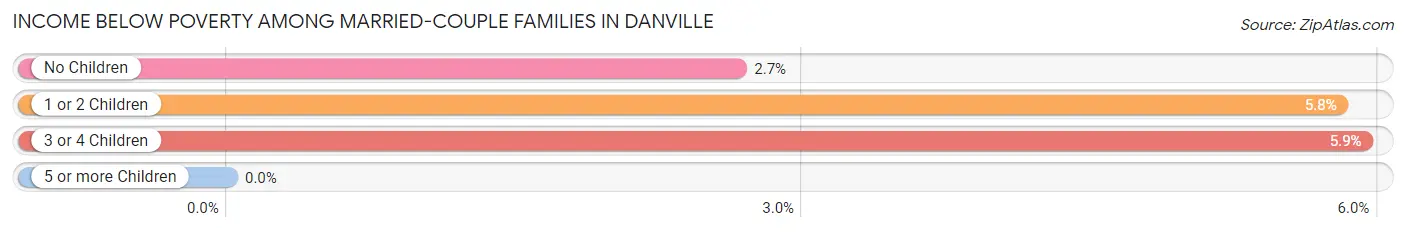
| Children | Above Poverty | Below Poverty |
| No Children | 1,498 (97.3%) | 41 (2.7%) |
| 1 or 2 Children | 699 (94.2%) | 43 (5.8%) |
| 3 or 4 Children | 222 (94.1%) | 14 (5.9%) |
| 5 or more Children | 0 (0.0%) | 0 (0.0%) |
| Total | 2,419 (96.1%) | 98 (3.9%) |
Income Below Poverty Among Single-Parent Households in Danville
According to the poverty data in Danville, 18.7% or 67 single-father households and 31.2% or 323 single-mother households are living below the poverty line. Among single-father households, those with 1 or 2 children have the highest poverty rate, with 34 households (23.0%) experiencing poverty. Likewise, among single-mother households, those with 3 or 4 children have the highest poverty rate, with 36 households (66.7%) falling below the poverty line.
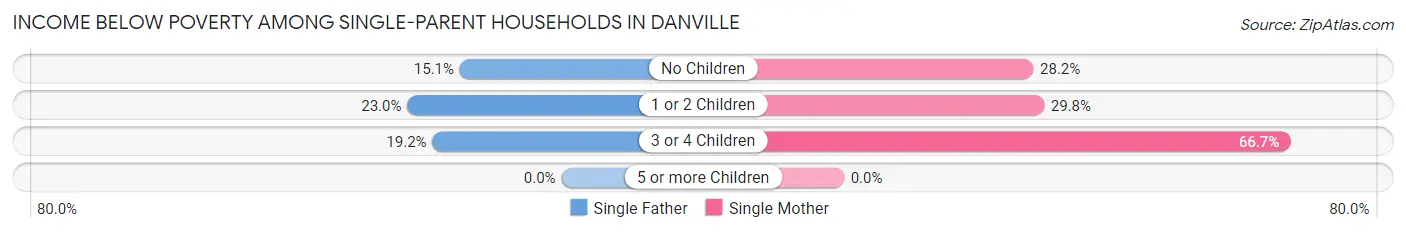
| Children | Single Father | Single Mother |
| No Children | 28 (15.1%) | 94 (28.2%) |
| 1 or 2 Children | 34 (23.0%) | 193 (29.8%) |
| 3 or 4 Children | 5 (19.2%) | 36 (66.7%) |
| 5 or more Children | 0 (0.0%) | 0 (0.0%) |
| Total | 67 (18.7%) | 323 (31.2%) |
Income Below Poverty Among Married-Couple vs Single-Parent Households in Danville
The poverty data for Danville shows that 98 of the married-couple family households (3.9%) and 390 of the single-parent households (28.0%) are living below the poverty level. Within the married-couple family households, those with 3 or 4 children have the highest poverty rate, with 14 households (5.9%) falling below the poverty line. Among the single-parent households, those with 3 or 4 children have the highest poverty rate, with 41 household (51.2%) living below poverty.
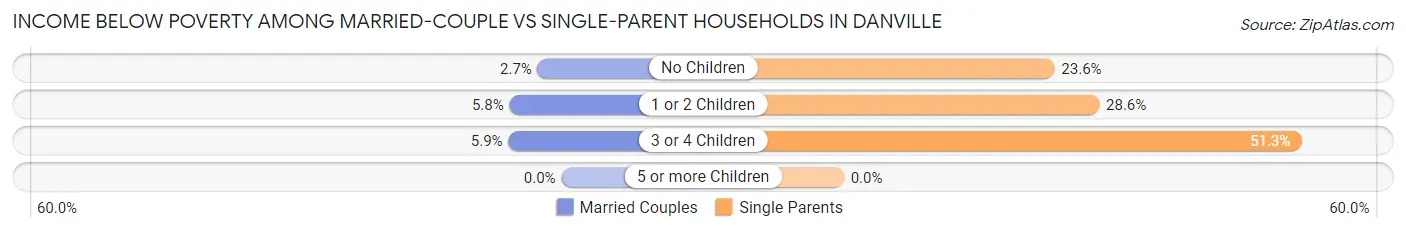
| Children | Married-Couple Families | Single-Parent Households |
| No Children | 41 (2.7%) | 122 (23.5%) |
| 1 or 2 Children | 43 (5.8%) | 227 (28.5%) |
| 3 or 4 Children | 14 (5.9%) | 41 (51.2%) |
| 5 or more Children | 0 (0.0%) | 0 (0.0%) |
| Total | 98 (3.9%) | 390 (28.0%) |
Race in Danville
The most populous races in Danville are White / Caucasian (13,921 | 81.0%), Black / African American (2,089 | 12.1%), and Hispanic or Latino (744 | 4.3%).
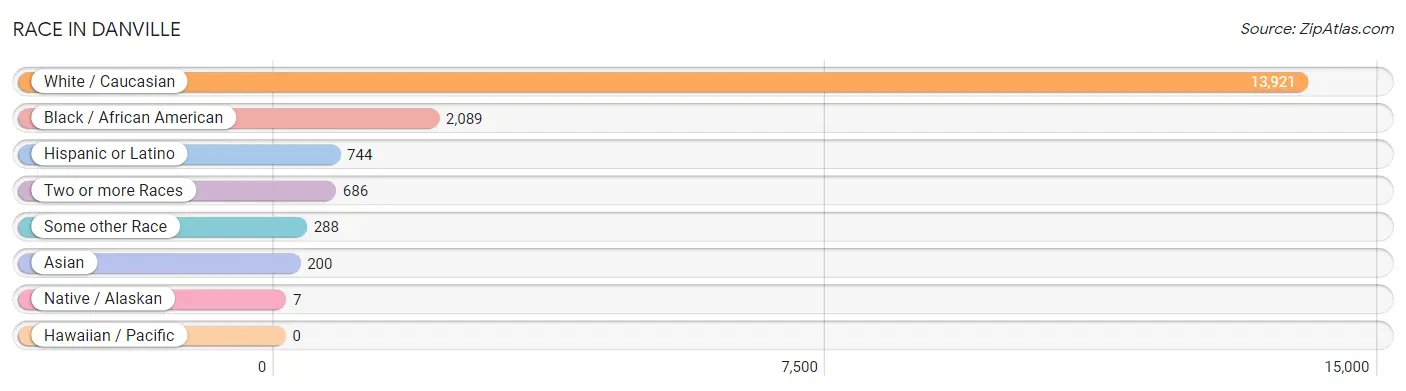
| Race | # Population | % Population |
| Asian | 200 | 1.2% |
| Black / African American | 2,089 | 12.1% |
| Hawaiian / Pacific | 0 | 0.0% |
| Hispanic or Latino | 744 | 4.3% |
| Native / Alaskan | 7 | 0.0% |
| White / Caucasian | 13,921 | 81.0% |
| Two or more Races | 686 | 4.0% |
| Some other Race | 288 | 1.7% |
| Total | 17,191 | 100.0% |
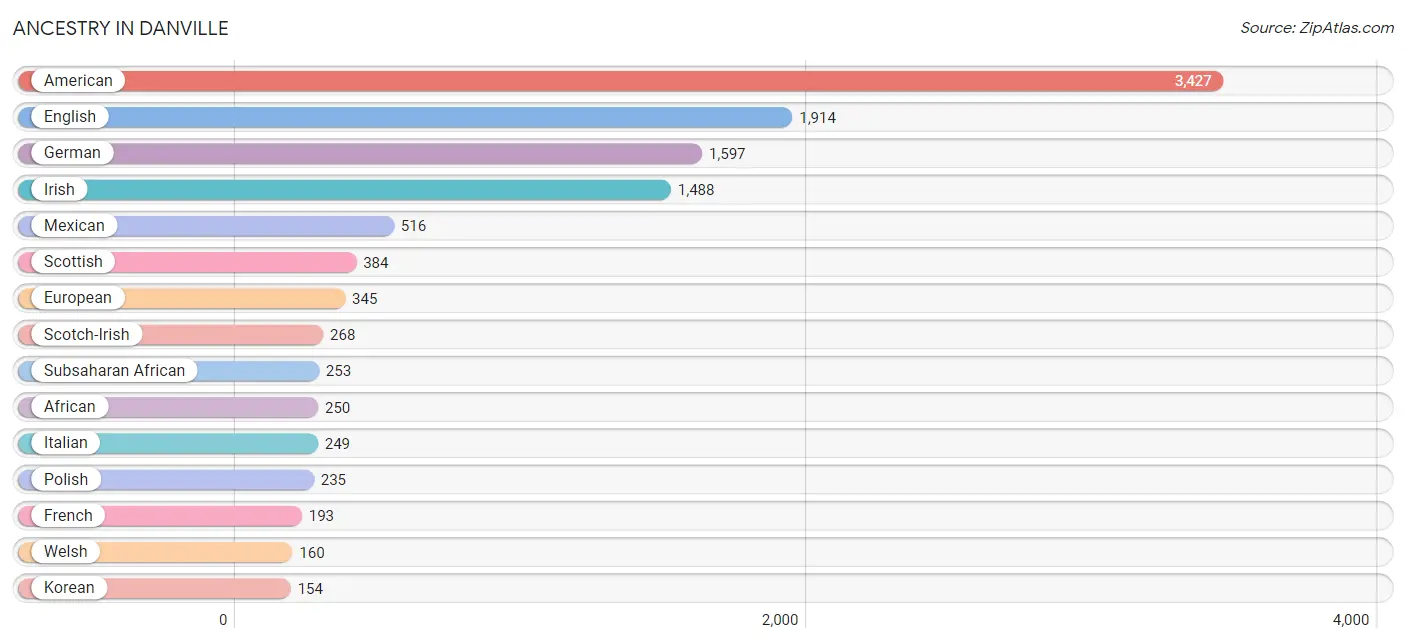
Ancestry in Danville
The most populous ancestries reported in Danville are American (3,427 | 19.9%), English (1,914 | 11.1%), German (1,597 | 9.3%), Irish (1,488 | 8.7%), and Mexican (516 | 3.0%), together accounting for 52.0% of all Danville residents.
| Ancestry | # Population | % Population |
| African | 250 | 1.5% |
| Alsatian | 8 | 0.1% |
| American | 3,427 | 19.9% |
| Arab | 54 | 0.3% |
| Argentinean | 19 | 0.1% |
| Austrian | 5 | 0.0% |
| Bhutanese | 18 | 0.1% |
| Blackfeet | 8 | 0.1% |
| British | 109 | 0.6% |
| Canadian | 58 | 0.3% |
| Central American | 72 | 0.4% |
| Cherokee | 52 | 0.3% |
| Chippewa | 2 | 0.0% |
| Croatian | 7 | 0.0% |
| Cuban | 48 | 0.3% |
| Czech | 20 | 0.1% |
| Danish | 16 | 0.1% |
| Dominican | 5 | 0.0% |
| Dutch | 109 | 0.6% |
| Eastern European | 77 | 0.4% |
| Egyptian | 8 | 0.1% |
| English | 1,914 | 11.1% |
| Ethiopian | 3 | 0.0% |
| European | 345 | 2.0% |
| Finnish | 17 | 0.1% |
| French | 193 | 1.1% |
| French Canadian | 28 | 0.2% |
| German | 1,597 | 9.3% |
| Greek | 46 | 0.3% |
| Guatemalan | 4 | 0.0% |
| Haitian | 10 | 0.1% |
| Hungarian | 112 | 0.6% |
| Indian (Asian) | 82 | 0.5% |
| Indonesian | 8 | 0.1% |
| Iranian | 7 | 0.0% |
| Irish | 1,488 | 8.7% |
| Italian | 249 | 1.5% |
| Jamaican | 14 | 0.1% |
| Jordanian | 26 | 0.2% |
| Korean | 154 | 0.9% |
| Lithuanian | 14 | 0.1% |
| Maltese | 14 | 0.1% |
| Mexican | 516 | 3.0% |
| Mongolian | 22 | 0.1% |
| Moroccan | 7 | 0.0% |
| New Zealander | 8 | 0.1% |
| Norwegian | 71 | 0.4% |
| Pakistani | 62 | 0.4% |
| Panamanian | 30 | 0.2% |
| Polish | 235 | 1.4% |
| Puerto Rican | 39 | 0.2% |
| Russian | 53 | 0.3% |
| Salvadoran | 38 | 0.2% |
| Scandinavian | 21 | 0.1% |
| Scotch-Irish | 268 | 1.6% |
| Scottish | 384 | 2.2% |
| South American | 19 | 0.1% |
| Spaniard | 22 | 0.1% |
| Spanish | 3 | 0.0% |
| Sri Lankan | 47 | 0.3% |
| Subsaharan African | 253 | 1.5% |
| Swedish | 114 | 0.7% |
| Swiss | 14 | 0.1% |
| Syrian | 13 | 0.1% |
| Thai | 7 | 0.0% |
| Ukrainian | 42 | 0.2% |
| Welsh | 160 | 0.9% | View All 67 Rows |
Immigrants in Danville
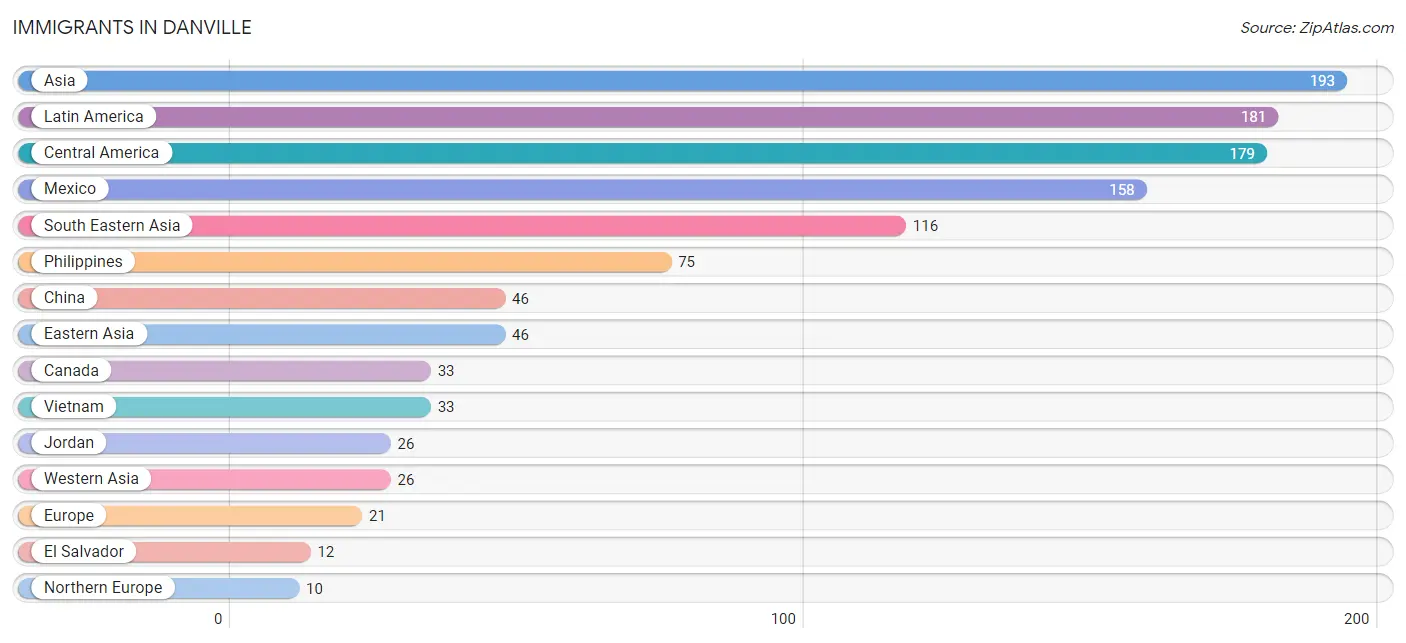
The most numerous immigrant groups reported in Danville came from Asia (193 | 1.1%), Latin America (181 | 1.1%), Central America (179 | 1.0%), Mexico (158 | 0.9%), and South Eastern Asia (116 | 0.7%), together accounting for 4.8% of all Danville residents.
| Immigration Origin | # Population | % Population |
| Asia | 193 | 1.1% |
| Canada | 33 | 0.2% |
| Caribbean | 2 | 0.0% |
| Central America | 179 | 1.0% |
| China | 46 | 0.3% |
| Dominican Republic | 2 | 0.0% |
| Eastern Asia | 46 | 0.3% |
| Eastern Europe | 3 | 0.0% |
| El Salvador | 12 | 0.1% |
| England | 5 | 0.0% |
| Europe | 21 | 0.1% |
| Honduras | 9 | 0.1% |
| India | 5 | 0.0% |
| Italy | 8 | 0.1% |
| Jordan | 26 | 0.2% |
| Latin America | 181 | 1.1% |
| Mexico | 158 | 0.9% |
| Northern Europe | 10 | 0.1% |
| Philippines | 75 | 0.4% |
| Russia | 3 | 0.0% |
| Scotland | 5 | 0.0% |
| South Central Asia | 5 | 0.0% |
| South Eastern Asia | 116 | 0.7% |
| Southern Europe | 8 | 0.1% |
| Vietnam | 33 | 0.2% |
| Western Asia | 26 | 0.2% | View All 26 Rows |
Sex and Age in Danville
Sex and Age in Danville
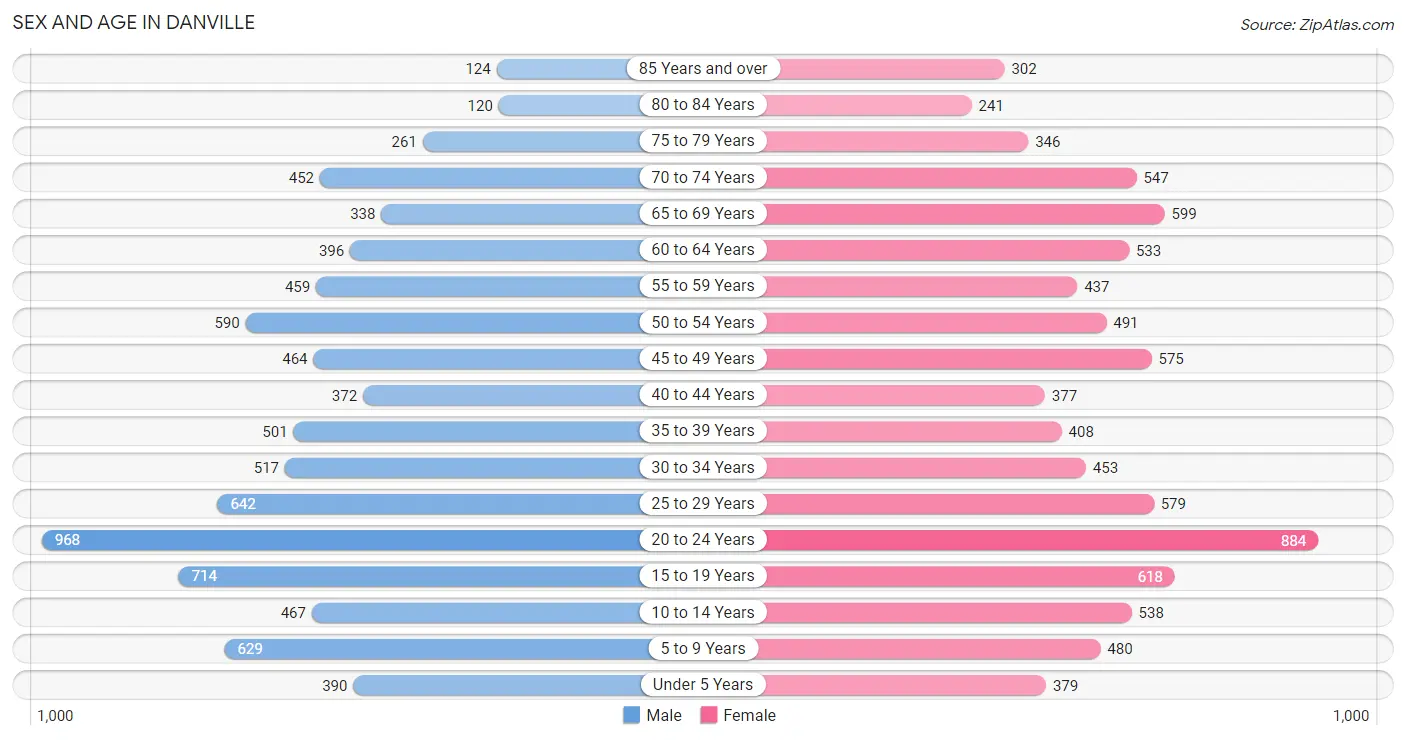
The most populous age groups in Danville are 20 to 24 Years (968 | 11.5%) for men and 20 to 24 Years (884 | 10.1%) for women.
| Age Bracket | Male | Female |
| Under 5 Years | 390 (4.6%) | 379 (4.3%) |
| 5 to 9 Years | 629 (7.5%) | 480 (5.5%) |
| 10 to 14 Years | 467 (5.6%) | 538 (6.1%) |
| 15 to 19 Years | 714 (8.5%) | 618 (7.0%) |
| 20 to 24 Years | 968 (11.5%) | 884 (10.1%) |
| 25 to 29 Years | 642 (7.6%) | 579 (6.6%) |
| 30 to 34 Years | 517 (6.1%) | 453 (5.2%) |
| 35 to 39 Years | 501 (6.0%) | 408 (4.6%) |
| 40 to 44 Years | 372 (4.4%) | 377 (4.3%) |
| 45 to 49 Years | 464 (5.5%) | 575 (6.5%) |
| 50 to 54 Years | 590 (7.0%) | 491 (5.6%) |
| 55 to 59 Years | 459 (5.5%) | 437 (5.0%) |
| 60 to 64 Years | 396 (4.7%) | 533 (6.1%) |
| 65 to 69 Years | 338 (4.0%) | 599 (6.8%) |
| 70 to 74 Years | 452 (5.4%) | 547 (6.2%) |
| 75 to 79 Years | 261 (3.1%) | 346 (3.9%) |
| 80 to 84 Years | 120 (1.4%) | 241 (2.7%) |
| 85 Years and over | 124 (1.5%) | 302 (3.4%) |
| Total | 8,404 (100.0%) | 8,787 (100.0%) |
Families and Households in Danville
Median Family Size in Danville
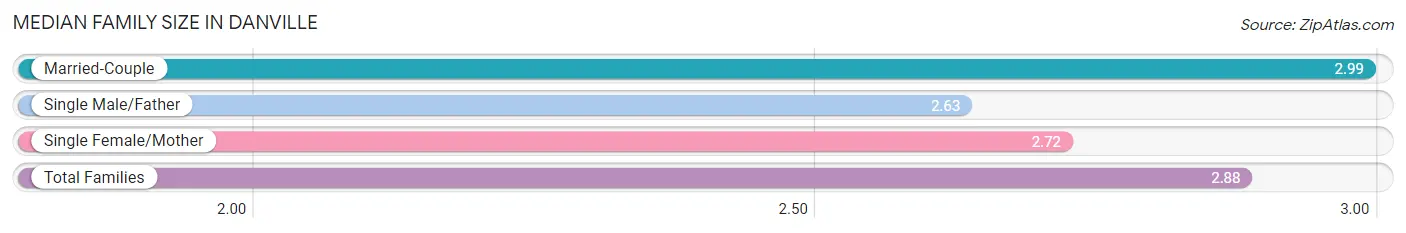
The median family size in Danville is 2.88 persons per family, with married-couple families (2,517 | 64.4%) accounting for the largest median family size of 2.99 persons per family. On the other hand, single male/father families (359 | 9.2%) represent the smallest median family size with 2.63 persons per family.
| Family Type | # Families | Family Size |
| Married-Couple | 2,517 (64.4%) | 2.99 |
| Single Male/Father | 359 (9.2%) | 2.63 |
| Single Female/Mother | 1,034 (26.5%) | 2.72 |
| Total Families | 3,910 (100.0%) | 2.88 |
Median Household Size in Danville
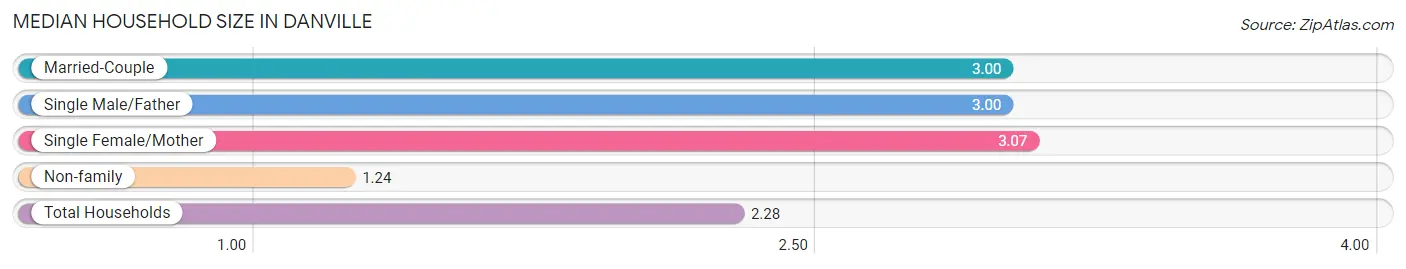
The median household size in Danville is 2.28 persons per household, with single female/mother households (1,034 | 15.5%) accounting for the largest median household size of 3.07 persons per household. non-family households (2,753 | 41.3%) represent the smallest median household size with 1.24 persons per household.
| Household Type | # Households | Household Size |
| Married-Couple | 2,517 (37.8%) | 3.00 |
| Single Male/Father | 359 (5.4%) | 3.00 |
| Single Female/Mother | 1,034 (15.5%) | 3.07 |
| Non-family | 2,753 (41.3%) | 1.24 |
| Total Households | 6,663 (100.0%) | 2.28 |
Household Size by Marriage Status in Danville
Out of a total of 6,663 households in Danville, 3,910 (58.7%) are family households, while 2,753 (41.3%) are nonfamily households. The most numerous type of family households are 2-person households, comprising 2,074, and the most common type of nonfamily households are 1-person households, comprising 2,418.
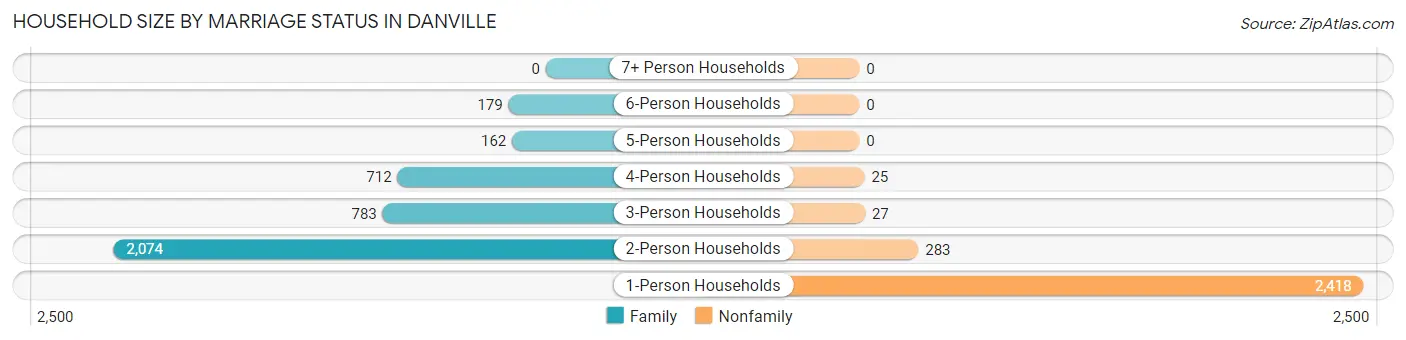
| Household Size | Family Households | Nonfamily Households |
| 1-Person Households | - | 2,418 (36.3%) |
| 2-Person Households | 2,074 (31.1%) | 283 (4.3%) |
| 3-Person Households | 783 (11.7%) | 27 (0.4%) |
| 4-Person Households | 712 (10.7%) | 25 (0.4%) |
| 5-Person Households | 162 (2.4%) | 0 (0.0%) |
| 6-Person Households | 179 (2.7%) | 0 (0.0%) |
| 7+ Person Households | 0 (0.0%) | 0 (0.0%) |
| Total | 3,910 (58.7%) | 2,753 (41.3%) |
Female Fertility in Danville
Fertility by Age in Danville
Average fertility rate in Danville is 63.0 births per 1,000 women. Women in the age bracket of 20 to 34 years have the highest fertility rate with 120.0 births per 1,000 women. Women in the age bracket of 20 to 34 years acount for 91.2% of all women with births.
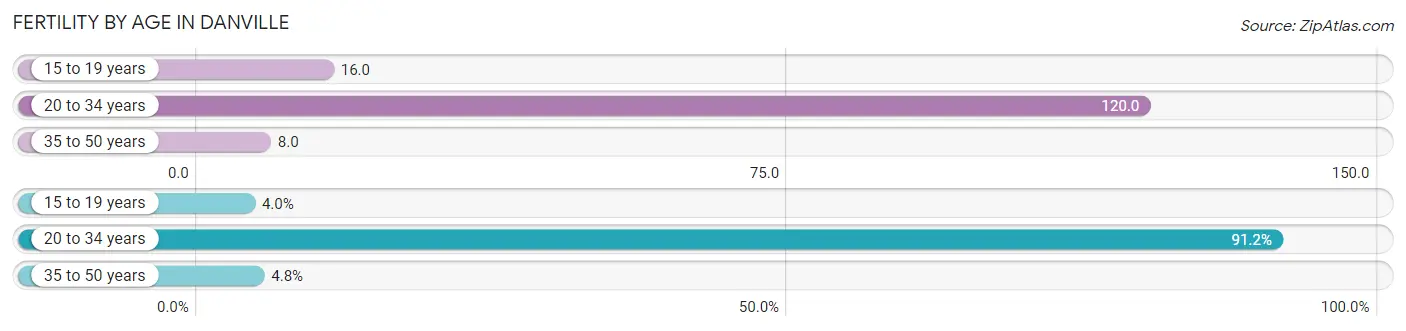
| Age Bracket | Women with Births | Births / 1,000 Women |
| 15 to 19 years | 10 (4.0%) | 16.0 |
| 20 to 34 years | 229 (91.2%) | 120.0 |
| 35 to 50 years | 12 (4.8%) | 8.0 |
| Total | 251 (100.0%) | 63.0 |
Fertility by Age by Marriage Status in Danville
74.5% of women with births (251) in Danville are married. The highest percentage of unmarried women with births falls into 15 to 19 years age bracket with 100.0% of them unmarried at the time of birth, while the lowest percentage of unmarried women with births belong to 35 to 50 years age bracket with 0.0% of them unmarried.
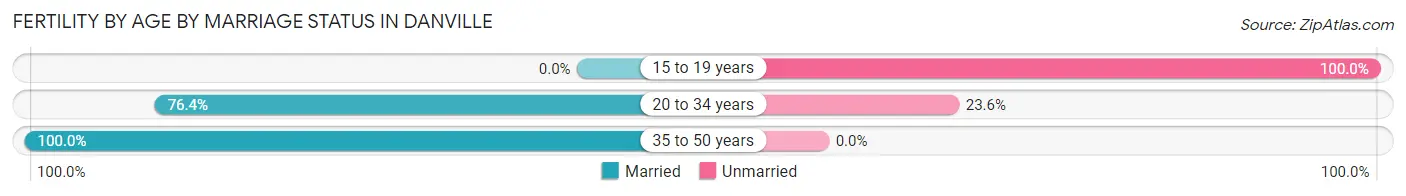
| Age Bracket | Married | Unmarried |
| 15 to 19 years | 0 (0.0%) | 10 (100.0%) |
| 20 to 34 years | 175 (76.4%) | 54 (23.6%) |
| 35 to 50 years | 12 (100.0%) | 0 (0.0%) |
| Total | 187 (74.5%) | 64 (25.5%) |
Fertility by Education in Danville
Average fertility rate in Danville is 63.0 births per 1,000 women. Women with the education attainment of high school diploma have the highest fertility rate of 172.0 births per 1,000 women, while women with the education attainment of college or associate's degree have the lowest fertility at 8.0 births per 1,000 women. Women with the education attainment of high school diploma represent 72.5% of all women with births.
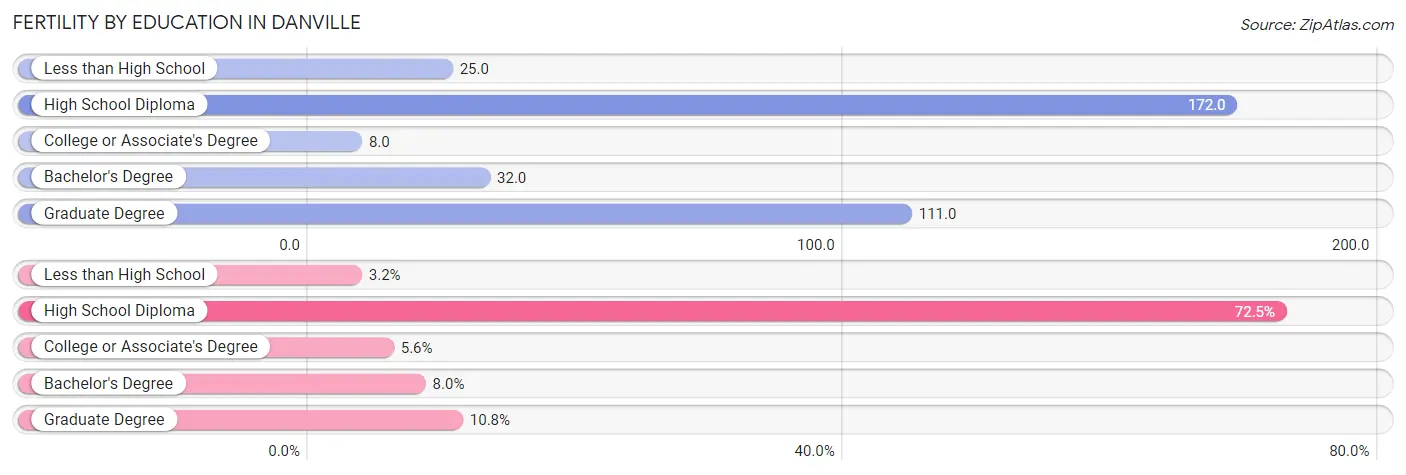
| Educational Attainment | Women with Births | Births / 1,000 Women |
| Less than High School | 8 (3.2%) | 25.0 |
| High School Diploma | 182 (72.5%) | 172.0 |
| College or Associate's Degree | 14 (5.6%) | 8.0 |
| Bachelor's Degree | 20 (8.0%) | 32.0 |
| Graduate Degree | 27 (10.8%) | 111.0 |
| Total | 251 (100.0%) | 63.0 |
Fertility by Education by Marriage Status in Danville
25.5% of women with births in Danville are unmarried. Women with the educational attainment of bachelor's degree are most likely to be married with 100.0% of them married at childbirth, while women with the educational attainment of less than high school are least likely to be married with 100.0% of them unmarried at childbirth.
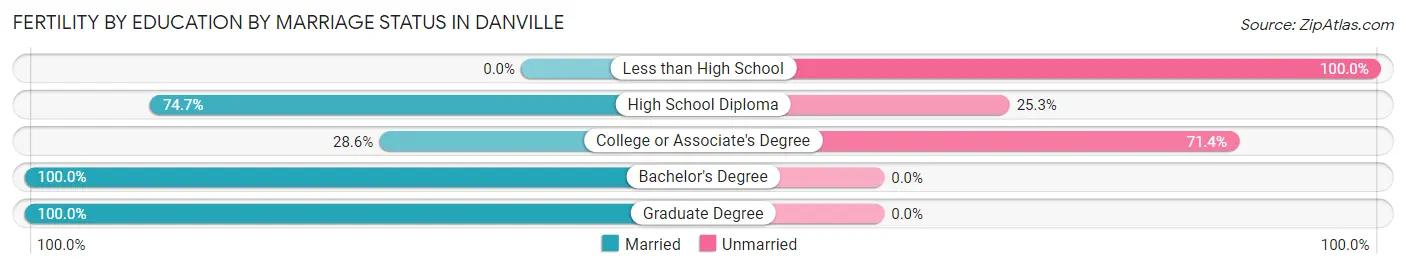
| Educational Attainment | Married | Unmarried |
| Less than High School | 0 (0.0%) | 8 (100.0%) |
| High School Diploma | 136 (74.7%) | 46 (25.3%) |
| College or Associate's Degree | 4 (28.6%) | 10 (71.4%) |
| Bachelor's Degree | 20 (100.0%) | 0 (0.0%) |
| Graduate Degree | 27 (100.0%) | 0 (0.0%) |
| Total | 187 (74.5%) | 64 (25.5%) |
Employment Characteristics in Danville
Employment by Class of Employer in Danville
Among the 6,770 employed individuals in Danville, private company employees (4,479 | 66.2%), not-for-profit organizations (897 | 13.3%), and state government employees (488 | 7.2%) make up the most common classes of employment.
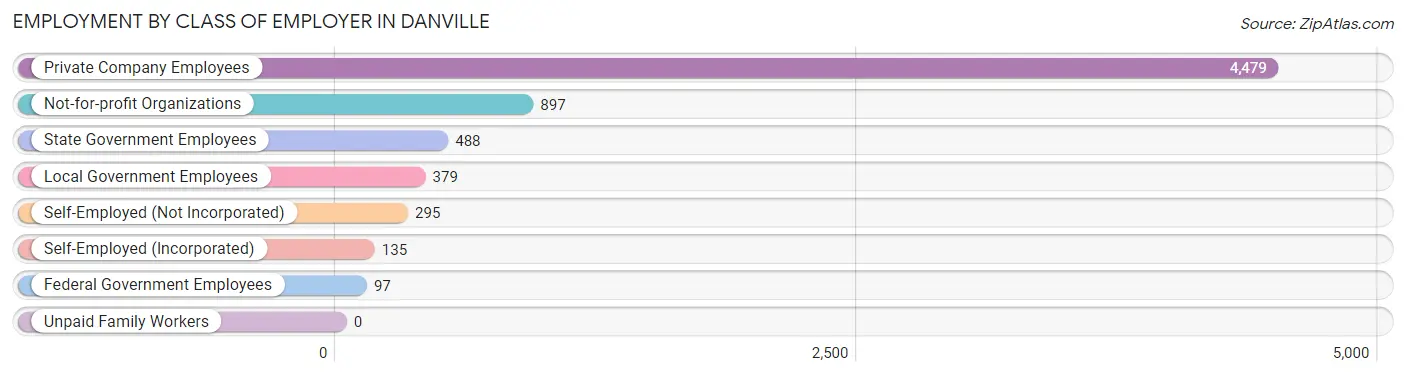
| Employer Class | # Employees | % Employees |
| Private Company Employees | 4,479 | 66.2% |
| Self-Employed (Incorporated) | 135 | 2.0% |
| Self-Employed (Not Incorporated) | 295 | 4.4% |
| Not-for-profit Organizations | 897 | 13.3% |
| Local Government Employees | 379 | 5.6% |
| State Government Employees | 488 | 7.2% |
| Federal Government Employees | 97 | 1.4% |
| Unpaid Family Workers | 0 | 0.0% |
| Total | 6,770 | 100.0% |
Employment Status by Age in Danville
According to the labor force statistics for Danville, out of the total population over 16 years of age (14,205), 54.2% or 7,699 individuals are in the labor force, with 8.2% or 631 of them unemployed. The age group with the highest labor force participation rate is 30 to 34 years, with 87.1% or 845 individuals in the labor force. Within the labor force, the 60 to 64 years age range has the highest percentage of unemployed individuals, with 30.4% or 147 of them being unemployed.
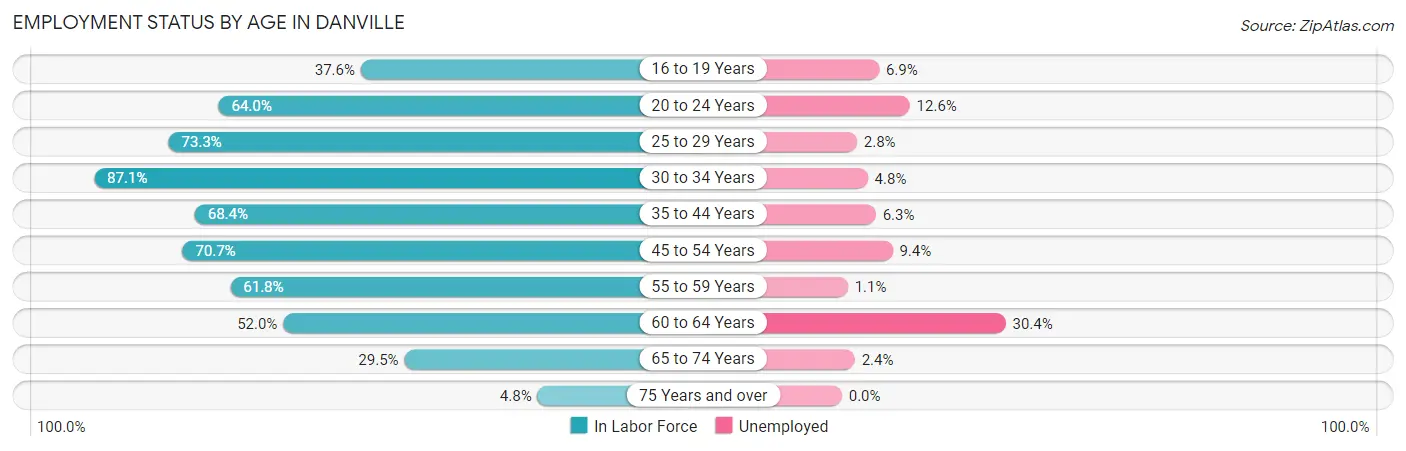
| Age Bracket | In Labor Force | Unemployed |
| 16 to 19 Years | 462 (37.6%) | 32 (6.9%) |
| 20 to 24 Years | 1,185 (64.0%) | 149 (12.6%) |
| 25 to 29 Years | 895 (73.3%) | 25 (2.8%) |
| 30 to 34 Years | 845 (87.1%) | 41 (4.8%) |
| 35 to 44 Years | 1,134 (68.4%) | 71 (6.3%) |
| 45 to 54 Years | 1,499 (70.7%) | 141 (9.4%) |
| 55 to 59 Years | 554 (61.8%) | 6 (1.1%) |
| 60 to 64 Years | 483 (52.0%) | 147 (30.4%) |
| 65 to 74 Years | 571 (29.5%) | 14 (2.4%) |
| 75 Years and over | 67 (4.8%) | 0 (0.0%) |
| Total | 7,699 (54.2%) | 631 (8.2%) |
Employment Status by Educational Attainment in Danville
According to labor force statistics for Danville, 69.4% of individuals (5,409) out of the total population between 25 and 64 years of age (7,794) are in the labor force, with 8.0% or 433 of them being unemployed. The group with the highest labor force participation rate are those with the educational attainment of bachelor's degree or higher, with 88.5% or 1,729 individuals in the labor force. Within the labor force, individuals with less than high school education have the highest percentage of unemployment, with 15.9% or 40 of them being unemployed.
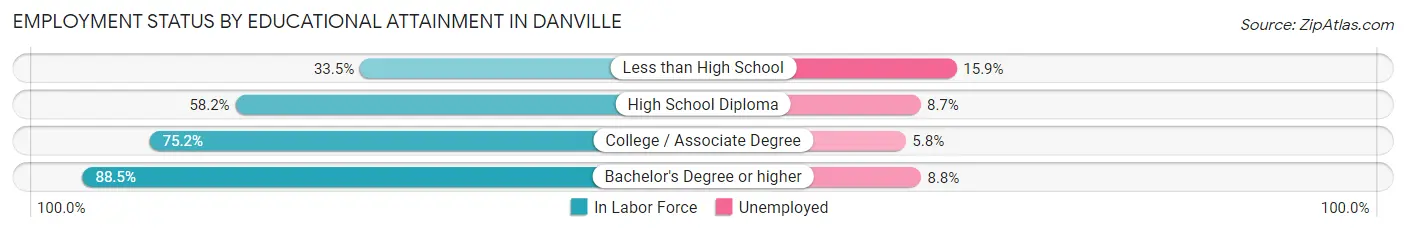
| Educational Attainment | In Labor Force | Unemployed |
| Less than High School | 251 (33.5%) | 119 (15.9%) |
| High School Diploma | 1,362 (58.2%) | 204 (8.7%) |
| College / Associate Degree | 2,069 (75.2%) | 160 (5.8%) |
| Bachelor's Degree or higher | 1,729 (88.5%) | 172 (8.8%) |
| Total | 5,409 (69.4%) | 624 (8.0%) |
Employment Occupations by Sex in Danville
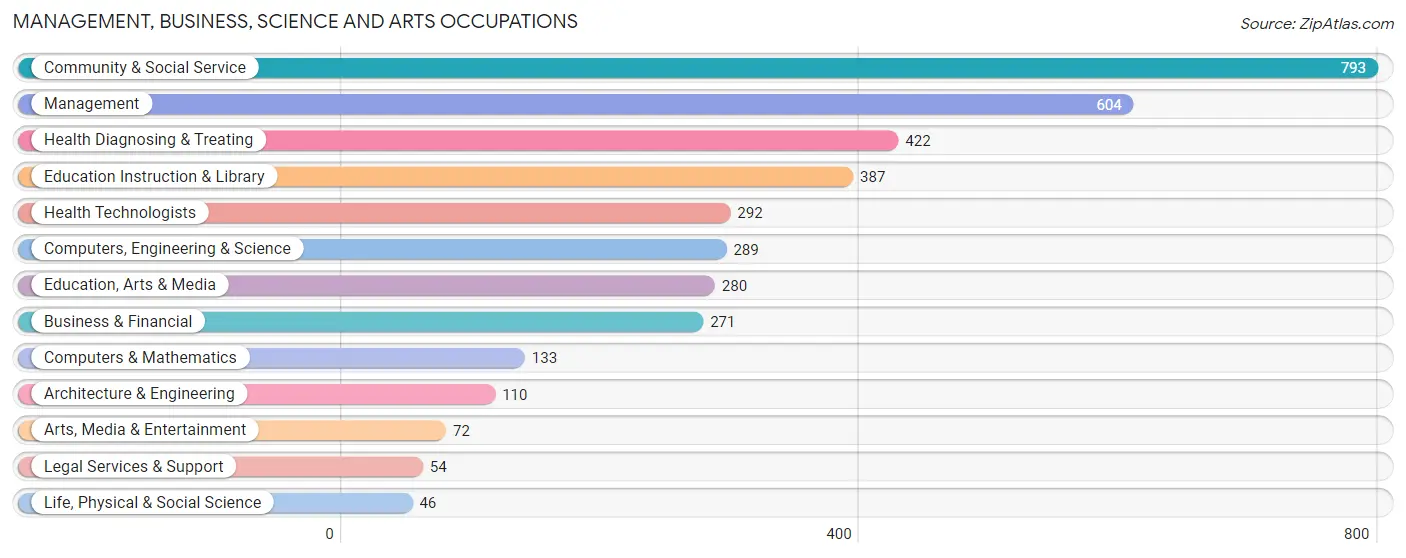
Management, Business, Science and Arts Occupations
The most common Management, Business, Science and Arts occupations in Danville are Community & Social Service (793 | 11.3%), Management (604 | 8.6%), Health Diagnosing & Treating (422 | 6.0%), Education Instruction & Library (387 | 5.5%), and Health Technologists (292 | 4.2%).
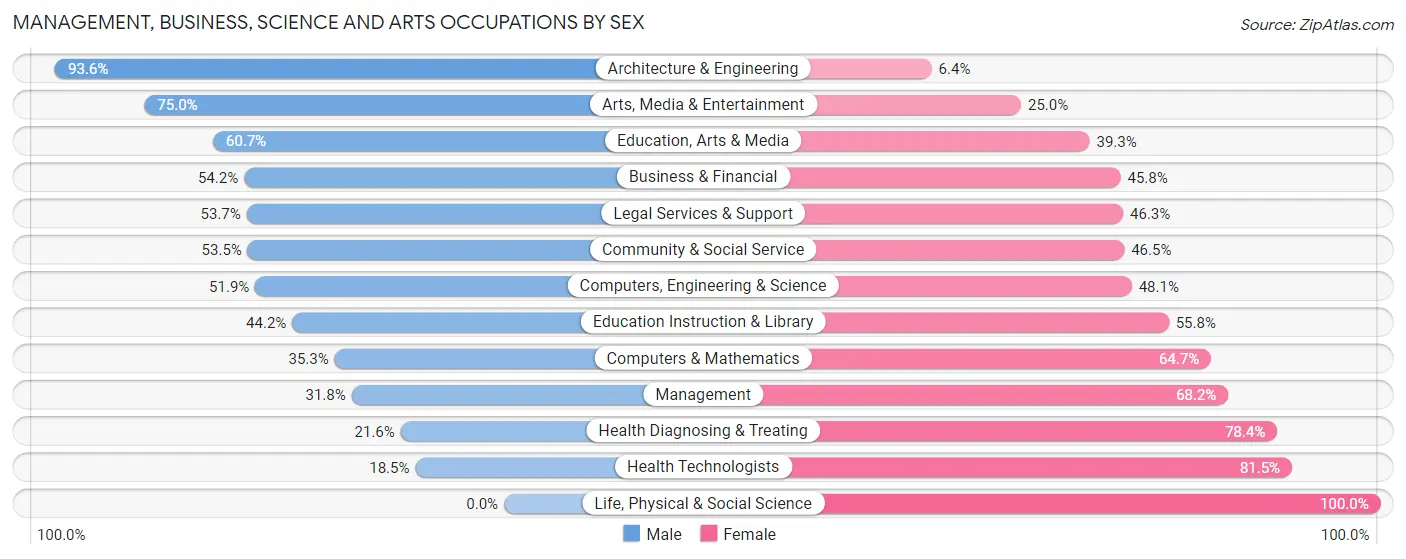
Management, Business, Science and Arts Occupations by Sex
Within the Management, Business, Science and Arts occupations in Danville, the most male-oriented occupations are Architecture & Engineering (93.6%), Arts, Media & Entertainment (75.0%), and Education, Arts & Media (60.7%), while the most female-oriented occupations are Life, Physical & Social Science (100.0%), Health Technologists (81.5%), and Health Diagnosing & Treating (78.4%).
| Occupation | Male | Female |
| Management | 192 (31.8%) | 412 (68.2%) |
| Business & Financial | 147 (54.2%) | 124 (45.8%) |
| Computers, Engineering & Science | 150 (51.9%) | 139 (48.1%) |
| Computers & Mathematics | 47 (35.3%) | 86 (64.7%) |
| Architecture & Engineering | 103 (93.6%) | 7 (6.4%) |
| Life, Physical & Social Science | 0 (0.0%) | 46 (100.0%) |
| Community & Social Service | 424 (53.5%) | 369 (46.5%) |
| Education, Arts & Media | 170 (60.7%) | 110 (39.3%) |
| Legal Services & Support | 29 (53.7%) | 25 (46.3%) |
| Education Instruction & Library | 171 (44.2%) | 216 (55.8%) |
| Arts, Media & Entertainment | 54 (75.0%) | 18 (25.0%) |
| Health Diagnosing & Treating | 91 (21.6%) | 331 (78.4%) |
| Health Technologists | 54 (18.5%) | 238 (81.5%) |
| Total (Category) | 1,004 (42.2%) | 1,375 (57.8%) |
| Total (Overall) | 3,470 (49.4%) | 3,557 (50.6%) |
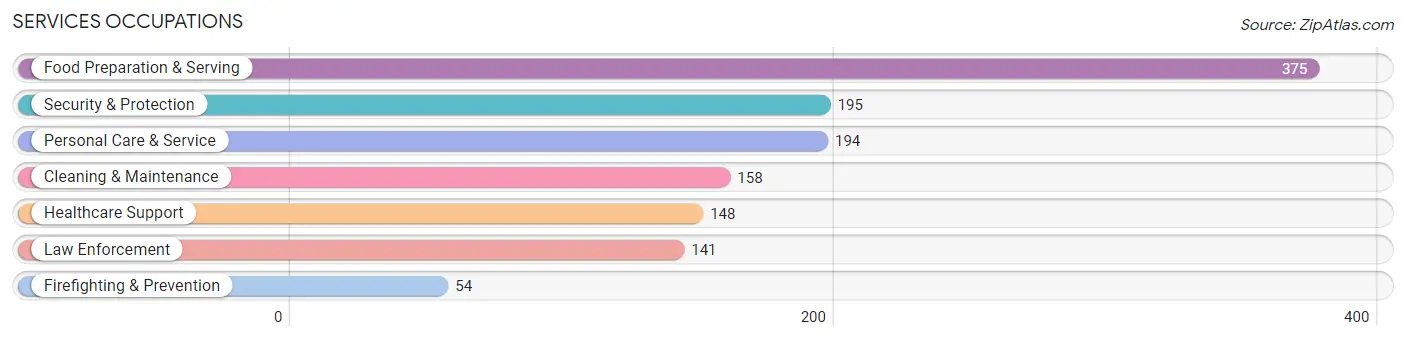
Services Occupations
The most common Services occupations in Danville are Food Preparation & Serving (375 | 5.3%), Security & Protection (195 | 2.8%), Personal Care & Service (194 | 2.8%), Cleaning & Maintenance (158 | 2.2%), and Healthcare Support (148 | 2.1%).
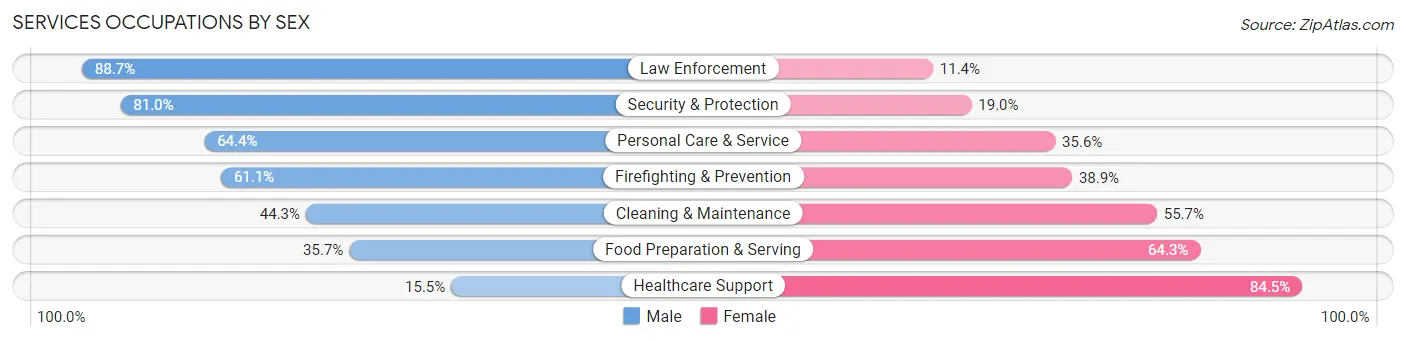
Services Occupations by Sex
Within the Services occupations in Danville, the most male-oriented occupations are Law Enforcement (88.6%), Security & Protection (81.0%), and Personal Care & Service (64.4%), while the most female-oriented occupations are Healthcare Support (84.5%), Food Preparation & Serving (64.3%), and Cleaning & Maintenance (55.7%).
| Occupation | Male | Female |
| Healthcare Support | 23 (15.5%) | 125 (84.5%) |
| Security & Protection | 158 (81.0%) | 37 (19.0%) |
| Firefighting & Prevention | 33 (61.1%) | 21 (38.9%) |
| Law Enforcement | 125 (88.6%) | 16 (11.4%) |
| Food Preparation & Serving | 134 (35.7%) | 241 (64.3%) |
| Cleaning & Maintenance | 70 (44.3%) | 88 (55.7%) |
| Personal Care & Service | 125 (64.4%) | 69 (35.6%) |
| Total (Category) | 510 (47.7%) | 560 (52.3%) |
| Total (Overall) | 3,470 (49.4%) | 3,557 (50.6%) |
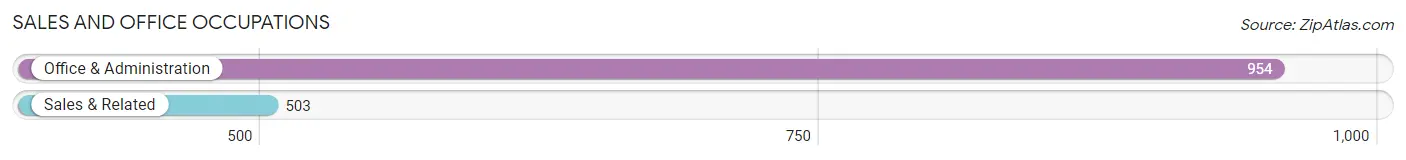
Sales and Office Occupations
The most common Sales and Office occupations in Danville are Office & Administration (954 | 13.6%), and Sales & Related (503 | 7.2%).
Sales and Office Occupations by Sex
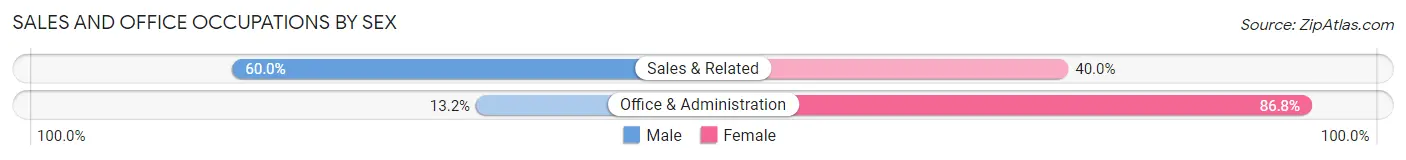
| Occupation | Male | Female |
| Sales & Related | 302 (60.0%) | 201 (40.0%) |
| Office & Administration | 126 (13.2%) | 828 (86.8%) |
| Total (Category) | 428 (29.4%) | 1,029 (70.6%) |
| Total (Overall) | 3,470 (49.4%) | 3,557 (50.6%) |
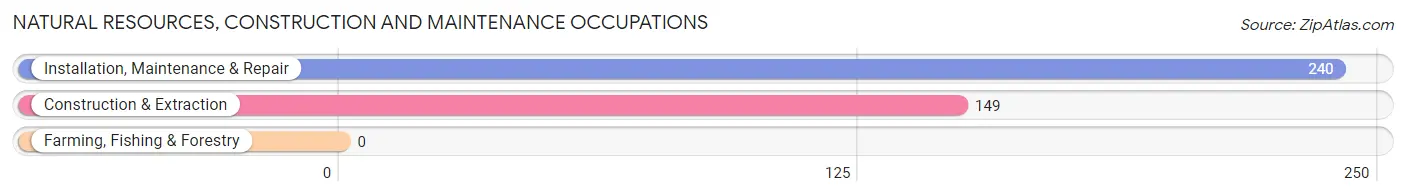
Natural Resources, Construction and Maintenance Occupations
The most common Natural Resources, Construction and Maintenance occupations in Danville are Installation, Maintenance & Repair (240 | 3.4%), and Construction & Extraction (149 | 2.1%).
Natural Resources, Construction and Maintenance Occupations by Sex
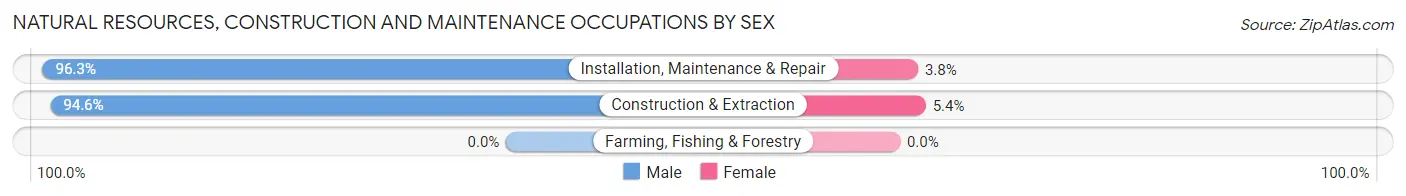
| Occupation | Male | Female |
| Farming, Fishing & Forestry | 0 (0.0%) | 0 (0.0%) |
| Construction & Extraction | 141 (94.6%) | 8 (5.4%) |
| Installation, Maintenance & Repair | 231 (96.3%) | 9 (3.7%) |
| Total (Category) | 372 (95.6%) | 17 (4.4%) |
| Total (Overall) | 3,470 (49.4%) | 3,557 (50.6%) |
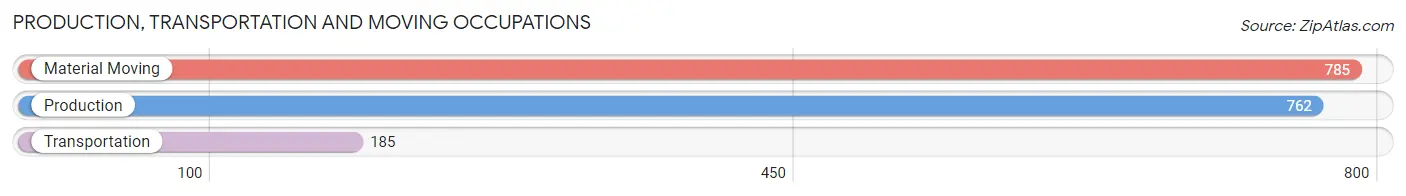
Production, Transportation and Moving Occupations
The most common Production, Transportation and Moving occupations in Danville are Material Moving (785 | 11.2%), Production (762 | 10.8%), and Transportation (185 | 2.6%).
Production, Transportation and Moving Occupations by Sex
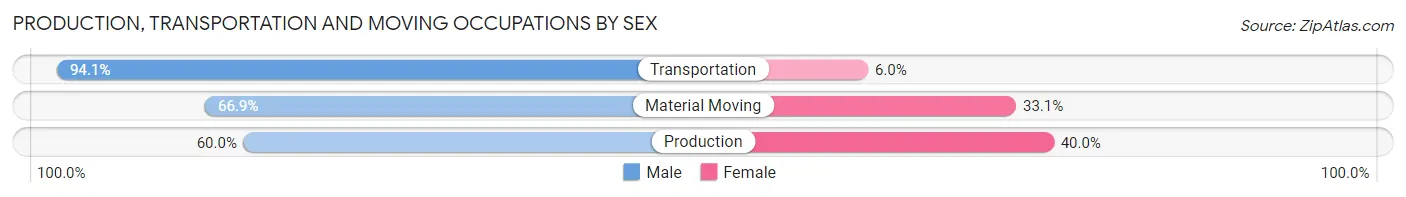
| Occupation | Male | Female |
| Production | 457 (60.0%) | 305 (40.0%) |
| Transportation | 174 (94.1%) | 11 (5.9%) |
| Material Moving | 525 (66.9%) | 260 (33.1%) |
| Total (Category) | 1,156 (66.7%) | 576 (33.3%) |
| Total (Overall) | 3,470 (49.4%) | 3,557 (50.6%) |
Employment Industries by Sex in Danville
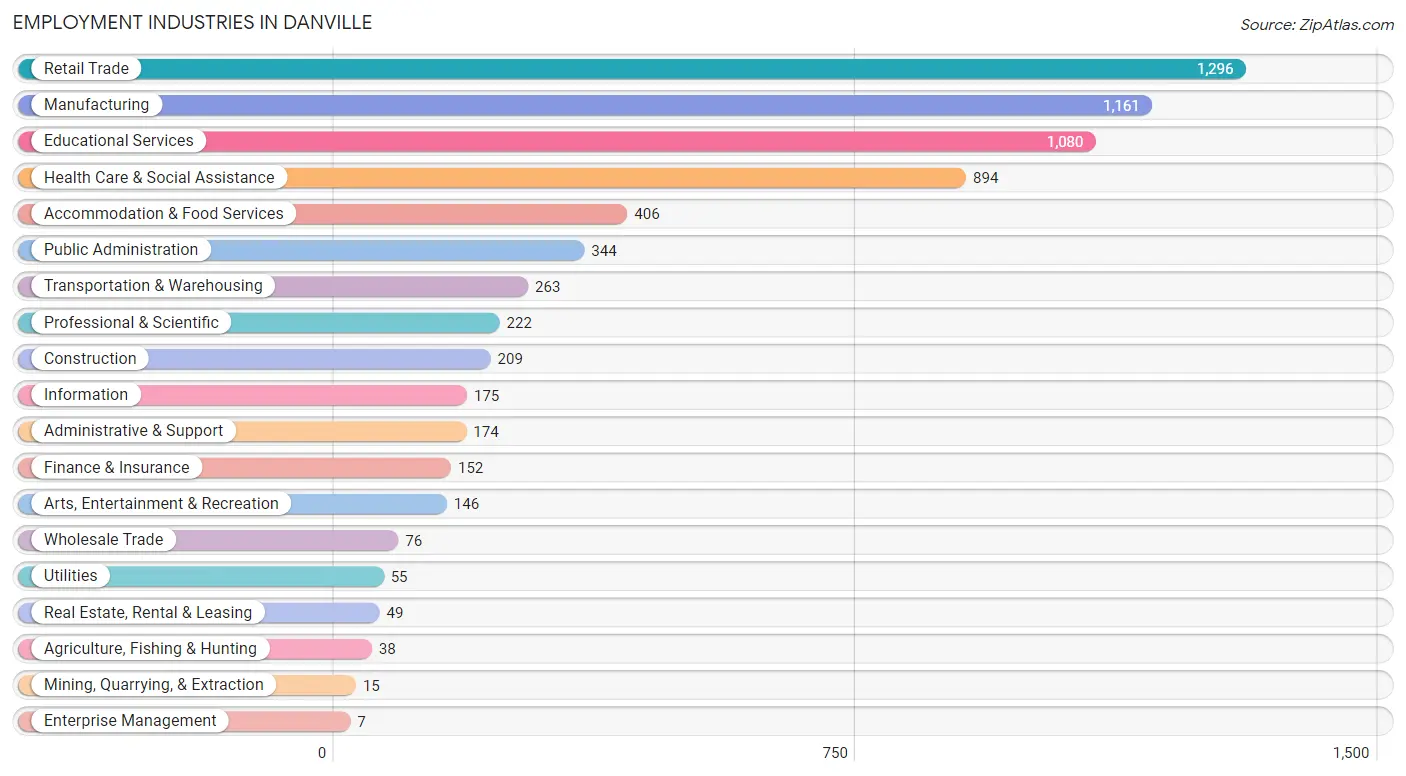
Employment Industries in Danville
The major employment industries in Danville include Retail Trade (1,296 | 18.4%), Manufacturing (1,161 | 16.5%), Educational Services (1,080 | 15.4%), Health Care & Social Assistance (894 | 12.7%), and Accommodation & Food Services (406 | 5.8%).
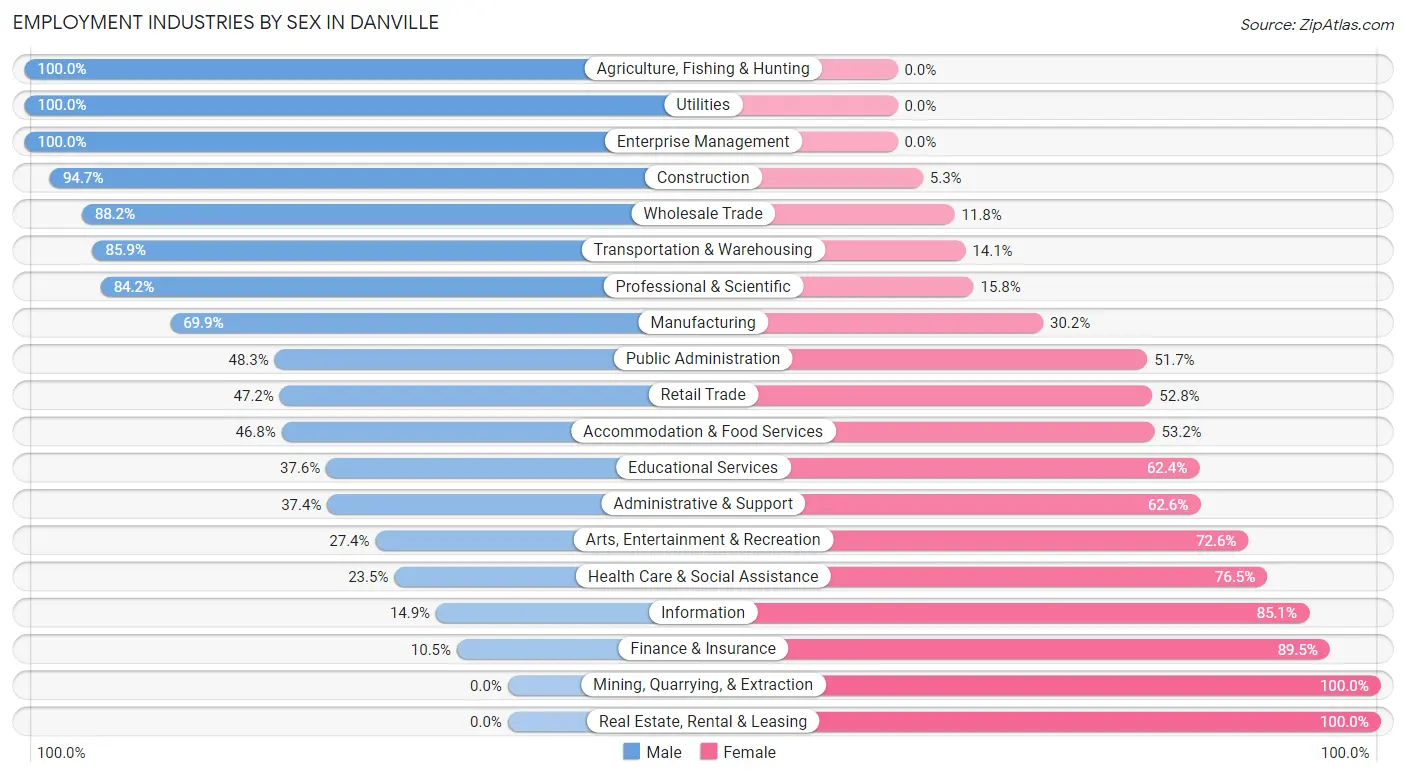
Employment Industries by Sex in Danville
The Danville industries that see more men than women are Agriculture, Fishing & Hunting (100.0%), Utilities (100.0%), and Enterprise Management (100.0%), whereas the industries that tend to have a higher number of women are Mining, Quarrying, & Extraction (100.0%), Real Estate, Rental & Leasing (100.0%), and Finance & Insurance (89.5%).
| Industry | Male | Female |
| Agriculture, Fishing & Hunting | 38 (100.0%) | 0 (0.0%) |
| Mining, Quarrying, & Extraction | 0 (0.0%) | 15 (100.0%) |
| Construction | 198 (94.7%) | 11 (5.3%) |
| Manufacturing | 811 (69.9%) | 350 (30.1%) |
| Wholesale Trade | 67 (88.2%) | 9 (11.8%) |
| Retail Trade | 612 (47.2%) | 684 (52.8%) |
| Transportation & Warehousing | 226 (85.9%) | 37 (14.1%) |
| Utilities | 55 (100.0%) | 0 (0.0%) |
| Information | 26 (14.9%) | 149 (85.1%) |
| Finance & Insurance | 16 (10.5%) | 136 (89.5%) |
| Real Estate, Rental & Leasing | 0 (0.0%) | 49 (100.0%) |
| Professional & Scientific | 187 (84.2%) | 35 (15.8%) |
| Enterprise Management | 7 (100.0%) | 0 (0.0%) |
| Administrative & Support | 65 (37.4%) | 109 (62.6%) |
| Educational Services | 406 (37.6%) | 674 (62.4%) |
| Health Care & Social Assistance | 210 (23.5%) | 684 (76.5%) |
| Arts, Entertainment & Recreation | 40 (27.4%) | 106 (72.6%) |
| Accommodation & Food Services | 190 (46.8%) | 216 (53.2%) |
| Public Administration | 166 (48.3%) | 178 (51.7%) |
| Total | 3,470 (49.4%) | 3,557 (50.6%) |
Education in Danville
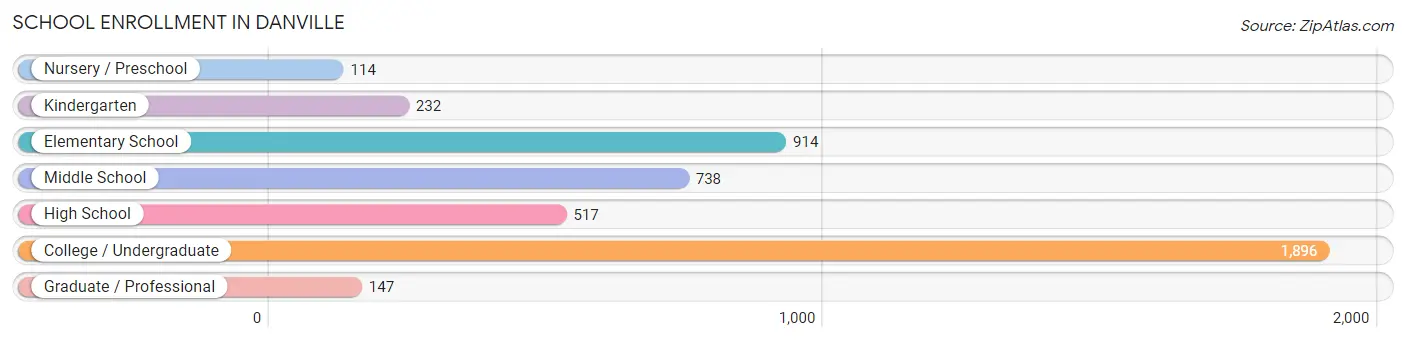
School Enrollment in Danville
The most common levels of schooling among the 4,558 students in Danville are college / undergraduate (1,896 | 41.6%), elementary school (914 | 20.1%), and middle school (738 | 16.2%).
| School Level | # Students | % Students |
| Nursery / Preschool | 114 | 2.5% |
| Kindergarten | 232 | 5.1% |
| Elementary School | 914 | 20.1% |
| Middle School | 738 | 16.2% |
| High School | 517 | 11.3% |
| College / Undergraduate | 1,896 | 41.6% |
| Graduate / Professional | 147 | 3.2% |
| Total | 4,558 | 100.0% |
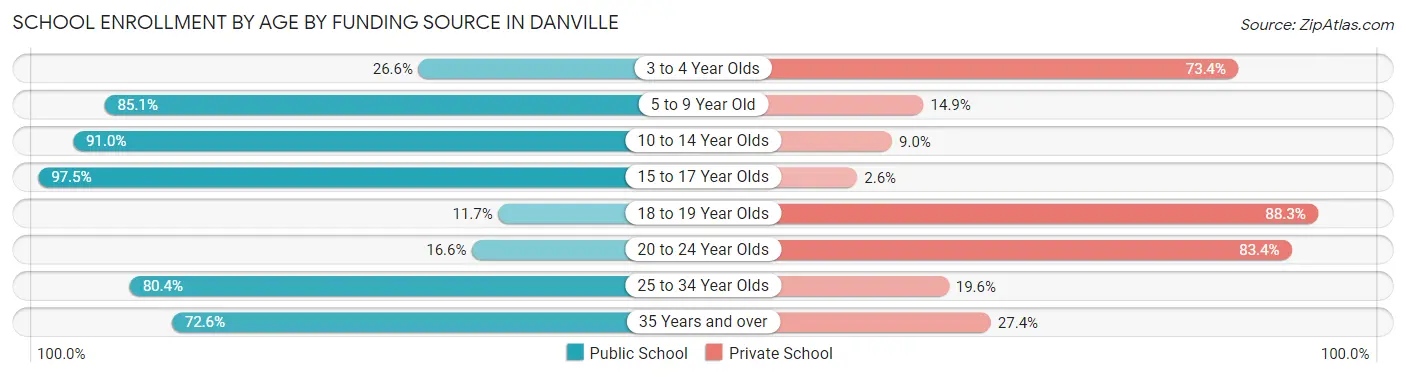
School Enrollment by Age by Funding Source in Danville
Out of a total of 4,558 students who are enrolled in schools in Danville, 1,841 (40.4%) attend a private institution, while the remaining 2,717 (59.6%) are enrolled in public schools. The age group of 18 to 19 year olds has the highest likelihood of being enrolled in private schools, with 708 (88.3% in the age bracket) enrolled. Conversely, the age group of 15 to 17 year olds has the lowest likelihood of being enrolled in a private school, with 420 (97.5% in the age bracket) attending a public institution.
| Age Bracket | Public School | Private School |
| 3 to 4 Year Olds | 21 (26.6%) | 58 (73.4%) |
| 5 to 9 Year Old | 869 (85.1%) | 152 (14.9%) |
| 10 to 14 Year Olds | 847 (91.0%) | 84 (9.0%) |
| 15 to 17 Year Olds | 420 (97.5%) | 11 (2.5%) |
| 18 to 19 Year Olds | 94 (11.7%) | 708 (88.3%) |
| 20 to 24 Year Olds | 146 (16.6%) | 733 (83.4%) |
| 25 to 34 Year Olds | 193 (80.4%) | 47 (19.6%) |
| 35 Years and over | 127 (72.6%) | 48 (27.4%) |
| Total | 2,717 (59.6%) | 1,841 (40.4%) |
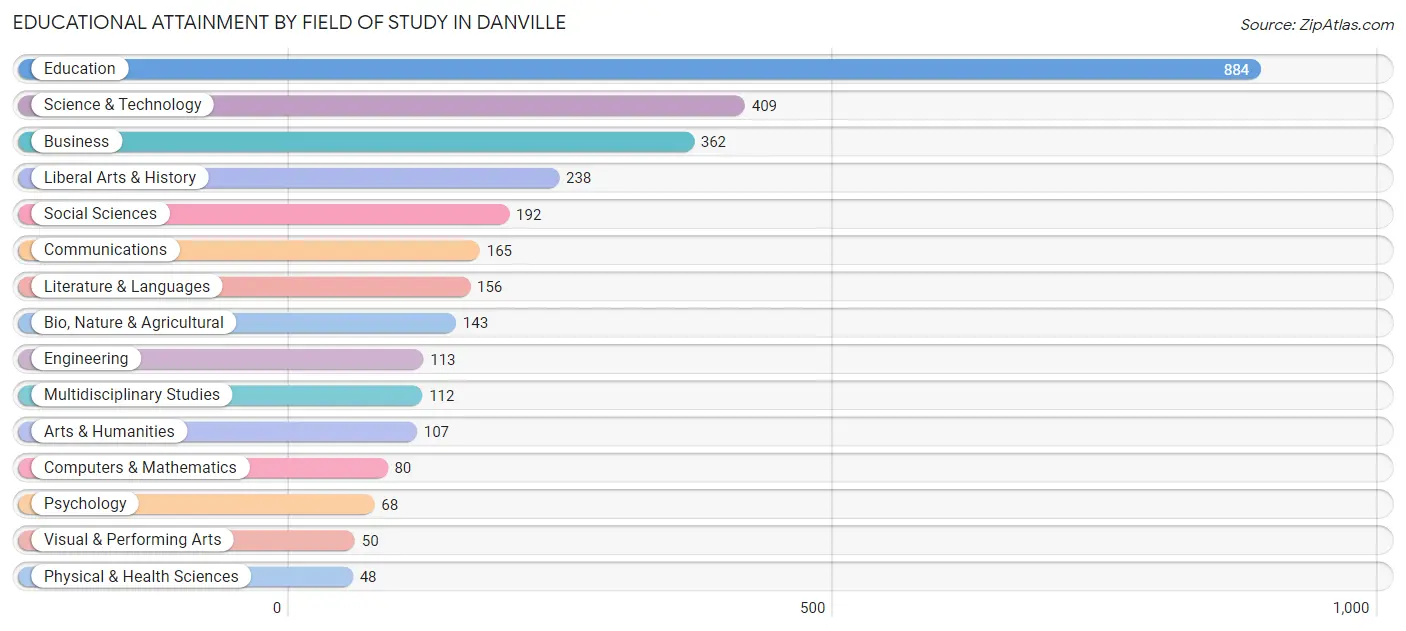
Educational Attainment by Field of Study in Danville
Education (884 | 28.3%), science & technology (409 | 13.1%), business (362 | 11.6%), liberal arts & history (238 | 7.6%), and social sciences (192 | 6.1%) are the most common fields of study among 3,127 individuals in Danville who have obtained a bachelor's degree or higher.
| Field of Study | # Graduates | % Graduates |
| Computers & Mathematics | 80 | 2.6% |
| Bio, Nature & Agricultural | 143 | 4.6% |
| Physical & Health Sciences | 48 | 1.5% |
| Psychology | 68 | 2.2% |
| Social Sciences | 192 | 6.1% |
| Engineering | 113 | 3.6% |
| Multidisciplinary Studies | 112 | 3.6% |
| Science & Technology | 409 | 13.1% |
| Business | 362 | 11.6% |
| Education | 884 | 28.3% |
| Literature & Languages | 156 | 5.0% |
| Liberal Arts & History | 238 | 7.6% |
| Visual & Performing Arts | 50 | 1.6% |
| Communications | 165 | 5.3% |
| Arts & Humanities | 107 | 3.4% |
| Total | 3,127 | 100.0% |
Transportation & Commute in Danville
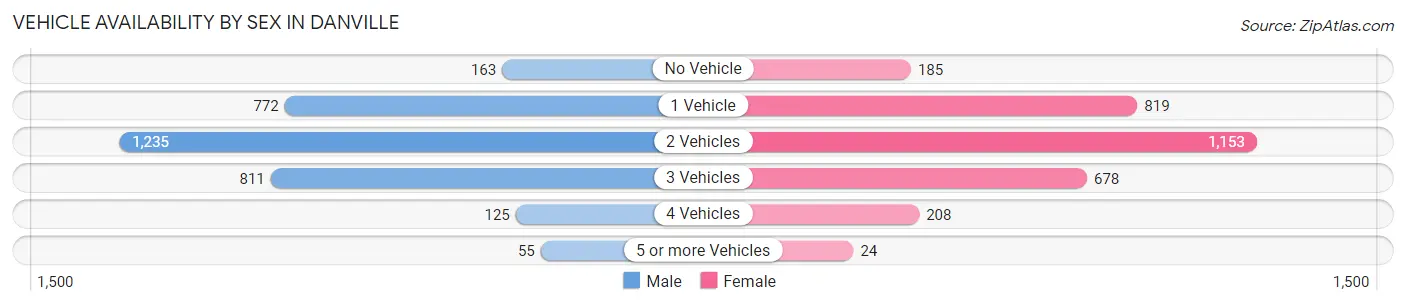
Vehicle Availability by Sex in Danville
The most prevalent vehicle ownership categories in Danville are males with 2 vehicles (1,235, accounting for 39.1%) and females with 2 vehicles (1,153, making up 40.3%).
| Vehicles Available | Male | Female |
| No Vehicle | 163 (5.2%) | 185 (6.0%) |
| 1 Vehicle | 772 (24.4%) | 819 (26.7%) |
| 2 Vehicles | 1,235 (39.1%) | 1,153 (37.6%) |
| 3 Vehicles | 811 (25.7%) | 678 (22.1%) |
| 4 Vehicles | 125 (4.0%) | 208 (6.8%) |
| 5 or more Vehicles | 55 (1.7%) | 24 (0.8%) |
| Total | 3,161 (100.0%) | 3,067 (100.0%) |
Commute Time in Danville
The most frequently occuring commute durations in Danville are 10 to 14 minutes (1,636 commuters, 25.7%), 5 to 9 minutes (1,316 commuters, 20.7%), and 15 to 19 minutes (794 commuters, 12.5%).
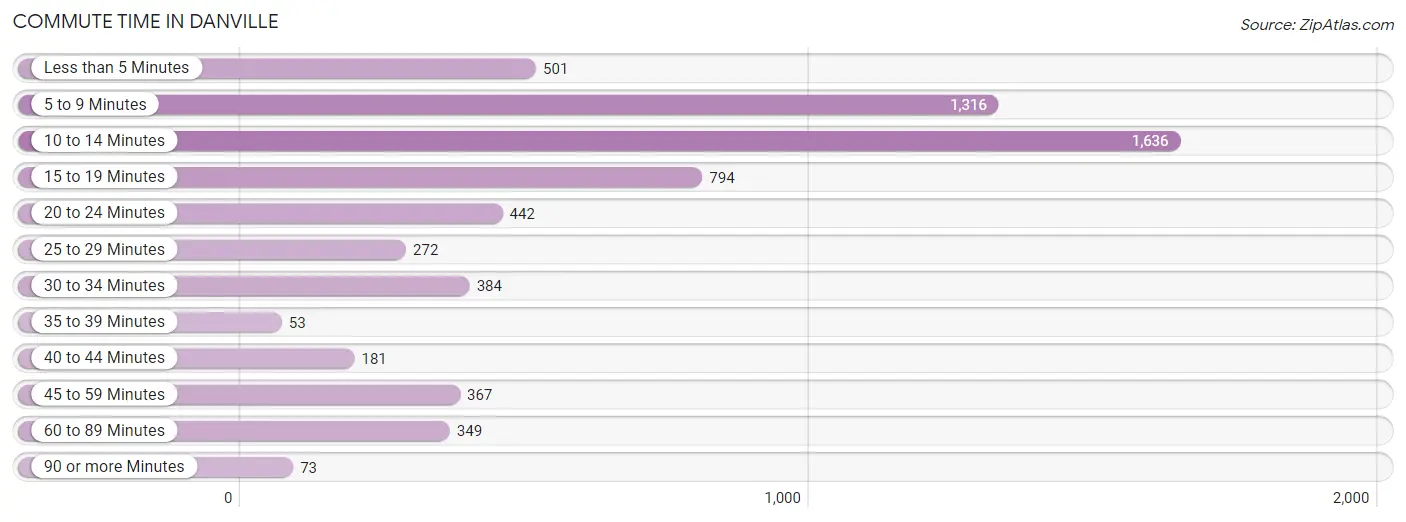
| Commute Time | # Commuters | % Commuters |
| Less than 5 Minutes | 501 | 7.9% |
| 5 to 9 Minutes | 1,316 | 20.7% |
| 10 to 14 Minutes | 1,636 | 25.7% |
| 15 to 19 Minutes | 794 | 12.5% |
| 20 to 24 Minutes | 442 | 6.9% |
| 25 to 29 Minutes | 272 | 4.3% |
| 30 to 34 Minutes | 384 | 6.0% |
| 35 to 39 Minutes | 53 | 0.8% |
| 40 to 44 Minutes | 181 | 2.8% |
| 45 to 59 Minutes | 367 | 5.8% |
| 60 to 89 Minutes | 349 | 5.5% |
| 90 or more Minutes | 73 | 1.1% |
Commute Time by Sex in Danville
The most common commute times in Danville are 10 to 14 minutes (822 commuters, 25.9%) for males and 5 to 9 minutes (880 commuters, 27.6%) for females.
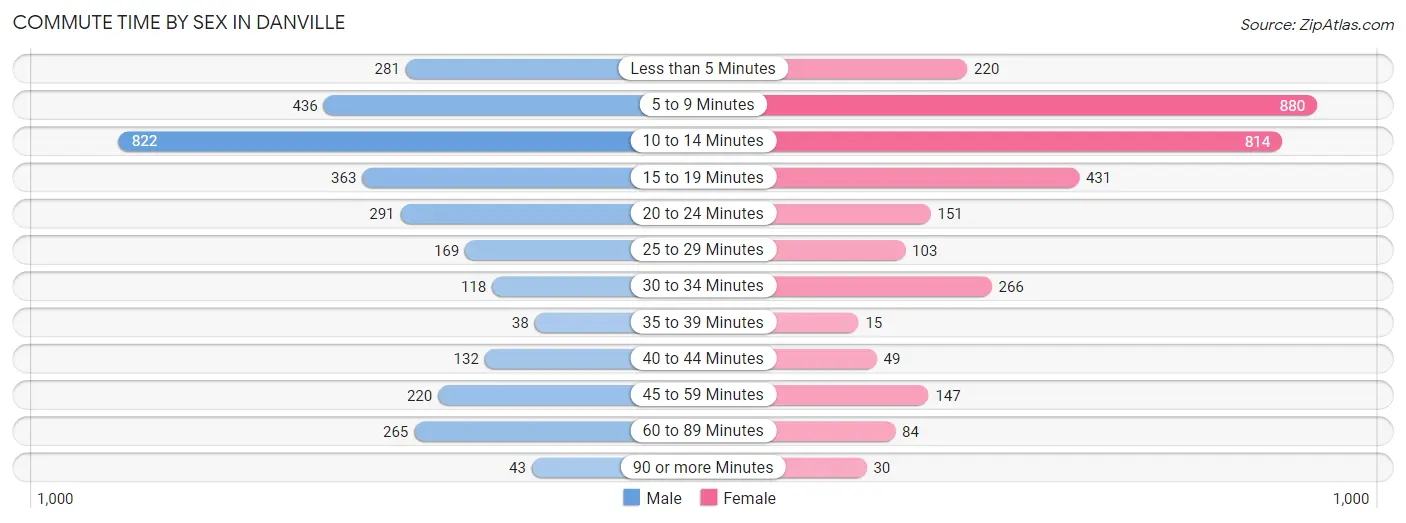
| Commute Time | Male | Female |
| Less than 5 Minutes | 281 (8.8%) | 220 (6.9%) |
| 5 to 9 Minutes | 436 (13.7%) | 880 (27.6%) |
| 10 to 14 Minutes | 822 (25.9%) | 814 (25.5%) |
| 15 to 19 Minutes | 363 (11.4%) | 431 (13.5%) |
| 20 to 24 Minutes | 291 (9.2%) | 151 (4.7%) |
| 25 to 29 Minutes | 169 (5.3%) | 103 (3.2%) |
| 30 to 34 Minutes | 118 (3.7%) | 266 (8.3%) |
| 35 to 39 Minutes | 38 (1.2%) | 15 (0.5%) |
| 40 to 44 Minutes | 132 (4.2%) | 49 (1.5%) |
| 45 to 59 Minutes | 220 (6.9%) | 147 (4.6%) |
| 60 to 89 Minutes | 265 (8.3%) | 84 (2.6%) |
| 90 or more Minutes | 43 (1.3%) | 30 (0.9%) |
Time of Departure to Work by Sex in Danville
The most frequent times of departure to work in Danville are 7:00 AM to 7:29 AM (424, 13.3%) for males and 7:30 AM to 7:59 AM (384, 12.0%) for females.
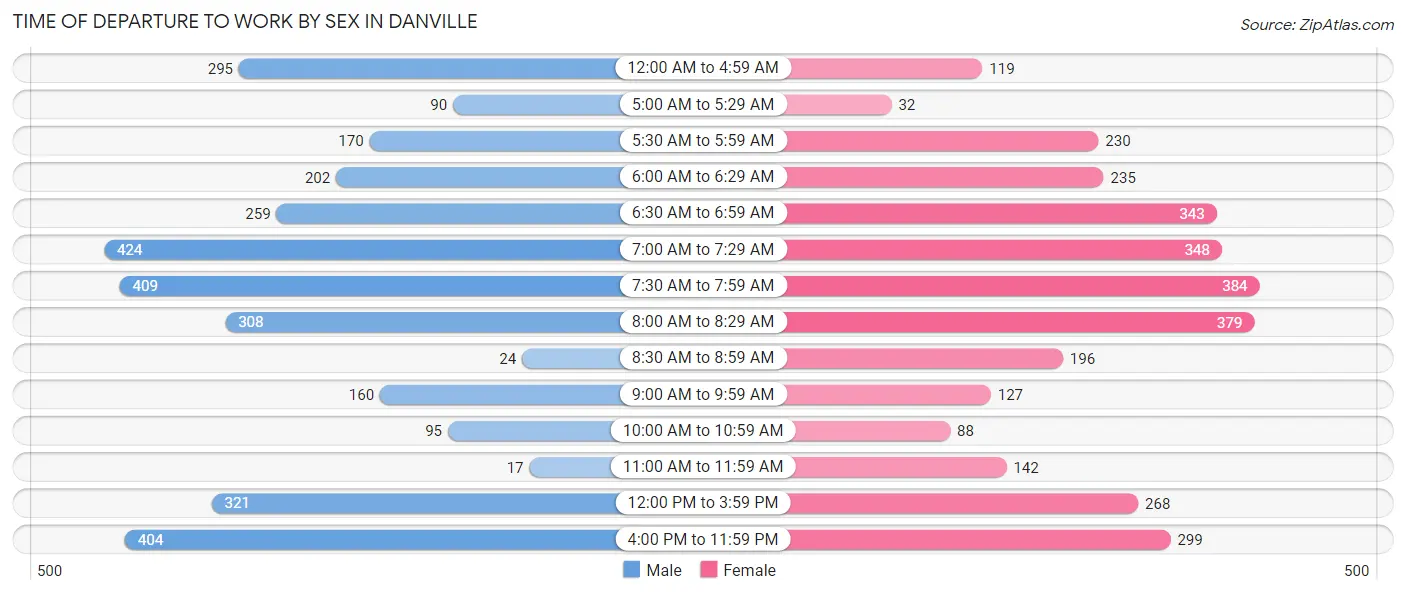
| Time of Departure | Male | Female |
| 12:00 AM to 4:59 AM | 295 (9.3%) | 119 (3.7%) |
| 5:00 AM to 5:29 AM | 90 (2.8%) | 32 (1.0%) |
| 5:30 AM to 5:59 AM | 170 (5.3%) | 230 (7.2%) |
| 6:00 AM to 6:29 AM | 202 (6.4%) | 235 (7.4%) |
| 6:30 AM to 6:59 AM | 259 (8.2%) | 343 (10.7%) |
| 7:00 AM to 7:29 AM | 424 (13.3%) | 348 (10.9%) |
| 7:30 AM to 7:59 AM | 409 (12.9%) | 384 (12.0%) |
| 8:00 AM to 8:29 AM | 308 (9.7%) | 379 (11.9%) |
| 8:30 AM to 8:59 AM | 24 (0.8%) | 196 (6.1%) |
| 9:00 AM to 9:59 AM | 160 (5.0%) | 127 (4.0%) |
| 10:00 AM to 10:59 AM | 95 (3.0%) | 88 (2.8%) |
| 11:00 AM to 11:59 AM | 17 (0.5%) | 142 (4.4%) |
| 12:00 PM to 3:59 PM | 321 (10.1%) | 268 (8.4%) |
| 4:00 PM to 11:59 PM | 404 (12.7%) | 299 (9.4%) |
| Total | 3,178 (100.0%) | 3,190 (100.0%) |
Housing Occupancy in Danville
Occupancy by Ownership in Danville
Of the total 6,663 dwellings in Danville, owner-occupied units account for 3,804 (57.1%), while renter-occupied units make up 2,859 (42.9%).
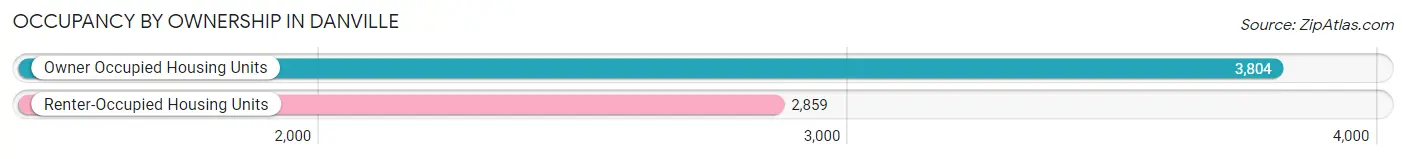
| Occupancy | # Housing Units | % Housing Units |
| Owner Occupied Housing Units | 3,804 | 57.1% |
| Renter-Occupied Housing Units | 2,859 | 42.9% |
| Total Occupied Housing Units | 6,663 | 100.0% |
Occupancy by Household Size in Danville
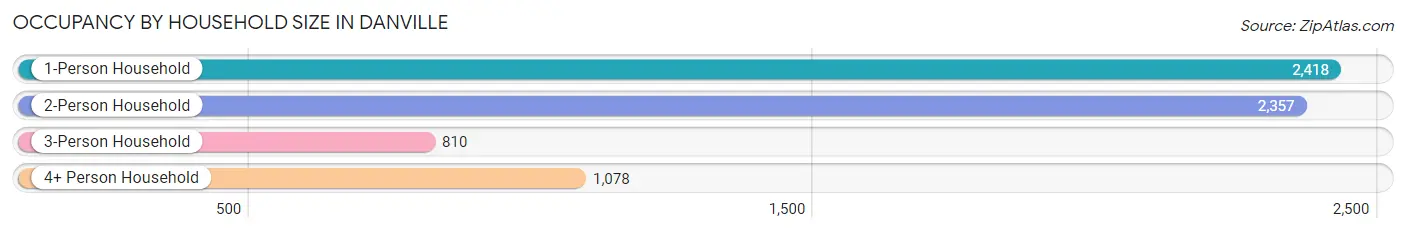
| Household Size | # Housing Units | % Housing Units |
| 1-Person Household | 2,418 | 36.3% |
| 2-Person Household | 2,357 | 35.4% |
| 3-Person Household | 810 | 12.2% |
| 4+ Person Household | 1,078 | 16.2% |
| Total Housing Units | 6,663 | 100.0% |
Occupancy by Ownership by Household Size in Danville
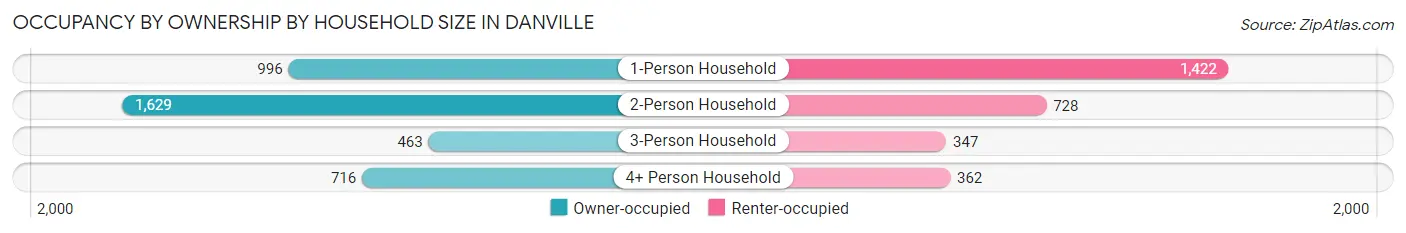
| Household Size | Owner-occupied | Renter-occupied |
| 1-Person Household | 996 (41.2%) | 1,422 (58.8%) |
| 2-Person Household | 1,629 (69.1%) | 728 (30.9%) |
| 3-Person Household | 463 (57.2%) | 347 (42.8%) |
| 4+ Person Household | 716 (66.4%) | 362 (33.6%) |
| Total Housing Units | 3,804 (57.1%) | 2,859 (42.9%) |
Occupancy by Educational Attainment in Danville
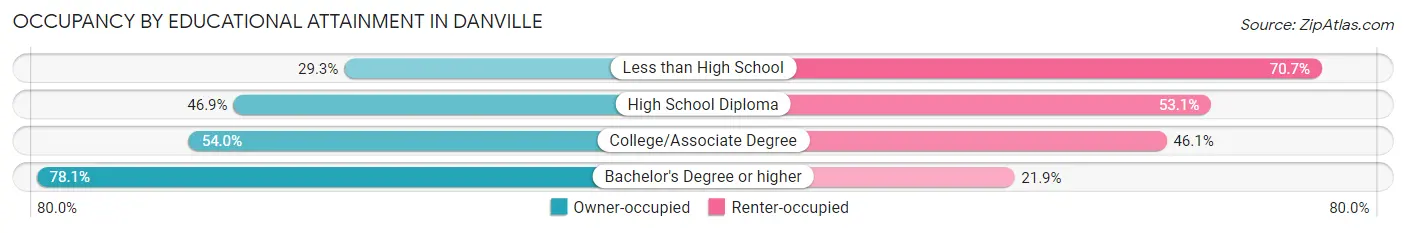
| Household Size | Owner-occupied | Renter-occupied |
| Less than High School | 139 (29.3%) | 335 (70.7%) |
| High School Diploma | 943 (46.9%) | 1,068 (53.1%) |
| College/Associate Degree | 1,208 (53.9%) | 1,031 (46.1%) |
| Bachelor's Degree or higher | 1,514 (78.1%) | 425 (21.9%) |
Occupancy by Age of Householder in Danville
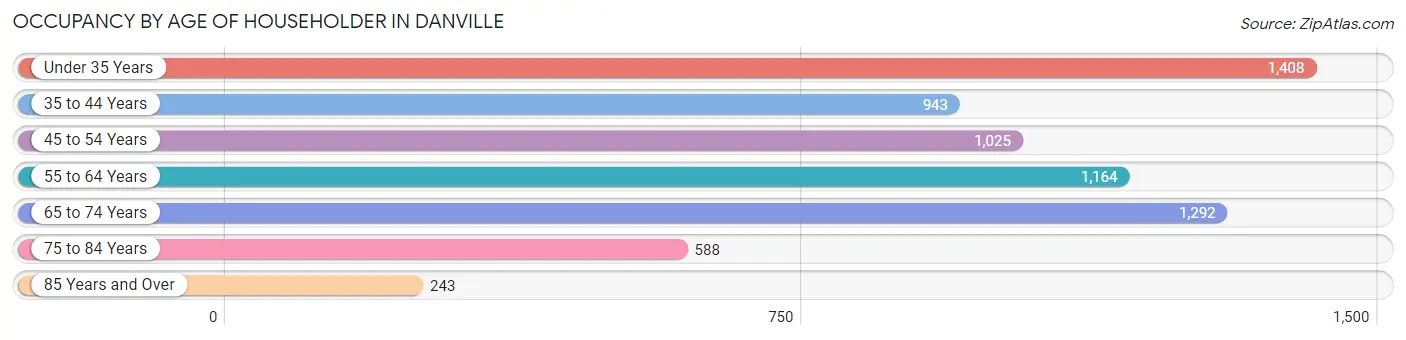
| Age Bracket | # Households | % Households |
| Under 35 Years | 1,408 | 21.1% |
| 35 to 44 Years | 943 | 14.1% |
| 45 to 54 Years | 1,025 | 15.4% |
| 55 to 64 Years | 1,164 | 17.5% |
| 65 to 74 Years | 1,292 | 19.4% |
| 75 to 84 Years | 588 | 8.8% |
| 85 Years and Over | 243 | 3.6% |
| Total | 6,663 | 100.0% |
Housing Finances in Danville
Median Income by Occupancy in Danville
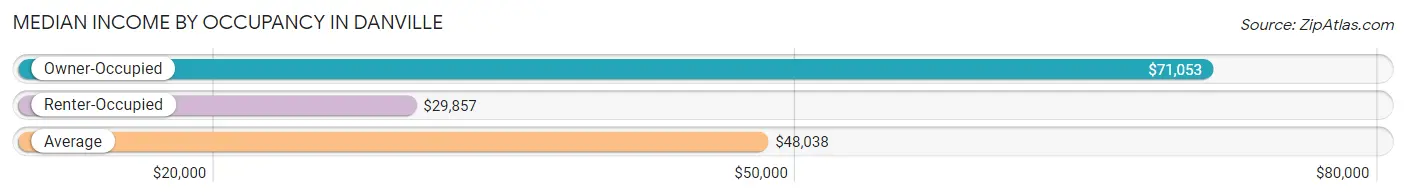
| Occupancy Type | # Households | Median Income |
| Owner-Occupied | 3,804 (57.1%) | $71,053 |
| Renter-Occupied | 2,859 (42.9%) | $29,857 |
| Average | 6,663 (100.0%) | $48,038 |
Occupancy by Householder Income Bracket in Danville
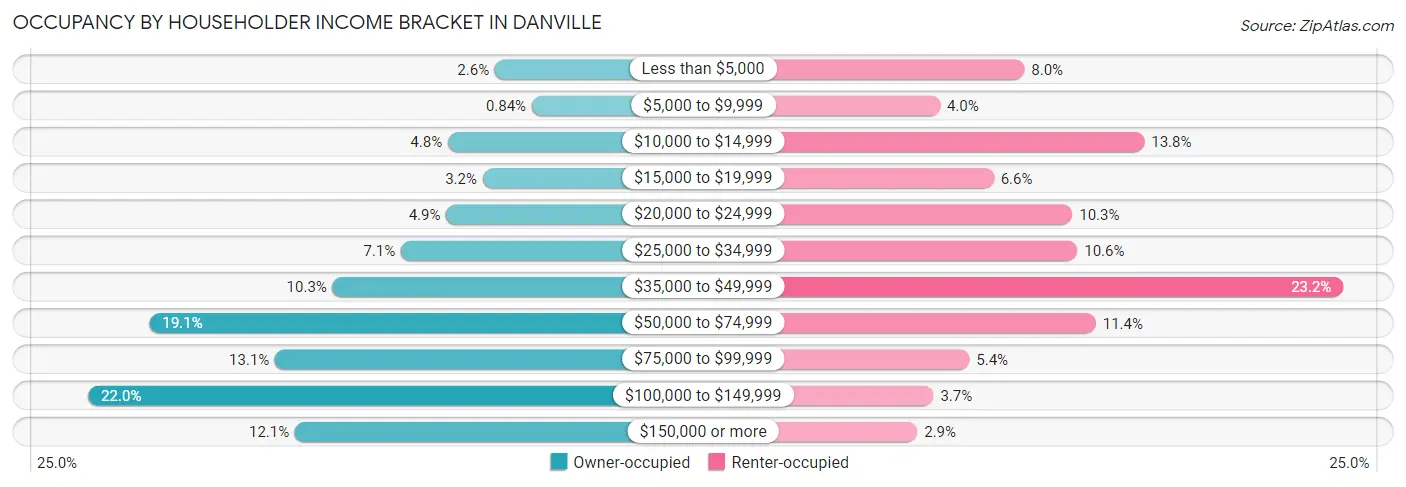
| Income Bracket | Owner-occupied | Renter-occupied |
| Less than $5,000 | 99 (2.6%) | 230 (8.0%) |
| $5,000 to $9,999 | 32 (0.8%) | 115 (4.0%) |
| $10,000 to $14,999 | 184 (4.8%) | 393 (13.8%) |
| $15,000 to $19,999 | 121 (3.2%) | 188 (6.6%) |
| $20,000 to $24,999 | 187 (4.9%) | 295 (10.3%) |
| $25,000 to $34,999 | 269 (7.1%) | 302 (10.6%) |
| $35,000 to $49,999 | 393 (10.3%) | 664 (23.2%) |
| $50,000 to $74,999 | 725 (19.1%) | 327 (11.4%) |
| $75,000 to $99,999 | 497 (13.1%) | 155 (5.4%) |
| $100,000 to $149,999 | 836 (22.0%) | 106 (3.7%) |
| $150,000 or more | 461 (12.1%) | 84 (2.9%) |
| Total | 3,804 (100.0%) | 2,859 (100.0%) |
Monthly Housing Cost Tiers in Danville
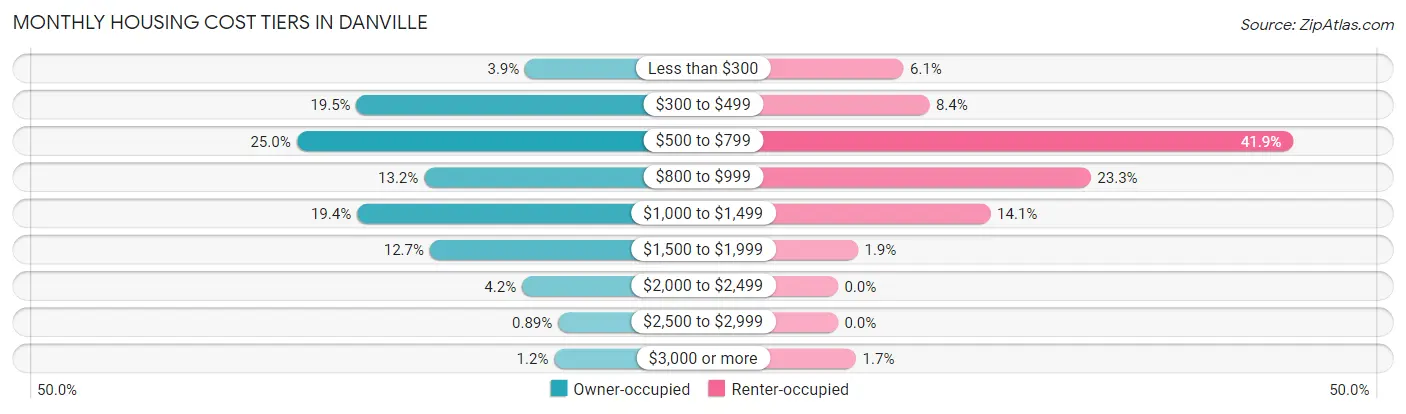
| Monthly Cost | Owner-occupied | Renter-occupied |
| Less than $300 | 149 (3.9%) | 173 (6.0%) |
| $300 to $499 | 740 (19.5%) | 241 (8.4%) |
| $500 to $799 | 950 (25.0%) | 1,199 (41.9%) |
| $800 to $999 | 503 (13.2%) | 666 (23.3%) |
| $1,000 to $1,499 | 738 (19.4%) | 402 (14.1%) |
| $1,500 to $1,999 | 483 (12.7%) | 53 (1.8%) |
| $2,000 to $2,499 | 160 (4.2%) | 0 (0.0%) |
| $2,500 to $2,999 | 34 (0.9%) | 0 (0.0%) |
| $3,000 or more | 47 (1.2%) | 48 (1.7%) |
| Total | 3,804 (100.0%) | 2,859 (100.0%) |
Physical Housing Characteristics in Danville
Housing Structures in Danville
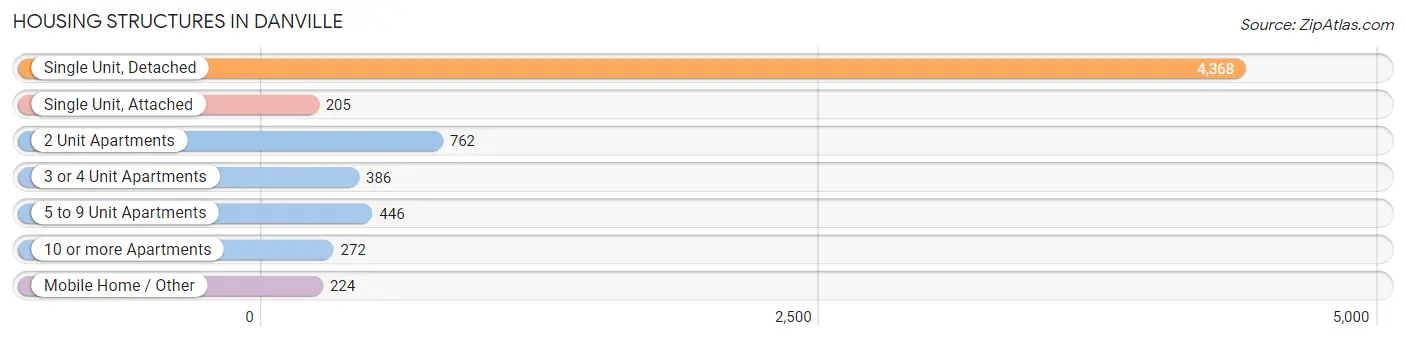
| Structure Type | # Housing Units | % Housing Units |
| Single Unit, Detached | 4,368 | 65.6% |
| Single Unit, Attached | 205 | 3.1% |
| 2 Unit Apartments | 762 | 11.4% |
| 3 or 4 Unit Apartments | 386 | 5.8% |
| 5 to 9 Unit Apartments | 446 | 6.7% |
| 10 or more Apartments | 272 | 4.1% |
| Mobile Home / Other | 224 | 3.4% |
| Total | 6,663 | 100.0% |
Housing Structures by Occupancy in Danville
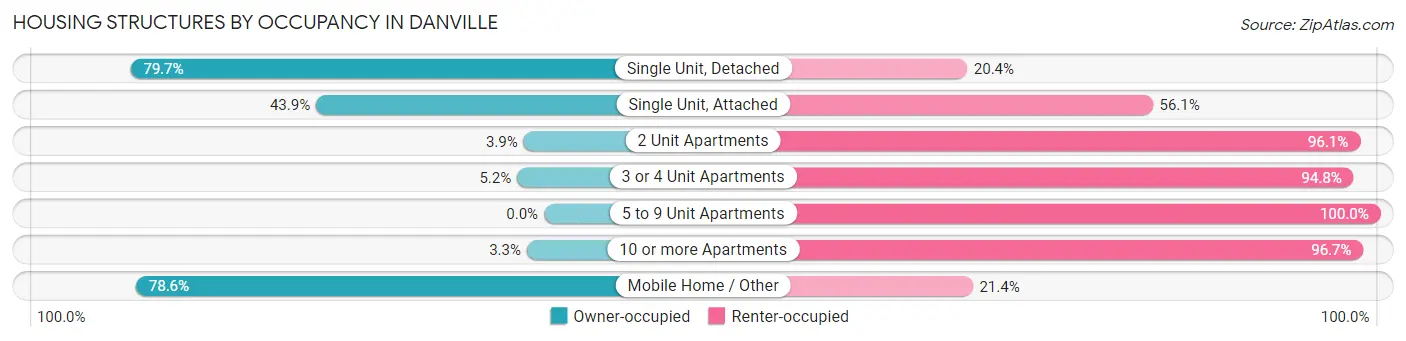
| Structure Type | Owner-occupied | Renter-occupied |
| Single Unit, Detached | 3,479 (79.6%) | 889 (20.3%) |
| Single Unit, Attached | 90 (43.9%) | 115 (56.1%) |
| 2 Unit Apartments | 30 (3.9%) | 732 (96.1%) |
| 3 or 4 Unit Apartments | 20 (5.2%) | 366 (94.8%) |
| 5 to 9 Unit Apartments | 0 (0.0%) | 446 (100.0%) |
| 10 or more Apartments | 9 (3.3%) | 263 (96.7%) |
| Mobile Home / Other | 176 (78.6%) | 48 (21.4%) |
| Total | 3,804 (57.1%) | 2,859 (42.9%) |
Housing Structures by Number of Rooms in Danville
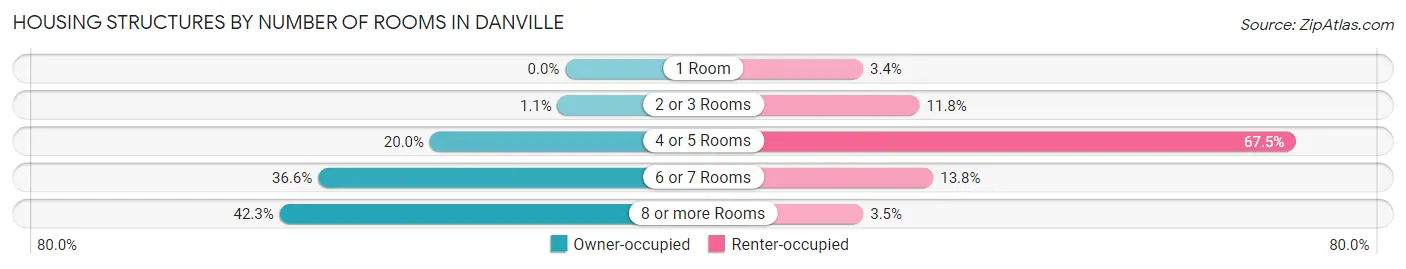
| Number of Rooms | Owner-occupied | Renter-occupied |
| 1 Room | 0 (0.0%) | 98 (3.4%) |
| 2 or 3 Rooms | 43 (1.1%) | 337 (11.8%) |
| 4 or 5 Rooms | 762 (20.0%) | 1,930 (67.5%) |
| 6 or 7 Rooms | 1,391 (36.6%) | 395 (13.8%) |
| 8 or more Rooms | 1,608 (42.3%) | 99 (3.5%) |
| Total | 3,804 (100.0%) | 2,859 (100.0%) |
Housing Structure by Heating Type in Danville
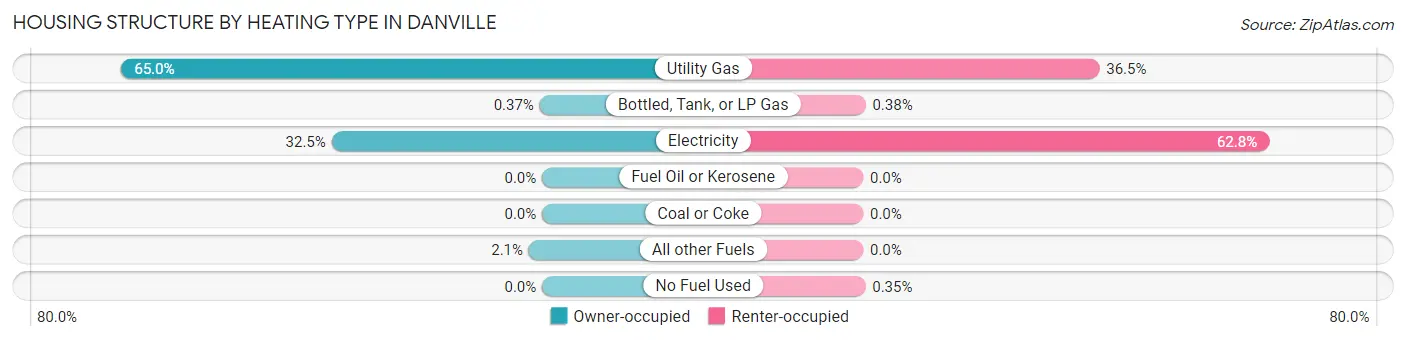
| Heating Type | Owner-occupied | Renter-occupied |
| Utility Gas | 2,474 (65.0%) | 1,044 (36.5%) |
| Bottled, Tank, or LP Gas | 14 (0.4%) | 11 (0.4%) |
| Electricity | 1,238 (32.5%) | 1,794 (62.7%) |
| Fuel Oil or Kerosene | 0 (0.0%) | 0 (0.0%) |
| Coal or Coke | 0 (0.0%) | 0 (0.0%) |
| All other Fuels | 78 (2.1%) | 0 (0.0%) |
| No Fuel Used | 0 (0.0%) | 10 (0.4%) |
| Total | 3,804 (100.0%) | 2,859 (100.0%) |
Household Vehicle Usage in Danville
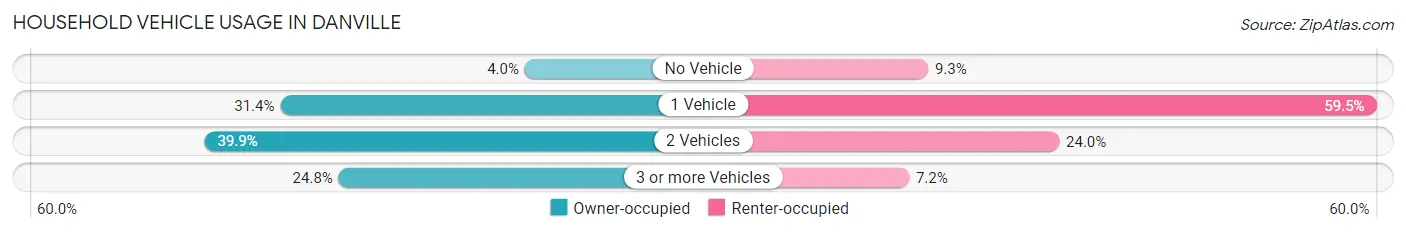
| Vehicles per Household | Owner-occupied | Renter-occupied |
| No Vehicle | 151 (4.0%) | 266 (9.3%) |
| 1 Vehicle | 1,193 (31.4%) | 1,702 (59.5%) |
| 2 Vehicles | 1,516 (39.9%) | 686 (24.0%) |
| 3 or more Vehicles | 944 (24.8%) | 205 (7.2%) |
| Total | 3,804 (100.0%) | 2,859 (100.0%) |
Real Estate & Mortgages in Danville
Real Estate and Mortgage Overview in Danville
| Characteristic | Without Mortgage | With Mortgage |
| Housing Units | 1,686 | 2,118 |
| Median Property Value | $203,500 | $172,600 |
| Median Household Income | $70,072 | $234 |
| Monthly Housing Costs | $498 | $47 |
| Real Estate Taxes | $1,779 | $21 |
Property Value by Mortgage Status in Danville
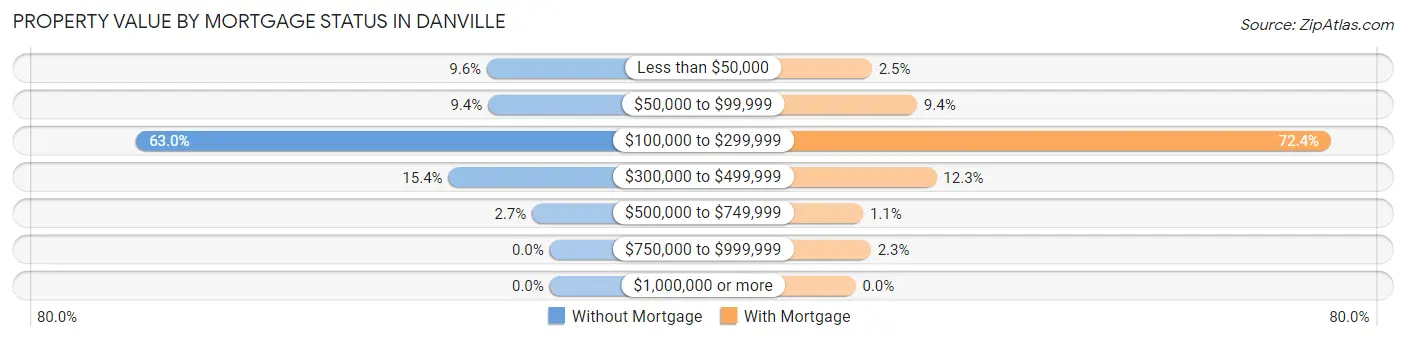
| Property Value | Without Mortgage | With Mortgage |
| Less than $50,000 | 161 (9.6%) | 52 (2.5%) |
| $50,000 to $99,999 | 158 (9.4%) | 198 (9.3%) |
| $100,000 to $299,999 | 1,062 (63.0%) | 1,534 (72.4%) |
| $300,000 to $499,999 | 260 (15.4%) | 261 (12.3%) |
| $500,000 to $749,999 | 45 (2.7%) | 24 (1.1%) |
| $750,000 to $999,999 | 0 (0.0%) | 49 (2.3%) |
| $1,000,000 or more | 0 (0.0%) | 0 (0.0%) |
| Total | 1,686 (100.0%) | 2,118 (100.0%) |
Household Income by Mortgage Status in Danville
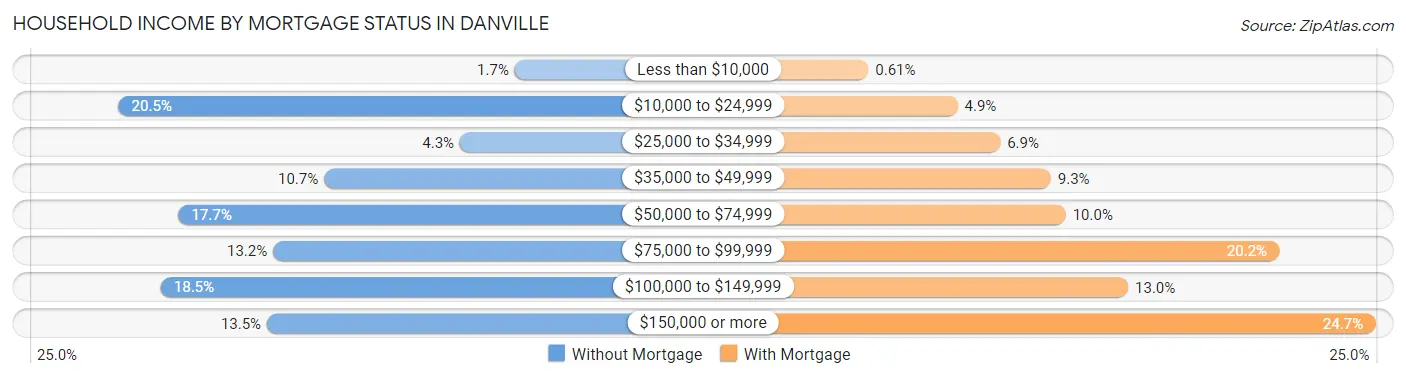
| Household Income | Without Mortgage | With Mortgage |
| Less than $10,000 | 28 (1.7%) | 13 (0.6%) |
| $10,000 to $24,999 | 346 (20.5%) | 103 (4.9%) |
| $25,000 to $34,999 | 72 (4.3%) | 146 (6.9%) |
| $35,000 to $49,999 | 181 (10.7%) | 197 (9.3%) |
| $50,000 to $74,999 | 298 (17.7%) | 212 (10.0%) |
| $75,000 to $99,999 | 222 (13.2%) | 427 (20.2%) |
| $100,000 to $149,999 | 312 (18.5%) | 275 (13.0%) |
| $150,000 or more | 227 (13.5%) | 524 (24.7%) |
| Total | 1,686 (100.0%) | 2,118 (100.0%) |
Property Value to Household Income Ratio in Danville
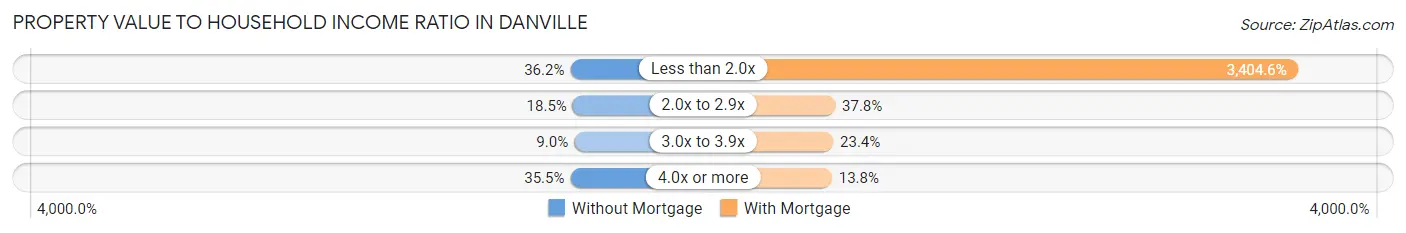
| Value-to-Income Ratio | Without Mortgage | With Mortgage |
| Less than 2.0x | 611 (36.2%) | 72,109 (3,404.6%) |
| 2.0x to 2.9x | 311 (18.4%) | 800 (37.8%) |
| 3.0x to 3.9x | 152 (9.0%) | 495 (23.4%) |
| 4.0x or more | 599 (35.5%) | 293 (13.8%) |
| Total | 1,686 (100.0%) | 2,118 (100.0%) |
Real Estate Taxes by Mortgage Status in Danville
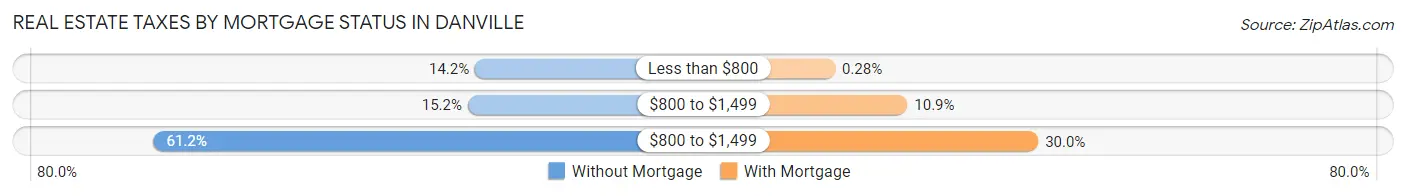
| Property Taxes | Without Mortgage | With Mortgage |
| Less than $800 | 239 (14.2%) | 6 (0.3%) |
| $800 to $1,499 | 257 (15.2%) | 230 (10.9%) |
| $800 to $1,499 | 1,031 (61.2%) | 635 (30.0%) |
| Total | 1,686 (100.0%) | 2,118 (100.0%) |
Health & Disability in Danville
Health Insurance Coverage by Age in Danville
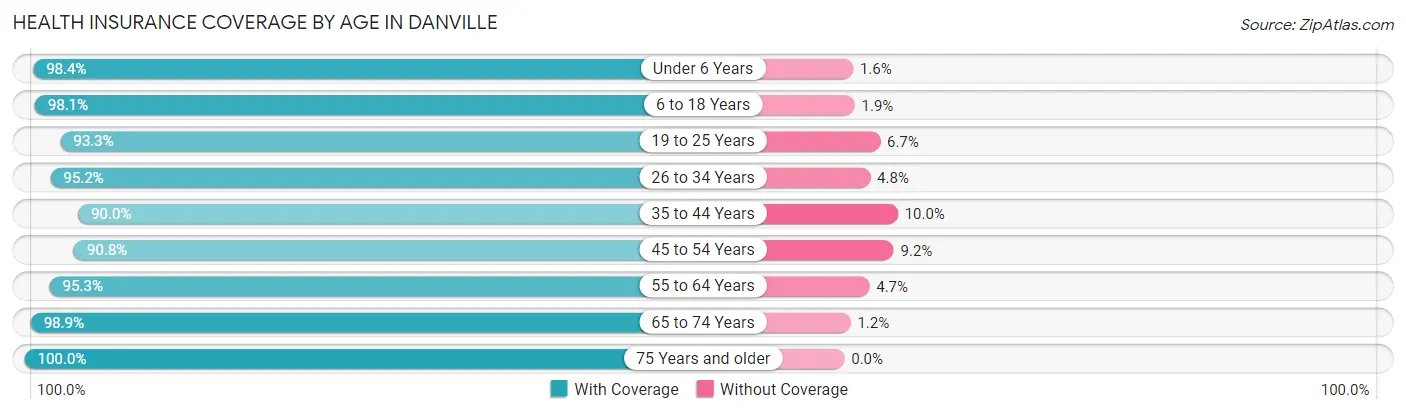
| Age Bracket | With Coverage | Without Coverage |
| Under 6 Years | 979 (98.4%) | 16 (1.6%) |
| 6 to 18 Years | 2,556 (98.1%) | 50 (1.9%) |
| 19 to 25 Years | 2,424 (93.3%) | 173 (6.7%) |
| 26 to 34 Years | 1,758 (95.2%) | 89 (4.8%) |
| 35 to 44 Years | 1,402 (90.0%) | 155 (10.0%) |
| 45 to 54 Years | 1,884 (90.8%) | 191 (9.2%) |
| 55 to 64 Years | 1,699 (95.3%) | 83 (4.7%) |
| 65 to 74 Years | 1,884 (98.9%) | 22 (1.1%) |
| 75 Years and older | 1,236 (100.0%) | 0 (0.0%) |
| Total | 15,822 (95.3%) | 779 (4.7%) |
Health Insurance Coverage by Citizenship Status in Danville
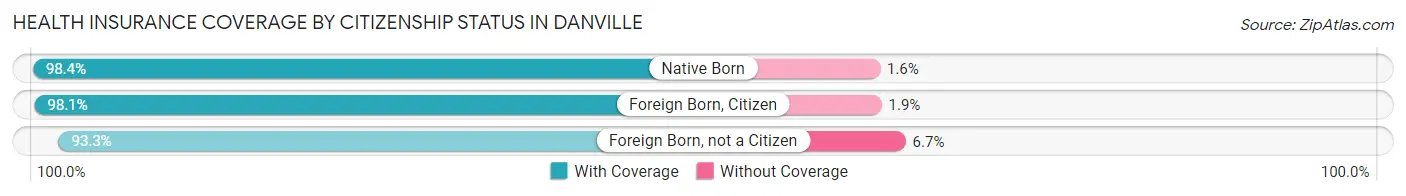
| Citizenship Status | With Coverage | Without Coverage |
| Native Born | 979 (98.4%) | 16 (1.6%) |
| Foreign Born, Citizen | 2,556 (98.1%) | 50 (1.9%) |
| Foreign Born, not a Citizen | 2,424 (93.3%) | 173 (6.7%) |
Health Insurance Coverage by Household Income in Danville
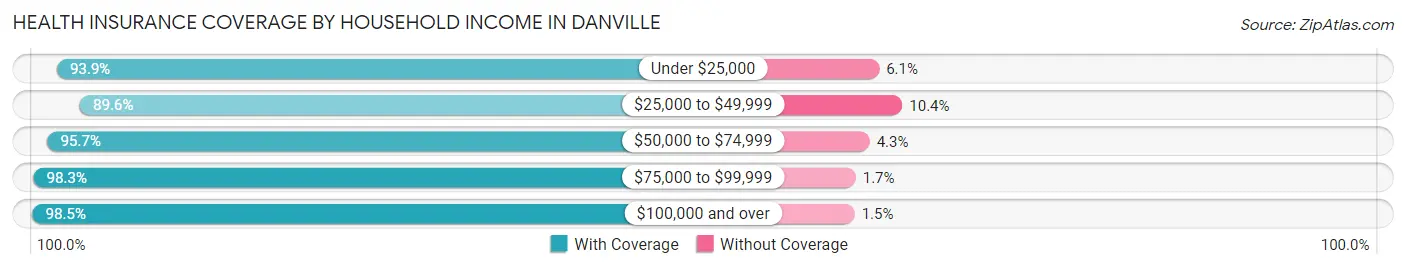
| Household Income | With Coverage | Without Coverage |
| Under $25,000 | 2,817 (93.9%) | 182 (6.1%) |
| $25,000 to $49,999 | 2,962 (89.6%) | 344 (10.4%) |
| $50,000 to $74,999 | 2,677 (95.7%) | 120 (4.3%) |
| $75,000 to $99,999 | 1,859 (98.3%) | 32 (1.7%) |
| $100,000 and over | 4,098 (98.5%) | 62 (1.5%) |
Public vs Private Health Insurance Coverage by Age in Danville
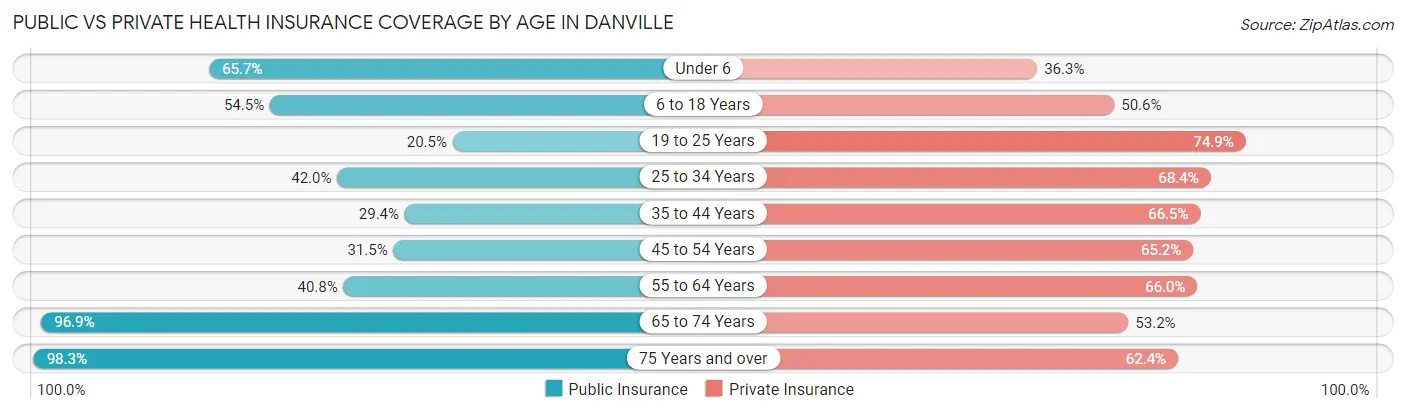
| Age Bracket | Public Insurance | Private Insurance |
| Under 6 | 654 (65.7%) | 361 (36.3%) |
| 6 to 18 Years | 1,419 (54.4%) | 1,318 (50.6%) |
| 19 to 25 Years | 533 (20.5%) | 1,946 (74.9%) |
| 25 to 34 Years | 775 (42.0%) | 1,264 (68.4%) |
| 35 to 44 Years | 458 (29.4%) | 1,036 (66.5%) |
| 45 to 54 Years | 654 (31.5%) | 1,353 (65.2%) |
| 55 to 64 Years | 727 (40.8%) | 1,176 (66.0%) |
| 65 to 74 Years | 1,847 (96.9%) | 1,014 (53.2%) |
| 75 Years and over | 1,215 (98.3%) | 771 (62.4%) |
| Total | 8,282 (49.9%) | 10,239 (61.7%) |
Disability Status by Sex by Age in Danville
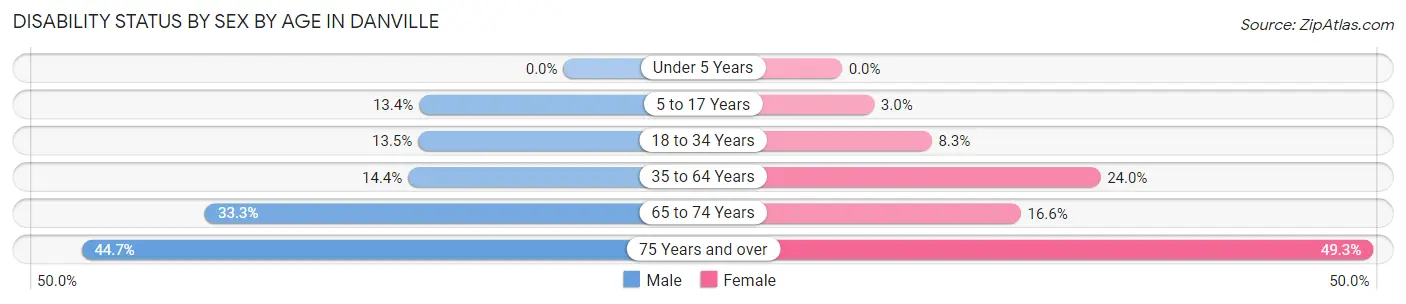
| Age Bracket | Male | Female |
| Under 5 Years | 0 (0.0%) | 0 (0.0%) |
| 5 to 17 Years | 178 (13.4%) | 36 (3.0%) |
| 18 to 34 Years | 328 (13.5%) | 192 (8.3%) |
| 35 to 64 Years | 380 (14.4%) | 666 (24.0%) |
| 65 to 74 Years | 257 (33.3%) | 188 (16.6%) |
| 75 Years and over | 199 (44.7%) | 390 (49.3%) |
Disability Class by Sex by Age in Danville
Disability Class: Hearing Difficulty
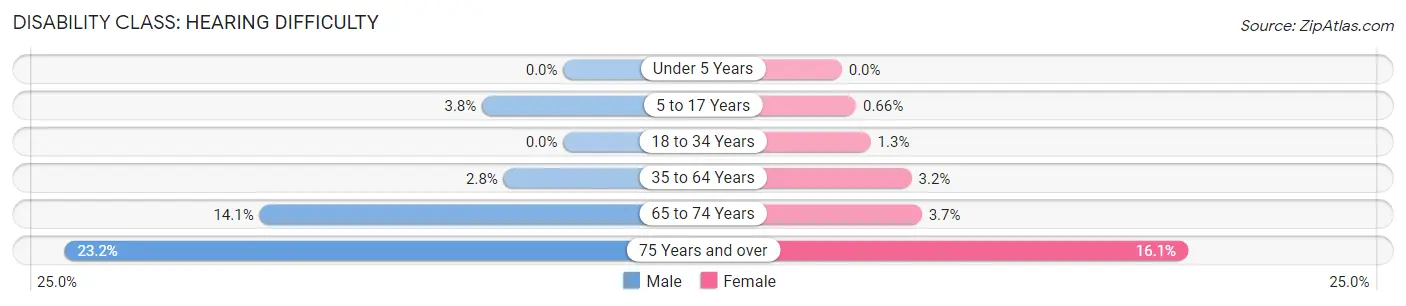
| Age Bracket | Male | Female |
| Under 5 Years | 0 (0.0%) | 0 (0.0%) |
| 5 to 17 Years | 50 (3.8%) | 8 (0.7%) |
| 18 to 34 Years | 0 (0.0%) | 31 (1.3%) |
| 35 to 64 Years | 73 (2.8%) | 90 (3.2%) |
| 65 to 74 Years | 109 (14.1%) | 42 (3.7%) |
| 75 Years and over | 103 (23.2%) | 127 (16.1%) |
Disability Class: Vision Difficulty
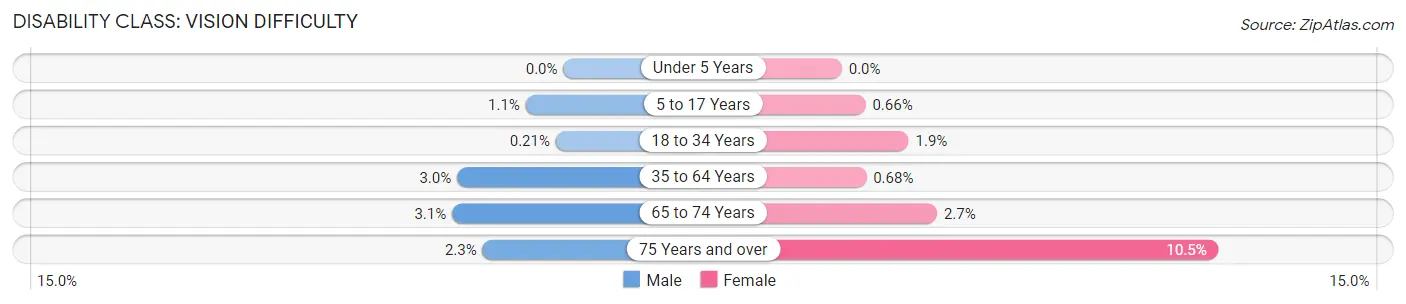
| Age Bracket | Male | Female |
| Under 5 Years | 0 (0.0%) | 0 (0.0%) |
| 5 to 17 Years | 14 (1.1%) | 8 (0.7%) |
| 18 to 34 Years | 5 (0.2%) | 43 (1.9%) |
| 35 to 64 Years | 78 (3.0%) | 19 (0.7%) |
| 65 to 74 Years | 24 (3.1%) | 30 (2.6%) |
| 75 Years and over | 10 (2.2%) | 83 (10.5%) |
Disability Class: Cognitive Difficulty
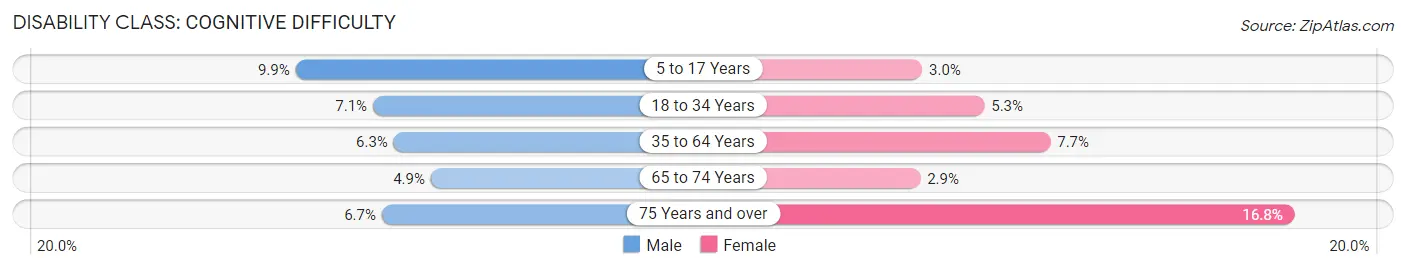
| Age Bracket | Male | Female |
| 5 to 17 Years | 132 (9.9%) | 36 (3.0%) |
| 18 to 34 Years | 172 (7.1%) | 122 (5.3%) |
| 35 to 64 Years | 166 (6.3%) | 215 (7.7%) |
| 65 to 74 Years | 38 (4.9%) | 33 (2.9%) |
| 75 Years and over | 30 (6.7%) | 133 (16.8%) |
Disability Class: Ambulatory Difficulty
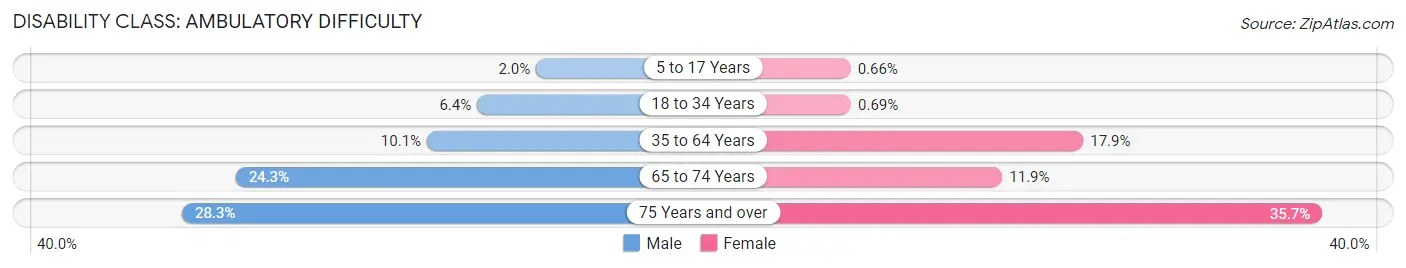
| Age Bracket | Male | Female |
| 5 to 17 Years | 27 (2.0%) | 8 (0.7%) |
| 18 to 34 Years | 156 (6.4%) | 16 (0.7%) |
| 35 to 64 Years | 267 (10.1%) | 498 (17.9%) |
| 65 to 74 Years | 188 (24.3%) | 135 (11.9%) |
| 75 Years and over | 126 (28.3%) | 282 (35.6%) |
Disability Class: Self-Care Difficulty
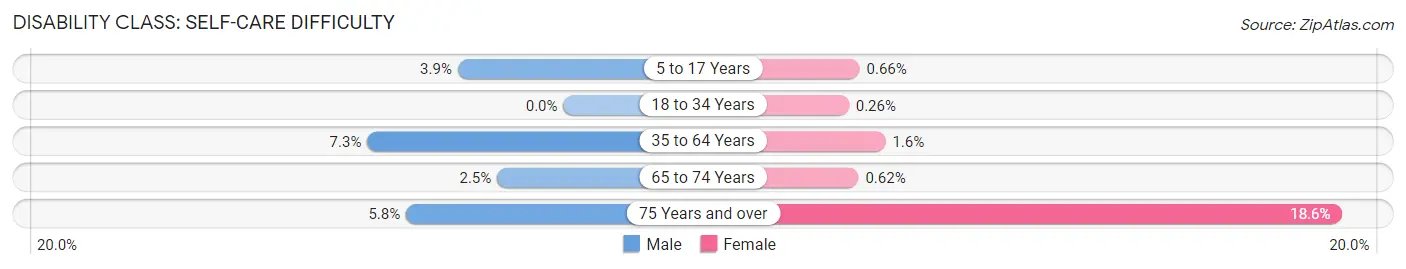
| Age Bracket | Male | Female |
| 5 to 17 Years | 52 (3.9%) | 8 (0.7%) |
| 18 to 34 Years | 0 (0.0%) | 6 (0.3%) |
| 35 to 64 Years | 192 (7.3%) | 45 (1.6%) |
| 65 to 74 Years | 19 (2.5%) | 7 (0.6%) |
| 75 Years and over | 26 (5.8%) | 147 (18.6%) |
Technology Access in Danville
Computing Device Access in Danville
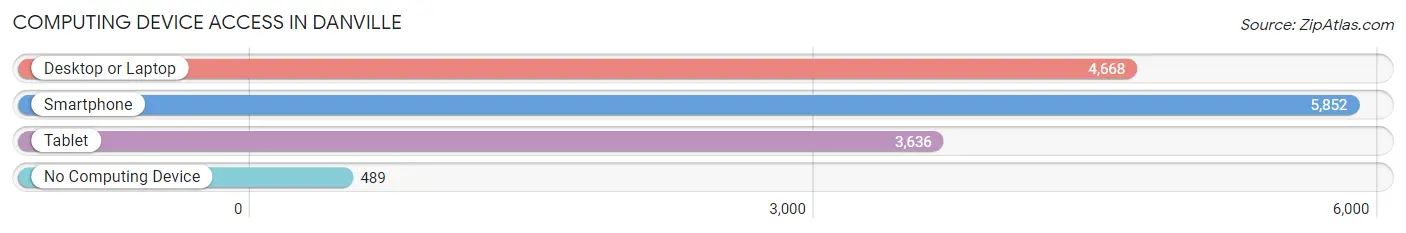
| Device Type | # Households | % Households |
| Desktop or Laptop | 4,668 | 70.1% |
| Smartphone | 5,852 | 87.8% |
| Tablet | 3,636 | 54.6% |
| No Computing Device | 489 | 7.3% |
| Total | 6,663 | 100.0% |
Internet Access in Danville
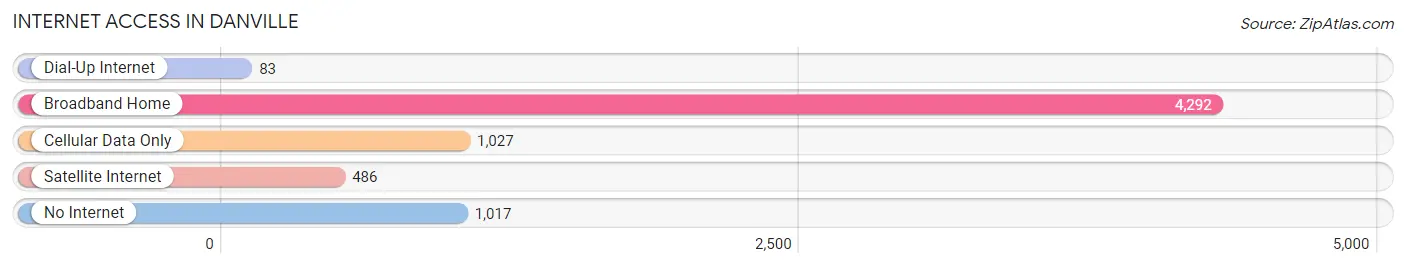
| Internet Type | # Households | % Households |
| Dial-Up Internet | 83 | 1.3% |
| Broadband Home | 4,292 | 64.4% |
| Cellular Data Only | 1,027 | 15.4% |
| Satellite Internet | 486 | 7.3% |
| No Internet | 1,017 | 15.3% |
| Total | 6,663 | 100.0% |
Danville Summary
Danville, Kentucky is a small city located in Boyle County, Kentucky. It is the county seat of Boyle County and is located in the heart of the Bluegrass Region. The city has a population of 16,218 as of the 2020 census.
History
The area that is now Danville was first settled in 1784 by John and William Trimble. The city was officially founded in 1787 and was named after Dan Trimble, the son of John and William. The city was incorporated in 1802 and was the first city in Kentucky to be incorporated.
Danville was an important center of commerce and transportation in the early 19th century. It was the site of the first post office in Kentucky and the first courthouse in the state. The city was also the site of the first college in Kentucky, Centre College, which was founded in 1819.
Geography
Danville is located in the Bluegrass Region of Kentucky, in the central part of the state. It is situated in the rolling hills of the Inner Bluegrass Region, near the Kentucky River. The city is located about 40 miles south of Lexington and about 60 miles north of Nashville, Tennessee.
The city has a total area of 8.3 square miles, all of which is land. The terrain is mostly flat, with some rolling hills. The climate is humid subtropical, with hot summers and mild winters.
Economy
Danville has a diverse economy, with a variety of industries. The city is home to several manufacturing companies, including E.I. du Pont de Nemours and Company, which produces chemicals and plastics. The city is also home to several healthcare companies, including Ephraim McDowell Health, which operates a hospital and several clinics in the city.
The city is also home to several educational institutions, including Centre College, which is a private liberal arts college. The city is also home to several other educational institutions, including Danville Community College and the Kentucky School for the Deaf.
Demographics
As of the 2020 census, Danville had a population of 16,218. The racial makeup of the city was 87.3% White, 8.2% African American, 0.4% Native American, 0.7% Asian, 0.1% Pacific Islander, 1.2% from other races, and 2.1% from two or more races. Hispanic or Latino of any race were 3.2% of the population.
The median household income in Danville was $41,945, and the median family income was $50,945. The per capita income in Danville was $21,945. About 15.3% of the population was below the poverty line.
Danville is a small city with a rich history and a diverse economy. It is home to several educational institutions and manufacturing companies, and is a great place to live and work.
Common Questions
What is Per Capita Income in Danville?
Per Capita income in Danville is $27,118.
What is the Median Family Income in Danville?
Median Family Income in Danville is $59,643.
What is the Median Household income in Danville?
Median Household Income in Danville is $48,038.
What is Income or Wage Gap in Danville?
Income or Wage Gap in Danville is 25.9%.
Women in Danville earn 74.1 cents for every dollar earned by a man.
What is Family Income Deficit in Danville?
Family Income Deficit in Danville is $12,523.
Families that are below poverty line in Danville earn $12,523 less on average than the poverty threshold level.
What is Inequality or Gini Index in Danville?
Inequality or Gini Index in Danville is 0.46.
What is the Total Population of Danville?
Total Population of Danville is 17,191.
What is the Total Male Population of Danville?
Total Male Population of Danville is 8,404.
What is the Total Female Population of Danville?
Total Female Population of Danville is 8,787.
What is the Ratio of Males per 100 Females in Danville?
There are 95.64 Males per 100 Females in Danville.
What is the Ratio of Females per 100 Males in Danville?
There are 104.56 Females per 100 Males in Danville.
What is the Median Population Age in Danville?
Median Population Age in Danville is 36.4 Years.
What is the Average Family Size in Danville
Average Family Size in Danville is 2.9 People.
What is the Average Household Size in Danville
Average Household Size in Danville is 2.3 People.
How Large is the Labor Force in Danville?
There are 7,699 People in the Labor Forcein in Danville.
What is the Percentage of People in the Labor Force in Danville?
54.2% of People are in the Labor Force in Danville.
What is the Unemployment Rate in Danville?
Unemployment Rate in Danville is 8.2%.