Madisonville, KY Map & Demographics
Madisonville Map
Madisonville Overview
$28,034
PER CAPITA INCOME
$60,722
AVG FAMILY INCOME
$54,234
AVG HOUSEHOLD INCOME
33.4%
WAGE / INCOME GAP [ % ]
66.6¢/ $1
WAGE / INCOME GAP [ $ ]
$13,954
FAMILY INCOME DEFICIT
0.44
INEQUALITY / GINI INDEX
19,433
TOTAL POPULATION
9,380
MALE POPULATION
10,053
FEMALE POPULATION
93.31
MALES / 100 FEMALES
107.17
FEMALES / 100 MALES
37.3
MEDIAN AGE
2.9
AVG FAMILY SIZE
2.3
AVG HOUSEHOLD SIZE
8,459
LABOR FORCE [ PEOPLE ]
55.3%
PERCENT IN LABOR FORCE
9.3%
UNEMPLOYMENT RATE
Madisonville Zip Codes
Madisonville Area Codes
Income in Madisonville
Income Overview in Madisonville
Per Capita Income in Madisonville is $28,034, while median incomes of families and households are $60,722 and $54,234 respectively.
| Characteristic | Number | Measure |
| Per Capita Income | 19,433 | $28,034 |
| Median Family Income | 5,206 | $60,722 |
| Mean Family Income | 5,206 | $76,900 |
| Median Household Income | 8,010 | $54,234 |
| Mean Household Income | 8,010 | $67,149 |
| Income Deficit | 5,206 | $13,954 |
| Wage / Income Gap (%) | 19,433 | 33.44% |
| Wage / Income Gap ($) | 19,433 | 66.56¢ per $1 |
| Gini / Inequality Index | 19,433 | 0.44 |
Earnings by Sex in Madisonville
Average Earnings in Madisonville are $37,286, $46,363 for men and $30,861 for women, a difference of 33.4%.
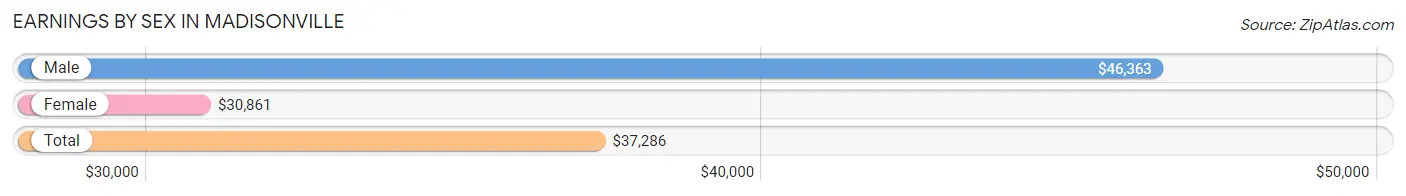
| Sex | Number | Average Earnings |
| Male | 4,413 (48.9%) | $46,363 |
| Female | 4,602 (51.0%) | $30,861 |
| Total | 9,015 (100.0%) | $37,286 |
Earnings by Sex by Income Bracket in Madisonville
The most common earnings brackets in Madisonville are $75,000 to $99,999 for men (613 | 13.9%) and $40,000 to $44,999 for women (599 | 13.0%).
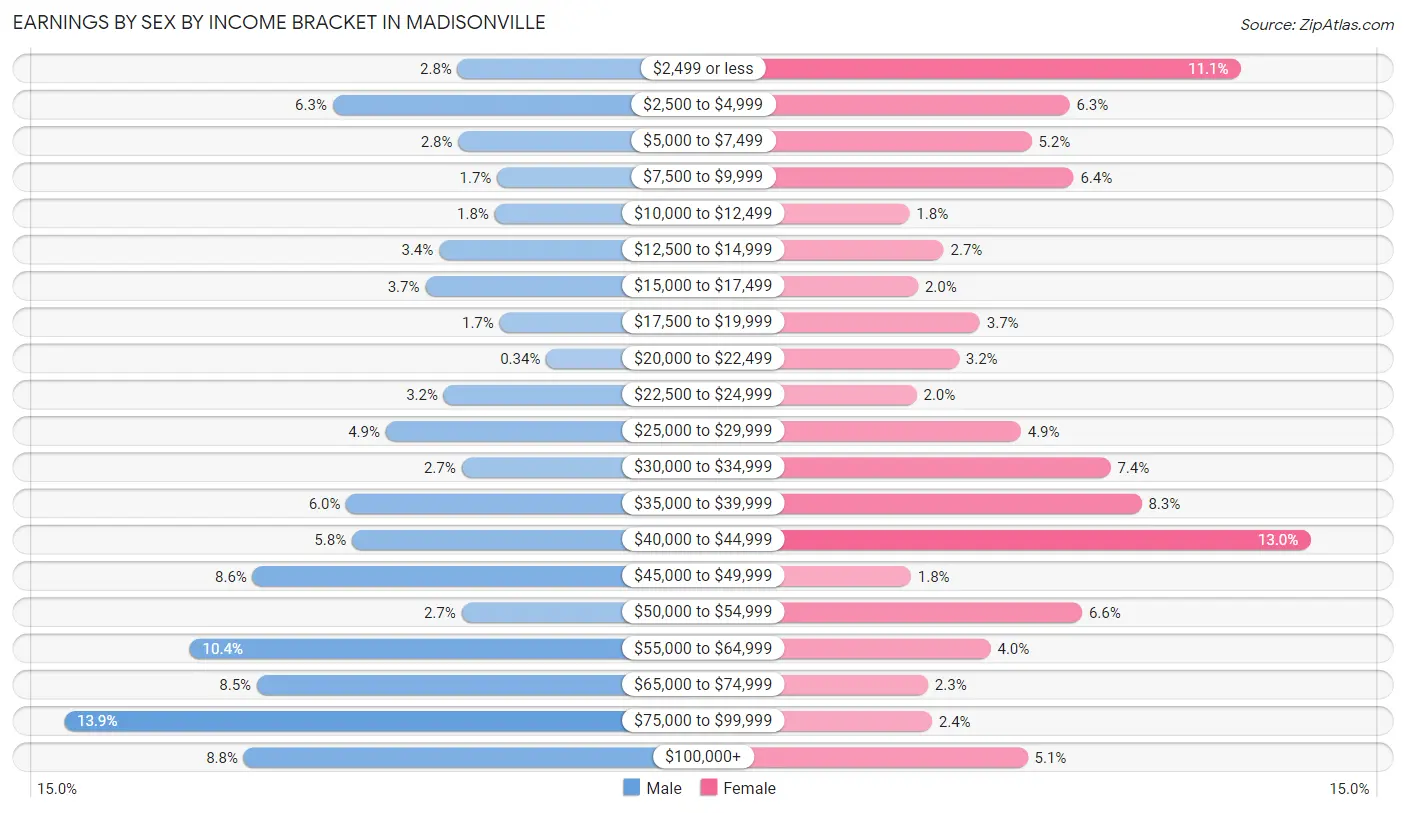
| Income | Male | Female |
| $2,499 or less | 125 (2.8%) | 509 (11.1%) |
| $2,500 to $4,999 | 280 (6.3%) | 288 (6.3%) |
| $5,000 to $7,499 | 124 (2.8%) | 239 (5.2%) |
| $7,500 to $9,999 | 76 (1.7%) | 293 (6.4%) |
| $10,000 to $12,499 | 79 (1.8%) | 81 (1.8%) |
| $12,500 to $14,999 | 148 (3.4%) | 125 (2.7%) |
| $15,000 to $17,499 | 165 (3.7%) | 92 (2.0%) |
| $17,500 to $19,999 | 73 (1.7%) | 172 (3.7%) |
| $20,000 to $22,499 | 15 (0.3%) | 145 (3.2%) |
| $22,500 to $24,999 | 142 (3.2%) | 90 (2.0%) |
| $25,000 to $29,999 | 214 (4.9%) | 225 (4.9%) |
| $30,000 to $34,999 | 120 (2.7%) | 341 (7.4%) |
| $35,000 to $39,999 | 263 (6.0%) | 381 (8.3%) |
| $40,000 to $44,999 | 256 (5.8%) | 599 (13.0%) |
| $45,000 to $49,999 | 379 (8.6%) | 83 (1.8%) |
| $50,000 to $54,999 | 120 (2.7%) | 304 (6.6%) |
| $55,000 to $64,999 | 457 (10.4%) | 186 (4.0%) |
| $65,000 to $74,999 | 374 (8.5%) | 105 (2.3%) |
| $75,000 to $99,999 | 613 (13.9%) | 110 (2.4%) |
| $100,000+ | 390 (8.8%) | 234 (5.1%) |
| Total | 4,413 (100.0%) | 4,602 (100.0%) |
Earnings by Sex by Educational Attainment in Madisonville
Average earnings in Madisonville are $49,473 for men and $34,607 for women, a difference of 30.0%. Men with an educational attainment of graduate degree enjoy the highest average annual earnings of $80,056, while those with less than high school education earn the least with $23,194. Women with an educational attainment of graduate degree earn the most with the average annual earnings of $42,486, while those with less than high school education have the smallest earnings of $9,549.
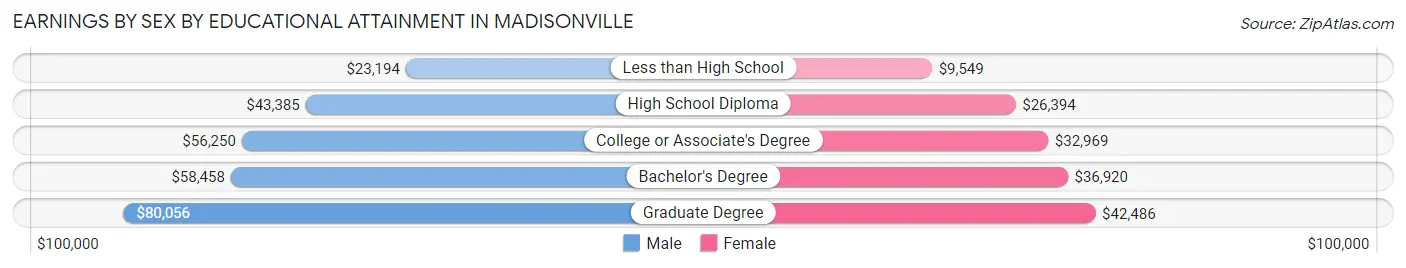
| Educational Attainment | Male Income | Female Income |
| Less than High School | $23,194 | $9,549 |
| High School Diploma | $43,385 | $26,394 |
| College or Associate's Degree | $56,250 | $32,969 |
| Bachelor's Degree | $58,458 | $36,920 |
| Graduate Degree | $80,056 | $42,486 |
| Total | $49,473 | $34,607 |
Family Income in Madisonville
Family Income Brackets in Madisonville
According to the Madisonville family income data, there are 1,166 families falling into the $50,000 to $74,999 income range, which is the most common income bracket and makes up 22.4% of all families. Conversely, the $200,000+ income bracket is the least frequent group with only 115 families (2.2%) belonging to this category.
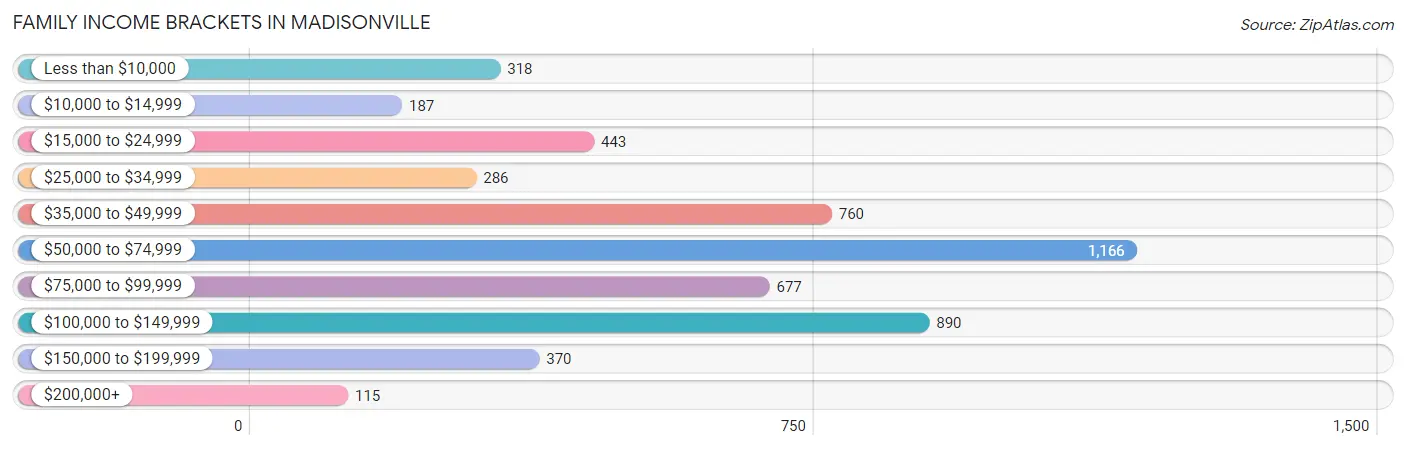
| Income Bracket | # Families | % Families |
| Less than $10,000 | 318 | 6.1% |
| $10,000 to $14,999 | 187 | 3.6% |
| $15,000 to $24,999 | 443 | 8.5% |
| $25,000 to $34,999 | 286 | 5.5% |
| $35,000 to $49,999 | 760 | 14.6% |
| $50,000 to $74,999 | 1,166 | 22.4% |
| $75,000 to $99,999 | 677 | 13.0% |
| $100,000 to $149,999 | 890 | 17.1% |
| $150,000 to $199,999 | 370 | 7.1% |
| $200,000+ | 115 | 2.2% |
Family Income by Famaliy Size in Madisonville
6-person families (110 | 2.1%) account for the highest median family income in Madisonville with $111,413 per family, while 2-person families (2,679 | 51.5%) have the highest median income of $32,328 per family member.
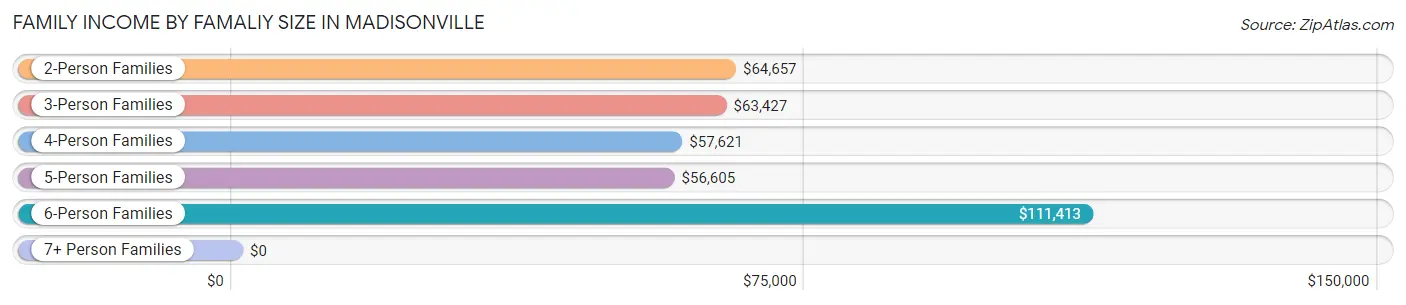
| Income Bracket | # Families | Median Income |
| 2-Person Families | 2,679 (51.5%) | $64,657 |
| 3-Person Families | 1,068 (20.5%) | $63,427 |
| 4-Person Families | 1,045 (20.1%) | $57,621 |
| 5-Person Families | 277 (5.3%) | $56,605 |
| 6-Person Families | 110 (2.1%) | $111,413 |
| 7+ Person Families | 27 (0.5%) | $0 |
| Total | 5,206 (100.0%) | $60,722 |
Family Income by Number of Earners in Madisonville
The median family income in Madisonville is $60,722, with families comprising 2 earners (2,053) having the highest median family income of $93,262, while families with no earners (1,169) have the lowest median family income of $32,188, accounting for 39.4% and 22.5% of families, respectively.
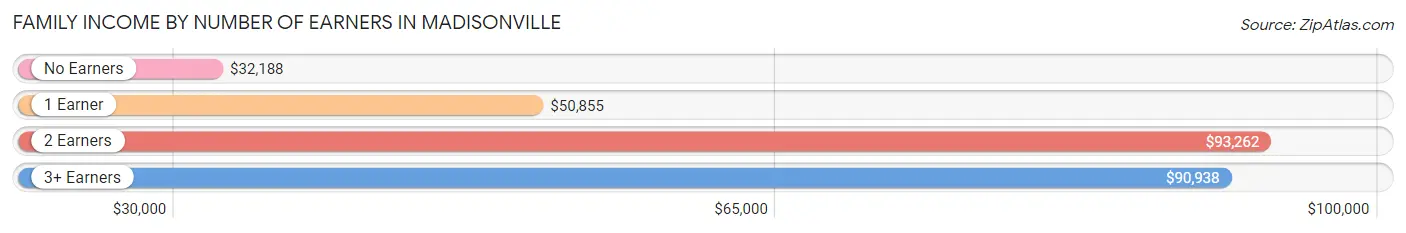
| Number of Earners | # Families | Median Income |
| No Earners | 1,169 (22.5%) | $32,188 |
| 1 Earner | 1,762 (33.9%) | $50,855 |
| 2 Earners | 2,053 (39.4%) | $93,262 |
| 3+ Earners | 222 (4.3%) | $90,938 |
| Total | 5,206 (100.0%) | $60,722 |
Household Income in Madisonville
Household Income Brackets in Madisonville
With 1,578 households falling in the category, the $50,000 to $74,999 income range is the most frequent in Madisonville, accounting for 19.7% of all households. In contrast, only 152 households (1.9%) fall into the $200,000+ income bracket, making it the least populous group.
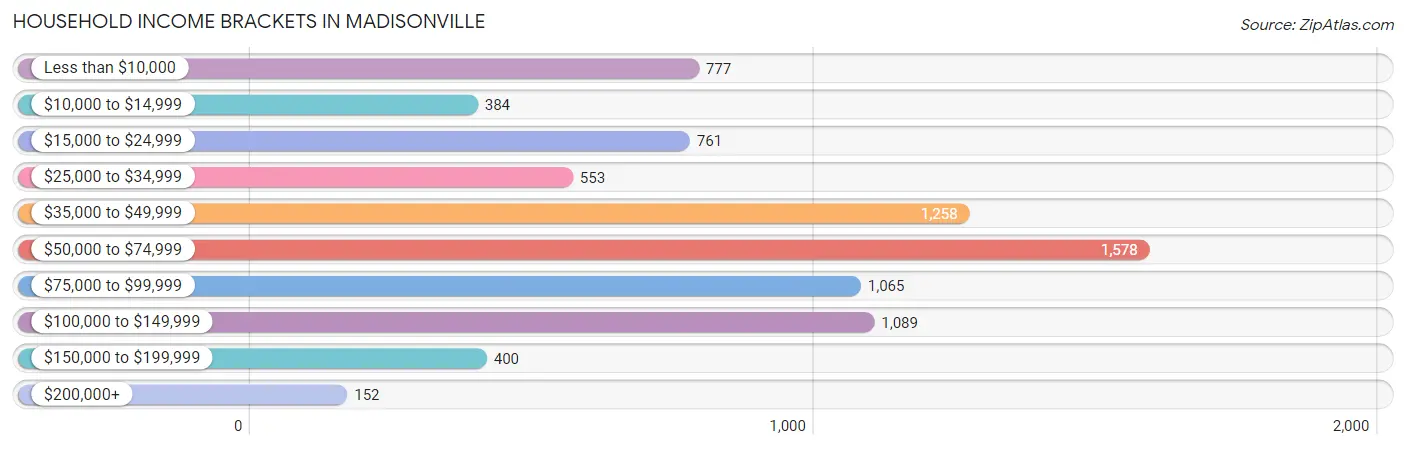
| Income Bracket | # Households | % Households |
| Less than $10,000 | 777 | 9.7% |
| $10,000 to $14,999 | 384 | 4.8% |
| $15,000 to $24,999 | 761 | 9.5% |
| $25,000 to $34,999 | 553 | 6.9% |
| $35,000 to $49,999 | 1,258 | 15.7% |
| $50,000 to $74,999 | 1,578 | 19.7% |
| $75,000 to $99,999 | 1,065 | 13.3% |
| $100,000 to $149,999 | 1,089 | 13.6% |
| $150,000 to $199,999 | 400 | 5.0% |
| $200,000+ | 152 | 1.9% |
Household Income by Householder Age in Madisonville
The median household income in Madisonville is $54,234, with the highest median household income of $58,566 found in the 45 to 64 years age bracket for the primary householder. A total of 2,683 households (33.5%) fall into this category. Meanwhile, the 15 to 24 years age bracket for the primary householder has the lowest median household income of $36,250, with 421 households (5.3%) in this group.
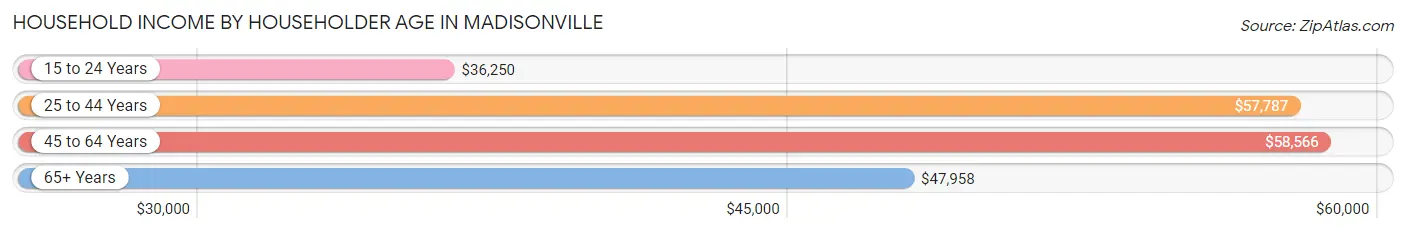
| Income Bracket | # Households | Median Income |
| 15 to 24 Years | 421 (5.3%) | $36,250 |
| 25 to 44 Years | 2,582 (32.2%) | $57,787 |
| 45 to 64 Years | 2,683 (33.5%) | $58,566 |
| 65+ Years | 2,324 (29.0%) | $47,958 |
| Total | 8,010 (100.0%) | $54,234 |
Poverty in Madisonville
Income Below Poverty by Sex and Age in Madisonville
With 17.1% poverty level for males and 24.6% for females among the residents of Madisonville, under 5 year old males and 6 to 11 year old females are the most vulnerable to poverty, with 211 males (34.6%) and 373 females (50.7%) in their respective age groups living below the poverty level.
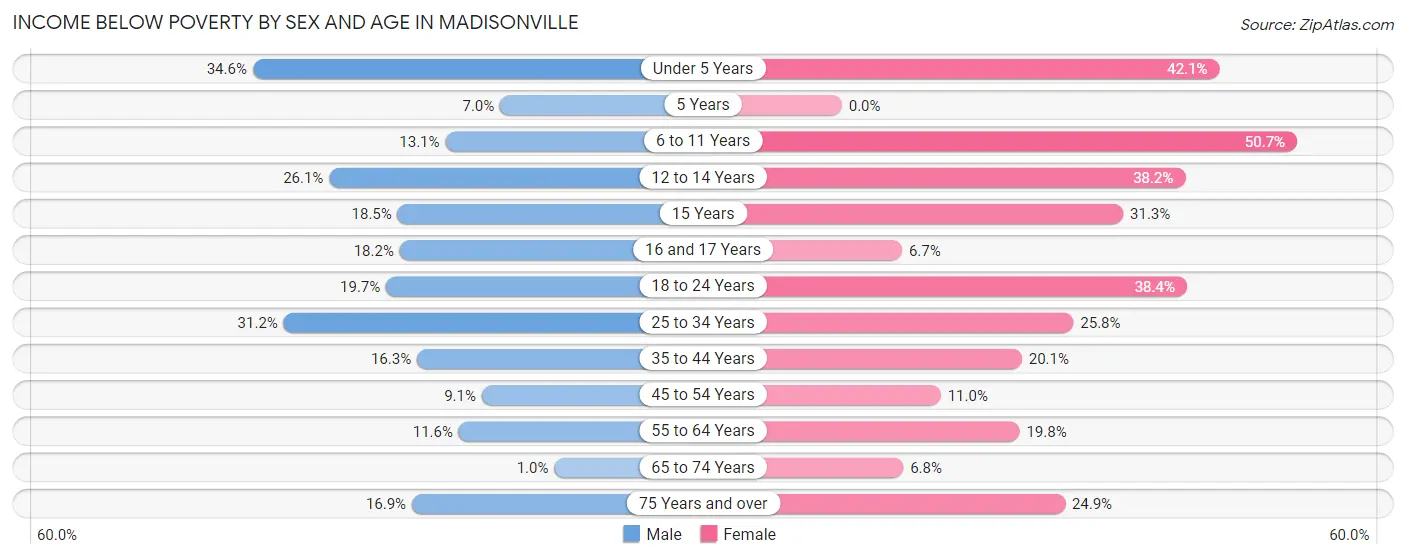
| Age Bracket | Male | Female |
| Under 5 Years | 211 (34.6%) | 259 (42.0%) |
| 5 Years | 14 (7.0%) | 0 (0.0%) |
| 6 to 11 Years | 102 (13.1%) | 373 (50.7%) |
| 12 to 14 Years | 103 (26.1%) | 156 (38.2%) |
| 15 Years | 12 (18.5%) | 52 (31.3%) |
| 16 and 17 Years | 80 (18.2%) | 14 (6.7%) |
| 18 to 24 Years | 136 (19.7%) | 373 (38.4%) |
| 25 to 34 Years | 390 (31.1%) | 309 (25.8%) |
| 35 to 44 Years | 149 (16.3%) | 247 (20.1%) |
| 45 to 54 Years | 110 (9.1%) | 124 (11.0%) |
| 55 to 64 Years | 118 (11.6%) | 212 (19.8%) |
| 65 to 74 Years | 8 (1.0%) | 81 (6.8%) |
| 75 Years and over | 102 (16.9%) | 170 (24.8%) |
| Total | 1,535 (17.1%) | 2,370 (24.6%) |
Income Above Poverty by Sex and Age in Madisonville
According to the poverty statistics in Madisonville, males aged 65 to 74 years and females aged 5 years are the age groups that are most secure financially, with 99.0% of males and 100.0% of females in these age groups living above the poverty line.
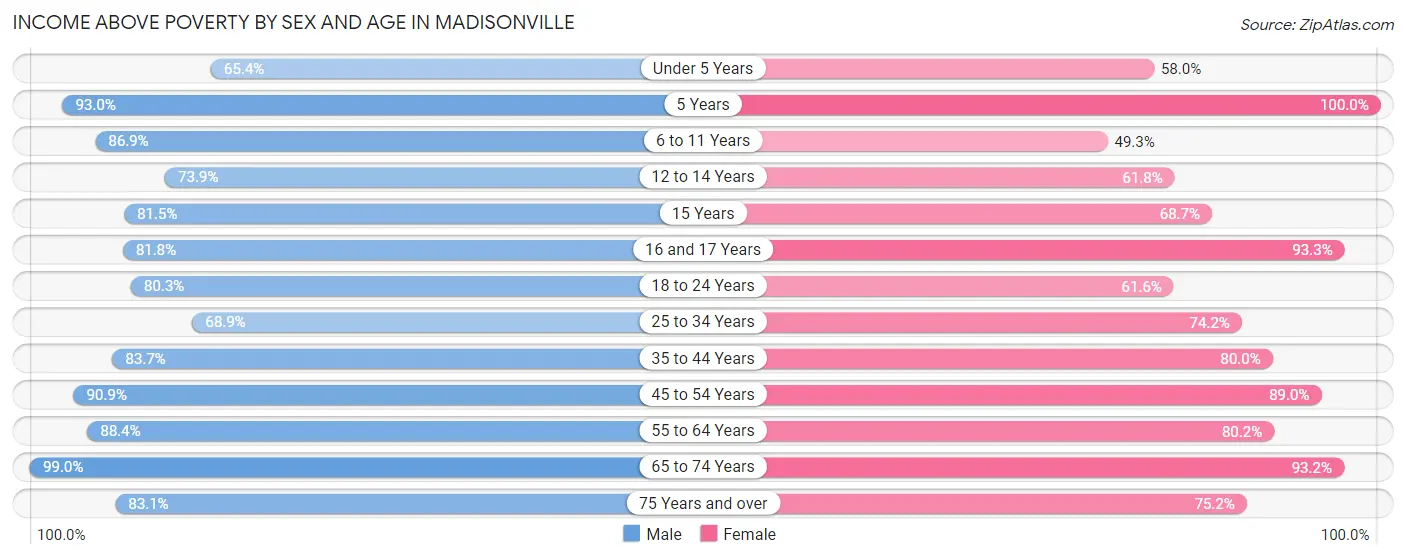
| Age Bracket | Male | Female |
| Under 5 Years | 399 (65.4%) | 357 (58.0%) |
| 5 Years | 185 (93.0%) | 13 (100.0%) |
| 6 to 11 Years | 674 (86.9%) | 363 (49.3%) |
| 12 to 14 Years | 292 (73.9%) | 252 (61.8%) |
| 15 Years | 53 (81.5%) | 114 (68.7%) |
| 16 and 17 Years | 359 (81.8%) | 195 (93.3%) |
| 18 to 24 Years | 553 (80.3%) | 598 (61.6%) |
| 25 to 34 Years | 862 (68.9%) | 889 (74.2%) |
| 35 to 44 Years | 765 (83.7%) | 985 (79.9%) |
| 45 to 54 Years | 1,101 (90.9%) | 1,001 (89.0%) |
| 55 to 64 Years | 896 (88.4%) | 859 (80.2%) |
| 65 to 74 Years | 788 (99.0%) | 1,103 (93.2%) |
| 75 Years and over | 503 (83.1%) | 514 (75.1%) |
| Total | 7,430 (82.9%) | 7,243 (75.3%) |
Income Below Poverty Among Married-Couple Families in Madisonville
The poverty statistics for married-couple families in Madisonville show that 5.5% or 184 of the total 3,326 families live below the poverty line. Families with 5 or more children have the highest poverty rate of 100.0%, comprising of 21 families. On the other hand, families with 1 or 2 children have the lowest poverty rate of 2.6%, which includes 27 families.
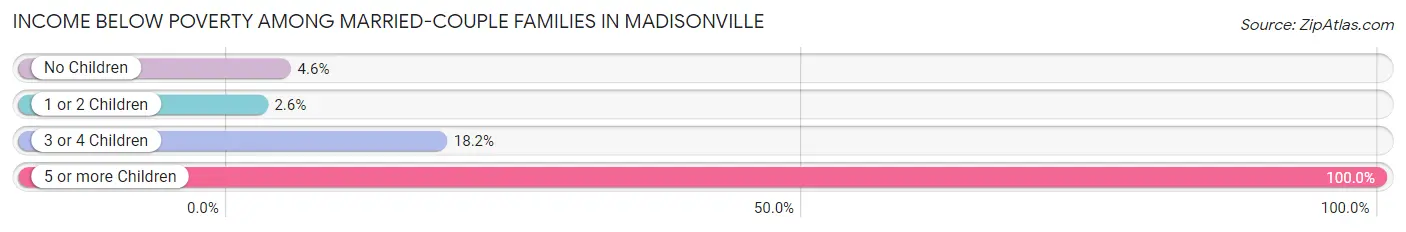
| Children | Above Poverty | Below Poverty |
| No Children | 1,918 (95.4%) | 92 (4.6%) |
| 1 or 2 Children | 1,026 (97.4%) | 27 (2.6%) |
| 3 or 4 Children | 198 (81.8%) | 44 (18.2%) |
| 5 or more Children | 0 (0.0%) | 21 (100.0%) |
| Total | 3,142 (94.5%) | 184 (5.5%) |
Income Below Poverty Among Single-Parent Households in Madisonville
According to the poverty data in Madisonville, 30.4% or 133 single-father households and 36.9% or 533 single-mother households are living below the poverty line. Among single-father households, those with no children have the highest poverty rate, with 69 households (37.7%) experiencing poverty. Likewise, among single-mother households, those with 3 or 4 children have the highest poverty rate, with 271 households (72.5%) falling below the poverty line.
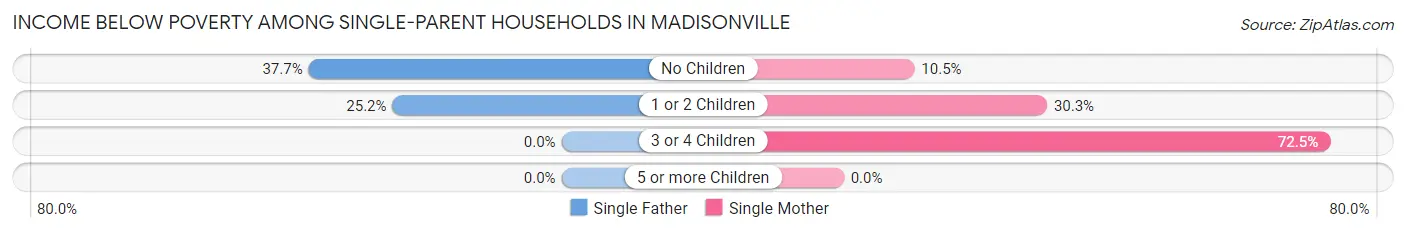
| Children | Single Father | Single Mother |
| No Children | 69 (37.7%) | 33 (10.5%) |
| 1 or 2 Children | 64 (25.2%) | 229 (30.3%) |
| 3 or 4 Children | 0 (0.0%) | 271 (72.5%) |
| 5 or more Children | 0 (0.0%) | 0 (0.0%) |
| Total | 133 (30.4%) | 533 (36.9%) |
Income Below Poverty Among Married-Couple vs Single-Parent Households in Madisonville
The poverty data for Madisonville shows that 184 of the married-couple family households (5.5%) and 666 of the single-parent households (35.4%) are living below the poverty level. Within the married-couple family households, those with 5 or more children have the highest poverty rate, with 21 households (100.0%) falling below the poverty line. Among the single-parent households, those with 3 or 4 children have the highest poverty rate, with 271 household (72.5%) living below poverty.
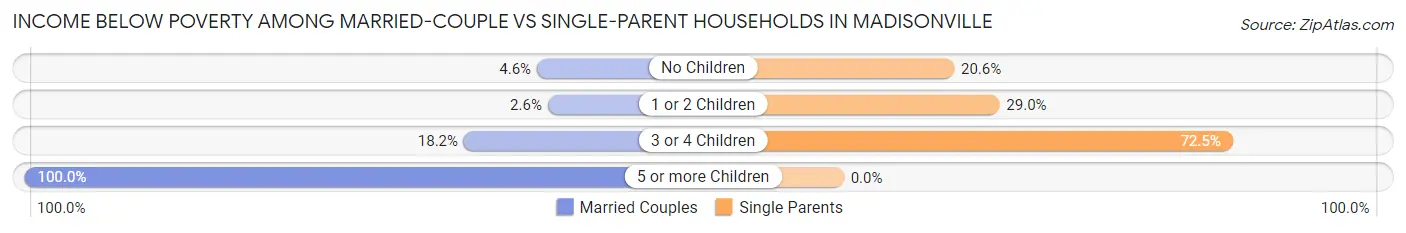
| Children | Married-Couple Families | Single-Parent Households |
| No Children | 92 (4.6%) | 102 (20.6%) |
| 1 or 2 Children | 27 (2.6%) | 293 (29.0%) |
| 3 or 4 Children | 44 (18.2%) | 271 (72.5%) |
| 5 or more Children | 21 (100.0%) | 0 (0.0%) |
| Total | 184 (5.5%) | 666 (35.4%) |
Race in Madisonville
The most populous races in Madisonville are White / Caucasian (15,250 | 78.5%), Black / African American (2,349 | 12.1%), and Two or more Races (1,268 | 6.5%).
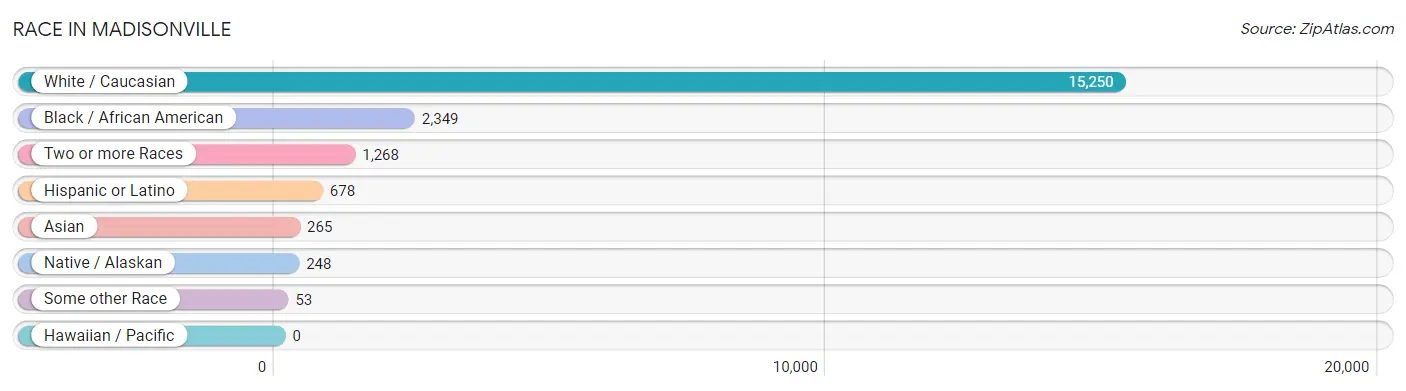
| Race | # Population | % Population |
| Asian | 265 | 1.4% |
| Black / African American | 2,349 | 12.1% |
| Hawaiian / Pacific | 0 | 0.0% |
| Hispanic or Latino | 678 | 3.5% |
| Native / Alaskan | 248 | 1.3% |
| White / Caucasian | 15,250 | 78.5% |
| Two or more Races | 1,268 | 6.5% |
| Some other Race | 53 | 0.3% |
| Total | 19,433 | 100.0% |
Ancestry in Madisonville
The most populous ancestries reported in Madisonville are American (2,327 | 12.0%), English (2,259 | 11.6%), Irish (1,695 | 8.7%), German (1,361 | 7.0%), and Mexican (478 | 2.5%), together accounting for 41.8% of all Madisonville residents.
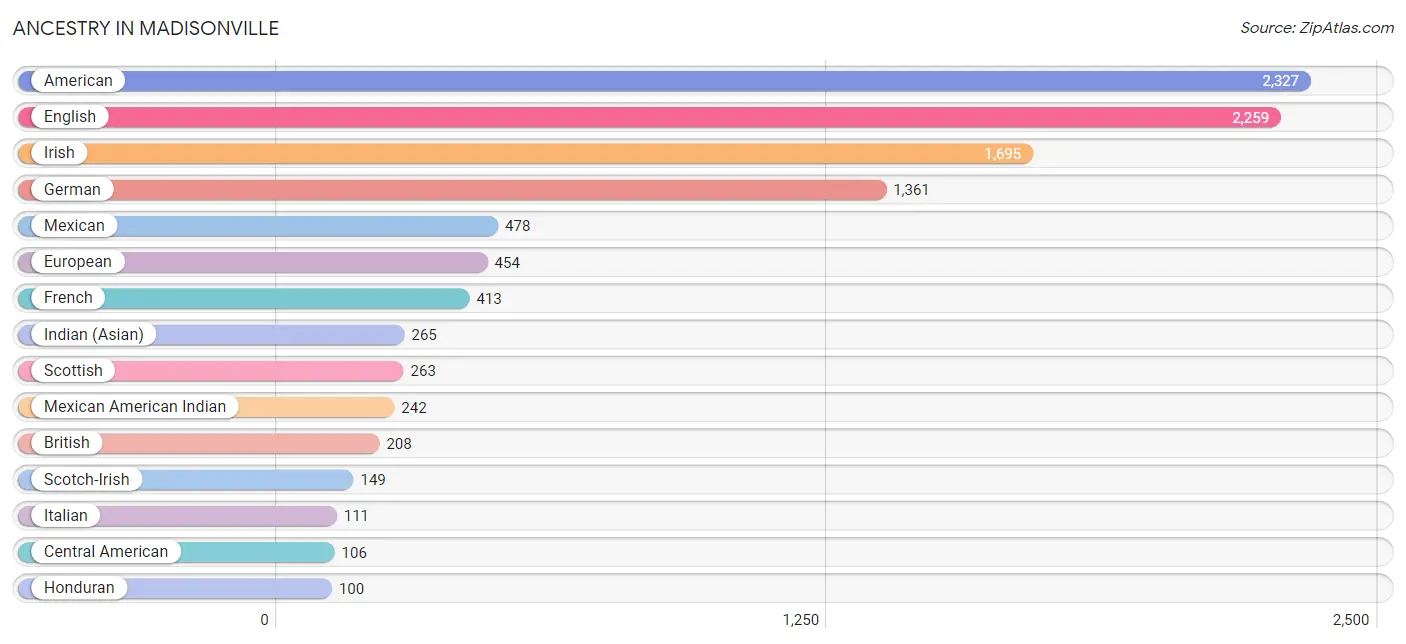
| Ancestry | # Population | % Population |
| African | 9 | 0.1% |
| Albanian | 6 | 0.0% |
| American | 2,327 | 12.0% |
| Arab | 6 | 0.0% |
| Australian | 15 | 0.1% |
| British | 208 | 1.1% |
| Canadian | 49 | 0.3% |
| Central American | 106 | 0.5% |
| Cherokee | 14 | 0.1% |
| Creek | 13 | 0.1% |
| Danish | 3 | 0.0% |
| Dominican | 14 | 0.1% |
| Dutch | 65 | 0.3% |
| Dutch West Indian | 7 | 0.0% |
| Eastern European | 9 | 0.1% |
| English | 2,259 | 11.6% |
| European | 454 | 2.3% |
| French | 413 | 2.1% |
| French Canadian | 9 | 0.1% |
| German | 1,361 | 7.0% |
| Honduran | 100 | 0.5% |
| Hungarian | 60 | 0.3% |
| Indian (Asian) | 265 | 1.4% |
| Irish | 1,695 | 8.7% |
| Italian | 111 | 0.6% |
| Japanese | 40 | 0.2% |
| Mexican | 478 | 2.5% |
| Mexican American Indian | 242 | 1.3% |
| Native Hawaiian | 54 | 0.3% |
| Nigerian | 8 | 0.0% |
| Northern European | 20 | 0.1% |
| Norwegian | 25 | 0.1% |
| Panamanian | 6 | 0.0% |
| Pennsylvania German | 16 | 0.1% |
| Polish | 60 | 0.3% |
| Portuguese | 51 | 0.3% |
| Puerto Rican | 31 | 0.2% |
| Russian | 5 | 0.0% |
| Scandinavian | 11 | 0.1% |
| Scotch-Irish | 149 | 0.8% |
| Scottish | 263 | 1.3% |
| Spaniard | 16 | 0.1% |
| Subsaharan African | 17 | 0.1% |
| Swedish | 52 | 0.3% |
| Syrian | 6 | 0.0% |
| Ukrainian | 28 | 0.1% |
| Welsh | 99 | 0.5% | View All 47 Rows |
Immigrants in Madisonville
The most numerous immigrant groups reported in Madisonville came from Asia (249 | 1.3%), China (206 | 1.1%), Eastern Asia (206 | 1.1%), Latin America (184 | 0.9%), and Central America (166 | 0.9%), together accounting for 5.2% of all Madisonville residents.
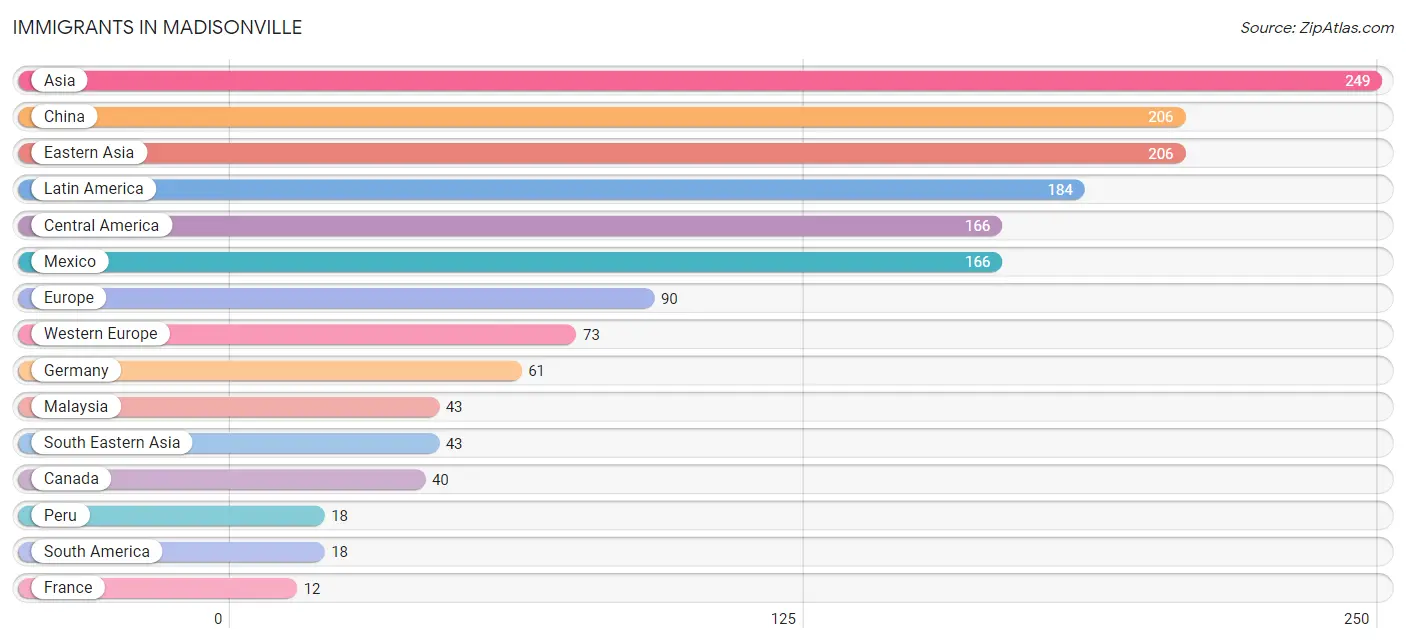
| Immigration Origin | # Population | % Population |
| Africa | 5 | 0.0% |
| Asia | 249 | 1.3% |
| Canada | 40 | 0.2% |
| Central America | 166 | 0.9% |
| China | 206 | 1.1% |
| Eastern Asia | 206 | 1.1% |
| Eastern Europe | 11 | 0.1% |
| Europe | 90 | 0.5% |
| France | 12 | 0.1% |
| Germany | 61 | 0.3% |
| Hungary | 6 | 0.0% |
| Italy | 6 | 0.0% |
| Latin America | 184 | 0.9% |
| Malaysia | 43 | 0.2% |
| Mexico | 166 | 0.9% |
| Nigeria | 5 | 0.0% |
| Peru | 18 | 0.1% |
| Russia | 5 | 0.0% |
| South America | 18 | 0.1% |
| South Eastern Asia | 43 | 0.2% |
| Southern Europe | 6 | 0.0% |
| Western Africa | 5 | 0.0% |
| Western Europe | 73 | 0.4% | View All 23 Rows |
Sex and Age in Madisonville
Sex and Age in Madisonville
The most populous age groups in Madisonville are 50 to 54 Years (791 | 8.4%) for men and 35 to 39 Years (735 | 7.3%) for women.
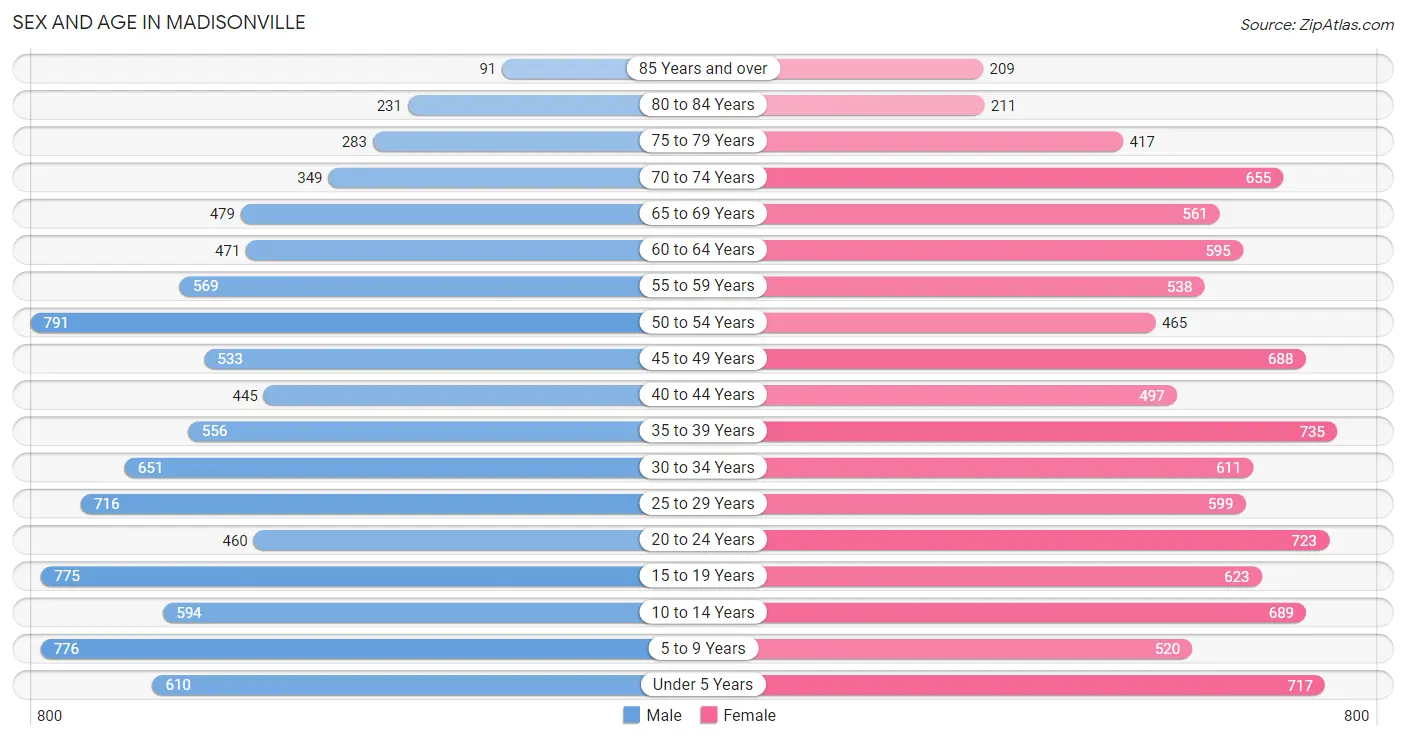
| Age Bracket | Male | Female |
| Under 5 Years | 610 (6.5%) | 717 (7.1%) |
| 5 to 9 Years | 776 (8.3%) | 520 (5.2%) |
| 10 to 14 Years | 594 (6.3%) | 689 (6.9%) |
| 15 to 19 Years | 775 (8.3%) | 623 (6.2%) |
| 20 to 24 Years | 460 (4.9%) | 723 (7.2%) |
| 25 to 29 Years | 716 (7.6%) | 599 (6.0%) |
| 30 to 34 Years | 651 (6.9%) | 611 (6.1%) |
| 35 to 39 Years | 556 (5.9%) | 735 (7.3%) |
| 40 to 44 Years | 445 (4.7%) | 497 (4.9%) |
| 45 to 49 Years | 533 (5.7%) | 688 (6.8%) |
| 50 to 54 Years | 791 (8.4%) | 465 (4.6%) |
| 55 to 59 Years | 569 (6.1%) | 538 (5.3%) |
| 60 to 64 Years | 471 (5.0%) | 595 (5.9%) |
| 65 to 69 Years | 479 (5.1%) | 561 (5.6%) |
| 70 to 74 Years | 349 (3.7%) | 655 (6.5%) |
| 75 to 79 Years | 283 (3.0%) | 417 (4.2%) |
| 80 to 84 Years | 231 (2.5%) | 211 (2.1%) |
| 85 Years and over | 91 (1.0%) | 209 (2.1%) |
| Total | 9,380 (100.0%) | 10,053 (100.0%) |
Families and Households in Madisonville
Median Family Size in Madisonville
The median family size in Madisonville is 2.86 persons per family, with single female/mother families (1,443 | 27.7%) accounting for the largest median family size of 3.01 persons per family. On the other hand, single male/father families (437 | 8.4%) represent the smallest median family size with 2.18 persons per family.
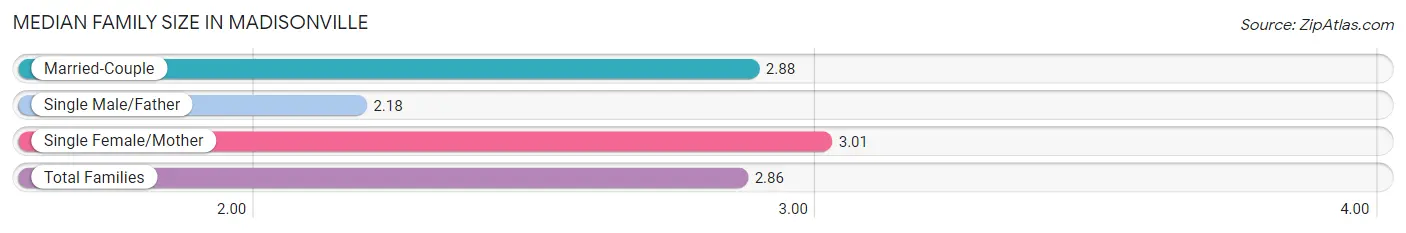
| Family Type | # Families | Family Size |
| Married-Couple | 3,326 (63.9%) | 2.88 |
| Single Male/Father | 437 (8.4%) | 2.18 |
| Single Female/Mother | 1,443 (27.7%) | 3.01 |
| Total Families | 5,206 (100.0%) | 2.86 |
Median Household Size in Madisonville
The median household size in Madisonville is 2.34 persons per household, with single female/mother households (1,443 | 18.0%) accounting for the largest median household size of 3.23 persons per household. non-family households (2,804 | 35.0%) represent the smallest median household size with 1.23 persons per household.
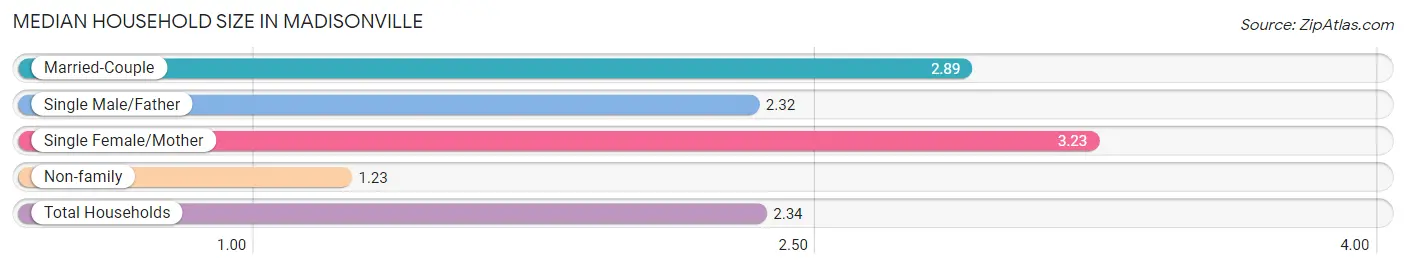
| Household Type | # Households | Household Size |
| Married-Couple | 3,326 (41.5%) | 2.89 |
| Single Male/Father | 437 (5.5%) | 2.32 |
| Single Female/Mother | 1,443 (18.0%) | 3.23 |
| Non-family | 2,804 (35.0%) | 1.23 |
| Total Households | 8,010 (100.0%) | 2.34 |
Household Size by Marriage Status in Madisonville
Out of a total of 8,010 households in Madisonville, 5,206 (65.0%) are family households, while 2,804 (35.0%) are nonfamily households. The most numerous type of family households are 2-person households, comprising 2,625, and the most common type of nonfamily households are 1-person households, comprising 2,279.
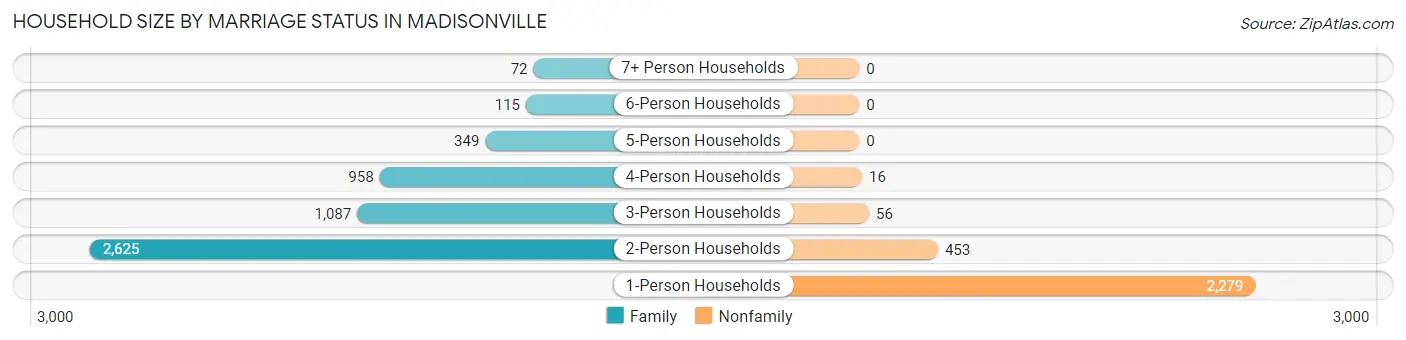
| Household Size | Family Households | Nonfamily Households |
| 1-Person Households | - | 2,279 (28.4%) |
| 2-Person Households | 2,625 (32.8%) | 453 (5.7%) |
| 3-Person Households | 1,087 (13.6%) | 56 (0.7%) |
| 4-Person Households | 958 (12.0%) | 16 (0.2%) |
| 5-Person Households | 349 (4.4%) | 0 (0.0%) |
| 6-Person Households | 115 (1.4%) | 0 (0.0%) |
| 7+ Person Households | 72 (0.9%) | 0 (0.0%) |
| Total | 5,206 (65.0%) | 2,804 (35.0%) |
Female Fertility in Madisonville
Fertility by Age in Madisonville
Average fertility rate in Madisonville is 64.0 births per 1,000 women. Women in the age bracket of 20 to 34 years have the highest fertility rate with 128.0 births per 1,000 women. Women in the age bracket of 20 to 34 years acount for 84.6% of all women with births.
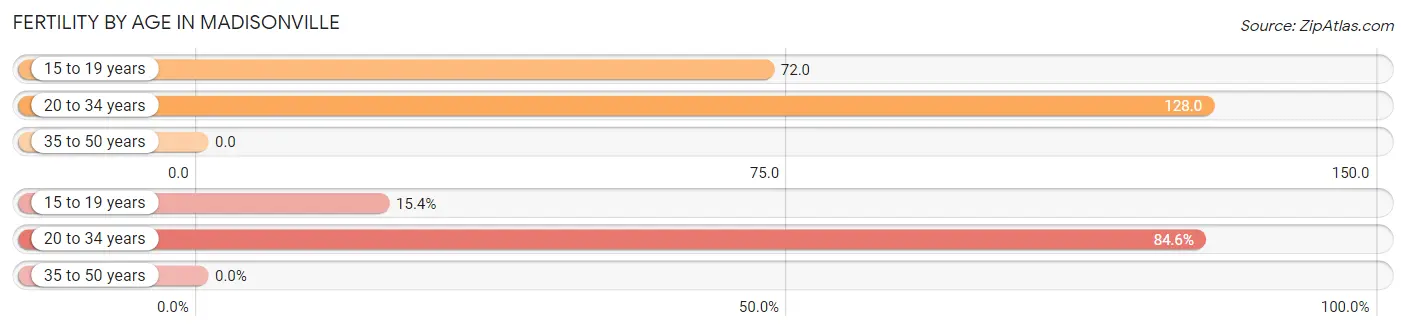
| Age Bracket | Women with Births | Births / 1,000 Women |
| 15 to 19 years | 45 (15.4%) | 72.0 |
| 20 to 34 years | 248 (84.6%) | 128.0 |
| 35 to 50 years | 0 (0.0%) | 0.0 |
| Total | 293 (100.0%) | 64.0 |
Fertility by Age by Marriage Status in Madisonville
42.3% of women with births (293) in Madisonville are married. The highest percentage of unmarried women with births falls into 15 to 19 years age bracket with 100.0% of them unmarried at the time of birth, while the lowest percentage of unmarried women with births belong to 20 to 34 years age bracket with 50.0% of them unmarried.
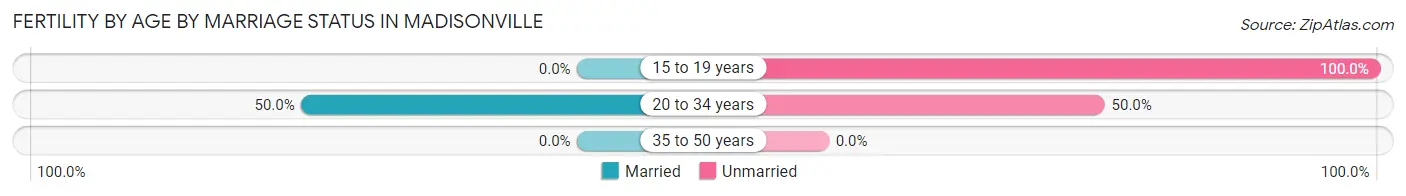
| Age Bracket | Married | Unmarried |
| 15 to 19 years | 0 (0.0%) | 45 (100.0%) |
| 20 to 34 years | 124 (50.0%) | 124 (50.0%) |
| 35 to 50 years | 0 (0.0%) | 0 (0.0%) |
| Total | 124 (42.3%) | 169 (57.7%) |
Fertility by Education in Madisonville
Average fertility rate in Madisonville is 64.0 births per 1,000 women. Women with the education attainment of less than high school have the highest fertility rate of 139.0 births per 1,000 women, while women with the education attainment of graduate degree have the lowest fertility at 12.0 births per 1,000 women. Women with the education attainment of college or associate's degree represent 41.3% of all women with births.
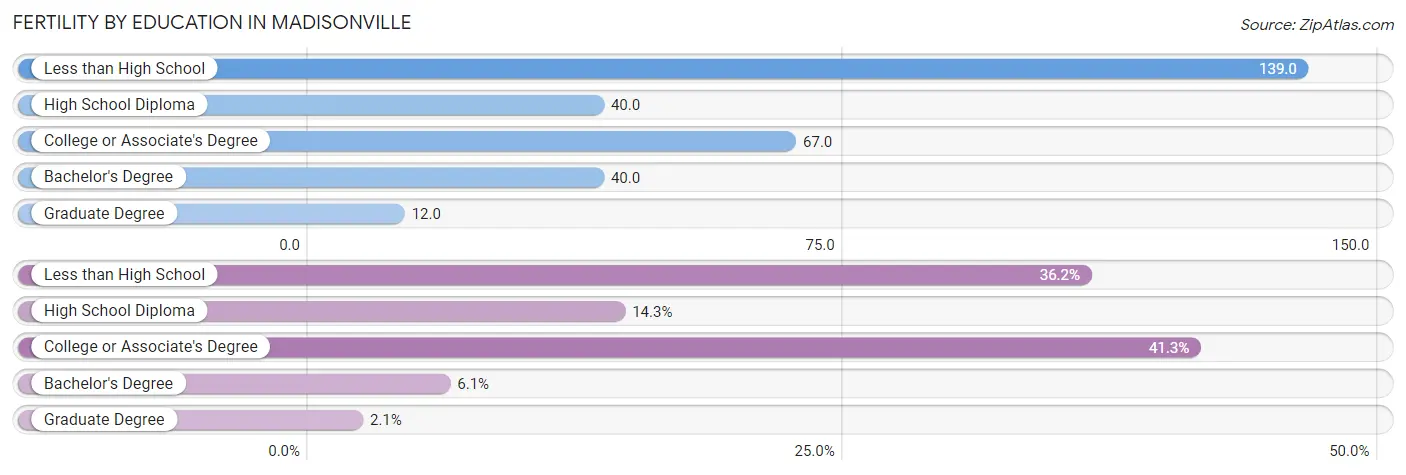
| Educational Attainment | Women with Births | Births / 1,000 Women |
| Less than High School | 106 (36.2%) | 139.0 |
| High School Diploma | 42 (14.3%) | 40.0 |
| College or Associate's Degree | 121 (41.3%) | 67.0 |
| Bachelor's Degree | 18 (6.1%) | 40.0 |
| Graduate Degree | 6 (2.1%) | 12.0 |
| Total | 293 (100.0%) | 64.0 |
Fertility by Education by Marriage Status in Madisonville
57.7% of women with births in Madisonville are unmarried. Women with the educational attainment of bachelor's degree are most likely to be married with 100.0% of them married at childbirth, while women with the educational attainment of less than high school are least likely to be married with 100.0% of them unmarried at childbirth.
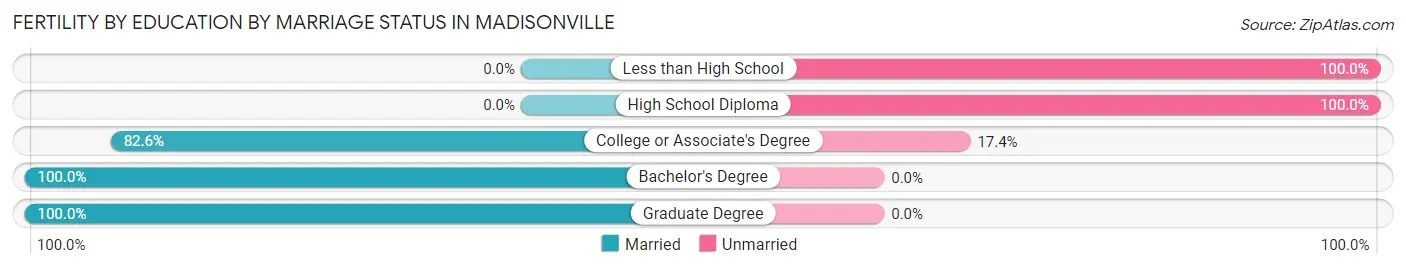
| Educational Attainment | Married | Unmarried |
| Less than High School | 0 (0.0%) | 106 (100.0%) |
| High School Diploma | 0 (0.0%) | 42 (100.0%) |
| College or Associate's Degree | 100 (82.6%) | 21 (17.4%) |
| Bachelor's Degree | 18 (100.0%) | 0 (0.0%) |
| Graduate Degree | 6 (100.0%) | 0 (0.0%) |
| Total | 124 (42.3%) | 169 (57.7%) |
Employment Characteristics in Madisonville
Employment by Class of Employer in Madisonville
Among the 7,512 employed individuals in Madisonville, private company employees (4,632 | 61.7%), not-for-profit organizations (1,040 | 13.8%), and local government employees (664 | 8.8%) make up the most common classes of employment.
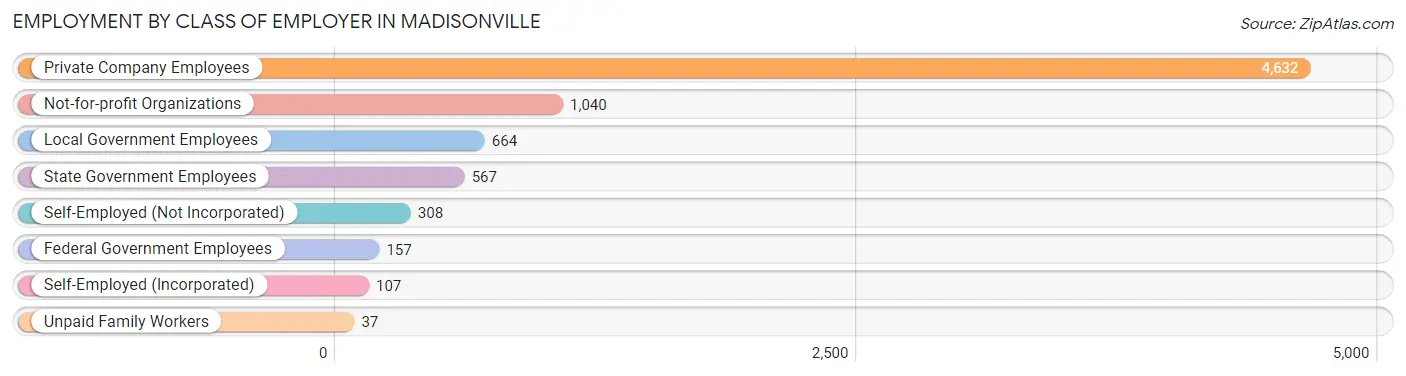
| Employer Class | # Employees | % Employees |
| Private Company Employees | 4,632 | 61.7% |
| Self-Employed (Incorporated) | 107 | 1.4% |
| Self-Employed (Not Incorporated) | 308 | 4.1% |
| Not-for-profit Organizations | 1,040 | 13.8% |
| Local Government Employees | 664 | 8.8% |
| State Government Employees | 567 | 7.5% |
| Federal Government Employees | 157 | 2.1% |
| Unpaid Family Workers | 37 | 0.5% |
| Total | 7,512 | 100.0% |
Employment Status by Age in Madisonville
According to the labor force statistics for Madisonville, out of the total population over 16 years of age (15,296), 55.3% or 8,459 individuals are in the labor force, with 9.3% or 787 of them unemployed. The age group with the highest labor force participation rate is 30 to 34 years, with 79.9% or 1,008 individuals in the labor force. Within the labor force, the 16 to 19 years age range has the highest percentage of unemployed individuals, with 33.7% or 137 of them being unemployed.
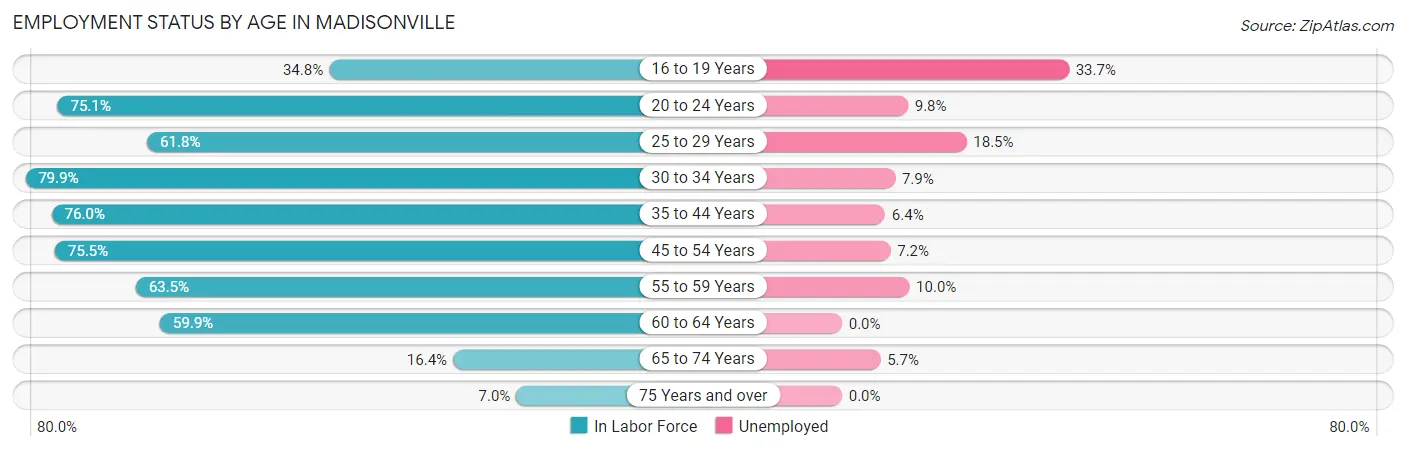
| Age Bracket | In Labor Force | Unemployed |
| 16 to 19 Years | 406 (34.8%) | 137 (33.7%) |
| 20 to 24 Years | 888 (75.1%) | 87 (9.8%) |
| 25 to 29 Years | 813 (61.8%) | 150 (18.5%) |
| 30 to 34 Years | 1,008 (79.9%) | 80 (7.9%) |
| 35 to 44 Years | 1,697 (76.0%) | 109 (6.4%) |
| 45 to 54 Years | 1,870 (75.5%) | 135 (7.2%) |
| 55 to 59 Years | 703 (63.5%) | 70 (10.0%) |
| 60 to 64 Years | 639 (59.9%) | 0 (0.0%) |
| 65 to 74 Years | 335 (16.4%) | 19 (5.7%) |
| 75 Years and over | 101 (7.0%) | 0 (0.0%) |
| Total | 8,459 (55.3%) | 787 (9.3%) |
Employment Status by Educational Attainment in Madisonville
According to labor force statistics for Madisonville, 71.1% of individuals (6,726) out of the total population between 25 and 64 years of age (9,460) are in the labor force, with 8.1% or 545 of them being unemployed. The group with the highest labor force participation rate are those with the educational attainment of bachelor's degree or higher, with 83.7% or 1,734 individuals in the labor force. Within the labor force, individuals with less than high school education have the highest percentage of unemployment, with 22.4% or 62 of them being unemployed.
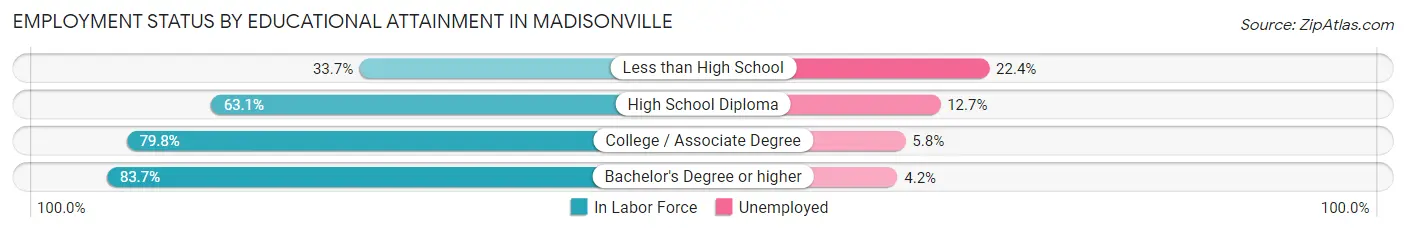
| Educational Attainment | In Labor Force | Unemployed |
| Less than High School | 277 (33.7%) | 184 (22.4%) |
| High School Diploma | 1,971 (63.1%) | 397 (12.7%) |
| College / Associate Degree | 2,748 (79.8%) | 200 (5.8%) |
| Bachelor's Degree or higher | 1,734 (83.7%) | 87 (4.2%) |
| Total | 6,726 (71.1%) | 766 (8.1%) |
Employment Occupations by Sex in Madisonville
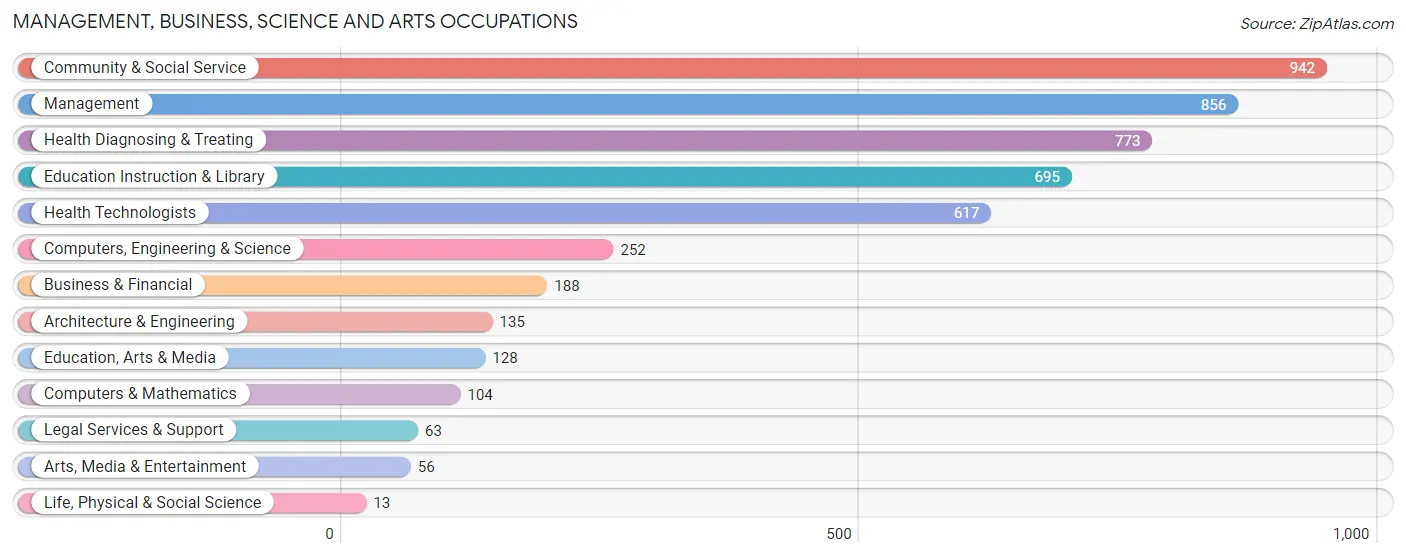
Management, Business, Science and Arts Occupations
The most common Management, Business, Science and Arts occupations in Madisonville are Community & Social Service (942 | 12.3%), Management (856 | 11.2%), Health Diagnosing & Treating (773 | 10.1%), Education Instruction & Library (695 | 9.1%), and Health Technologists (617 | 8.1%).
Management, Business, Science and Arts Occupations by Sex
Within the Management, Business, Science and Arts occupations in Madisonville, the most male-oriented occupations are Architecture & Engineering (80.0%), Life, Physical & Social Science (76.9%), and Computers, Engineering & Science (75.8%), while the most female-oriented occupations are Education, Arts & Media (89.1%), Education Instruction & Library (82.9%), and Community & Social Service (82.3%).
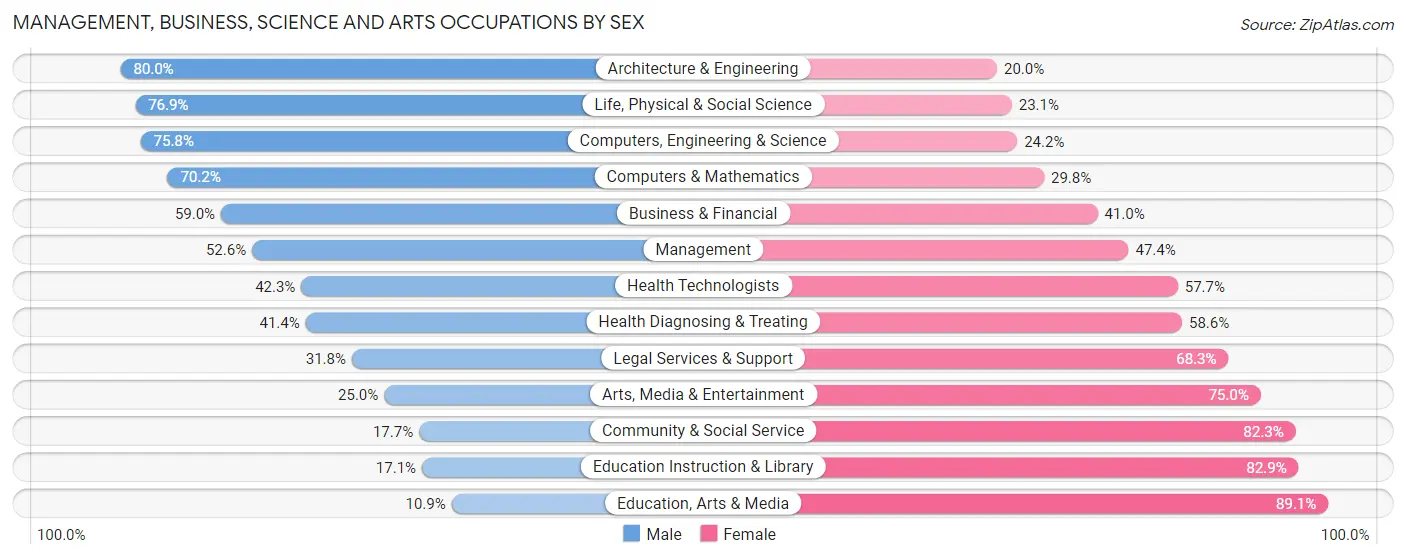
| Occupation | Male | Female |
| Management | 450 (52.6%) | 406 (47.4%) |
| Business & Financial | 111 (59.0%) | 77 (41.0%) |
| Computers, Engineering & Science | 191 (75.8%) | 61 (24.2%) |
| Computers & Mathematics | 73 (70.2%) | 31 (29.8%) |
| Architecture & Engineering | 108 (80.0%) | 27 (20.0%) |
| Life, Physical & Social Science | 10 (76.9%) | 3 (23.1%) |
| Community & Social Service | 167 (17.7%) | 775 (82.3%) |
| Education, Arts & Media | 14 (10.9%) | 114 (89.1%) |
| Legal Services & Support | 20 (31.8%) | 43 (68.2%) |
| Education Instruction & Library | 119 (17.1%) | 576 (82.9%) |
| Arts, Media & Entertainment | 14 (25.0%) | 42 (75.0%) |
| Health Diagnosing & Treating | 320 (41.4%) | 453 (58.6%) |
| Health Technologists | 261 (42.3%) | 356 (57.7%) |
| Total (Category) | 1,239 (41.1%) | 1,772 (58.9%) |
| Total (Overall) | 3,772 (49.2%) | 3,890 (50.8%) |
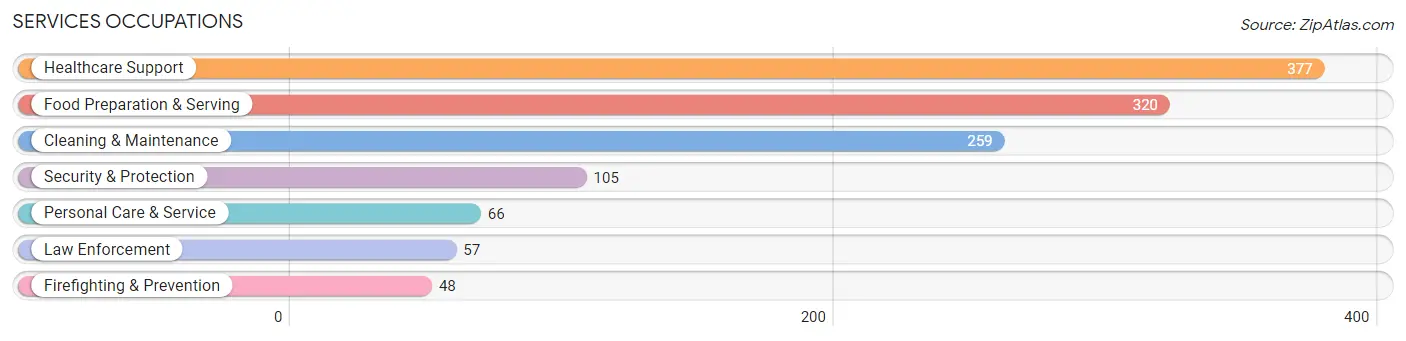
Services Occupations
The most common Services occupations in Madisonville are Healthcare Support (377 | 4.9%), Food Preparation & Serving (320 | 4.2%), Cleaning & Maintenance (259 | 3.4%), Security & Protection (105 | 1.4%), and Personal Care & Service (66 | 0.9%).
Services Occupations by Sex
Within the Services occupations in Madisonville, the most male-oriented occupations are Firefighting & Prevention (100.0%), Security & Protection (66.7%), and Cleaning & Maintenance (58.3%), while the most female-oriented occupations are Personal Care & Service (100.0%), Healthcare Support (79.0%), and Law Enforcement (61.4%).
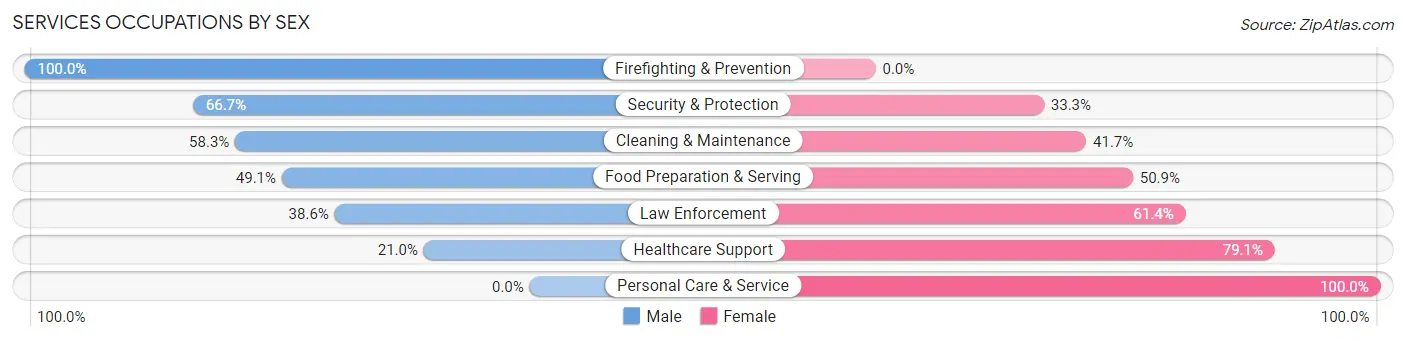
| Occupation | Male | Female |
| Healthcare Support | 79 (20.9%) | 298 (79.0%) |
| Security & Protection | 70 (66.7%) | 35 (33.3%) |
| Firefighting & Prevention | 48 (100.0%) | 0 (0.0%) |
| Law Enforcement | 22 (38.6%) | 35 (61.4%) |
| Food Preparation & Serving | 157 (49.1%) | 163 (50.9%) |
| Cleaning & Maintenance | 151 (58.3%) | 108 (41.7%) |
| Personal Care & Service | 0 (0.0%) | 66 (100.0%) |
| Total (Category) | 457 (40.6%) | 670 (59.5%) |
| Total (Overall) | 3,772 (49.2%) | 3,890 (50.8%) |
Sales and Office Occupations
The most common Sales and Office occupations in Madisonville are Office & Administration (935 | 12.2%), and Sales & Related (500 | 6.5%).

Sales and Office Occupations by Sex

| Occupation | Male | Female |
| Sales & Related | 234 (46.8%) | 266 (53.2%) |
| Office & Administration | 132 (14.1%) | 803 (85.9%) |
| Total (Category) | 366 (25.5%) | 1,069 (74.5%) |
| Total (Overall) | 3,772 (49.2%) | 3,890 (50.8%) |
Natural Resources, Construction and Maintenance Occupations
The most common Natural Resources, Construction and Maintenance occupations in Madisonville are Installation, Maintenance & Repair (285 | 3.7%), Construction & Extraction (266 | 3.5%), and Farming, Fishing & Forestry (12 | 0.2%).
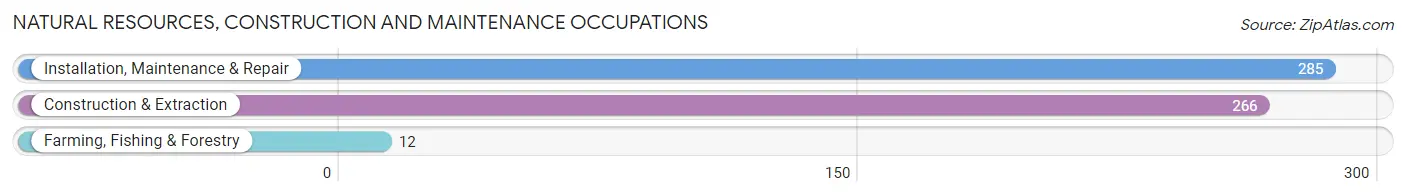
Natural Resources, Construction and Maintenance Occupations by Sex

| Occupation | Male | Female |
| Farming, Fishing & Forestry | 12 (100.0%) | 0 (0.0%) |
| Construction & Extraction | 264 (99.3%) | 2 (0.7%) |
| Installation, Maintenance & Repair | 285 (100.0%) | 0 (0.0%) |
| Total (Category) | 561 (99.6%) | 2 (0.4%) |
| Total (Overall) | 3,772 (49.2%) | 3,890 (50.8%) |
Production, Transportation and Moving Occupations
The most common Production, Transportation and Moving occupations in Madisonville are Production (747 | 9.8%), Transportation (423 | 5.5%), and Material Moving (356 | 4.6%).
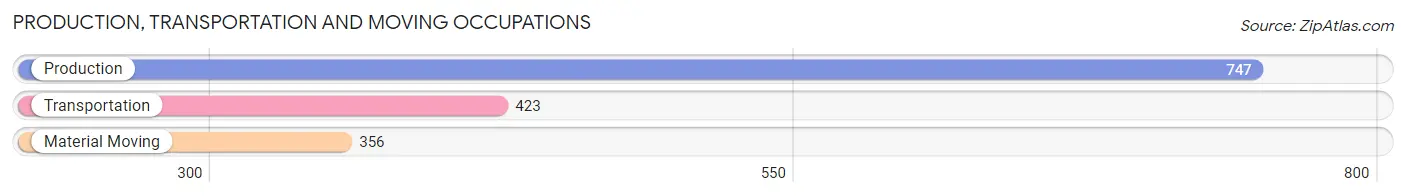
Production, Transportation and Moving Occupations by Sex
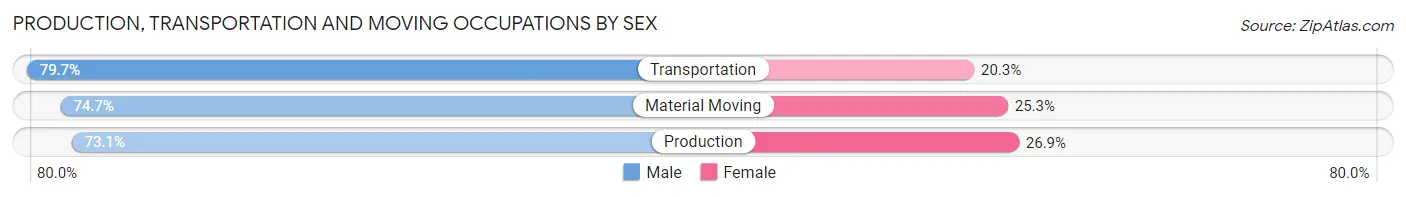
| Occupation | Male | Female |
| Production | 546 (73.1%) | 201 (26.9%) |
| Transportation | 337 (79.7%) | 86 (20.3%) |
| Material Moving | 266 (74.7%) | 90 (25.3%) |
| Total (Category) | 1,149 (75.3%) | 377 (24.7%) |
| Total (Overall) | 3,772 (49.2%) | 3,890 (50.8%) |
Employment Industries by Sex in Madisonville
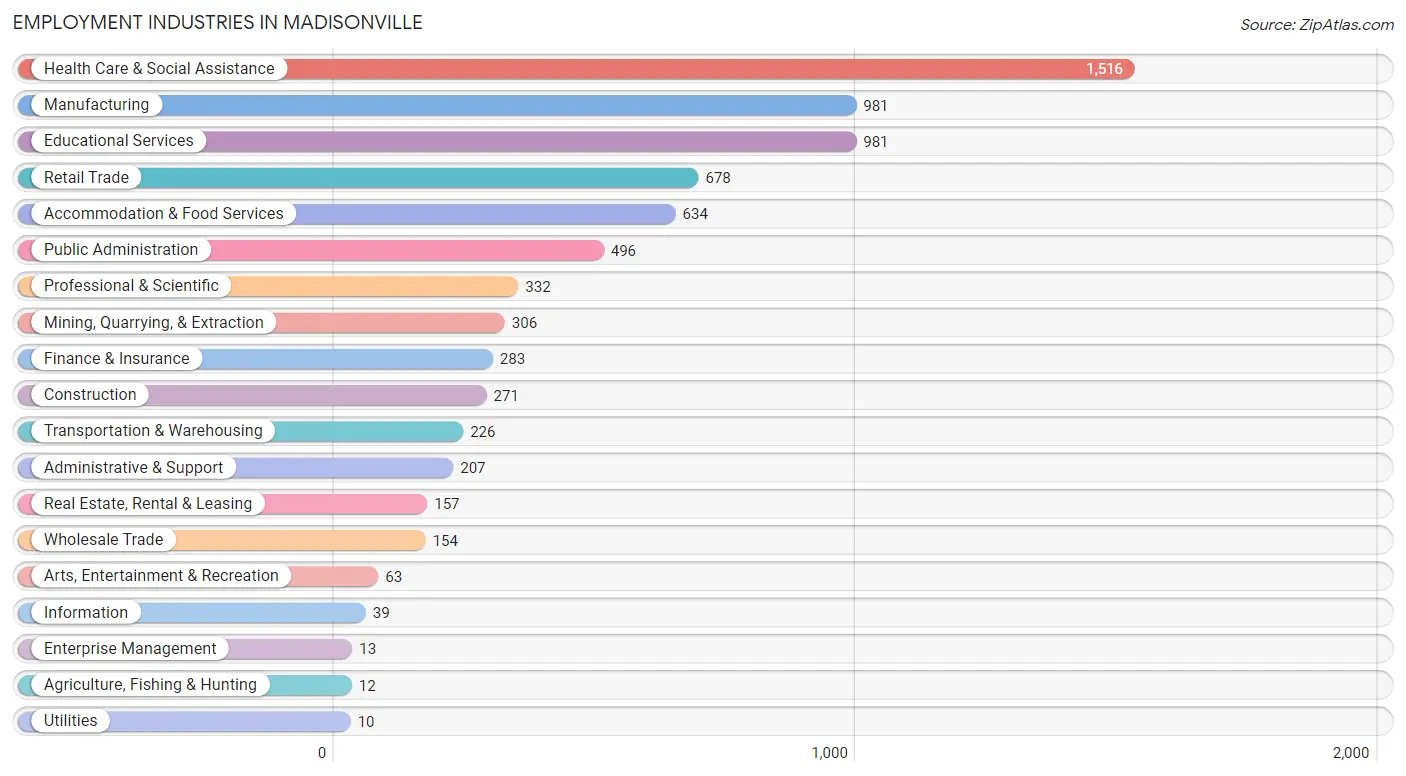
Employment Industries in Madisonville
The major employment industries in Madisonville include Health Care & Social Assistance (1,516 | 19.8%), Manufacturing (981 | 12.8%), Educational Services (981 | 12.8%), Retail Trade (678 | 8.8%), and Accommodation & Food Services (634 | 8.3%).
Employment Industries by Sex in Madisonville
The Madisonville industries that see more men than women are Agriculture, Fishing & Hunting (100.0%), Mining, Quarrying, & Extraction (100.0%), and Utilities (100.0%), whereas the industries that tend to have a higher number of women are Enterprise Management (100.0%), Finance & Insurance (84.5%), and Educational Services (81.5%).
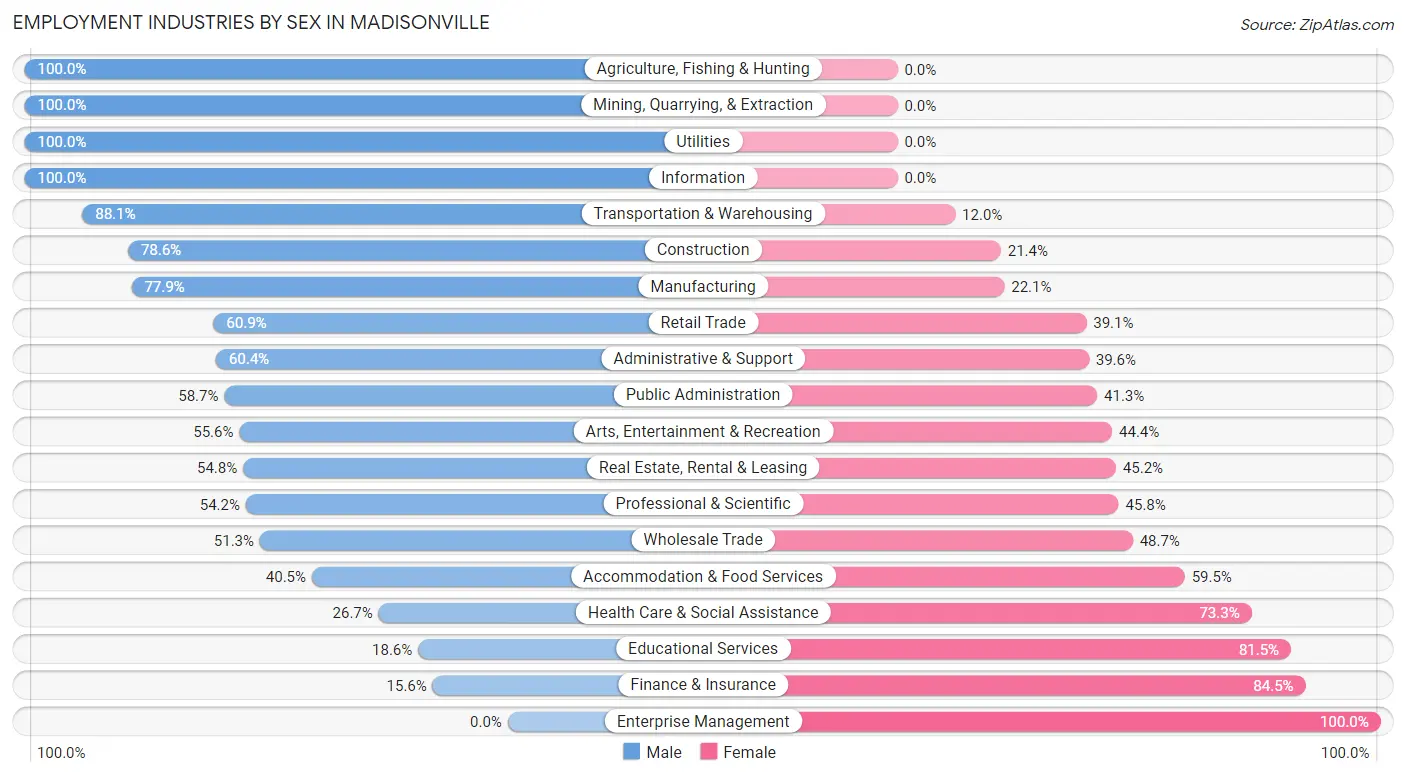
| Industry | Male | Female |
| Agriculture, Fishing & Hunting | 12 (100.0%) | 0 (0.0%) |
| Mining, Quarrying, & Extraction | 306 (100.0%) | 0 (0.0%) |
| Construction | 213 (78.6%) | 58 (21.4%) |
| Manufacturing | 764 (77.9%) | 217 (22.1%) |
| Wholesale Trade | 79 (51.3%) | 75 (48.7%) |
| Retail Trade | 413 (60.9%) | 265 (39.1%) |
| Transportation & Warehousing | 199 (88.0%) | 27 (11.9%) |
| Utilities | 10 (100.0%) | 0 (0.0%) |
| Information | 39 (100.0%) | 0 (0.0%) |
| Finance & Insurance | 44 (15.5%) | 239 (84.5%) |
| Real Estate, Rental & Leasing | 86 (54.8%) | 71 (45.2%) |
| Professional & Scientific | 180 (54.2%) | 152 (45.8%) |
| Enterprise Management | 0 (0.0%) | 13 (100.0%) |
| Administrative & Support | 125 (60.4%) | 82 (39.6%) |
| Educational Services | 182 (18.5%) | 799 (81.5%) |
| Health Care & Social Assistance | 405 (26.7%) | 1,111 (73.3%) |
| Arts, Entertainment & Recreation | 35 (55.6%) | 28 (44.4%) |
| Accommodation & Food Services | 257 (40.5%) | 377 (59.5%) |
| Public Administration | 291 (58.7%) | 205 (41.3%) |
| Total | 3,772 (49.2%) | 3,890 (50.8%) |
Education in Madisonville
School Enrollment in Madisonville
The most common levels of schooling among the 4,472 students in Madisonville are high school (1,240 | 27.7%), elementary school (989 | 22.1%), and middle school (923 | 20.6%).
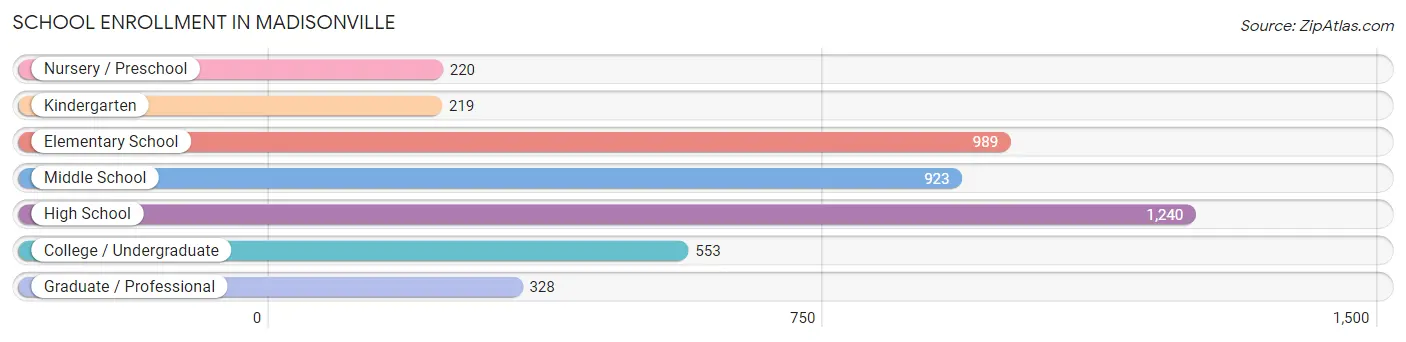
| School Level | # Students | % Students |
| Nursery / Preschool | 220 | 4.9% |
| Kindergarten | 219 | 4.9% |
| Elementary School | 989 | 22.1% |
| Middle School | 923 | 20.6% |
| High School | 1,240 | 27.7% |
| College / Undergraduate | 553 | 12.4% |
| Graduate / Professional | 328 | 7.3% |
| Total | 4,472 | 100.0% |
School Enrollment by Age by Funding Source in Madisonville
Out of a total of 4,472 students who are enrolled in schools in Madisonville, 434 (9.7%) attend a private institution, while the remaining 4,038 (90.3%) are enrolled in public schools. The age group of 3 to 4 year olds has the highest likelihood of being enrolled in private schools, with 58 (33.9% in the age bracket) enrolled. Conversely, the age group of 35 years and over has the lowest likelihood of being enrolled in a private school, with 298 (100.0% in the age bracket) attending a public institution.
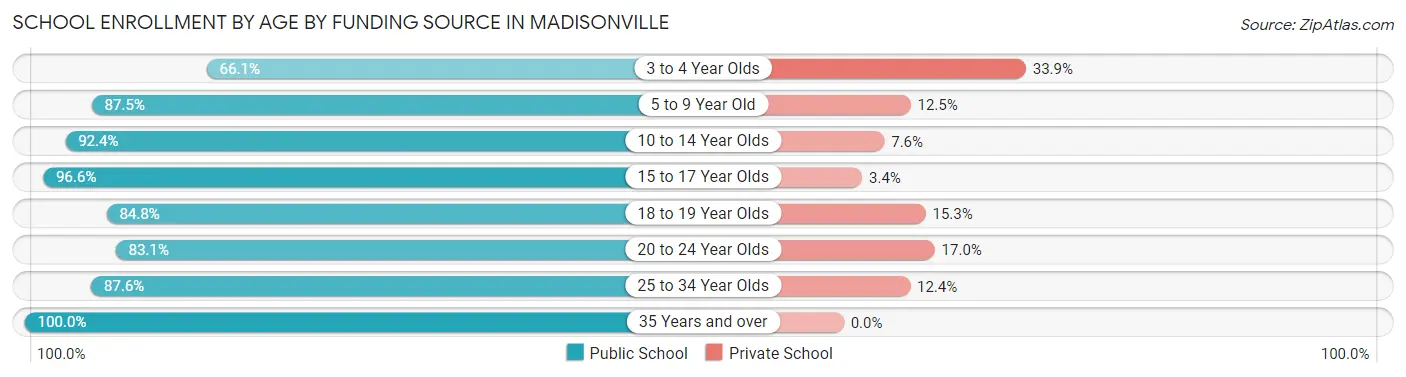
| Age Bracket | Public School | Private School |
| 3 to 4 Year Olds | 113 (66.1%) | 58 (33.9%) |
| 5 to 9 Year Old | 1,033 (87.5%) | 147 (12.5%) |
| 10 to 14 Year Olds | 1,111 (92.4%) | 91 (7.6%) |
| 15 to 17 Year Olds | 844 (96.6%) | 30 (3.4%) |
| 18 to 19 Year Olds | 300 (84.8%) | 54 (15.2%) |
| 20 to 24 Year Olds | 98 (83.1%) | 20 (17.0%) |
| 25 to 34 Year Olds | 241 (87.6%) | 34 (12.4%) |
| 35 Years and over | 298 (100.0%) | 0 (0.0%) |
| Total | 4,038 (90.3%) | 434 (9.7%) |
Educational Attainment by Field of Study in Madisonville
Education (697 | 24.5%), business (416 | 14.6%), science & technology (391 | 13.8%), liberal arts & history (252 | 8.9%), and literature & languages (213 | 7.5%) are the most common fields of study among 2,841 individuals in Madisonville who have obtained a bachelor's degree or higher.
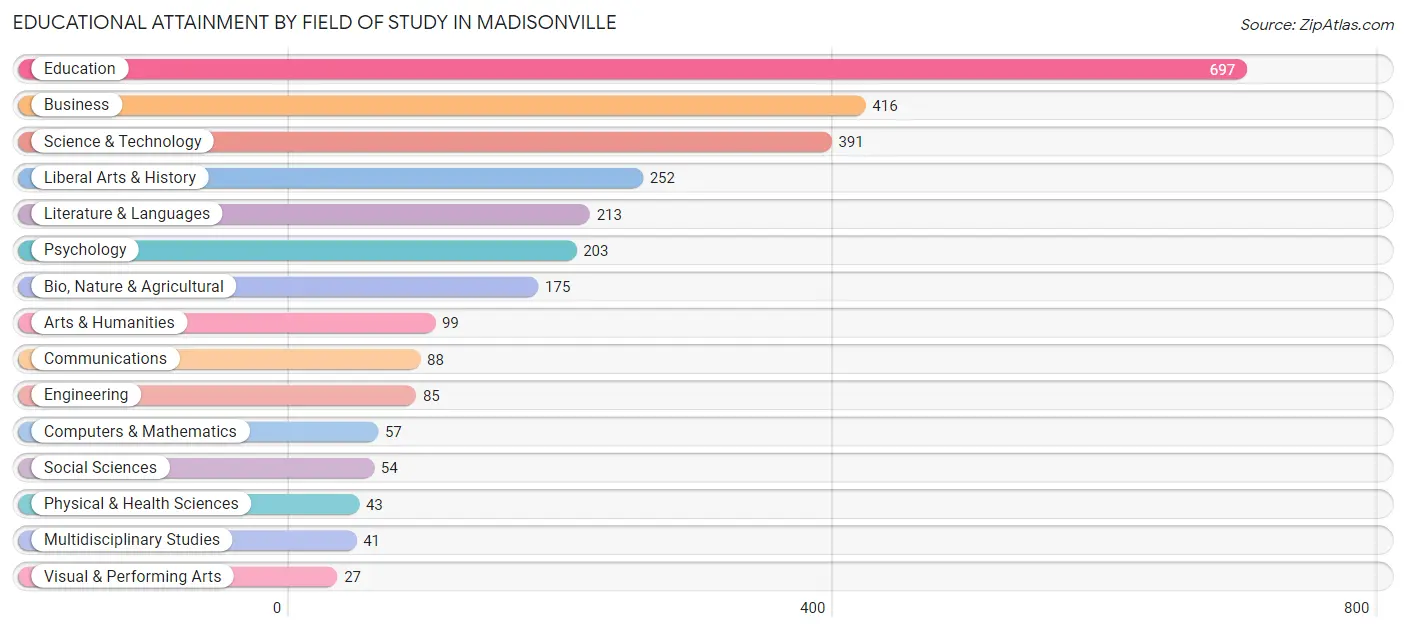
| Field of Study | # Graduates | % Graduates |
| Computers & Mathematics | 57 | 2.0% |
| Bio, Nature & Agricultural | 175 | 6.2% |
| Physical & Health Sciences | 43 | 1.5% |
| Psychology | 203 | 7.1% |
| Social Sciences | 54 | 1.9% |
| Engineering | 85 | 3.0% |
| Multidisciplinary Studies | 41 | 1.4% |
| Science & Technology | 391 | 13.8% |
| Business | 416 | 14.6% |
| Education | 697 | 24.5% |
| Literature & Languages | 213 | 7.5% |
| Liberal Arts & History | 252 | 8.9% |
| Visual & Performing Arts | 27 | 0.9% |
| Communications | 88 | 3.1% |
| Arts & Humanities | 99 | 3.5% |
| Total | 2,841 | 100.0% |
Transportation & Commute in Madisonville
Vehicle Availability by Sex in Madisonville
The most prevalent vehicle ownership categories in Madisonville are males with 2 vehicles (1,906, accounting for 51.2%) and females with 2 vehicles (1,968, making up 50.3%).
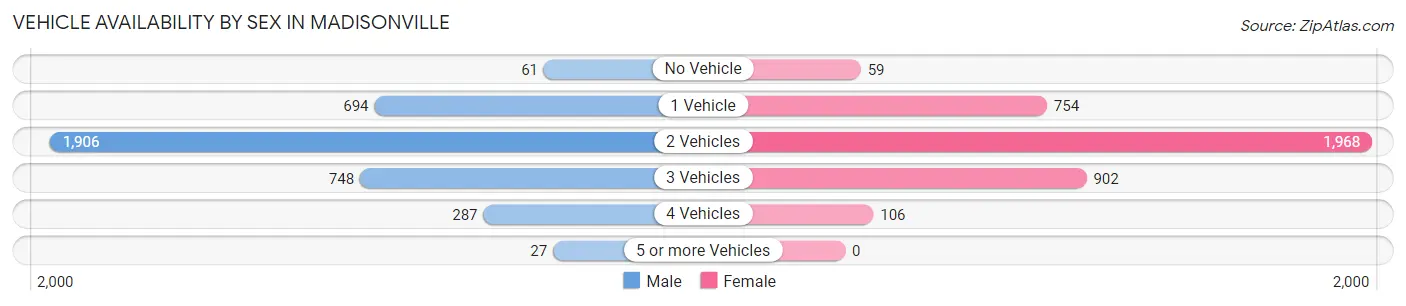
| Vehicles Available | Male | Female |
| No Vehicle | 61 (1.6%) | 59 (1.6%) |
| 1 Vehicle | 694 (18.6%) | 754 (19.9%) |
| 2 Vehicles | 1,906 (51.2%) | 1,968 (51.9%) |
| 3 Vehicles | 748 (20.1%) | 902 (23.8%) |
| 4 Vehicles | 287 (7.7%) | 106 (2.8%) |
| 5 or more Vehicles | 27 (0.7%) | 0 (0.0%) |
| Total | 3,723 (100.0%) | 3,789 (100.0%) |
Commute Time in Madisonville
The most frequently occuring commute durations in Madisonville are 10 to 14 minutes (2,124 commuters, 29.5%), 5 to 9 minutes (1,729 commuters, 24.0%), and 15 to 19 minutes (938 commuters, 13.1%).
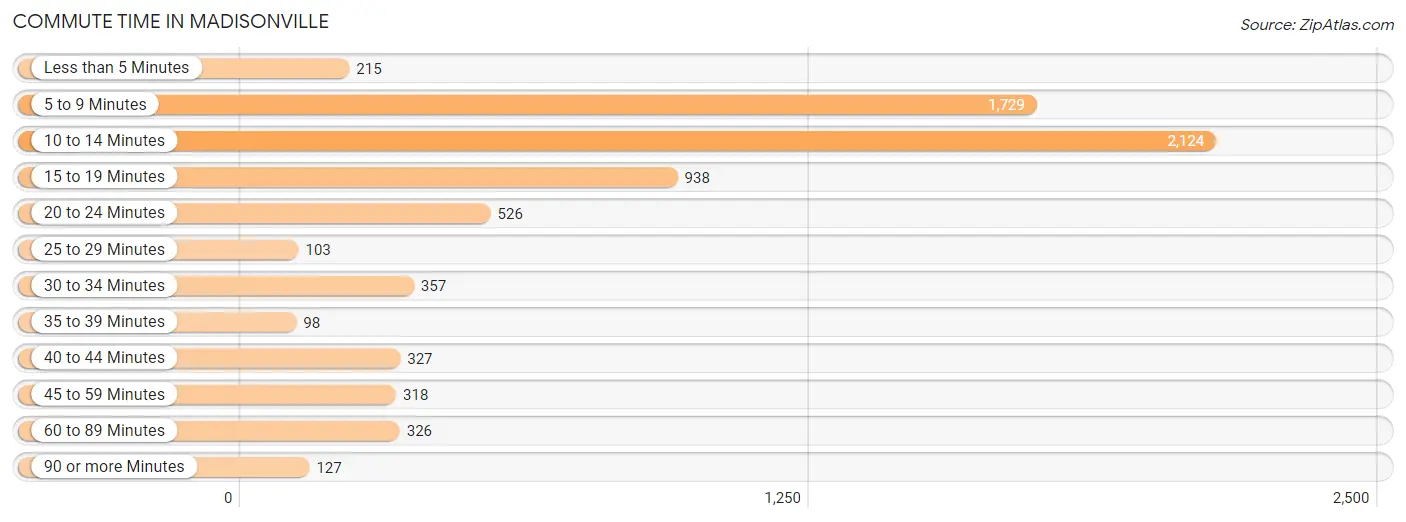
| Commute Time | # Commuters | % Commuters |
| Less than 5 Minutes | 215 | 3.0% |
| 5 to 9 Minutes | 1,729 | 24.0% |
| 10 to 14 Minutes | 2,124 | 29.5% |
| 15 to 19 Minutes | 938 | 13.1% |
| 20 to 24 Minutes | 526 | 7.3% |
| 25 to 29 Minutes | 103 | 1.4% |
| 30 to 34 Minutes | 357 | 5.0% |
| 35 to 39 Minutes | 98 | 1.4% |
| 40 to 44 Minutes | 327 | 4.5% |
| 45 to 59 Minutes | 318 | 4.4% |
| 60 to 89 Minutes | 326 | 4.5% |
| 90 or more Minutes | 127 | 1.8% |
Commute Time by Sex in Madisonville
The most common commute times in Madisonville are 10 to 14 minutes (1,013 commuters, 28.3%) for males and 10 to 14 minutes (1,111 commuters, 30.8%) for females.
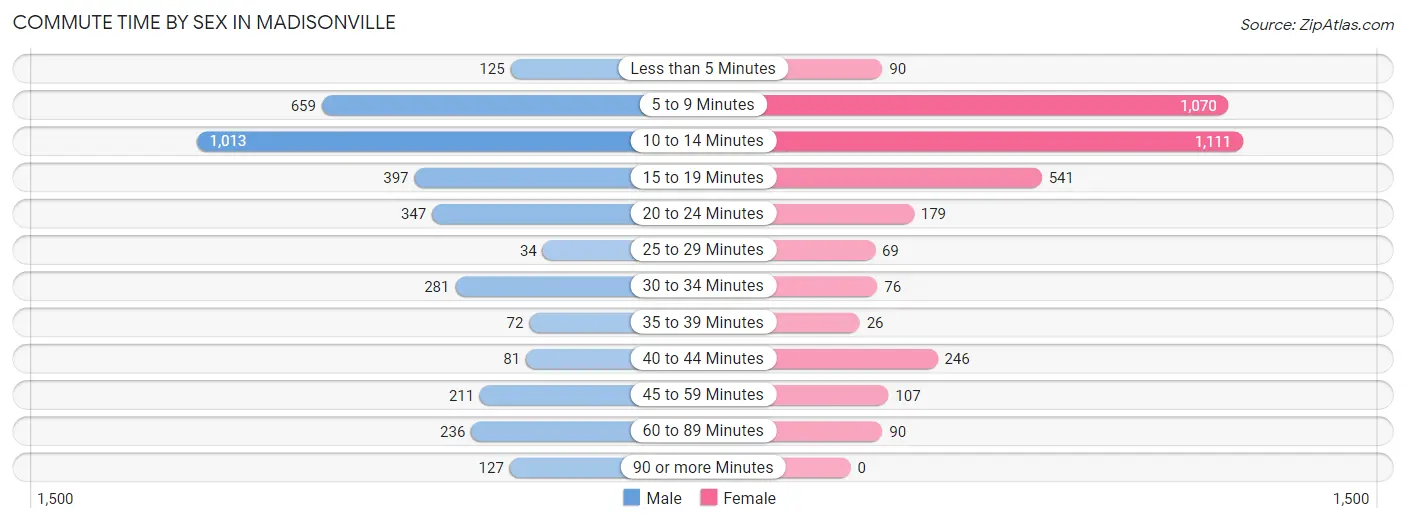
| Commute Time | Male | Female |
| Less than 5 Minutes | 125 (3.5%) | 90 (2.5%) |
| 5 to 9 Minutes | 659 (18.4%) | 1,070 (29.7%) |
| 10 to 14 Minutes | 1,013 (28.3%) | 1,111 (30.8%) |
| 15 to 19 Minutes | 397 (11.1%) | 541 (15.0%) |
| 20 to 24 Minutes | 347 (9.7%) | 179 (5.0%) |
| 25 to 29 Minutes | 34 (0.9%) | 69 (1.9%) |
| 30 to 34 Minutes | 281 (7.8%) | 76 (2.1%) |
| 35 to 39 Minutes | 72 (2.0%) | 26 (0.7%) |
| 40 to 44 Minutes | 81 (2.3%) | 246 (6.8%) |
| 45 to 59 Minutes | 211 (5.9%) | 107 (3.0%) |
| 60 to 89 Minutes | 236 (6.6%) | 90 (2.5%) |
| 90 or more Minutes | 127 (3.5%) | 0 (0.0%) |
Time of Departure to Work by Sex in Madisonville
The most frequent times of departure to work in Madisonville are 6:00 AM to 6:29 AM (594, 16.6%) for males and 7:30 AM to 7:59 AM (599, 16.6%) for females.
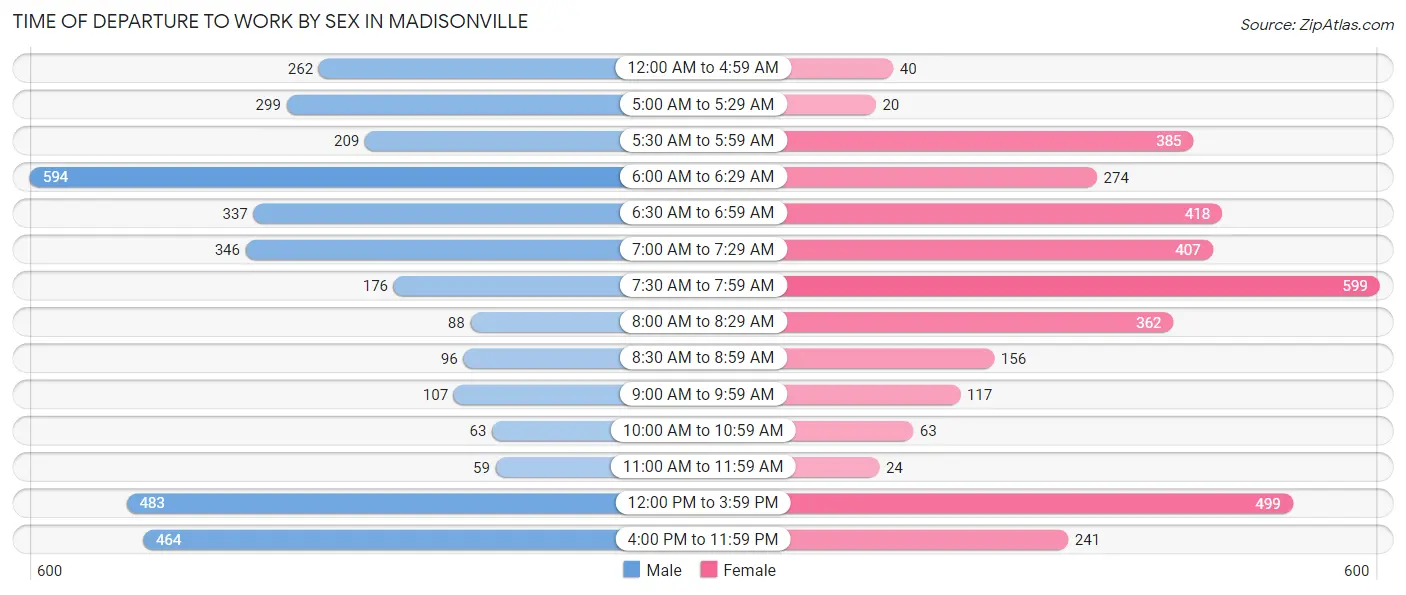
| Time of Departure | Male | Female |
| 12:00 AM to 4:59 AM | 262 (7.3%) | 40 (1.1%) |
| 5:00 AM to 5:29 AM | 299 (8.3%) | 20 (0.5%) |
| 5:30 AM to 5:59 AM | 209 (5.8%) | 385 (10.7%) |
| 6:00 AM to 6:29 AM | 594 (16.6%) | 274 (7.6%) |
| 6:30 AM to 6:59 AM | 337 (9.4%) | 418 (11.6%) |
| 7:00 AM to 7:29 AM | 346 (9.7%) | 407 (11.3%) |
| 7:30 AM to 7:59 AM | 176 (4.9%) | 599 (16.6%) |
| 8:00 AM to 8:29 AM | 88 (2.5%) | 362 (10.0%) |
| 8:30 AM to 8:59 AM | 96 (2.7%) | 156 (4.3%) |
| 9:00 AM to 9:59 AM | 107 (3.0%) | 117 (3.3%) |
| 10:00 AM to 10:59 AM | 63 (1.8%) | 63 (1.8%) |
| 11:00 AM to 11:59 AM | 59 (1.7%) | 24 (0.7%) |
| 12:00 PM to 3:59 PM | 483 (13.5%) | 499 (13.8%) |
| 4:00 PM to 11:59 PM | 464 (13.0%) | 241 (6.7%) |
| Total | 3,583 (100.0%) | 3,605 (100.0%) |
Housing Occupancy in Madisonville
Occupancy by Ownership in Madisonville
Of the total 8,010 dwellings in Madisonville, owner-occupied units account for 4,870 (60.8%), while renter-occupied units make up 3,140 (39.2%).
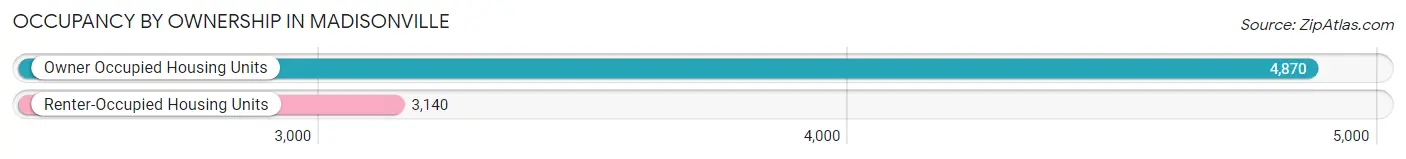
| Occupancy | # Housing Units | % Housing Units |
| Owner Occupied Housing Units | 4,870 | 60.8% |
| Renter-Occupied Housing Units | 3,140 | 39.2% |
| Total Occupied Housing Units | 8,010 | 100.0% |
Occupancy by Household Size in Madisonville
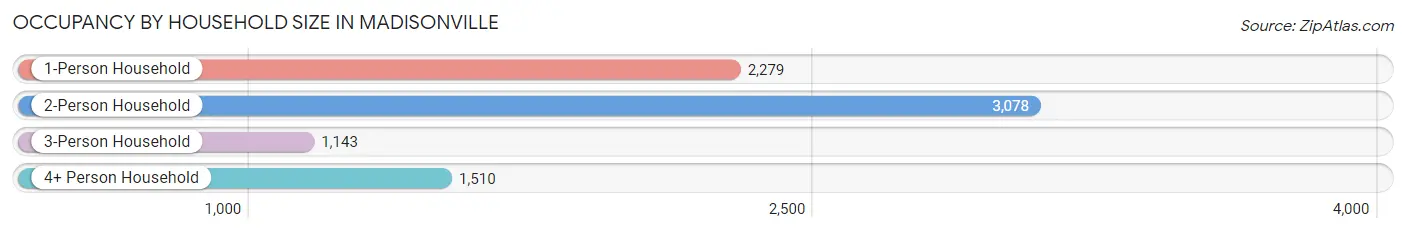
| Household Size | # Housing Units | % Housing Units |
| 1-Person Household | 2,279 | 28.4% |
| 2-Person Household | 3,078 | 38.4% |
| 3-Person Household | 1,143 | 14.3% |
| 4+ Person Household | 1,510 | 18.9% |
| Total Housing Units | 8,010 | 100.0% |
Occupancy by Ownership by Household Size in Madisonville
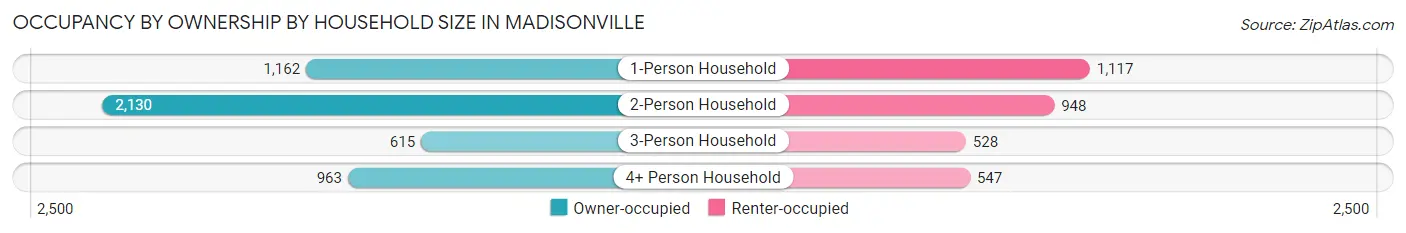
| Household Size | Owner-occupied | Renter-occupied |
| 1-Person Household | 1,162 (51.0%) | 1,117 (49.0%) |
| 2-Person Household | 2,130 (69.2%) | 948 (30.8%) |
| 3-Person Household | 615 (53.8%) | 528 (46.2%) |
| 4+ Person Household | 963 (63.8%) | 547 (36.2%) |
| Total Housing Units | 4,870 (60.8%) | 3,140 (39.2%) |
Occupancy by Educational Attainment in Madisonville
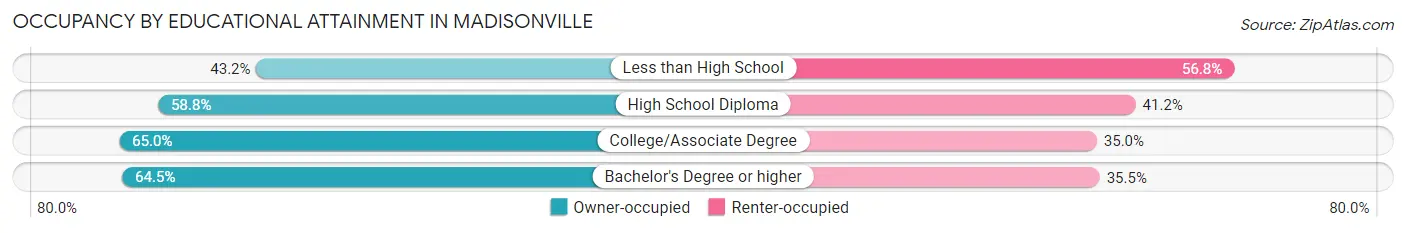
| Household Size | Owner-occupied | Renter-occupied |
| Less than High School | 310 (43.2%) | 407 (56.8%) |
| High School Diploma | 1,651 (58.8%) | 1,155 (41.2%) |
| College/Associate Degree | 1,855 (65.0%) | 999 (35.0%) |
| Bachelor's Degree or higher | 1,054 (64.5%) | 579 (35.5%) |
Occupancy by Age of Householder in Madisonville
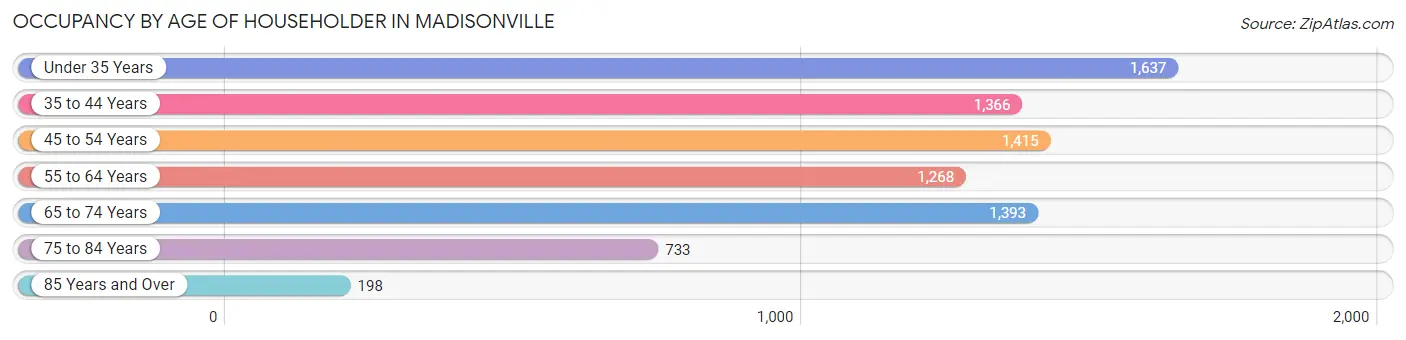
| Age Bracket | # Households | % Households |
| Under 35 Years | 1,637 | 20.4% |
| 35 to 44 Years | 1,366 | 17.1% |
| 45 to 54 Years | 1,415 | 17.7% |
| 55 to 64 Years | 1,268 | 15.8% |
| 65 to 74 Years | 1,393 | 17.4% |
| 75 to 84 Years | 733 | 9.1% |
| 85 Years and Over | 198 | 2.5% |
| Total | 8,010 | 100.0% |
Housing Finances in Madisonville
Median Income by Occupancy in Madisonville
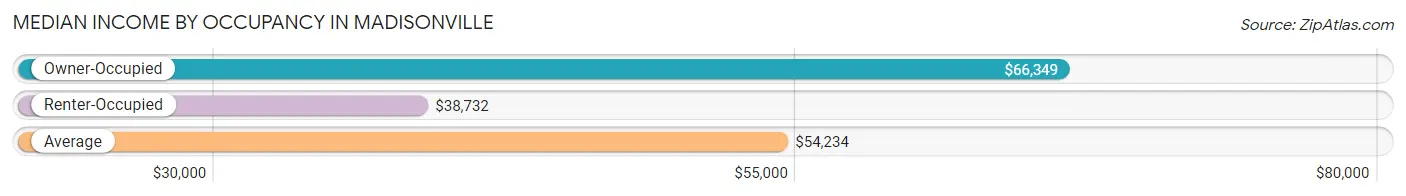
| Occupancy Type | # Households | Median Income |
| Owner-Occupied | 4,870 (60.8%) | $66,349 |
| Renter-Occupied | 3,140 (39.2%) | $38,732 |
| Average | 8,010 (100.0%) | $54,234 |
Occupancy by Householder Income Bracket in Madisonville
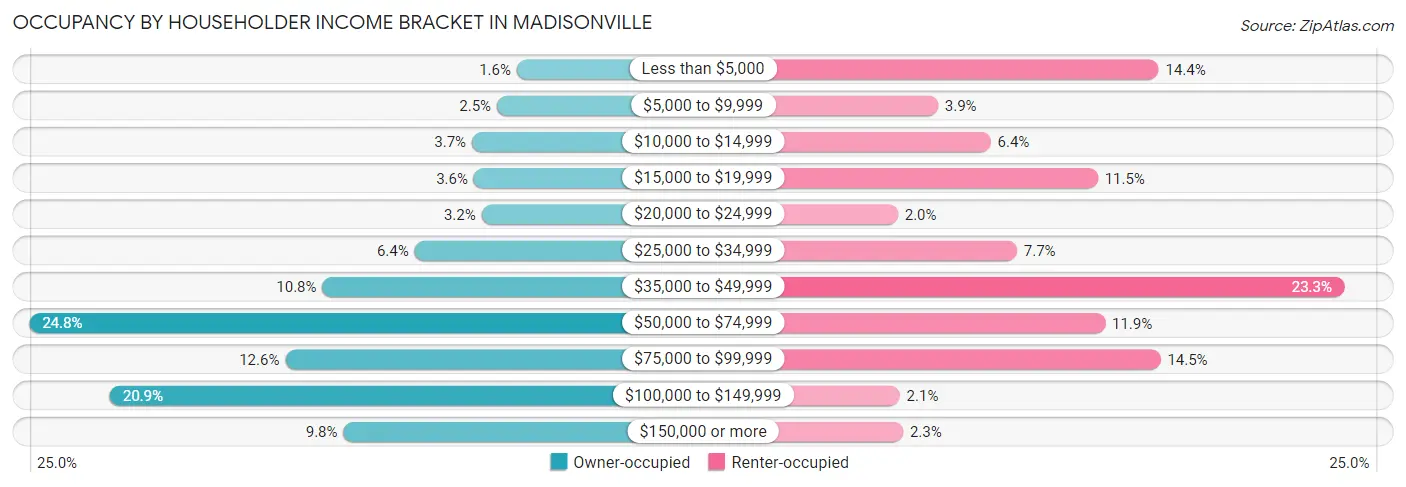
| Income Bracket | Owner-occupied | Renter-occupied |
| Less than $5,000 | 76 (1.6%) | 453 (14.4%) |
| $5,000 to $9,999 | 122 (2.5%) | 123 (3.9%) |
| $10,000 to $14,999 | 180 (3.7%) | 202 (6.4%) |
| $15,000 to $19,999 | 176 (3.6%) | 362 (11.5%) |
| $20,000 to $24,999 | 158 (3.2%) | 63 (2.0%) |
| $25,000 to $34,999 | 313 (6.4%) | 241 (7.7%) |
| $35,000 to $49,999 | 527 (10.8%) | 730 (23.3%) |
| $50,000 to $74,999 | 1,207 (24.8%) | 373 (11.9%) |
| $75,000 to $99,999 | 613 (12.6%) | 456 (14.5%) |
| $100,000 to $149,999 | 1,020 (20.9%) | 66 (2.1%) |
| $150,000 or more | 478 (9.8%) | 71 (2.3%) |
| Total | 4,870 (100.0%) | 3,140 (100.0%) |
Monthly Housing Cost Tiers in Madisonville
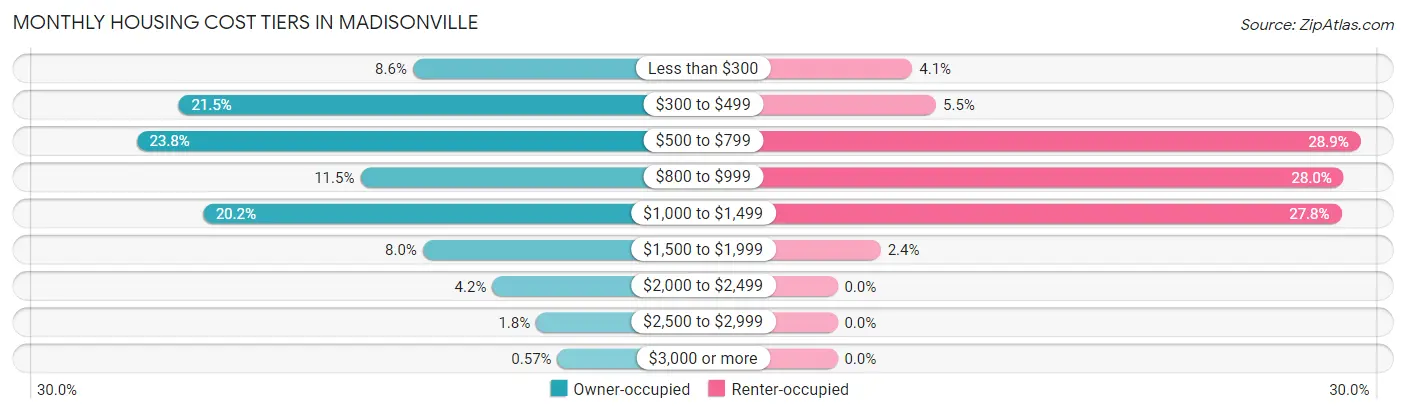
| Monthly Cost | Owner-occupied | Renter-occupied |
| Less than $300 | 417 (8.6%) | 130 (4.1%) |
| $300 to $499 | 1,047 (21.5%) | 171 (5.4%) |
| $500 to $799 | 1,160 (23.8%) | 907 (28.9%) |
| $800 to $999 | 558 (11.5%) | 878 (28.0%) |
| $1,000 to $1,499 | 982 (20.2%) | 874 (27.8%) |
| $1,500 to $1,999 | 390 (8.0%) | 75 (2.4%) |
| $2,000 to $2,499 | 203 (4.2%) | 0 (0.0%) |
| $2,500 to $2,999 | 85 (1.8%) | 0 (0.0%) |
| $3,000 or more | 28 (0.6%) | 0 (0.0%) |
| Total | 4,870 (100.0%) | 3,140 (100.0%) |
Physical Housing Characteristics in Madisonville
Housing Structures in Madisonville
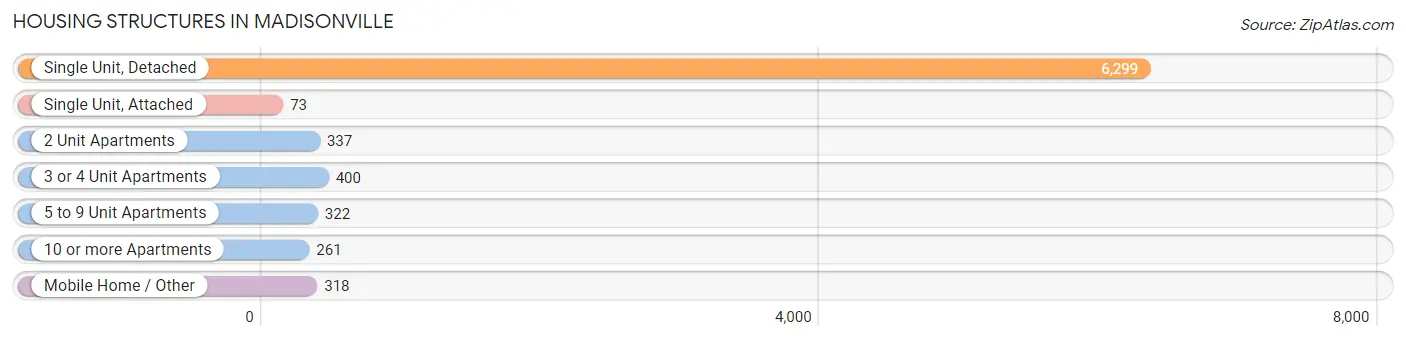
| Structure Type | # Housing Units | % Housing Units |
| Single Unit, Detached | 6,299 | 78.6% |
| Single Unit, Attached | 73 | 0.9% |
| 2 Unit Apartments | 337 | 4.2% |
| 3 or 4 Unit Apartments | 400 | 5.0% |
| 5 to 9 Unit Apartments | 322 | 4.0% |
| 10 or more Apartments | 261 | 3.3% |
| Mobile Home / Other | 318 | 4.0% |
| Total | 8,010 | 100.0% |
Housing Structures by Occupancy in Madisonville
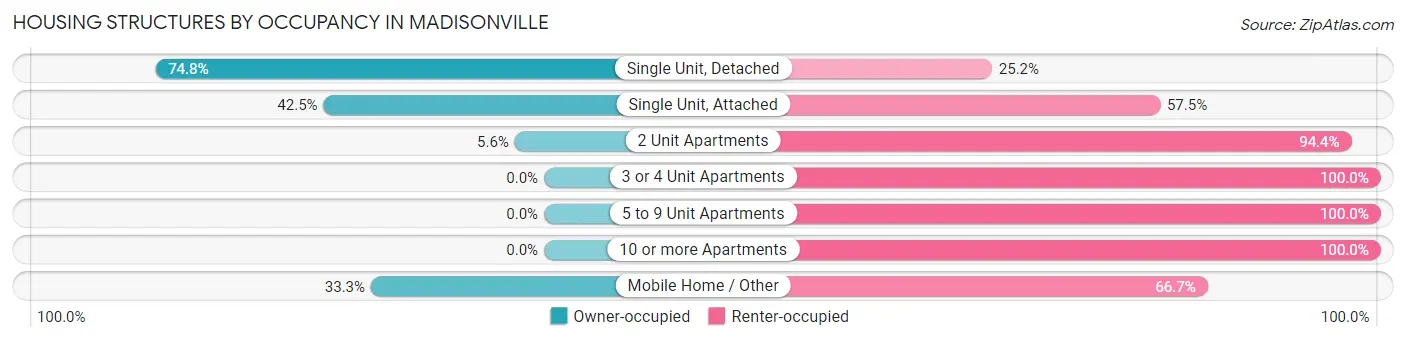
| Structure Type | Owner-occupied | Renter-occupied |
| Single Unit, Detached | 4,714 (74.8%) | 1,585 (25.2%) |
| Single Unit, Attached | 31 (42.5%) | 42 (57.5%) |
| 2 Unit Apartments | 19 (5.6%) | 318 (94.4%) |
| 3 or 4 Unit Apartments | 0 (0.0%) | 400 (100.0%) |
| 5 to 9 Unit Apartments | 0 (0.0%) | 322 (100.0%) |
| 10 or more Apartments | 0 (0.0%) | 261 (100.0%) |
| Mobile Home / Other | 106 (33.3%) | 212 (66.7%) |
| Total | 4,870 (60.8%) | 3,140 (39.2%) |
Housing Structures by Number of Rooms in Madisonville
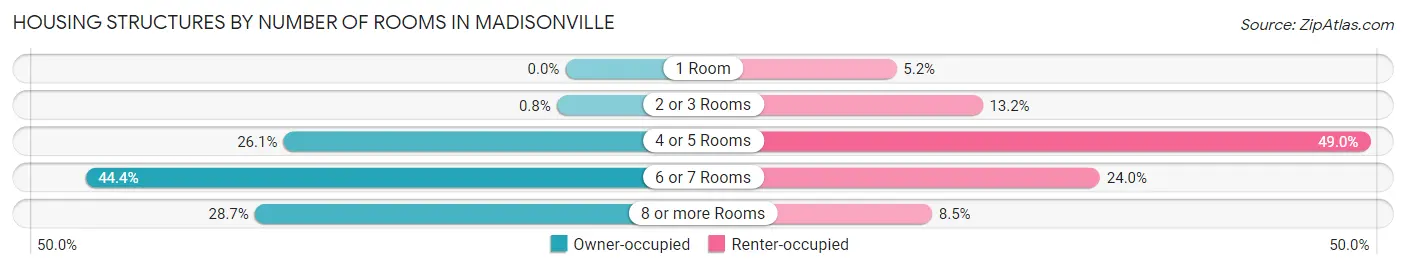
| Number of Rooms | Owner-occupied | Renter-occupied |
| 1 Room | 0 (0.0%) | 164 (5.2%) |
| 2 or 3 Rooms | 39 (0.8%) | 414 (13.2%) |
| 4 or 5 Rooms | 1,270 (26.1%) | 1,540 (49.0%) |
| 6 or 7 Rooms | 2,162 (44.4%) | 755 (24.0%) |
| 8 or more Rooms | 1,399 (28.7%) | 267 (8.5%) |
| Total | 4,870 (100.0%) | 3,140 (100.0%) |
Housing Structure by Heating Type in Madisonville
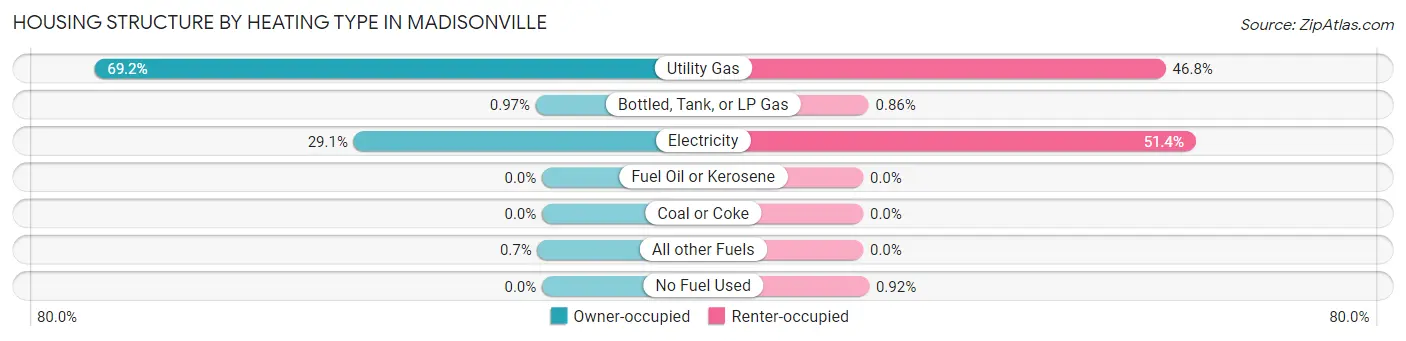
| Heating Type | Owner-occupied | Renter-occupied |
| Utility Gas | 3,371 (69.2%) | 1,469 (46.8%) |
| Bottled, Tank, or LP Gas | 47 (1.0%) | 27 (0.9%) |
| Electricity | 1,418 (29.1%) | 1,615 (51.4%) |
| Fuel Oil or Kerosene | 0 (0.0%) | 0 (0.0%) |
| Coal or Coke | 0 (0.0%) | 0 (0.0%) |
| All other Fuels | 34 (0.7%) | 0 (0.0%) |
| No Fuel Used | 0 (0.0%) | 29 (0.9%) |
| Total | 4,870 (100.0%) | 3,140 (100.0%) |
Household Vehicle Usage in Madisonville
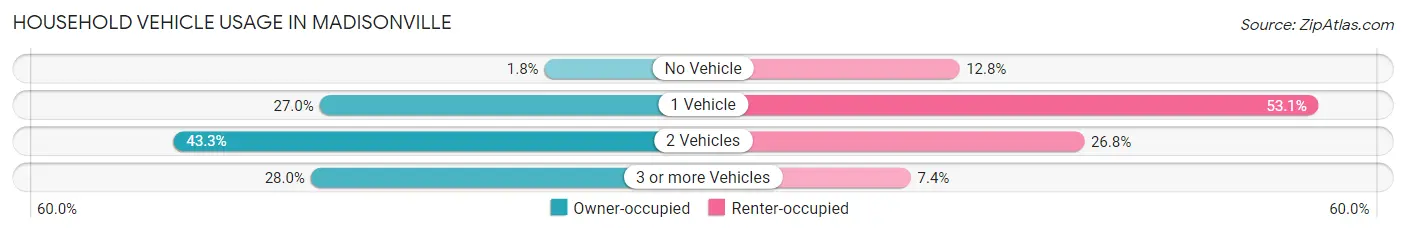
| Vehicles per Household | Owner-occupied | Renter-occupied |
| No Vehicle | 86 (1.8%) | 402 (12.8%) |
| 1 Vehicle | 1,313 (27.0%) | 1,666 (53.1%) |
| 2 Vehicles | 2,110 (43.3%) | 841 (26.8%) |
| 3 or more Vehicles | 1,361 (28.0%) | 231 (7.4%) |
| Total | 4,870 (100.0%) | 3,140 (100.0%) |
Real Estate & Mortgages in Madisonville
Real Estate and Mortgage Overview in Madisonville
| Characteristic | Without Mortgage | With Mortgage |
| Housing Units | 2,154 | 2,716 |
| Median Property Value | $138,600 | $147,200 |
| Median Household Income | $54,500 | $290 |
| Monthly Housing Costs | $434 | $28 |
| Real Estate Taxes | $950 | $209 |
Property Value by Mortgage Status in Madisonville
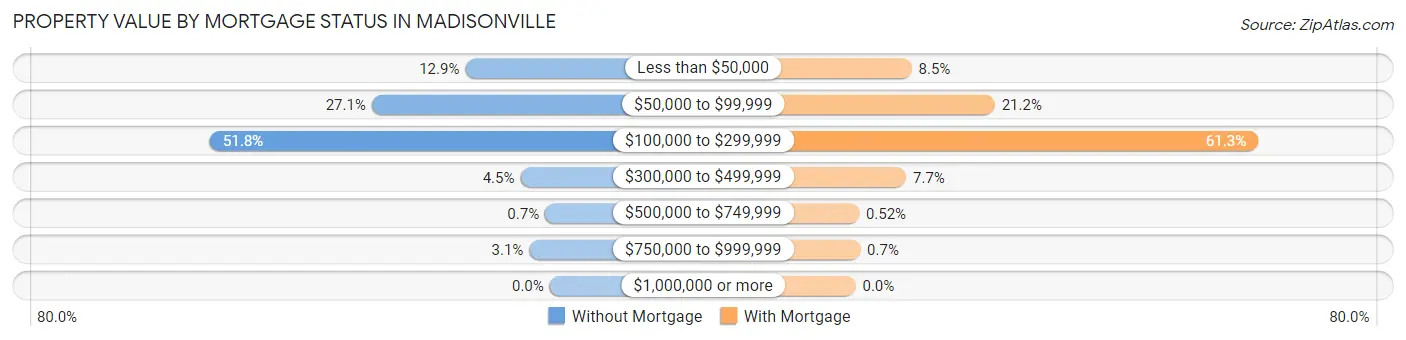
| Property Value | Without Mortgage | With Mortgage |
| Less than $50,000 | 277 (12.9%) | 232 (8.5%) |
| $50,000 to $99,999 | 584 (27.1%) | 576 (21.2%) |
| $100,000 to $299,999 | 1,115 (51.8%) | 1,666 (61.3%) |
| $300,000 to $499,999 | 96 (4.5%) | 209 (7.7%) |
| $500,000 to $749,999 | 15 (0.7%) | 14 (0.5%) |
| $750,000 to $999,999 | 67 (3.1%) | 19 (0.7%) |
| $1,000,000 or more | 0 (0.0%) | 0 (0.0%) |
| Total | 2,154 (100.0%) | 2,716 (100.0%) |
Household Income by Mortgage Status in Madisonville
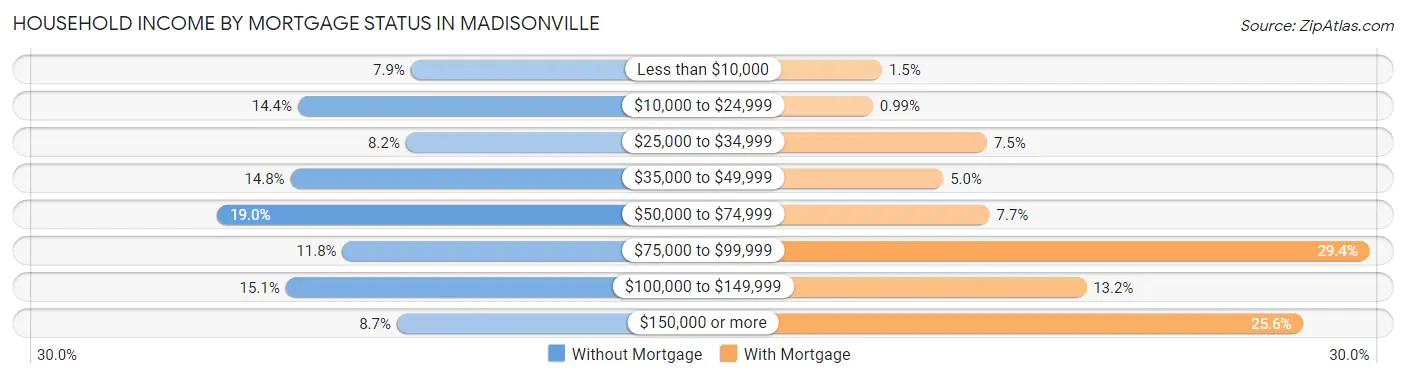
| Household Income | Without Mortgage | With Mortgage |
| Less than $10,000 | 171 (7.9%) | 41 (1.5%) |
| $10,000 to $24,999 | 310 (14.4%) | 27 (1.0%) |
| $25,000 to $34,999 | 177 (8.2%) | 204 (7.5%) |
| $35,000 to $49,999 | 319 (14.8%) | 136 (5.0%) |
| $50,000 to $74,999 | 409 (19.0%) | 208 (7.7%) |
| $75,000 to $99,999 | 255 (11.8%) | 798 (29.4%) |
| $100,000 to $149,999 | 325 (15.1%) | 358 (13.2%) |
| $150,000 or more | 188 (8.7%) | 695 (25.6%) |
| Total | 2,154 (100.0%) | 2,716 (100.0%) |
Property Value to Household Income Ratio in Madisonville
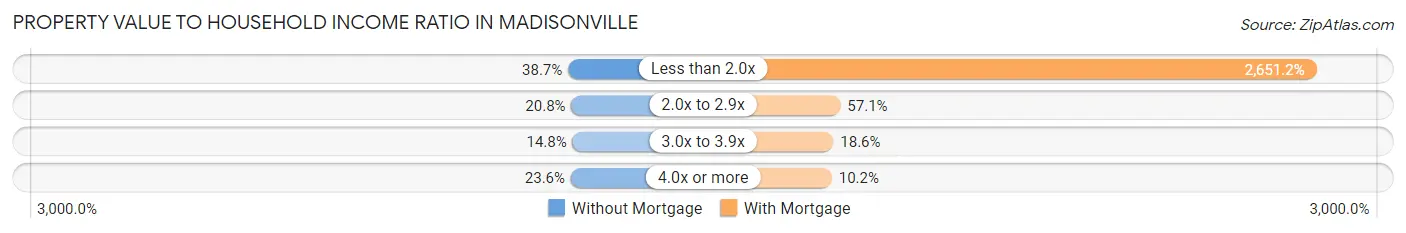
| Value-to-Income Ratio | Without Mortgage | With Mortgage |
| Less than 2.0x | 834 (38.7%) | 72,007 (2,651.2%) |
| 2.0x to 2.9x | 449 (20.8%) | 1,551 (57.1%) |
| 3.0x to 3.9x | 318 (14.8%) | 506 (18.6%) |
| 4.0x or more | 509 (23.6%) | 276 (10.2%) |
| Total | 2,154 (100.0%) | 2,716 (100.0%) |
Real Estate Taxes by Mortgage Status in Madisonville
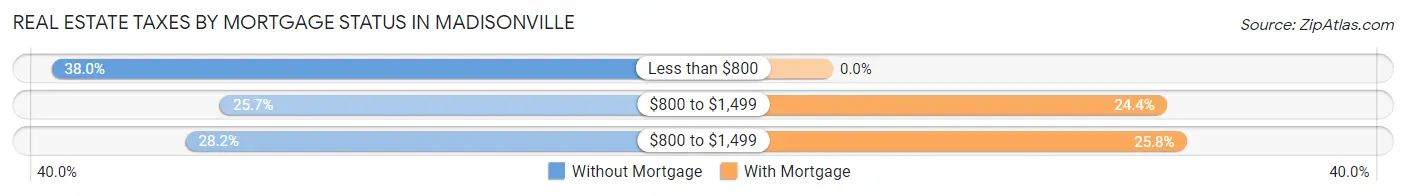
| Property Taxes | Without Mortgage | With Mortgage |
| Less than $800 | 819 (38.0%) | 0 (0.0%) |
| $800 to $1,499 | 554 (25.7%) | 662 (24.4%) |
| $800 to $1,499 | 608 (28.2%) | 701 (25.8%) |
| Total | 2,154 (100.0%) | 2,716 (100.0%) |
Health & Disability in Madisonville
Health Insurance Coverage by Age in Madisonville
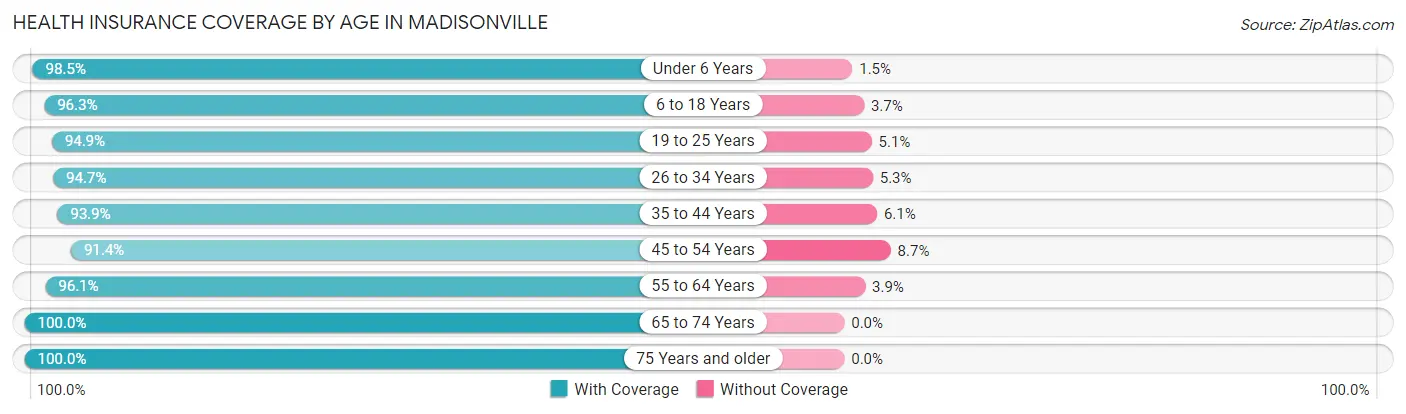
| Age Bracket | With Coverage | Without Coverage |
| Under 6 Years | 1,516 (98.5%) | 23 (1.5%) |
| 6 to 18 Years | 3,332 (96.3%) | 127 (3.7%) |
| 19 to 25 Years | 1,752 (94.9%) | 94 (5.1%) |
| 26 to 34 Years | 1,942 (94.7%) | 109 (5.3%) |
| 35 to 44 Years | 2,015 (93.9%) | 131 (6.1%) |
| 45 to 54 Years | 2,122 (91.3%) | 201 (8.6%) |
| 55 to 64 Years | 2,004 (96.1%) | 81 (3.9%) |
| 65 to 74 Years | 1,980 (100.0%) | 0 (0.0%) |
| 75 Years and older | 1,289 (100.0%) | 0 (0.0%) |
| Total | 17,952 (95.9%) | 766 (4.1%) |
Health Insurance Coverage by Citizenship Status in Madisonville
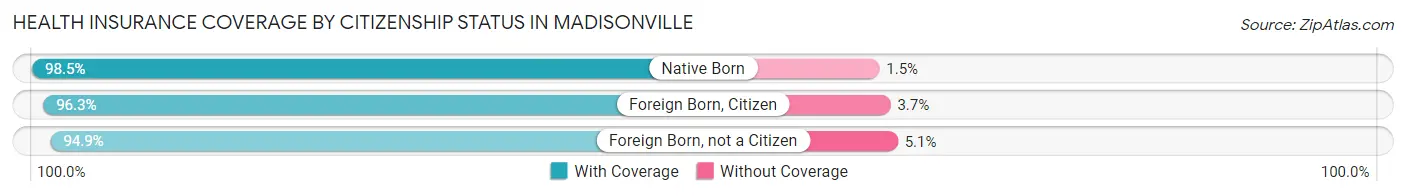
| Citizenship Status | With Coverage | Without Coverage |
| Native Born | 1,516 (98.5%) | 23 (1.5%) |
| Foreign Born, Citizen | 3,332 (96.3%) | 127 (3.7%) |
| Foreign Born, not a Citizen | 1,752 (94.9%) | 94 (5.1%) |
Health Insurance Coverage by Household Income in Madisonville
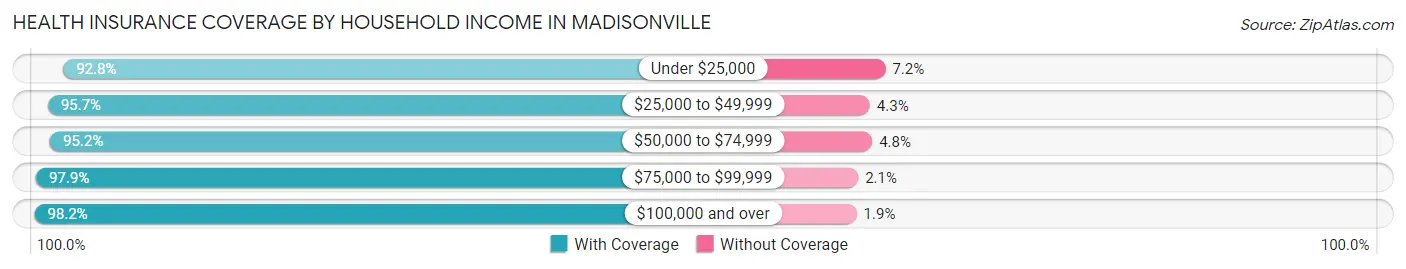
| Household Income | With Coverage | Without Coverage |
| Under $25,000 | 3,457 (92.8%) | 270 (7.2%) |
| $25,000 to $49,999 | 3,621 (95.7%) | 164 (4.3%) |
| $50,000 to $74,999 | 3,861 (95.2%) | 193 (4.8%) |
| $75,000 to $99,999 | 2,237 (97.9%) | 49 (2.1%) |
| $100,000 and over | 4,776 (98.2%) | 90 (1.8%) |
Public vs Private Health Insurance Coverage by Age in Madisonville
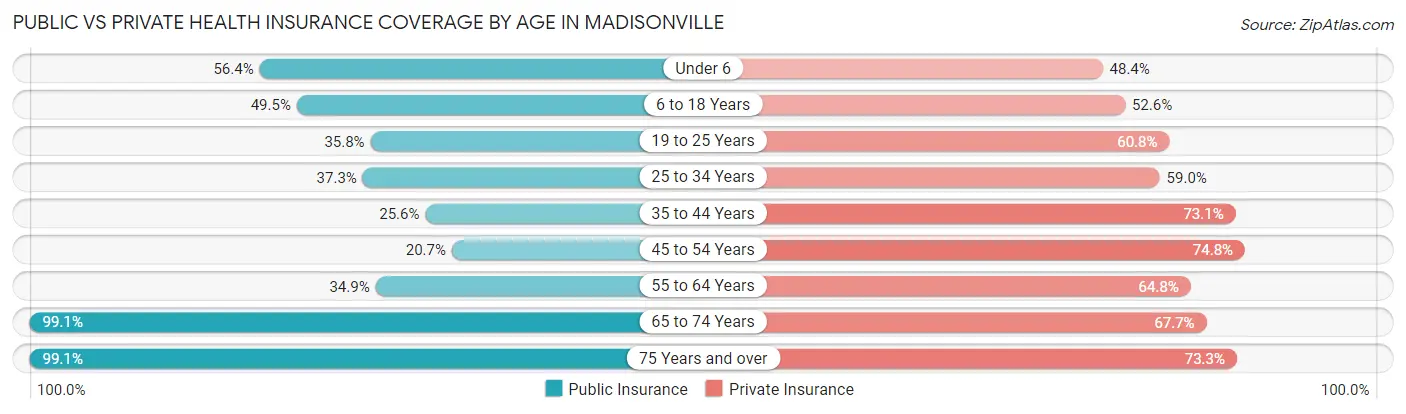
| Age Bracket | Public Insurance | Private Insurance |
| Under 6 | 868 (56.4%) | 745 (48.4%) |
| 6 to 18 Years | 1,712 (49.5%) | 1,818 (52.6%) |
| 19 to 25 Years | 661 (35.8%) | 1,122 (60.8%) |
| 25 to 34 Years | 764 (37.2%) | 1,210 (59.0%) |
| 35 to 44 Years | 550 (25.6%) | 1,568 (73.1%) |
| 45 to 54 Years | 481 (20.7%) | 1,738 (74.8%) |
| 55 to 64 Years | 727 (34.9%) | 1,350 (64.7%) |
| 65 to 74 Years | 1,962 (99.1%) | 1,340 (67.7%) |
| 75 Years and over | 1,277 (99.1%) | 945 (73.3%) |
| Total | 9,002 (48.1%) | 11,836 (63.2%) |
Disability Status by Sex by Age in Madisonville
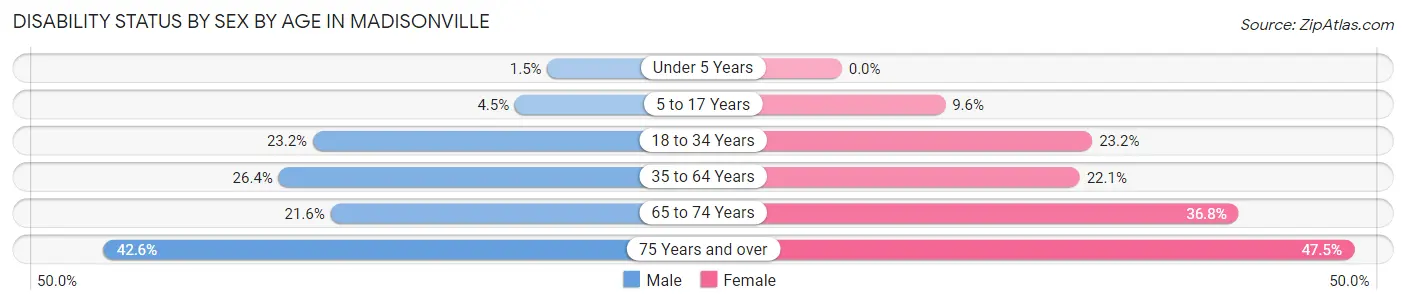
| Age Bracket | Male | Female |
| Under 5 Years | 9 (1.5%) | 0 (0.0%) |
| 5 to 17 Years | 84 (4.5%) | 152 (9.6%) |
| 18 to 34 Years | 451 (23.2%) | 504 (23.2%) |
| 35 to 64 Years | 826 (26.4%) | 757 (22.1%) |
| 65 to 74 Years | 172 (21.6%) | 436 (36.8%) |
| 75 Years and over | 258 (42.6%) | 325 (47.5%) |
Disability Class by Sex by Age in Madisonville
Disability Class: Hearing Difficulty
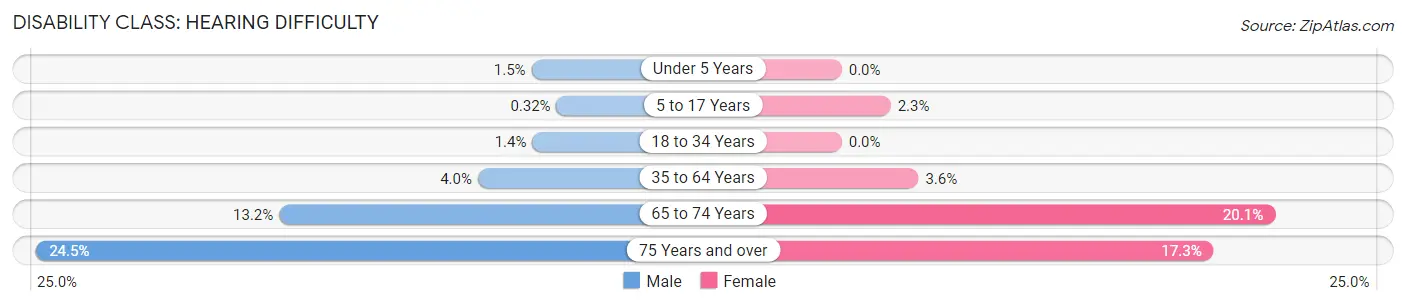
| Age Bracket | Male | Female |
| Under 5 Years | 9 (1.5%) | 0 (0.0%) |
| 5 to 17 Years | 6 (0.3%) | 36 (2.3%) |
| 18 to 34 Years | 28 (1.4%) | 0 (0.0%) |
| 35 to 64 Years | 124 (4.0%) | 122 (3.6%) |
| 65 to 74 Years | 105 (13.2%) | 238 (20.1%) |
| 75 Years and over | 148 (24.5%) | 118 (17.2%) |
Disability Class: Vision Difficulty
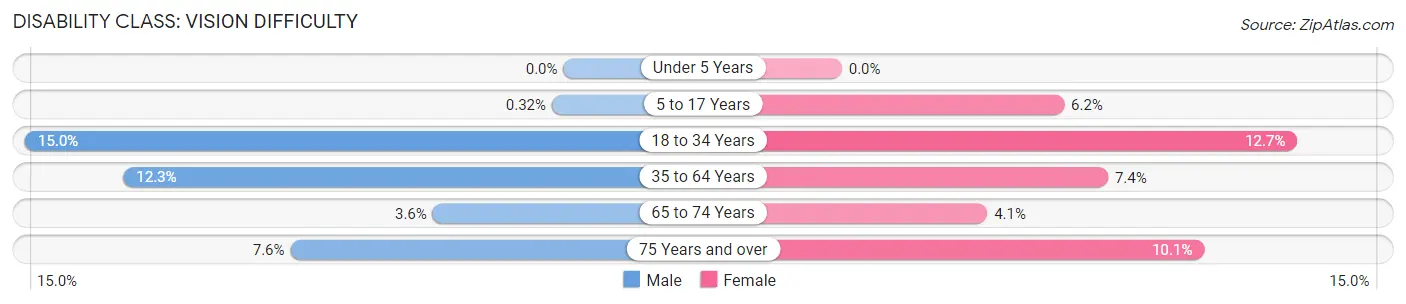
| Age Bracket | Male | Female |
| Under 5 Years | 0 (0.0%) | 0 (0.0%) |
| 5 to 17 Years | 6 (0.3%) | 98 (6.2%) |
| 18 to 34 Years | 291 (15.0%) | 275 (12.7%) |
| 35 to 64 Years | 383 (12.2%) | 254 (7.4%) |
| 65 to 74 Years | 29 (3.6%) | 48 (4.1%) |
| 75 Years and over | 46 (7.6%) | 69 (10.1%) |
Disability Class: Cognitive Difficulty
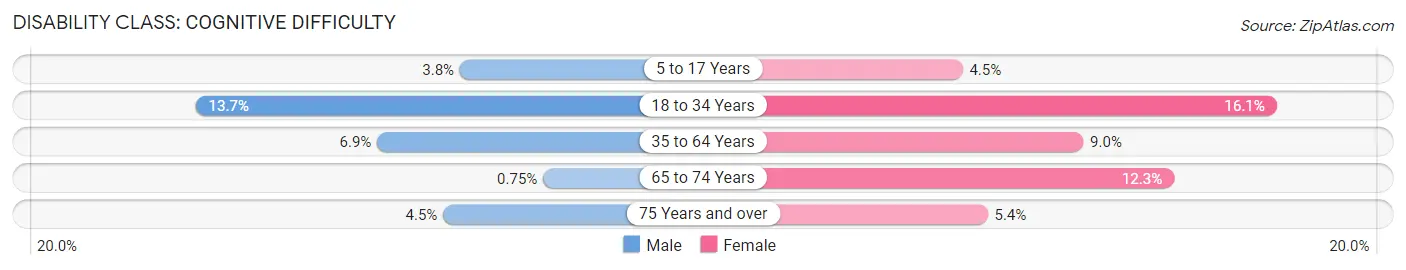
| Age Bracket | Male | Female |
| 5 to 17 Years | 72 (3.8%) | 71 (4.5%) |
| 18 to 34 Years | 265 (13.7%) | 350 (16.1%) |
| 35 to 64 Years | 216 (6.9%) | 307 (9.0%) |
| 65 to 74 Years | 6 (0.7%) | 146 (12.3%) |
| 75 Years and over | 27 (4.5%) | 37 (5.4%) |
Disability Class: Ambulatory Difficulty
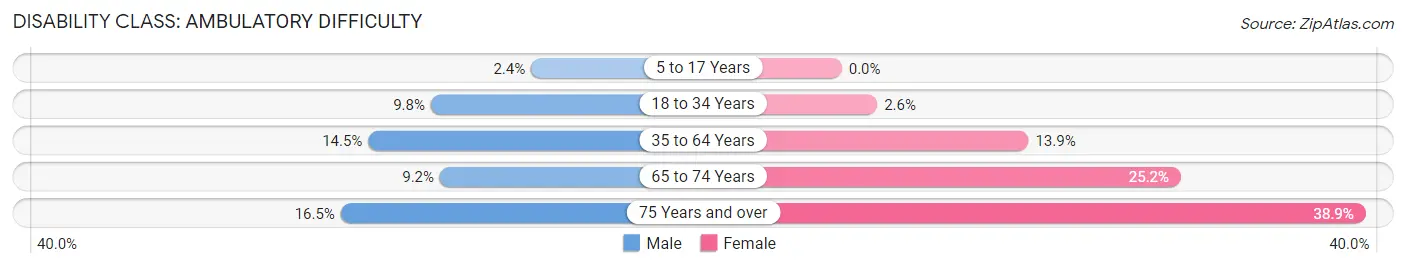
| Age Bracket | Male | Female |
| 5 to 17 Years | 45 (2.4%) | 0 (0.0%) |
| 18 to 34 Years | 191 (9.8%) | 57 (2.6%) |
| 35 to 64 Years | 453 (14.5%) | 475 (13.9%) |
| 65 to 74 Years | 73 (9.2%) | 298 (25.2%) |
| 75 Years and over | 100 (16.5%) | 266 (38.9%) |
Disability Class: Self-Care Difficulty
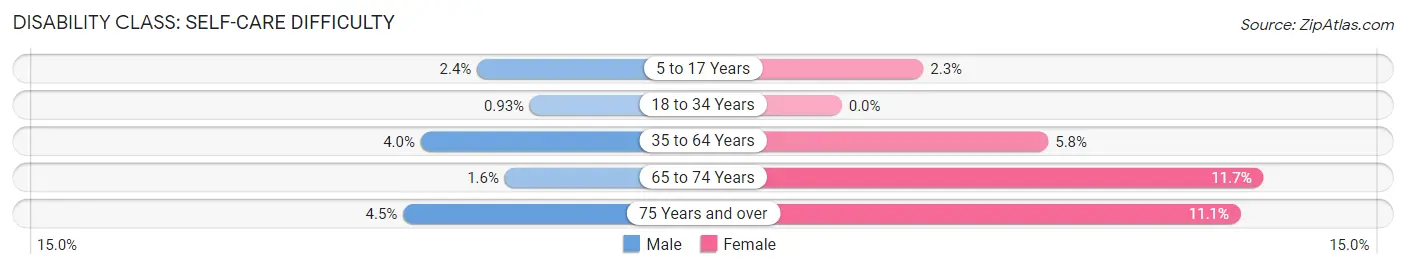
| Age Bracket | Male | Female |
| 5 to 17 Years | 45 (2.4%) | 36 (2.3%) |
| 18 to 34 Years | 18 (0.9%) | 0 (0.0%) |
| 35 to 64 Years | 124 (4.0%) | 197 (5.8%) |
| 65 to 74 Years | 13 (1.6%) | 139 (11.7%) |
| 75 Years and over | 27 (4.5%) | 76 (11.1%) |
Technology Access in Madisonville
Computing Device Access in Madisonville
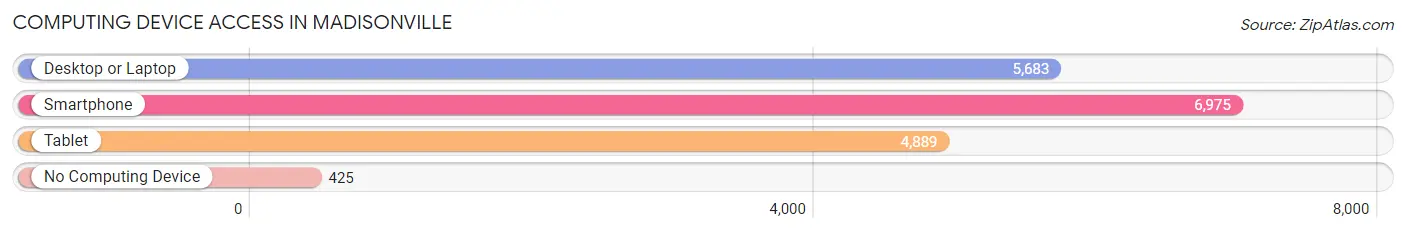
| Device Type | # Households | % Households |
| Desktop or Laptop | 5,683 | 71.0% |
| Smartphone | 6,975 | 87.1% |
| Tablet | 4,889 | 61.0% |
| No Computing Device | 425 | 5.3% |
| Total | 8,010 | 100.0% |
Internet Access in Madisonville
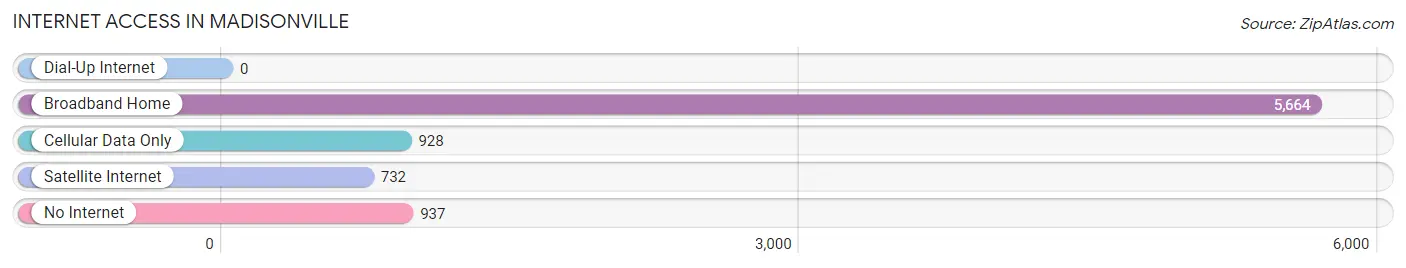
| Internet Type | # Households | % Households |
| Dial-Up Internet | 0 | 0.0% |
| Broadband Home | 5,664 | 70.7% |
| Cellular Data Only | 928 | 11.6% |
| Satellite Internet | 732 | 9.1% |
| No Internet | 937 | 11.7% |
| Total | 8,010 | 100.0% |
Madisonville Summary
Introduction
Madisonville is a city located in Hopkins County, Kentucky, United States. It is the county seat of Hopkins County and is located along the Pennyrile Parkway. The city is home to a population of 19,307 people as of the 2010 census. Madisonville is known for its rich history, diverse geography, strong economy, and unique demographics.
History
Madisonville was founded in 1807 by James Madison, the fourth President of the United States. The city was named after him in honor of his service to the nation. Madisonville was originally a small farming community, but it quickly grew into a bustling city. The city was incorporated in 1810 and has since become a major hub for commerce and industry in the region.
The city has a long and rich history. During the Civil War, Madisonville was a major supply center for the Confederate Army. The city was also the site of a major battle in 1862, when Union forces attempted to capture the city. The battle was unsuccessful, and the city remained in Confederate hands until the end of the war.
In the late 19th century, Madisonville became a major railroad hub. The city was home to several major railroads, including the Louisville and Nashville Railroad, the Illinois Central Railroad, and the St. Louis and San Francisco Railroad. The railroads brought a great deal of economic prosperity to the city, and it quickly became a major industrial center.
Geography
Madisonville is located in western Kentucky, in the Pennyrile region of the state. The city is situated along the Pennyrile Parkway, a major highway that runs through the region. The city is located about 80 miles north of Nashville, Tennessee, and about 120 miles south of Louisville, Kentucky.
The city is located in a hilly region of the state, and the terrain is mostly flat. The city is located in a humid subtropical climate zone, and the average temperature in the summer is around 80 degrees Fahrenheit. The city receives an average of 45 inches of rain per year.
Economy
Madisonville has a strong and diverse economy. The city is home to several major employers, including the Madisonville Community College, the Madisonville-Hopkins County Economic Development Corporation, and the Madisonville-Hopkins County Chamber of Commerce. The city is also home to several manufacturing companies, including the Madisonville Manufacturing Company, the Madisonville Foundry, and the Madisonville Textile Company.
The city is also home to several retail stores, restaurants, and other businesses. The city is a major shopping destination for the region, and it is home to several major shopping centers, including the Madisonville Mall and the Madisonville Towne Center.
Demographics
As of the 2010 census, Madisonville had a population of 19,307 people. The city has a diverse population, with a mix of races and ethnicities. The city is predominantly white, with a population that is 79.3% white, 15.2% African American, 1.2% Asian, and 4.3% other.
The city has a median household income of $37,845, and the median age is 37. The city has a poverty rate of 17.3%, and the unemployment rate is 6.2%.
Conclusion
Madisonville is a city located in Hopkins County, Kentucky. The city is known for its rich history, diverse geography, strong economy, and unique demographics. The city has a population of 19,307 people, and it is home to several major employers and businesses. The city has a median household income of $37,845, and the poverty rate is 17.3%. Madisonville is a vibrant and diverse city, and it is a great place to live and work.
Common Questions
What is Per Capita Income in Madisonville?
Per Capita income in Madisonville is $28,034.
What is the Median Family Income in Madisonville?
Median Family Income in Madisonville is $60,722.
What is the Median Household income in Madisonville?
Median Household Income in Madisonville is $54,234.
What is Income or Wage Gap in Madisonville?
Income or Wage Gap in Madisonville is 33.4%.
Women in Madisonville earn 66.6 cents for every dollar earned by a man.
What is Family Income Deficit in Madisonville?
Family Income Deficit in Madisonville is $13,954.
Families that are below poverty line in Madisonville earn $13,954 less on average than the poverty threshold level.
What is Inequality or Gini Index in Madisonville?
Inequality or Gini Index in Madisonville is 0.44.
What is the Total Population of Madisonville?
Total Population of Madisonville is 19,433.
What is the Total Male Population of Madisonville?
Total Male Population of Madisonville is 9,380.
What is the Total Female Population of Madisonville?
Total Female Population of Madisonville is 10,053.
What is the Ratio of Males per 100 Females in Madisonville?
There are 93.31 Males per 100 Females in Madisonville.
What is the Ratio of Females per 100 Males in Madisonville?
There are 107.17 Females per 100 Males in Madisonville.
What is the Median Population Age in Madisonville?
Median Population Age in Madisonville is 37.3 Years.
What is the Average Family Size in Madisonville
Average Family Size in Madisonville is 2.9 People.
What is the Average Household Size in Madisonville
Average Household Size in Madisonville is 2.3 People.
How Large is the Labor Force in Madisonville?
There are 8,459 People in the Labor Forcein in Madisonville.
What is the Percentage of People in the Labor Force in Madisonville?
55.3% of People are in the Labor Force in Madisonville.
What is the Unemployment Rate in Madisonville?
Unemployment Rate in Madisonville is 9.3%.