Davy, WV Map & Demographics
Davy Map
Davy Overview
$13,983
PER CAPITA INCOME
$52,250
AVG FAMILY INCOME
$38,750
AVG HOUSEHOLD INCOME
54.5%
WAGE / INCOME GAP [ % ]
45.5¢/ $1
WAGE / INCOME GAP [ $ ]
0.41
INEQUALITY / GINI INDEX
271
TOTAL POPULATION
129
MALE POPULATION
142
FEMALE POPULATION
90.85
MALES / 100 FEMALES
110.08
FEMALES / 100 MALES
40.1
MEDIAN AGE
4.3
AVG FAMILY SIZE
3.1
AVG HOUSEHOLD SIZE
69
LABOR FORCE [ PEOPLE ]
37.3%
PERCENT IN LABOR FORCE
8.7%
UNEMPLOYMENT RATE
Davy Zip Codes
Income in Davy
Income Overview in Davy
Per Capita Income in Davy is $13,983, while median incomes of families and households are $52,250 and $38,750 respectively.
| Characteristic | Number | Measure |
| Per Capita Income | 271 | $13,983 |
| Median Family Income | 53 | $52,250 |
| Mean Family Income | 53 | $64,238 |
| Median Household Income | 86 | $38,750 |
| Mean Household Income | 86 | $49,128 |
| Income Deficit | 53 | $0 |
| Wage / Income Gap (%) | 271 | 54.48% |
| Wage / Income Gap ($) | 271 | 45.52¢ per $1 |
| Gini / Inequality Index | 271 | 0.41 |
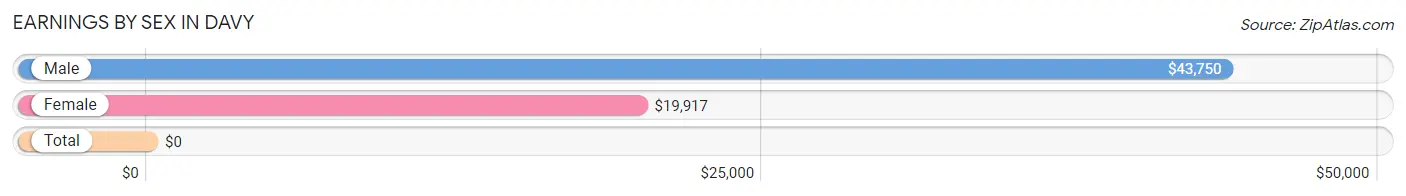
Earnings by Sex in Davy
| Sex | Number | Average Earnings |
| Male | 32 (45.1%) | $43,750 |
| Female | 39 (54.9%) | $19,917 |
| Total | 71 (100.0%) | $0 |
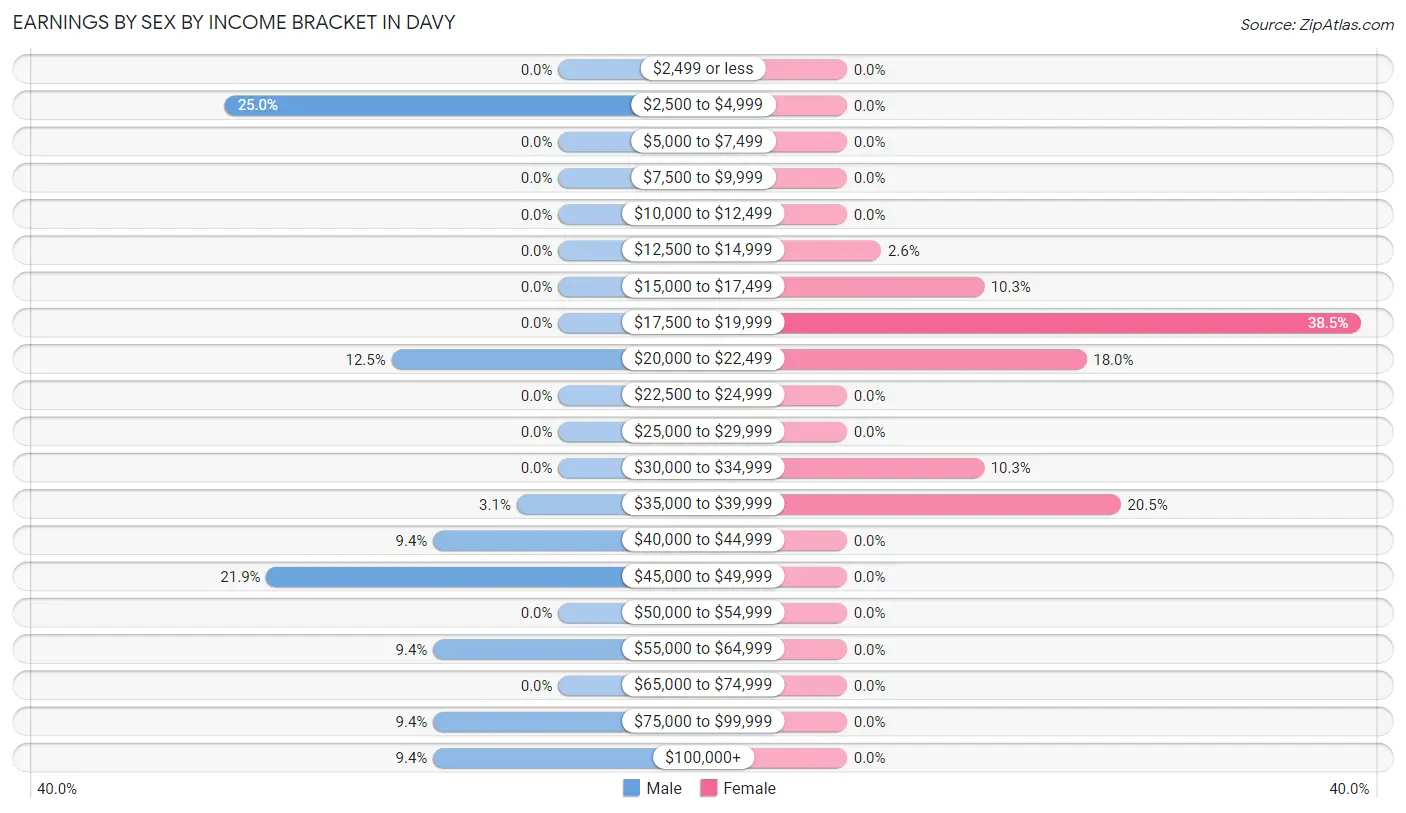
Earnings by Sex by Income Bracket in Davy
The most common earnings brackets in Davy are $2,500 to $4,999 for men (8 | 25.0%) and $17,500 to $19,999 for women (15 | 38.5%).
| Income | Male | Female |
| $2,499 or less | 0 (0.0%) | 0 (0.0%) |
| $2,500 to $4,999 | 8 (25.0%) | 0 (0.0%) |
| $5,000 to $7,499 | 0 (0.0%) | 0 (0.0%) |
| $7,500 to $9,999 | 0 (0.0%) | 0 (0.0%) |
| $10,000 to $12,499 | 0 (0.0%) | 0 (0.0%) |
| $12,500 to $14,999 | 0 (0.0%) | 1 (2.6%) |
| $15,000 to $17,499 | 0 (0.0%) | 4 (10.3%) |
| $17,500 to $19,999 | 0 (0.0%) | 15 (38.5%) |
| $20,000 to $22,499 | 4 (12.5%) | 7 (17.9%) |
| $22,500 to $24,999 | 0 (0.0%) | 0 (0.0%) |
| $25,000 to $29,999 | 0 (0.0%) | 0 (0.0%) |
| $30,000 to $34,999 | 0 (0.0%) | 4 (10.3%) |
| $35,000 to $39,999 | 1 (3.1%) | 8 (20.5%) |
| $40,000 to $44,999 | 3 (9.4%) | 0 (0.0%) |
| $45,000 to $49,999 | 7 (21.9%) | 0 (0.0%) |
| $50,000 to $54,999 | 0 (0.0%) | 0 (0.0%) |
| $55,000 to $64,999 | 3 (9.4%) | 0 (0.0%) |
| $65,000 to $74,999 | 0 (0.0%) | 0 (0.0%) |
| $75,000 to $99,999 | 3 (9.4%) | 0 (0.0%) |
| $100,000+ | 3 (9.4%) | 0 (0.0%) |
| Total | 32 (100.0%) | 39 (100.0%) |
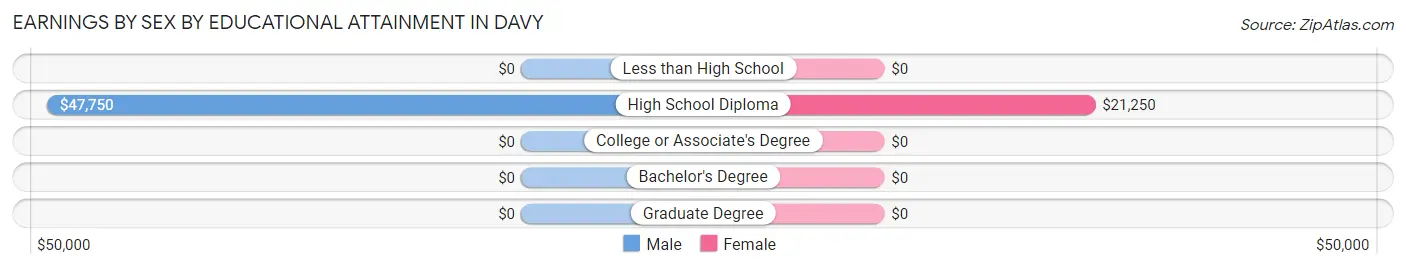
Earnings by Sex by Educational Attainment in Davy
Average earnings in Davy are $48,500 for men and $20,000 for women, a difference of 58.8%. Men with an educational attainment of high school diploma enjoy the highest average annual earnings of $47,750, while those with high school diploma education earn the least with $47,750. Women with an educational attainment of high school diploma earn the most with the average annual earnings of $21,250, while those with high school diploma education have the smallest earnings of $21,250.
| Educational Attainment | Male Income | Female Income |
| Less than High School | - | - |
| High School Diploma | $47,750 | $21,250 |
| College or Associate's Degree | - | - |
| Bachelor's Degree | - | - |
| Graduate Degree | - | - |
| Total | $48,500 | $20,000 |
Family Income in Davy
Family Income Brackets in Davy
According to the Davy family income data, there are 14 families falling into the $35,000 to $49,999 income range, which is the most common income bracket and makes up 26.4% of all families.
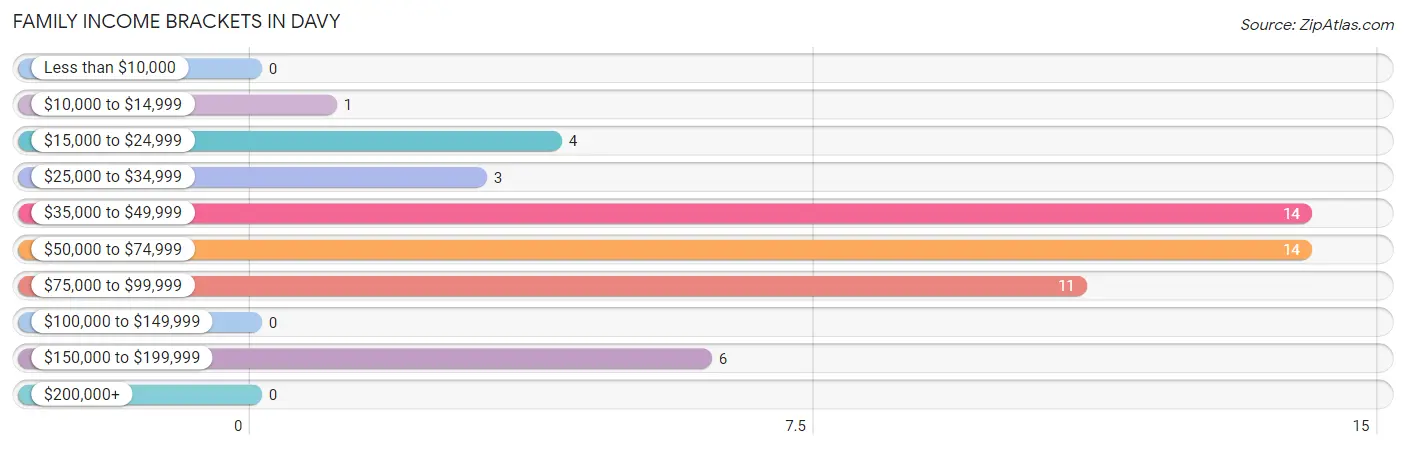
| Income Bracket | # Families | % Families |
| Less than $10,000 | 0 | 0.0% |
| $10,000 to $14,999 | 1 | 1.9% |
| $15,000 to $24,999 | 4 | 7.5% |
| $25,000 to $34,999 | 3 | 5.7% |
| $35,000 to $49,999 | 14 | 26.4% |
| $50,000 to $74,999 | 14 | 26.4% |
| $75,000 to $99,999 | 11 | 20.8% |
| $100,000 to $149,999 | 0 | 0.0% |
| $150,000 to $199,999 | 6 | 11.3% |
| $200,000+ | 0 | 0.0% |
Family Income by Famaliy Size in Davy
2-person families (14 | 26.4%) account for the highest median family income in Davy with $58,333 per family, while 2-person families (14 | 26.4%) have the highest median income of $29,166 per family member.
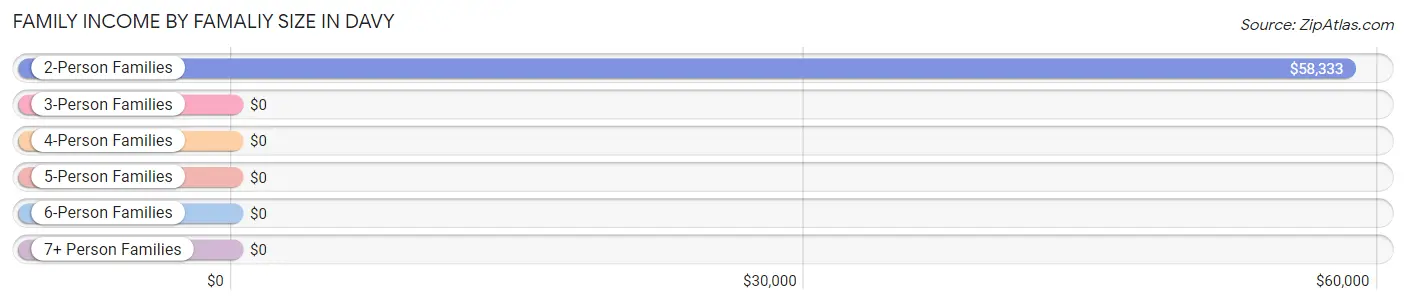
| Income Bracket | # Families | Median Income |
| 2-Person Families | 14 (26.4%) | $58,333 |
| 3-Person Families | 24 (45.3%) | $0 |
| 4-Person Families | 0 (0.0%) | $0 |
| 5-Person Families | 11 (20.7%) | $0 |
| 6-Person Families | 0 (0.0%) | $0 |
| 7+ Person Families | 4 (7.5%) | $0 |
| Total | 53 (100.0%) | $52,250 |
Family Income by Number of Earners in Davy
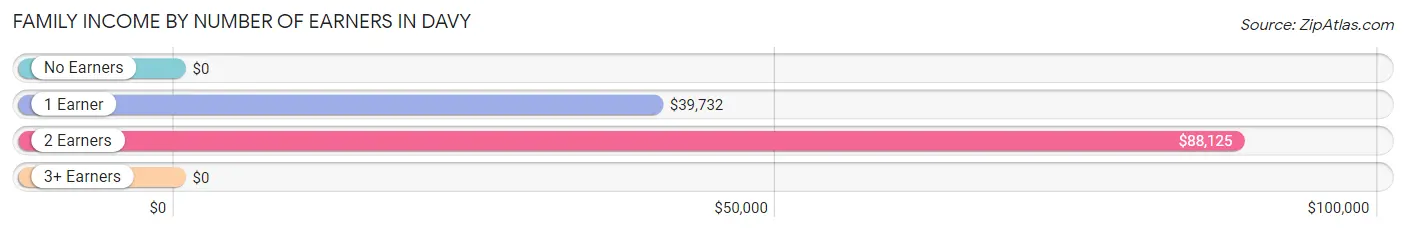
| Number of Earners | # Families | Median Income |
| No Earners | 0 (0.0%) | $0 |
| 1 Earner | 41 (77.4%) | $39,732 |
| 2 Earners | 12 (22.6%) | $88,125 |
| 3+ Earners | 0 (0.0%) | $0 |
| Total | 53 (100.0%) | $52,250 |
Household Income in Davy
Household Income Brackets in Davy
With 19 households falling in the category, the $50,000 to $74,999 income range is the most frequent in Davy, accounting for 22.1% of all households.
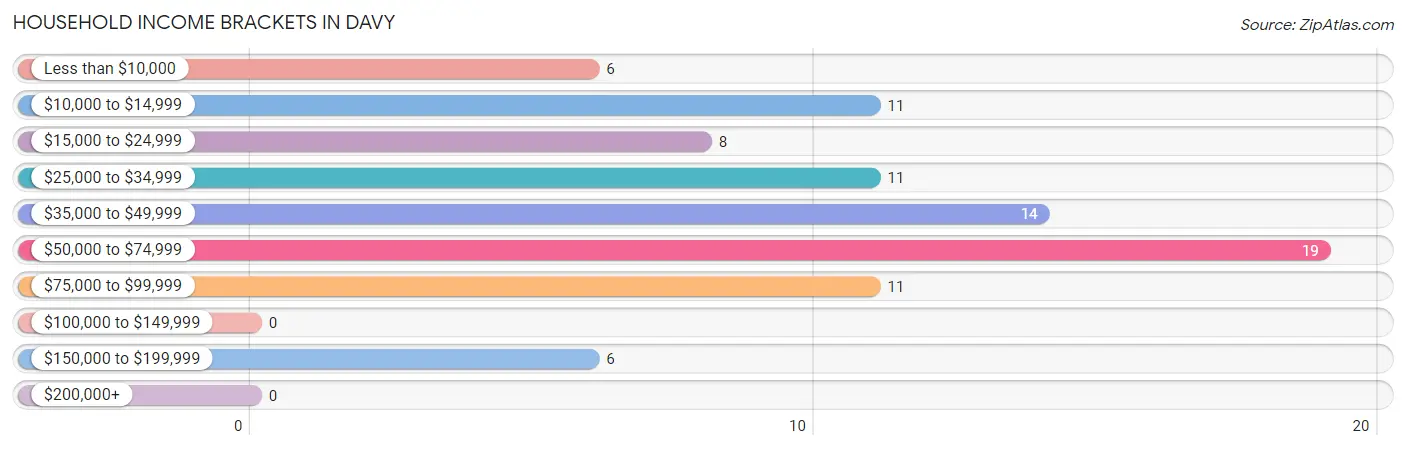
| Income Bracket | # Households | % Households |
| Less than $10,000 | 6 | 7.0% |
| $10,000 to $14,999 | 11 | 12.8% |
| $15,000 to $24,999 | 8 | 9.3% |
| $25,000 to $34,999 | 11 | 12.8% |
| $35,000 to $49,999 | 14 | 16.3% |
| $50,000 to $74,999 | 19 | 22.1% |
| $75,000 to $99,999 | 11 | 12.8% |
| $100,000 to $149,999 | 0 | 0.0% |
| $150,000 to $199,999 | 6 | 7.0% |
| $200,000+ | 0 | 0.0% |
Household Income by Householder Age in Davy
The median household income in Davy is $38,750, with the highest median household income of $51,250 found in the 45 to 64 years age bracket for the primary householder. A total of 39 households (45.4%) fall into this category. Meanwhile, the 15 to 24 years age bracket for the primary householder has the lowest median household income of $0, with 1 households (1.2%) in this group.
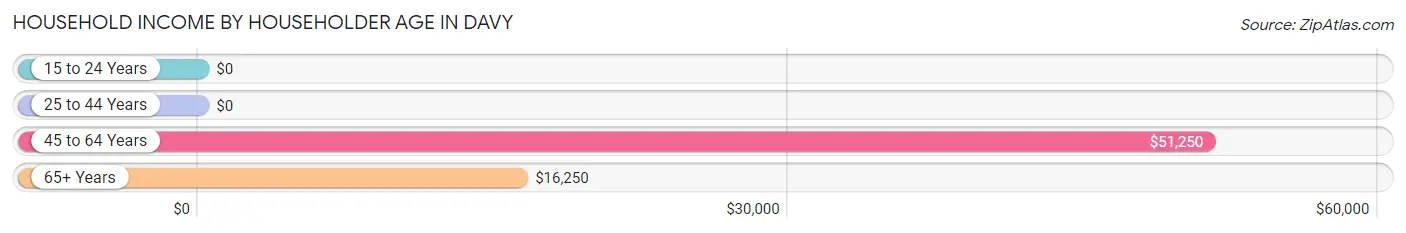
| Income Bracket | # Households | Median Income |
| 15 to 24 Years | 1 (1.2%) | $0 |
| 25 to 44 Years | 16 (18.6%) | $0 |
| 45 to 64 Years | 39 (45.4%) | $51,250 |
| 65+ Years | 30 (34.9%) | $16,250 |
| Total | 86 (100.0%) | $38,750 |
Poverty in Davy
Income Below Poverty by Sex and Age in Davy
With 9.3% poverty level for males and 21.8% for females among the residents of Davy, under 5 year old males and under 5 year old females are the most vulnerable to poverty, with 7 males (70.0%) and 8 females (100.0%) in their respective age groups living below the poverty level.
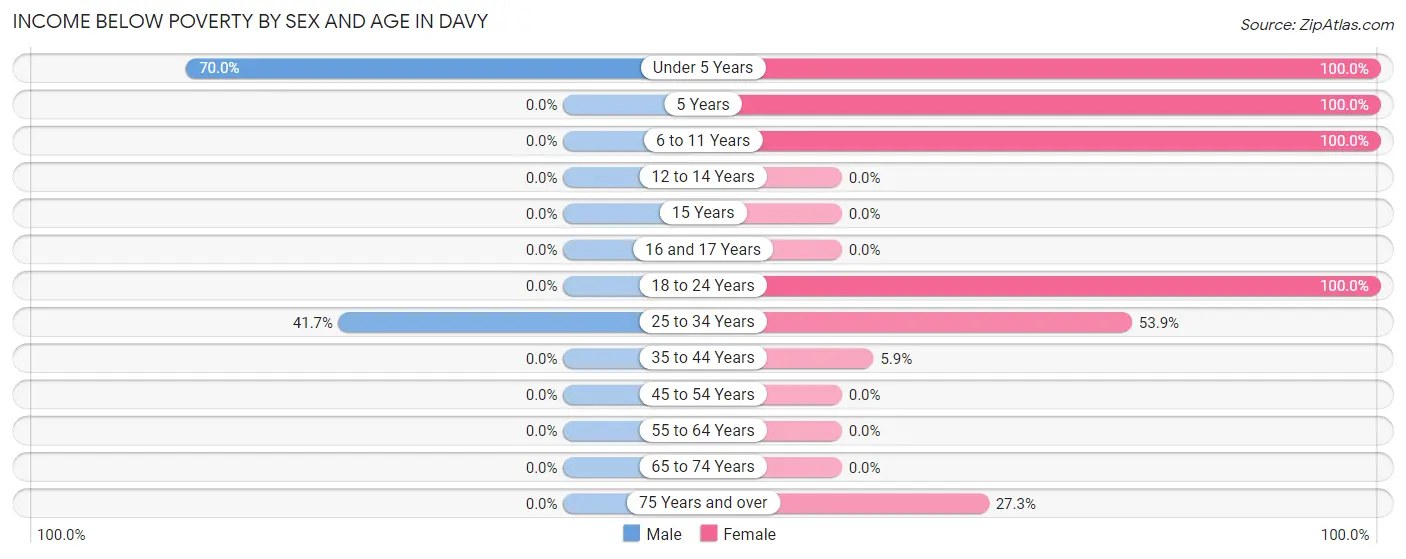
| Age Bracket | Male | Female |
| Under 5 Years | 7 (70.0%) | 8 (100.0%) |
| 5 Years | 0 (0.0%) | 3 (100.0%) |
| 6 to 11 Years | 0 (0.0%) | 6 (100.0%) |
| 12 to 14 Years | 0 (0.0%) | 0 (0.0%) |
| 15 Years | 0 (0.0%) | 0 (0.0%) |
| 16 and 17 Years | 0 (0.0%) | 0 (0.0%) |
| 18 to 24 Years | 0 (0.0%) | 1 (100.0%) |
| 25 to 34 Years | 5 (41.7%) | 7 (53.8%) |
| 35 to 44 Years | 0 (0.0%) | 3 (5.9%) |
| 45 to 54 Years | 0 (0.0%) | 0 (0.0%) |
| 55 to 64 Years | 0 (0.0%) | 0 (0.0%) |
| 65 to 74 Years | 0 (0.0%) | 0 (0.0%) |
| 75 Years and over | 0 (0.0%) | 3 (27.3%) |
| Total | 12 (9.3%) | 31 (21.8%) |
Income Above Poverty by Sex and Age in Davy
According to the poverty statistics in Davy, males aged 6 to 11 years and females aged 12 to 14 years are the age groups that are most secure financially, with 100.0% of males and 100.0% of females in these age groups living above the poverty line.
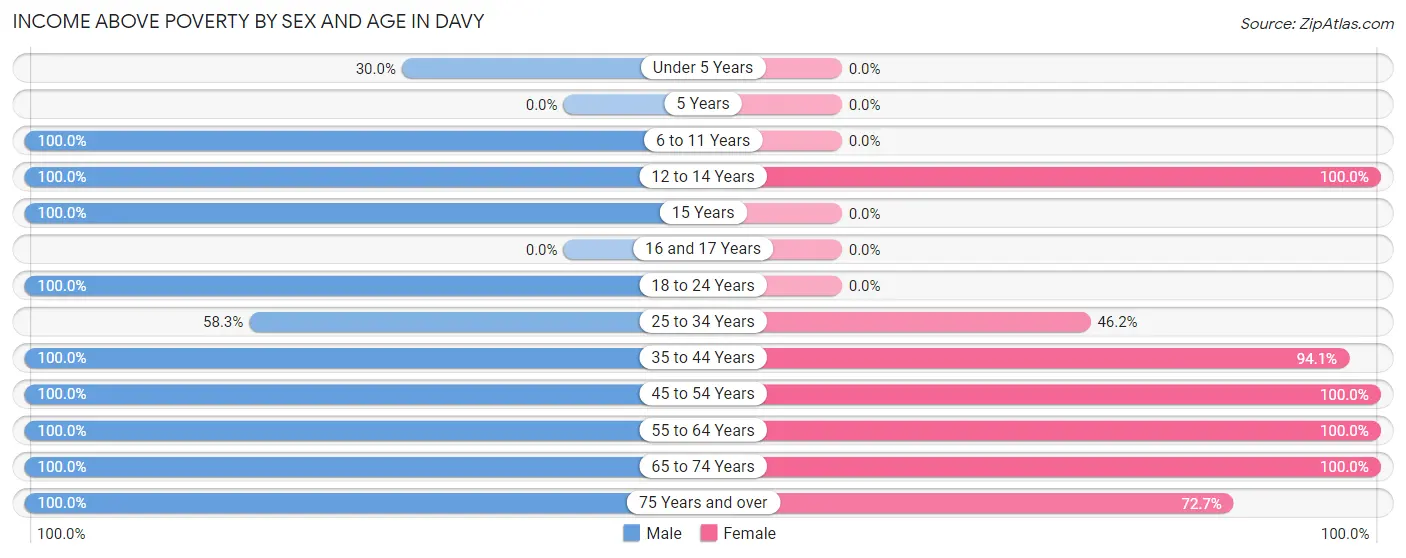
| Age Bracket | Male | Female |
| Under 5 Years | 3 (30.0%) | 0 (0.0%) |
| 5 Years | 0 (0.0%) | 0 (0.0%) |
| 6 to 11 Years | 7 (100.0%) | 0 (0.0%) |
| 12 to 14 Years | 14 (100.0%) | 8 (100.0%) |
| 15 Years | 30 (100.0%) | 0 (0.0%) |
| 16 and 17 Years | 0 (0.0%) | 0 (0.0%) |
| 18 to 24 Years | 11 (100.0%) | 0 (0.0%) |
| 25 to 34 Years | 7 (58.3%) | 6 (46.2%) |
| 35 to 44 Years | 6 (100.0%) | 48 (94.1%) |
| 45 to 54 Years | 9 (100.0%) | 15 (100.0%) |
| 55 to 64 Years | 11 (100.0%) | 21 (100.0%) |
| 65 to 74 Years | 15 (100.0%) | 5 (100.0%) |
| 75 Years and over | 4 (100.0%) | 8 (72.7%) |
| Total | 117 (90.7%) | 111 (78.2%) |
Income Below Poverty Among Married-Couple Families in Davy
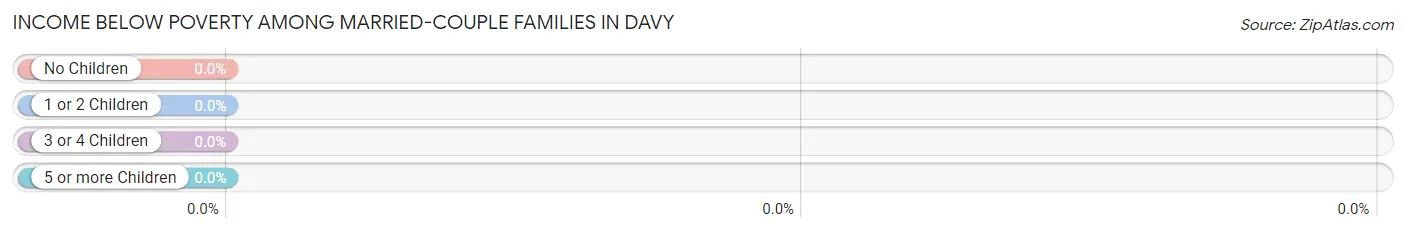
| Children | Above Poverty | Below Poverty |
| No Children | 9 (100.0%) | 0 (0.0%) |
| 1 or 2 Children | 32 (100.0%) | 0 (0.0%) |
| 3 or 4 Children | 0 (0.0%) | 0 (0.0%) |
| 5 or more Children | 0 (0.0%) | 0 (0.0%) |
| Total | 41 (100.0%) | 0 (0.0%) |
Income Below Poverty Among Single-Parent Households in Davy
According to the poverty data in Davy, 66.7% or 4 single-father households and 16.7% or 1 single-mother households are living below the poverty line. Among single-father households, those with 5 or more children have the highest poverty rate, with 4 households (100.0%) experiencing poverty. Likewise, among single-mother households, those with 1 or 2 children have the highest poverty rate, with 1 households (16.7%) falling below the poverty line.
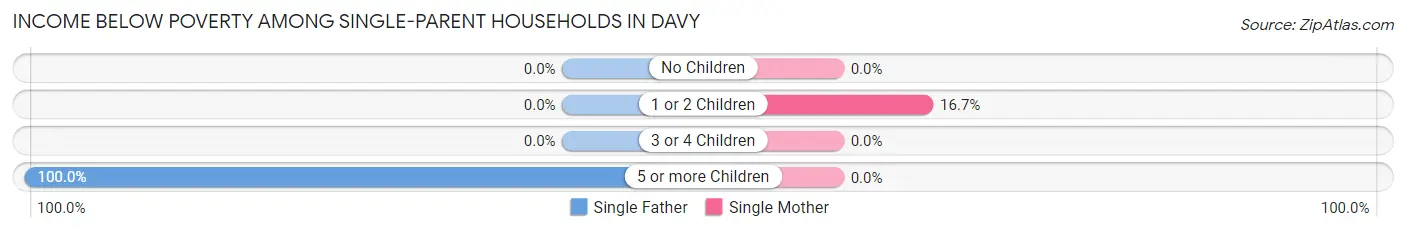
| Children | Single Father | Single Mother |
| No Children | 0 (0.0%) | 0 (0.0%) |
| 1 or 2 Children | 0 (0.0%) | 1 (16.7%) |
| 3 or 4 Children | 0 (0.0%) | 0 (0.0%) |
| 5 or more Children | 4 (100.0%) | 0 (0.0%) |
| Total | 4 (66.7%) | 1 (16.7%) |
Income Below Poverty Among Married-Couple vs Single-Parent Households in Davy
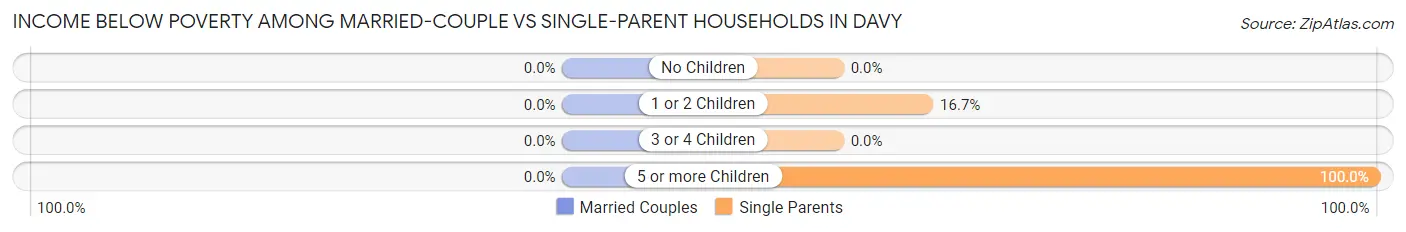
| Children | Married-Couple Families | Single-Parent Households |
| No Children | 0 (0.0%) | 0 (0.0%) |
| 1 or 2 Children | 0 (0.0%) | 1 (16.7%) |
| 3 or 4 Children | 0 (0.0%) | 0 (0.0%) |
| 5 or more Children | 0 (0.0%) | 4 (100.0%) |
| Total | 0 (0.0%) | 5 (41.7%) |
Race in Davy
The most populous races in Davy are , and White / Caucasian (271 | 100.0%).
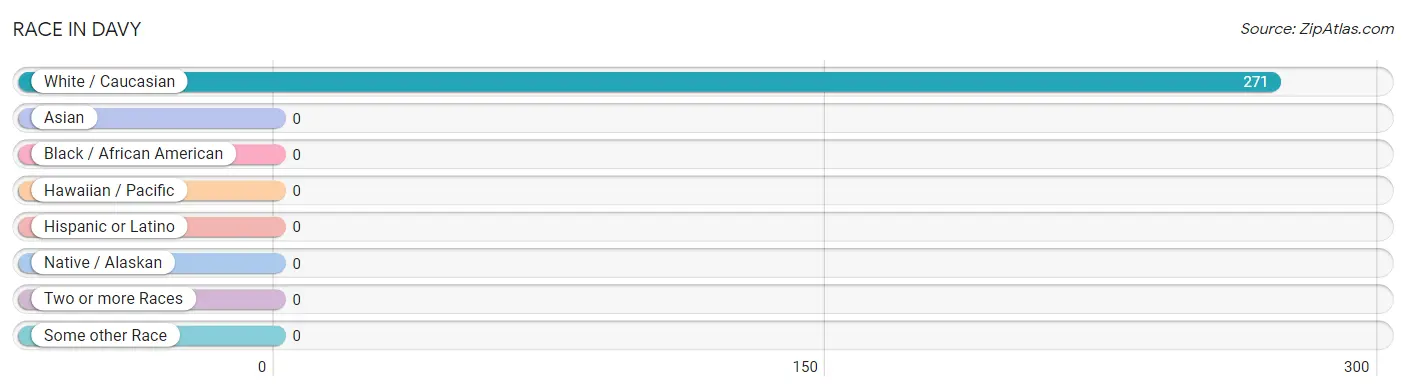
| Race | # Population | % Population |
| Asian | 0 | 0.0% |
| Black / African American | 0 | 0.0% |
| Hawaiian / Pacific | 0 | 0.0% |
| Hispanic or Latino | 0 | 0.0% |
| Native / Alaskan | 0 | 0.0% |
| White / Caucasian | 271 | 100.0% |
| Two or more Races | 0 | 0.0% |
| Some other Race | 0 | 0.0% |
| Total | 271 | 100.0% |
Ancestry in Davy
The most populous ancestries reported in Davy are American (37 | 13.7%), Italian (22 | 8.1%), Irish (13 | 4.8%), English (6 | 2.2%), and Bulgarian (3 | 1.1%), together accounting for 29.9% of all Davy residents.
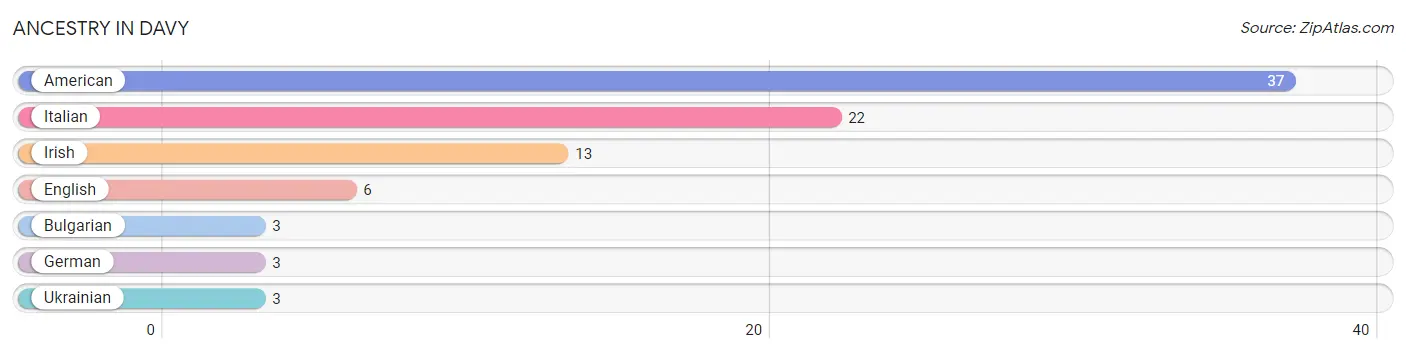
| Ancestry | # Population | % Population |
| American | 37 | 13.7% |
| Bulgarian | 3 | 1.1% |
| English | 6 | 2.2% |
| German | 3 | 1.1% |
| Irish | 13 | 4.8% |
| Italian | 22 | 8.1% |
| Ukrainian | 3 | 1.1% | View All 7 Rows |
Immigrants in Davy

| Immigration Origin | # Population | % Population | View All 0 Rows |
Sex and Age in Davy
Sex and Age in Davy
The most populous age groups in Davy are 15 to 19 Years (41 | 31.8%) for men and 40 to 44 Years (45 | 31.7%) for women.
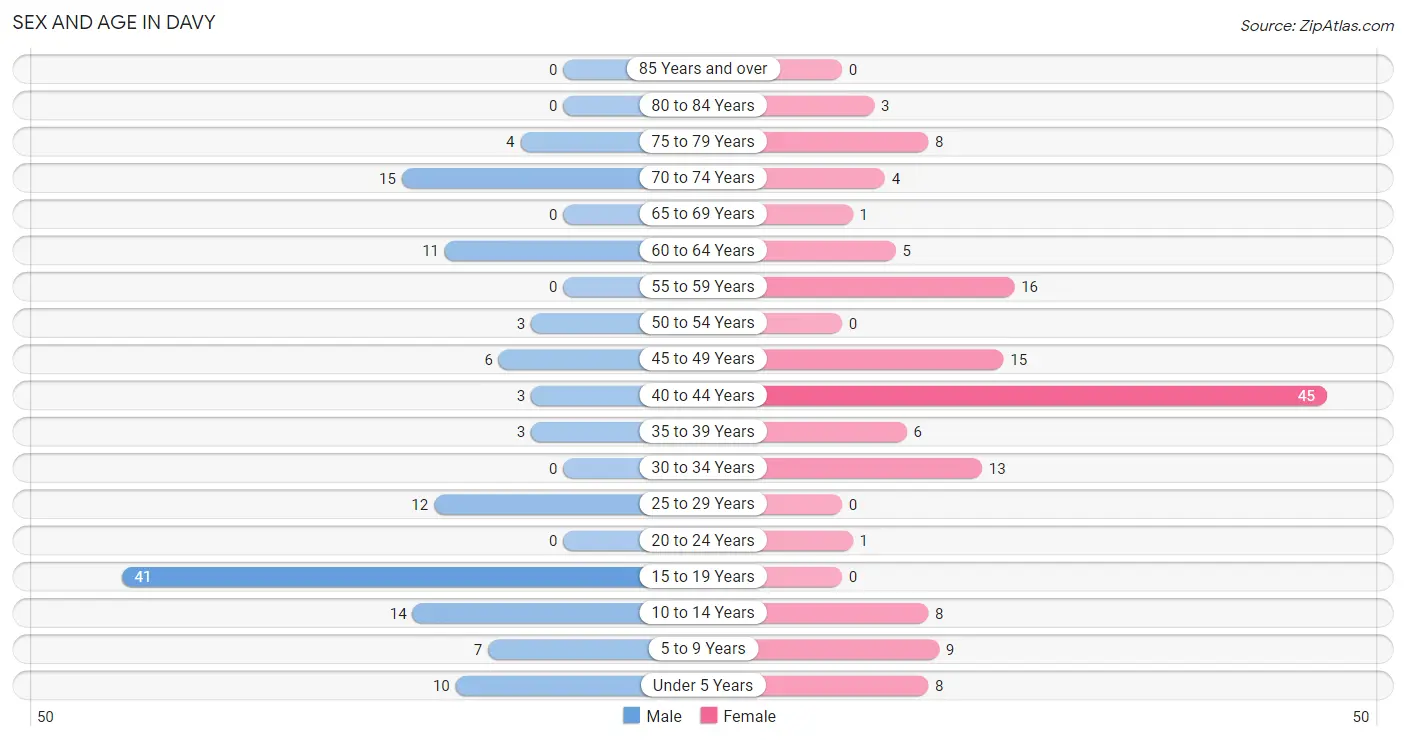
| Age Bracket | Male | Female |
| Under 5 Years | 10 (7.7%) | 8 (5.6%) |
| 5 to 9 Years | 7 (5.4%) | 9 (6.3%) |
| 10 to 14 Years | 14 (10.8%) | 8 (5.6%) |
| 15 to 19 Years | 41 (31.8%) | 0 (0.0%) |
| 20 to 24 Years | 0 (0.0%) | 1 (0.7%) |
| 25 to 29 Years | 12 (9.3%) | 0 (0.0%) |
| 30 to 34 Years | 0 (0.0%) | 13 (9.1%) |
| 35 to 39 Years | 3 (2.3%) | 6 (4.2%) |
| 40 to 44 Years | 3 (2.3%) | 45 (31.7%) |
| 45 to 49 Years | 6 (4.6%) | 15 (10.6%) |
| 50 to 54 Years | 3 (2.3%) | 0 (0.0%) |
| 55 to 59 Years | 0 (0.0%) | 16 (11.3%) |
| 60 to 64 Years | 11 (8.5%) | 5 (3.5%) |
| 65 to 69 Years | 0 (0.0%) | 1 (0.7%) |
| 70 to 74 Years | 15 (11.6%) | 4 (2.8%) |
| 75 to 79 Years | 4 (3.1%) | 8 (5.6%) |
| 80 to 84 Years | 0 (0.0%) | 3 (2.1%) |
| 85 Years and over | 0 (0.0%) | 0 (0.0%) |
| Total | 129 (100.0%) | 142 (100.0%) |
Families and Households in Davy
Median Family Size in Davy
The median family size in Davy is 4.34 persons per family, with single male/father families (6 | 11.3%) accounting for the largest median family size of 5.5 persons per family. On the other hand, single female/mother families (6 | 11.3%) represent the smallest median family size with 2.83 persons per family.
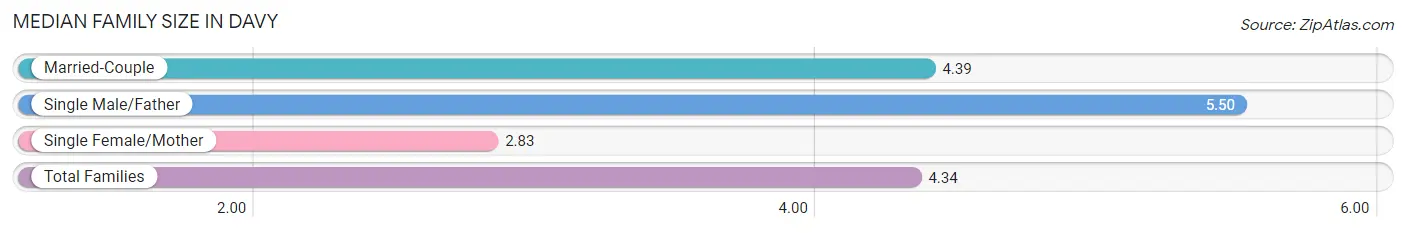
| Family Type | # Families | Family Size |
| Married-Couple | 41 (77.4%) | 4.39 |
| Single Male/Father | 6 (11.3%) | 5.50 |
| Single Female/Mother | 6 (11.3%) | 2.83 |
| Total Families | 53 (100.0%) | 4.34 |
Median Household Size in Davy
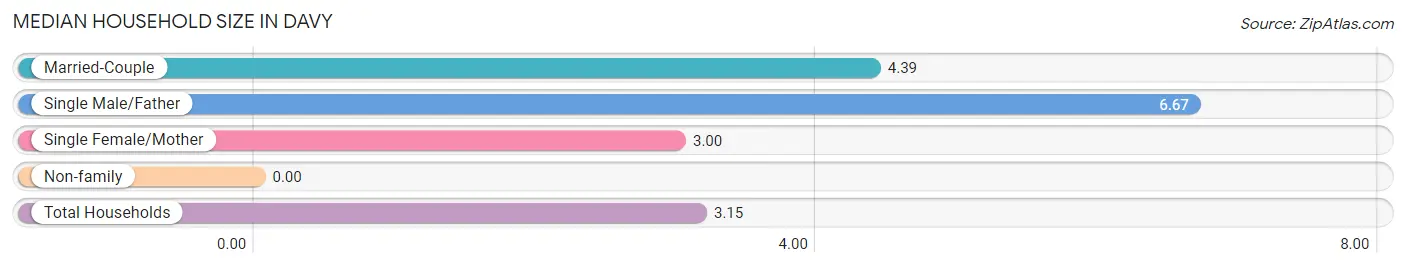
| Household Type | # Households | Household Size |
| Married-Couple | 41 (47.7%) | 4.39 |
| Single Male/Father | 6 (7.0%) | 6.67 |
| Single Female/Mother | 6 (7.0%) | 3.00 |
| Non-family | 33 (38.4%) | - |
| Total Households | 86 (100.0%) | 3.15 |
Household Size by Marriage Status in Davy
Out of a total of 86 households in Davy, 53 (61.6%) are family households, while 33 (38.4%) are nonfamily households. The most numerous type of family households are 3-person households, comprising 25, and the most common type of nonfamily households are 1-person households, comprising 33.
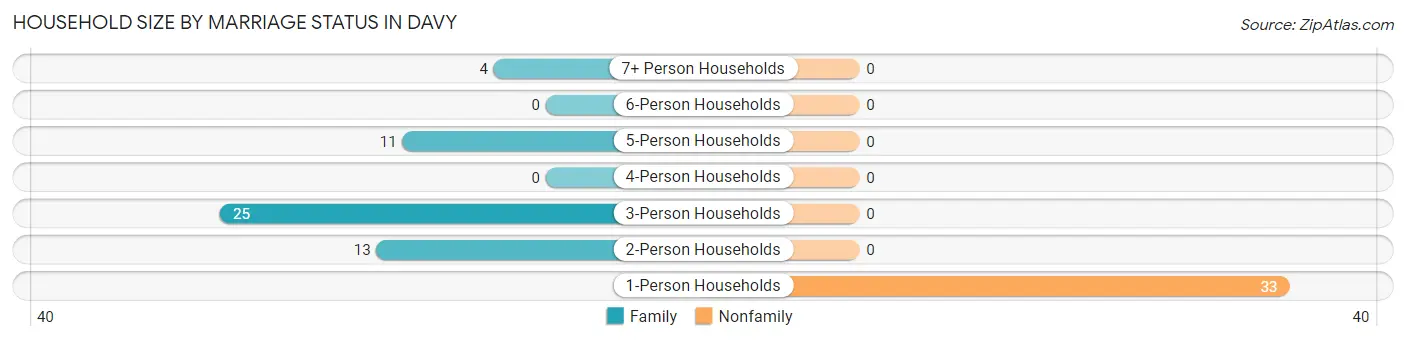
| Household Size | Family Households | Nonfamily Households |
| 1-Person Households | - | 33 (38.4%) |
| 2-Person Households | 13 (15.1%) | 0 (0.0%) |
| 3-Person Households | 25 (29.1%) | 0 (0.0%) |
| 4-Person Households | 0 (0.0%) | 0 (0.0%) |
| 5-Person Households | 11 (12.8%) | 0 (0.0%) |
| 6-Person Households | 0 (0.0%) | 0 (0.0%) |
| 7+ Person Households | 4 (4.6%) | 0 (0.0%) |
| Total | 53 (61.6%) | 33 (38.4%) |
Female Fertility in Davy
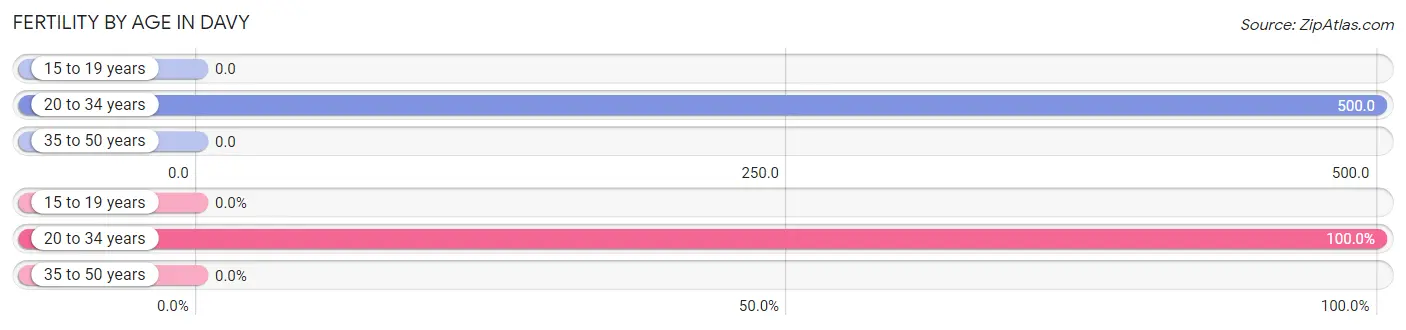
Fertility by Age in Davy
Average fertility rate in Davy is 88.0 births per 1,000 women. Women in the age bracket of 20 to 34 years have the highest fertility rate with 500.0 births per 1,000 women. Women in the age bracket of 20 to 34 years acount for 100.0% of all women with births.
| Age Bracket | Women with Births | Births / 1,000 Women |
| 15 to 19 years | 0 (0.0%) | 0.0 |
| 20 to 34 years | 7 (100.0%) | 500.0 |
| 35 to 50 years | 0 (0.0%) | 0.0 |
| Total | 7 (100.0%) | 88.0 |
Fertility by Age by Marriage Status in Davy
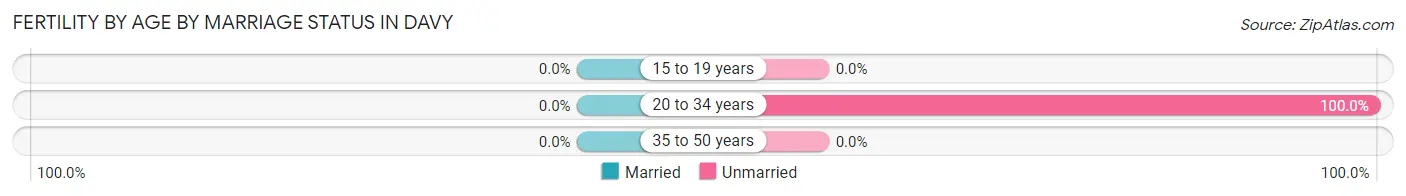
| Age Bracket | Married | Unmarried |
| 15 to 19 years | 0 (0.0%) | 0 (0.0%) |
| 20 to 34 years | 0 (0.0%) | 7 (100.0%) |
| 35 to 50 years | 0 (0.0%) | 0 (0.0%) |
| Total | 0 (0.0%) | 7 (100.0%) |
Fertility by Education in Davy
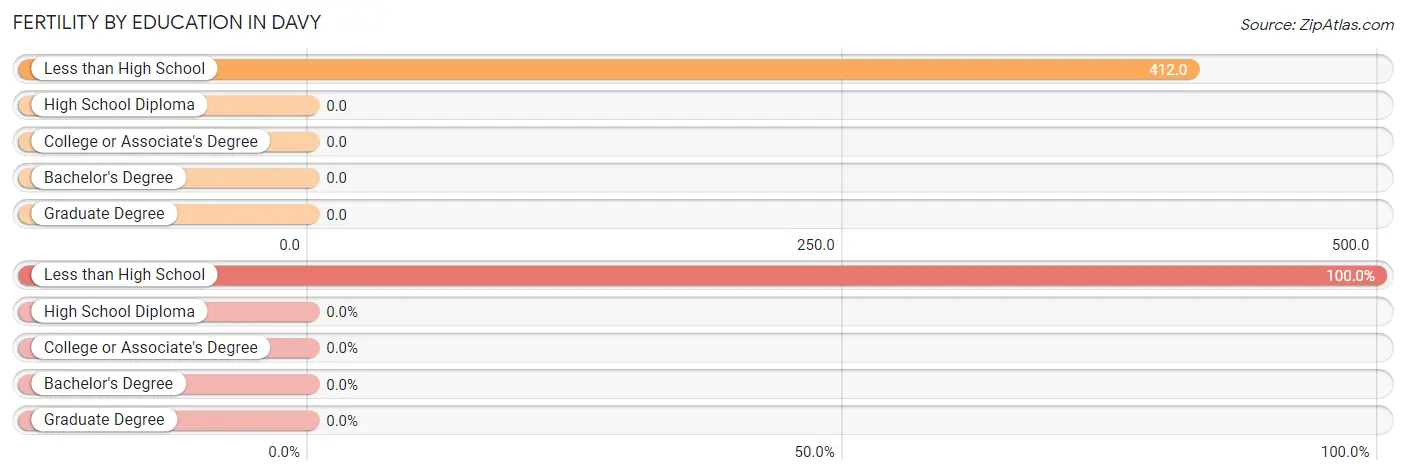
| Educational Attainment | Women with Births | Births / 1,000 Women |
| Less than High School | 7 (100.0%) | 412.0 |
| High School Diploma | 0 (0.0%) | 0.0 |
| College or Associate's Degree | 0 (0.0%) | 0.0 |
| Bachelor's Degree | 0 (0.0%) | 0.0 |
| Graduate Degree | 0 (0.0%) | 0.0 |
| Total | 7 (100.0%) | 88.0 |
Fertility by Education by Marriage Status in Davy
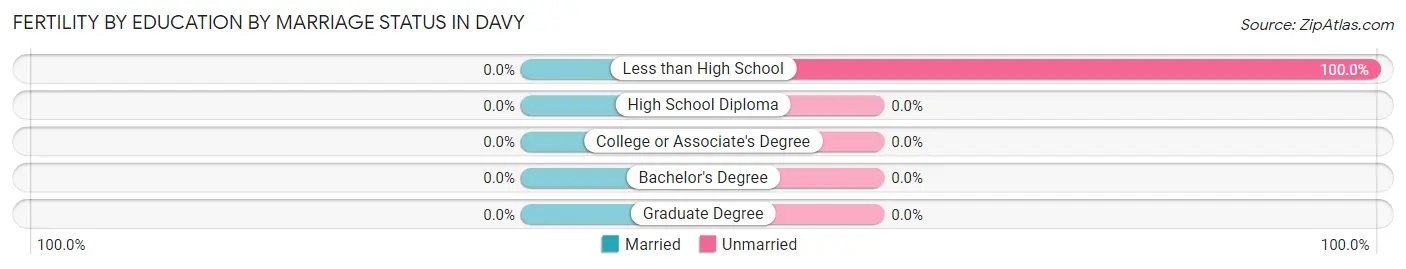
| Educational Attainment | Married | Unmarried |
| Less than High School | 0 (0.0%) | 7 (100.0%) |
| High School Diploma | 0 (0.0%) | 0 (0.0%) |
| College or Associate's Degree | 0 (0.0%) | 0 (0.0%) |
| Bachelor's Degree | 0 (0.0%) | 0 (0.0%) |
| Graduate Degree | 0 (0.0%) | 0 (0.0%) |
| Total | 0 (0.0%) | 7 (100.0%) |
Employment Characteristics in Davy
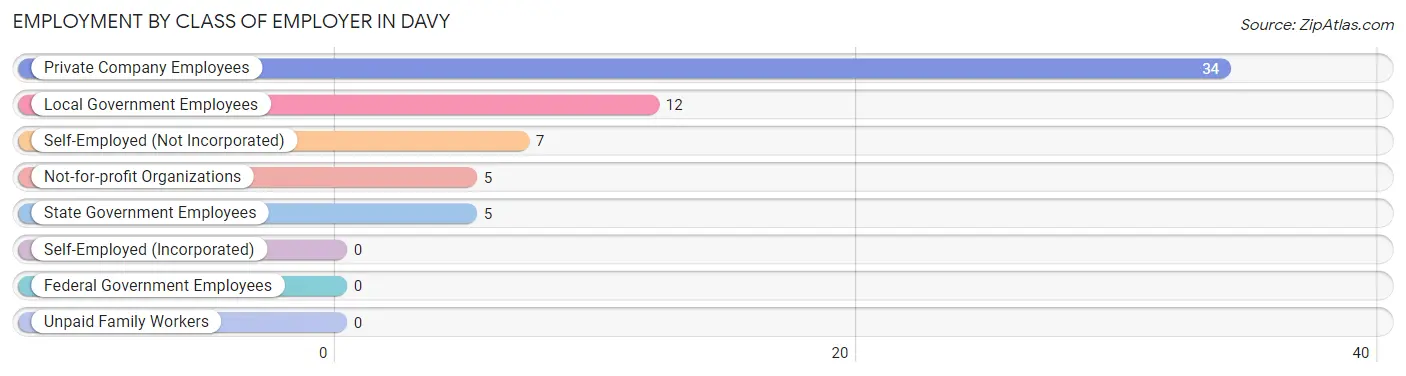
Employment by Class of Employer in Davy
Among the 63 employed individuals in Davy, private company employees (34 | 54.0%), local government employees (12 | 19.1%), and self-employed (not incorporated) (7 | 11.1%) make up the most common classes of employment.
| Employer Class | # Employees | % Employees |
| Private Company Employees | 34 | 54.0% |
| Self-Employed (Incorporated) | 0 | 0.0% |
| Self-Employed (Not Incorporated) | 7 | 11.1% |
| Not-for-profit Organizations | 5 | 7.9% |
| Local Government Employees | 12 | 19.1% |
| State Government Employees | 5 | 7.9% |
| Federal Government Employees | 0 | 0.0% |
| Unpaid Family Workers | 0 | 0.0% |
| Total | 63 | 100.0% |
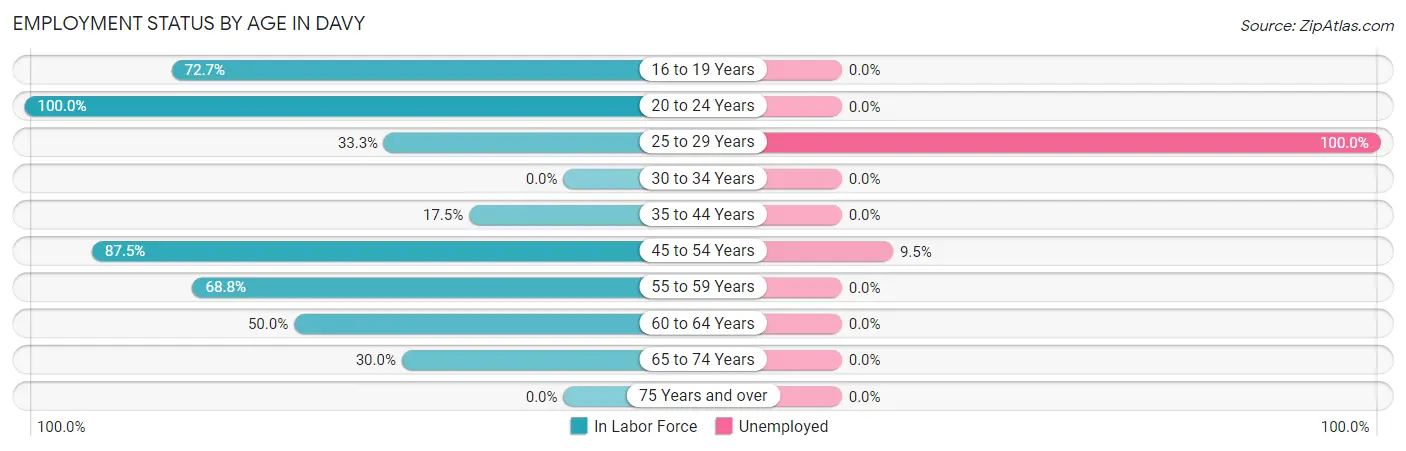
Employment Status by Age in Davy
According to the labor force statistics for Davy, out of the total population over 16 years of age (185), 37.3% or 69 individuals are in the labor force, with 8.7% or 6 of them unemployed. The age group with the highest labor force participation rate is 20 to 24 years, with 100.0% or 1 individuals in the labor force. Within the labor force, the 25 to 29 years age range has the highest percentage of unemployed individuals, with 100.0% or 4 of them being unemployed.
| Age Bracket | In Labor Force | Unemployed |
| 16 to 19 Years | 8 (72.7%) | 0 (0.0%) |
| 20 to 24 Years | 1 (100.0%) | 0 (0.0%) |
| 25 to 29 Years | 4 (33.3%) | 4 (100.0%) |
| 30 to 34 Years | 0 (0.0%) | 0 (0.0%) |
| 35 to 44 Years | 10 (17.5%) | 0 (0.0%) |
| 45 to 54 Years | 21 (87.5%) | 2 (9.5%) |
| 55 to 59 Years | 11 (68.8%) | 0 (0.0%) |
| 60 to 64 Years | 8 (50.0%) | 0 (0.0%) |
| 65 to 74 Years | 6 (30.0%) | 0 (0.0%) |
| 75 Years and over | 0 (0.0%) | 0 (0.0%) |
| Total | 69 (37.3%) | 6 (8.7%) |
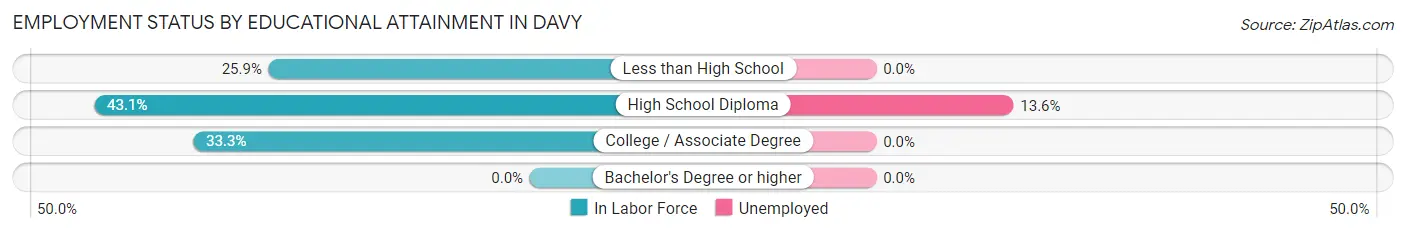
Employment Status by Educational Attainment in Davy
According to labor force statistics for Davy, 39.1% of individuals (54) out of the total population between 25 and 64 years of age (138) are in the labor force, with 11.1% or 6 of them being unemployed. The group with the highest labor force participation rate are those with the educational attainment of high school diploma, with 43.1% or 44 individuals in the labor force. Within the labor force, individuals with high school diploma education have the highest percentage of unemployment, with 13.6% or 6 of them being unemployed.
| Educational Attainment | In Labor Force | Unemployed |
| Less than High School | 7 (25.9%) | 0 (0.0%) |
| High School Diploma | 44 (43.1%) | 14 (13.6%) |
| College / Associate Degree | 3 (33.3%) | 0 (0.0%) |
| Bachelor's Degree or higher | 0 (0.0%) | 0 (0.0%) |
| Total | 54 (39.1%) | 15 (11.1%) |
Employment Occupations by Sex in Davy
Management, Business, Science and Arts Occupations
The most common Management, Business, Science and Arts occupations in Davy are Health Diagnosing & Treating (3 | 4.8%), and Management (1 | 1.6%).
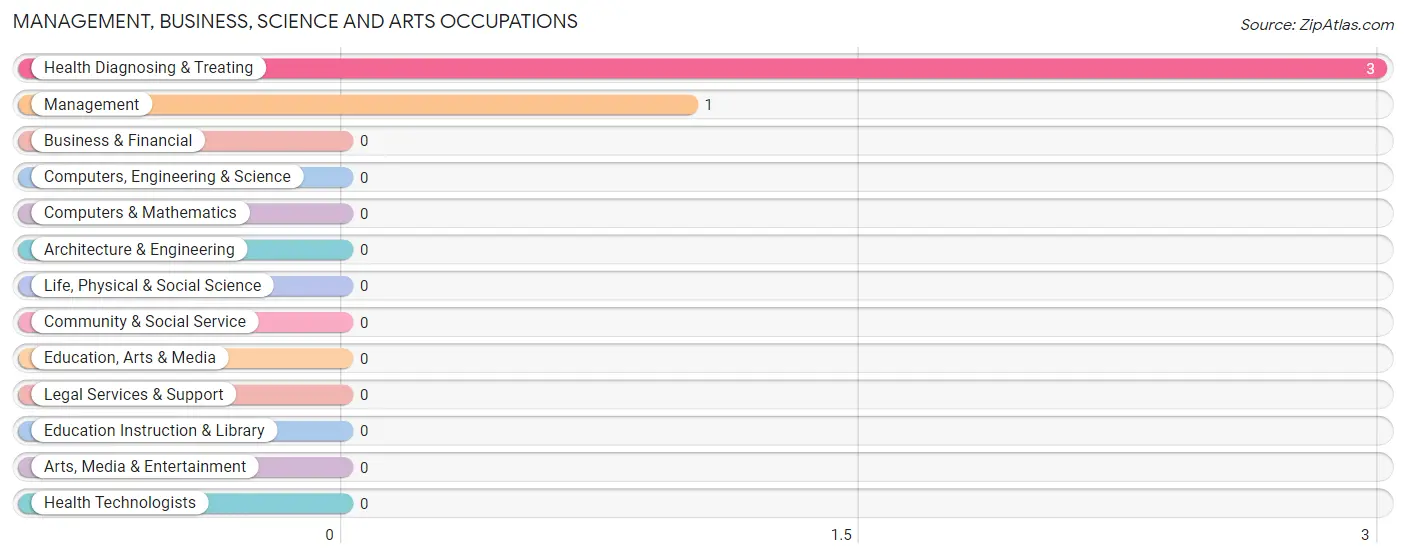
Management, Business, Science and Arts Occupations by Sex
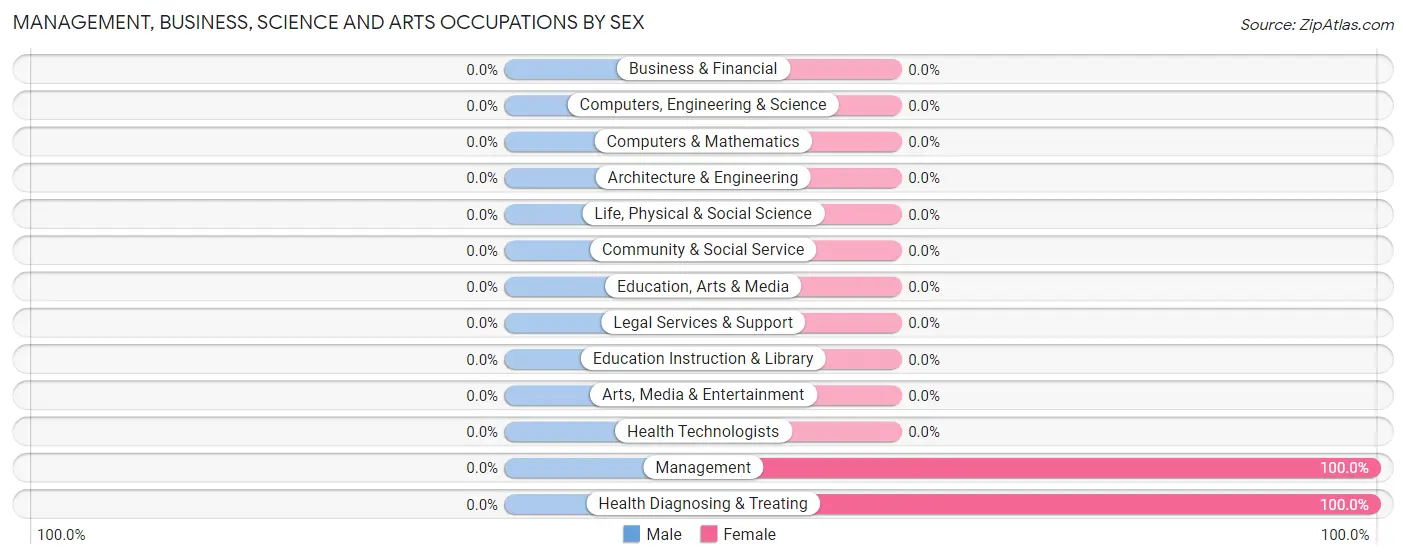
| Occupation | Male | Female |
| Management | 0 (0.0%) | 1 (100.0%) |
| Business & Financial | 0 (0.0%) | 0 (0.0%) |
| Computers, Engineering & Science | 0 (0.0%) | 0 (0.0%) |
| Computers & Mathematics | 0 (0.0%) | 0 (0.0%) |
| Architecture & Engineering | 0 (0.0%) | 0 (0.0%) |
| Life, Physical & Social Science | 0 (0.0%) | 0 (0.0%) |
| Community & Social Service | 0 (0.0%) | 0 (0.0%) |
| Education, Arts & Media | 0 (0.0%) | 0 (0.0%) |
| Legal Services & Support | 0 (0.0%) | 0 (0.0%) |
| Education Instruction & Library | 0 (0.0%) | 0 (0.0%) |
| Arts, Media & Entertainment | 0 (0.0%) | 0 (0.0%) |
| Health Diagnosing & Treating | 0 (0.0%) | 3 (100.0%) |
| Health Technologists | 0 (0.0%) | 0 (0.0%) |
| Total (Category) | 0 (0.0%) | 4 (100.0%) |
| Total (Overall) | 26 (41.3%) | 37 (58.7%) |
Services Occupations
The most common Services occupations in Davy are Healthcare Support (15 | 23.8%), and Food Preparation & Serving (1 | 1.6%).
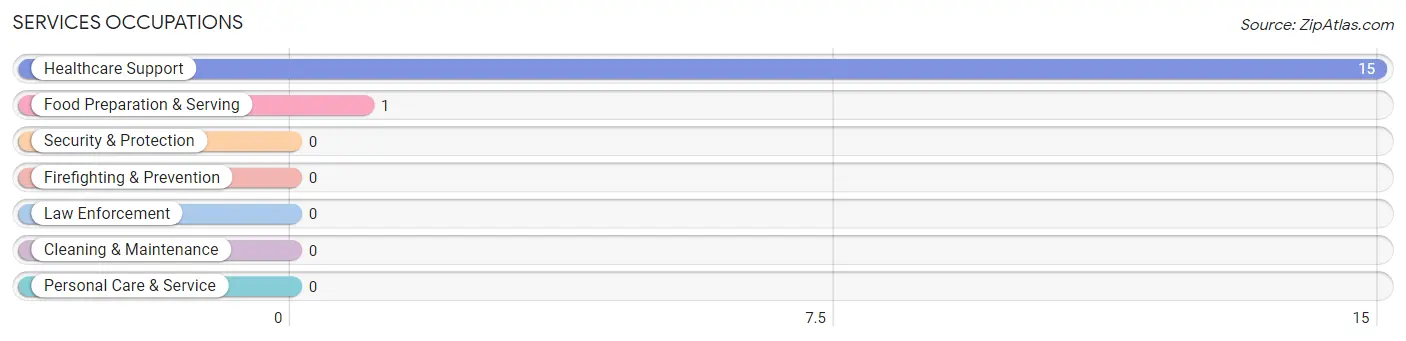
Services Occupations by Sex
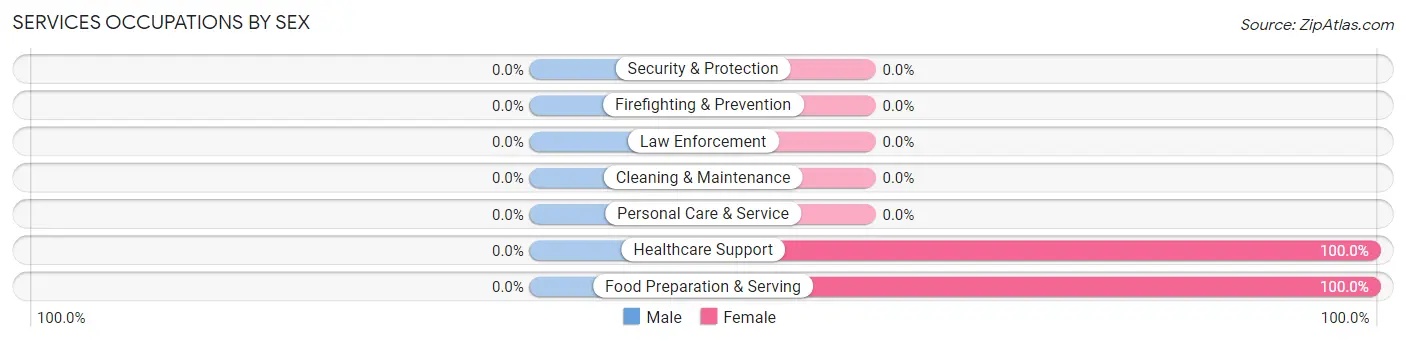
| Occupation | Male | Female |
| Healthcare Support | 0 (0.0%) | 15 (100.0%) |
| Security & Protection | 0 (0.0%) | 0 (0.0%) |
| Firefighting & Prevention | 0 (0.0%) | 0 (0.0%) |
| Law Enforcement | 0 (0.0%) | 0 (0.0%) |
| Food Preparation & Serving | 0 (0.0%) | 1 (100.0%) |
| Cleaning & Maintenance | 0 (0.0%) | 0 (0.0%) |
| Personal Care & Service | 0 (0.0%) | 0 (0.0%) |
| Total (Category) | 0 (0.0%) | 16 (100.0%) |
| Total (Overall) | 26 (41.3%) | 37 (58.7%) |
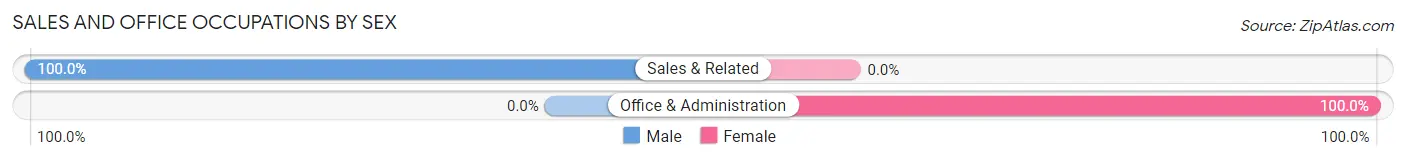
Sales and Office Occupations
The most common Sales and Office occupations in Davy are Office & Administration (17 | 27.0%), and Sales & Related (3 | 4.8%).
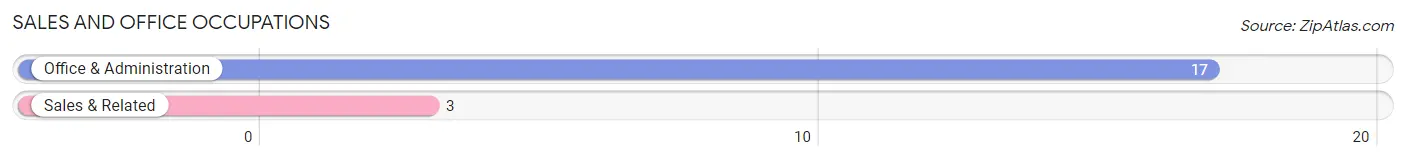
Sales and Office Occupations by Sex
| Occupation | Male | Female |
| Sales & Related | 3 (100.0%) | 0 (0.0%) |
| Office & Administration | 0 (0.0%) | 17 (100.0%) |
| Total (Category) | 3 (15.0%) | 17 (85.0%) |
| Total (Overall) | 26 (41.3%) | 37 (58.7%) |
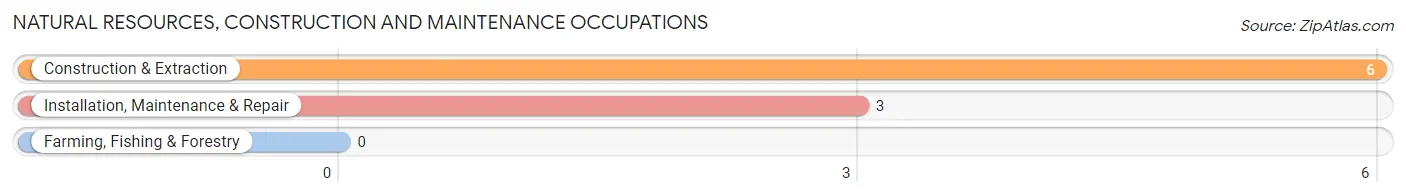
Natural Resources, Construction and Maintenance Occupations
The most common Natural Resources, Construction and Maintenance occupations in Davy are Construction & Extraction (6 | 9.5%), and Installation, Maintenance & Repair (3 | 4.8%).
Natural Resources, Construction and Maintenance Occupations by Sex
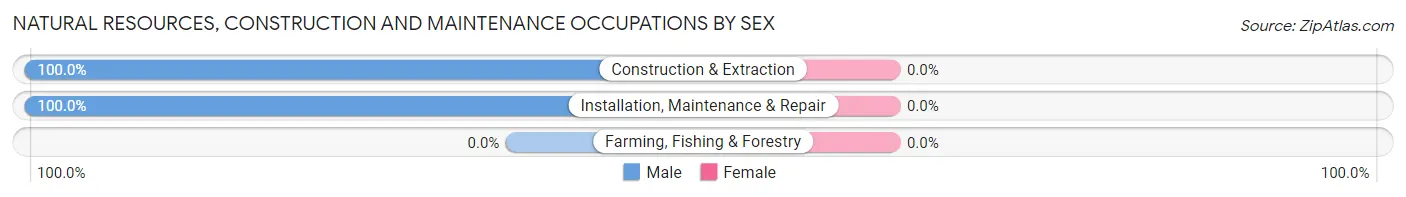
| Occupation | Male | Female |
| Farming, Fishing & Forestry | 0 (0.0%) | 0 (0.0%) |
| Construction & Extraction | 6 (100.0%) | 0 (0.0%) |
| Installation, Maintenance & Repair | 3 (100.0%) | 0 (0.0%) |
| Total (Category) | 9 (100.0%) | 0 (0.0%) |
| Total (Overall) | 26 (41.3%) | 37 (58.7%) |
Production, Transportation and Moving Occupations
The most common Production, Transportation and Moving occupations in Davy are Material Moving (8 | 12.7%), and Production (6 | 9.5%).
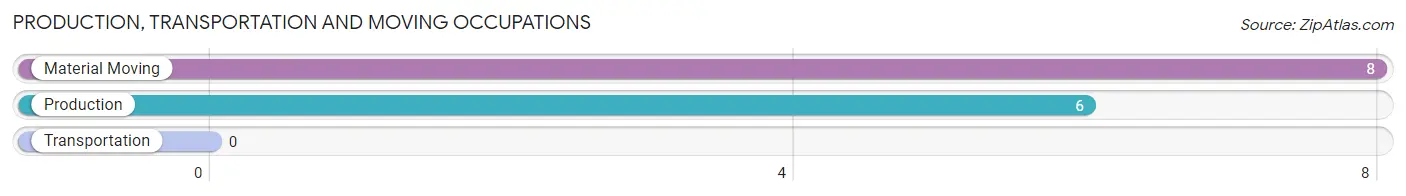
Production, Transportation and Moving Occupations by Sex
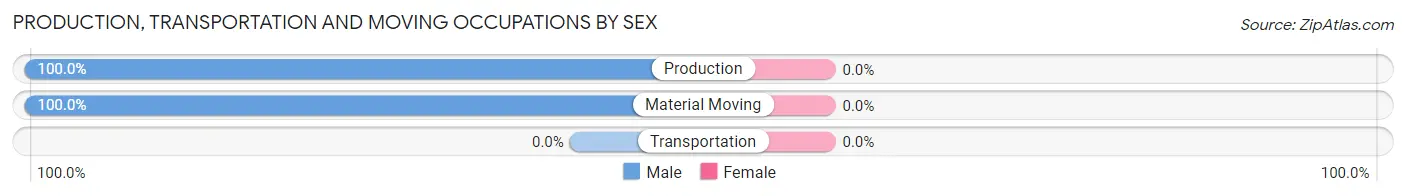
| Occupation | Male | Female |
| Production | 6 (100.0%) | 0 (0.0%) |
| Transportation | 0 (0.0%) | 0 (0.0%) |
| Material Moving | 8 (100.0%) | 0 (0.0%) |
| Total (Category) | 14 (100.0%) | 0 (0.0%) |
| Total (Overall) | 26 (41.3%) | 37 (58.7%) |
Employment Industries by Sex in Davy
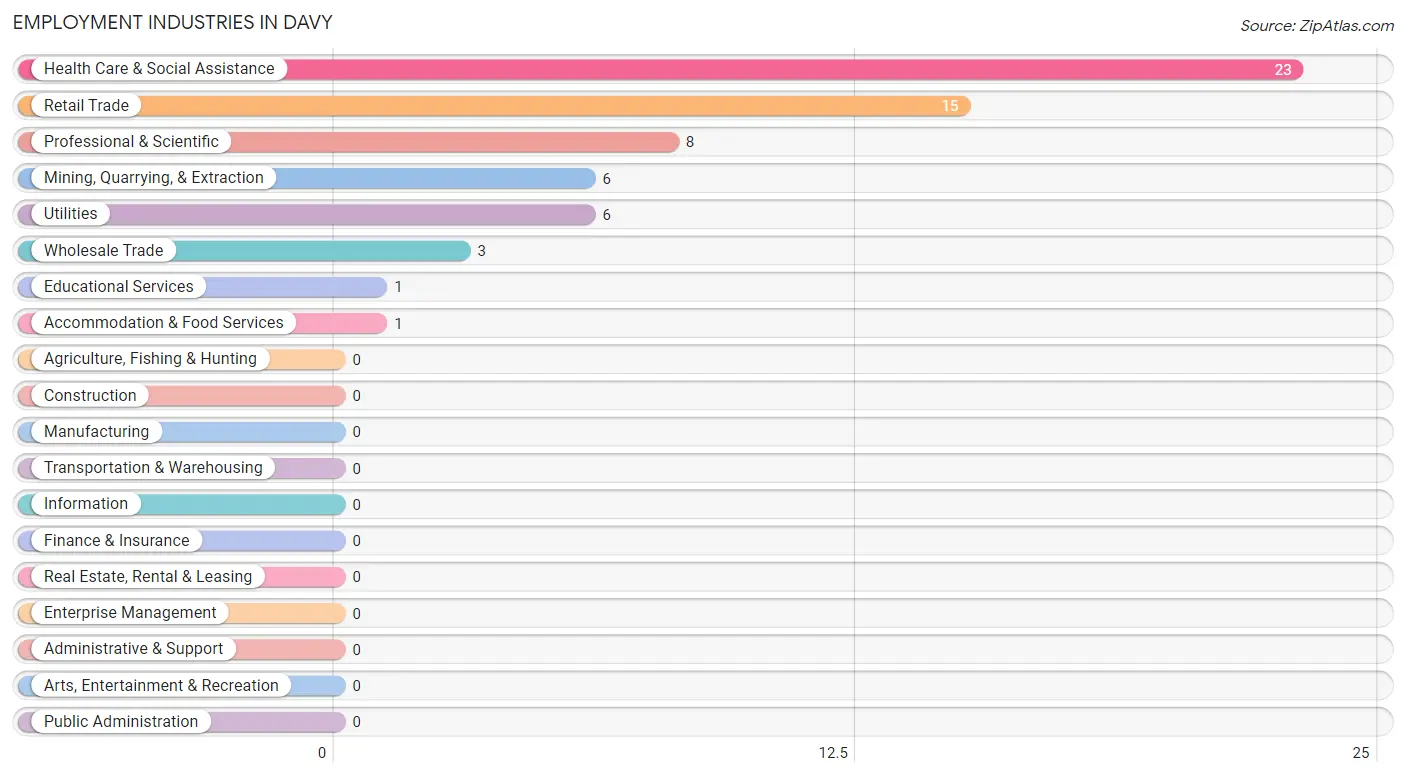
Employment Industries in Davy
The major employment industries in Davy include Health Care & Social Assistance (23 | 36.5%), Retail Trade (15 | 23.8%), Professional & Scientific (8 | 12.7%), Mining, Quarrying, & Extraction (6 | 9.5%), and Utilities (6 | 9.5%).
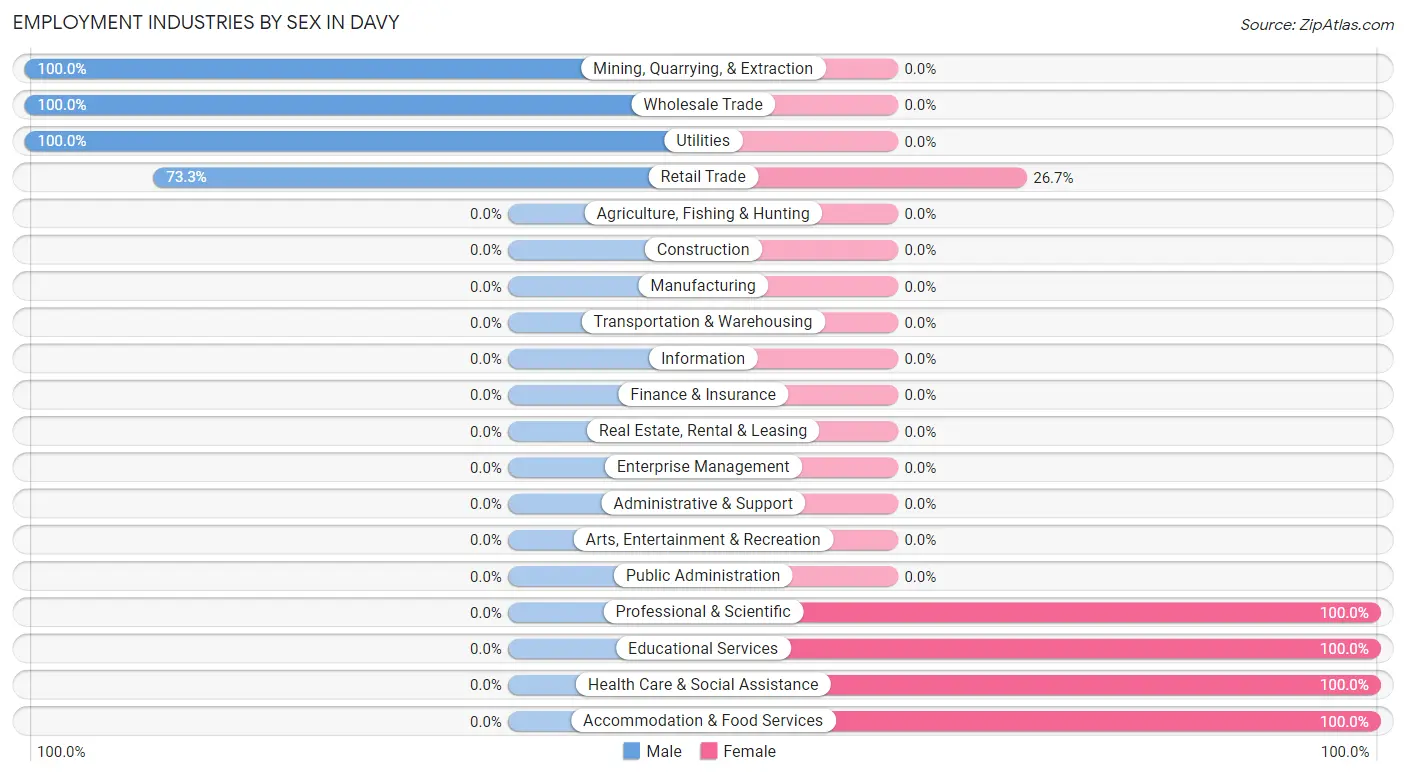
Employment Industries by Sex in Davy
The Davy industries that see more men than women are Mining, Quarrying, & Extraction (100.0%), Wholesale Trade (100.0%), and Utilities (100.0%), whereas the industries that tend to have a higher number of women are Professional & Scientific (100.0%), Educational Services (100.0%), and Health Care & Social Assistance (100.0%).
| Industry | Male | Female |
| Agriculture, Fishing & Hunting | 0 (0.0%) | 0 (0.0%) |
| Mining, Quarrying, & Extraction | 6 (100.0%) | 0 (0.0%) |
| Construction | 0 (0.0%) | 0 (0.0%) |
| Manufacturing | 0 (0.0%) | 0 (0.0%) |
| Wholesale Trade | 3 (100.0%) | 0 (0.0%) |
| Retail Trade | 11 (73.3%) | 4 (26.7%) |
| Transportation & Warehousing | 0 (0.0%) | 0 (0.0%) |
| Utilities | 6 (100.0%) | 0 (0.0%) |
| Information | 0 (0.0%) | 0 (0.0%) |
| Finance & Insurance | 0 (0.0%) | 0 (0.0%) |
| Real Estate, Rental & Leasing | 0 (0.0%) | 0 (0.0%) |
| Professional & Scientific | 0 (0.0%) | 8 (100.0%) |
| Enterprise Management | 0 (0.0%) | 0 (0.0%) |
| Administrative & Support | 0 (0.0%) | 0 (0.0%) |
| Educational Services | 0 (0.0%) | 1 (100.0%) |
| Health Care & Social Assistance | 0 (0.0%) | 23 (100.0%) |
| Arts, Entertainment & Recreation | 0 (0.0%) | 0 (0.0%) |
| Accommodation & Food Services | 0 (0.0%) | 1 (100.0%) |
| Public Administration | 0 (0.0%) | 0 (0.0%) |
| Total | 26 (41.3%) | 37 (58.7%) |
Education in Davy
School Enrollment in Davy
The most common levels of schooling among the 61 students in Davy are high school (28 | 45.9%), middle school (17 | 27.9%), and elementary school (13 | 21.3%).
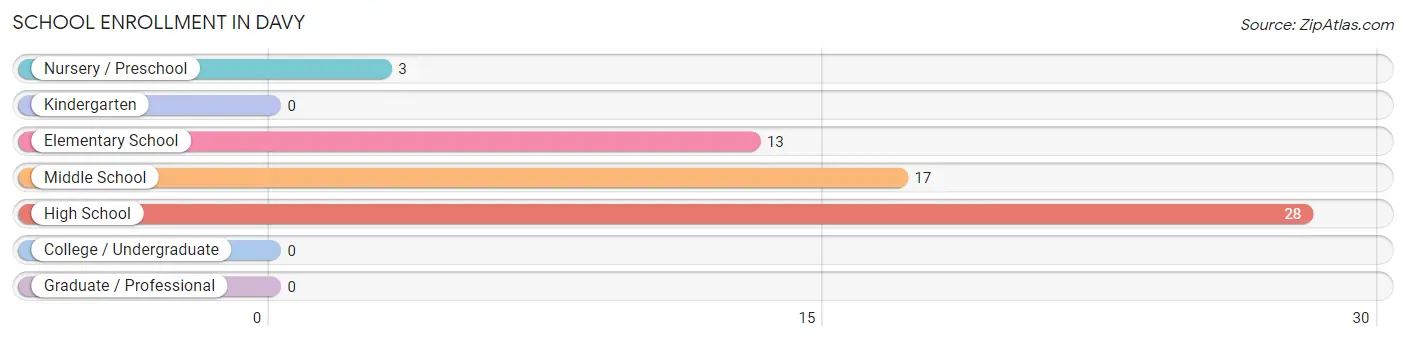
| School Level | # Students | % Students |
| Nursery / Preschool | 3 | 4.9% |
| Kindergarten | 0 | 0.0% |
| Elementary School | 13 | 21.3% |
| Middle School | 17 | 27.9% |
| High School | 28 | 45.9% |
| College / Undergraduate | 0 | 0.0% |
| Graduate / Professional | 0 | 0.0% |
| Total | 61 | 100.0% |
School Enrollment by Age by Funding Source in Davy
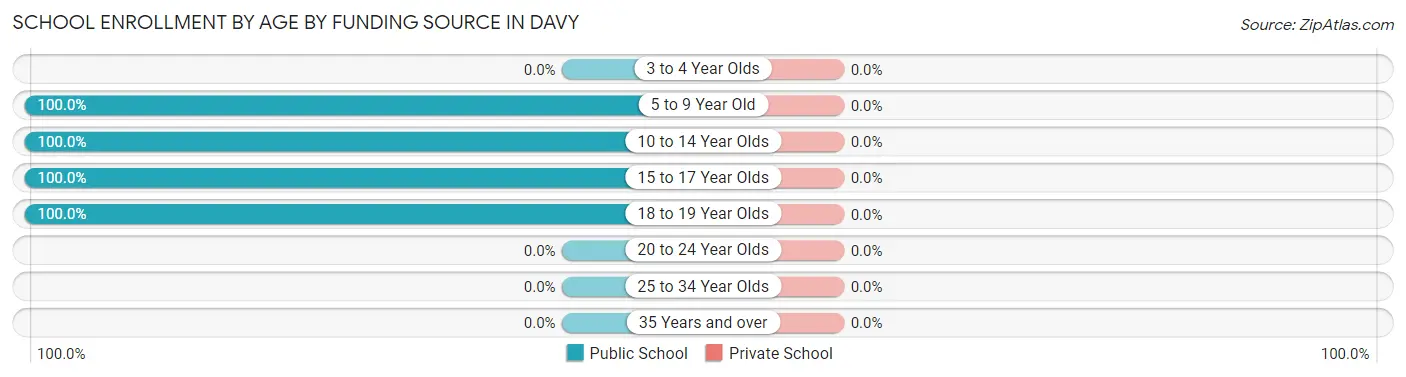
| Age Bracket | Public School | Private School |
| 3 to 4 Year Olds | 0 (0.0%) | 0 (0.0%) |
| 5 to 9 Year Old | 16 (100.0%) | 0 (0.0%) |
| 10 to 14 Year Olds | 22 (100.0%) | 0 (0.0%) |
| 15 to 17 Year Olds | 12 (100.0%) | 0 (0.0%) |
| 18 to 19 Year Olds | 11 (100.0%) | 0 (0.0%) |
| 20 to 24 Year Olds | 0 (0.0%) | 0 (0.0%) |
| 25 to 34 Year Olds | 0 (0.0%) | 0 (0.0%) |
| 35 Years and over | 0 (0.0%) | 0 (0.0%) |
| Total | 61 (100.0%) | 0 (0.0%) |
Educational Attainment by Field of Study in Davy
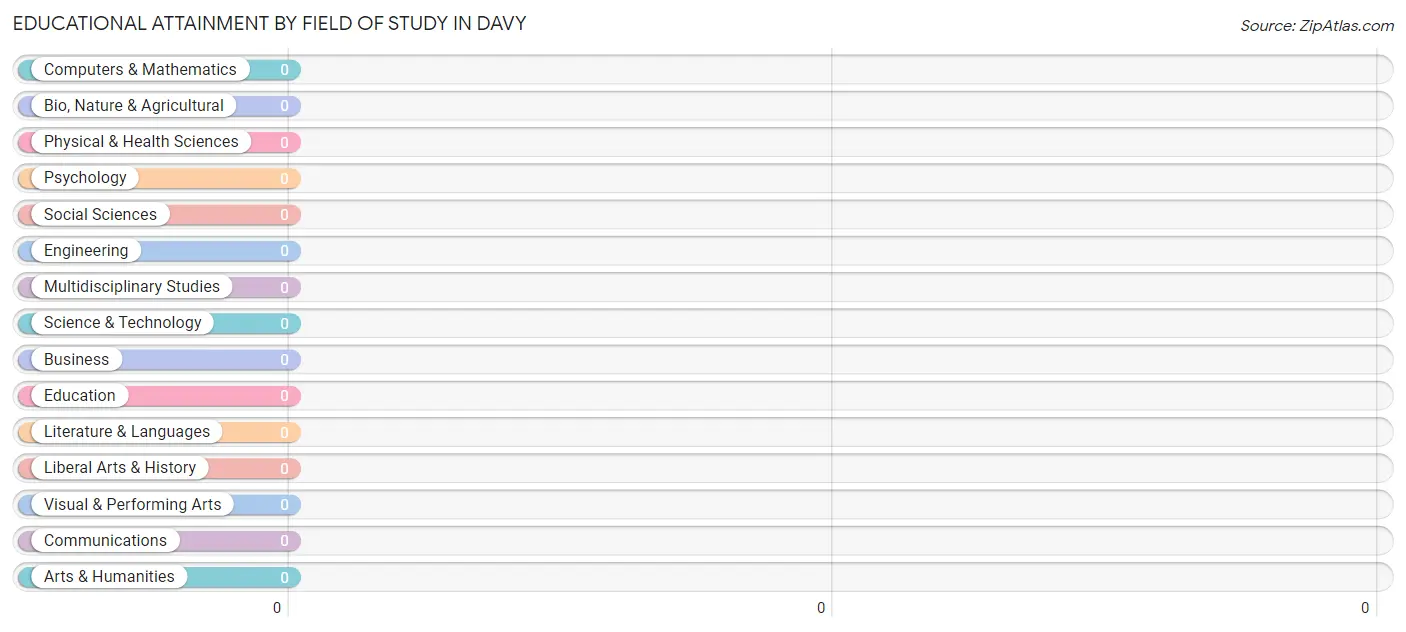
| Field of Study | # Graduates | % Graduates |
| Computers & Mathematics | 0 | 0.0% |
| Bio, Nature & Agricultural | 0 | 0.0% |
| Physical & Health Sciences | 0 | 0.0% |
| Psychology | 0 | 0.0% |
| Social Sciences | 0 | 0.0% |
| Engineering | 0 | 0.0% |
| Multidisciplinary Studies | 0 | 0.0% |
| Science & Technology | 0 | 0.0% |
| Business | 0 | 0.0% |
| Education | 0 | 0.0% |
| Literature & Languages | 0 | 0.0% |
| Liberal Arts & History | 0 | 0.0% |
| Visual & Performing Arts | 0 | 0.0% |
| Communications | 0 | 0.0% |
| Arts & Humanities | 0 | 0.0% |
| Total | 0 | 0.0% |
Transportation & Commute in Davy
Vehicle Availability by Sex in Davy
The most prevalent vehicle ownership categories in Davy are males with 1 vehicle (11, accounting for 42.3%) and females with 1 vehicle (21, making up 29.7%).
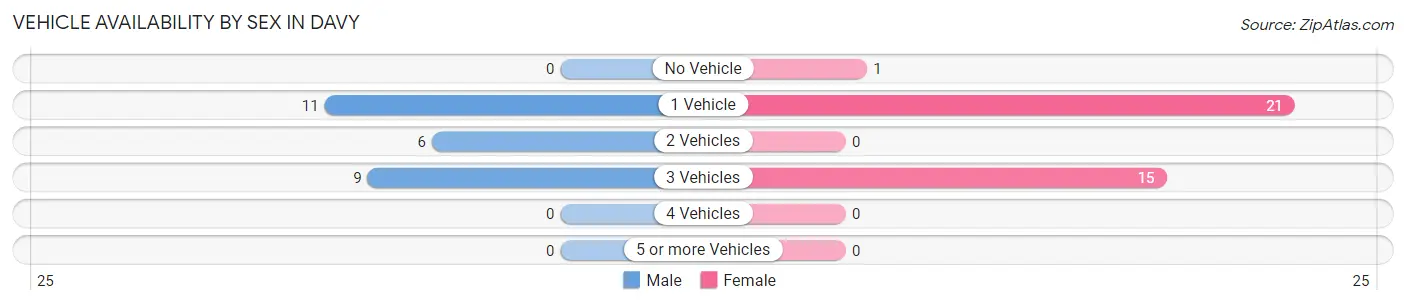
| Vehicles Available | Male | Female |
| No Vehicle | 0 (0.0%) | 1 (2.7%) |
| 1 Vehicle | 11 (42.3%) | 21 (56.8%) |
| 2 Vehicles | 6 (23.1%) | 0 (0.0%) |
| 3 Vehicles | 9 (34.6%) | 15 (40.5%) |
| 4 Vehicles | 0 (0.0%) | 0 (0.0%) |
| 5 or more Vehicles | 0 (0.0%) | 0 (0.0%) |
| Total | 26 (100.0%) | 37 (100.0%) |
Commute Time in Davy
The most frequently occuring commute durations in Davy are 25 to 29 minutes (23 commuters, 36.5%), less than 5 minutes (12 commuters, 19.1%), and 90 or more minutes (8 commuters, 12.7%).
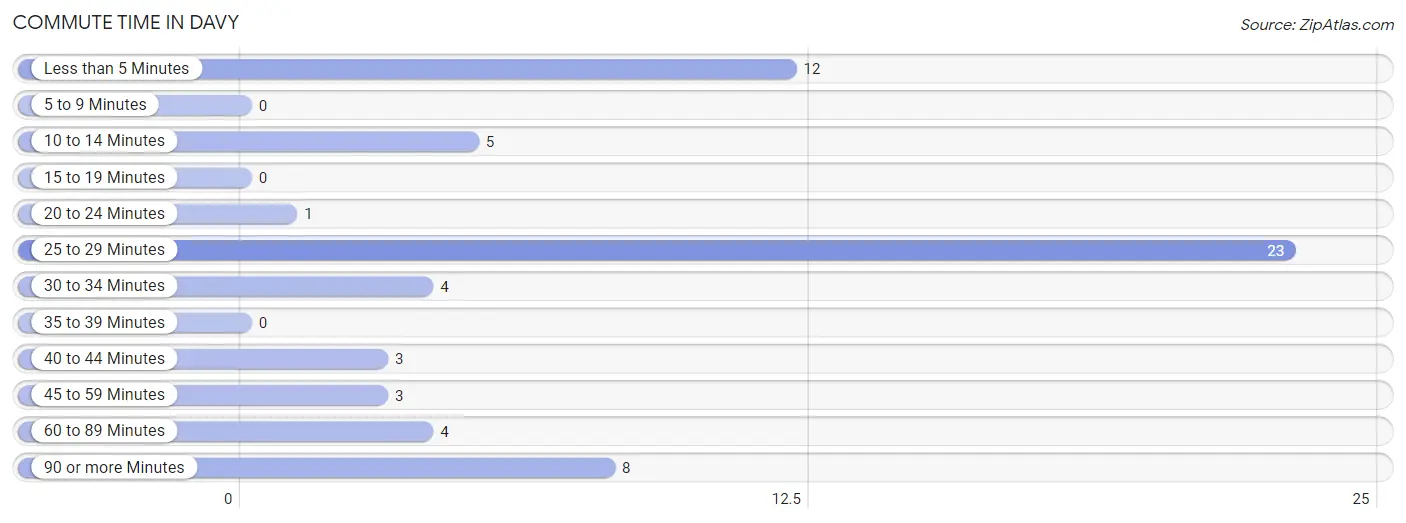
| Commute Time | # Commuters | % Commuters |
| Less than 5 Minutes | 12 | 19.1% |
| 5 to 9 Minutes | 0 | 0.0% |
| 10 to 14 Minutes | 5 | 7.9% |
| 15 to 19 Minutes | 0 | 0.0% |
| 20 to 24 Minutes | 1 | 1.6% |
| 25 to 29 Minutes | 23 | 36.5% |
| 30 to 34 Minutes | 4 | 6.4% |
| 35 to 39 Minutes | 0 | 0.0% |
| 40 to 44 Minutes | 3 | 4.8% |
| 45 to 59 Minutes | 3 | 4.8% |
| 60 to 89 Minutes | 4 | 6.4% |
| 90 or more Minutes | 8 | 12.7% |
Commute Time by Sex in Davy
The most common commute times in Davy are 25 to 29 minutes (11 commuters, 42.3%) for males and less than 5 minutes (12 commuters, 32.4%) for females.
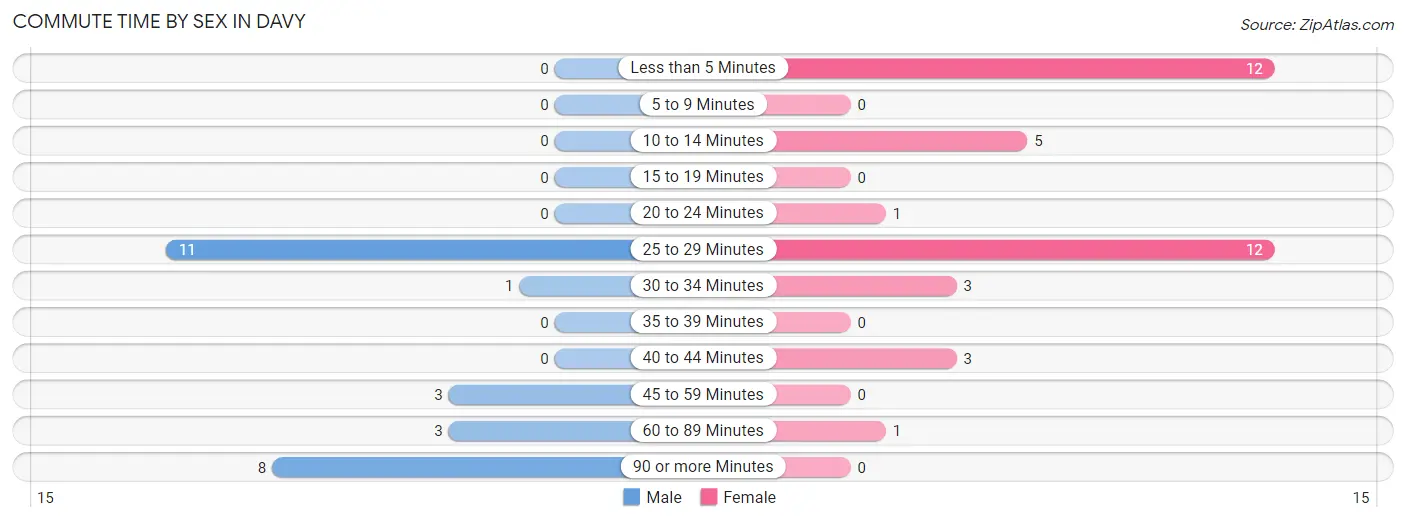
| Commute Time | Male | Female |
| Less than 5 Minutes | 0 (0.0%) | 12 (32.4%) |
| 5 to 9 Minutes | 0 (0.0%) | 0 (0.0%) |
| 10 to 14 Minutes | 0 (0.0%) | 5 (13.5%) |
| 15 to 19 Minutes | 0 (0.0%) | 0 (0.0%) |
| 20 to 24 Minutes | 0 (0.0%) | 1 (2.7%) |
| 25 to 29 Minutes | 11 (42.3%) | 12 (32.4%) |
| 30 to 34 Minutes | 1 (3.8%) | 3 (8.1%) |
| 35 to 39 Minutes | 0 (0.0%) | 0 (0.0%) |
| 40 to 44 Minutes | 0 (0.0%) | 3 (8.1%) |
| 45 to 59 Minutes | 3 (11.5%) | 0 (0.0%) |
| 60 to 89 Minutes | 3 (11.5%) | 1 (2.7%) |
| 90 or more Minutes | 8 (30.8%) | 0 (0.0%) |
Time of Departure to Work by Sex in Davy
The most frequent times of departure to work in Davy are 12:00 AM to 4:59 AM (8, 30.8%) for males and 12:00 PM to 3:59 PM (12, 32.4%) for females.
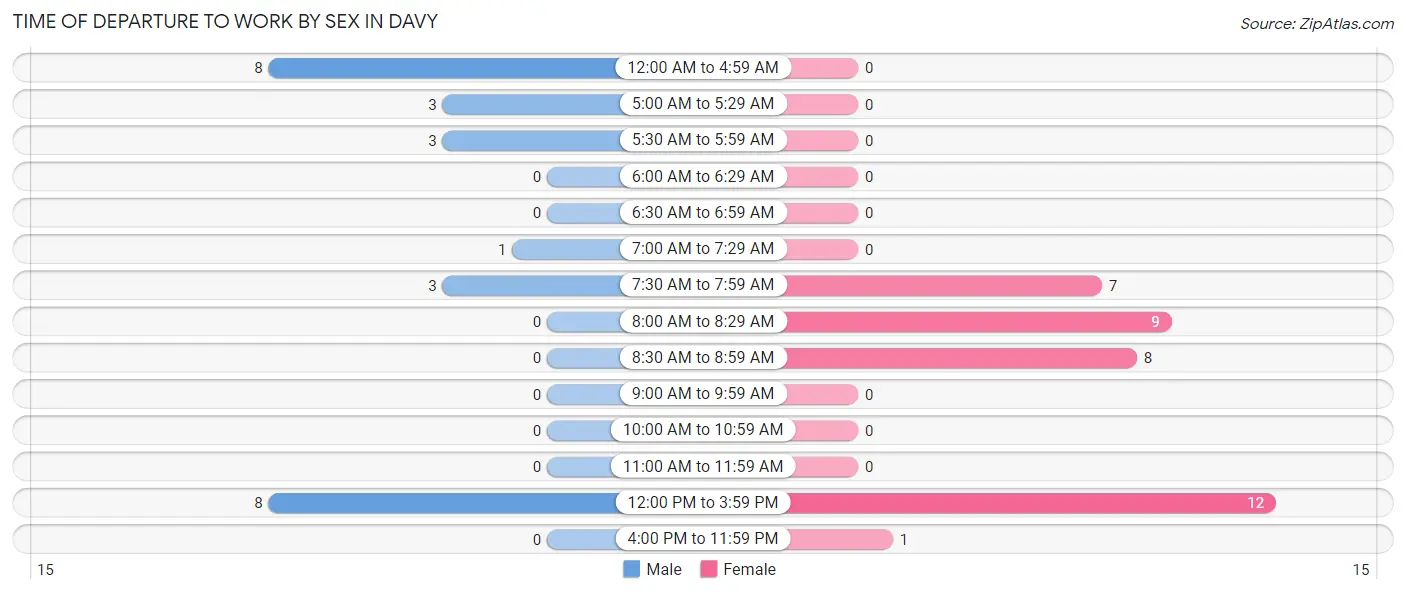
| Time of Departure | Male | Female |
| 12:00 AM to 4:59 AM | 8 (30.8%) | 0 (0.0%) |
| 5:00 AM to 5:29 AM | 3 (11.5%) | 0 (0.0%) |
| 5:30 AM to 5:59 AM | 3 (11.5%) | 0 (0.0%) |
| 6:00 AM to 6:29 AM | 0 (0.0%) | 0 (0.0%) |
| 6:30 AM to 6:59 AM | 0 (0.0%) | 0 (0.0%) |
| 7:00 AM to 7:29 AM | 1 (3.8%) | 0 (0.0%) |
| 7:30 AM to 7:59 AM | 3 (11.5%) | 7 (18.9%) |
| 8:00 AM to 8:29 AM | 0 (0.0%) | 9 (24.3%) |
| 8:30 AM to 8:59 AM | 0 (0.0%) | 8 (21.6%) |
| 9:00 AM to 9:59 AM | 0 (0.0%) | 0 (0.0%) |
| 10:00 AM to 10:59 AM | 0 (0.0%) | 0 (0.0%) |
| 11:00 AM to 11:59 AM | 0 (0.0%) | 0 (0.0%) |
| 12:00 PM to 3:59 PM | 8 (30.8%) | 12 (32.4%) |
| 4:00 PM to 11:59 PM | 0 (0.0%) | 1 (2.7%) |
| Total | 26 (100.0%) | 37 (100.0%) |
Housing Occupancy in Davy
Occupancy by Ownership in Davy
Of the total 86 dwellings in Davy, owner-occupied units account for 78 (90.7%), while renter-occupied units make up 8 (9.3%).
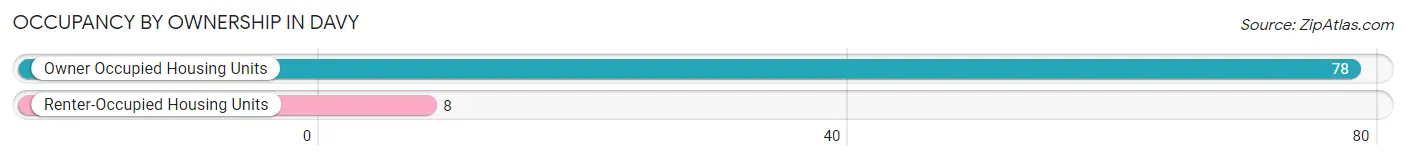
| Occupancy | # Housing Units | % Housing Units |
| Owner Occupied Housing Units | 78 | 90.7% |
| Renter-Occupied Housing Units | 8 | 9.3% |
| Total Occupied Housing Units | 86 | 100.0% |
Occupancy by Household Size in Davy
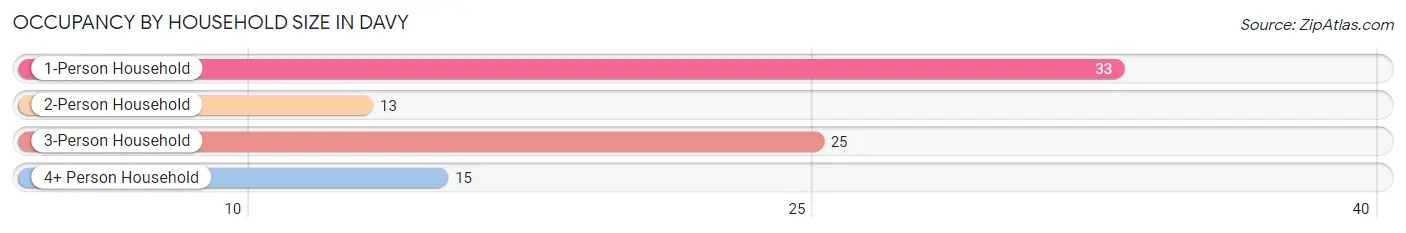
| Household Size | # Housing Units | % Housing Units |
| 1-Person Household | 33 | 38.4% |
| 2-Person Household | 13 | 15.1% |
| 3-Person Household | 25 | 29.1% |
| 4+ Person Household | 15 | 17.4% |
| Total Housing Units | 86 | 100.0% |
Occupancy by Ownership by Household Size in Davy
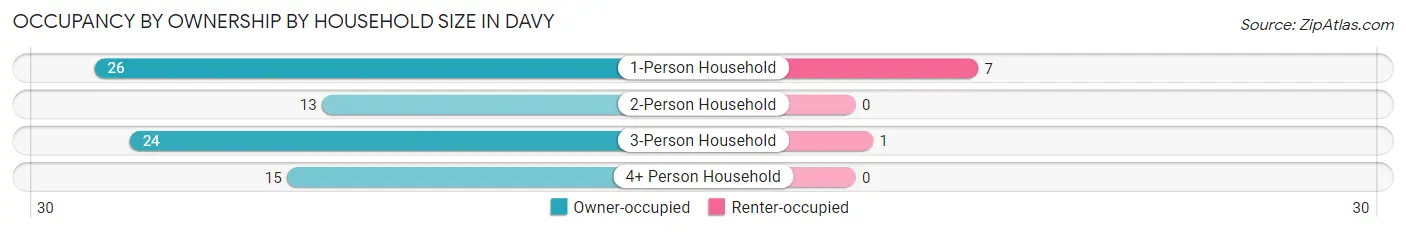
| Household Size | Owner-occupied | Renter-occupied |
| 1-Person Household | 26 (78.8%) | 7 (21.2%) |
| 2-Person Household | 13 (100.0%) | 0 (0.0%) |
| 3-Person Household | 24 (96.0%) | 1 (4.0%) |
| 4+ Person Household | 15 (100.0%) | 0 (0.0%) |
| Total Housing Units | 78 (90.7%) | 8 (9.3%) |
Occupancy by Educational Attainment in Davy
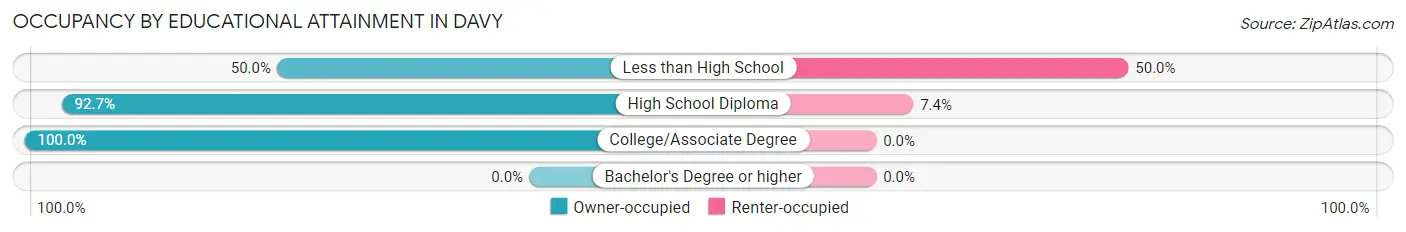
| Household Size | Owner-occupied | Renter-occupied |
| Less than High School | 3 (50.0%) | 3 (50.0%) |
| High School Diploma | 63 (92.6%) | 5 (7.3%) |
| College/Associate Degree | 12 (100.0%) | 0 (0.0%) |
| Bachelor's Degree or higher | 0 (0.0%) | 0 (0.0%) |
Occupancy by Age of Householder in Davy
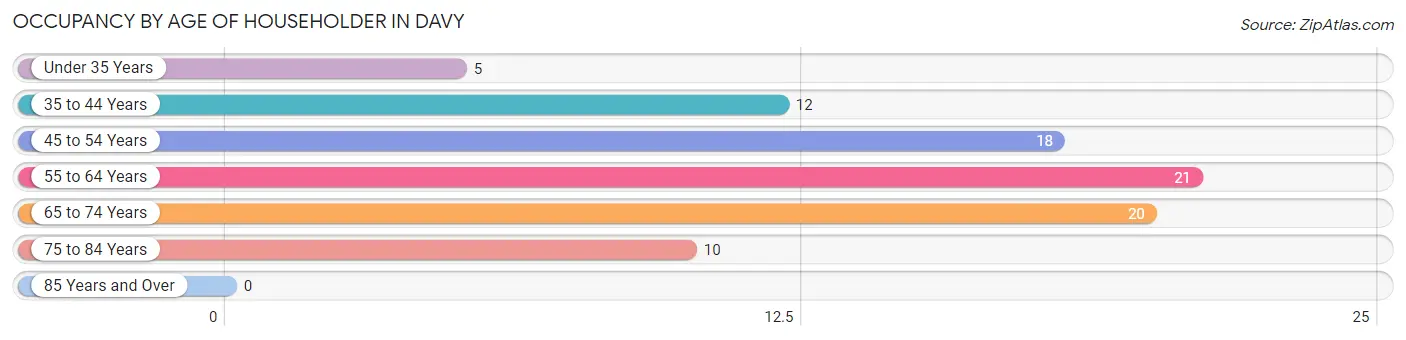
| Age Bracket | # Households | % Households |
| Under 35 Years | 5 | 5.8% |
| 35 to 44 Years | 12 | 14.0% |
| 45 to 54 Years | 18 | 20.9% |
| 55 to 64 Years | 21 | 24.4% |
| 65 to 74 Years | 20 | 23.3% |
| 75 to 84 Years | 10 | 11.6% |
| 85 Years and Over | 0 | 0.0% |
| Total | 86 | 100.0% |
Housing Finances in Davy
Median Income by Occupancy in Davy
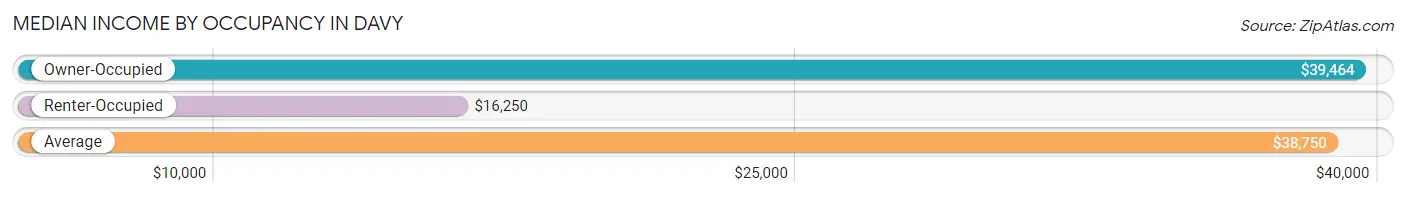
| Occupancy Type | # Households | Median Income |
| Owner-Occupied | 78 (90.7%) | $39,464 |
| Renter-Occupied | 8 (9.3%) | $16,250 |
| Average | 86 (100.0%) | $38,750 |
Occupancy by Householder Income Bracket in Davy
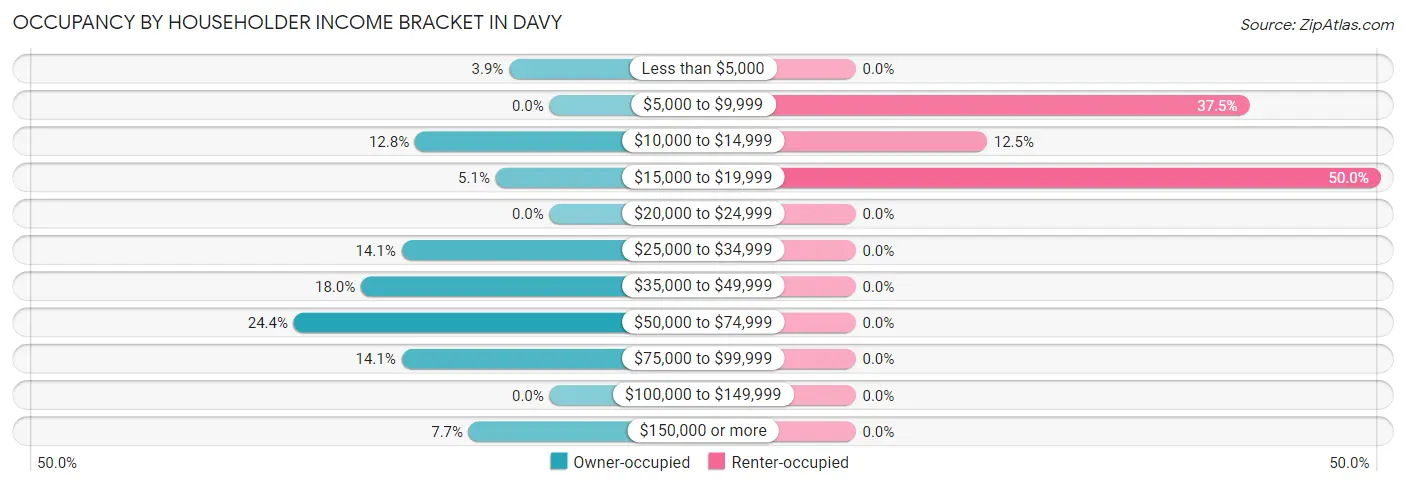
| Income Bracket | Owner-occupied | Renter-occupied |
| Less than $5,000 | 3 (3.8%) | 0 (0.0%) |
| $5,000 to $9,999 | 0 (0.0%) | 3 (37.5%) |
| $10,000 to $14,999 | 10 (12.8%) | 1 (12.5%) |
| $15,000 to $19,999 | 4 (5.1%) | 4 (50.0%) |
| $20,000 to $24,999 | 0 (0.0%) | 0 (0.0%) |
| $25,000 to $34,999 | 11 (14.1%) | 0 (0.0%) |
| $35,000 to $49,999 | 14 (17.9%) | 0 (0.0%) |
| $50,000 to $74,999 | 19 (24.4%) | 0 (0.0%) |
| $75,000 to $99,999 | 11 (14.1%) | 0 (0.0%) |
| $100,000 to $149,999 | 0 (0.0%) | 0 (0.0%) |
| $150,000 or more | 6 (7.7%) | 0 (0.0%) |
| Total | 78 (100.0%) | 8 (100.0%) |
Monthly Housing Cost Tiers in Davy
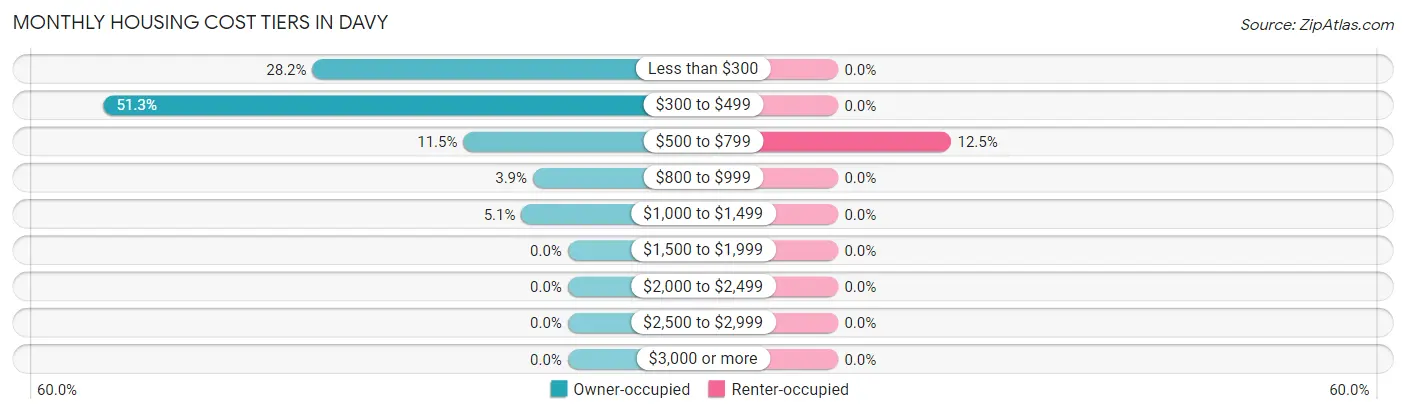
| Monthly Cost | Owner-occupied | Renter-occupied |
| Less than $300 | 22 (28.2%) | 0 (0.0%) |
| $300 to $499 | 40 (51.3%) | 0 (0.0%) |
| $500 to $799 | 9 (11.5%) | 1 (12.5%) |
| $800 to $999 | 3 (3.8%) | 0 (0.0%) |
| $1,000 to $1,499 | 4 (5.1%) | 0 (0.0%) |
| $1,500 to $1,999 | 0 (0.0%) | 0 (0.0%) |
| $2,000 to $2,499 | 0 (0.0%) | 0 (0.0%) |
| $2,500 to $2,999 | 0 (0.0%) | 0 (0.0%) |
| $3,000 or more | 0 (0.0%) | 0 (0.0%) |
| Total | 78 (100.0%) | 8 (100.0%) |
Physical Housing Characteristics in Davy
Housing Structures in Davy
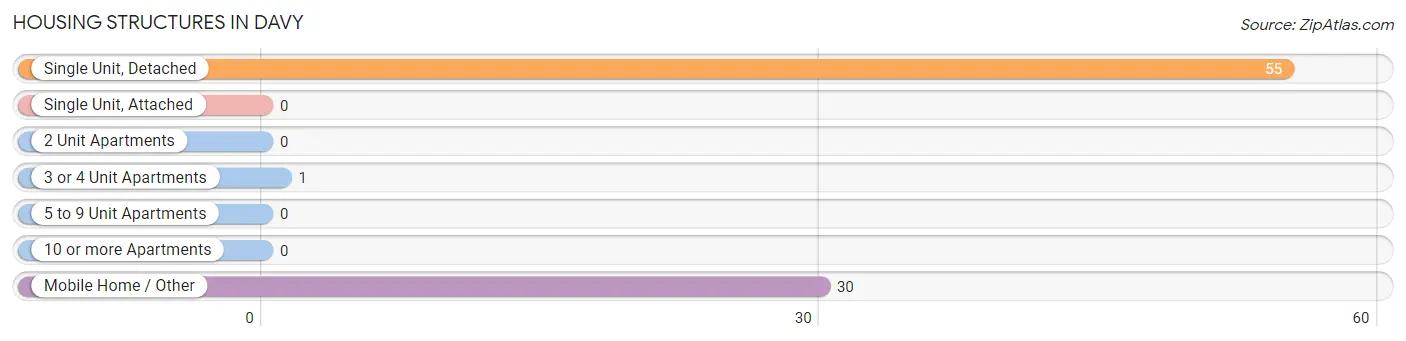
| Structure Type | # Housing Units | % Housing Units |
| Single Unit, Detached | 55 | 63.9% |
| Single Unit, Attached | 0 | 0.0% |
| 2 Unit Apartments | 0 | 0.0% |
| 3 or 4 Unit Apartments | 1 | 1.2% |
| 5 to 9 Unit Apartments | 0 | 0.0% |
| 10 or more Apartments | 0 | 0.0% |
| Mobile Home / Other | 30 | 34.9% |
| Total | 86 | 100.0% |
Housing Structures by Occupancy in Davy
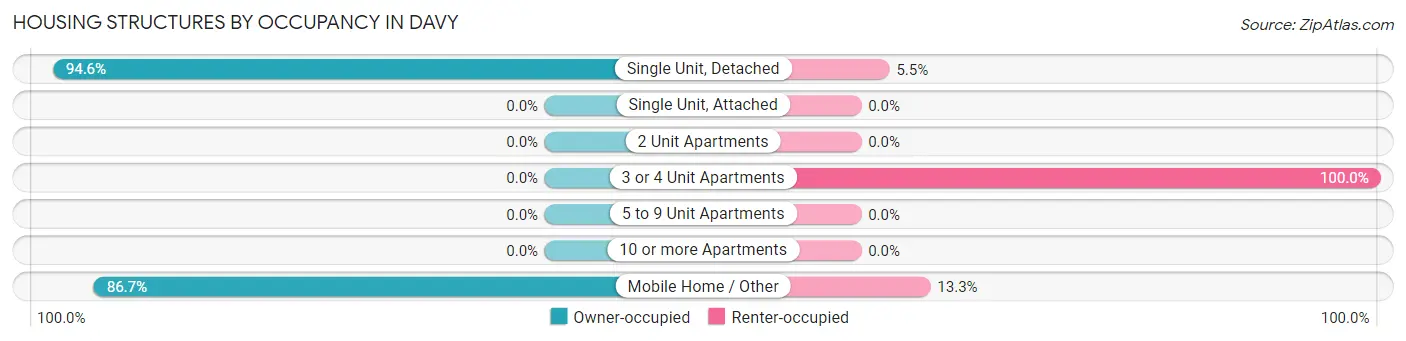
| Structure Type | Owner-occupied | Renter-occupied |
| Single Unit, Detached | 52 (94.6%) | 3 (5.4%) |
| Single Unit, Attached | 0 (0.0%) | 0 (0.0%) |
| 2 Unit Apartments | 0 (0.0%) | 0 (0.0%) |
| 3 or 4 Unit Apartments | 0 (0.0%) | 1 (100.0%) |
| 5 to 9 Unit Apartments | 0 (0.0%) | 0 (0.0%) |
| 10 or more Apartments | 0 (0.0%) | 0 (0.0%) |
| Mobile Home / Other | 26 (86.7%) | 4 (13.3%) |
| Total | 78 (90.7%) | 8 (9.3%) |
Housing Structures by Number of Rooms in Davy
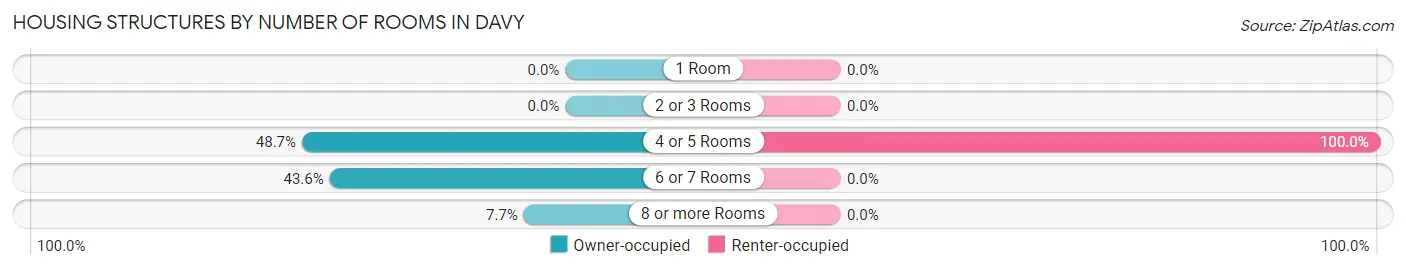
| Number of Rooms | Owner-occupied | Renter-occupied |
| 1 Room | 0 (0.0%) | 0 (0.0%) |
| 2 or 3 Rooms | 0 (0.0%) | 0 (0.0%) |
| 4 or 5 Rooms | 38 (48.7%) | 8 (100.0%) |
| 6 or 7 Rooms | 34 (43.6%) | 0 (0.0%) |
| 8 or more Rooms | 6 (7.7%) | 0 (0.0%) |
| Total | 78 (100.0%) | 8 (100.0%) |
Housing Structure by Heating Type in Davy
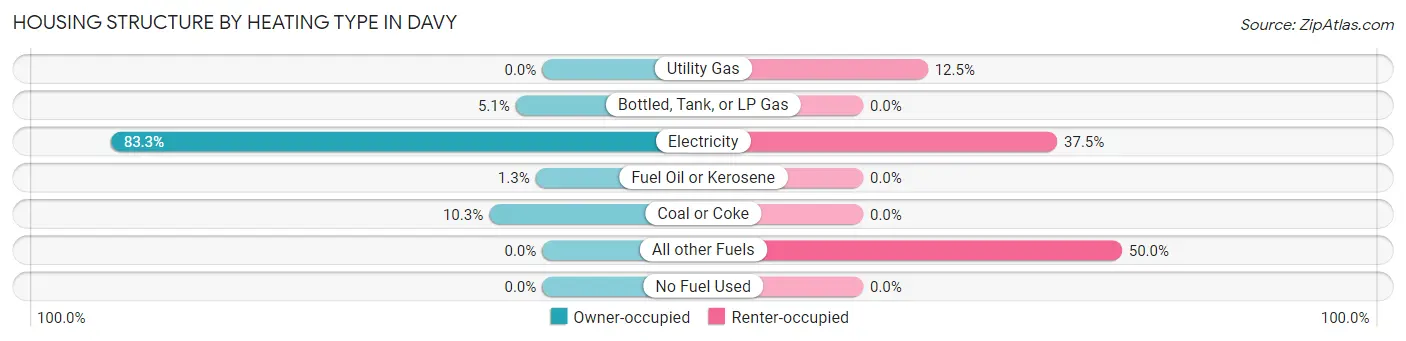
| Heating Type | Owner-occupied | Renter-occupied |
| Utility Gas | 0 (0.0%) | 1 (12.5%) |
| Bottled, Tank, or LP Gas | 4 (5.1%) | 0 (0.0%) |
| Electricity | 65 (83.3%) | 3 (37.5%) |
| Fuel Oil or Kerosene | 1 (1.3%) | 0 (0.0%) |
| Coal or Coke | 8 (10.3%) | 0 (0.0%) |
| All other Fuels | 0 (0.0%) | 4 (50.0%) |
| No Fuel Used | 0 (0.0%) | 0 (0.0%) |
| Total | 78 (100.0%) | 8 (100.0%) |
Household Vehicle Usage in Davy
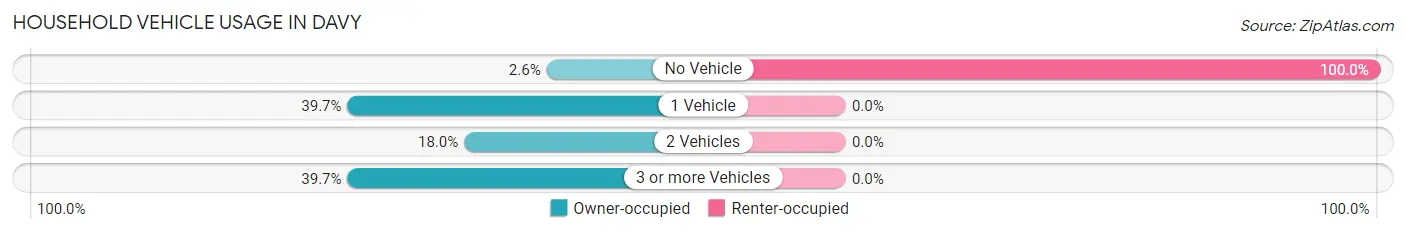
| Vehicles per Household | Owner-occupied | Renter-occupied |
| No Vehicle | 2 (2.6%) | 8 (100.0%) |
| 1 Vehicle | 31 (39.7%) | 0 (0.0%) |
| 2 Vehicles | 14 (17.9%) | 0 (0.0%) |
| 3 or more Vehicles | 31 (39.7%) | 0 (0.0%) |
| Total | 78 (100.0%) | 8 (100.0%) |
Real Estate & Mortgages in Davy
Real Estate and Mortgage Overview in Davy
| Characteristic | Without Mortgage | With Mortgage |
| Housing Units | 74 | 4 |
| Median Property Value | $24,500 | $0 |
| Median Household Income | $39,821 | $0 |
| Monthly Housing Costs | $336 | $0 |
| Real Estate Taxes | $219 | $0 |
Property Value by Mortgage Status in Davy
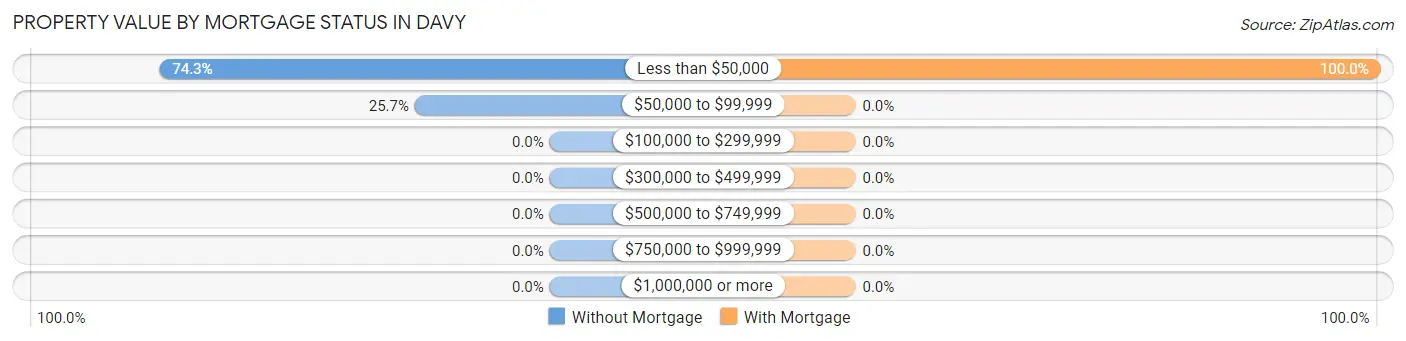
| Property Value | Without Mortgage | With Mortgage |
| Less than $50,000 | 55 (74.3%) | 4 (100.0%) |
| $50,000 to $99,999 | 19 (25.7%) | 0 (0.0%) |
| $100,000 to $299,999 | 0 (0.0%) | 0 (0.0%) |
| $300,000 to $499,999 | 0 (0.0%) | 0 (0.0%) |
| $500,000 to $749,999 | 0 (0.0%) | 0 (0.0%) |
| $750,000 to $999,999 | 0 (0.0%) | 0 (0.0%) |
| $1,000,000 or more | 0 (0.0%) | 0 (0.0%) |
| Total | 74 (100.0%) | 4 (100.0%) |
Household Income by Mortgage Status in Davy
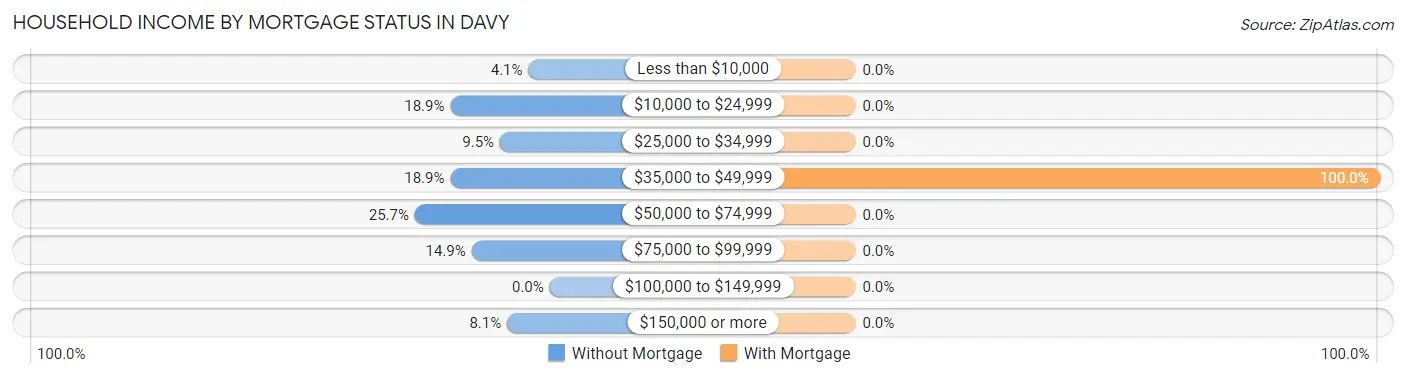
| Household Income | Without Mortgage | With Mortgage |
| Less than $10,000 | 3 (4.1%) | 0 (0.0%) |
| $10,000 to $24,999 | 14 (18.9%) | 0 (0.0%) |
| $25,000 to $34,999 | 7 (9.5%) | 0 (0.0%) |
| $35,000 to $49,999 | 14 (18.9%) | 4 (100.0%) |
| $50,000 to $74,999 | 19 (25.7%) | 0 (0.0%) |
| $75,000 to $99,999 | 11 (14.9%) | 0 (0.0%) |
| $100,000 to $149,999 | 0 (0.0%) | 0 (0.0%) |
| $150,000 or more | 6 (8.1%) | 0 (0.0%) |
| Total | 74 (100.0%) | 4 (100.0%) |
Property Value to Household Income Ratio in Davy
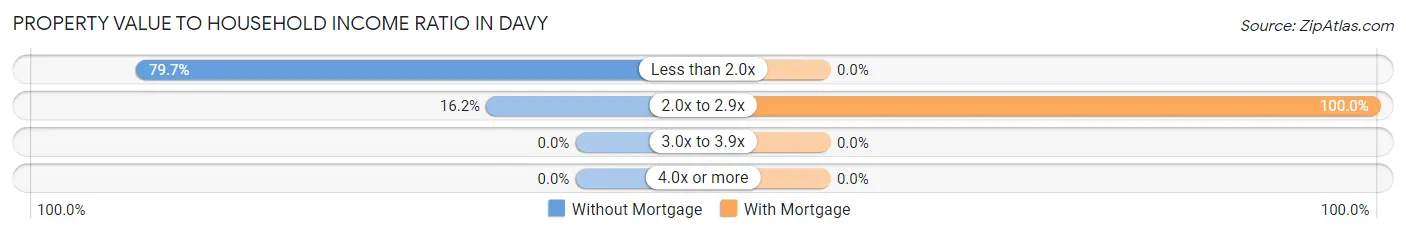
| Value-to-Income Ratio | Without Mortgage | With Mortgage |
| Less than 2.0x | 59 (79.7%) | 0 (0.0%) |
| 2.0x to 2.9x | 12 (16.2%) | 4 (100.0%) |
| 3.0x to 3.9x | 0 (0.0%) | 0 (0.0%) |
| 4.0x or more | 0 (0.0%) | 0 (0.0%) |
| Total | 74 (100.0%) | 4 (100.0%) |
Real Estate Taxes by Mortgage Status in Davy
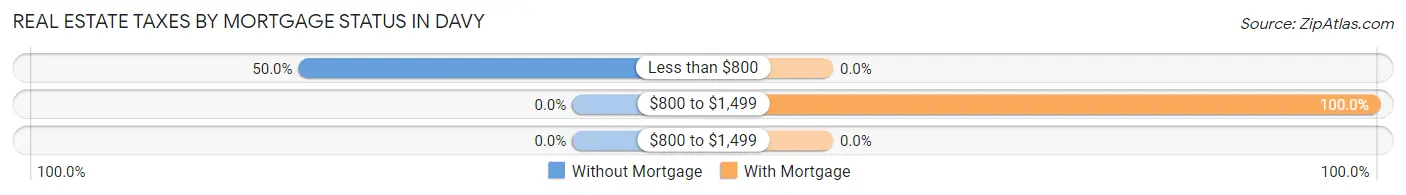
| Property Taxes | Without Mortgage | With Mortgage |
| Less than $800 | 37 (50.0%) | 0 (0.0%) |
| $800 to $1,499 | 0 (0.0%) | 4 (100.0%) |
| $800 to $1,499 | 0 (0.0%) | 0 (0.0%) |
| Total | 74 (100.0%) | 4 (100.0%) |
Health & Disability in Davy
Health Insurance Coverage by Age in Davy
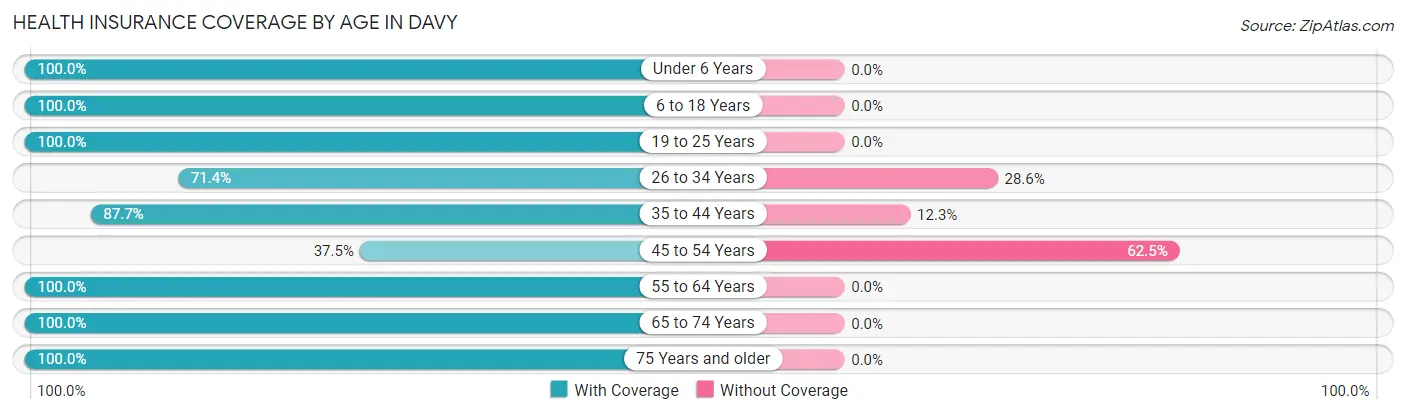
| Age Bracket | With Coverage | Without Coverage |
| Under 6 Years | 21 (100.0%) | 0 (0.0%) |
| 6 to 18 Years | 76 (100.0%) | 0 (0.0%) |
| 19 to 25 Years | 5 (100.0%) | 0 (0.0%) |
| 26 to 34 Years | 15 (71.4%) | 6 (28.6%) |
| 35 to 44 Years | 50 (87.7%) | 7 (12.3%) |
| 45 to 54 Years | 9 (37.5%) | 15 (62.5%) |
| 55 to 64 Years | 32 (100.0%) | 0 (0.0%) |
| 65 to 74 Years | 20 (100.0%) | 0 (0.0%) |
| 75 Years and older | 15 (100.0%) | 0 (0.0%) |
| Total | 243 (89.7%) | 28 (10.3%) |
Health Insurance Coverage by Citizenship Status in Davy
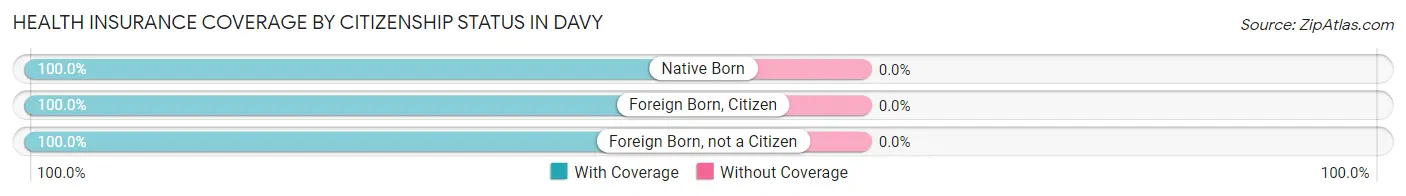
| Citizenship Status | With Coverage | Without Coverage |
| Native Born | 21 (100.0%) | 0 (0.0%) |
| Foreign Born, Citizen | 76 (100.0%) | 0 (0.0%) |
| Foreign Born, not a Citizen | 5 (100.0%) | 0 (0.0%) |
Health Insurance Coverage by Household Income in Davy
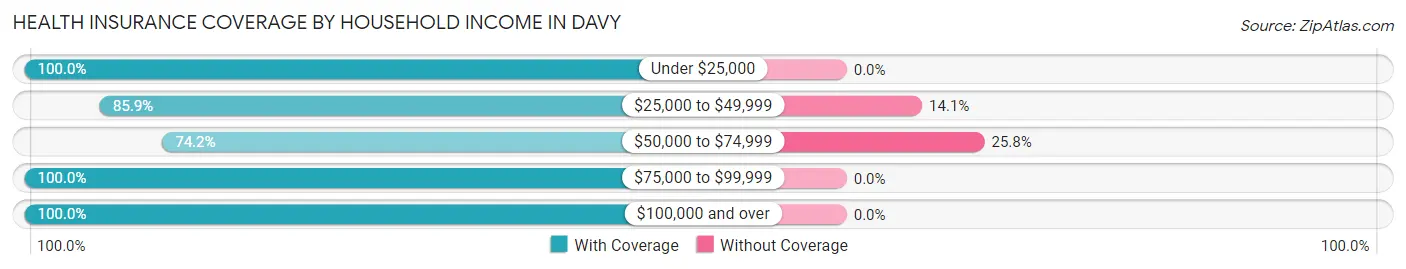
| Household Income | With Coverage | Without Coverage |
| Under $25,000 | 28 (100.0%) | 0 (0.0%) |
| $25,000 to $49,999 | 73 (85.9%) | 12 (14.1%) |
| $50,000 to $74,999 | 46 (74.2%) | 16 (25.8%) |
| $75,000 to $99,999 | 82 (100.0%) | 0 (0.0%) |
| $100,000 and over | 14 (100.0%) | 0 (0.0%) |
Public vs Private Health Insurance Coverage by Age in Davy
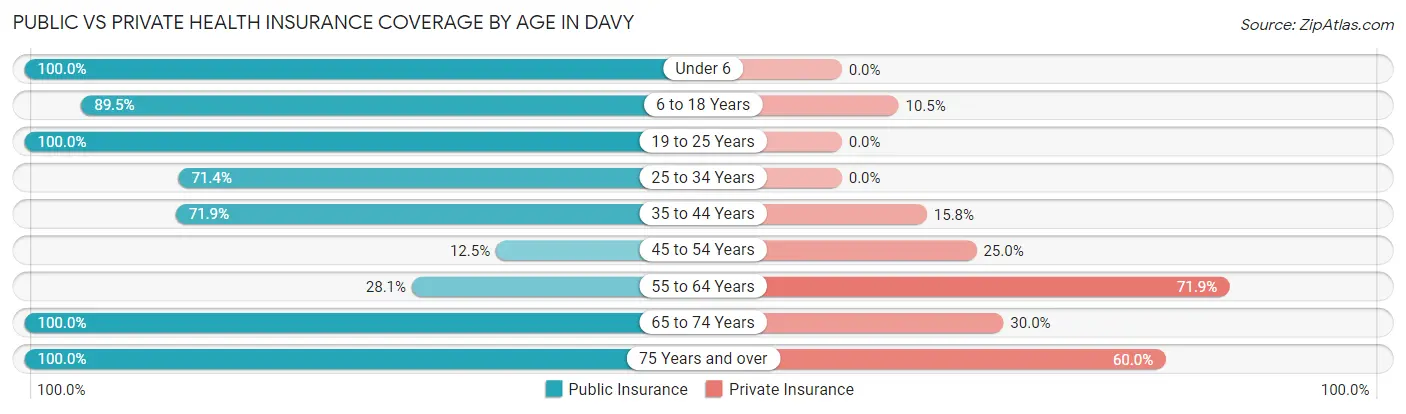
| Age Bracket | Public Insurance | Private Insurance |
| Under 6 | 21 (100.0%) | 0 (0.0%) |
| 6 to 18 Years | 68 (89.5%) | 8 (10.5%) |
| 19 to 25 Years | 5 (100.0%) | 0 (0.0%) |
| 25 to 34 Years | 15 (71.4%) | 0 (0.0%) |
| 35 to 44 Years | 41 (71.9%) | 9 (15.8%) |
| 45 to 54 Years | 3 (12.5%) | 6 (25.0%) |
| 55 to 64 Years | 9 (28.1%) | 23 (71.9%) |
| 65 to 74 Years | 20 (100.0%) | 6 (30.0%) |
| 75 Years and over | 15 (100.0%) | 9 (60.0%) |
| Total | 197 (72.7%) | 61 (22.5%) |
Disability Status by Sex by Age in Davy
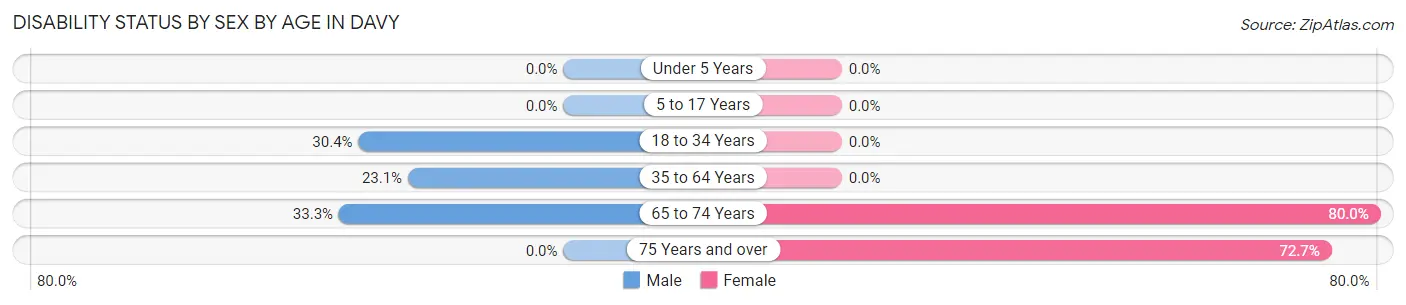
| Age Bracket | Male | Female |
| Under 5 Years | 0 (0.0%) | 0 (0.0%) |
| 5 to 17 Years | 0 (0.0%) | 0 (0.0%) |
| 18 to 34 Years | 7 (30.4%) | 0 (0.0%) |
| 35 to 64 Years | 6 (23.1%) | 0 (0.0%) |
| 65 to 74 Years | 5 (33.3%) | 4 (80.0%) |
| 75 Years and over | 0 (0.0%) | 8 (72.7%) |
Disability Class by Sex by Age in Davy
Disability Class: Hearing Difficulty
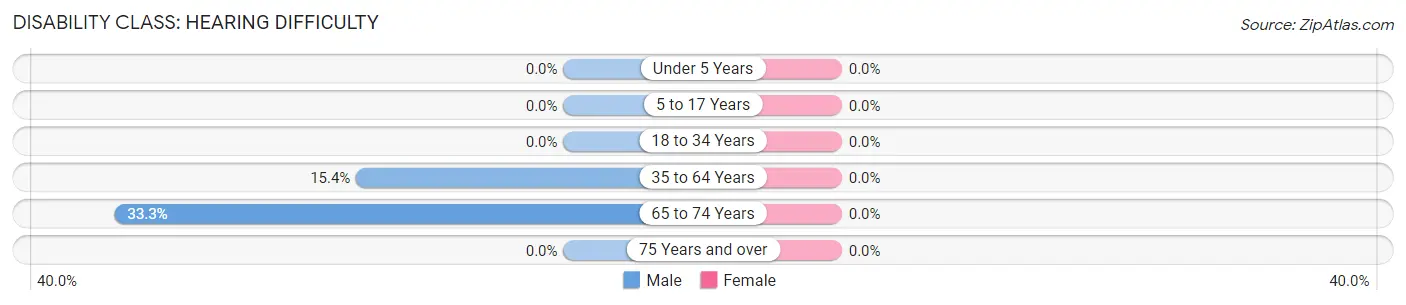
| Age Bracket | Male | Female |
| Under 5 Years | 0 (0.0%) | 0 (0.0%) |
| 5 to 17 Years | 0 (0.0%) | 0 (0.0%) |
| 18 to 34 Years | 0 (0.0%) | 0 (0.0%) |
| 35 to 64 Years | 4 (15.4%) | 0 (0.0%) |
| 65 to 74 Years | 5 (33.3%) | 0 (0.0%) |
| 75 Years and over | 0 (0.0%) | 0 (0.0%) |
Disability Class: Vision Difficulty
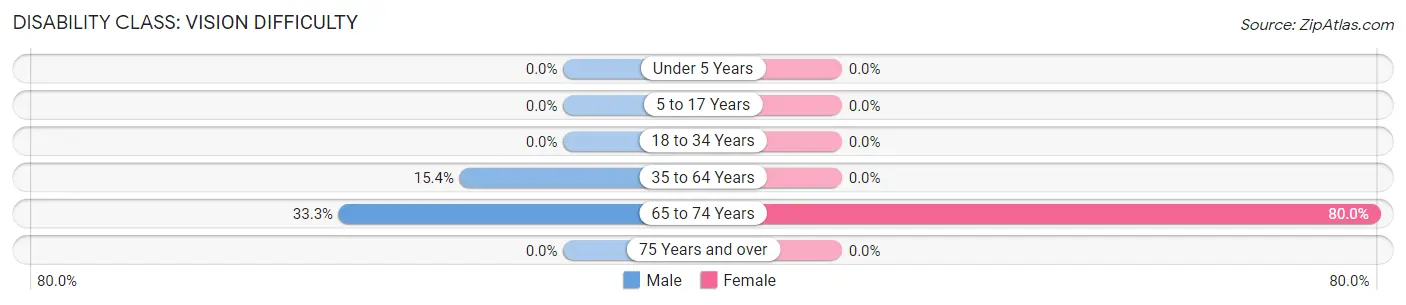
| Age Bracket | Male | Female |
| Under 5 Years | 0 (0.0%) | 0 (0.0%) |
| 5 to 17 Years | 0 (0.0%) | 0 (0.0%) |
| 18 to 34 Years | 0 (0.0%) | 0 (0.0%) |
| 35 to 64 Years | 4 (15.4%) | 0 (0.0%) |
| 65 to 74 Years | 5 (33.3%) | 4 (80.0%) |
| 75 Years and over | 0 (0.0%) | 0 (0.0%) |
Disability Class: Cognitive Difficulty
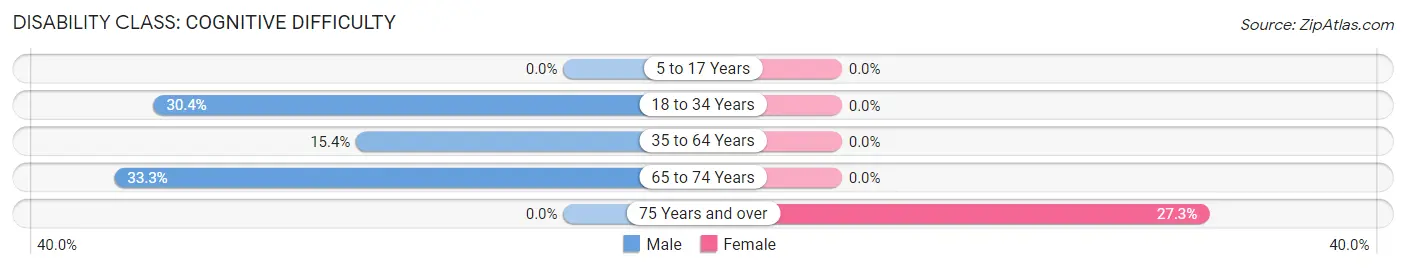
| Age Bracket | Male | Female |
| 5 to 17 Years | 0 (0.0%) | 0 (0.0%) |
| 18 to 34 Years | 7 (30.4%) | 0 (0.0%) |
| 35 to 64 Years | 4 (15.4%) | 0 (0.0%) |
| 65 to 74 Years | 5 (33.3%) | 0 (0.0%) |
| 75 Years and over | 0 (0.0%) | 3 (27.3%) |
Disability Class: Ambulatory Difficulty
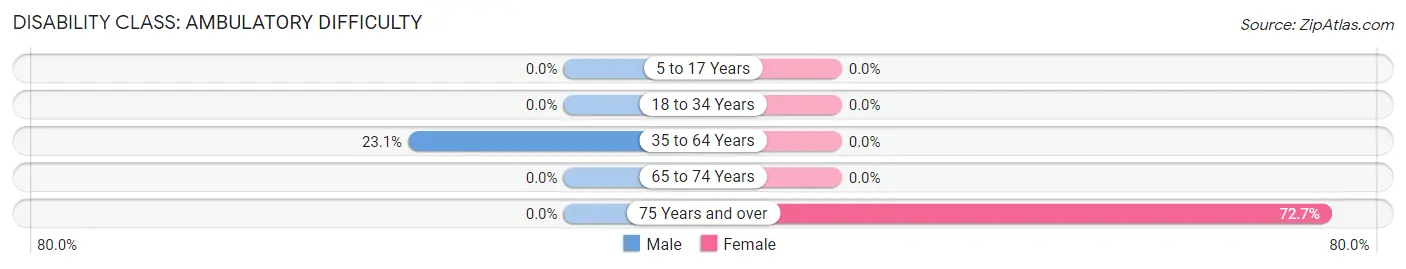
| Age Bracket | Male | Female |
| 5 to 17 Years | 0 (0.0%) | 0 (0.0%) |
| 18 to 34 Years | 0 (0.0%) | 0 (0.0%) |
| 35 to 64 Years | 6 (23.1%) | 0 (0.0%) |
| 65 to 74 Years | 0 (0.0%) | 0 (0.0%) |
| 75 Years and over | 0 (0.0%) | 8 (72.7%) |
Disability Class: Self-Care Difficulty
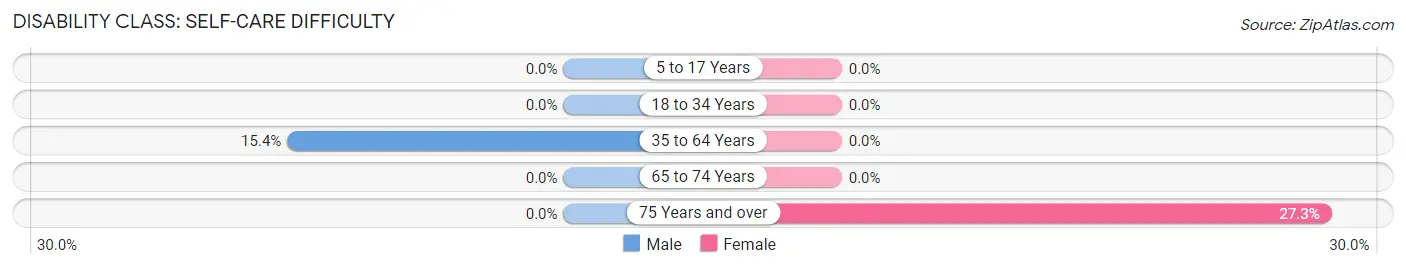
| Age Bracket | Male | Female |
| 5 to 17 Years | 0 (0.0%) | 0 (0.0%) |
| 18 to 34 Years | 0 (0.0%) | 0 (0.0%) |
| 35 to 64 Years | 4 (15.4%) | 0 (0.0%) |
| 65 to 74 Years | 0 (0.0%) | 0 (0.0%) |
| 75 Years and over | 0 (0.0%) | 3 (27.3%) |
Technology Access in Davy
Computing Device Access in Davy
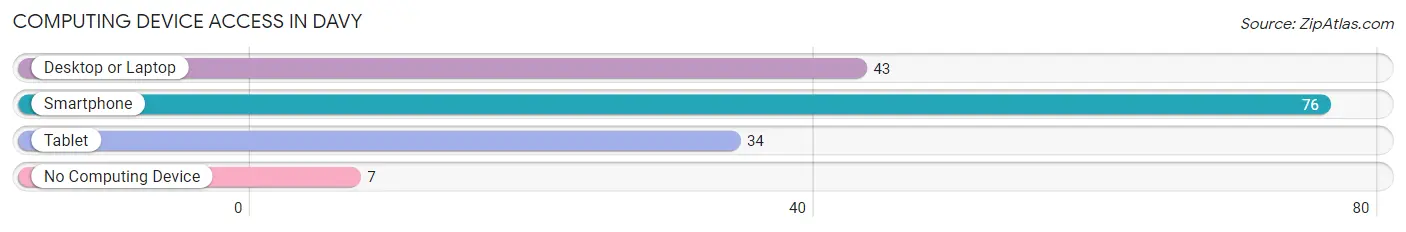
| Device Type | # Households | % Households |
| Desktop or Laptop | 43 | 50.0% |
| Smartphone | 76 | 88.4% |
| Tablet | 34 | 39.5% |
| No Computing Device | 7 | 8.1% |
| Total | 86 | 100.0% |
Internet Access in Davy
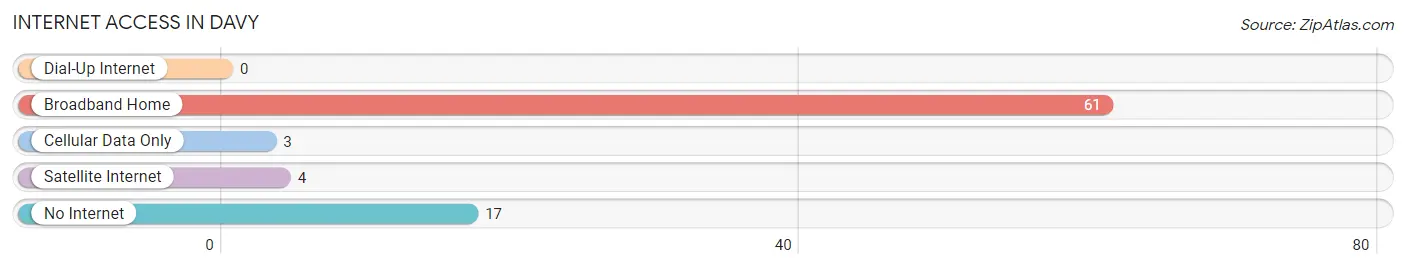
| Internet Type | # Households | % Households |
| Dial-Up Internet | 0 | 0.0% |
| Broadband Home | 61 | 70.9% |
| Cellular Data Only | 3 | 3.5% |
| Satellite Internet | 4 | 4.6% |
| No Internet | 17 | 19.8% |
| Total | 86 | 100.0% |
Davy Summary
Davy, West Virginia is a small unincorporated community located in McDowell County. It is situated in the Appalachian Mountains and is surrounded by lush forests and rolling hills. The town is home to a population of approximately 500 people and is known for its coal mining history.
History
Davy was founded in the late 1800s by coal miners who were looking for work in the area. The town was named after the Davy Coal Company, which was one of the first coal companies to operate in the area. The company was founded by John Davy, who was a prominent figure in the coal industry in the late 19th century.
The town grew rapidly in the early 1900s as the coal industry flourished in the area. The town was home to several coal mines, which provided employment for many of the town’s residents. The town also had a number of stores, churches, and other businesses that served the local community.
In the mid-1900s, the coal industry began to decline in the area and many of the town’s residents moved away in search of work. The town’s population decreased significantly and the town began to decline. In the late 20th century, the town began to experience a resurgence as new businesses and industries moved into the area.
Geography
Davy is located in the Appalachian Mountains in McDowell County, West Virginia. The town is situated in a valley surrounded by rolling hills and lush forests. The town is located near the Tug Fork River, which provides a source of water for the town.
The town is located approximately 30 miles from the city of Welch, which is the county seat of McDowell County. The town is also located near the cities of Bluefield and Princeton, which are both located in neighboring Mercer County.
Economy
The economy of Davy is largely based on the coal industry. The town is home to several coal mines, which provide employment for many of the town’s residents. The town also has a number of stores, churches, and other businesses that serve the local community.
The town is also home to a number of tourist attractions, including the Davy Coal Mine Museum, which is located in the town’s historic district. The museum showcases the history of the coal industry in the area and is a popular destination for visitors.
Demographics
As of the 2010 census, the population of Davy was approximately 500 people. The town is predominantly white, with approximately 95% of the population being white. The town also has a small African American population, with approximately 4% of the population being African American.
The median household income in Davy is approximately $25,000, which is significantly lower than the national average. The town also has a higher poverty rate than the national average, with approximately 25% of the population living below the poverty line.
Conclusion
Davy, West Virginia is a small unincorporated community located in McDowell County. The town is home to a population of approximately 500 people and is known for its coal mining history. The town’s economy is largely based on the coal industry, and the town also has a number of stores, churches, and other businesses that serve the local community. The town is predominantly white, with approximately 95% of the population being white. The median household income in Davy is approximately $25,000, which is significantly lower than the national average.
Common Questions
What is Per Capita Income in Davy?
Per Capita income in Davy is $13,983.
What is the Median Family Income in Davy?
Median Family Income in Davy is $52,250.
What is the Median Household income in Davy?
Median Household Income in Davy is $38,750.
What is Income or Wage Gap in Davy?
Income or Wage Gap in Davy is 54.5%.
Women in Davy earn 45.5 cents for every dollar earned by a man.
What is Inequality or Gini Index in Davy?
Inequality or Gini Index in Davy is 0.41.
What is the Total Population of Davy?
Total Population of Davy is 271.
What is the Total Male Population of Davy?
Total Male Population of Davy is 129.
What is the Total Female Population of Davy?
Total Female Population of Davy is 142.
What is the Ratio of Males per 100 Females in Davy?
There are 90.85 Males per 100 Females in Davy.
What is the Ratio of Females per 100 Males in Davy?
There are 110.08 Females per 100 Males in Davy.
What is the Median Population Age in Davy?
Median Population Age in Davy is 40.1 Years.
What is the Average Family Size in Davy
Average Family Size in Davy is 4.3 People.
What is the Average Household Size in Davy
Average Household Size in Davy is 3.1 People.
How Large is the Labor Force in Davy?
There are 69 People in the Labor Forcein in Davy.
What is the Percentage of People in the Labor Force in Davy?
37.3% of People are in the Labor Force in Davy.
What is the Unemployment Rate in Davy?
Unemployment Rate in Davy is 8.7%.