Prairie City, OR Map & Demographics
Prairie City Map
Prairie City Overview
$34,940
PER CAPITA INCOME
$62,303
AVG FAMILY INCOME
$50,556
AVG HOUSEHOLD INCOME
0.45
INEQUALITY / GINI INDEX
717
TOTAL POPULATION
365
MALE POPULATION
352
FEMALE POPULATION
103.69
MALES / 100 FEMALES
96.44
FEMALES / 100 MALES
57.4
MEDIAN AGE
2.5
AVG FAMILY SIZE
1.7
AVG HOUSEHOLD SIZE
277
LABOR FORCE [ PEOPLE ]
44.4%
PERCENT IN LABOR FORCE
6.5%
UNEMPLOYMENT RATE
Prairie City Zip Codes
Prairie City Area Codes
Income in Prairie City
Income Overview in Prairie City
Per Capita Income in Prairie City is $34,940, while median incomes of families and households are $62,303 and $50,556 respectively.
| Characteristic | Number | Measure |
| Per Capita Income | 717 | $34,940 |
| Median Family Income | 179 | $62,303 |
| Mean Family Income | 179 | $85,695 |
| Median Household Income | 396 | $50,556 |
| Mean Household Income | 396 | $65,172 |
| Income Deficit | 179 | $0 |
| Wage / Income Gap (%) | 717 | 0.00% |
| Wage / Income Gap ($) | 717 | 100.00¢ per $1 |
| Gini / Inequality Index | 717 | 0.45 |
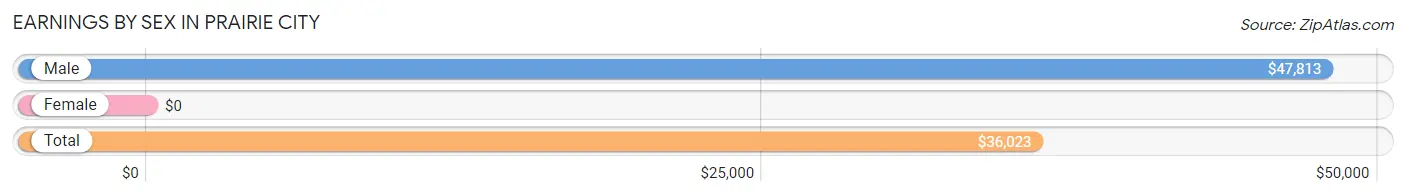
Earnings by Sex in Prairie City
| Sex | Number | Average Earnings |
| Male | 159 (48.9%) | $47,813 |
| Female | 166 (51.1%) | $0 |
| Total | 325 (100.0%) | $36,023 |
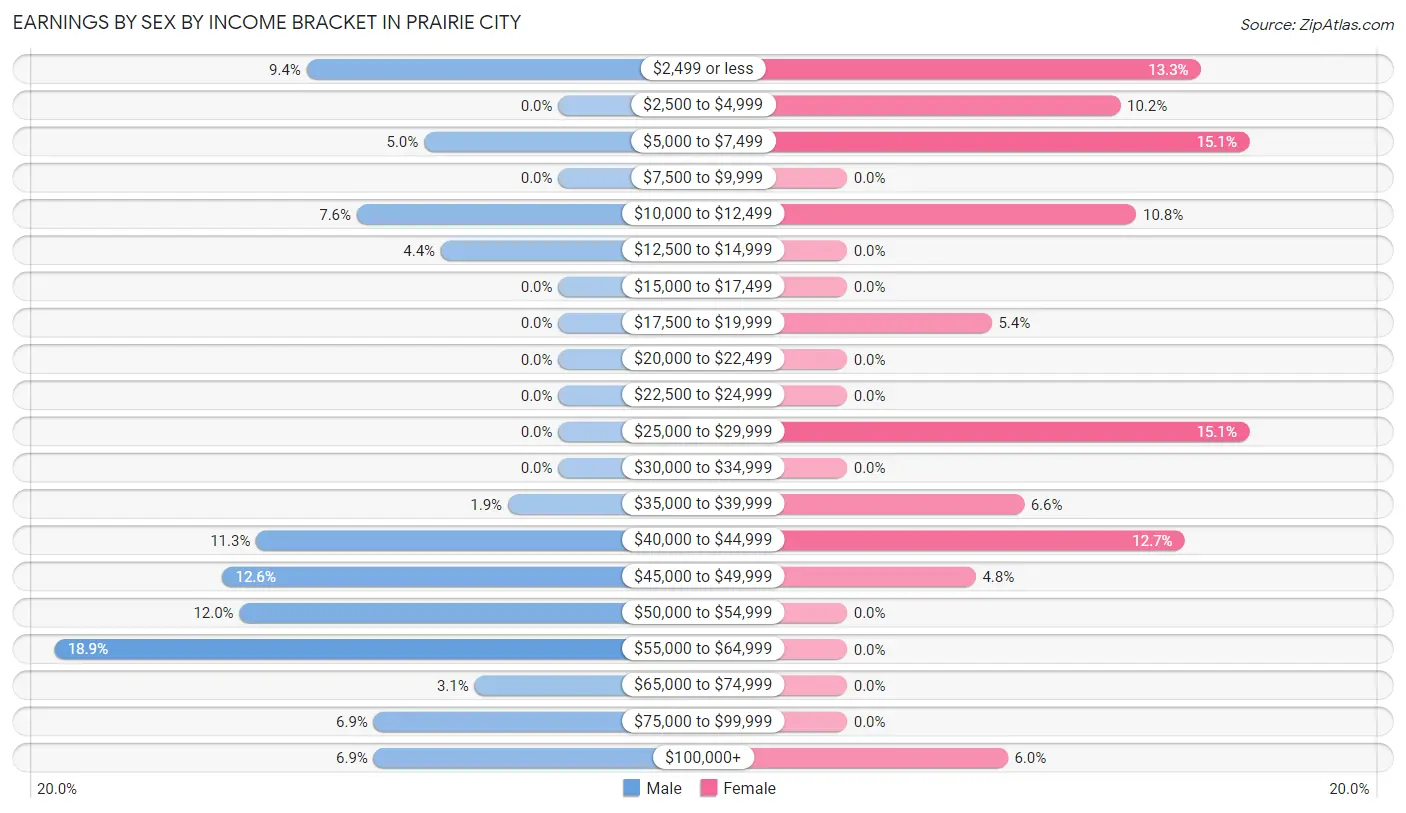
Earnings by Sex by Income Bracket in Prairie City
The most common earnings brackets in Prairie City are $55,000 to $64,999 for men (30 | 18.9%) and $5,000 to $7,499 for women (25 | 15.1%).
| Income | Male | Female |
| $2,499 or less | 15 (9.4%) | 22 (13.3%) |
| $2,500 to $4,999 | 0 (0.0%) | 17 (10.2%) |
| $5,000 to $7,499 | 8 (5.0%) | 25 (15.1%) |
| $7,500 to $9,999 | 0 (0.0%) | 0 (0.0%) |
| $10,000 to $12,499 | 12 (7.5%) | 18 (10.8%) |
| $12,500 to $14,999 | 7 (4.4%) | 0 (0.0%) |
| $15,000 to $17,499 | 0 (0.0%) | 0 (0.0%) |
| $17,500 to $19,999 | 0 (0.0%) | 9 (5.4%) |
| $20,000 to $22,499 | 0 (0.0%) | 0 (0.0%) |
| $22,500 to $24,999 | 0 (0.0%) | 0 (0.0%) |
| $25,000 to $29,999 | 0 (0.0%) | 25 (15.1%) |
| $30,000 to $34,999 | 0 (0.0%) | 0 (0.0%) |
| $35,000 to $39,999 | 3 (1.9%) | 11 (6.6%) |
| $40,000 to $44,999 | 18 (11.3%) | 21 (12.7%) |
| $45,000 to $49,999 | 20 (12.6%) | 8 (4.8%) |
| $50,000 to $54,999 | 19 (11.9%) | 0 (0.0%) |
| $55,000 to $64,999 | 30 (18.9%) | 0 (0.0%) |
| $65,000 to $74,999 | 5 (3.1%) | 0 (0.0%) |
| $75,000 to $99,999 | 11 (6.9%) | 0 (0.0%) |
| $100,000+ | 11 (6.9%) | 10 (6.0%) |
| Total | 159 (100.0%) | 166 (100.0%) |
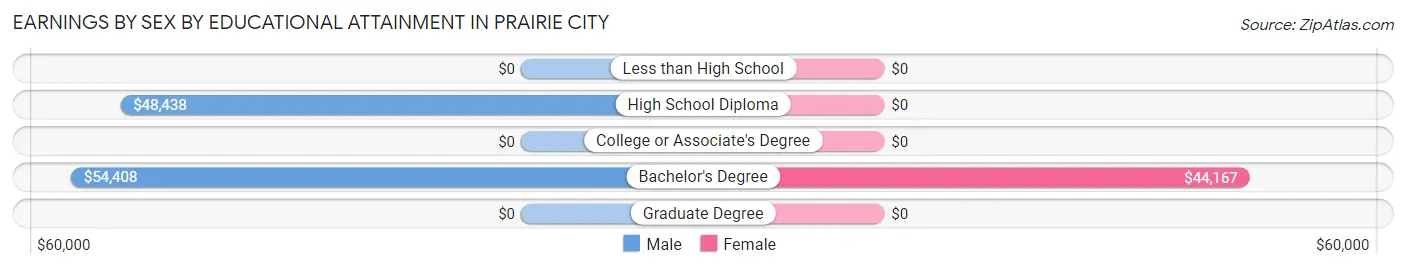
Earnings by Sex by Educational Attainment in Prairie City
| Educational Attainment | Male Income | Female Income |
| Less than High School | - | - |
| High School Diploma | $48,438 | $0 |
| College or Associate's Degree | - | - |
| Bachelor's Degree | $54,408 | $44,167 |
| Graduate Degree | - | - |
| Total | $52,566 | $0 |
Family Income in Prairie City
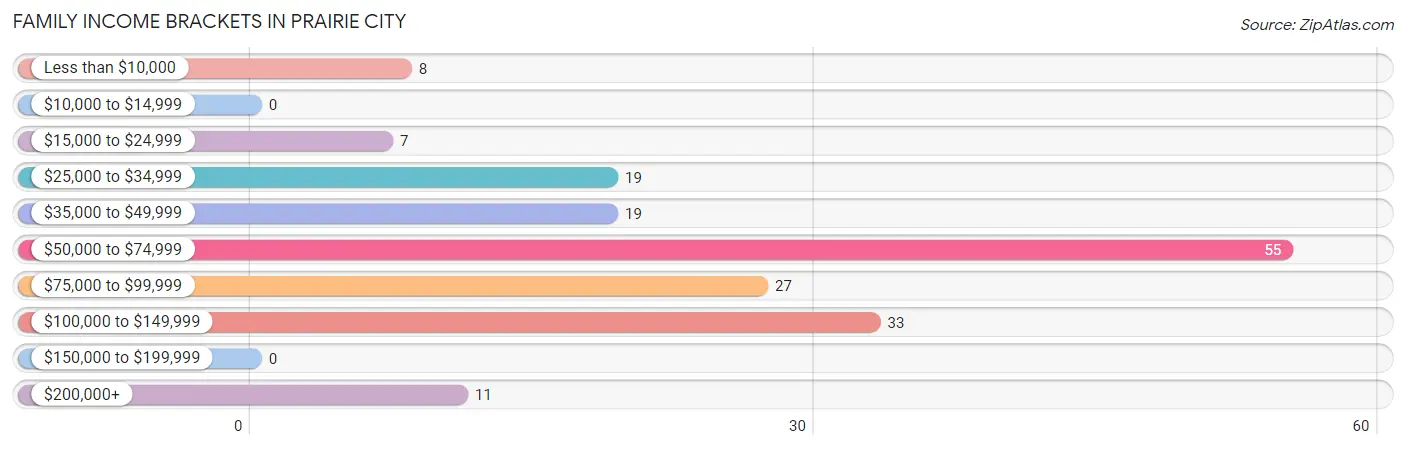
Family Income Brackets in Prairie City
According to the Prairie City family income data, there are 55 families falling into the $50,000 to $74,999 income range, which is the most common income bracket and makes up 30.7% of all families.
| Income Bracket | # Families | % Families |
| Less than $10,000 | 8 | 4.5% |
| $10,000 to $14,999 | 0 | 0.0% |
| $15,000 to $24,999 | 7 | 3.9% |
| $25,000 to $34,999 | 19 | 10.6% |
| $35,000 to $49,999 | 19 | 10.6% |
| $50,000 to $74,999 | 55 | 30.7% |
| $75,000 to $99,999 | 27 | 15.1% |
| $100,000 to $149,999 | 33 | 18.4% |
| $150,000 to $199,999 | 0 | 0.0% |
| $200,000+ | 11 | 6.1% |
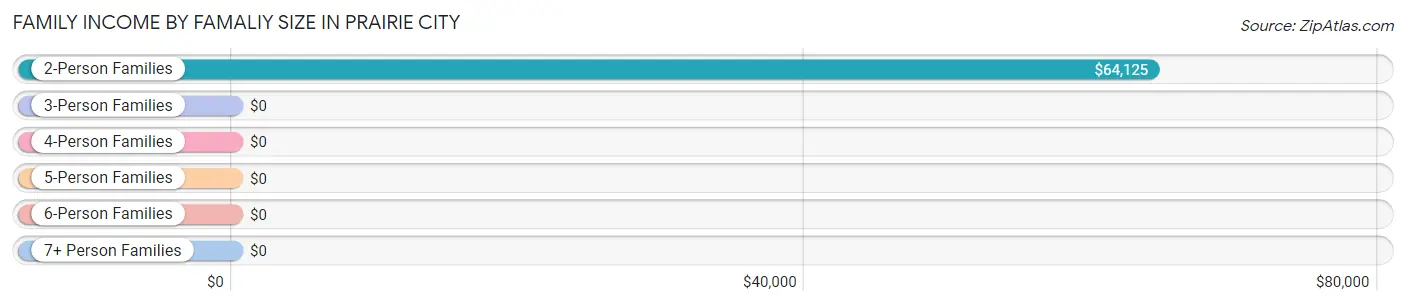
Family Income by Famaliy Size in Prairie City
2-person families (111 | 62.0%) account for the highest median family income in Prairie City with $64,125 per family, while 2-person families (111 | 62.0%) have the highest median income of $32,062 per family member.
| Income Bracket | # Families | Median Income |
| 2-Person Families | 111 (62.0%) | $64,125 |
| 3-Person Families | 46 (25.7%) | $0 |
| 4-Person Families | 18 (10.1%) | $0 |
| 5-Person Families | 0 (0.0%) | $0 |
| 6-Person Families | 4 (2.2%) | $0 |
| 7+ Person Families | 0 (0.0%) | $0 |
| Total | 179 (100.0%) | $62,303 |
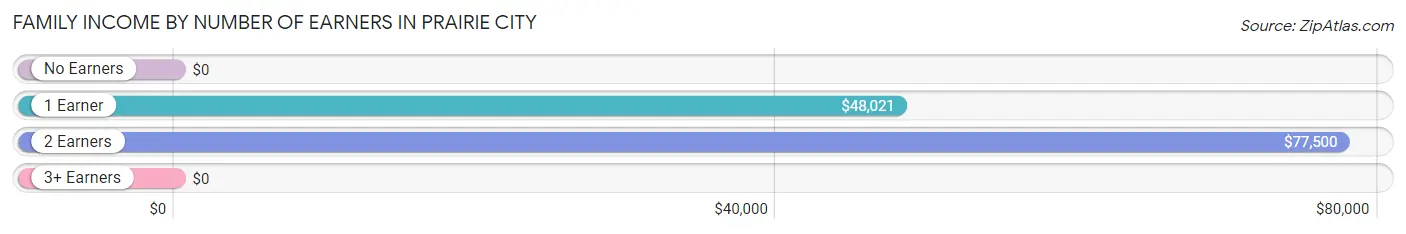
Family Income by Number of Earners in Prairie City
| Number of Earners | # Families | Median Income |
| No Earners | 25 (14.0%) | $0 |
| 1 Earner | 59 (33.0%) | $48,021 |
| 2 Earners | 84 (46.9%) | $77,500 |
| 3+ Earners | 11 (6.1%) | $0 |
| Total | 179 (100.0%) | $62,303 |
Household Income in Prairie City
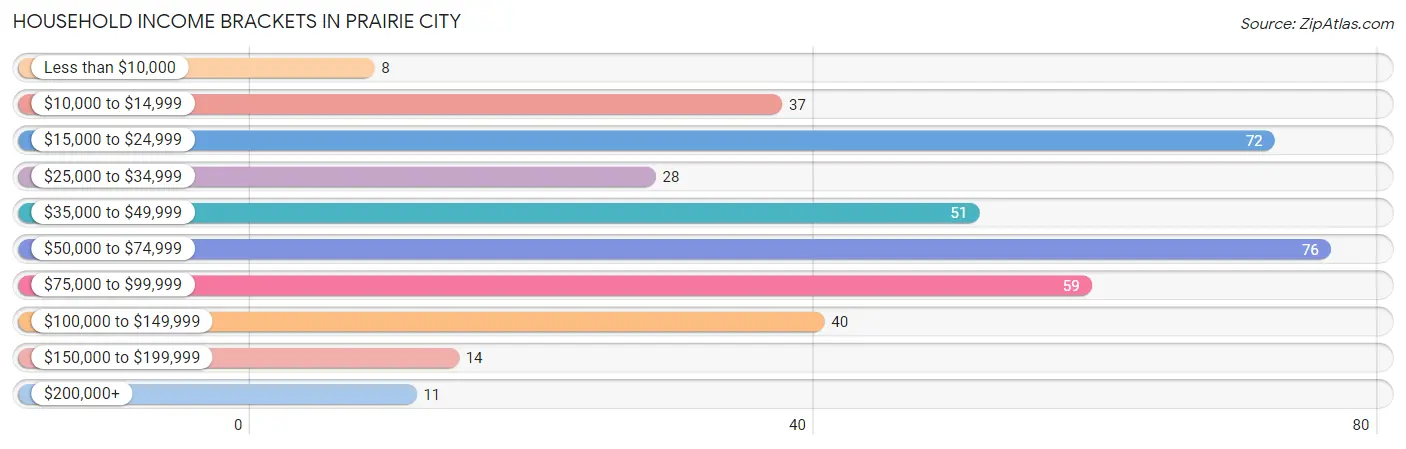
Household Income Brackets in Prairie City
With 76 households falling in the category, the $50,000 to $74,999 income range is the most frequent in Prairie City, accounting for 19.2% of all households. In contrast, only 8 households (2.0%) fall into the less than $10,000 income bracket, making it the least populous group.
| Income Bracket | # Households | % Households |
| Less than $10,000 | 8 | 2.0% |
| $10,000 to $14,999 | 37 | 9.3% |
| $15,000 to $24,999 | 72 | 18.2% |
| $25,000 to $34,999 | 28 | 7.1% |
| $35,000 to $49,999 | 51 | 12.9% |
| $50,000 to $74,999 | 76 | 19.2% |
| $75,000 to $99,999 | 59 | 14.9% |
| $100,000 to $149,999 | 40 | 10.1% |
| $150,000 to $199,999 | 14 | 3.5% |
| $200,000+ | 11 | 2.8% |
Household Income by Householder Age in Prairie City
The median household income in Prairie City is $50,556, with the highest median household income of $61,008 found in the 25 to 44 years age bracket for the primary householder. A total of 113 households (28.5%) fall into this category.
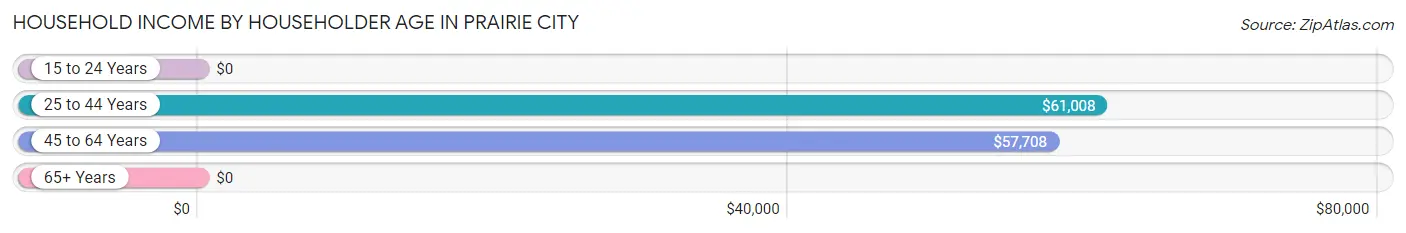
| Income Bracket | # Households | Median Income |
| 15 to 24 Years | 0 (0.0%) | $0 |
| 25 to 44 Years | 113 (28.5%) | $61,008 |
| 45 to 64 Years | 86 (21.7%) | $57,708 |
| 65+ Years | 197 (49.7%) | $0 |
| Total | 396 (100.0%) | $50,556 |
Poverty in Prairie City
Income Below Poverty by Sex and Age in Prairie City
With 15.8% poverty level for males and 14.3% for females among the residents of Prairie City, 6 to 11 year old males and 75 year old and over females are the most vulnerable to poverty, with 15 males (75.0%) and 30 females (32.6%) in their respective age groups living below the poverty level.
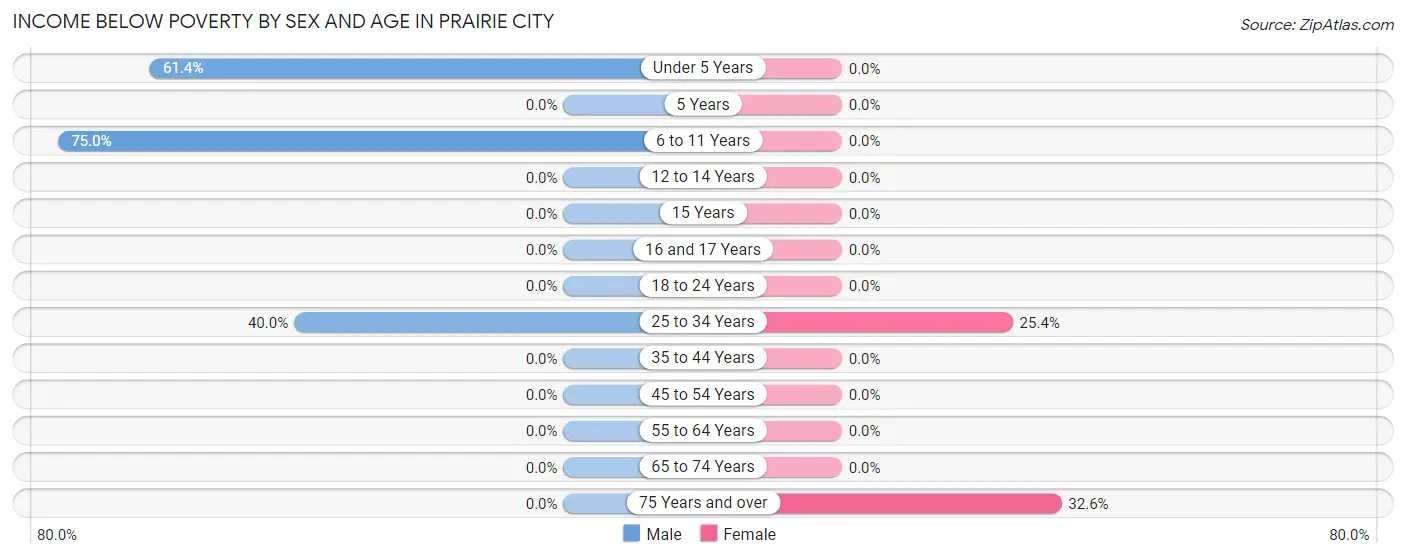
| Age Bracket | Male | Female |
| Under 5 Years | 27 (61.4%) | 0 (0.0%) |
| 5 Years | 0 (0.0%) | 0 (0.0%) |
| 6 to 11 Years | 15 (75.0%) | 0 (0.0%) |
| 12 to 14 Years | 0 (0.0%) | 0 (0.0%) |
| 15 Years | 0 (0.0%) | 0 (0.0%) |
| 16 and 17 Years | 0 (0.0%) | 0 (0.0%) |
| 18 to 24 Years | 0 (0.0%) | 0 (0.0%) |
| 25 to 34 Years | 14 (40.0%) | 17 (25.4%) |
| 35 to 44 Years | 0 (0.0%) | 0 (0.0%) |
| 45 to 54 Years | 0 (0.0%) | 0 (0.0%) |
| 55 to 64 Years | 0 (0.0%) | 0 (0.0%) |
| 65 to 74 Years | 0 (0.0%) | 0 (0.0%) |
| 75 Years and over | 0 (0.0%) | 30 (32.6%) |
| Total | 56 (15.8%) | 47 (14.3%) |
Income Above Poverty by Sex and Age in Prairie City
According to the poverty statistics in Prairie City, males aged 12 to 14 years and females aged 6 to 11 years are the age groups that are most secure financially, with 100.0% of males and 100.0% of females in these age groups living above the poverty line.
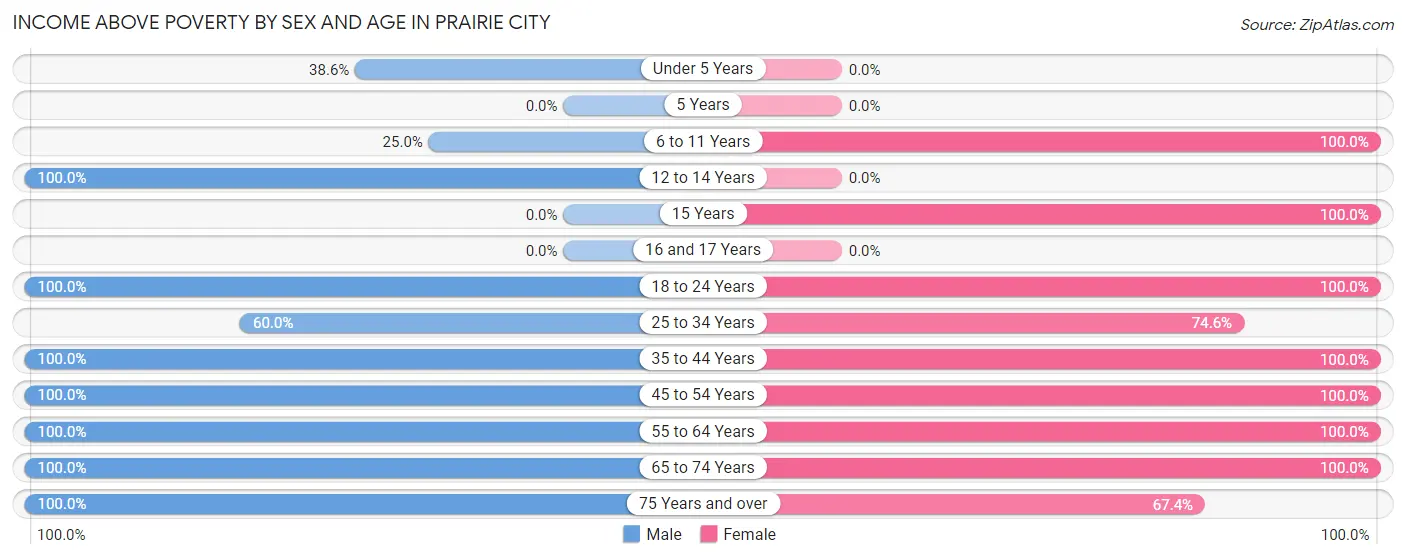
| Age Bracket | Male | Female |
| Under 5 Years | 17 (38.6%) | 0 (0.0%) |
| 5 Years | 0 (0.0%) | 0 (0.0%) |
| 6 to 11 Years | 5 (25.0%) | 13 (100.0%) |
| 12 to 14 Years | 5 (100.0%) | 0 (0.0%) |
| 15 Years | 0 (0.0%) | 11 (100.0%) |
| 16 and 17 Years | 0 (0.0%) | 0 (0.0%) |
| 18 to 24 Years | 20 (100.0%) | 3 (100.0%) |
| 25 to 34 Years | 21 (60.0%) | 50 (74.6%) |
| 35 to 44 Years | 67 (100.0%) | 9 (100.0%) |
| 45 to 54 Years | 11 (100.0%) | 46 (100.0%) |
| 55 to 64 Years | 52 (100.0%) | 60 (100.0%) |
| 65 to 74 Years | 39 (100.0%) | 28 (100.0%) |
| 75 Years and over | 62 (100.0%) | 62 (67.4%) |
| Total | 299 (84.2%) | 282 (85.7%) |
Income Below Poverty Among Married-Couple Families in Prairie City
The poverty statistics for married-couple families in Prairie City show that 4.7% or 7 of the total 149 families live below the poverty line. Families with 1 or 2 children have the highest poverty rate of 15.6%, comprising of 7 families. On the other hand, families with no children have the lowest poverty rate of 0.0%, which includes 0 families.
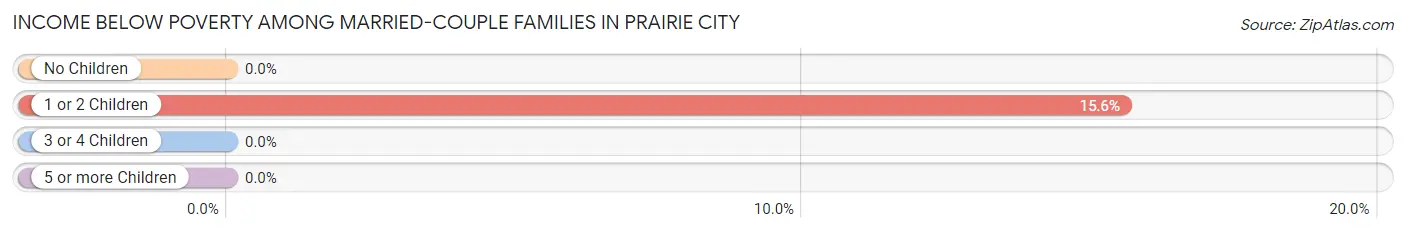
| Children | Above Poverty | Below Poverty |
| No Children | 104 (100.0%) | 0 (0.0%) |
| 1 or 2 Children | 38 (84.4%) | 7 (15.6%) |
| 3 or 4 Children | 0 (0.0%) | 0 (0.0%) |
| 5 or more Children | 0 (0.0%) | 0 (0.0%) |
| Total | 142 (95.3%) | 7 (4.7%) |
Income Below Poverty Among Single-Parent Households in Prairie City
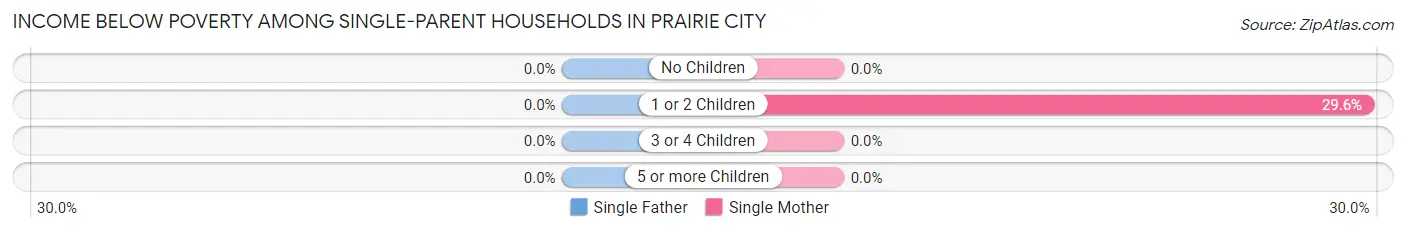
| Children | Single Father | Single Mother |
| No Children | 0 (0.0%) | 0 (0.0%) |
| 1 or 2 Children | 0 (0.0%) | 8 (29.6%) |
| 3 or 4 Children | 0 (0.0%) | 0 (0.0%) |
| 5 or more Children | 0 (0.0%) | 0 (0.0%) |
| Total | 0 (0.0%) | 8 (26.7%) |
Income Below Poverty Among Married-Couple vs Single-Parent Households in Prairie City
The poverty data for Prairie City shows that 7 of the married-couple family households (4.7%) and 8 of the single-parent households (26.7%) are living below the poverty level. Within the married-couple family households, those with 1 or 2 children have the highest poverty rate, with 7 households (15.6%) falling below the poverty line. Among the single-parent households, those with 1 or 2 children have the highest poverty rate, with 8 household (29.6%) living below poverty.
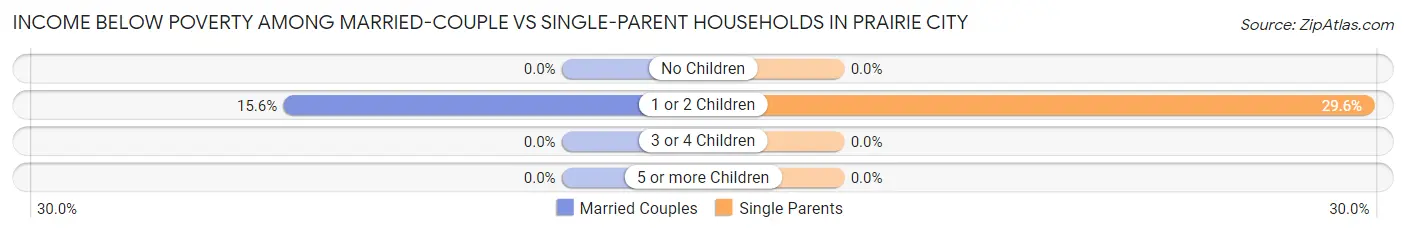
| Children | Married-Couple Families | Single-Parent Households |
| No Children | 0 (0.0%) | 0 (0.0%) |
| 1 or 2 Children | 7 (15.6%) | 8 (29.6%) |
| 3 or 4 Children | 0 (0.0%) | 0 (0.0%) |
| 5 or more Children | 0 (0.0%) | 0 (0.0%) |
| Total | 7 (4.7%) | 8 (26.7%) |
Race in Prairie City
The most populous races in Prairie City are White / Caucasian (674 | 94.0%), Hispanic or Latino (34 | 4.7%), and Two or more Races (30 | 4.2%).
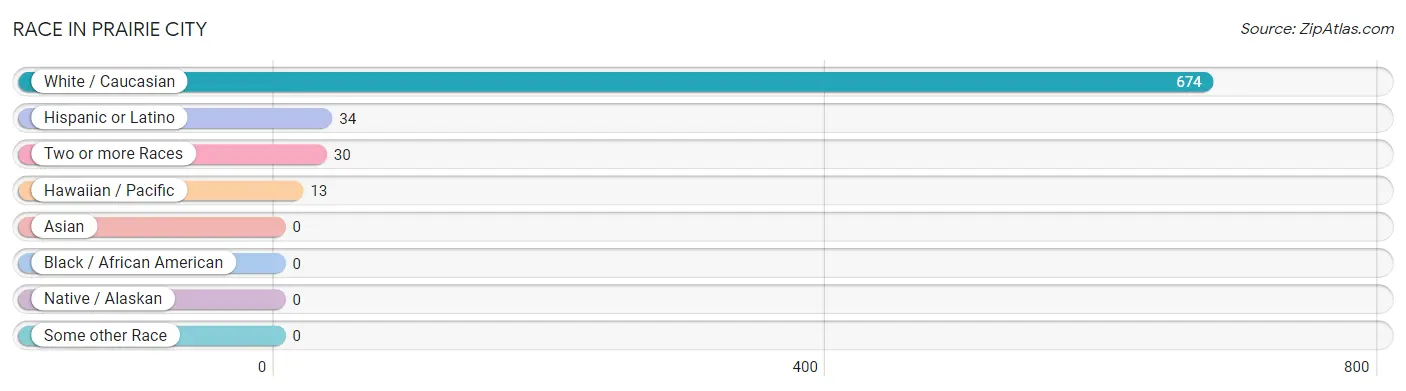
| Race | # Population | % Population |
| Asian | 0 | 0.0% |
| Black / African American | 0 | 0.0% |
| Hawaiian / Pacific | 13 | 1.8% |
| Hispanic or Latino | 34 | 4.7% |
| Native / Alaskan | 0 | 0.0% |
| White / Caucasian | 674 | 94.0% |
| Two or more Races | 30 | 4.2% |
| Some other Race | 0 | 0.0% |
| Total | 717 | 100.0% |
Ancestry in Prairie City
The most populous ancestries reported in Prairie City are American (182 | 25.4%), German (168 | 23.4%), English (92 | 12.8%), Italian (69 | 9.6%), and Irish (67 | 9.3%), together accounting for 80.6% of all Prairie City residents.
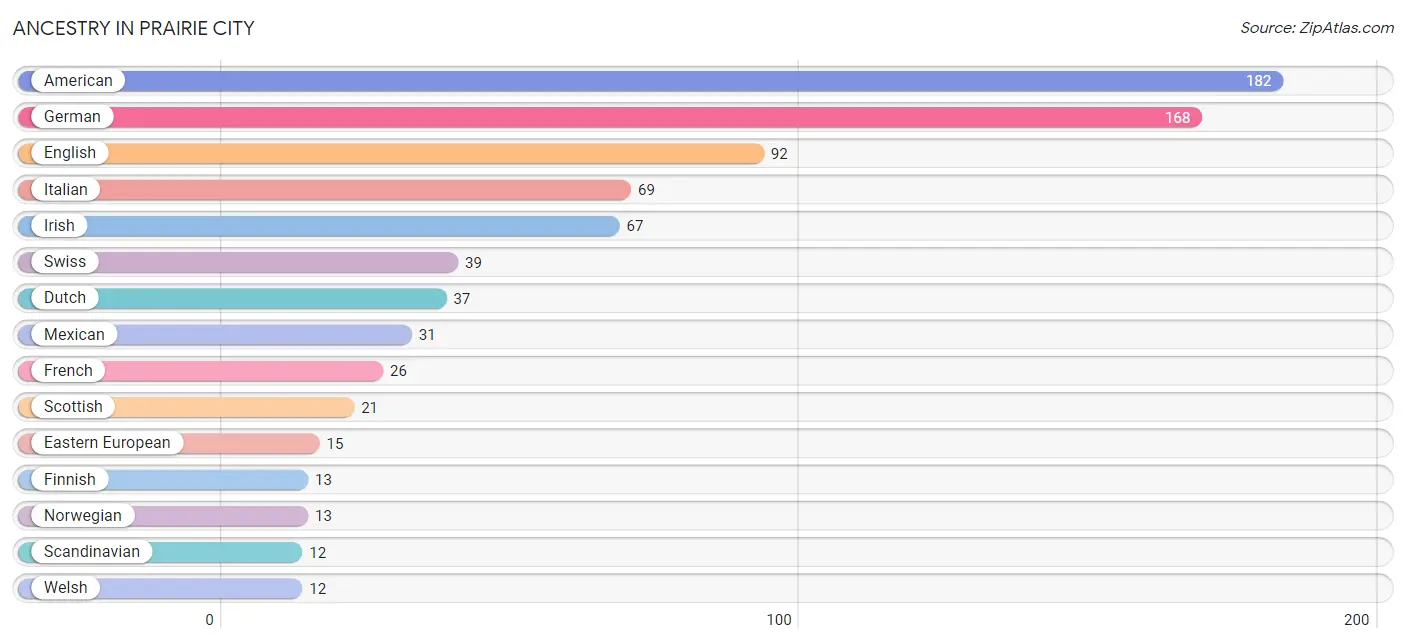
| Ancestry | # Population | % Population |
| American | 182 | 25.4% |
| Bulgarian | 8 | 1.1% |
| Cherokee | 7 | 1.0% |
| Danish | 6 | 0.8% |
| Dutch | 37 | 5.2% |
| Eastern European | 15 | 2.1% |
| English | 92 | 12.8% |
| European | 8 | 1.1% |
| Finnish | 13 | 1.8% |
| French | 26 | 3.6% |
| German | 168 | 23.4% |
| Hungarian | 10 | 1.4% |
| Irish | 67 | 9.3% |
| Italian | 69 | 9.6% |
| Mexican | 31 | 4.3% |
| Norwegian | 13 | 1.8% |
| Portuguese | 4 | 0.6% |
| Samoan | 8 | 1.1% |
| Scandinavian | 12 | 1.7% |
| Scotch-Irish | 7 | 1.0% |
| Scottish | 21 | 2.9% |
| Spaniard | 3 | 0.4% |
| Swiss | 39 | 5.4% |
| Welsh | 12 | 1.7% | View All 24 Rows |
Immigrants in Prairie City
The most numerous immigrant groups reported in Prairie City came from Canada (17 | 2.4%), Bulgaria (8 | 1.1%), Eastern Europe (8 | 1.1%), Europe (8 | 1.1%), and Oceania (6 | 0.8%), together accounting for 6.6% of all Prairie City residents.
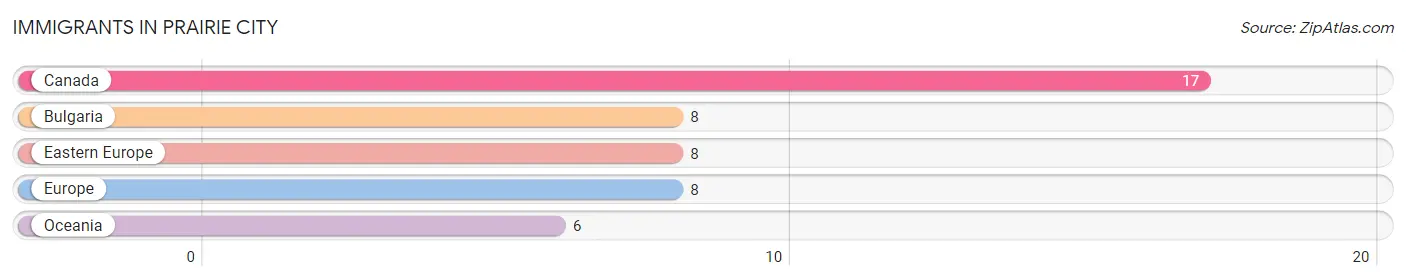
| Immigration Origin | # Population | % Population |
| Bulgaria | 8 | 1.1% |
| Canada | 17 | 2.4% |
| Eastern Europe | 8 | 1.1% |
| Europe | 8 | 1.1% |
| Oceania | 6 | 0.8% | View All 5 Rows |
Sex and Age in Prairie City
Sex and Age in Prairie City
The most populous age groups in Prairie City are 75 to 79 Years (72 | 19.7%) for men and 85 Years and over (71 | 20.2%) for women.
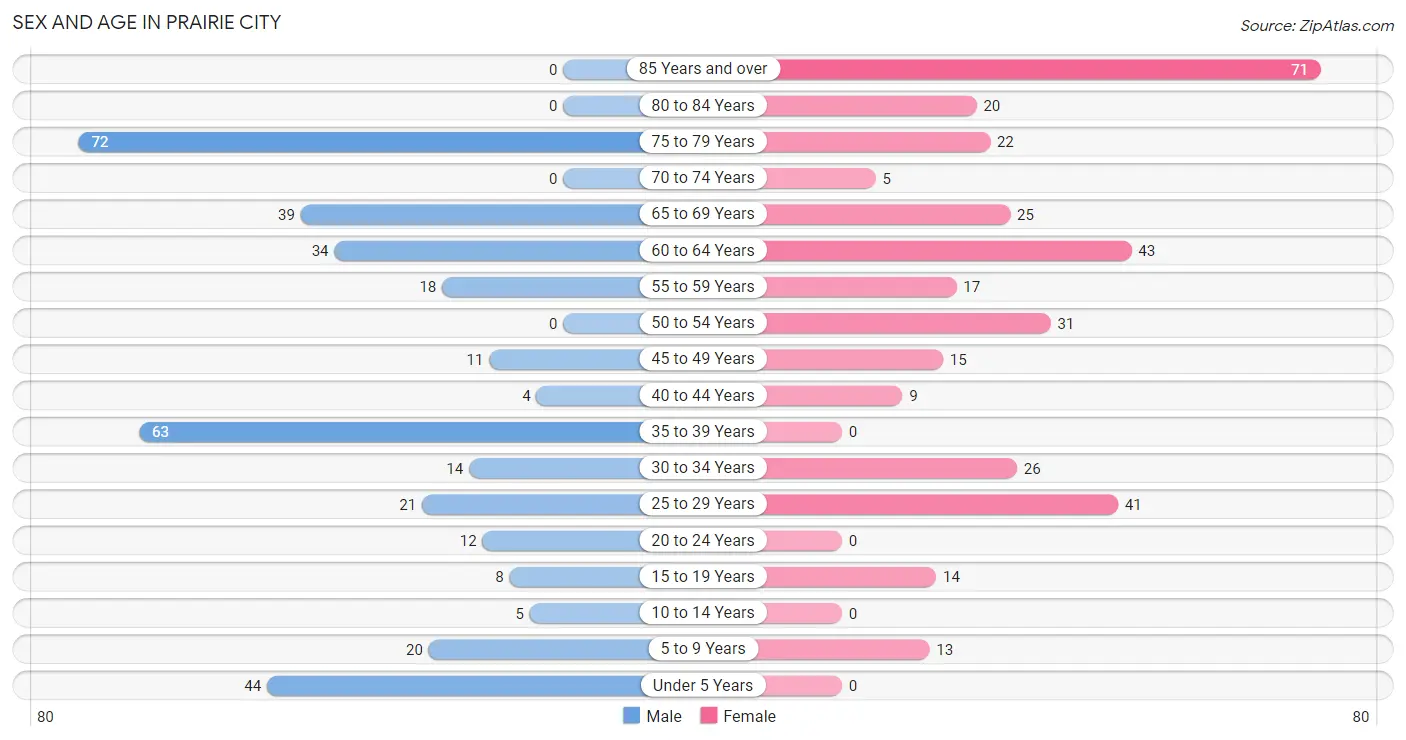
| Age Bracket | Male | Female |
| Under 5 Years | 44 (12.0%) | 0 (0.0%) |
| 5 to 9 Years | 20 (5.5%) | 13 (3.7%) |
| 10 to 14 Years | 5 (1.4%) | 0 (0.0%) |
| 15 to 19 Years | 8 (2.2%) | 14 (4.0%) |
| 20 to 24 Years | 12 (3.3%) | 0 (0.0%) |
| 25 to 29 Years | 21 (5.8%) | 41 (11.7%) |
| 30 to 34 Years | 14 (3.8%) | 26 (7.4%) |
| 35 to 39 Years | 63 (17.3%) | 0 (0.0%) |
| 40 to 44 Years | 4 (1.1%) | 9 (2.6%) |
| 45 to 49 Years | 11 (3.0%) | 15 (4.3%) |
| 50 to 54 Years | 0 (0.0%) | 31 (8.8%) |
| 55 to 59 Years | 18 (4.9%) | 17 (4.8%) |
| 60 to 64 Years | 34 (9.3%) | 43 (12.2%) |
| 65 to 69 Years | 39 (10.7%) | 25 (7.1%) |
| 70 to 74 Years | 0 (0.0%) | 5 (1.4%) |
| 75 to 79 Years | 72 (19.7%) | 22 (6.2%) |
| 80 to 84 Years | 0 (0.0%) | 20 (5.7%) |
| 85 Years and over | 0 (0.0%) | 71 (20.2%) |
| Total | 365 (100.0%) | 352 (100.0%) |
Families and Households in Prairie City
Median Family Size in Prairie City
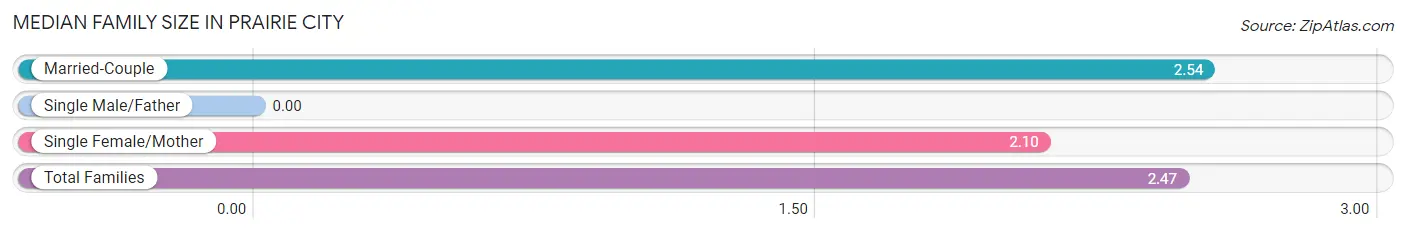
| Family Type | # Families | Family Size |
| Married-Couple | 149 (83.2%) | 2.54 |
| Single Male/Father | 0 (0.0%) | - |
| Single Female/Mother | 30 (16.8%) | 2.10 |
| Total Families | 179 (100.0%) | 2.47 |
Median Household Size in Prairie City
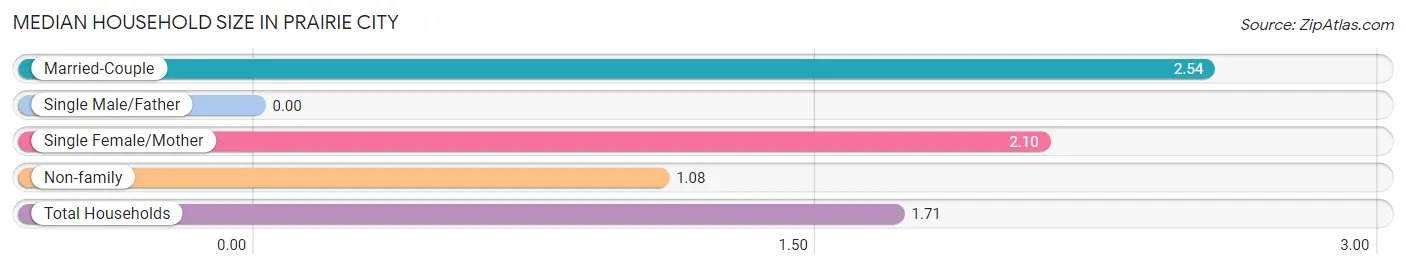
| Household Type | # Households | Household Size |
| Married-Couple | 149 (37.6%) | 2.54 |
| Single Male/Father | 0 (0.0%) | - |
| Single Female/Mother | 30 (7.6%) | 2.10 |
| Non-family | 217 (54.8%) | 1.08 |
| Total Households | 396 (100.0%) | 1.71 |
Household Size by Marriage Status in Prairie City
Out of a total of 396 households in Prairie City, 179 (45.2%) are family households, while 217 (54.8%) are nonfamily households. The most numerous type of family households are 2-person households, comprising 111, and the most common type of nonfamily households are 1-person households, comprising 201.
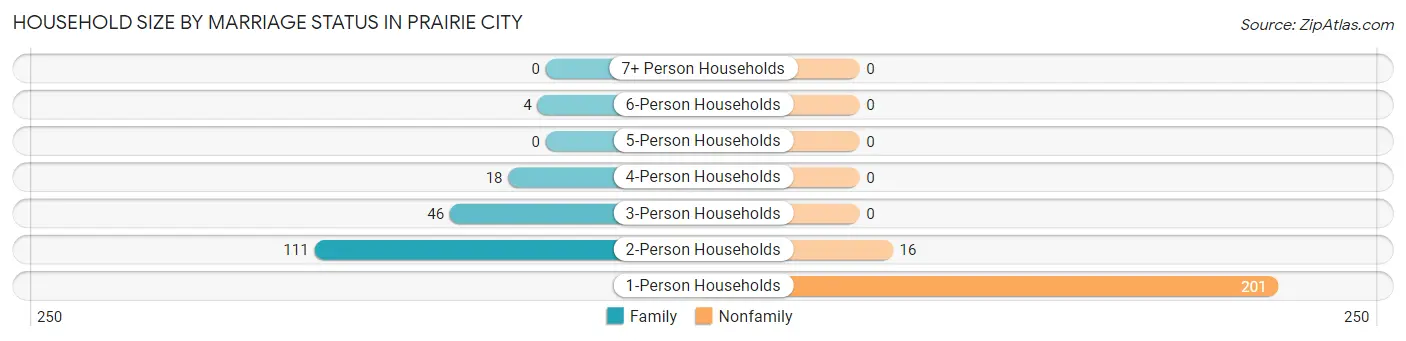
| Household Size | Family Households | Nonfamily Households |
| 1-Person Households | - | 201 (50.8%) |
| 2-Person Households | 111 (28.0%) | 16 (4.0%) |
| 3-Person Households | 46 (11.6%) | 0 (0.0%) |
| 4-Person Households | 18 (4.5%) | 0 (0.0%) |
| 5-Person Households | 0 (0.0%) | 0 (0.0%) |
| 6-Person Households | 4 (1.0%) | 0 (0.0%) |
| 7+ Person Households | 0 (0.0%) | 0 (0.0%) |
| Total | 179 (45.2%) | 217 (54.8%) |
Female Fertility in Prairie City
Fertility by Age in Prairie City
Average fertility rate in Prairie City is 238.0 births per 1,000 women. Women in the age bracket of 20 to 34 years have the highest fertility rate with 373.0 births per 1,000 women. Women in the age bracket of 20 to 34 years acount for 100.0% of all women with births.
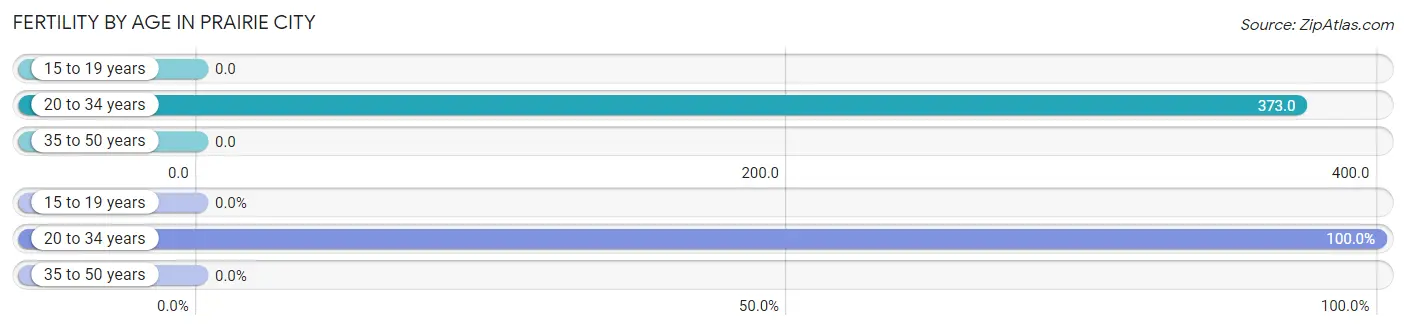
| Age Bracket | Women with Births | Births / 1,000 Women |
| 15 to 19 years | 0 (0.0%) | 0.0 |
| 20 to 34 years | 25 (100.0%) | 373.0 |
| 35 to 50 years | 0 (0.0%) | 0.0 |
| Total | 25 (100.0%) | 238.0 |
Fertility by Age by Marriage Status in Prairie City
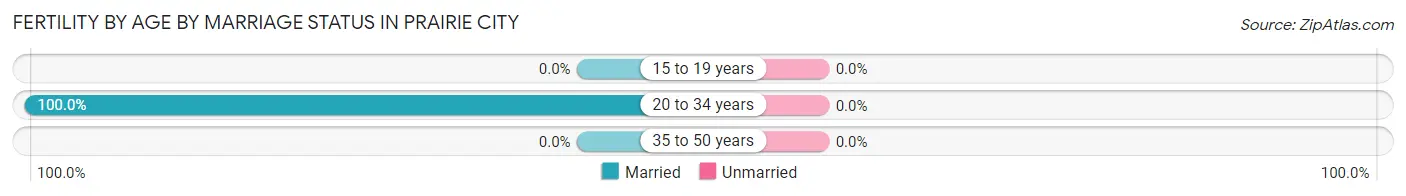
| Age Bracket | Married | Unmarried |
| 15 to 19 years | 0 (0.0%) | 0 (0.0%) |
| 20 to 34 years | 25 (100.0%) | 0 (0.0%) |
| 35 to 50 years | 0 (0.0%) | 0 (0.0%) |
| Total | 25 (100.0%) | 0 (0.0%) |
Fertility by Education in Prairie City
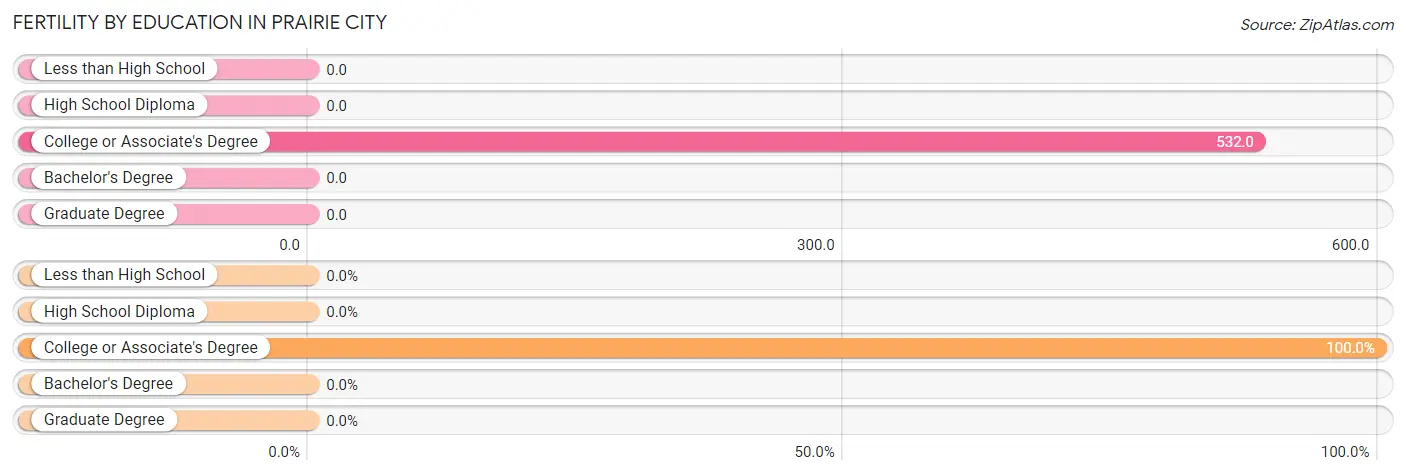
| Educational Attainment | Women with Births | Births / 1,000 Women |
| Less than High School | 0 (0.0%) | 0.0 |
| High School Diploma | 0 (0.0%) | 0.0 |
| College or Associate's Degree | 25 (100.0%) | 532.0 |
| Bachelor's Degree | 0 (0.0%) | 0.0 |
| Graduate Degree | 0 (0.0%) | 0.0 |
| Total | 25 (100.0%) | 238.0 |
Fertility by Education by Marriage Status in Prairie City
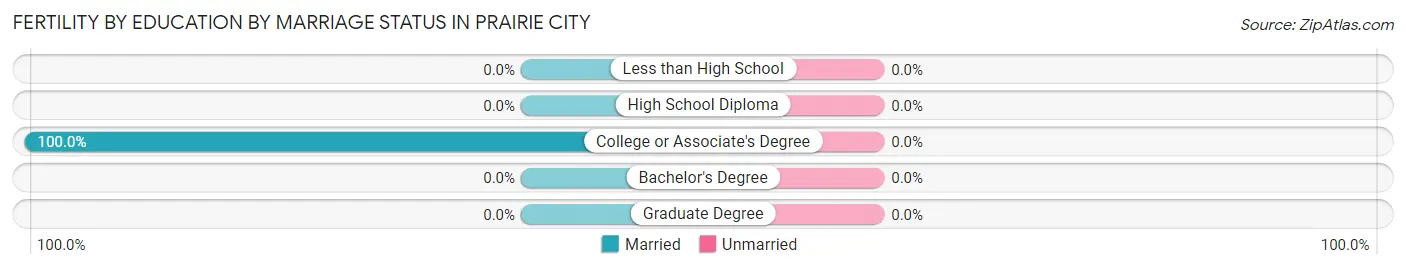
| Educational Attainment | Married | Unmarried |
| Less than High School | 0 (0.0%) | 0 (0.0%) |
| High School Diploma | 0 (0.0%) | 0 (0.0%) |
| College or Associate's Degree | 25 (100.0%) | 0 (0.0%) |
| Bachelor's Degree | 0 (0.0%) | 0 (0.0%) |
| Graduate Degree | 0 (0.0%) | 0 (0.0%) |
| Total | 25 (100.0%) | 0 (0.0%) |
Employment Characteristics in Prairie City
Employment by Class of Employer in Prairie City
Among the 236 employed individuals in Prairie City, private company employees (111 | 47.0%), federal government employees (65 | 27.5%), and local government employees (26 | 11.0%) make up the most common classes of employment.
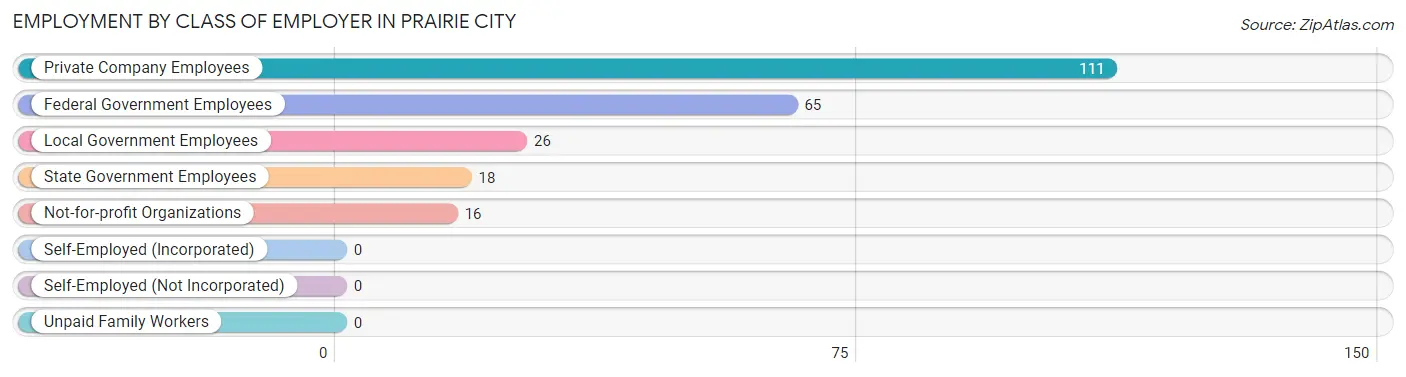
| Employer Class | # Employees | % Employees |
| Private Company Employees | 111 | 47.0% |
| Self-Employed (Incorporated) | 0 | 0.0% |
| Self-Employed (Not Incorporated) | 0 | 0.0% |
| Not-for-profit Organizations | 16 | 6.8% |
| Local Government Employees | 26 | 11.0% |
| State Government Employees | 18 | 7.6% |
| Federal Government Employees | 65 | 27.5% |
| Unpaid Family Workers | 0 | 0.0% |
| Total | 236 | 100.0% |
Employment Status by Age in Prairie City
According to the labor force statistics for Prairie City, out of the total population over 16 years of age (624), 44.4% or 277 individuals are in the labor force, with 6.5% or 18 of them unemployed. The age group with the highest labor force participation rate is 35 to 44 years, with 100.0% or 76 individuals in the labor force. Within the labor force, the 60 to 64 years age range has the highest percentage of unemployed individuals, with 27.5% or 11 of them being unemployed.
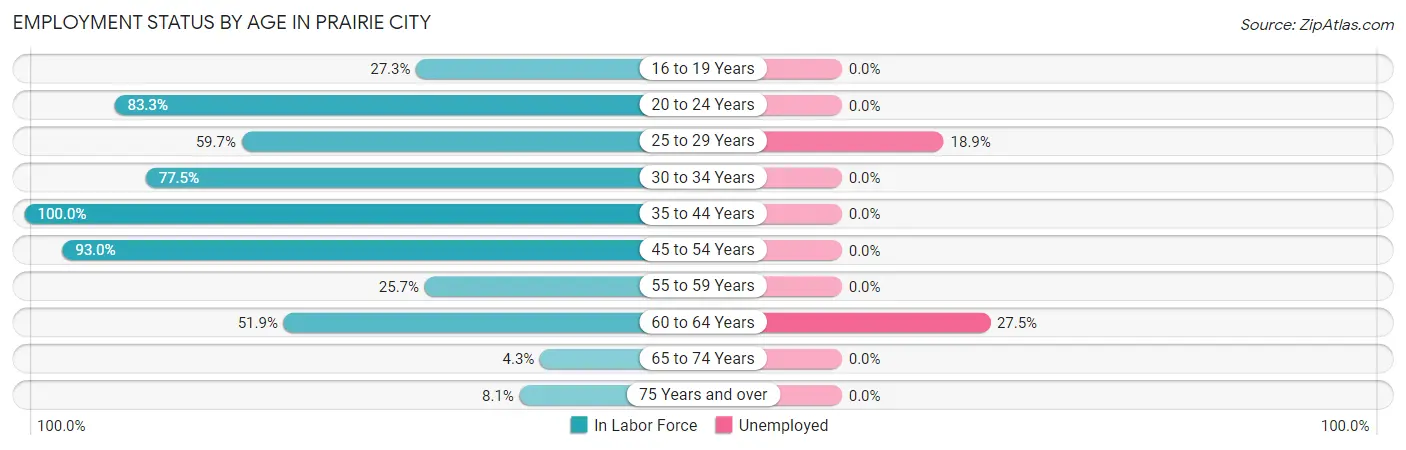
| Age Bracket | In Labor Force | Unemployed |
| 16 to 19 Years | 3 (27.3%) | 0 (0.0%) |
| 20 to 24 Years | 10 (83.3%) | 0 (0.0%) |
| 25 to 29 Years | 37 (59.7%) | 7 (18.9%) |
| 30 to 34 Years | 31 (77.5%) | 0 (0.0%) |
| 35 to 44 Years | 76 (100.0%) | 0 (0.0%) |
| 45 to 54 Years | 53 (93.0%) | 0 (0.0%) |
| 55 to 59 Years | 9 (25.7%) | 0 (0.0%) |
| 60 to 64 Years | 40 (51.9%) | 11 (27.5%) |
| 65 to 74 Years | 3 (4.3%) | 0 (0.0%) |
| 75 Years and over | 15 (8.1%) | 0 (0.0%) |
| Total | 277 (44.4%) | 18 (6.5%) |
Employment Status by Educational Attainment in Prairie City
According to labor force statistics for Prairie City, 70.9% of individuals (246) out of the total population between 25 and 64 years of age (347) are in the labor force, with 7.3% or 18 of them being unemployed. The group with the highest labor force participation rate are those with the educational attainment of bachelor's degree or higher, with 91.1% or 82 individuals in the labor force. Within the labor force, individuals with high school diploma education have the highest percentage of unemployment, with 21.7% or 18 of them being unemployed.
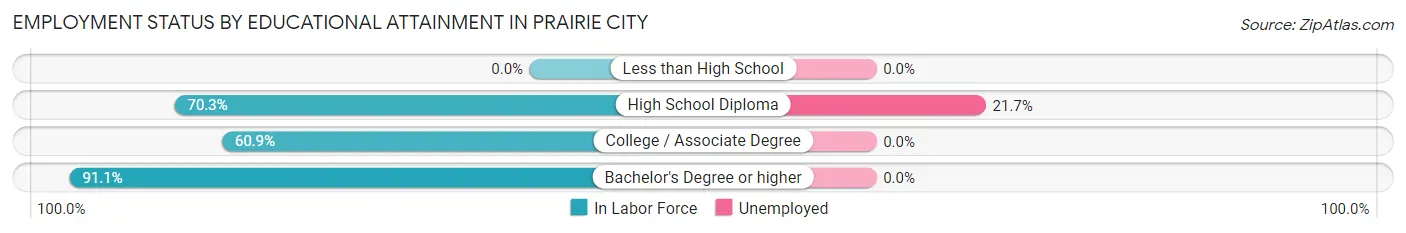
| Educational Attainment | In Labor Force | Unemployed |
| Less than High School | 0 (0.0%) | 0 (0.0%) |
| High School Diploma | 83 (70.3%) | 26 (21.7%) |
| College / Associate Degree | 81 (60.9%) | 0 (0.0%) |
| Bachelor's Degree or higher | 82 (91.1%) | 0 (0.0%) |
| Total | 246 (70.9%) | 25 (7.3%) |
Employment Occupations by Sex in Prairie City
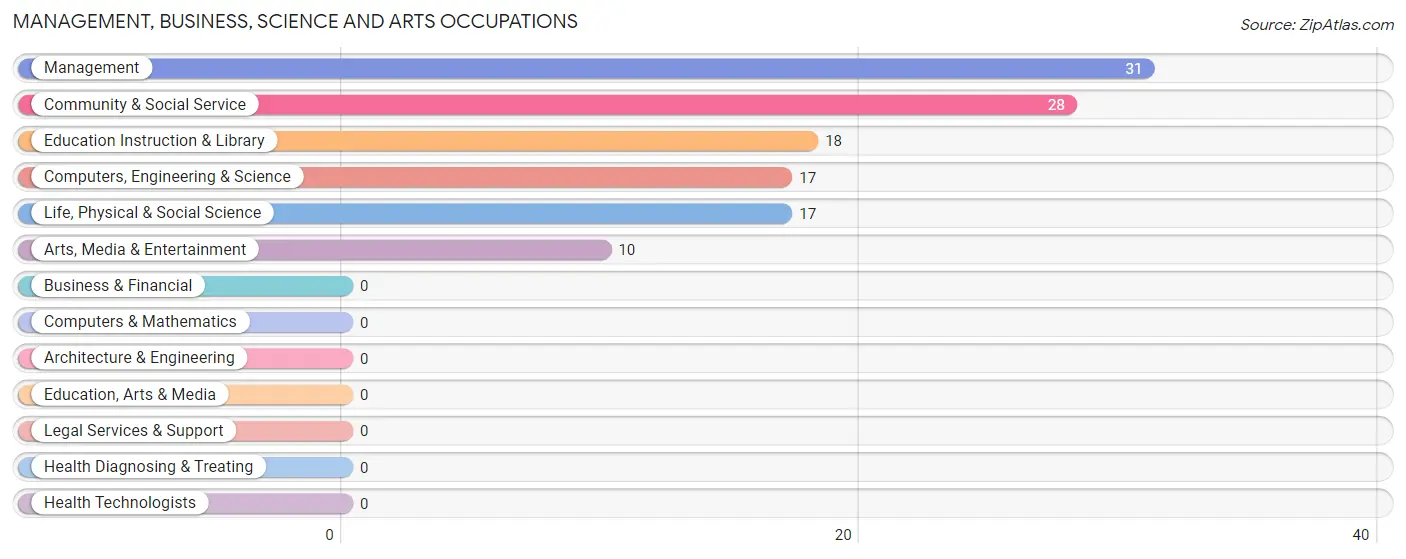
Management, Business, Science and Arts Occupations
The most common Management, Business, Science and Arts occupations in Prairie City are Management (31 | 12.0%), Community & Social Service (28 | 10.8%), Education Instruction & Library (18 | 7.0%), Computers, Engineering & Science (17 | 6.6%), and Life, Physical & Social Science (17 | 6.6%).
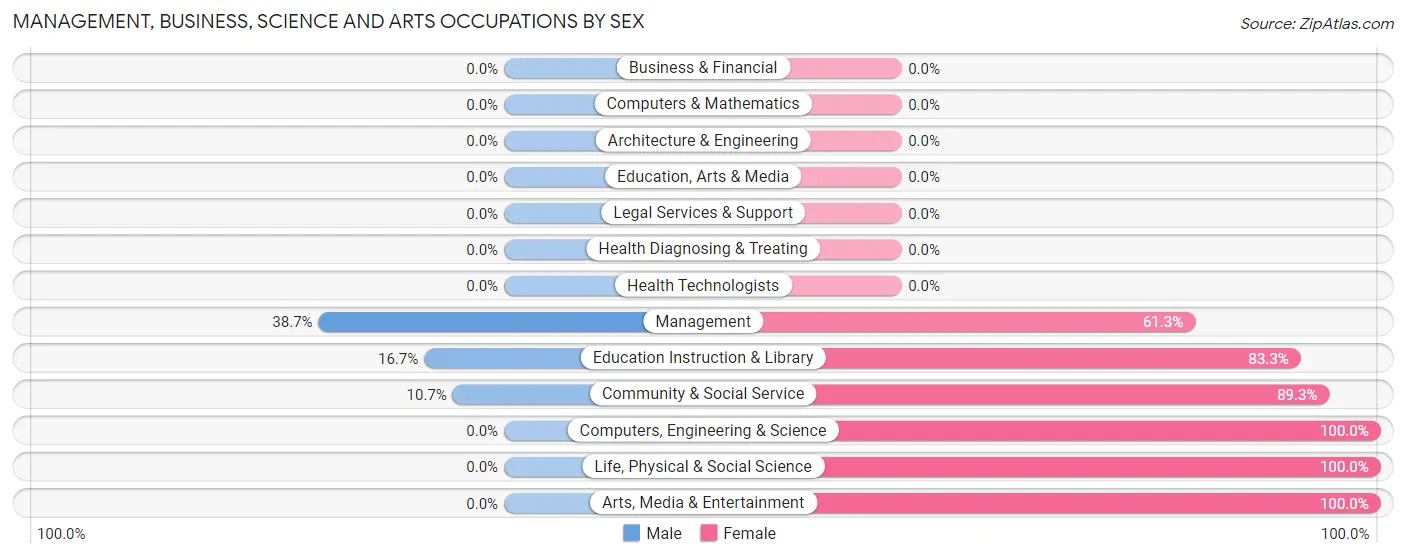
Management, Business, Science and Arts Occupations by Sex
Within the Management, Business, Science and Arts occupations in Prairie City, the most male-oriented occupations are Management (38.7%), Education Instruction & Library (16.7%), and Community & Social Service (10.7%), while the most female-oriented occupations are Computers, Engineering & Science (100.0%), Life, Physical & Social Science (100.0%), and Arts, Media & Entertainment (100.0%).
| Occupation | Male | Female |
| Management | 12 (38.7%) | 19 (61.3%) |
| Business & Financial | 0 (0.0%) | 0 (0.0%) |
| Computers, Engineering & Science | 0 (0.0%) | 17 (100.0%) |
| Computers & Mathematics | 0 (0.0%) | 0 (0.0%) |
| Architecture & Engineering | 0 (0.0%) | 0 (0.0%) |
| Life, Physical & Social Science | 0 (0.0%) | 17 (100.0%) |
| Community & Social Service | 3 (10.7%) | 25 (89.3%) |
| Education, Arts & Media | 0 (0.0%) | 0 (0.0%) |
| Legal Services & Support | 0 (0.0%) | 0 (0.0%) |
| Education Instruction & Library | 3 (16.7%) | 15 (83.3%) |
| Arts, Media & Entertainment | 0 (0.0%) | 10 (100.0%) |
| Health Diagnosing & Treating | 0 (0.0%) | 0 (0.0%) |
| Health Technologists | 0 (0.0%) | 0 (0.0%) |
| Total (Category) | 15 (19.7%) | 61 (80.3%) |
| Total (Overall) | 140 (54.0%) | 119 (46.0%) |
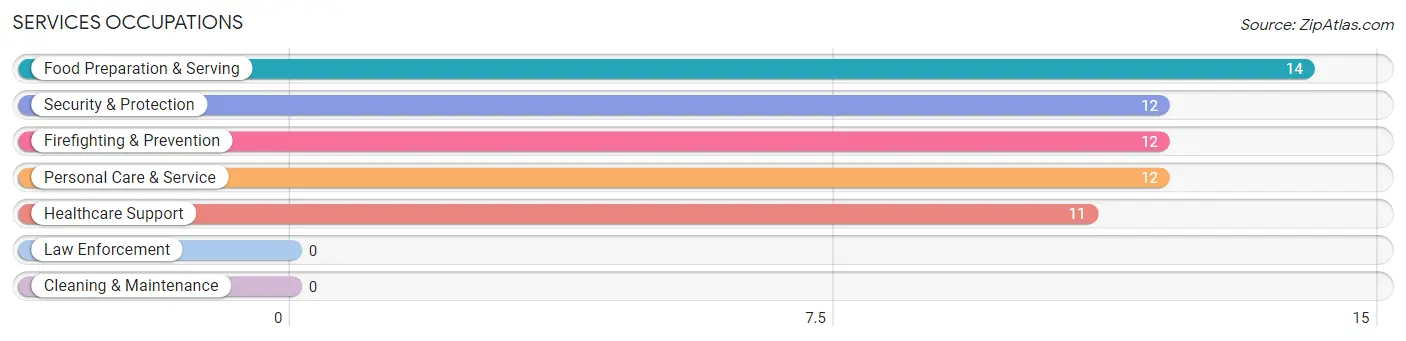
Services Occupations
The most common Services occupations in Prairie City are Food Preparation & Serving (14 | 5.4%), Security & Protection (12 | 4.6%), Firefighting & Prevention (12 | 4.6%), Personal Care & Service (12 | 4.6%), and Healthcare Support (11 | 4.3%).
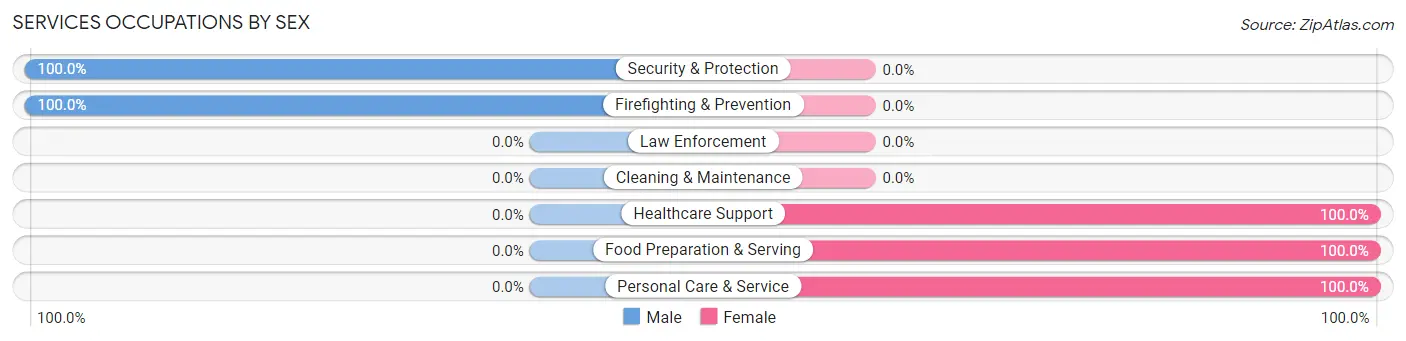
Services Occupations by Sex
Within the Services occupations in Prairie City, the most male-oriented occupations are Security & Protection (100.0%), and Firefighting & Prevention (100.0%), while the most female-oriented occupations are Healthcare Support (100.0%), Food Preparation & Serving (100.0%), and Personal Care & Service (100.0%).
| Occupation | Male | Female |
| Healthcare Support | 0 (0.0%) | 11 (100.0%) |
| Security & Protection | 12 (100.0%) | 0 (0.0%) |
| Firefighting & Prevention | 12 (100.0%) | 0 (0.0%) |
| Law Enforcement | 0 (0.0%) | 0 (0.0%) |
| Food Preparation & Serving | 0 (0.0%) | 14 (100.0%) |
| Cleaning & Maintenance | 0 (0.0%) | 0 (0.0%) |
| Personal Care & Service | 0 (0.0%) | 12 (100.0%) |
| Total (Category) | 12 (24.5%) | 37 (75.5%) |
| Total (Overall) | 140 (54.0%) | 119 (46.0%) |
Sales and Office Occupations
The most common Sales and Office occupations in Prairie City are Sales & Related (51 | 19.7%), and Office & Administration (13 | 5.0%).
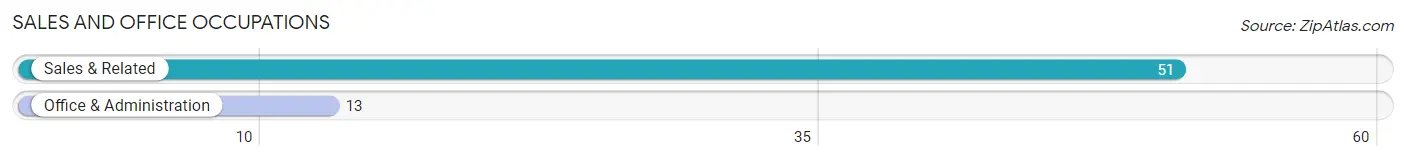
Sales and Office Occupations by Sex
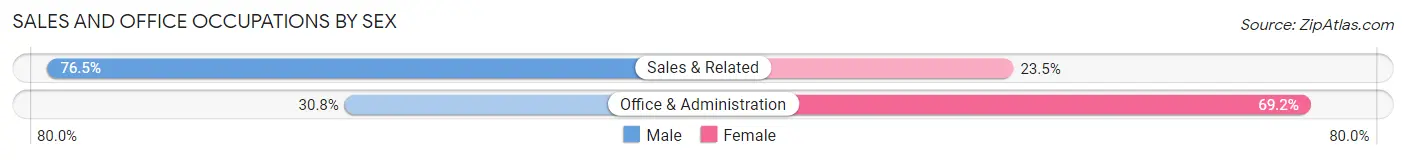
| Occupation | Male | Female |
| Sales & Related | 39 (76.5%) | 12 (23.5%) |
| Office & Administration | 4 (30.8%) | 9 (69.2%) |
| Total (Category) | 43 (67.2%) | 21 (32.8%) |
| Total (Overall) | 140 (54.0%) | 119 (46.0%) |
Natural Resources, Construction and Maintenance Occupations
The most common Natural Resources, Construction and Maintenance occupations in Prairie City are Construction & Extraction (52 | 20.1%), and Installation, Maintenance & Repair (18 | 7.0%).
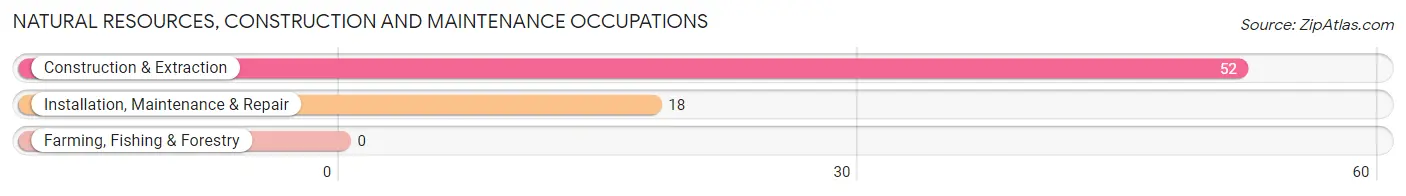
Natural Resources, Construction and Maintenance Occupations by Sex
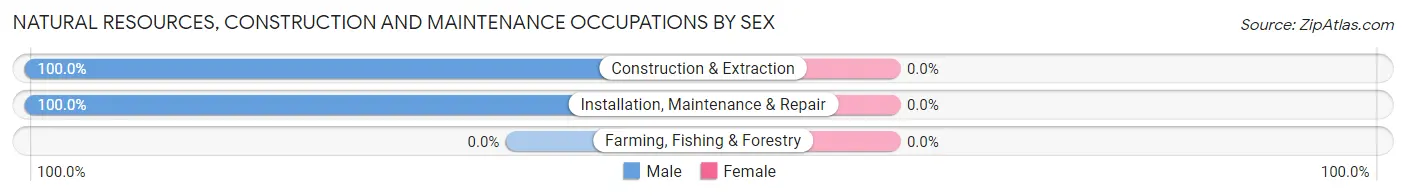
| Occupation | Male | Female |
| Farming, Fishing & Forestry | 0 (0.0%) | 0 (0.0%) |
| Construction & Extraction | 52 (100.0%) | 0 (0.0%) |
| Installation, Maintenance & Repair | 18 (100.0%) | 0 (0.0%) |
| Total (Category) | 70 (100.0%) | 0 (0.0%) |
| Total (Overall) | 140 (54.0%) | 119 (46.0%) |
Production, Transportation and Moving Occupations
Production, Transportation and Moving Occupations by Sex
| Occupation | Male | Female |
| Production | 0 (0.0%) | 0 (0.0%) |
| Transportation | 0 (0.0%) | 0 (0.0%) |
| Material Moving | 0 (0.0%) | 0 (0.0%) |
| Total (Category) | 0 (0.0%) | 0 (0.0%) |
| Total (Overall) | 140 (54.0%) | 119 (46.0%) |
Employment Industries by Sex in Prairie City
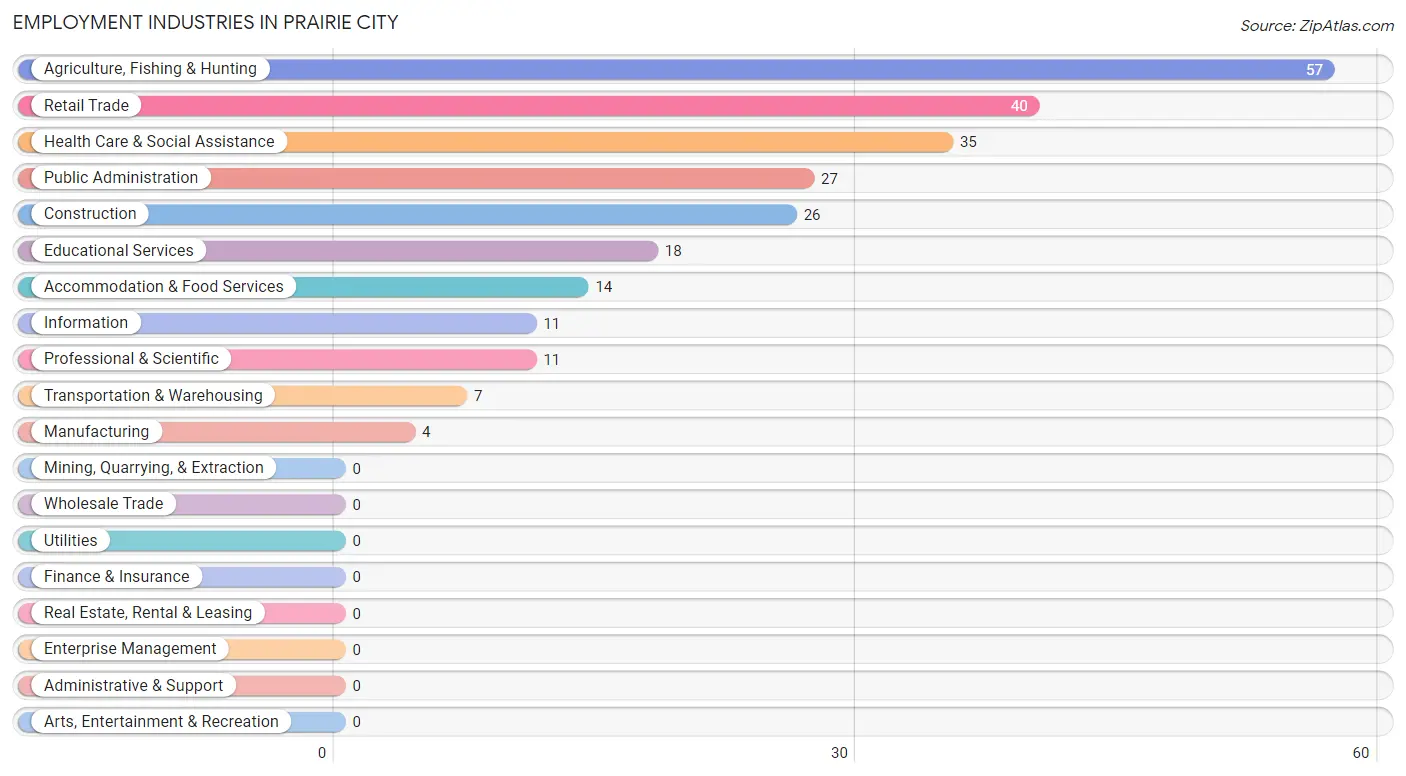
Employment Industries in Prairie City
The major employment industries in Prairie City include Agriculture, Fishing & Hunting (57 | 22.0%), Retail Trade (40 | 15.4%), Health Care & Social Assistance (35 | 13.5%), Public Administration (27 | 10.4%), and Construction (26 | 10.0%).
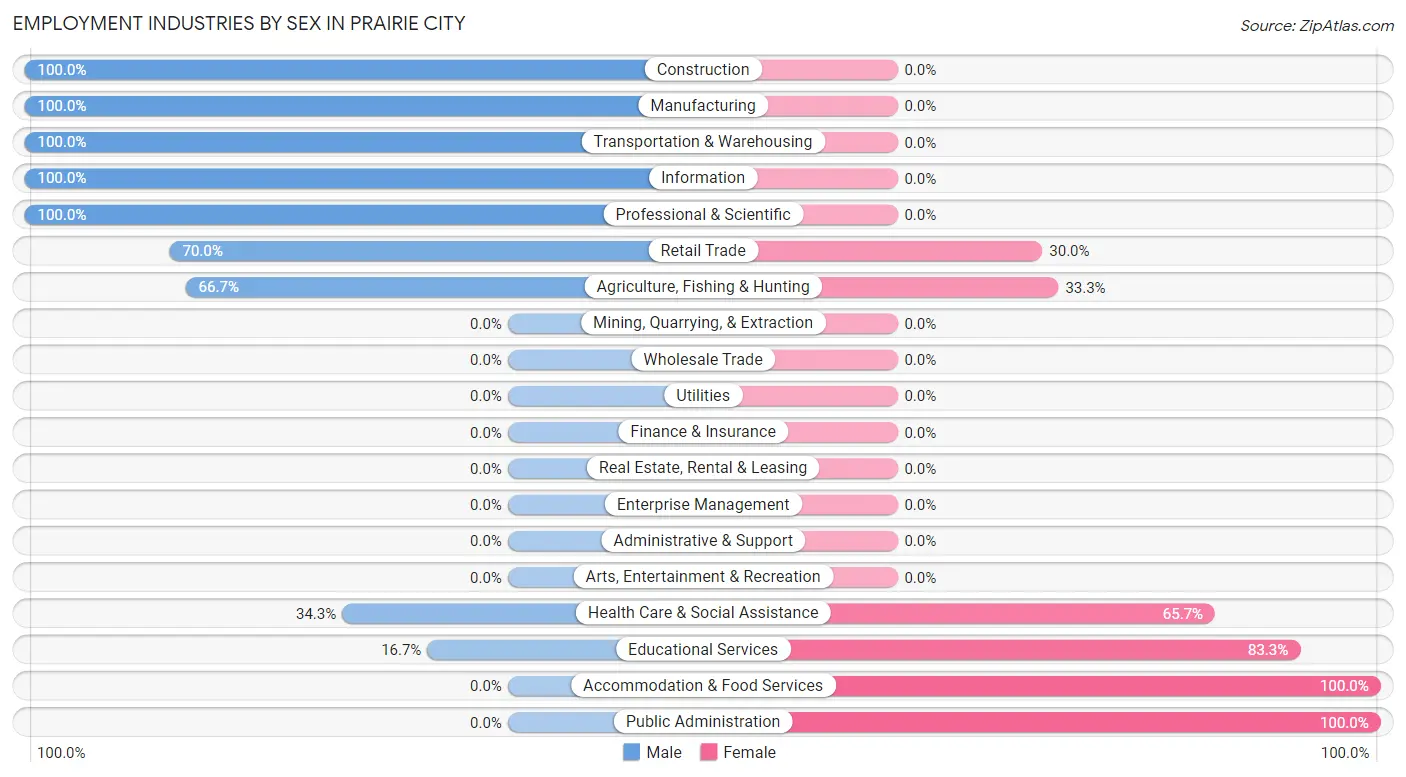
Employment Industries by Sex in Prairie City
The Prairie City industries that see more men than women are Construction (100.0%), Manufacturing (100.0%), and Transportation & Warehousing (100.0%), whereas the industries that tend to have a higher number of women are Accommodation & Food Services (100.0%), Public Administration (100.0%), and Educational Services (83.3%).
| Industry | Male | Female |
| Agriculture, Fishing & Hunting | 38 (66.7%) | 19 (33.3%) |
| Mining, Quarrying, & Extraction | 0 (0.0%) | 0 (0.0%) |
| Construction | 26 (100.0%) | 0 (0.0%) |
| Manufacturing | 4 (100.0%) | 0 (0.0%) |
| Wholesale Trade | 0 (0.0%) | 0 (0.0%) |
| Retail Trade | 28 (70.0%) | 12 (30.0%) |
| Transportation & Warehousing | 7 (100.0%) | 0 (0.0%) |
| Utilities | 0 (0.0%) | 0 (0.0%) |
| Information | 11 (100.0%) | 0 (0.0%) |
| Finance & Insurance | 0 (0.0%) | 0 (0.0%) |
| Real Estate, Rental & Leasing | 0 (0.0%) | 0 (0.0%) |
| Professional & Scientific | 11 (100.0%) | 0 (0.0%) |
| Enterprise Management | 0 (0.0%) | 0 (0.0%) |
| Administrative & Support | 0 (0.0%) | 0 (0.0%) |
| Educational Services | 3 (16.7%) | 15 (83.3%) |
| Health Care & Social Assistance | 12 (34.3%) | 23 (65.7%) |
| Arts, Entertainment & Recreation | 0 (0.0%) | 0 (0.0%) |
| Accommodation & Food Services | 0 (0.0%) | 14 (100.0%) |
| Public Administration | 0 (0.0%) | 27 (100.0%) |
| Total | 140 (54.0%) | 119 (46.0%) |
Education in Prairie City
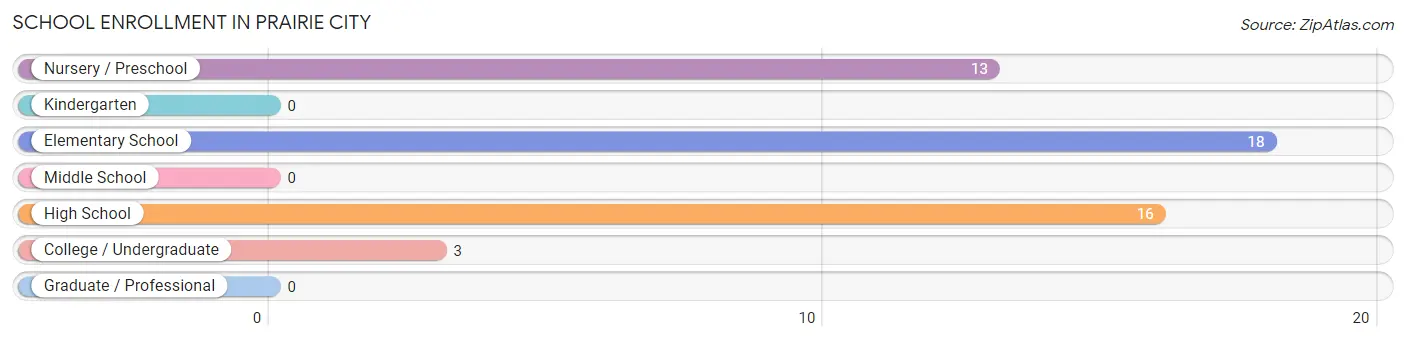
School Enrollment in Prairie City
The most common levels of schooling among the 50 students in Prairie City are elementary school (18 | 36.0%), high school (16 | 32.0%), and nursery / preschool (13 | 26.0%).
| School Level | # Students | % Students |
| Nursery / Preschool | 13 | 26.0% |
| Kindergarten | 0 | 0.0% |
| Elementary School | 18 | 36.0% |
| Middle School | 0 | 0.0% |
| High School | 16 | 32.0% |
| College / Undergraduate | 3 | 6.0% |
| Graduate / Professional | 0 | 0.0% |
| Total | 50 | 100.0% |
School Enrollment by Age by Funding Source in Prairie City
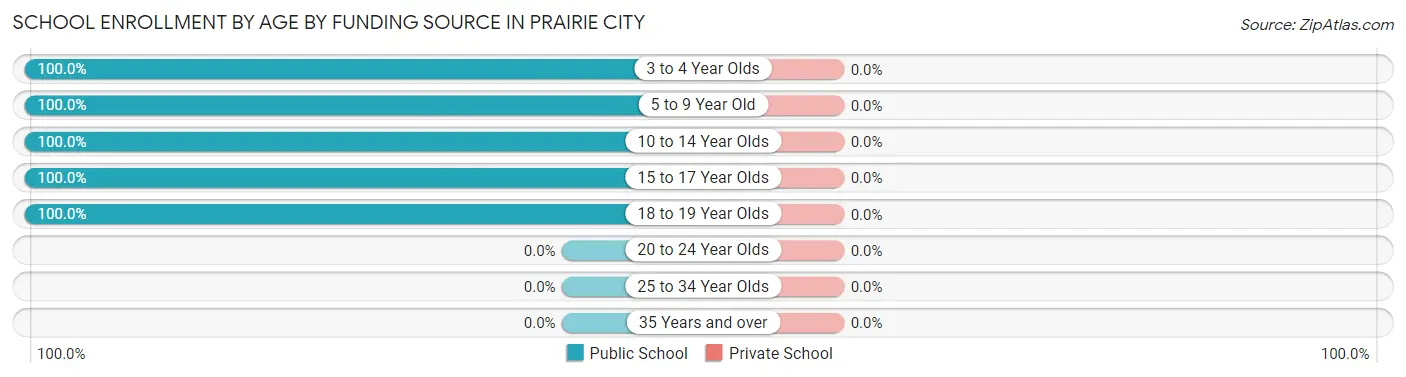
| Age Bracket | Public School | Private School |
| 3 to 4 Year Olds | 13 (100.0%) | 0 (0.0%) |
| 5 to 9 Year Old | 18 (100.0%) | 0 (0.0%) |
| 10 to 14 Year Olds | 5 (100.0%) | 0 (0.0%) |
| 15 to 17 Year Olds | 11 (100.0%) | 0 (0.0%) |
| 18 to 19 Year Olds | 3 (100.0%) | 0 (0.0%) |
| 20 to 24 Year Olds | 0 (0.0%) | 0 (0.0%) |
| 25 to 34 Year Olds | 0 (0.0%) | 0 (0.0%) |
| 35 Years and over | 0 (0.0%) | 0 (0.0%) |
| Total | 50 (100.0%) | 0 (0.0%) |
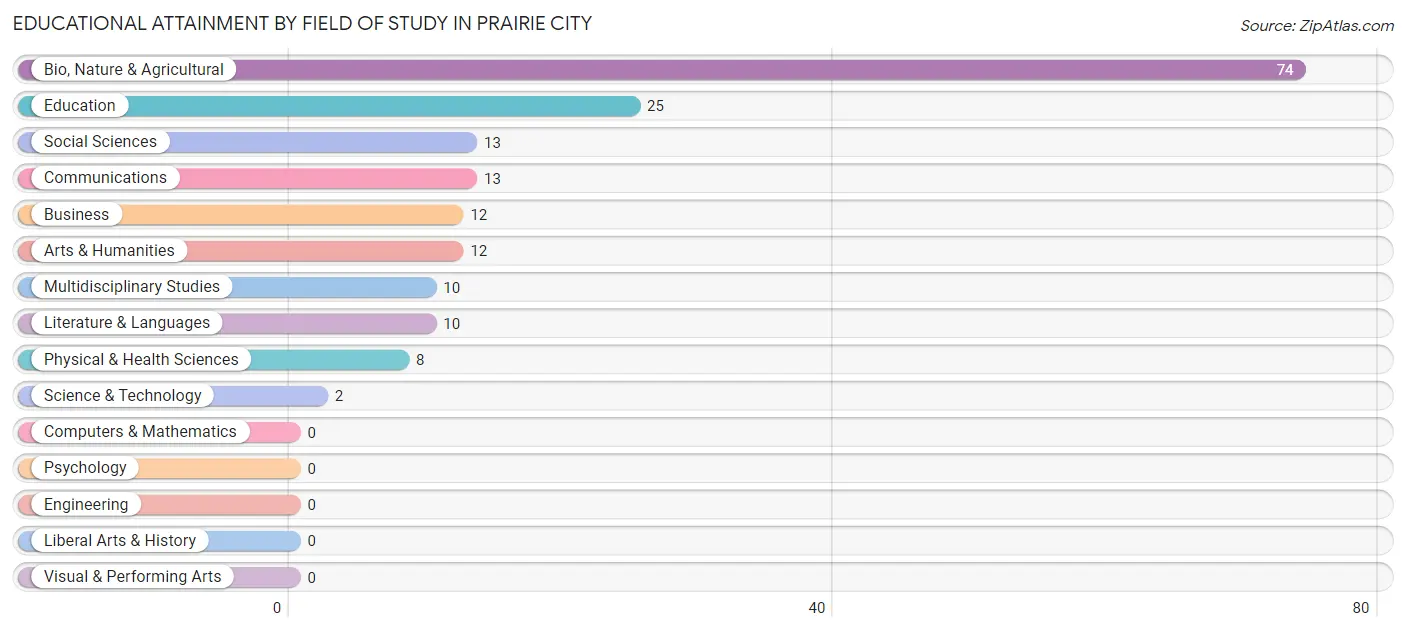
Educational Attainment by Field of Study in Prairie City
Bio, nature & agricultural (74 | 41.3%), education (25 | 14.0%), social sciences (13 | 7.3%), communications (13 | 7.3%), and business (12 | 6.7%) are the most common fields of study among 179 individuals in Prairie City who have obtained a bachelor's degree or higher.
| Field of Study | # Graduates | % Graduates |
| Computers & Mathematics | 0 | 0.0% |
| Bio, Nature & Agricultural | 74 | 41.3% |
| Physical & Health Sciences | 8 | 4.5% |
| Psychology | 0 | 0.0% |
| Social Sciences | 13 | 7.3% |
| Engineering | 0 | 0.0% |
| Multidisciplinary Studies | 10 | 5.6% |
| Science & Technology | 2 | 1.1% |
| Business | 12 | 6.7% |
| Education | 25 | 14.0% |
| Literature & Languages | 10 | 5.6% |
| Liberal Arts & History | 0 | 0.0% |
| Visual & Performing Arts | 0 | 0.0% |
| Communications | 13 | 7.3% |
| Arts & Humanities | 12 | 6.7% |
| Total | 179 | 100.0% |
Transportation & Commute in Prairie City
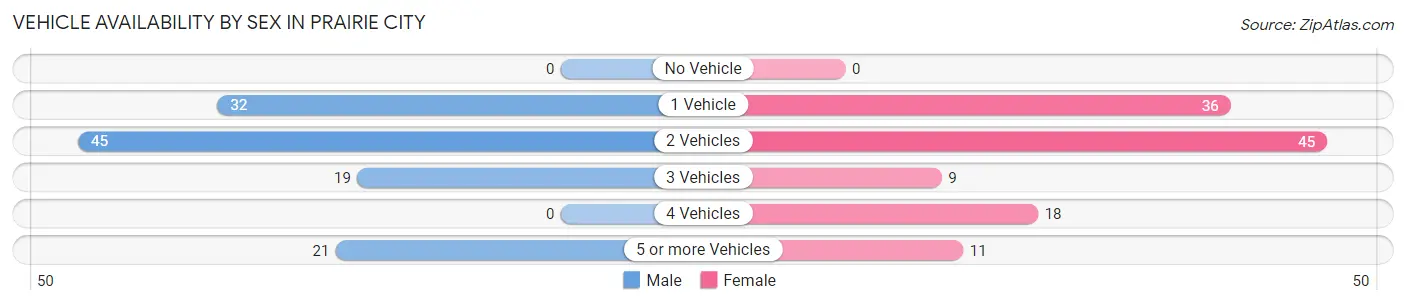
Vehicle Availability by Sex in Prairie City
The most prevalent vehicle ownership categories in Prairie City are males with 2 vehicles (45, accounting for 38.5%) and females with 2 vehicles (45, making up 37.8%).
| Vehicles Available | Male | Female |
| No Vehicle | 0 (0.0%) | 0 (0.0%) |
| 1 Vehicle | 32 (27.4%) | 36 (30.2%) |
| 2 Vehicles | 45 (38.5%) | 45 (37.8%) |
| 3 Vehicles | 19 (16.2%) | 9 (7.6%) |
| 4 Vehicles | 0 (0.0%) | 18 (15.1%) |
| 5 or more Vehicles | 21 (17.9%) | 11 (9.2%) |
| Total | 117 (100.0%) | 119 (100.0%) |
Commute Time in Prairie City
The most frequently occuring commute durations in Prairie City are less than 5 minutes (65 commuters, 30.4%), 15 to 19 minutes (47 commuters, 22.0%), and 20 to 24 minutes (31 commuters, 14.5%).
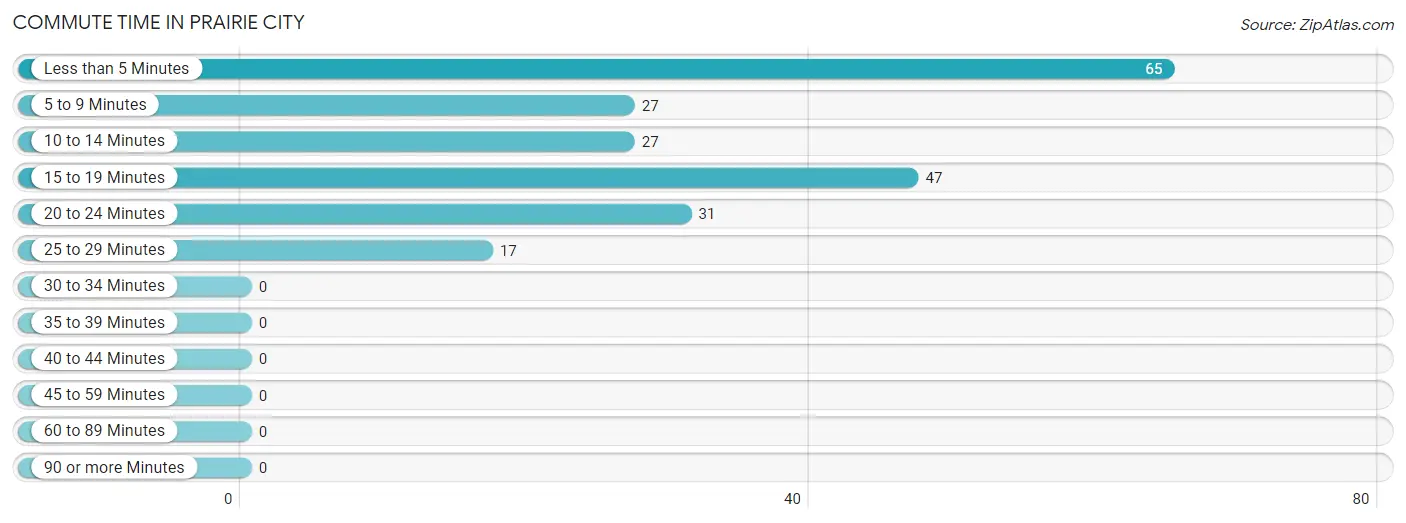
| Commute Time | # Commuters | % Commuters |
| Less than 5 Minutes | 65 | 30.4% |
| 5 to 9 Minutes | 27 | 12.6% |
| 10 to 14 Minutes | 27 | 12.6% |
| 15 to 19 Minutes | 47 | 22.0% |
| 20 to 24 Minutes | 31 | 14.5% |
| 25 to 29 Minutes | 17 | 7.9% |
| 30 to 34 Minutes | 0 | 0.0% |
| 35 to 39 Minutes | 0 | 0.0% |
| 40 to 44 Minutes | 0 | 0.0% |
| 45 to 59 Minutes | 0 | 0.0% |
| 60 to 89 Minutes | 0 | 0.0% |
| 90 or more Minutes | 0 | 0.0% |
Commute Time by Sex in Prairie City
The most common commute times in Prairie City are 15 to 19 minutes (30 commuters, 29.7%) for males and less than 5 minutes (55 commuters, 48.7%) for females.
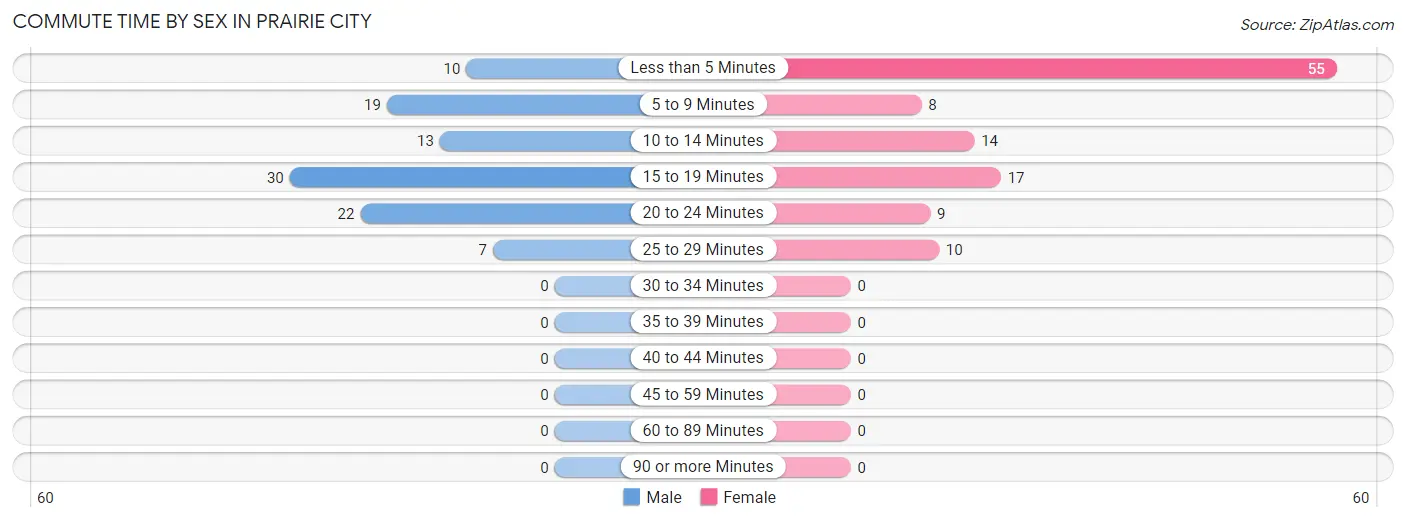
| Commute Time | Male | Female |
| Less than 5 Minutes | 10 (9.9%) | 55 (48.7%) |
| 5 to 9 Minutes | 19 (18.8%) | 8 (7.1%) |
| 10 to 14 Minutes | 13 (12.9%) | 14 (12.4%) |
| 15 to 19 Minutes | 30 (29.7%) | 17 (15.0%) |
| 20 to 24 Minutes | 22 (21.8%) | 9 (8.0%) |
| 25 to 29 Minutes | 7 (6.9%) | 10 (8.8%) |
| 30 to 34 Minutes | 0 (0.0%) | 0 (0.0%) |
| 35 to 39 Minutes | 0 (0.0%) | 0 (0.0%) |
| 40 to 44 Minutes | 0 (0.0%) | 0 (0.0%) |
| 45 to 59 Minutes | 0 (0.0%) | 0 (0.0%) |
| 60 to 89 Minutes | 0 (0.0%) | 0 (0.0%) |
| 90 or more Minutes | 0 (0.0%) | 0 (0.0%) |
Time of Departure to Work by Sex in Prairie City
The most frequent times of departure to work in Prairie City are 12:00 PM to 3:59 PM (22, 21.8%) for males and 8:00 AM to 8:29 AM (24, 21.2%) for females.
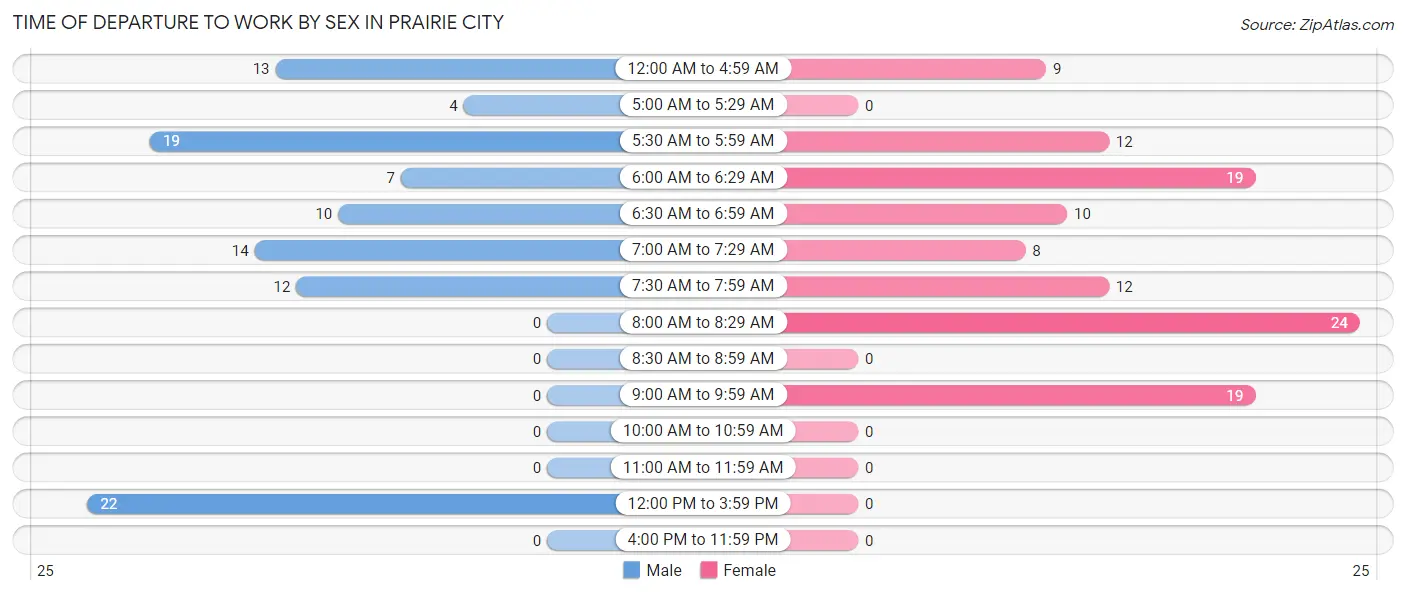
| Time of Departure | Male | Female |
| 12:00 AM to 4:59 AM | 13 (12.9%) | 9 (8.0%) |
| 5:00 AM to 5:29 AM | 4 (4.0%) | 0 (0.0%) |
| 5:30 AM to 5:59 AM | 19 (18.8%) | 12 (10.6%) |
| 6:00 AM to 6:29 AM | 7 (6.9%) | 19 (16.8%) |
| 6:30 AM to 6:59 AM | 10 (9.9%) | 10 (8.8%) |
| 7:00 AM to 7:29 AM | 14 (13.9%) | 8 (7.1%) |
| 7:30 AM to 7:59 AM | 12 (11.9%) | 12 (10.6%) |
| 8:00 AM to 8:29 AM | 0 (0.0%) | 24 (21.2%) |
| 8:30 AM to 8:59 AM | 0 (0.0%) | 0 (0.0%) |
| 9:00 AM to 9:59 AM | 0 (0.0%) | 19 (16.8%) |
| 10:00 AM to 10:59 AM | 0 (0.0%) | 0 (0.0%) |
| 11:00 AM to 11:59 AM | 0 (0.0%) | 0 (0.0%) |
| 12:00 PM to 3:59 PM | 22 (21.8%) | 0 (0.0%) |
| 4:00 PM to 11:59 PM | 0 (0.0%) | 0 (0.0%) |
| Total | 101 (100.0%) | 113 (100.0%) |
Housing Occupancy in Prairie City
Occupancy by Ownership in Prairie City
Of the total 396 dwellings in Prairie City, owner-occupied units account for 327 (82.6%), while renter-occupied units make up 69 (17.4%).
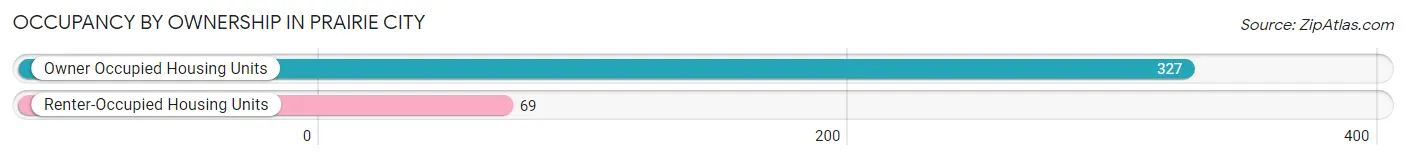
| Occupancy | # Housing Units | % Housing Units |
| Owner Occupied Housing Units | 327 | 82.6% |
| Renter-Occupied Housing Units | 69 | 17.4% |
| Total Occupied Housing Units | 396 | 100.0% |
Occupancy by Household Size in Prairie City
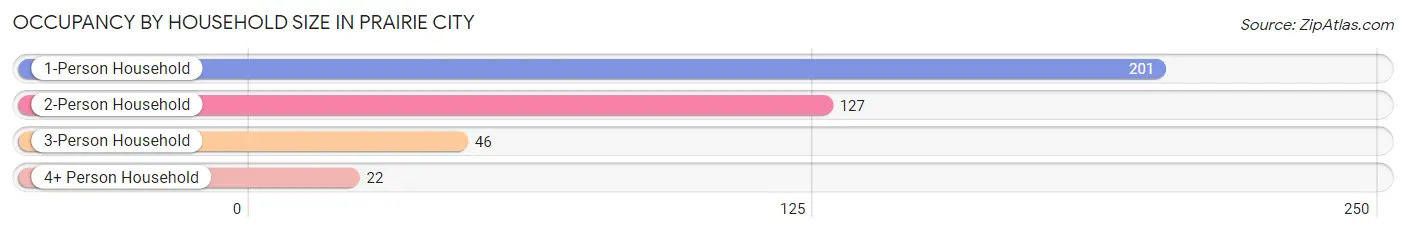
| Household Size | # Housing Units | % Housing Units |
| 1-Person Household | 201 | 50.8% |
| 2-Person Household | 127 | 32.1% |
| 3-Person Household | 46 | 11.6% |
| 4+ Person Household | 22 | 5.6% |
| Total Housing Units | 396 | 100.0% |
Occupancy by Ownership by Household Size in Prairie City
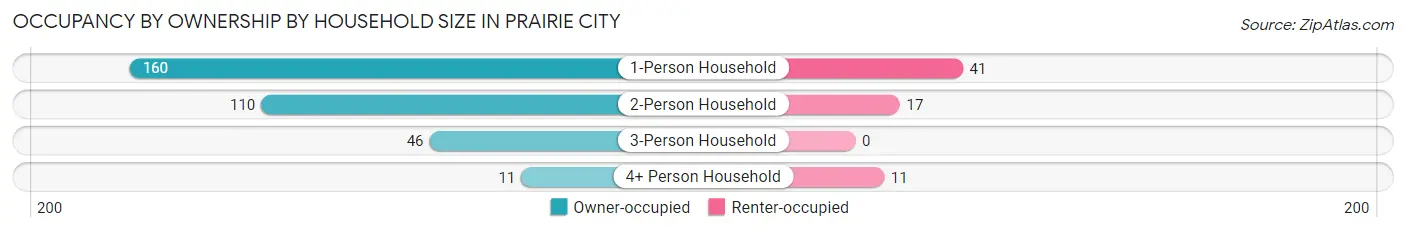
| Household Size | Owner-occupied | Renter-occupied |
| 1-Person Household | 160 (79.6%) | 41 (20.4%) |
| 2-Person Household | 110 (86.6%) | 17 (13.4%) |
| 3-Person Household | 46 (100.0%) | 0 (0.0%) |
| 4+ Person Household | 11 (50.0%) | 11 (50.0%) |
| Total Housing Units | 327 (82.6%) | 69 (17.4%) |
Occupancy by Educational Attainment in Prairie City
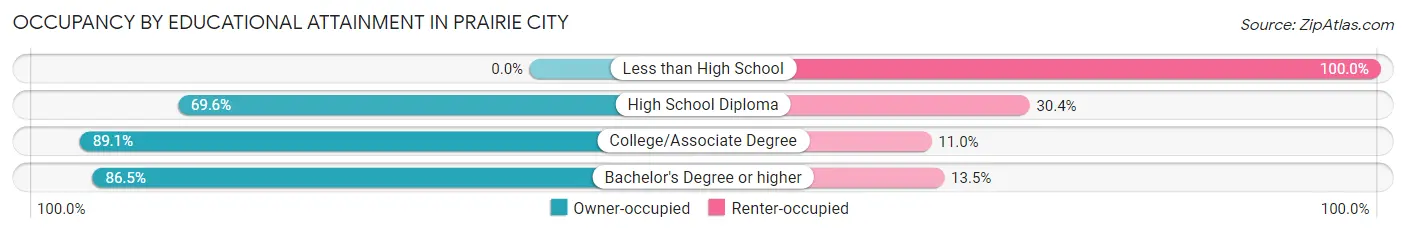
| Household Size | Owner-occupied | Renter-occupied |
| Less than High School | 0 (0.0%) | 4 (100.0%) |
| High School Diploma | 71 (69.6%) | 31 (30.4%) |
| College/Associate Degree | 179 (89.0%) | 22 (11.0%) |
| Bachelor's Degree or higher | 77 (86.5%) | 12 (13.5%) |
Occupancy by Age of Householder in Prairie City
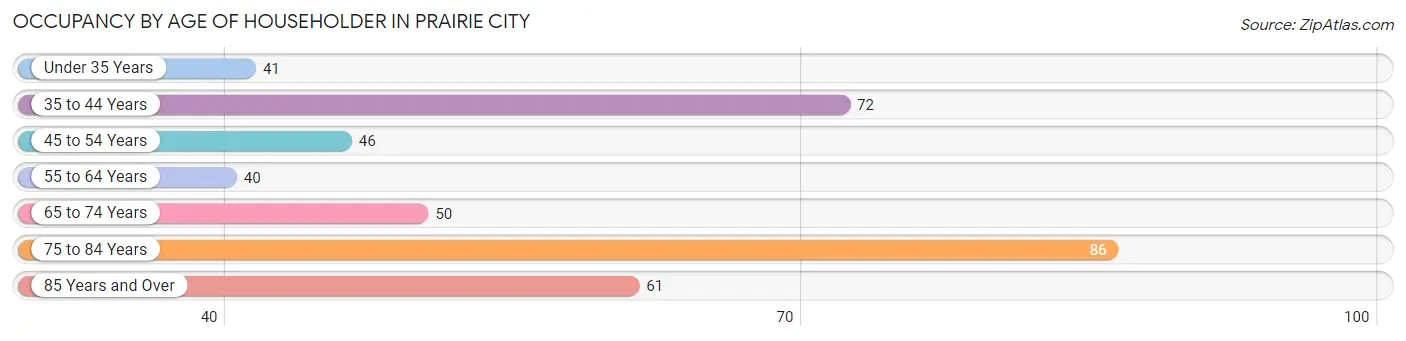
| Age Bracket | # Households | % Households |
| Under 35 Years | 41 | 10.3% |
| 35 to 44 Years | 72 | 18.2% |
| 45 to 54 Years | 46 | 11.6% |
| 55 to 64 Years | 40 | 10.1% |
| 65 to 74 Years | 50 | 12.6% |
| 75 to 84 Years | 86 | 21.7% |
| 85 Years and Over | 61 | 15.4% |
| Total | 396 | 100.0% |
Housing Finances in Prairie City
Median Income by Occupancy in Prairie City
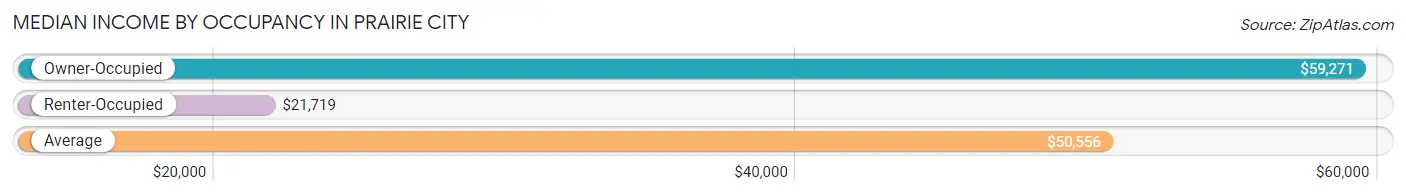
| Occupancy Type | # Households | Median Income |
| Owner-Occupied | 327 (82.6%) | $59,271 |
| Renter-Occupied | 69 (17.4%) | $21,719 |
| Average | 396 (100.0%) | $50,556 |
Occupancy by Householder Income Bracket in Prairie City
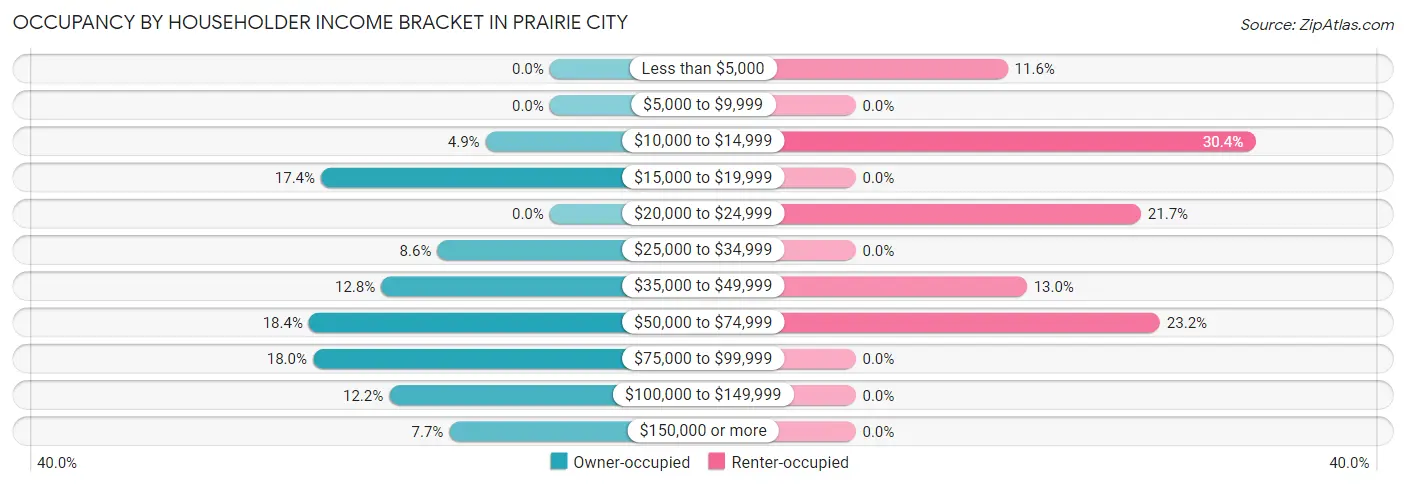
| Income Bracket | Owner-occupied | Renter-occupied |
| Less than $5,000 | 0 (0.0%) | 8 (11.6%) |
| $5,000 to $9,999 | 0 (0.0%) | 0 (0.0%) |
| $10,000 to $14,999 | 16 (4.9%) | 21 (30.4%) |
| $15,000 to $19,999 | 57 (17.4%) | 0 (0.0%) |
| $20,000 to $24,999 | 0 (0.0%) | 15 (21.7%) |
| $25,000 to $34,999 | 28 (8.6%) | 0 (0.0%) |
| $35,000 to $49,999 | 42 (12.8%) | 9 (13.0%) |
| $50,000 to $74,999 | 60 (18.3%) | 16 (23.2%) |
| $75,000 to $99,999 | 59 (18.0%) | 0 (0.0%) |
| $100,000 to $149,999 | 40 (12.2%) | 0 (0.0%) |
| $150,000 or more | 25 (7.6%) | 0 (0.0%) |
| Total | 327 (100.0%) | 69 (100.0%) |
Monthly Housing Cost Tiers in Prairie City
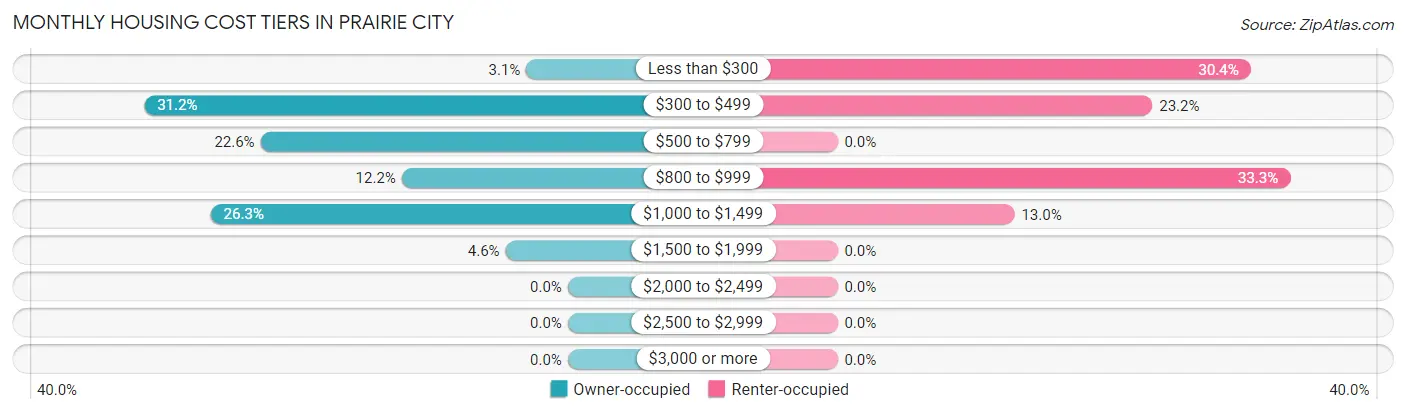
| Monthly Cost | Owner-occupied | Renter-occupied |
| Less than $300 | 10 (3.1%) | 21 (30.4%) |
| $300 to $499 | 102 (31.2%) | 16 (23.2%) |
| $500 to $799 | 74 (22.6%) | 0 (0.0%) |
| $800 to $999 | 40 (12.2%) | 23 (33.3%) |
| $1,000 to $1,499 | 86 (26.3%) | 9 (13.0%) |
| $1,500 to $1,999 | 15 (4.6%) | 0 (0.0%) |
| $2,000 to $2,499 | 0 (0.0%) | 0 (0.0%) |
| $2,500 to $2,999 | 0 (0.0%) | 0 (0.0%) |
| $3,000 or more | 0 (0.0%) | 0 (0.0%) |
| Total | 327 (100.0%) | 69 (100.0%) |
Physical Housing Characteristics in Prairie City
Housing Structures in Prairie City
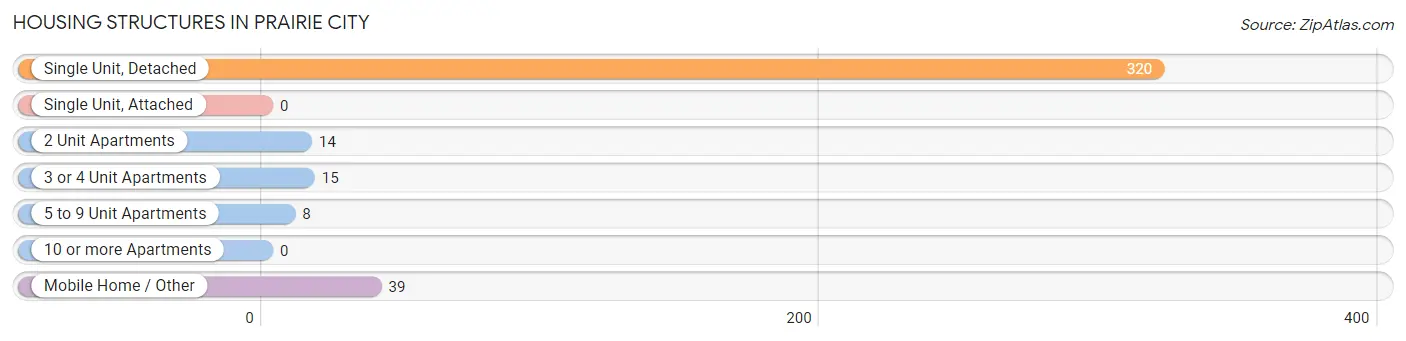
| Structure Type | # Housing Units | % Housing Units |
| Single Unit, Detached | 320 | 80.8% |
| Single Unit, Attached | 0 | 0.0% |
| 2 Unit Apartments | 14 | 3.5% |
| 3 or 4 Unit Apartments | 15 | 3.8% |
| 5 to 9 Unit Apartments | 8 | 2.0% |
| 10 or more Apartments | 0 | 0.0% |
| Mobile Home / Other | 39 | 9.9% |
| Total | 396 | 100.0% |
Housing Structures by Occupancy in Prairie City
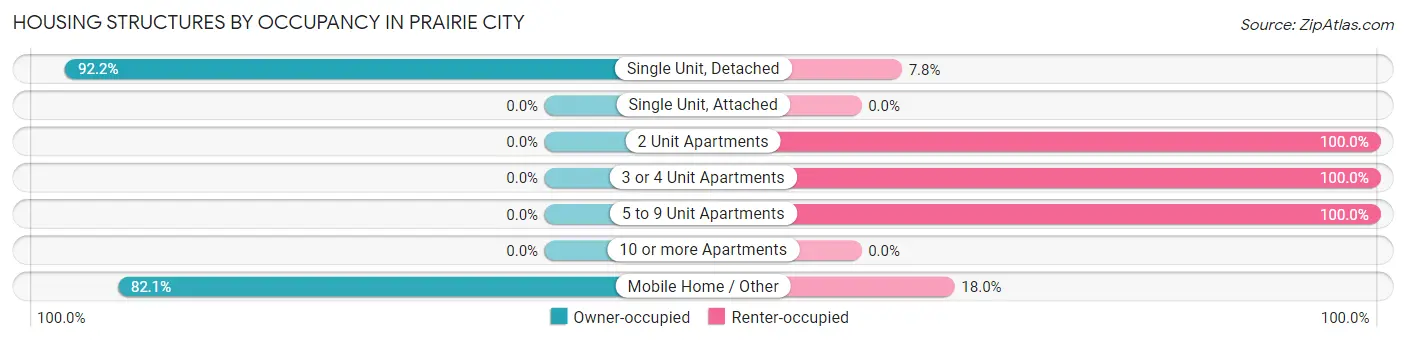
| Structure Type | Owner-occupied | Renter-occupied |
| Single Unit, Detached | 295 (92.2%) | 25 (7.8%) |
| Single Unit, Attached | 0 (0.0%) | 0 (0.0%) |
| 2 Unit Apartments | 0 (0.0%) | 14 (100.0%) |
| 3 or 4 Unit Apartments | 0 (0.0%) | 15 (100.0%) |
| 5 to 9 Unit Apartments | 0 (0.0%) | 8 (100.0%) |
| 10 or more Apartments | 0 (0.0%) | 0 (0.0%) |
| Mobile Home / Other | 32 (82.1%) | 7 (17.9%) |
| Total | 327 (82.6%) | 69 (17.4%) |
Housing Structures by Number of Rooms in Prairie City
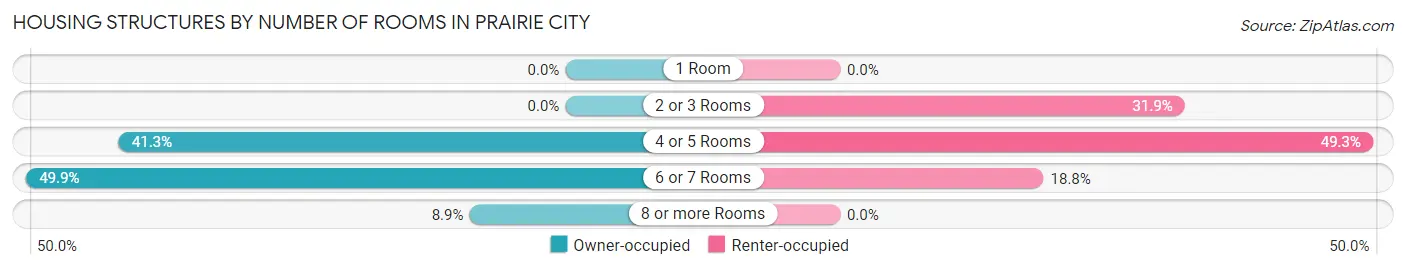
| Number of Rooms | Owner-occupied | Renter-occupied |
| 1 Room | 0 (0.0%) | 0 (0.0%) |
| 2 or 3 Rooms | 0 (0.0%) | 22 (31.9%) |
| 4 or 5 Rooms | 135 (41.3%) | 34 (49.3%) |
| 6 or 7 Rooms | 163 (49.8%) | 13 (18.8%) |
| 8 or more Rooms | 29 (8.9%) | 0 (0.0%) |
| Total | 327 (100.0%) | 69 (100.0%) |
Housing Structure by Heating Type in Prairie City
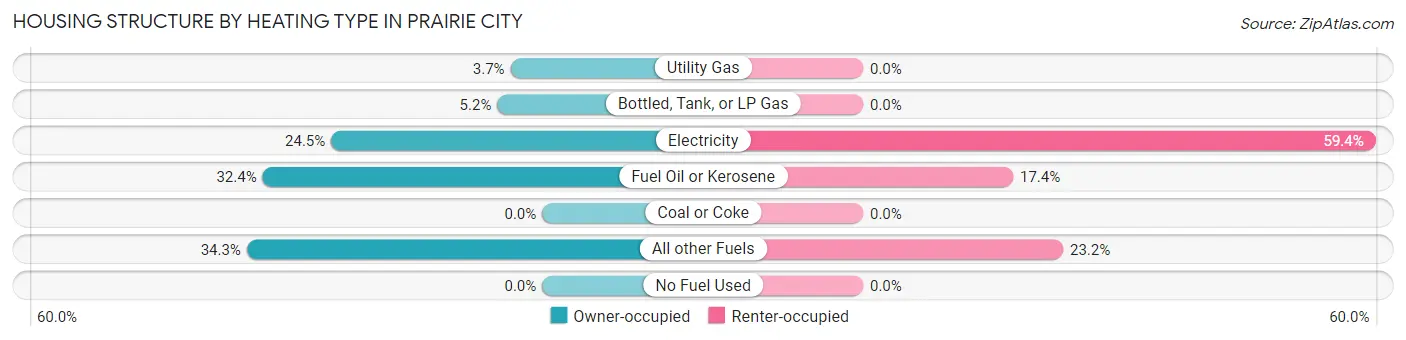
| Heating Type | Owner-occupied | Renter-occupied |
| Utility Gas | 12 (3.7%) | 0 (0.0%) |
| Bottled, Tank, or LP Gas | 17 (5.2%) | 0 (0.0%) |
| Electricity | 80 (24.5%) | 41 (59.4%) |
| Fuel Oil or Kerosene | 106 (32.4%) | 12 (17.4%) |
| Coal or Coke | 0 (0.0%) | 0 (0.0%) |
| All other Fuels | 112 (34.3%) | 16 (23.2%) |
| No Fuel Used | 0 (0.0%) | 0 (0.0%) |
| Total | 327 (100.0%) | 69 (100.0%) |
Household Vehicle Usage in Prairie City
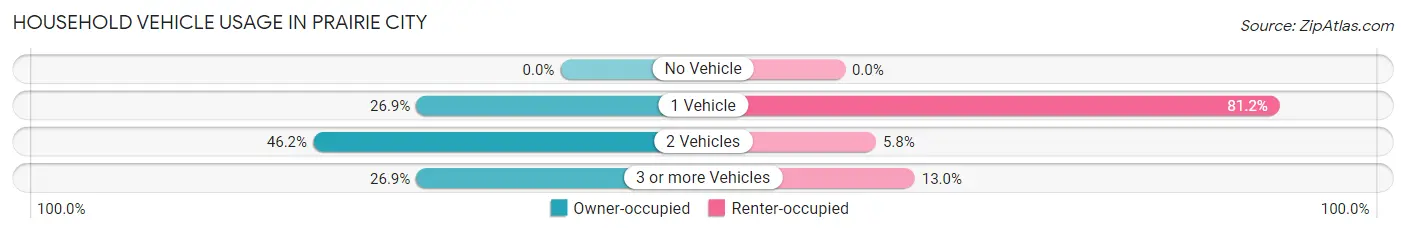
| Vehicles per Household | Owner-occupied | Renter-occupied |
| No Vehicle | 0 (0.0%) | 0 (0.0%) |
| 1 Vehicle | 88 (26.9%) | 56 (81.2%) |
| 2 Vehicles | 151 (46.2%) | 4 (5.8%) |
| 3 or more Vehicles | 88 (26.9%) | 9 (13.0%) |
| Total | 327 (100.0%) | 69 (100.0%) |
Real Estate & Mortgages in Prairie City
Real Estate and Mortgage Overview in Prairie City
| Characteristic | Without Mortgage | With Mortgage |
| Housing Units | 162 | 165 |
| Median Property Value | $122,200 | $160,100 |
| Median Household Income | $64,500 | $0 |
| Monthly Housing Costs | $467 | $0 |
| Real Estate Taxes | $1,859 | $0 |
Property Value by Mortgage Status in Prairie City
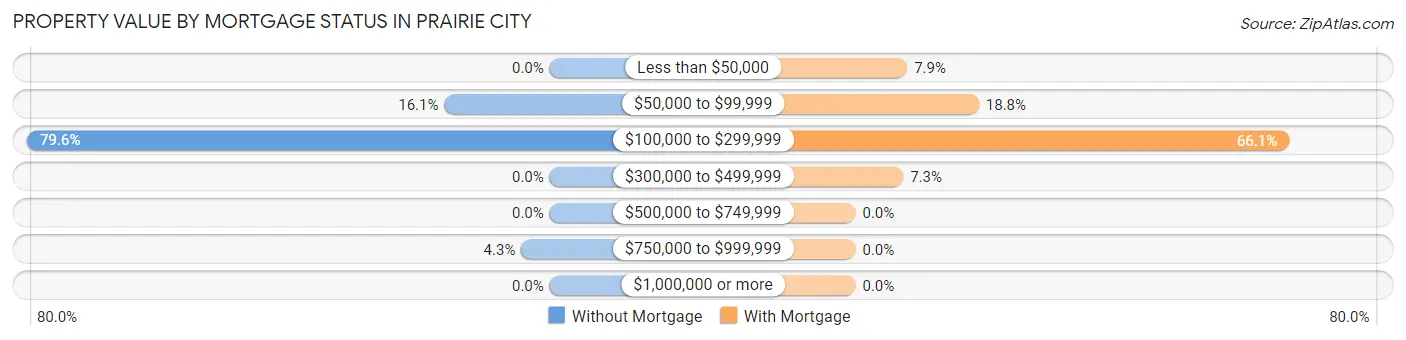
| Property Value | Without Mortgage | With Mortgage |
| Less than $50,000 | 0 (0.0%) | 13 (7.9%) |
| $50,000 to $99,999 | 26 (16.1%) | 31 (18.8%) |
| $100,000 to $299,999 | 129 (79.6%) | 109 (66.1%) |
| $300,000 to $499,999 | 0 (0.0%) | 12 (7.3%) |
| $500,000 to $749,999 | 0 (0.0%) | 0 (0.0%) |
| $750,000 to $999,999 | 7 (4.3%) | 0 (0.0%) |
| $1,000,000 or more | 0 (0.0%) | 0 (0.0%) |
| Total | 162 (100.0%) | 165 (100.0%) |
Household Income by Mortgage Status in Prairie City
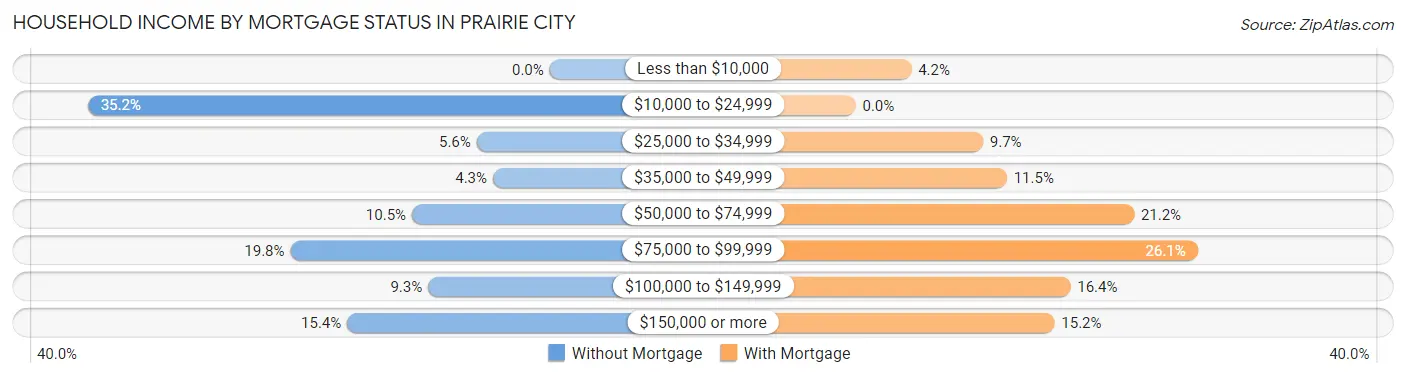
| Household Income | Without Mortgage | With Mortgage |
| Less than $10,000 | 0 (0.0%) | 7 (4.2%) |
| $10,000 to $24,999 | 57 (35.2%) | 0 (0.0%) |
| $25,000 to $34,999 | 9 (5.6%) | 16 (9.7%) |
| $35,000 to $49,999 | 7 (4.3%) | 19 (11.5%) |
| $50,000 to $74,999 | 17 (10.5%) | 35 (21.2%) |
| $75,000 to $99,999 | 32 (19.8%) | 43 (26.1%) |
| $100,000 to $149,999 | 15 (9.3%) | 27 (16.4%) |
| $150,000 or more | 25 (15.4%) | 25 (15.1%) |
| Total | 162 (100.0%) | 165 (100.0%) |
Property Value to Household Income Ratio in Prairie City
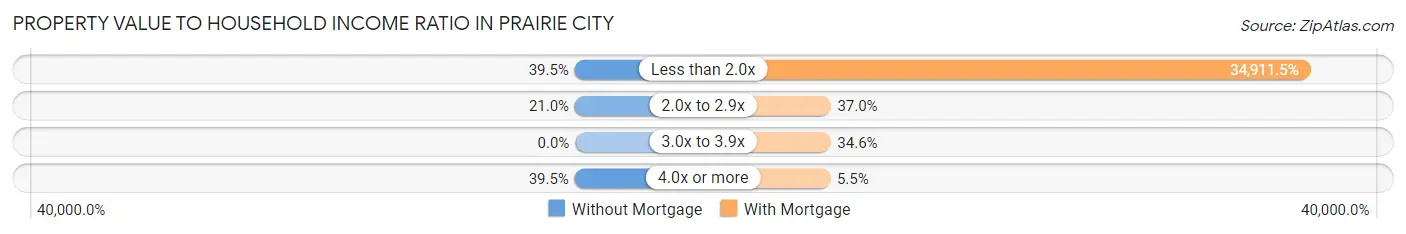
| Value-to-Income Ratio | Without Mortgage | With Mortgage |
| Less than 2.0x | 64 (39.5%) | 57,604 (34,911.5%) |
| 2.0x to 2.9x | 34 (21.0%) | 61 (37.0%) |
| 3.0x to 3.9x | 0 (0.0%) | 57 (34.5%) |
| 4.0x or more | 64 (39.5%) | 9 (5.4%) |
| Total | 162 (100.0%) | 165 (100.0%) |
Real Estate Taxes by Mortgage Status in Prairie City
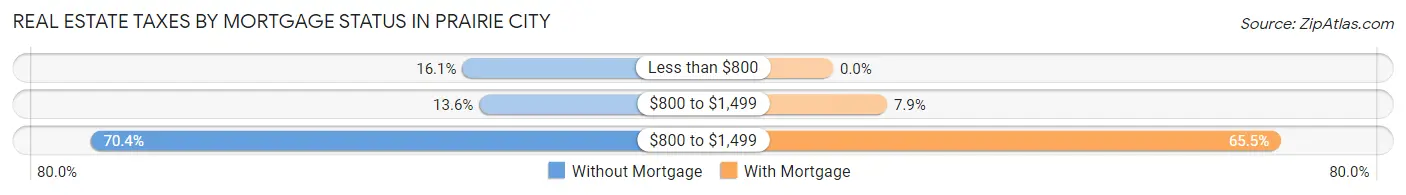
| Property Taxes | Without Mortgage | With Mortgage |
| Less than $800 | 26 (16.1%) | 0 (0.0%) |
| $800 to $1,499 | 22 (13.6%) | 13 (7.9%) |
| $800 to $1,499 | 114 (70.4%) | 108 (65.4%) |
| Total | 162 (100.0%) | 165 (100.0%) |
Health & Disability in Prairie City
Health Insurance Coverage by Age in Prairie City
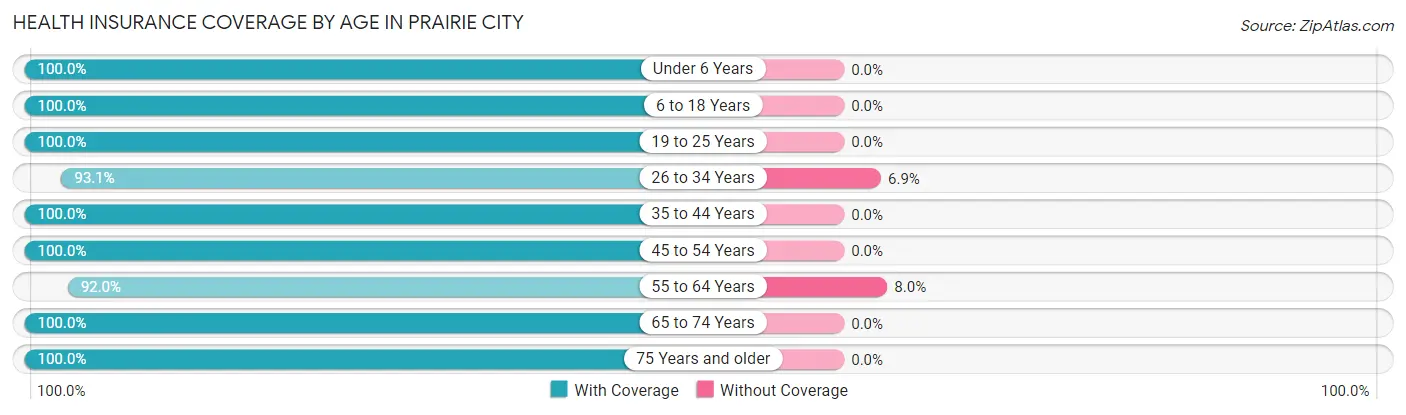
| Age Bracket | With Coverage | Without Coverage |
| Under 6 Years | 44 (100.0%) | 0 (0.0%) |
| 6 to 18 Years | 49 (100.0%) | 0 (0.0%) |
| 19 to 25 Years | 23 (100.0%) | 0 (0.0%) |
| 26 to 34 Years | 95 (93.1%) | 7 (6.9%) |
| 35 to 44 Years | 76 (100.0%) | 0 (0.0%) |
| 45 to 54 Years | 57 (100.0%) | 0 (0.0%) |
| 55 to 64 Years | 103 (92.0%) | 9 (8.0%) |
| 65 to 74 Years | 67 (100.0%) | 0 (0.0%) |
| 75 Years and older | 154 (100.0%) | 0 (0.0%) |
| Total | 668 (97.7%) | 16 (2.3%) |
Health Insurance Coverage by Citizenship Status in Prairie City
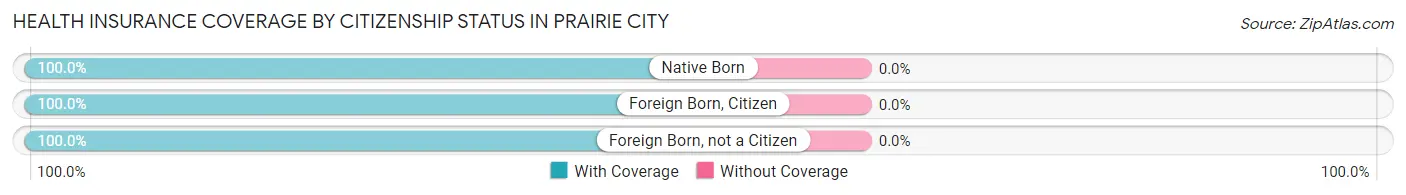
| Citizenship Status | With Coverage | Without Coverage |
| Native Born | 44 (100.0%) | 0 (0.0%) |
| Foreign Born, Citizen | 49 (100.0%) | 0 (0.0%) |
| Foreign Born, not a Citizen | 23 (100.0%) | 0 (0.0%) |
Health Insurance Coverage by Household Income in Prairie City
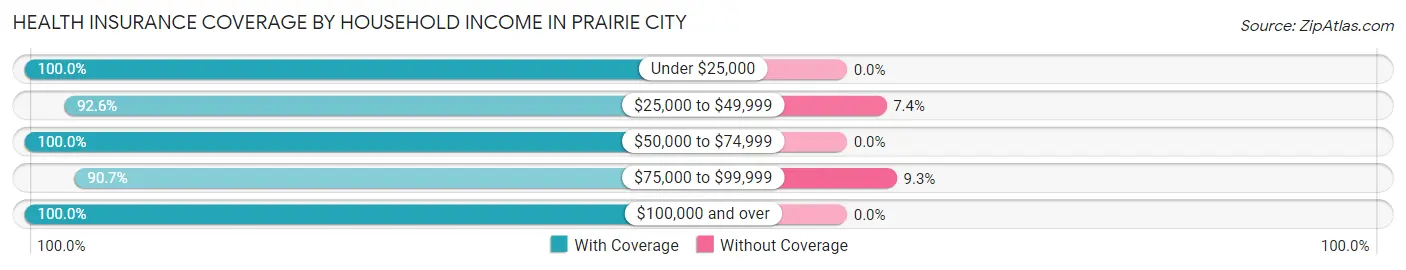
| Household Income | With Coverage | Without Coverage |
| Under $25,000 | 168 (100.0%) | 0 (0.0%) |
| $25,000 to $49,999 | 113 (92.6%) | 9 (7.4%) |
| $50,000 to $74,999 | 171 (100.0%) | 0 (0.0%) |
| $75,000 to $99,999 | 68 (90.7%) | 7 (9.3%) |
| $100,000 and over | 140 (100.0%) | 0 (0.0%) |
Public vs Private Health Insurance Coverage by Age in Prairie City
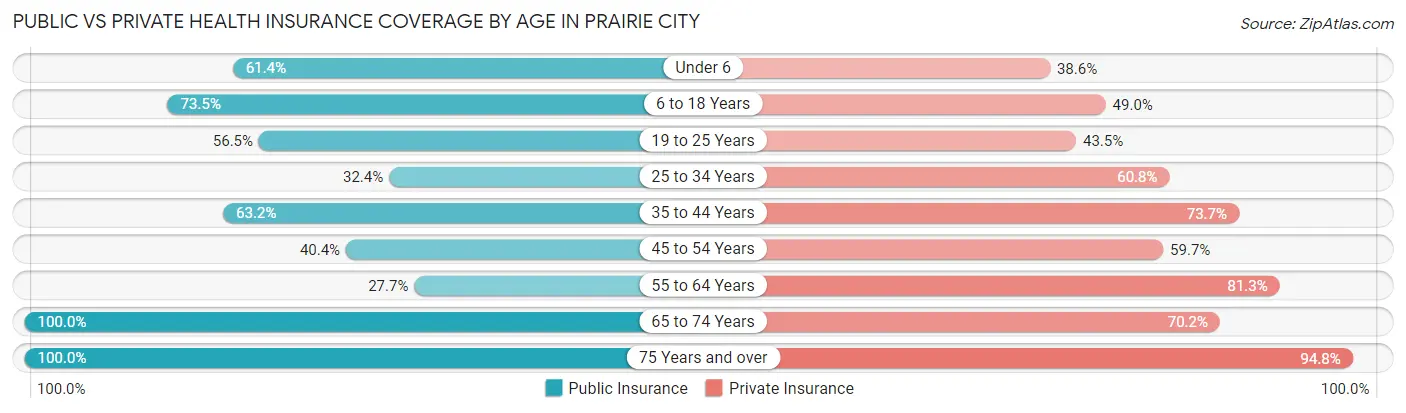
| Age Bracket | Public Insurance | Private Insurance |
| Under 6 | 27 (61.4%) | 17 (38.6%) |
| 6 to 18 Years | 36 (73.5%) | 24 (49.0%) |
| 19 to 25 Years | 13 (56.5%) | 10 (43.5%) |
| 25 to 34 Years | 33 (32.4%) | 62 (60.8%) |
| 35 to 44 Years | 48 (63.2%) | 56 (73.7%) |
| 45 to 54 Years | 23 (40.4%) | 34 (59.7%) |
| 55 to 64 Years | 31 (27.7%) | 91 (81.2%) |
| 65 to 74 Years | 67 (100.0%) | 47 (70.2%) |
| 75 Years and over | 154 (100.0%) | 146 (94.8%) |
| Total | 432 (63.2%) | 487 (71.2%) |
Disability Status by Sex by Age in Prairie City
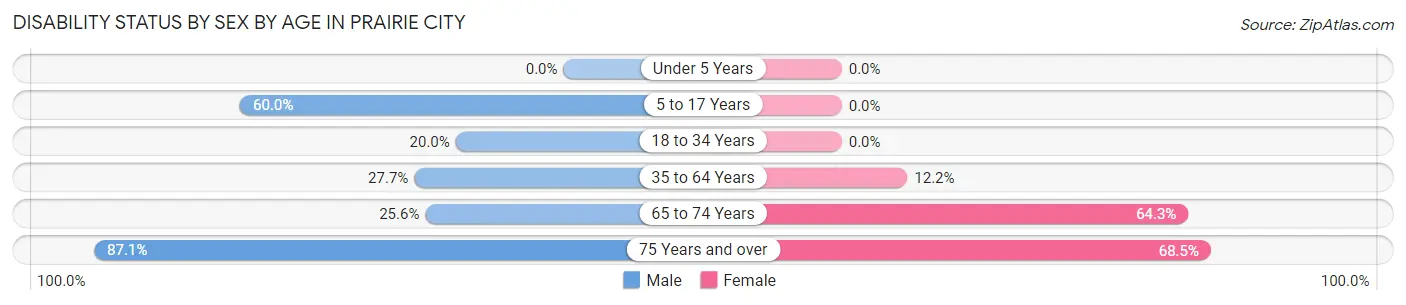
| Age Bracket | Male | Female |
| Under 5 Years | 0 (0.0%) | 0 (0.0%) |
| 5 to 17 Years | 15 (60.0%) | 0 (0.0%) |
| 18 to 34 Years | 11 (20.0%) | 0 (0.0%) |
| 35 to 64 Years | 36 (27.7%) | 14 (12.2%) |
| 65 to 74 Years | 10 (25.6%) | 18 (64.3%) |
| 75 Years and over | 54 (87.1%) | 63 (68.5%) |
Disability Class by Sex by Age in Prairie City
Disability Class: Hearing Difficulty
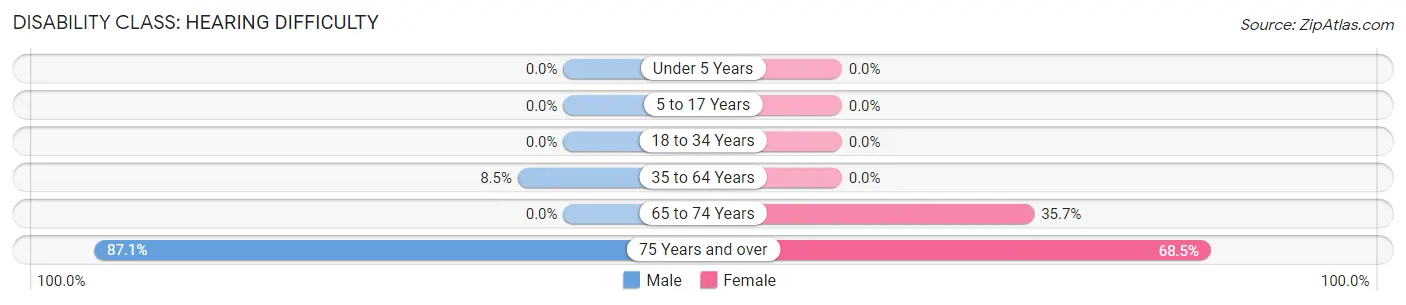
| Age Bracket | Male | Female |
| Under 5 Years | 0 (0.0%) | 0 (0.0%) |
| 5 to 17 Years | 0 (0.0%) | 0 (0.0%) |
| 18 to 34 Years | 0 (0.0%) | 0 (0.0%) |
| 35 to 64 Years | 11 (8.5%) | 0 (0.0%) |
| 65 to 74 Years | 0 (0.0%) | 10 (35.7%) |
| 75 Years and over | 54 (87.1%) | 63 (68.5%) |
Disability Class: Vision Difficulty
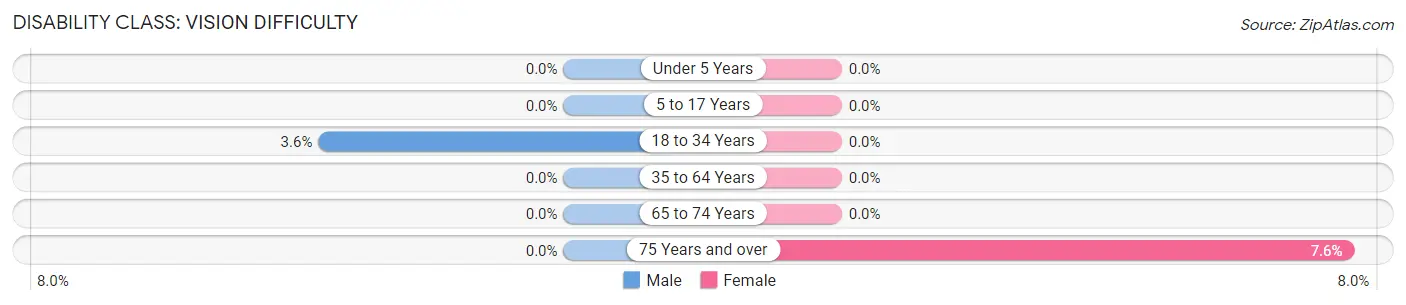
| Age Bracket | Male | Female |
| Under 5 Years | 0 (0.0%) | 0 (0.0%) |
| 5 to 17 Years | 0 (0.0%) | 0 (0.0%) |
| 18 to 34 Years | 2 (3.6%) | 0 (0.0%) |
| 35 to 64 Years | 0 (0.0%) | 0 (0.0%) |
| 65 to 74 Years | 0 (0.0%) | 0 (0.0%) |
| 75 Years and over | 0 (0.0%) | 7 (7.6%) |
Disability Class: Cognitive Difficulty
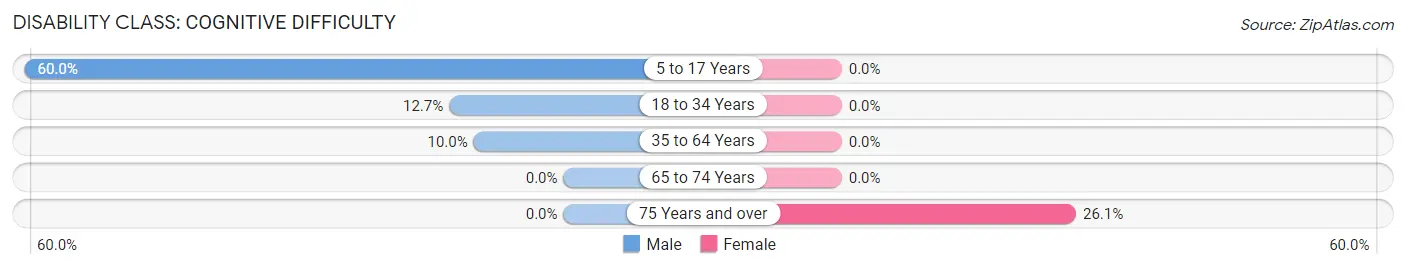
| Age Bracket | Male | Female |
| 5 to 17 Years | 15 (60.0%) | 0 (0.0%) |
| 18 to 34 Years | 7 (12.7%) | 0 (0.0%) |
| 35 to 64 Years | 13 (10.0%) | 0 (0.0%) |
| 65 to 74 Years | 0 (0.0%) | 0 (0.0%) |
| 75 Years and over | 0 (0.0%) | 24 (26.1%) |
Disability Class: Ambulatory Difficulty
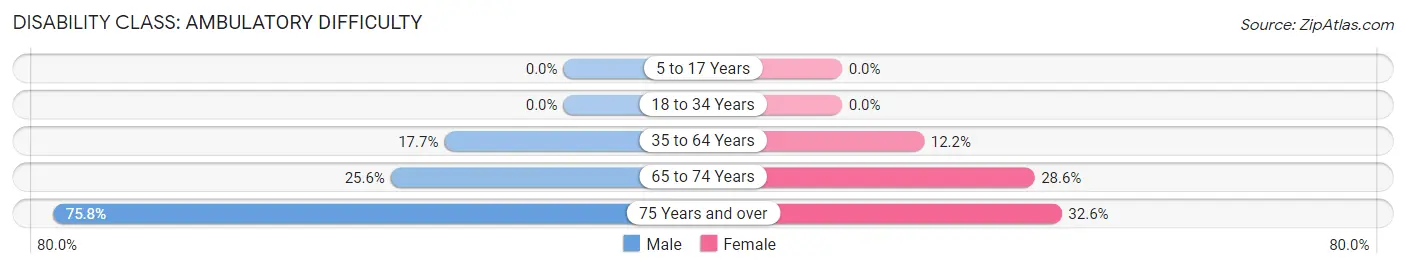
| Age Bracket | Male | Female |
| 5 to 17 Years | 0 (0.0%) | 0 (0.0%) |
| 18 to 34 Years | 0 (0.0%) | 0 (0.0%) |
| 35 to 64 Years | 23 (17.7%) | 14 (12.2%) |
| 65 to 74 Years | 10 (25.6%) | 8 (28.6%) |
| 75 Years and over | 47 (75.8%) | 30 (32.6%) |
Disability Class: Self-Care Difficulty
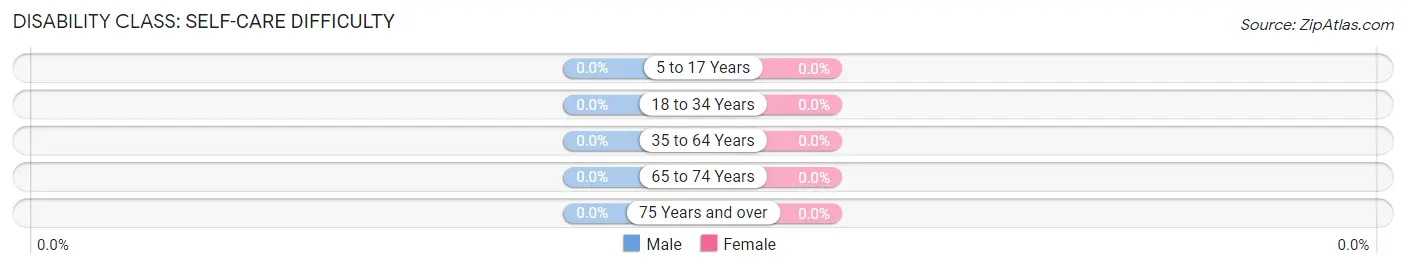
| Age Bracket | Male | Female |
| 5 to 17 Years | 0 (0.0%) | 0 (0.0%) |
| 18 to 34 Years | 0 (0.0%) | 0 (0.0%) |
| 35 to 64 Years | 0 (0.0%) | 0 (0.0%) |
| 65 to 74 Years | 0 (0.0%) | 0 (0.0%) |
| 75 Years and over | 0 (0.0%) | 0 (0.0%) |
Technology Access in Prairie City
Computing Device Access in Prairie City
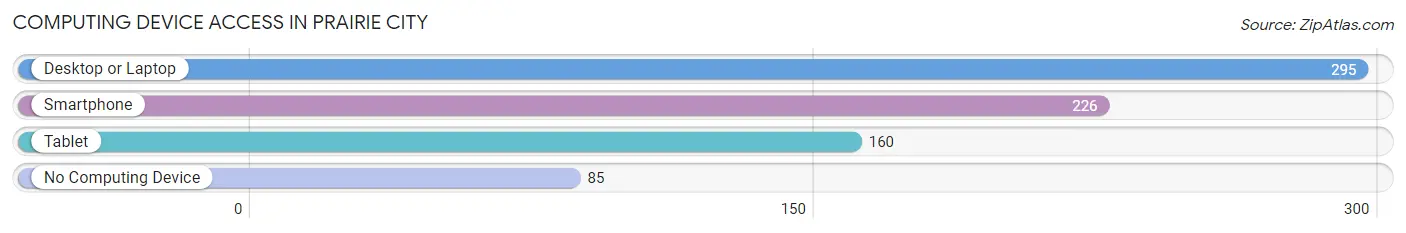
| Device Type | # Households | % Households |
| Desktop or Laptop | 295 | 74.5% |
| Smartphone | 226 | 57.1% |
| Tablet | 160 | 40.4% |
| No Computing Device | 85 | 21.5% |
| Total | 396 | 100.0% |
Internet Access in Prairie City
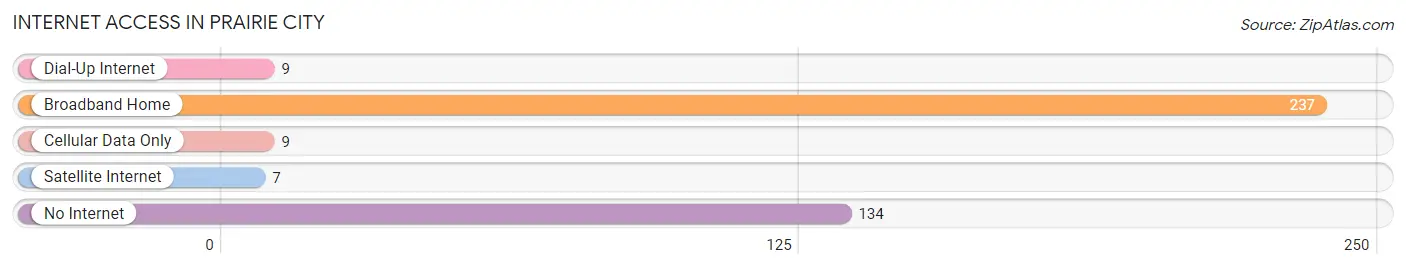
| Internet Type | # Households | % Households |
| Dial-Up Internet | 9 | 2.3% |
| Broadband Home | 237 | 59.9% |
| Cellular Data Only | 9 | 2.3% |
| Satellite Internet | 7 | 1.8% |
| No Internet | 134 | 33.8% |
| Total | 396 | 100.0% |
Prairie City Summary
Prairie City, Oregon is a small town located in Grant County in the eastern part of the state. It is situated in the Blue Mountains, at an elevation of 4,000 feet, and is surrounded by the John Day River and its tributaries. The town was founded in 1864 and is the oldest incorporated city in Grant County.
Geography
Prairie City is located in the Blue Mountains of eastern Oregon, at an elevation of 4,000 feet. The town is situated in a valley surrounded by the John Day River and its tributaries. The area is characterized by rolling hills, sagebrush, and juniper trees. The climate is semi-arid, with hot summers and cold winters.
Economy
Prairie City’s economy is largely based on agriculture and ranching. The town is home to several large cattle ranches, as well as a number of smaller farms. The area is also known for its production of hay, wheat, and other grains. In addition, the town is home to several small businesses, including a grocery store, a hardware store, and a restaurant.
Demographics
As of the 2010 census, Prairie City had a population of 1,072. The racial makeup of the town was 95.2% White, 0.3% African American, 0.7% Native American, 0.2% Asian, 0.1% Pacific Islander, 0.7% from other races, and 2.0% from two or more races. Hispanic or Latino of any race were 2.2% of the population.
History
Prairie City was founded in 1864 by a group of settlers from the Midwest. The town was originally called “Prairieville”, but the name was changed to “Prairie City” in 1868. The town was incorporated in 1872 and has remained an important center of commerce and culture in the region ever since.
In the late 19th century, Prairie City was a bustling center of commerce and industry. The town was home to several sawmills, a flour mill, a woolen mill, and a brickyard. The town also had a number of stores, saloons, and hotels.
In the early 20th century, the town’s economy shifted from industry to agriculture. The town is now home to several large cattle ranches, as well as a number of smaller farms. The area is also known for its production of hay, wheat, and other grains.
Today, Prairie City is a small, rural town with a population of just over 1,000. The town is home to several small businesses, including a grocery store, a hardware store, and a restaurant. The town is also home to a number of historic buildings, including the Prairie City Hotel, which was built in 1872.
Prairie City is a small, rural town with a rich history and a vibrant economy. The town is home to a number of historic buildings, as well as several small businesses. The town is also surrounded by the beautiful Blue Mountains and the John Day River, making it a great place to visit or live.
Common Questions
What is Per Capita Income in Prairie City?
Per Capita income in Prairie City is $34,940.
What is the Median Family Income in Prairie City?
Median Family Income in Prairie City is $62,303.
What is the Median Household income in Prairie City?
Median Household Income in Prairie City is $50,556.
What is Inequality or Gini Index in Prairie City?
Inequality or Gini Index in Prairie City is 0.45.
What is the Total Population of Prairie City?
Total Population of Prairie City is 717.
What is the Total Male Population of Prairie City?
Total Male Population of Prairie City is 365.
What is the Total Female Population of Prairie City?
Total Female Population of Prairie City is 352.
What is the Ratio of Males per 100 Females in Prairie City?
There are 103.69 Males per 100 Females in Prairie City.
What is the Ratio of Females per 100 Males in Prairie City?
There are 96.44 Females per 100 Males in Prairie City.
What is the Median Population Age in Prairie City?
Median Population Age in Prairie City is 57.4 Years.
What is the Average Family Size in Prairie City
Average Family Size in Prairie City is 2.5 People.
What is the Average Household Size in Prairie City
Average Household Size in Prairie City is 1.7 People.
How Large is the Labor Force in Prairie City?
There are 277 People in the Labor Forcein in Prairie City.
What is the Percentage of People in the Labor Force in Prairie City?
44.4% of People are in the Labor Force in Prairie City.
What is the Unemployment Rate in Prairie City?
Unemployment Rate in Prairie City is 6.5%.