Pinetop Lakeside, AZ Map & Demographics
Pinetop Lakeside Map
Pinetop Lakeside Overview
$33,617
PER CAPITA INCOME
$61,402
AVG FAMILY INCOME
$57,125
AVG HOUSEHOLD INCOME
47.7%
WAGE / INCOME GAP [ % ]
52.3¢/ $1
WAGE / INCOME GAP [ $ ]
0.41
INEQUALITY / GINI INDEX
4,080
TOTAL POPULATION
1,943
MALE POPULATION
2,137
FEMALE POPULATION
90.92
MALES / 100 FEMALES
109.98
FEMALES / 100 MALES
51.9
MEDIAN AGE
2.8
AVG FAMILY SIZE
2.3
AVG HOUSEHOLD SIZE
1,830
LABOR FORCE [ PEOPLE ]
51.6%
PERCENT IN LABOR FORCE
4.9%
UNEMPLOYMENT RATE
Pinetop Lakeside Area Codes
Income in Pinetop Lakeside
Income Overview in Pinetop Lakeside
Per Capita Income in Pinetop Lakeside is $33,617, while median incomes of families and households are $61,402 and $57,125 respectively.
| Characteristic | Number | Measure |
| Per Capita Income | 4,080 | $33,617 |
| Median Family Income | 1,178 | $61,402 |
| Mean Family Income | 1,178 | $81,701 |
| Median Household Income | 1,769 | $57,125 |
| Mean Household Income | 1,769 | $76,019 |
| Income Deficit | 1,178 | $0 |
| Wage / Income Gap (%) | 4,080 | 47.66% |
| Wage / Income Gap ($) | 4,080 | 52.34¢ per $1 |
| Gini / Inequality Index | 4,080 | 0.41 |
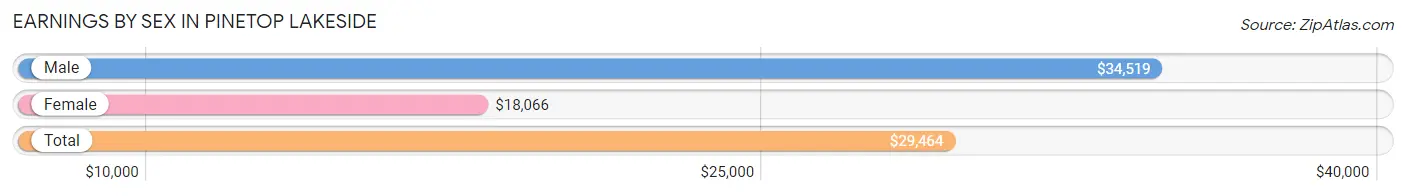
Earnings by Sex in Pinetop Lakeside
Average Earnings in Pinetop Lakeside are $29,464, $34,519 for men and $18,066 for women, a difference of 47.7%.
| Sex | Number | Average Earnings |
| Male | 1,049 (55.1%) | $34,519 |
| Female | 854 (44.9%) | $18,066 |
| Total | 1,903 (100.0%) | $29,464 |
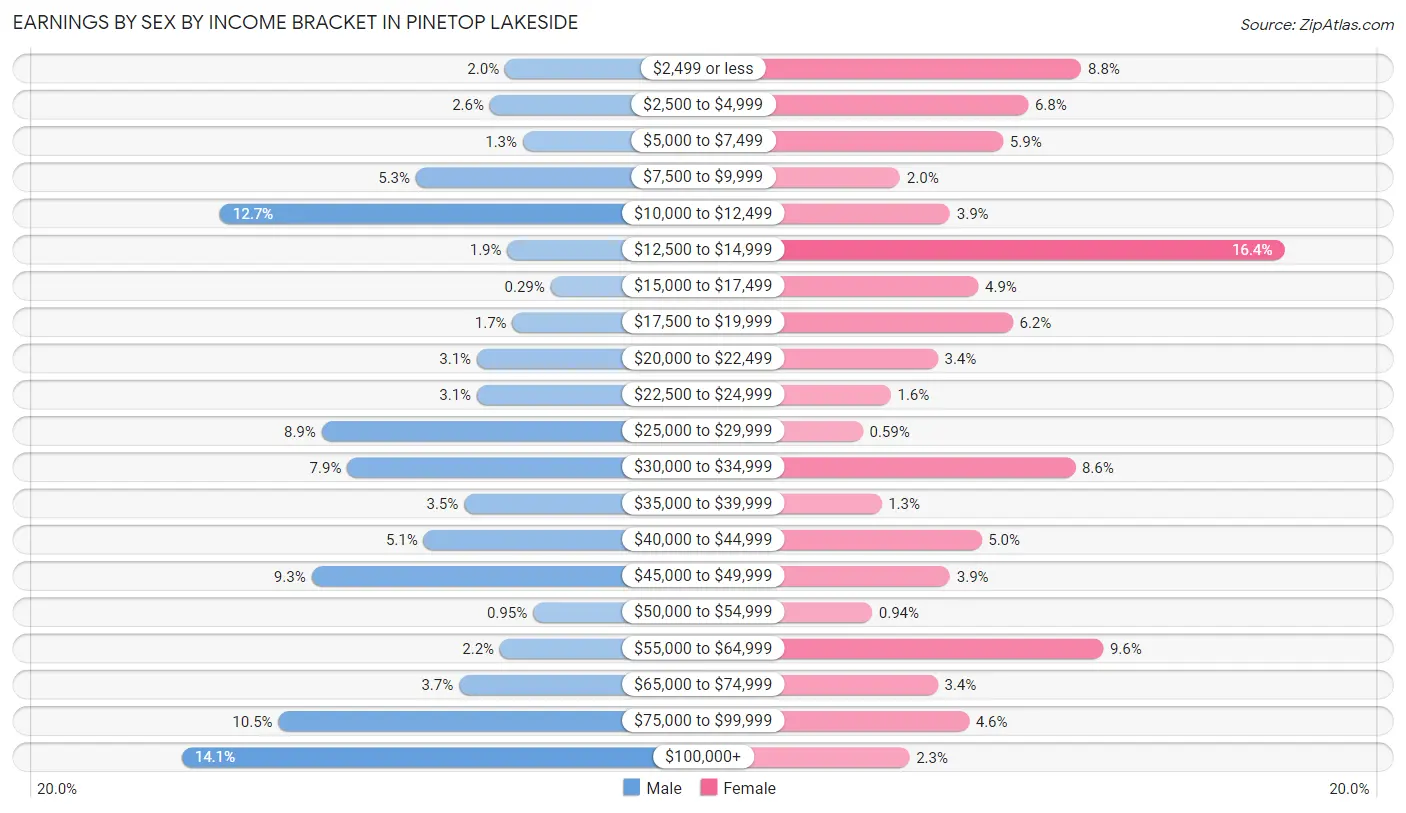
Earnings by Sex by Income Bracket in Pinetop Lakeside
The most common earnings brackets in Pinetop Lakeside are $100,000+ for men (148 | 14.1%) and $12,500 to $14,999 for women (140 | 16.4%).
| Income | Male | Female |
| $2,499 or less | 21 (2.0%) | 75 (8.8%) |
| $2,500 to $4,999 | 27 (2.6%) | 58 (6.8%) |
| $5,000 to $7,499 | 14 (1.3%) | 50 (5.9%) |
| $7,500 to $9,999 | 56 (5.3%) | 17 (2.0%) |
| $10,000 to $12,499 | 133 (12.7%) | 33 (3.9%) |
| $12,500 to $14,999 | 20 (1.9%) | 140 (16.4%) |
| $15,000 to $17,499 | 3 (0.3%) | 42 (4.9%) |
| $17,500 to $19,999 | 18 (1.7%) | 53 (6.2%) |
| $20,000 to $22,499 | 32 (3.0%) | 29 (3.4%) |
| $22,500 to $24,999 | 32 (3.0%) | 14 (1.6%) |
| $25,000 to $29,999 | 93 (8.9%) | 5 (0.6%) |
| $30,000 to $34,999 | 83 (7.9%) | 73 (8.6%) |
| $35,000 to $39,999 | 37 (3.5%) | 11 (1.3%) |
| $40,000 to $44,999 | 53 (5.1%) | 43 (5.0%) |
| $45,000 to $49,999 | 97 (9.2%) | 33 (3.9%) |
| $50,000 to $54,999 | 10 (0.9%) | 8 (0.9%) |
| $55,000 to $64,999 | 23 (2.2%) | 82 (9.6%) |
| $65,000 to $74,999 | 39 (3.7%) | 29 (3.4%) |
| $75,000 to $99,999 | 110 (10.5%) | 39 (4.6%) |
| $100,000+ | 148 (14.1%) | 20 (2.3%) |
| Total | 1,049 (100.0%) | 854 (100.0%) |
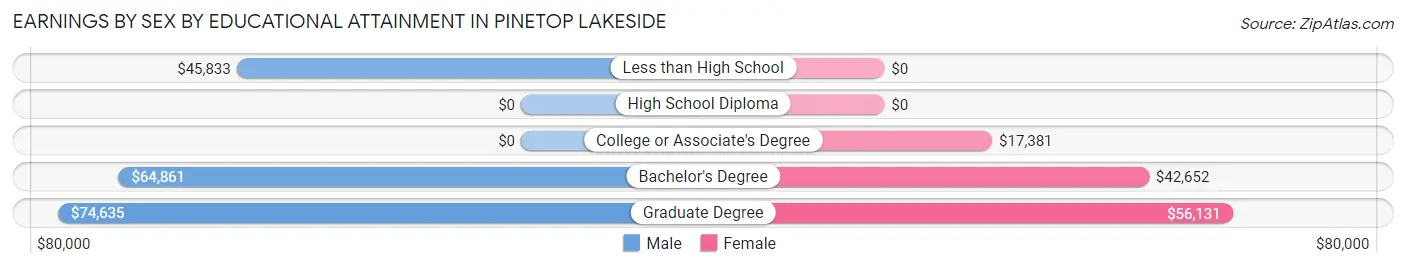
Earnings by Sex by Educational Attainment in Pinetop Lakeside
Average earnings in Pinetop Lakeside are $40,306 for men and $21,466 for women, a difference of 46.7%. Men with an educational attainment of graduate degree enjoy the highest average annual earnings of $74,635, while those with less than high school education earn the least with $45,833. Women with an educational attainment of graduate degree earn the most with the average annual earnings of $56,131, while those with college or associate's degree education have the smallest earnings of $17,381.
| Educational Attainment | Male Income | Female Income |
| Less than High School | $45,833 | $0 |
| High School Diploma | - | - |
| College or Associate's Degree | - | - |
| Bachelor's Degree | $64,861 | $42,652 |
| Graduate Degree | $74,635 | $56,131 |
| Total | $40,306 | $21,466 |
Family Income in Pinetop Lakeside
Family Income Brackets in Pinetop Lakeside
According to the Pinetop Lakeside family income data, there are 257 families falling into the $15,000 to $24,999 income range, which is the most common income bracket and makes up 21.8% of all families.
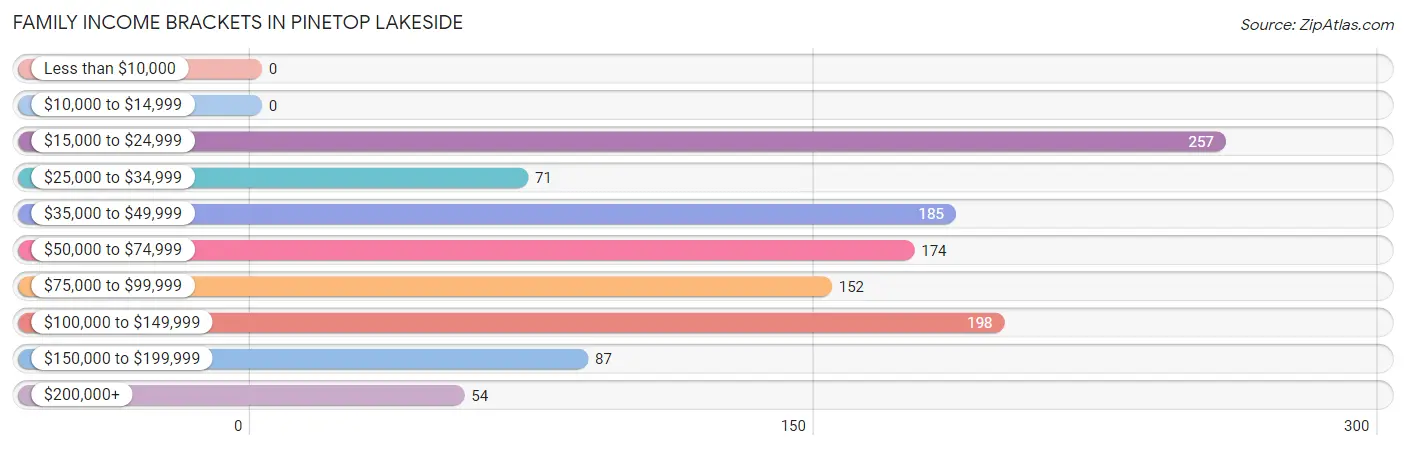
| Income Bracket | # Families | % Families |
| Less than $10,000 | 0 | 0.0% |
| $10,000 to $14,999 | 0 | 0.0% |
| $15,000 to $24,999 | 257 | 21.8% |
| $25,000 to $34,999 | 71 | 6.0% |
| $35,000 to $49,999 | 185 | 15.7% |
| $50,000 to $74,999 | 174 | 14.8% |
| $75,000 to $99,999 | 152 | 12.9% |
| $100,000 to $149,999 | 198 | 16.8% |
| $150,000 to $199,999 | 87 | 7.4% |
| $200,000+ | 54 | 4.6% |
Family Income by Famaliy Size in Pinetop Lakeside
4-person families (174 | 14.8%) account for the highest median family income in Pinetop Lakeside with $102,566 per family, while 3-person families (216 | 18.3%) have the highest median income of $26,515 per family member.
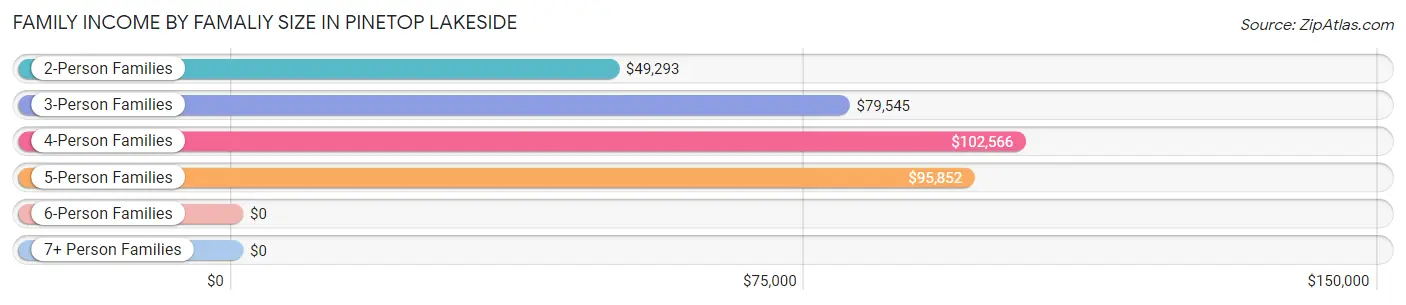
| Income Bracket | # Families | Median Income |
| 2-Person Families | 731 (62.1%) | $49,293 |
| 3-Person Families | 216 (18.3%) | $79,545 |
| 4-Person Families | 174 (14.8%) | $102,566 |
| 5-Person Families | 57 (4.8%) | $95,852 |
| 6-Person Families | 0 (0.0%) | $0 |
| 7+ Person Families | 0 (0.0%) | $0 |
| Total | 1,178 (100.0%) | $61,402 |
Family Income by Number of Earners in Pinetop Lakeside
The median family income in Pinetop Lakeside is $61,402, with families comprising 3+ earners (105) having the highest median family income of $104,836, while families with 1 earner (461) have the lowest median family income of $34,250, accounting for 8.9% and 39.1% of families, respectively.
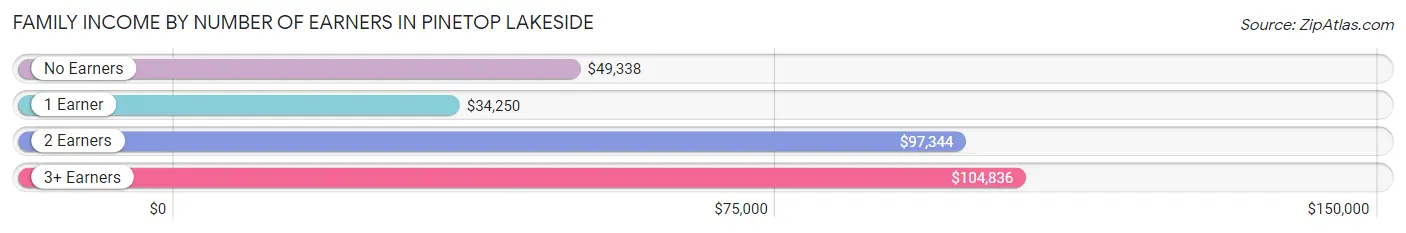
| Number of Earners | # Families | Median Income |
| No Earners | 345 (29.3%) | $49,338 |
| 1 Earner | 461 (39.1%) | $34,250 |
| 2 Earners | 267 (22.7%) | $97,344 |
| 3+ Earners | 105 (8.9%) | $104,836 |
| Total | 1,178 (100.0%) | $61,402 |
Household Income in Pinetop Lakeside
Household Income Brackets in Pinetop Lakeside
With 361 households falling in the category, the $50,000 to $74,999 income range is the most frequent in Pinetop Lakeside, accounting for 20.4% of all households. In contrast, only 19 households (1.1%) fall into the less than $10,000 income bracket, making it the least populous group.
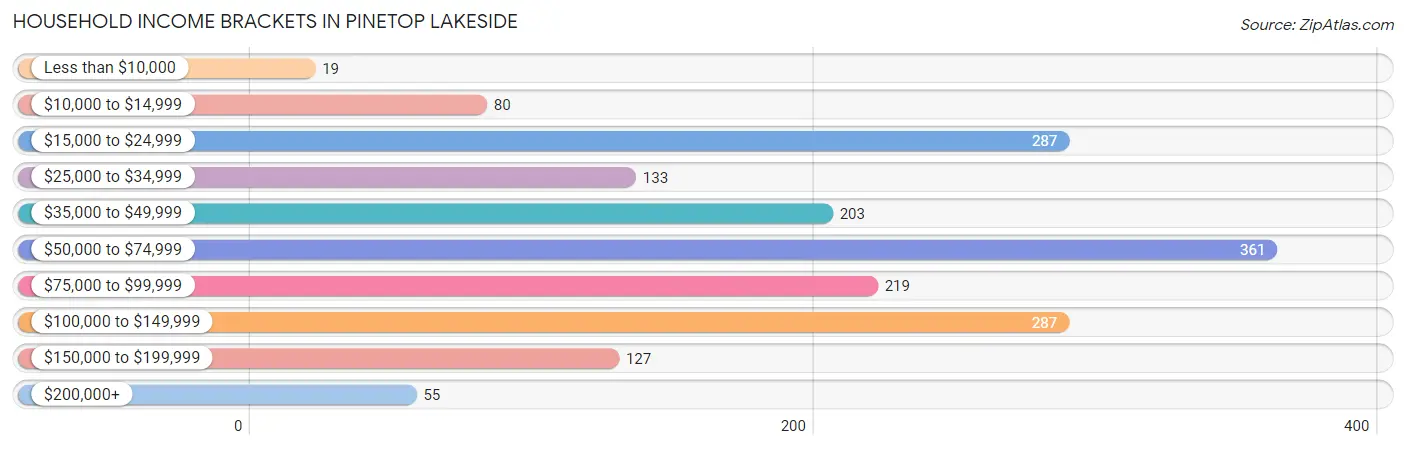
| Income Bracket | # Households | % Households |
| Less than $10,000 | 19 | 1.1% |
| $10,000 to $14,999 | 80 | 4.5% |
| $15,000 to $24,999 | 287 | 16.2% |
| $25,000 to $34,999 | 133 | 7.5% |
| $35,000 to $49,999 | 203 | 11.5% |
| $50,000 to $74,999 | 361 | 20.4% |
| $75,000 to $99,999 | 219 | 12.4% |
| $100,000 to $149,999 | 287 | 16.2% |
| $150,000 to $199,999 | 127 | 7.2% |
| $200,000+ | 55 | 3.1% |
Household Income by Householder Age in Pinetop Lakeside
The median household income in Pinetop Lakeside is $57,125, with the highest median household income of $88,015 found in the 45 to 64 years age bracket for the primary householder. A total of 591 households (33.4%) fall into this category. Meanwhile, the 15 to 24 years age bracket for the primary householder has the lowest median household income of $0, with 36 households (2.0%) in this group.
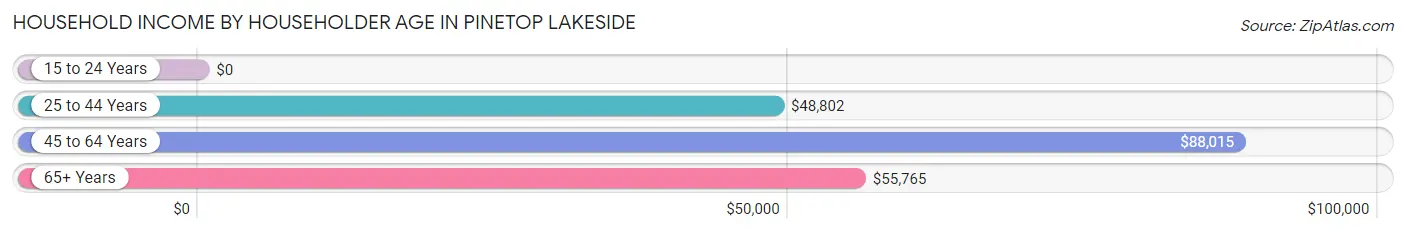
| Income Bracket | # Households | Median Income |
| 15 to 24 Years | 36 (2.0%) | $0 |
| 25 to 44 Years | 360 (20.3%) | $48,802 |
| 45 to 64 Years | 591 (33.4%) | $88,015 |
| 65+ Years | 782 (44.2%) | $55,765 |
| Total | 1,769 (100.0%) | $57,125 |
Poverty in Pinetop Lakeside
Income Below Poverty by Sex and Age in Pinetop Lakeside
With 6.5% poverty level for males and 12.5% for females among the residents of Pinetop Lakeside, 25 to 34 year old males and 5 year old females are the most vulnerable to poverty, with 37 males (43.5%) and 22 females (71.0%) in their respective age groups living below the poverty level.
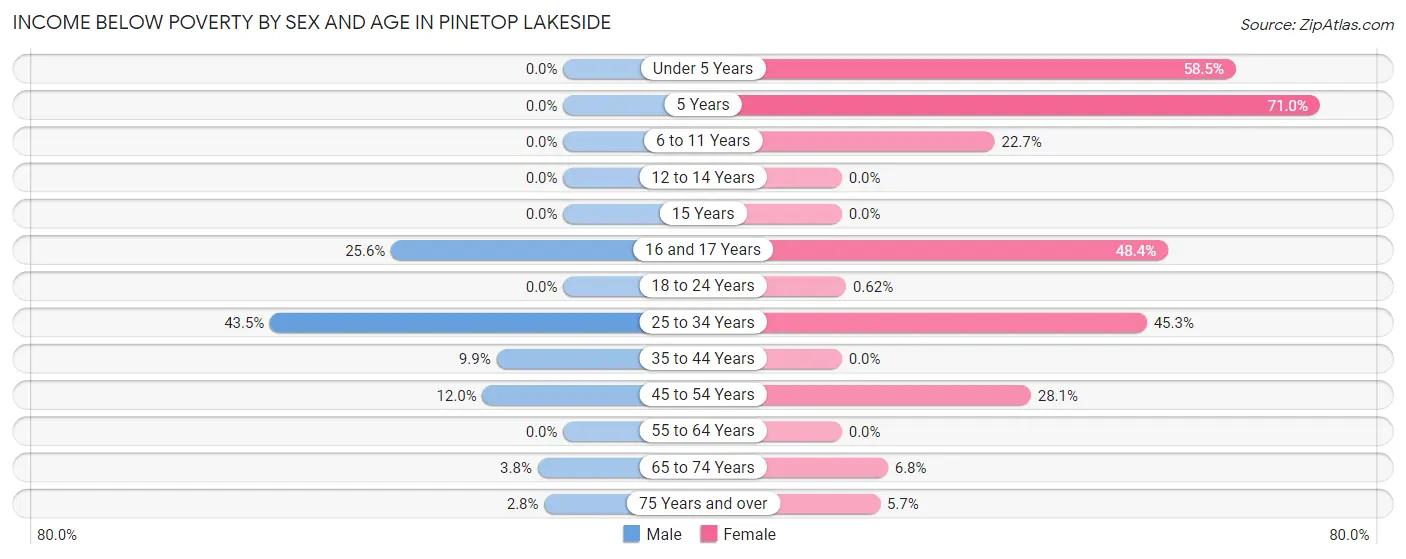
| Age Bracket | Male | Female |
| Under 5 Years | 0 (0.0%) | 31 (58.5%) |
| 5 Years | 0 (0.0%) | 22 (71.0%) |
| 6 to 11 Years | 0 (0.0%) | 22 (22.7%) |
| 12 to 14 Years | 0 (0.0%) | 0 (0.0%) |
| 15 Years | 0 (0.0%) | 0 (0.0%) |
| 16 and 17 Years | 23 (25.6%) | 31 (48.4%) |
| 18 to 24 Years | 0 (0.0%) | 1 (0.6%) |
| 25 to 34 Years | 37 (43.5%) | 48 (45.3%) |
| 35 to 44 Years | 14 (9.9%) | 0 (0.0%) |
| 45 to 54 Years | 27 (12.0%) | 64 (28.1%) |
| 55 to 64 Years | 0 (0.0%) | 0 (0.0%) |
| 65 to 74 Years | 16 (3.8%) | 31 (6.8%) |
| 75 Years and over | 8 (2.8%) | 11 (5.7%) |
| Total | 125 (6.5%) | 261 (12.5%) |
Income Above Poverty by Sex and Age in Pinetop Lakeside
According to the poverty statistics in Pinetop Lakeside, males aged under 5 years and females aged 12 to 14 years are the age groups that are most secure financially, with 100.0% of males and 100.0% of females in these age groups living above the poverty line.
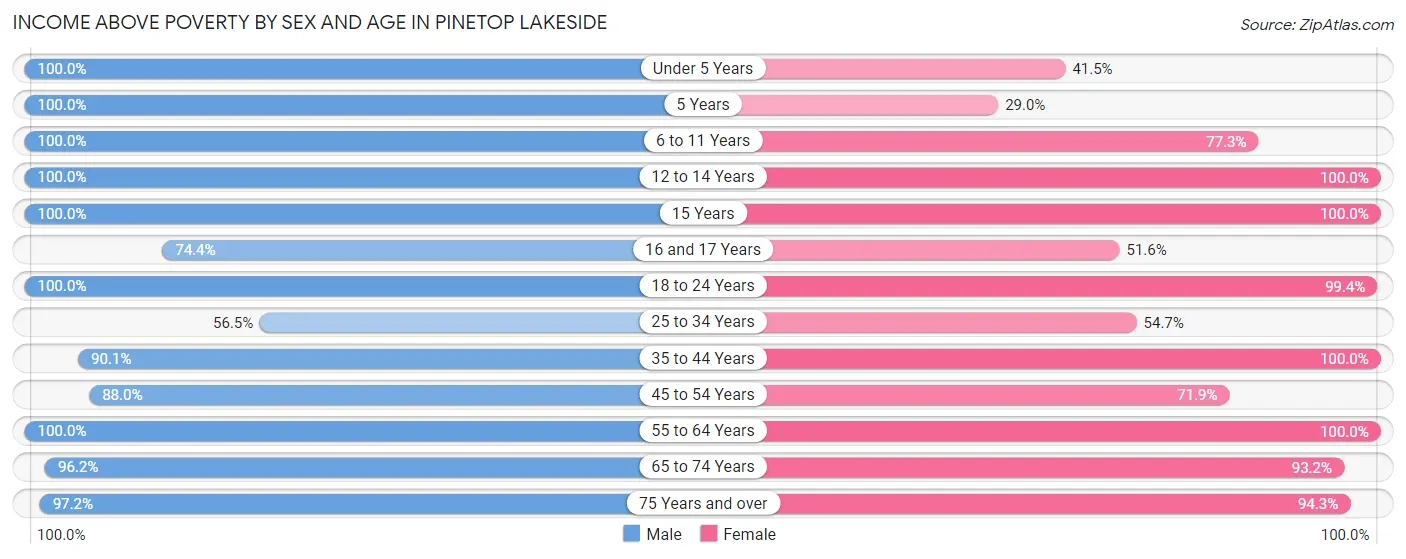
| Age Bracket | Male | Female |
| Under 5 Years | 18 (100.0%) | 22 (41.5%) |
| 5 Years | 18 (100.0%) | 9 (29.0%) |
| 6 to 11 Years | 75 (100.0%) | 75 (77.3%) |
| 12 to 14 Years | 65 (100.0%) | 74 (100.0%) |
| 15 Years | 17 (100.0%) | 56 (100.0%) |
| 16 and 17 Years | 67 (74.4%) | 33 (51.6%) |
| 18 to 24 Years | 138 (100.0%) | 161 (99.4%) |
| 25 to 34 Years | 48 (56.5%) | 58 (54.7%) |
| 35 to 44 Years | 127 (90.1%) | 368 (100.0%) |
| 45 to 54 Years | 198 (88.0%) | 164 (71.9%) |
| 55 to 64 Years | 354 (100.0%) | 208 (100.0%) |
| 65 to 74 Years | 405 (96.2%) | 423 (93.2%) |
| 75 Years and over | 276 (97.2%) | 183 (94.3%) |
| Total | 1,806 (93.5%) | 1,834 (87.5%) |
Income Below Poverty Among Married-Couple Families in Pinetop Lakeside
The poverty statistics for married-couple families in Pinetop Lakeside show that 2.1% or 19 of the total 921 families live below the poverty line. Families with 1 or 2 children have the highest poverty rate of 8.1%, comprising of 19 families. On the other hand, families with no children have the lowest poverty rate of 0.0%, which includes 0 families.
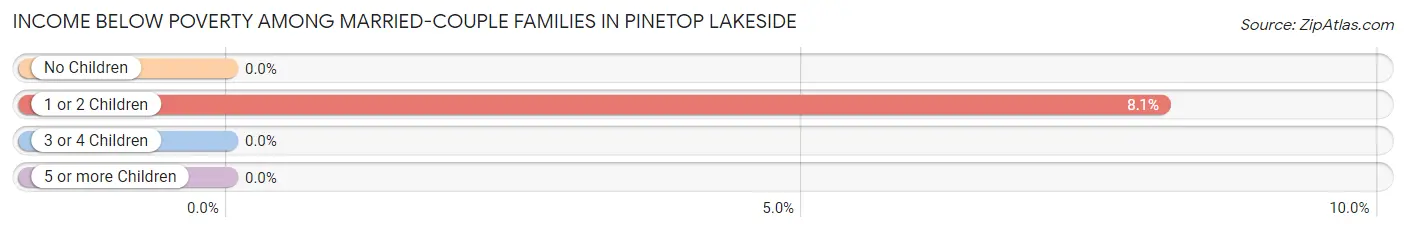
| Children | Above Poverty | Below Poverty |
| No Children | 665 (100.0%) | 0 (0.0%) |
| 1 or 2 Children | 215 (91.9%) | 19 (8.1%) |
| 3 or 4 Children | 22 (100.0%) | 0 (0.0%) |
| 5 or more Children | 0 (0.0%) | 0 (0.0%) |
| Total | 902 (97.9%) | 19 (2.1%) |
Income Below Poverty Among Single-Parent Households in Pinetop Lakeside
According to the poverty data in Pinetop Lakeside, 28.6% or 8 single-father households and 11.8% or 27 single-mother households are living below the poverty line. Among single-father households, those with 1 or 2 children have the highest poverty rate, with 8 households (66.7%) experiencing poverty. Likewise, among single-mother households, those with 1 or 2 children have the highest poverty rate, with 27 households (20.3%) falling below the poverty line.
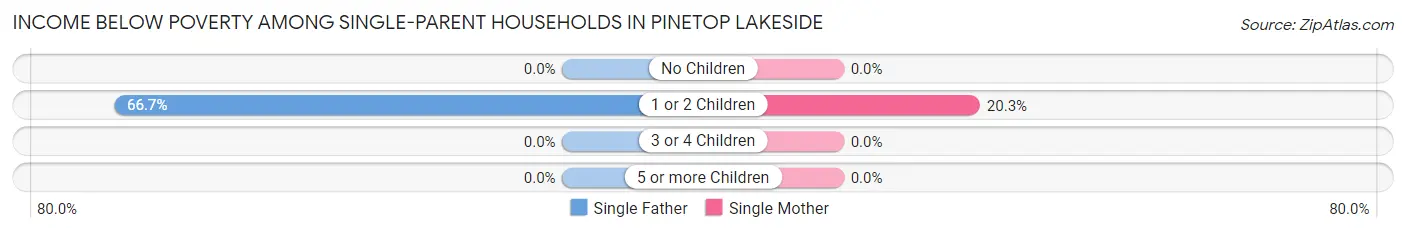
| Children | Single Father | Single Mother |
| No Children | 0 (0.0%) | 0 (0.0%) |
| 1 or 2 Children | 8 (66.7%) | 27 (20.3%) |
| 3 or 4 Children | 0 (0.0%) | 0 (0.0%) |
| 5 or more Children | 0 (0.0%) | 0 (0.0%) |
| Total | 8 (28.6%) | 27 (11.8%) |
Income Below Poverty Among Married-Couple vs Single-Parent Households in Pinetop Lakeside
The poverty data for Pinetop Lakeside shows that 19 of the married-couple family households (2.1%) and 35 of the single-parent households (13.6%) are living below the poverty level. Within the married-couple family households, those with 1 or 2 children have the highest poverty rate, with 19 households (8.1%) falling below the poverty line. Among the single-parent households, those with 1 or 2 children have the highest poverty rate, with 35 household (24.1%) living below poverty.
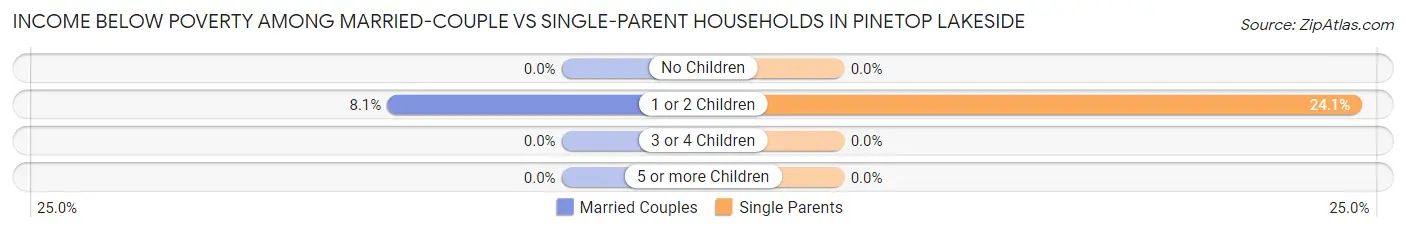
| Children | Married-Couple Families | Single-Parent Households |
| No Children | 0 (0.0%) | 0 (0.0%) |
| 1 or 2 Children | 19 (8.1%) | 35 (24.1%) |
| 3 or 4 Children | 0 (0.0%) | 0 (0.0%) |
| 5 or more Children | 0 (0.0%) | 0 (0.0%) |
| Total | 19 (2.1%) | 35 (13.6%) |
Race in Pinetop Lakeside
The most populous races in Pinetop Lakeside are White / Caucasian (3,369 | 82.6%), Hispanic or Latino (507 | 12.4%), and Two or more Races (392 | 9.6%).
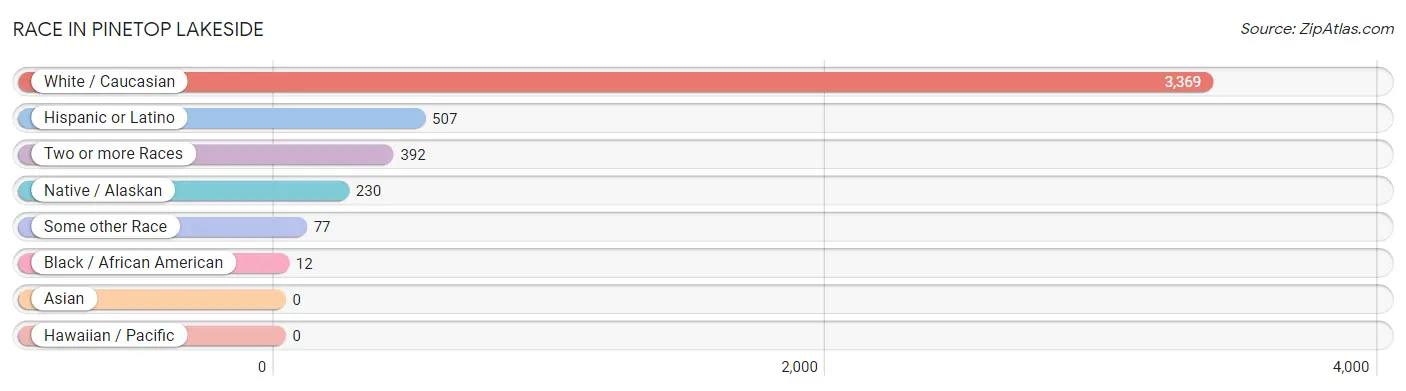
| Race | # Population | % Population |
| Asian | 0 | 0.0% |
| Black / African American | 12 | 0.3% |
| Hawaiian / Pacific | 0 | 0.0% |
| Hispanic or Latino | 507 | 12.4% |
| Native / Alaskan | 230 | 5.6% |
| White / Caucasian | 3,369 | 82.6% |
| Two or more Races | 392 | 9.6% |
| Some other Race | 77 | 1.9% |
| Total | 4,080 | 100.0% |
Ancestry in Pinetop Lakeside
The most populous ancestries reported in Pinetop Lakeside are German (917 | 22.5%), English (498 | 12.2%), Mexican (436 | 10.7%), Irish (405 | 9.9%), and American (285 | 7.0%), together accounting for 62.3% of all Pinetop Lakeside residents.
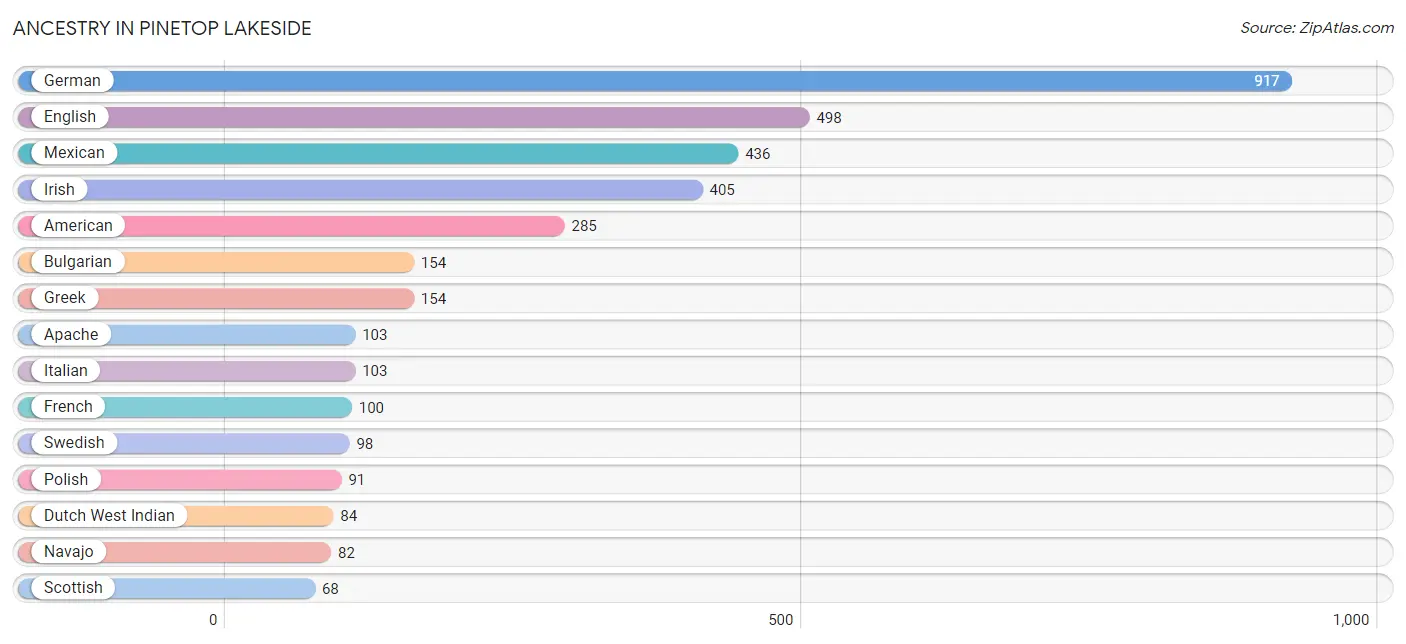
| Ancestry | # Population | % Population |
| American | 285 | 7.0% |
| Apache | 103 | 2.5% |
| Arab | 7 | 0.2% |
| Austrian | 4 | 0.1% |
| British | 29 | 0.7% |
| Bulgarian | 154 | 3.8% |
| Central American | 11 | 0.3% |
| Central American Indian | 41 | 1.0% |
| Cherokee | 10 | 0.3% |
| Croatian | 28 | 0.7% |
| Cuban | 7 | 0.2% |
| Czech | 8 | 0.2% |
| Czechoslovakian | 12 | 0.3% |
| Danish | 56 | 1.4% |
| Dutch | 49 | 1.2% |
| Dutch West Indian | 84 | 2.1% |
| English | 498 | 12.2% |
| European | 26 | 0.6% |
| French | 100 | 2.5% |
| German | 917 | 22.5% |
| Greek | 154 | 3.8% |
| Hungarian | 38 | 0.9% |
| Irish | 405 | 9.9% |
| Iroquois | 15 | 0.4% |
| Italian | 103 | 2.5% |
| Latvian | 5 | 0.1% |
| Lebanese | 7 | 0.2% |
| Mexican | 436 | 10.7% |
| Navajo | 82 | 2.0% |
| Norwegian | 58 | 1.4% |
| Polish | 91 | 2.2% |
| Puerto Rican | 19 | 0.5% |
| Romanian | 1 | 0.0% |
| Salvadoran | 11 | 0.3% |
| Scandinavian | 15 | 0.4% |
| Scotch-Irish | 49 | 1.2% |
| Scottish | 68 | 1.7% |
| Slovak | 18 | 0.4% |
| Slovene | 10 | 0.3% |
| South American | 8 | 0.2% |
| Spanish | 17 | 0.4% |
| Swedish | 98 | 2.4% |
| Venezuelan | 8 | 0.2% |
| Welsh | 35 | 0.9% | View All 44 Rows |
Immigrants in Pinetop Lakeside
The most numerous immigrant groups reported in Pinetop Lakeside came from Europe (97 | 2.4%), Latin America (88 | 2.2%), Central America (73 | 1.8%), Mexico (73 | 1.8%), and Eastern Europe (71 | 1.7%), together accounting for 9.9% of all Pinetop Lakeside residents.
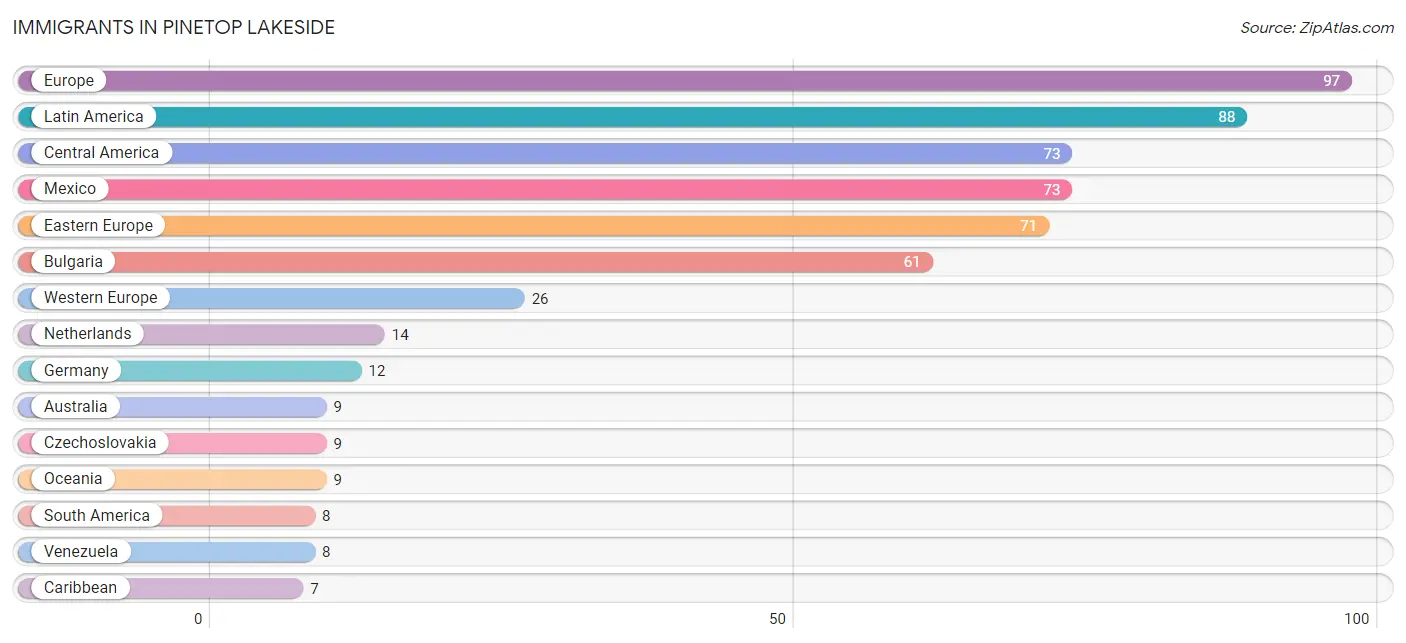
| Immigration Origin | # Population | % Population |
| Australia | 9 | 0.2% |
| Bulgaria | 61 | 1.5% |
| Caribbean | 7 | 0.2% |
| Central America | 73 | 1.8% |
| Cuba | 7 | 0.2% |
| Czechoslovakia | 9 | 0.2% |
| Eastern Europe | 71 | 1.7% |
| Europe | 97 | 2.4% |
| Germany | 12 | 0.3% |
| Latin America | 88 | 2.2% |
| Mexico | 73 | 1.8% |
| Netherlands | 14 | 0.3% |
| Oceania | 9 | 0.2% |
| Romania | 1 | 0.0% |
| South America | 8 | 0.2% |
| Venezuela | 8 | 0.2% |
| Western Europe | 26 | 0.6% | View All 17 Rows |
Sex and Age in Pinetop Lakeside
Sex and Age in Pinetop Lakeside
The most populous age groups in Pinetop Lakeside are 65 to 69 Years (255 | 13.1%) for men and 65 to 69 Years (242 | 11.3%) for women.
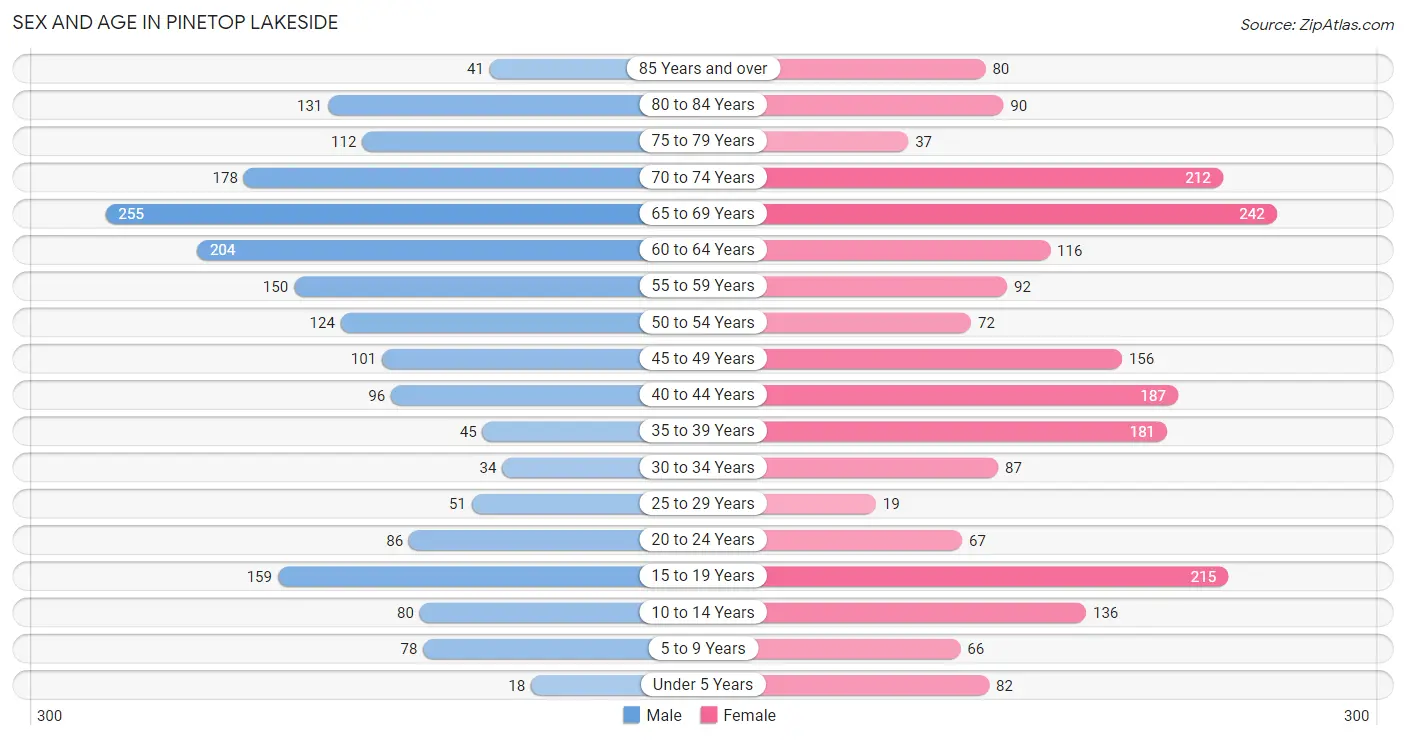
| Age Bracket | Male | Female |
| Under 5 Years | 18 (0.9%) | 82 (3.8%) |
| 5 to 9 Years | 78 (4.0%) | 66 (3.1%) |
| 10 to 14 Years | 80 (4.1%) | 136 (6.4%) |
| 15 to 19 Years | 159 (8.2%) | 215 (10.1%) |
| 20 to 24 Years | 86 (4.4%) | 67 (3.1%) |
| 25 to 29 Years | 51 (2.6%) | 19 (0.9%) |
| 30 to 34 Years | 34 (1.8%) | 87 (4.1%) |
| 35 to 39 Years | 45 (2.3%) | 181 (8.5%) |
| 40 to 44 Years | 96 (4.9%) | 187 (8.7%) |
| 45 to 49 Years | 101 (5.2%) | 156 (7.3%) |
| 50 to 54 Years | 124 (6.4%) | 72 (3.4%) |
| 55 to 59 Years | 150 (7.7%) | 92 (4.3%) |
| 60 to 64 Years | 204 (10.5%) | 116 (5.4%) |
| 65 to 69 Years | 255 (13.1%) | 242 (11.3%) |
| 70 to 74 Years | 178 (9.2%) | 212 (9.9%) |
| 75 to 79 Years | 112 (5.8%) | 37 (1.7%) |
| 80 to 84 Years | 131 (6.7%) | 90 (4.2%) |
| 85 Years and over | 41 (2.1%) | 80 (3.7%) |
| Total | 1,943 (100.0%) | 2,137 (100.0%) |
Families and Households in Pinetop Lakeside
Median Family Size in Pinetop Lakeside
The median family size in Pinetop Lakeside is 2.76 persons per family, with married-couple families (921 | 78.2%) accounting for the largest median family size of 2.89 persons per family. On the other hand, single male/father families (28 | 2.4%) represent the smallest median family size with 2.07 persons per family.
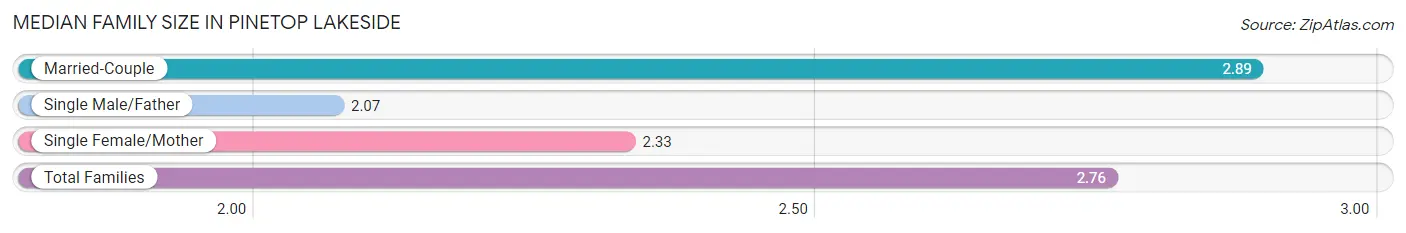
| Family Type | # Families | Family Size |
| Married-Couple | 921 (78.2%) | 2.89 |
| Single Male/Father | 28 (2.4%) | 2.07 |
| Single Female/Mother | 229 (19.4%) | 2.33 |
| Total Families | 1,178 (100.0%) | 2.76 |
Median Household Size in Pinetop Lakeside
The median household size in Pinetop Lakeside is 2.29 persons per household, with married-couple households (921 | 52.1%) accounting for the largest median household size of 2.93 persons per household. non-family households (591 | 33.4%) represent the smallest median household size with 1.13 persons per household.
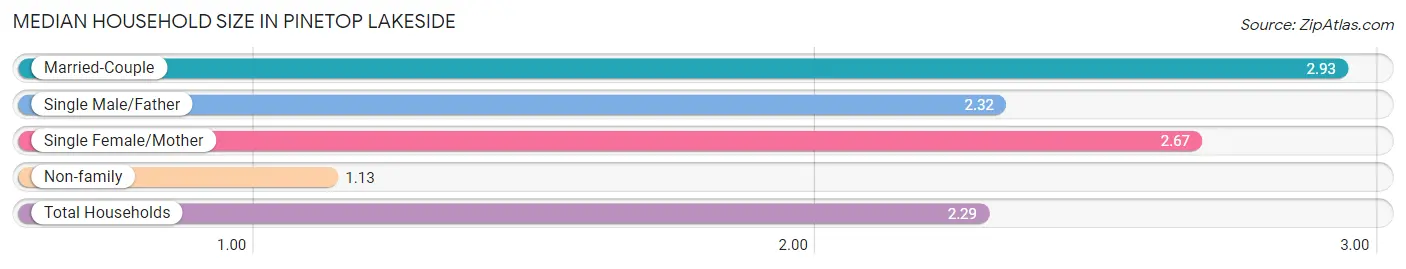
| Household Type | # Households | Household Size |
| Married-Couple | 921 (52.1%) | 2.93 |
| Single Male/Father | 28 (1.6%) | 2.32 |
| Single Female/Mother | 229 (13.0%) | 2.67 |
| Non-family | 591 (33.4%) | 1.13 |
| Total Households | 1,769 (100.0%) | 2.29 |
Household Size by Marriage Status in Pinetop Lakeside
Out of a total of 1,769 households in Pinetop Lakeside, 1,178 (66.6%) are family households, while 591 (33.4%) are nonfamily households. The most numerous type of family households are 2-person households, comprising 659, and the most common type of nonfamily households are 1-person households, comprising 507.
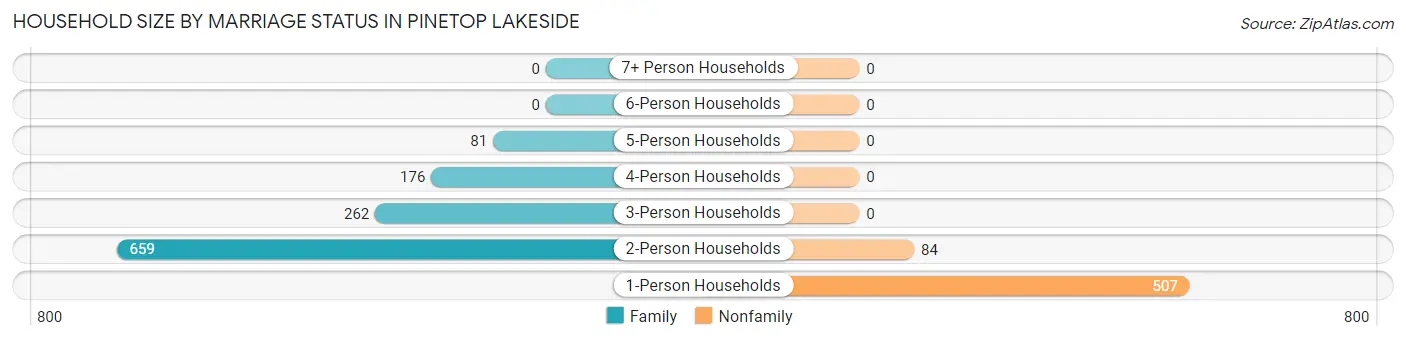
| Household Size | Family Households | Nonfamily Households |
| 1-Person Households | - | 507 (28.7%) |
| 2-Person Households | 659 (37.2%) | 84 (4.8%) |
| 3-Person Households | 262 (14.8%) | 0 (0.0%) |
| 4-Person Households | 176 (10.0%) | 0 (0.0%) |
| 5-Person Households | 81 (4.6%) | 0 (0.0%) |
| 6-Person Households | 0 (0.0%) | 0 (0.0%) |
| 7+ Person Households | 0 (0.0%) | 0 (0.0%) |
| Total | 1,178 (66.6%) | 591 (33.4%) |
Female Fertility in Pinetop Lakeside
Fertility by Age in Pinetop Lakeside
Average fertility rate in Pinetop Lakeside is 8.0 births per 1,000 women. Women in the age bracket of 20 to 34 years have the highest fertility rate with 46.0 births per 1,000 women. Women in the age bracket of 20 to 34 years acount for 100.0% of all women with births.
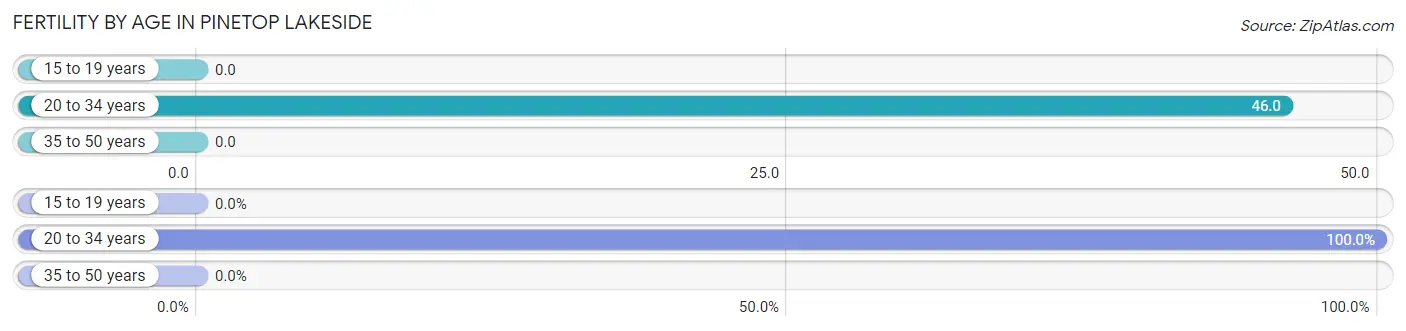
| Age Bracket | Women with Births | Births / 1,000 Women |
| 15 to 19 years | 0 (0.0%) | 0.0 |
| 20 to 34 years | 8 (100.0%) | 46.0 |
| 35 to 50 years | 0 (0.0%) | 0.0 |
| Total | 8 (100.0%) | 8.0 |
Fertility by Age by Marriage Status in Pinetop Lakeside
75.0% of women with births (8) in Pinetop Lakeside are married. The highest percentage of unmarried women with births falls into 20 to 34 years age bracket with 25.0% of them unmarried at the time of birth, while the lowest percentage of unmarried women with births belong to 20 to 34 years age bracket with 25.0% of them unmarried.
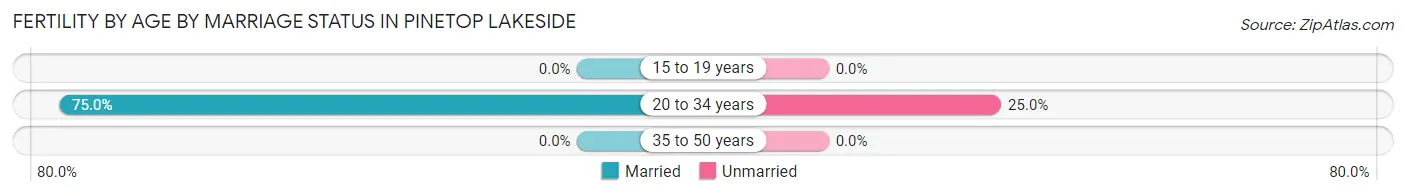
| Age Bracket | Married | Unmarried |
| 15 to 19 years | 0 (0.0%) | 0 (0.0%) |
| 20 to 34 years | 6 (75.0%) | 2 (25.0%) |
| 35 to 50 years | 0 (0.0%) | 0 (0.0%) |
| Total | 6 (75.0%) | 2 (25.0%) |
Fertility by Education in Pinetop Lakeside
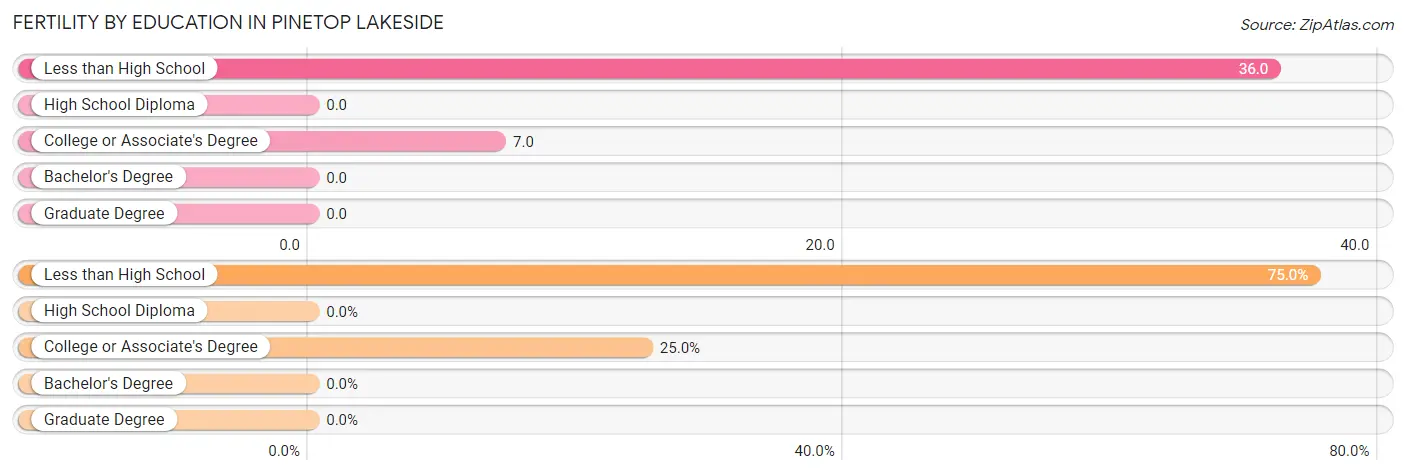
| Educational Attainment | Women with Births | Births / 1,000 Women |
| Less than High School | 6 (75.0%) | 36.0 |
| High School Diploma | 0 (0.0%) | 0.0 |
| College or Associate's Degree | 2 (25.0%) | 7.0 |
| Bachelor's Degree | 0 (0.0%) | 0.0 |
| Graduate Degree | 0 (0.0%) | 0.0 |
| Total | 8 (100.0%) | 8.0 |
Fertility by Education by Marriage Status in Pinetop Lakeside
25.0% of women with births in Pinetop Lakeside are unmarried. Women with the educational attainment of less than high school are most likely to be married with 100.0% of them married at childbirth, while women with the educational attainment of college or associate's degree are least likely to be married with 100.0% of them unmarried at childbirth.
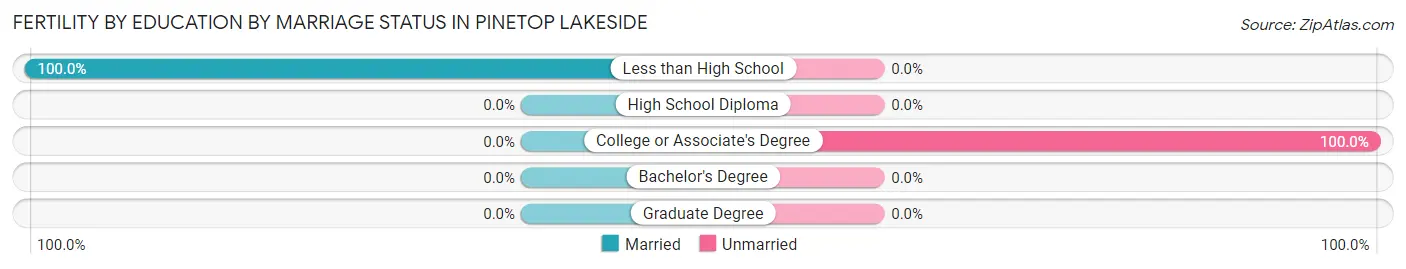
| Educational Attainment | Married | Unmarried |
| Less than High School | 6 (100.0%) | 0 (0.0%) |
| High School Diploma | 0 (0.0%) | 0 (0.0%) |
| College or Associate's Degree | 0 (0.0%) | 2 (100.0%) |
| Bachelor's Degree | 0 (0.0%) | 0 (0.0%) |
| Graduate Degree | 0 (0.0%) | 0 (0.0%) |
| Total | 6 (75.0%) | 2 (25.0%) |
Employment Characteristics in Pinetop Lakeside
Employment by Class of Employer in Pinetop Lakeside
Among the 1,678 employed individuals in Pinetop Lakeside, private company employees (797 | 47.5%), local government employees (318 | 19.0%), and state government employees (154 | 9.2%) make up the most common classes of employment.
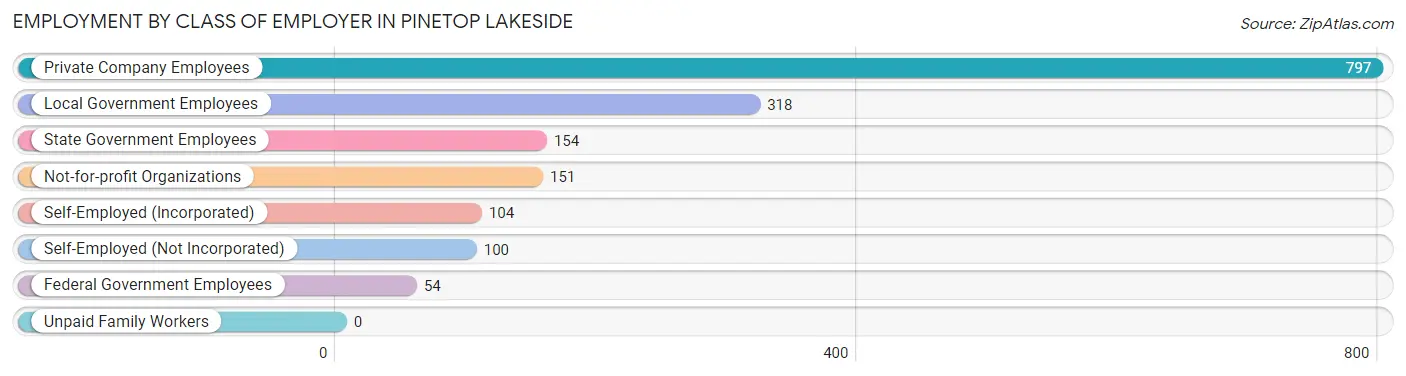
| Employer Class | # Employees | % Employees |
| Private Company Employees | 797 | 47.5% |
| Self-Employed (Incorporated) | 104 | 6.2% |
| Self-Employed (Not Incorporated) | 100 | 6.0% |
| Not-for-profit Organizations | 151 | 9.0% |
| Local Government Employees | 318 | 19.0% |
| State Government Employees | 154 | 9.2% |
| Federal Government Employees | 54 | 3.2% |
| Unpaid Family Workers | 0 | 0.0% |
| Total | 1,678 | 100.0% |
Employment Status by Age in Pinetop Lakeside
According to the labor force statistics for Pinetop Lakeside, out of the total population over 16 years of age (3,547), 51.6% or 1,830 individuals are in the labor force, with 4.9% or 90 of them unemployed. The age group with the highest labor force participation rate is 35 to 44 years, with 90.0% or 458 individuals in the labor force. Within the labor force, the 35 to 44 years age range has the highest percentage of unemployed individuals, with 16.8% or 77 of them being unemployed.
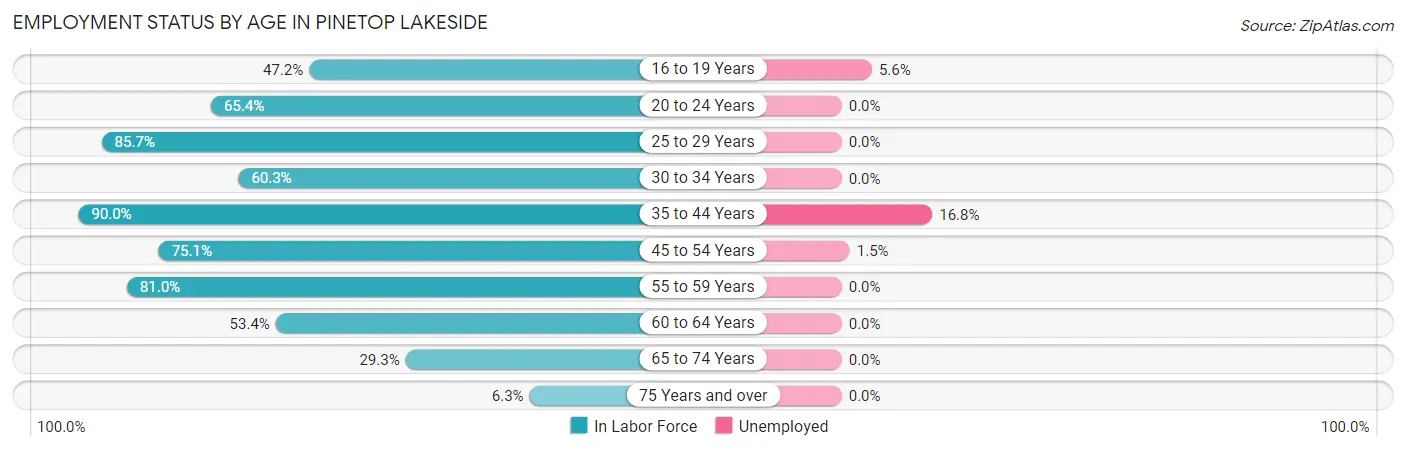
| Age Bracket | In Labor Force | Unemployed |
| 16 to 19 Years | 142 (47.2%) | 8 (5.6%) |
| 20 to 24 Years | 100 (65.4%) | 0 (0.0%) |
| 25 to 29 Years | 60 (85.7%) | 0 (0.0%) |
| 30 to 34 Years | 73 (60.3%) | 0 (0.0%) |
| 35 to 44 Years | 458 (90.0%) | 77 (16.8%) |
| 45 to 54 Years | 340 (75.1%) | 5 (1.5%) |
| 55 to 59 Years | 196 (81.0%) | 0 (0.0%) |
| 60 to 64 Years | 171 (53.4%) | 0 (0.0%) |
| 65 to 74 Years | 260 (29.3%) | 0 (0.0%) |
| 75 Years and over | 31 (6.3%) | 0 (0.0%) |
| Total | 1,830 (51.6%) | 90 (4.9%) |
Employment Status by Educational Attainment in Pinetop Lakeside
According to labor force statistics for Pinetop Lakeside, 75.7% of individuals (1,298) out of the total population between 25 and 64 years of age (1,715) are in the labor force, with 6.3% or 82 of them being unemployed. The group with the highest labor force participation rate are those with the educational attainment of bachelor's degree or higher, with 84.9% or 570 individuals in the labor force. Within the labor force, individuals with bachelor's degree or higher education have the highest percentage of unemployment, with 11.8% or 67 of them being unemployed.
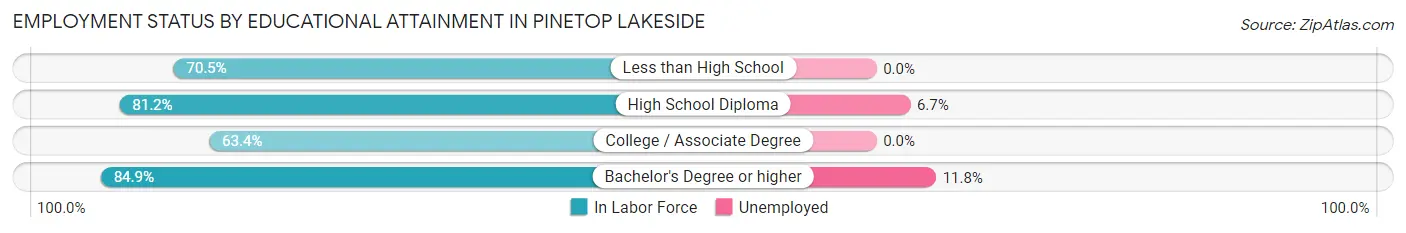
| Educational Attainment | In Labor Force | Unemployed |
| Less than High School | 167 (70.5%) | 0 (0.0%) |
| High School Diploma | 225 (81.2%) | 19 (6.7%) |
| College / Associate Degree | 336 (63.4%) | 0 (0.0%) |
| Bachelor's Degree or higher | 570 (84.9%) | 79 (11.8%) |
| Total | 1,298 (75.7%) | 108 (6.3%) |
Employment Occupations by Sex in Pinetop Lakeside
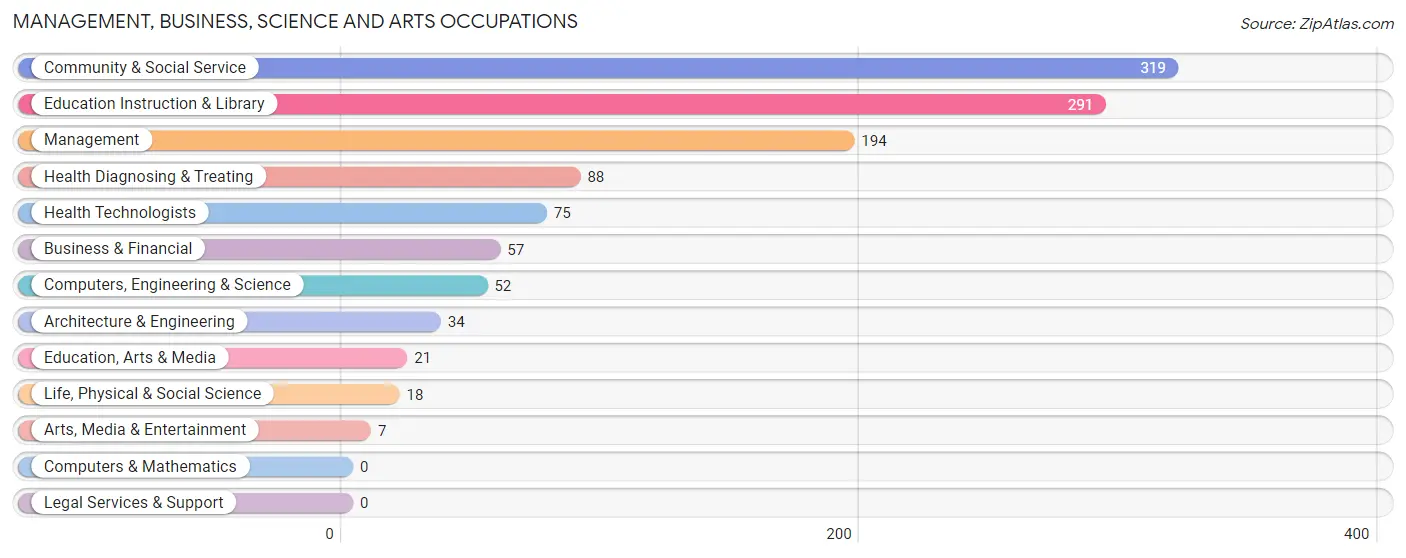
Management, Business, Science and Arts Occupations
The most common Management, Business, Science and Arts occupations in Pinetop Lakeside are Community & Social Service (319 | 18.3%), Education Instruction & Library (291 | 16.7%), Management (194 | 11.1%), Health Diagnosing & Treating (88 | 5.1%), and Health Technologists (75 | 4.3%).
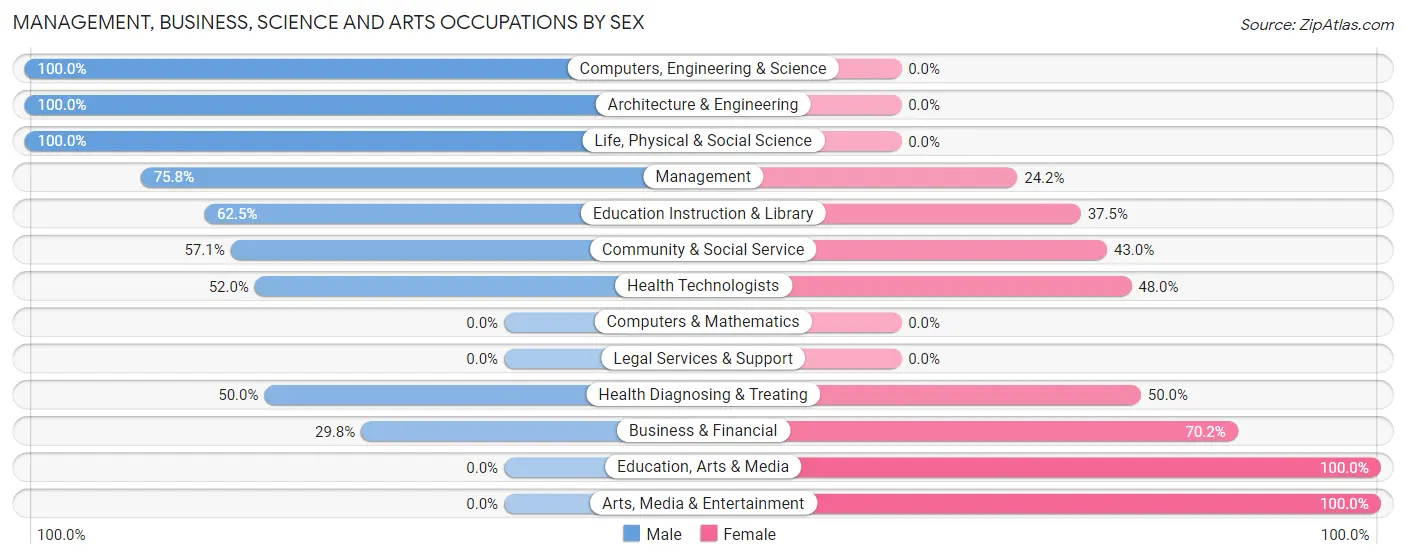
Management, Business, Science and Arts Occupations by Sex
Within the Management, Business, Science and Arts occupations in Pinetop Lakeside, the most male-oriented occupations are Computers, Engineering & Science (100.0%), Architecture & Engineering (100.0%), and Life, Physical & Social Science (100.0%), while the most female-oriented occupations are Education, Arts & Media (100.0%), Arts, Media & Entertainment (100.0%), and Business & Financial (70.2%).
| Occupation | Male | Female |
| Management | 147 (75.8%) | 47 (24.2%) |
| Business & Financial | 17 (29.8%) | 40 (70.2%) |
| Computers, Engineering & Science | 52 (100.0%) | 0 (0.0%) |
| Computers & Mathematics | 0 (0.0%) | 0 (0.0%) |
| Architecture & Engineering | 34 (100.0%) | 0 (0.0%) |
| Life, Physical & Social Science | 18 (100.0%) | 0 (0.0%) |
| Community & Social Service | 182 (57.1%) | 137 (42.9%) |
| Education, Arts & Media | 0 (0.0%) | 21 (100.0%) |
| Legal Services & Support | 0 (0.0%) | 0 (0.0%) |
| Education Instruction & Library | 182 (62.5%) | 109 (37.5%) |
| Arts, Media & Entertainment | 0 (0.0%) | 7 (100.0%) |
| Health Diagnosing & Treating | 44 (50.0%) | 44 (50.0%) |
| Health Technologists | 39 (52.0%) | 36 (48.0%) |
| Total (Category) | 442 (62.3%) | 268 (37.8%) |
| Total (Overall) | 924 (53.1%) | 817 (46.9%) |
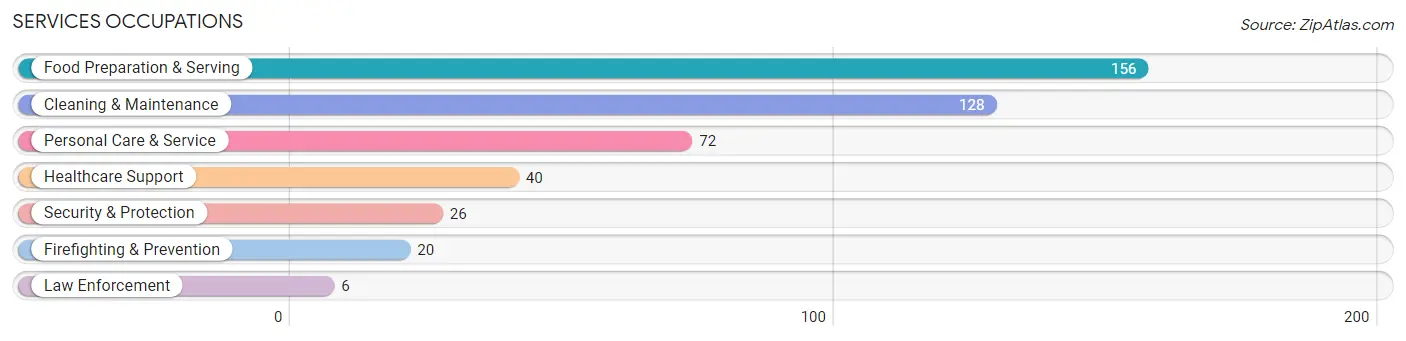
Services Occupations
The most common Services occupations in Pinetop Lakeside are Food Preparation & Serving (156 | 9.0%), Cleaning & Maintenance (128 | 7.3%), Personal Care & Service (72 | 4.1%), Healthcare Support (40 | 2.3%), and Security & Protection (26 | 1.5%).
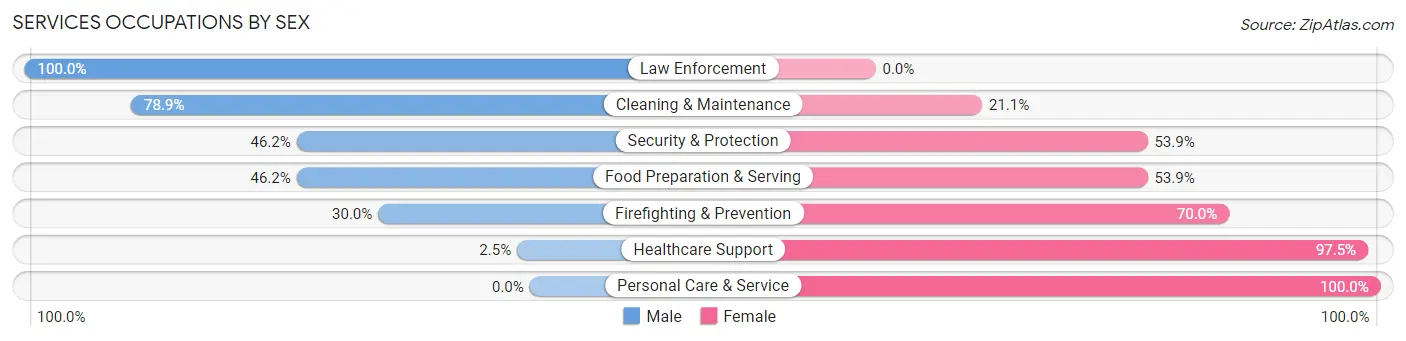
Services Occupations by Sex
Within the Services occupations in Pinetop Lakeside, the most male-oriented occupations are Law Enforcement (100.0%), Cleaning & Maintenance (78.9%), and Security & Protection (46.2%), while the most female-oriented occupations are Personal Care & Service (100.0%), Healthcare Support (97.5%), and Firefighting & Prevention (70.0%).
| Occupation | Male | Female |
| Healthcare Support | 1 (2.5%) | 39 (97.5%) |
| Security & Protection | 12 (46.2%) | 14 (53.8%) |
| Firefighting & Prevention | 6 (30.0%) | 14 (70.0%) |
| Law Enforcement | 6 (100.0%) | 0 (0.0%) |
| Food Preparation & Serving | 72 (46.2%) | 84 (53.8%) |
| Cleaning & Maintenance | 101 (78.9%) | 27 (21.1%) |
| Personal Care & Service | 0 (0.0%) | 72 (100.0%) |
| Total (Category) | 186 (44.1%) | 236 (55.9%) |
| Total (Overall) | 924 (53.1%) | 817 (46.9%) |
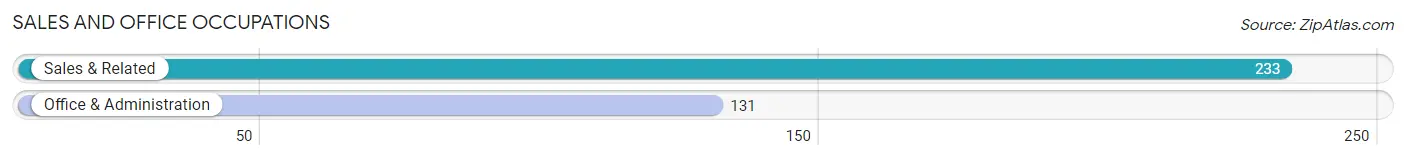
Sales and Office Occupations
The most common Sales and Office occupations in Pinetop Lakeside are Sales & Related (233 | 13.4%), and Office & Administration (131 | 7.5%).
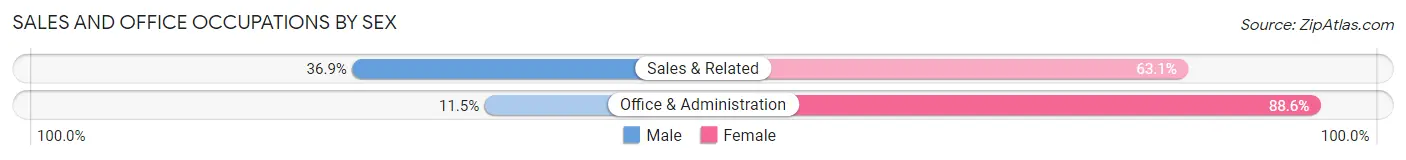
Sales and Office Occupations by Sex
| Occupation | Male | Female |
| Sales & Related | 86 (36.9%) | 147 (63.1%) |
| Office & Administration | 15 (11.5%) | 116 (88.5%) |
| Total (Category) | 101 (27.8%) | 263 (72.3%) |
| Total (Overall) | 924 (53.1%) | 817 (46.9%) |
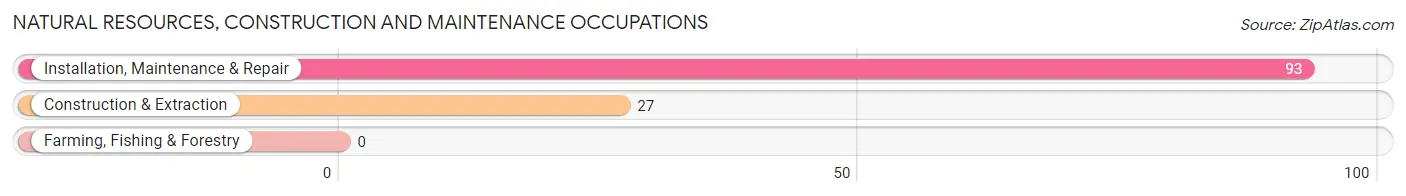
Natural Resources, Construction and Maintenance Occupations
The most common Natural Resources, Construction and Maintenance occupations in Pinetop Lakeside are Installation, Maintenance & Repair (93 | 5.3%), and Construction & Extraction (27 | 1.5%).
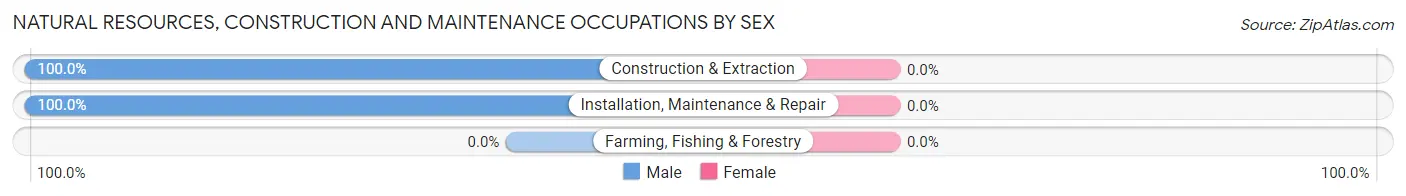
Natural Resources, Construction and Maintenance Occupations by Sex
| Occupation | Male | Female |
| Farming, Fishing & Forestry | 0 (0.0%) | 0 (0.0%) |
| Construction & Extraction | 27 (100.0%) | 0 (0.0%) |
| Installation, Maintenance & Repair | 93 (100.0%) | 0 (0.0%) |
| Total (Category) | 120 (100.0%) | 0 (0.0%) |
| Total (Overall) | 924 (53.1%) | 817 (46.9%) |
Production, Transportation and Moving Occupations
The most common Production, Transportation and Moving occupations in Pinetop Lakeside are Transportation (72 | 4.1%), Production (41 | 2.4%), and Material Moving (12 | 0.7%).
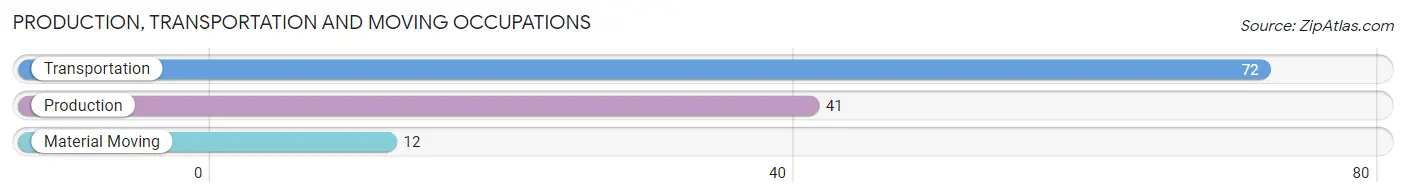
Production, Transportation and Moving Occupations by Sex
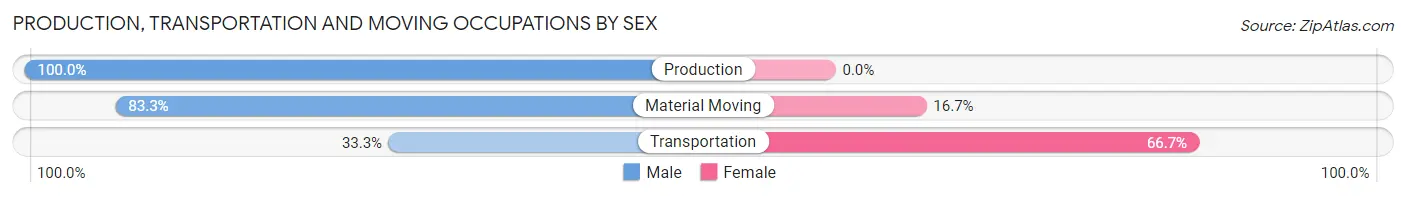
| Occupation | Male | Female |
| Production | 41 (100.0%) | 0 (0.0%) |
| Transportation | 24 (33.3%) | 48 (66.7%) |
| Material Moving | 10 (83.3%) | 2 (16.7%) |
| Total (Category) | 75 (60.0%) | 50 (40.0%) |
| Total (Overall) | 924 (53.1%) | 817 (46.9%) |
Employment Industries by Sex in Pinetop Lakeside
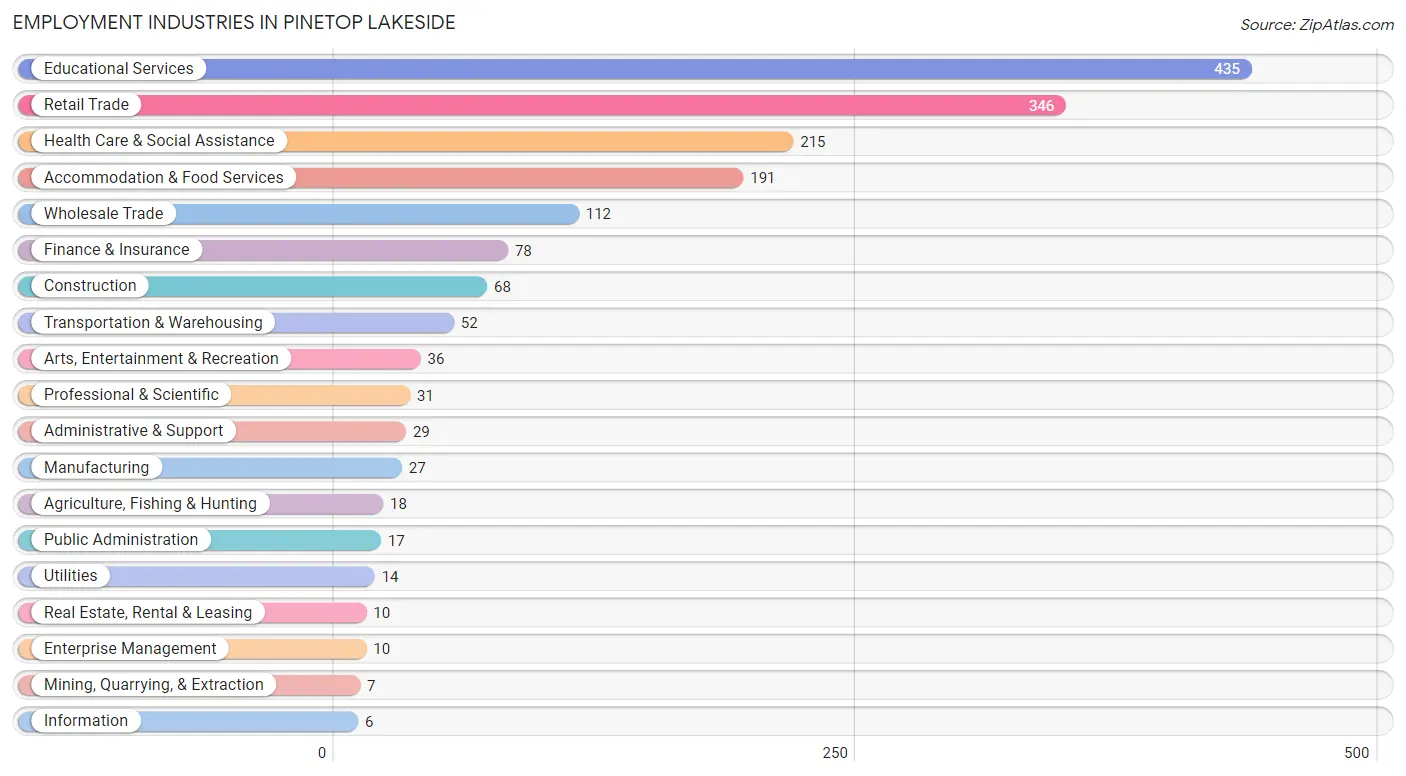
Employment Industries in Pinetop Lakeside
The major employment industries in Pinetop Lakeside include Educational Services (435 | 25.0%), Retail Trade (346 | 19.9%), Health Care & Social Assistance (215 | 12.3%), Accommodation & Food Services (191 | 11.0%), and Wholesale Trade (112 | 6.4%).
Employment Industries by Sex in Pinetop Lakeside
The Pinetop Lakeside industries that see more men than women are Agriculture, Fishing & Hunting (100.0%), Mining, Quarrying, & Extraction (100.0%), and Construction (100.0%), whereas the industries that tend to have a higher number of women are Transportation & Warehousing (100.0%), Utilities (100.0%), and Real Estate, Rental & Leasing (100.0%).
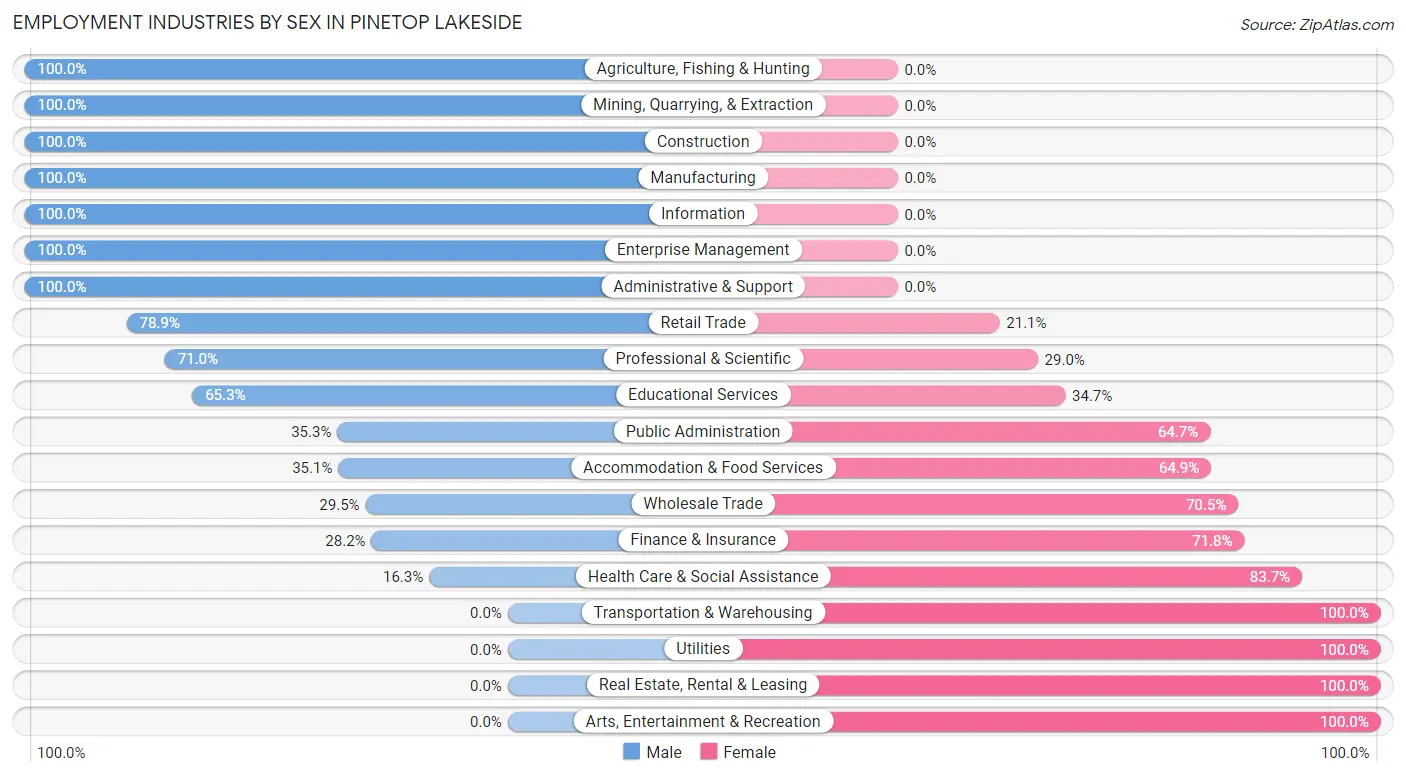
| Industry | Male | Female |
| Agriculture, Fishing & Hunting | 18 (100.0%) | 0 (0.0%) |
| Mining, Quarrying, & Extraction | 7 (100.0%) | 0 (0.0%) |
| Construction | 68 (100.0%) | 0 (0.0%) |
| Manufacturing | 27 (100.0%) | 0 (0.0%) |
| Wholesale Trade | 33 (29.5%) | 79 (70.5%) |
| Retail Trade | 273 (78.9%) | 73 (21.1%) |
| Transportation & Warehousing | 0 (0.0%) | 52 (100.0%) |
| Utilities | 0 (0.0%) | 14 (100.0%) |
| Information | 6 (100.0%) | 0 (0.0%) |
| Finance & Insurance | 22 (28.2%) | 56 (71.8%) |
| Real Estate, Rental & Leasing | 0 (0.0%) | 10 (100.0%) |
| Professional & Scientific | 22 (71.0%) | 9 (29.0%) |
| Enterprise Management | 10 (100.0%) | 0 (0.0%) |
| Administrative & Support | 29 (100.0%) | 0 (0.0%) |
| Educational Services | 284 (65.3%) | 151 (34.7%) |
| Health Care & Social Assistance | 35 (16.3%) | 180 (83.7%) |
| Arts, Entertainment & Recreation | 0 (0.0%) | 36 (100.0%) |
| Accommodation & Food Services | 67 (35.1%) | 124 (64.9%) |
| Public Administration | 6 (35.3%) | 11 (64.7%) |
| Total | 924 (53.1%) | 817 (46.9%) |
Education in Pinetop Lakeside
School Enrollment in Pinetop Lakeside
The most common levels of schooling among the 737 students in Pinetop Lakeside are high school (315 | 42.7%), middle school (178 | 24.1%), and college / undergraduate (110 | 14.9%).
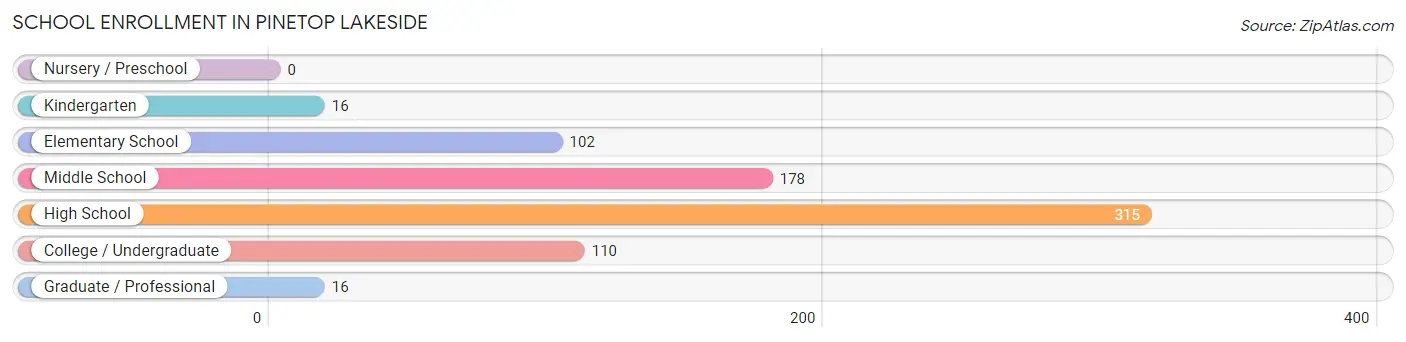
| School Level | # Students | % Students |
| Nursery / Preschool | 0 | 0.0% |
| Kindergarten | 16 | 2.2% |
| Elementary School | 102 | 13.8% |
| Middle School | 178 | 24.1% |
| High School | 315 | 42.7% |
| College / Undergraduate | 110 | 14.9% |
| Graduate / Professional | 16 | 2.2% |
| Total | 737 | 100.0% |
School Enrollment by Age by Funding Source in Pinetop Lakeside
Out of a total of 737 students who are enrolled in schools in Pinetop Lakeside, 39 (5.3%) attend a private institution, while the remaining 698 (94.7%) are enrolled in public schools. The age group of 35 years and over has the highest likelihood of being enrolled in private schools, with 9 (33.3% in the age bracket) enrolled. Conversely, the age group of 10 to 14 year olds has the lowest likelihood of being enrolled in a private school, with 216 (100.0% in the age bracket) attending a public institution.
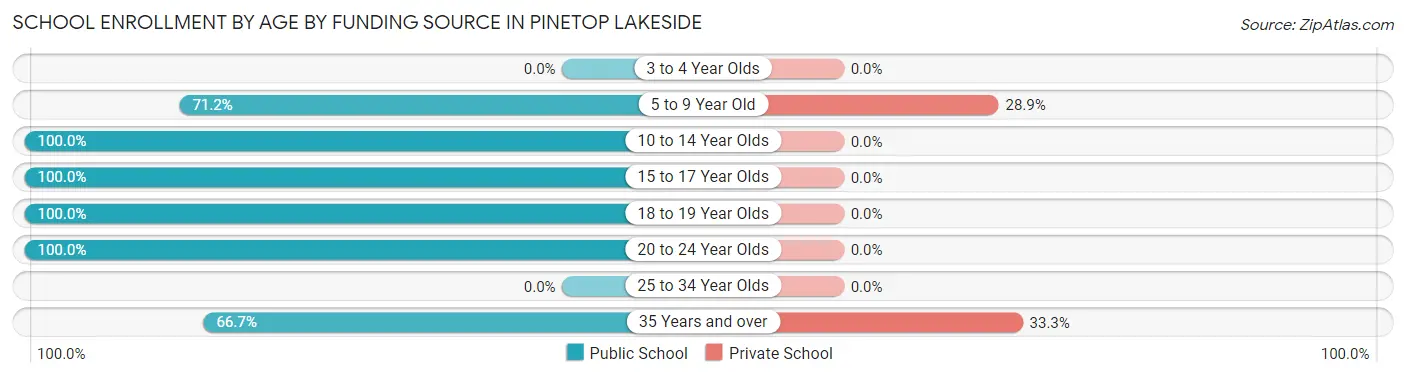
| Age Bracket | Public School | Private School |
| 3 to 4 Year Olds | 0 (0.0%) | 0 (0.0%) |
| 5 to 9 Year Old | 74 (71.2%) | 30 (28.8%) |
| 10 to 14 Year Olds | 216 (100.0%) | 0 (0.0%) |
| 15 to 17 Year Olds | 192 (100.0%) | 0 (0.0%) |
| 18 to 19 Year Olds | 134 (100.0%) | 0 (0.0%) |
| 20 to 24 Year Olds | 64 (100.0%) | 0 (0.0%) |
| 25 to 34 Year Olds | 0 (0.0%) | 0 (0.0%) |
| 35 Years and over | 18 (66.7%) | 9 (33.3%) |
| Total | 698 (94.7%) | 39 (5.3%) |
Educational Attainment by Field of Study in Pinetop Lakeside
Education (271 | 22.3%), business (215 | 17.7%), science & technology (109 | 9.0%), bio, nature & agricultural (97 | 8.0%), and social sciences (90 | 7.4%) are the most common fields of study among 1,215 individuals in Pinetop Lakeside who have obtained a bachelor's degree or higher.
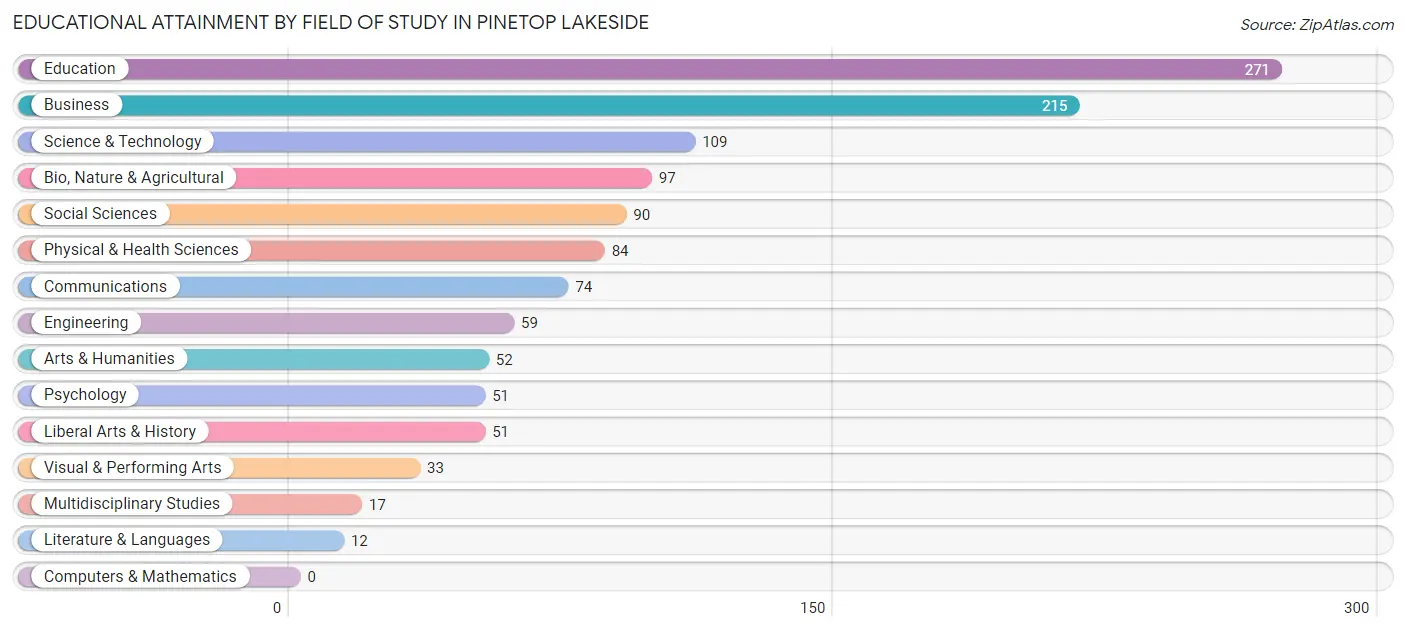
| Field of Study | # Graduates | % Graduates |
| Computers & Mathematics | 0 | 0.0% |
| Bio, Nature & Agricultural | 97 | 8.0% |
| Physical & Health Sciences | 84 | 6.9% |
| Psychology | 51 | 4.2% |
| Social Sciences | 90 | 7.4% |
| Engineering | 59 | 4.9% |
| Multidisciplinary Studies | 17 | 1.4% |
| Science & Technology | 109 | 9.0% |
| Business | 215 | 17.7% |
| Education | 271 | 22.3% |
| Literature & Languages | 12 | 1.0% |
| Liberal Arts & History | 51 | 4.2% |
| Visual & Performing Arts | 33 | 2.7% |
| Communications | 74 | 6.1% |
| Arts & Humanities | 52 | 4.3% |
| Total | 1,215 | 100.0% |
Transportation & Commute in Pinetop Lakeside
Vehicle Availability by Sex in Pinetop Lakeside
The most prevalent vehicle ownership categories in Pinetop Lakeside are males with 2 vehicles (467, accounting for 50.8%) and females with 2 vehicles (189, making up 61.9%).
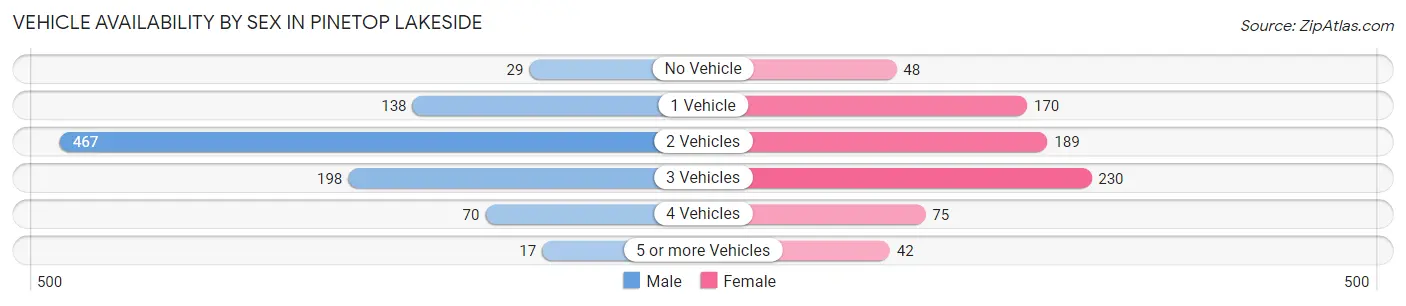
| Vehicles Available | Male | Female |
| No Vehicle | 29 (3.2%) | 48 (6.4%) |
| 1 Vehicle | 138 (15.0%) | 170 (22.6%) |
| 2 Vehicles | 467 (50.8%) | 189 (25.1%) |
| 3 Vehicles | 198 (21.5%) | 230 (30.5%) |
| 4 Vehicles | 70 (7.6%) | 75 (10.0%) |
| 5 or more Vehicles | 17 (1.8%) | 42 (5.6%) |
| Total | 919 (100.0%) | 754 (100.0%) |
Commute Time in Pinetop Lakeside
The most frequently occuring commute durations in Pinetop Lakeside are 30 to 34 minutes (308 commuters, 19.7%), 15 to 19 minutes (294 commuters, 18.8%), and 5 to 9 minutes (271 commuters, 17.3%).
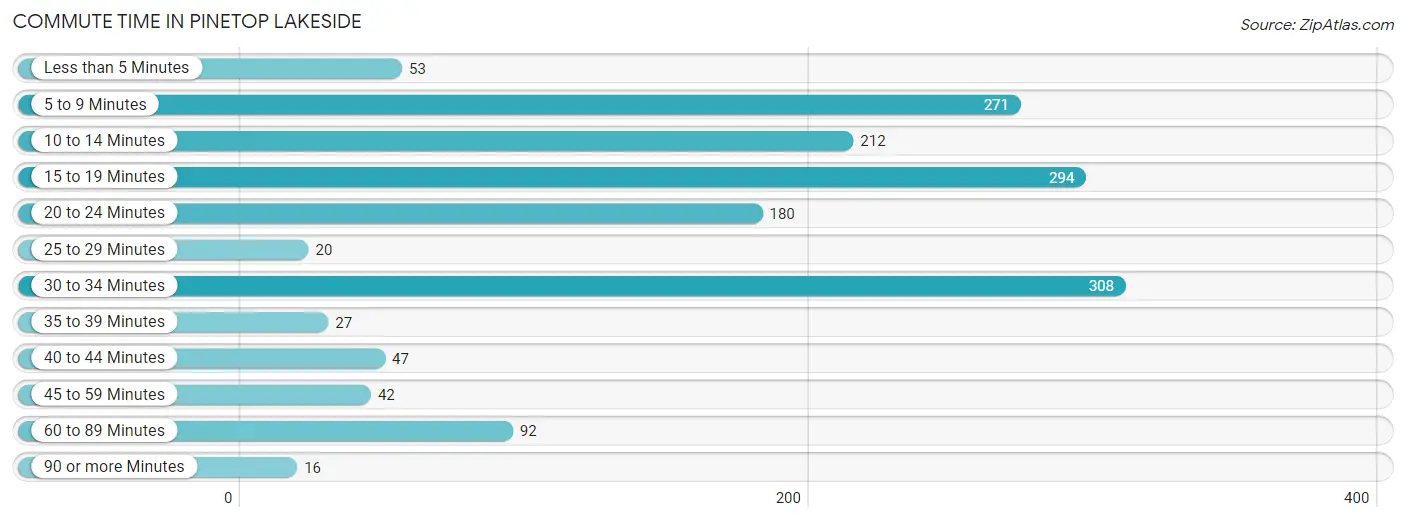
| Commute Time | # Commuters | % Commuters |
| Less than 5 Minutes | 53 | 3.4% |
| 5 to 9 Minutes | 271 | 17.3% |
| 10 to 14 Minutes | 212 | 13.6% |
| 15 to 19 Minutes | 294 | 18.8% |
| 20 to 24 Minutes | 180 | 11.5% |
| 25 to 29 Minutes | 20 | 1.3% |
| 30 to 34 Minutes | 308 | 19.7% |
| 35 to 39 Minutes | 27 | 1.7% |
| 40 to 44 Minutes | 47 | 3.0% |
| 45 to 59 Minutes | 42 | 2.7% |
| 60 to 89 Minutes | 92 | 5.9% |
| 90 or more Minutes | 16 | 1.0% |
Commute Time by Sex in Pinetop Lakeside
The most common commute times in Pinetop Lakeside are 30 to 34 minutes (212 commuters, 23.8%) for males and 5 to 9 minutes (137 commuters, 20.4%) for females.
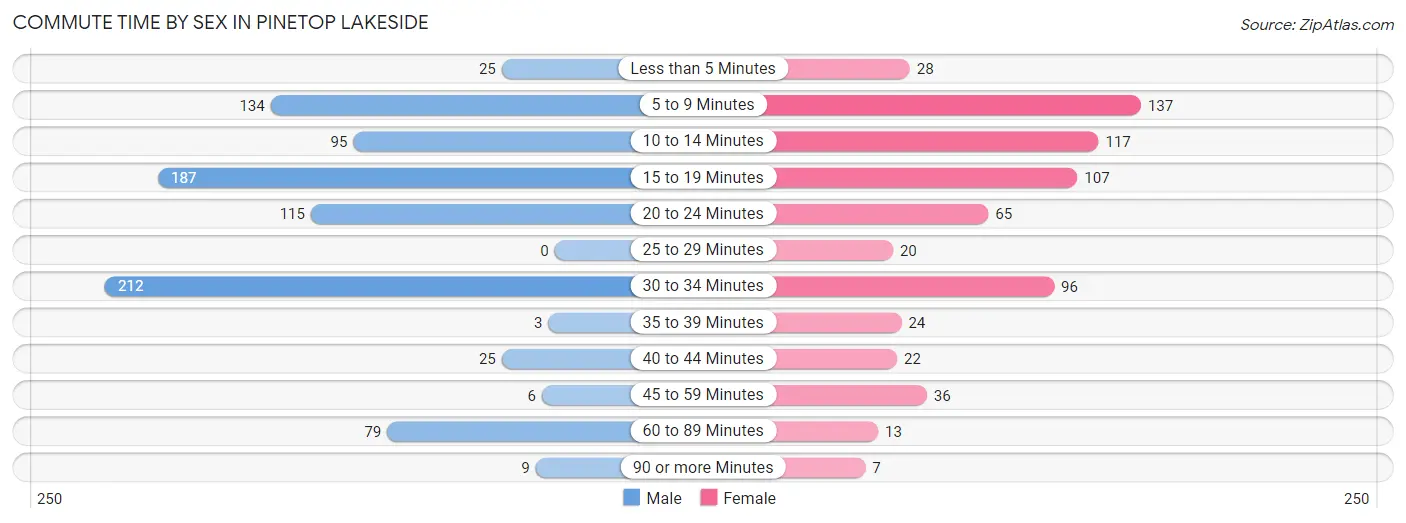
| Commute Time | Male | Female |
| Less than 5 Minutes | 25 (2.8%) | 28 (4.2%) |
| 5 to 9 Minutes | 134 (15.1%) | 137 (20.4%) |
| 10 to 14 Minutes | 95 (10.7%) | 117 (17.4%) |
| 15 to 19 Minutes | 187 (21.0%) | 107 (15.9%) |
| 20 to 24 Minutes | 115 (12.9%) | 65 (9.7%) |
| 25 to 29 Minutes | 0 (0.0%) | 20 (3.0%) |
| 30 to 34 Minutes | 212 (23.8%) | 96 (14.3%) |
| 35 to 39 Minutes | 3 (0.3%) | 24 (3.6%) |
| 40 to 44 Minutes | 25 (2.8%) | 22 (3.3%) |
| 45 to 59 Minutes | 6 (0.7%) | 36 (5.4%) |
| 60 to 89 Minutes | 79 (8.9%) | 13 (1.9%) |
| 90 or more Minutes | 9 (1.0%) | 7 (1.0%) |
Time of Departure to Work by Sex in Pinetop Lakeside
The most frequent times of departure to work in Pinetop Lakeside are 7:30 AM to 7:59 AM (258, 29.0%) for males and 7:30 AM to 7:59 AM (199, 29.6%) for females.
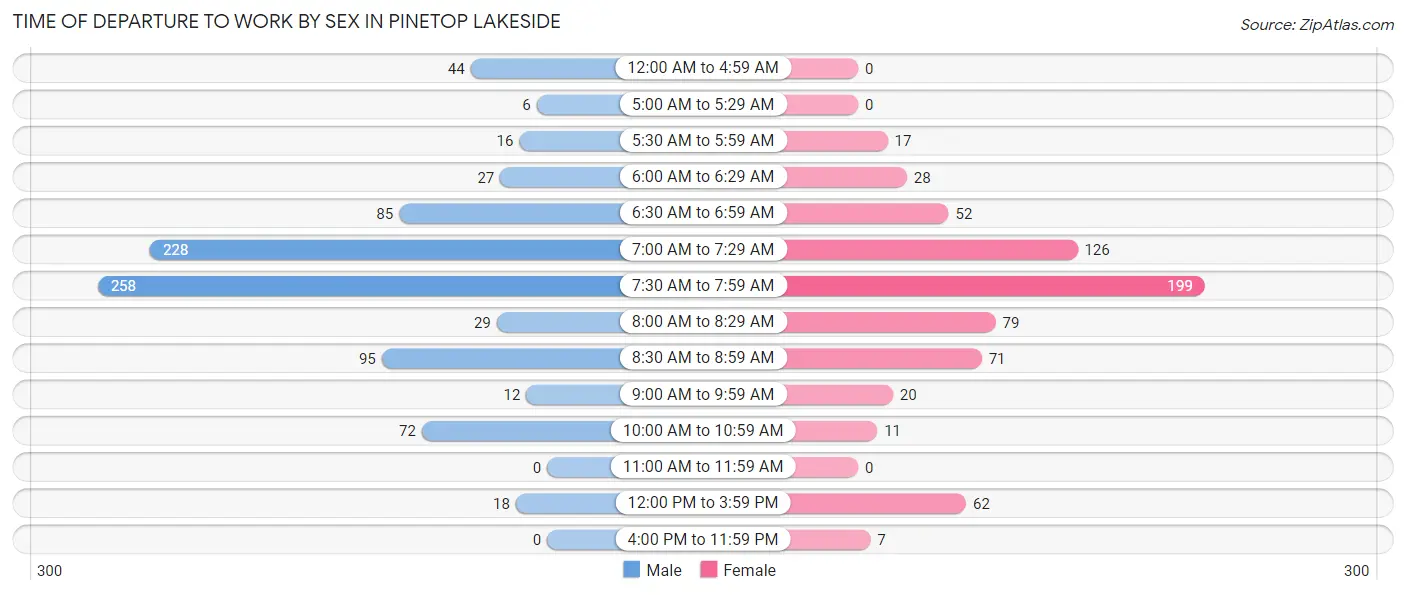
| Time of Departure | Male | Female |
| 12:00 AM to 4:59 AM | 44 (4.9%) | 0 (0.0%) |
| 5:00 AM to 5:29 AM | 6 (0.7%) | 0 (0.0%) |
| 5:30 AM to 5:59 AM | 16 (1.8%) | 17 (2.5%) |
| 6:00 AM to 6:29 AM | 27 (3.0%) | 28 (4.2%) |
| 6:30 AM to 6:59 AM | 85 (9.6%) | 52 (7.7%) |
| 7:00 AM to 7:29 AM | 228 (25.6%) | 126 (18.8%) |
| 7:30 AM to 7:59 AM | 258 (29.0%) | 199 (29.6%) |
| 8:00 AM to 8:29 AM | 29 (3.3%) | 79 (11.8%) |
| 8:30 AM to 8:59 AM | 95 (10.7%) | 71 (10.6%) |
| 9:00 AM to 9:59 AM | 12 (1.3%) | 20 (3.0%) |
| 10:00 AM to 10:59 AM | 72 (8.1%) | 11 (1.6%) |
| 11:00 AM to 11:59 AM | 0 (0.0%) | 0 (0.0%) |
| 12:00 PM to 3:59 PM | 18 (2.0%) | 62 (9.2%) |
| 4:00 PM to 11:59 PM | 0 (0.0%) | 7 (1.0%) |
| Total | 890 (100.0%) | 672 (100.0%) |
Housing Occupancy in Pinetop Lakeside
Occupancy by Ownership in Pinetop Lakeside
Of the total 1,769 dwellings in Pinetop Lakeside, owner-occupied units account for 1,332 (75.3%), while renter-occupied units make up 437 (24.7%).
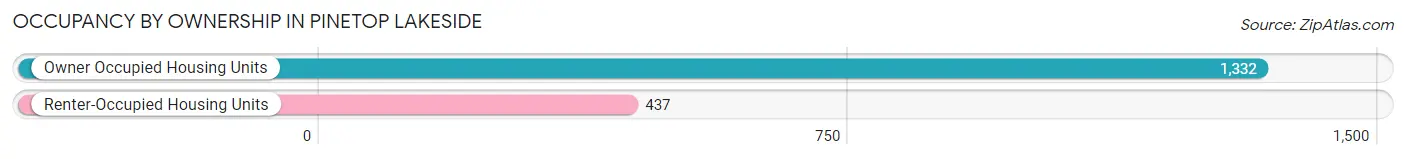
| Occupancy | # Housing Units | % Housing Units |
| Owner Occupied Housing Units | 1,332 | 75.3% |
| Renter-Occupied Housing Units | 437 | 24.7% |
| Total Occupied Housing Units | 1,769 | 100.0% |
Occupancy by Household Size in Pinetop Lakeside
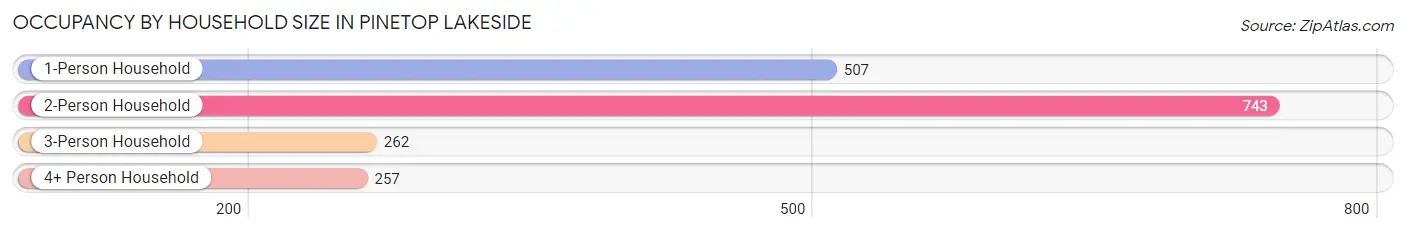
| Household Size | # Housing Units | % Housing Units |
| 1-Person Household | 507 | 28.7% |
| 2-Person Household | 743 | 42.0% |
| 3-Person Household | 262 | 14.8% |
| 4+ Person Household | 257 | 14.5% |
| Total Housing Units | 1,769 | 100.0% |
Occupancy by Ownership by Household Size in Pinetop Lakeside
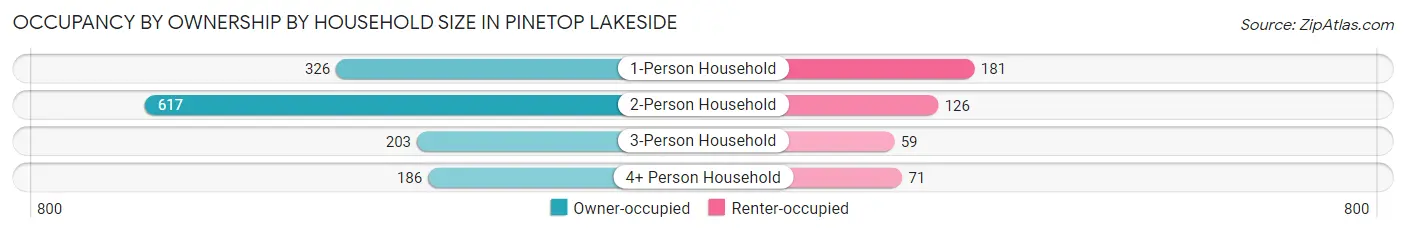
| Household Size | Owner-occupied | Renter-occupied |
| 1-Person Household | 326 (64.3%) | 181 (35.7%) |
| 2-Person Household | 617 (83.0%) | 126 (17.0%) |
| 3-Person Household | 203 (77.5%) | 59 (22.5%) |
| 4+ Person Household | 186 (72.4%) | 71 (27.6%) |
| Total Housing Units | 1,332 (75.3%) | 437 (24.7%) |
Occupancy by Educational Attainment in Pinetop Lakeside
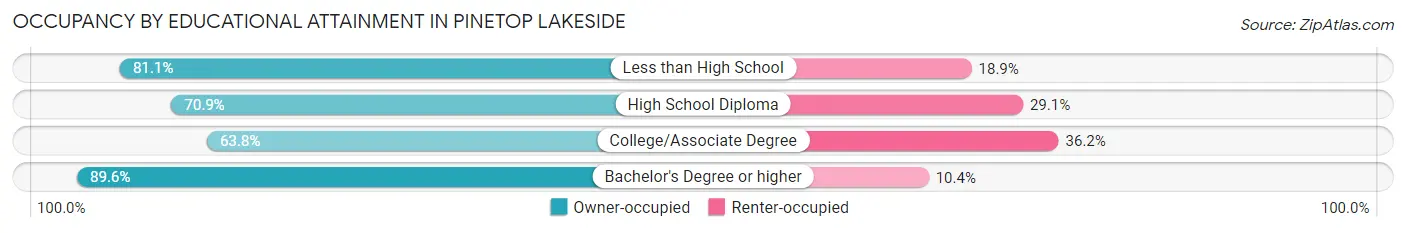
| Household Size | Owner-occupied | Renter-occupied |
| Less than High School | 60 (81.1%) | 14 (18.9%) |
| High School Diploma | 246 (70.9%) | 101 (29.1%) |
| College/Associate Degree | 450 (63.8%) | 255 (36.2%) |
| Bachelor's Degree or higher | 576 (89.6%) | 67 (10.4%) |
Occupancy by Age of Householder in Pinetop Lakeside
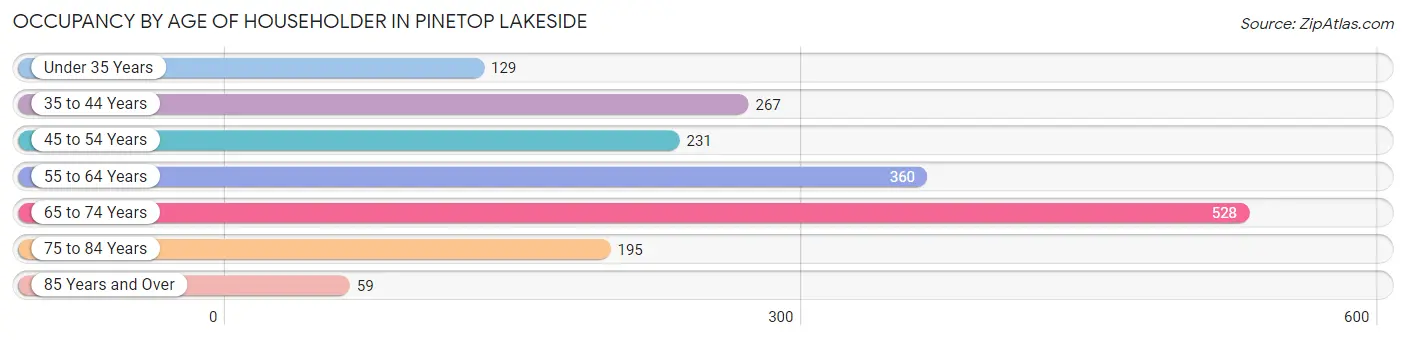
| Age Bracket | # Households | % Households |
| Under 35 Years | 129 | 7.3% |
| 35 to 44 Years | 267 | 15.1% |
| 45 to 54 Years | 231 | 13.1% |
| 55 to 64 Years | 360 | 20.3% |
| 65 to 74 Years | 528 | 29.8% |
| 75 to 84 Years | 195 | 11.0% |
| 85 Years and Over | 59 | 3.3% |
| Total | 1,769 | 100.0% |
Housing Finances in Pinetop Lakeside
Median Income by Occupancy in Pinetop Lakeside
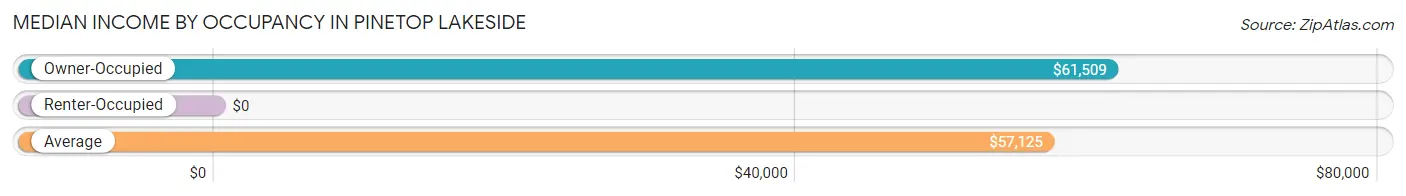
| Occupancy Type | # Households | Median Income |
| Owner-Occupied | 1,332 (75.3%) | $61,509 |
| Renter-Occupied | 437 (24.7%) | $0 |
| Average | 1,769 (100.0%) | $57,125 |
Occupancy by Householder Income Bracket in Pinetop Lakeside
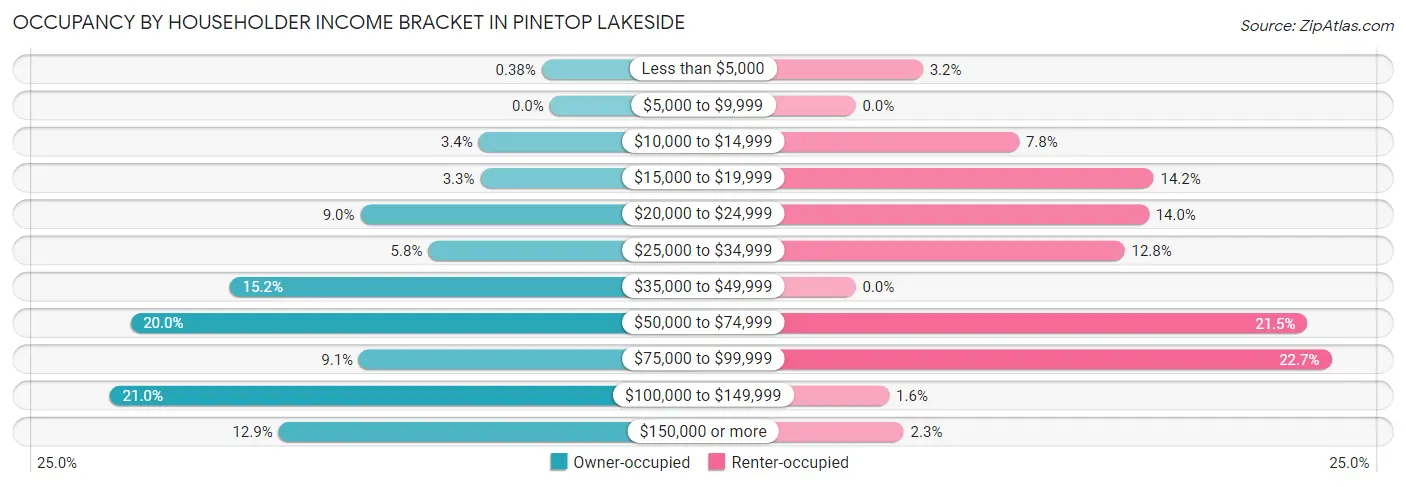
| Income Bracket | Owner-occupied | Renter-occupied |
| Less than $5,000 | 5 (0.4%) | 14 (3.2%) |
| $5,000 to $9,999 | 0 (0.0%) | 0 (0.0%) |
| $10,000 to $14,999 | 45 (3.4%) | 34 (7.8%) |
| $15,000 to $19,999 | 44 (3.3%) | 62 (14.2%) |
| $20,000 to $24,999 | 120 (9.0%) | 61 (14.0%) |
| $25,000 to $34,999 | 77 (5.8%) | 56 (12.8%) |
| $35,000 to $49,999 | 203 (15.2%) | 0 (0.0%) |
| $50,000 to $74,999 | 266 (20.0%) | 94 (21.5%) |
| $75,000 to $99,999 | 121 (9.1%) | 99 (22.7%) |
| $100,000 to $149,999 | 279 (20.9%) | 7 (1.6%) |
| $150,000 or more | 172 (12.9%) | 10 (2.3%) |
| Total | 1,332 (100.0%) | 437 (100.0%) |
Monthly Housing Cost Tiers in Pinetop Lakeside
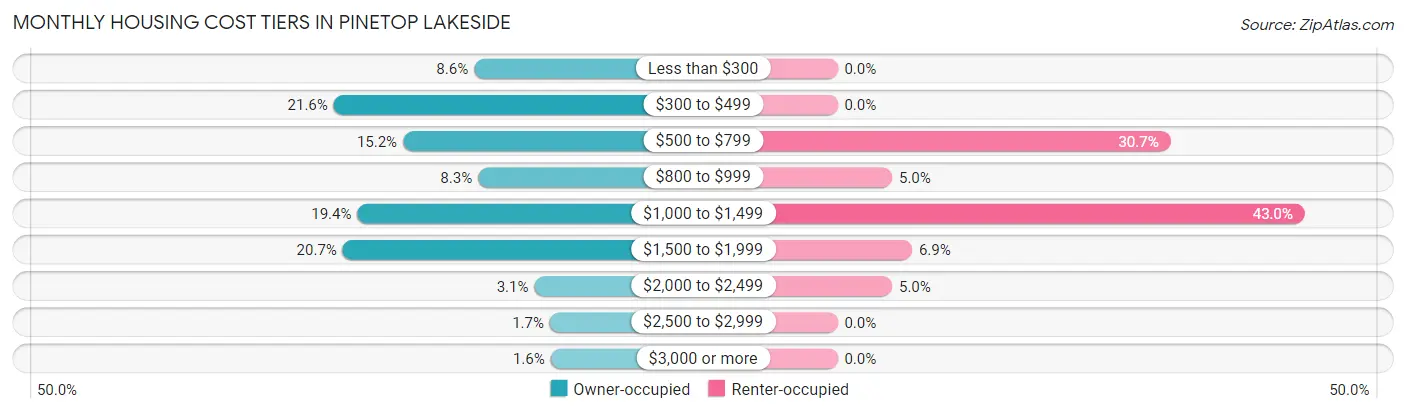
| Monthly Cost | Owner-occupied | Renter-occupied |
| Less than $300 | 115 (8.6%) | 0 (0.0%) |
| $300 to $499 | 287 (21.5%) | 0 (0.0%) |
| $500 to $799 | 202 (15.2%) | 134 (30.7%) |
| $800 to $999 | 110 (8.3%) | 22 (5.0%) |
| $1,000 to $1,499 | 258 (19.4%) | 188 (43.0%) |
| $1,500 to $1,999 | 276 (20.7%) | 30 (6.9%) |
| $2,000 to $2,499 | 41 (3.1%) | 22 (5.0%) |
| $2,500 to $2,999 | 22 (1.7%) | 0 (0.0%) |
| $3,000 or more | 21 (1.6%) | 0 (0.0%) |
| Total | 1,332 (100.0%) | 437 (100.0%) |
Physical Housing Characteristics in Pinetop Lakeside
Housing Structures in Pinetop Lakeside
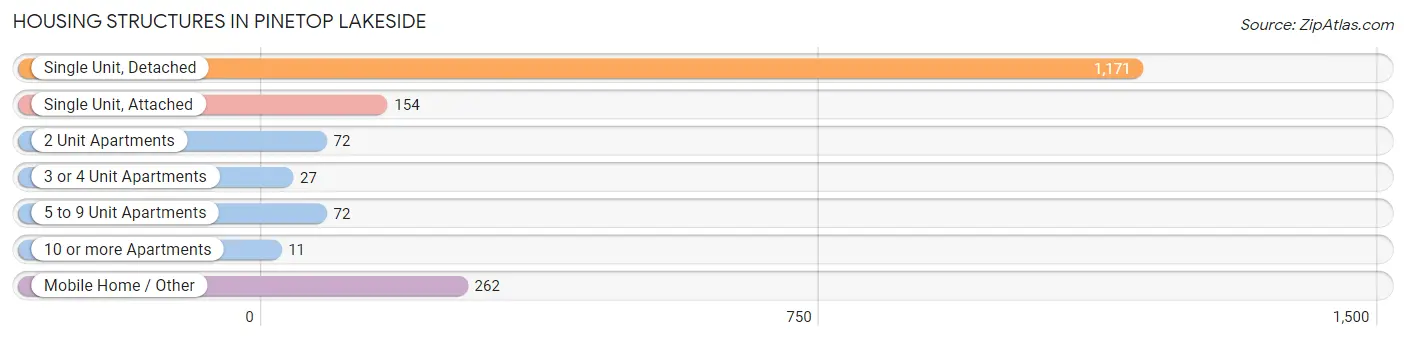
| Structure Type | # Housing Units | % Housing Units |
| Single Unit, Detached | 1,171 | 66.2% |
| Single Unit, Attached | 154 | 8.7% |
| 2 Unit Apartments | 72 | 4.1% |
| 3 or 4 Unit Apartments | 27 | 1.5% |
| 5 to 9 Unit Apartments | 72 | 4.1% |
| 10 or more Apartments | 11 | 0.6% |
| Mobile Home / Other | 262 | 14.8% |
| Total | 1,769 | 100.0% |
Housing Structures by Occupancy in Pinetop Lakeside
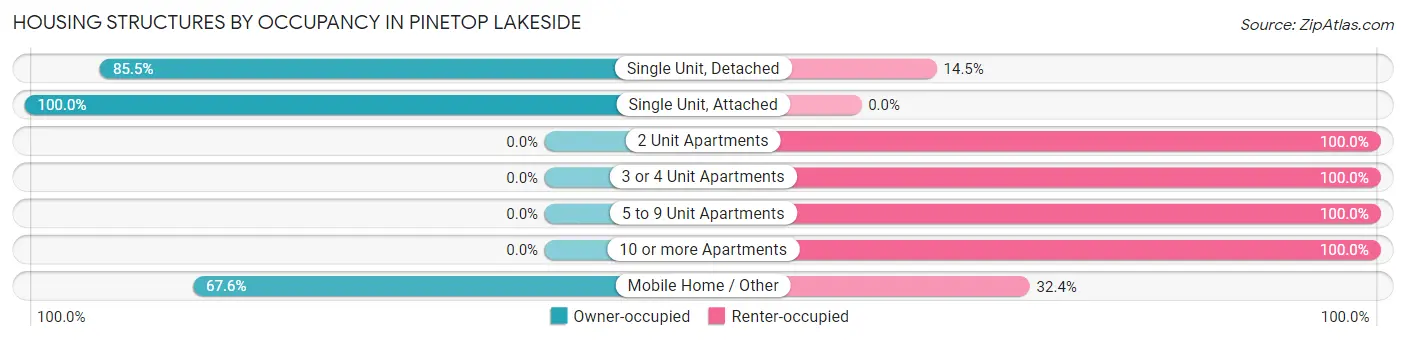
| Structure Type | Owner-occupied | Renter-occupied |
| Single Unit, Detached | 1,001 (85.5%) | 170 (14.5%) |
| Single Unit, Attached | 154 (100.0%) | 0 (0.0%) |
| 2 Unit Apartments | 0 (0.0%) | 72 (100.0%) |
| 3 or 4 Unit Apartments | 0 (0.0%) | 27 (100.0%) |
| 5 to 9 Unit Apartments | 0 (0.0%) | 72 (100.0%) |
| 10 or more Apartments | 0 (0.0%) | 11 (100.0%) |
| Mobile Home / Other | 177 (67.6%) | 85 (32.4%) |
| Total | 1,332 (75.3%) | 437 (24.7%) |
Housing Structures by Number of Rooms in Pinetop Lakeside
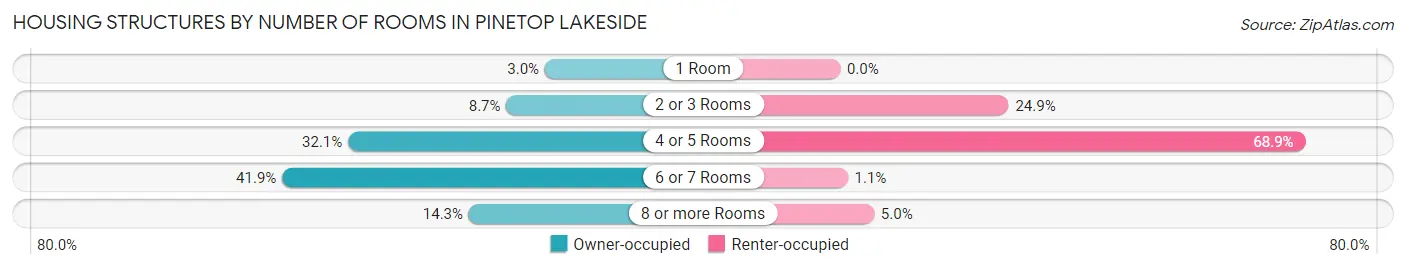
| Number of Rooms | Owner-occupied | Renter-occupied |
| 1 Room | 40 (3.0%) | 0 (0.0%) |
| 2 or 3 Rooms | 116 (8.7%) | 109 (24.9%) |
| 4 or 5 Rooms | 428 (32.1%) | 301 (68.9%) |
| 6 or 7 Rooms | 558 (41.9%) | 5 (1.1%) |
| 8 or more Rooms | 190 (14.3%) | 22 (5.0%) |
| Total | 1,332 (100.0%) | 437 (100.0%) |
Housing Structure by Heating Type in Pinetop Lakeside
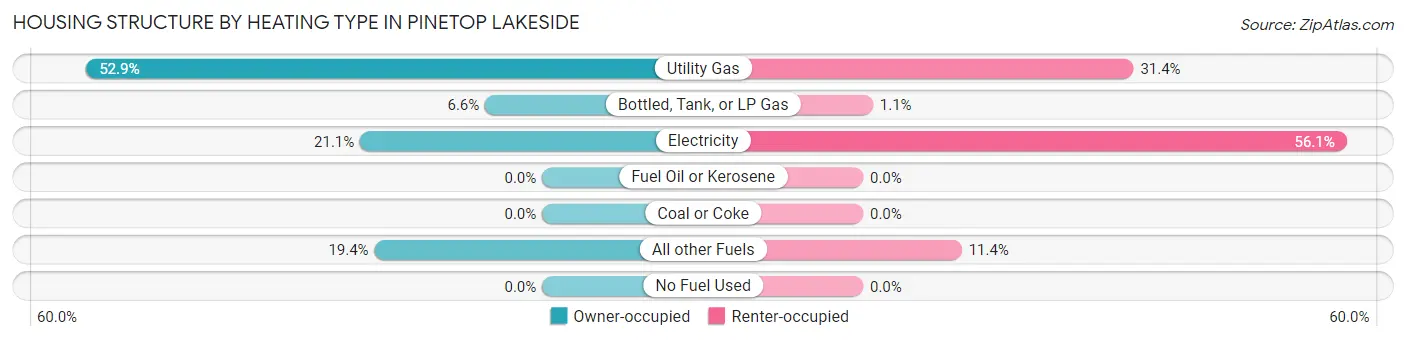
| Heating Type | Owner-occupied | Renter-occupied |
| Utility Gas | 704 (52.8%) | 137 (31.4%) |
| Bottled, Tank, or LP Gas | 88 (6.6%) | 5 (1.1%) |
| Electricity | 281 (21.1%) | 245 (56.1%) |
| Fuel Oil or Kerosene | 0 (0.0%) | 0 (0.0%) |
| Coal or Coke | 0 (0.0%) | 0 (0.0%) |
| All other Fuels | 259 (19.4%) | 50 (11.4%) |
| No Fuel Used | 0 (0.0%) | 0 (0.0%) |
| Total | 1,332 (100.0%) | 437 (100.0%) |
Household Vehicle Usage in Pinetop Lakeside
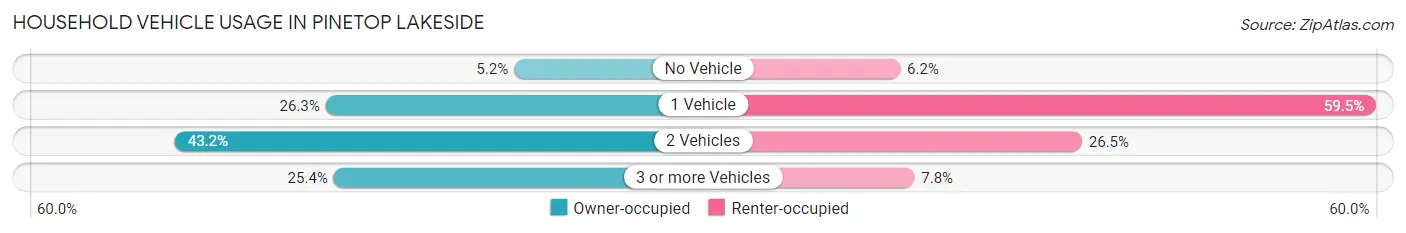
| Vehicles per Household | Owner-occupied | Renter-occupied |
| No Vehicle | 69 (5.2%) | 27 (6.2%) |
| 1 Vehicle | 350 (26.3%) | 260 (59.5%) |
| 2 Vehicles | 575 (43.2%) | 116 (26.5%) |
| 3 or more Vehicles | 338 (25.4%) | 34 (7.8%) |
| Total | 1,332 (100.0%) | 437 (100.0%) |
Real Estate & Mortgages in Pinetop Lakeside
Real Estate and Mortgage Overview in Pinetop Lakeside
| Characteristic | Without Mortgage | With Mortgage |
| Housing Units | 604 | 728 |
| Median Property Value | $325,000 | $256,300 |
| Median Household Income | $48,393 | $132 |
| Monthly Housing Costs | $455 | $21 |
| Real Estate Taxes | $2,198 | $10 |
Property Value by Mortgage Status in Pinetop Lakeside
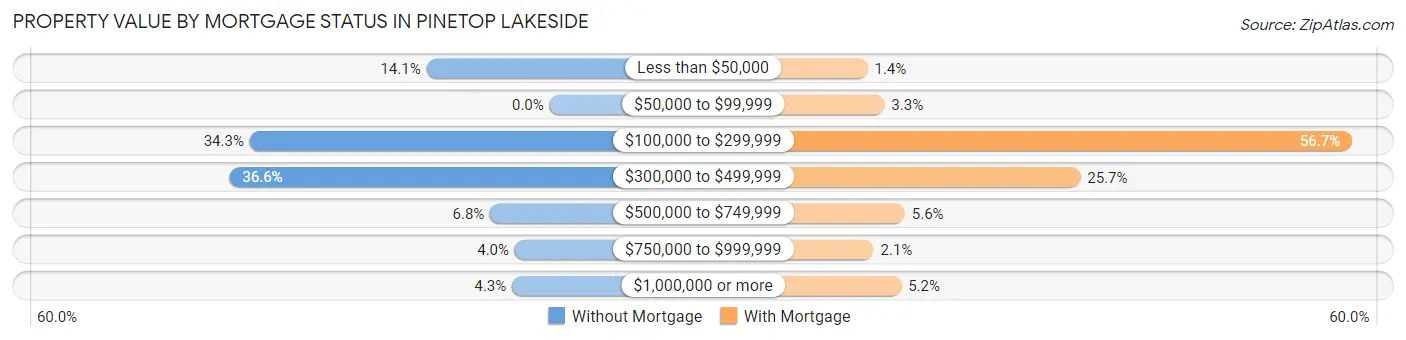
| Property Value | Without Mortgage | With Mortgage |
| Less than $50,000 | 85 (14.1%) | 10 (1.4%) |
| $50,000 to $99,999 | 0 (0.0%) | 24 (3.3%) |
| $100,000 to $299,999 | 207 (34.3%) | 413 (56.7%) |
| $300,000 to $499,999 | 221 (36.6%) | 187 (25.7%) |
| $500,000 to $749,999 | 41 (6.8%) | 41 (5.6%) |
| $750,000 to $999,999 | 24 (4.0%) | 15 (2.1%) |
| $1,000,000 or more | 26 (4.3%) | 38 (5.2%) |
| Total | 604 (100.0%) | 728 (100.0%) |
Household Income by Mortgage Status in Pinetop Lakeside
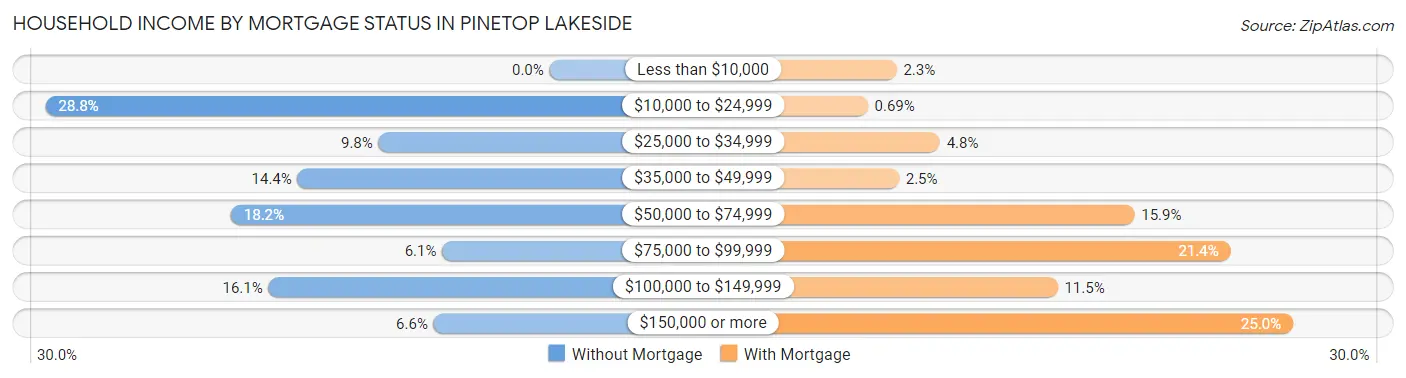
| Household Income | Without Mortgage | With Mortgage |
| Less than $10,000 | 0 (0.0%) | 17 (2.3%) |
| $10,000 to $24,999 | 174 (28.8%) | 5 (0.7%) |
| $25,000 to $34,999 | 59 (9.8%) | 35 (4.8%) |
| $35,000 to $49,999 | 87 (14.4%) | 18 (2.5%) |
| $50,000 to $74,999 | 110 (18.2%) | 116 (15.9%) |
| $75,000 to $99,999 | 37 (6.1%) | 156 (21.4%) |
| $100,000 to $149,999 | 97 (16.1%) | 84 (11.5%) |
| $150,000 or more | 40 (6.6%) | 182 (25.0%) |
| Total | 604 (100.0%) | 728 (100.0%) |
Property Value to Household Income Ratio in Pinetop Lakeside
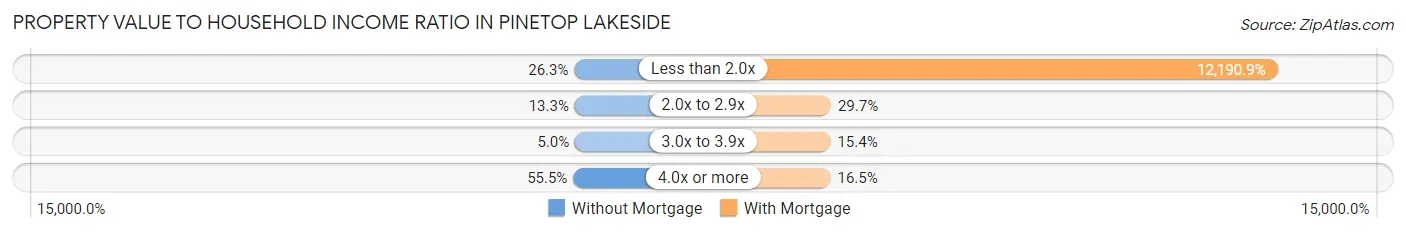
| Value-to-Income Ratio | Without Mortgage | With Mortgage |
| Less than 2.0x | 159 (26.3%) | 88,750 (12,190.9%) |
| 2.0x to 2.9x | 80 (13.3%) | 216 (29.7%) |
| 3.0x to 3.9x | 30 (5.0%) | 112 (15.4%) |
| 4.0x or more | 335 (55.5%) | 120 (16.5%) |
| Total | 604 (100.0%) | 728 (100.0%) |
Real Estate Taxes by Mortgage Status in Pinetop Lakeside
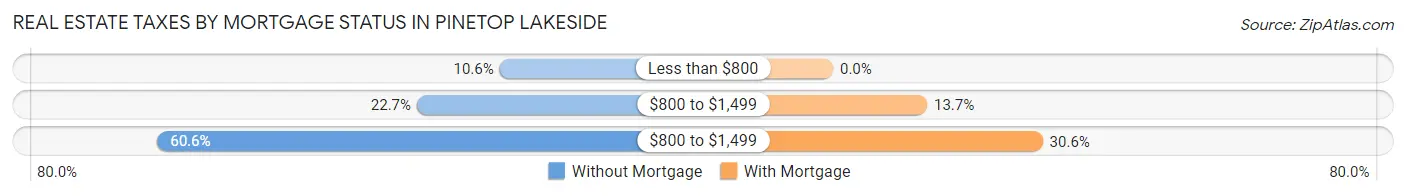
| Property Taxes | Without Mortgage | With Mortgage |
| Less than $800 | 64 (10.6%) | 0 (0.0%) |
| $800 to $1,499 | 137 (22.7%) | 100 (13.7%) |
| $800 to $1,499 | 366 (60.6%) | 223 (30.6%) |
| Total | 604 (100.0%) | 728 (100.0%) |
Health & Disability in Pinetop Lakeside
Health Insurance Coverage by Age in Pinetop Lakeside
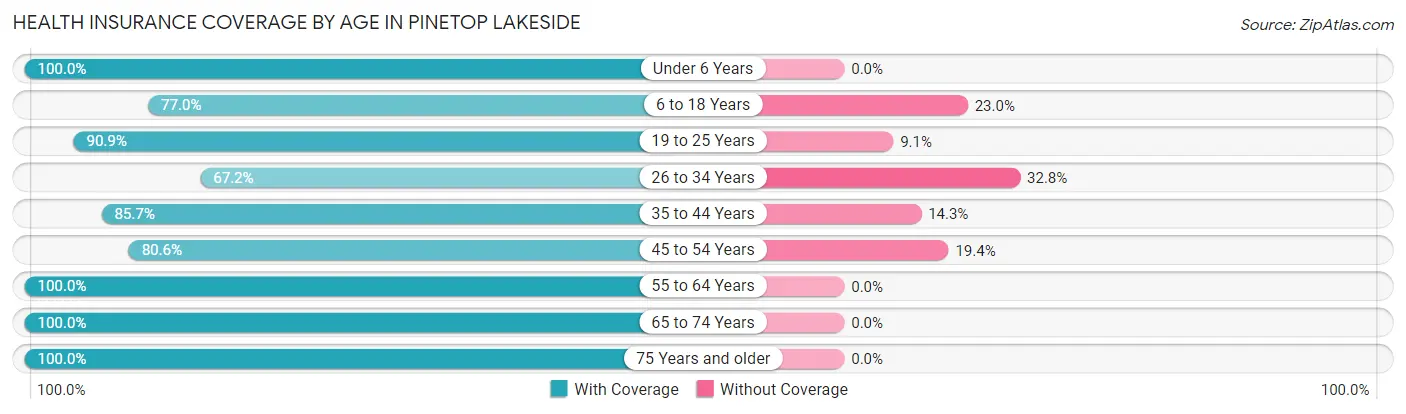
| Age Bracket | With Coverage | Without Coverage |
| Under 6 Years | 149 (100.0%) | 0 (0.0%) |
| 6 to 18 Years | 485 (77.0%) | 145 (23.0%) |
| 19 to 25 Years | 199 (90.9%) | 20 (9.1%) |
| 26 to 34 Years | 121 (67.2%) | 59 (32.8%) |
| 35 to 44 Years | 436 (85.7%) | 73 (14.3%) |
| 45 to 54 Years | 365 (80.6%) | 88 (19.4%) |
| 55 to 64 Years | 562 (100.0%) | 0 (0.0%) |
| 65 to 74 Years | 875 (100.0%) | 0 (0.0%) |
| 75 Years and older | 478 (100.0%) | 0 (0.0%) |
| Total | 3,670 (90.5%) | 385 (9.5%) |
Health Insurance Coverage by Citizenship Status in Pinetop Lakeside
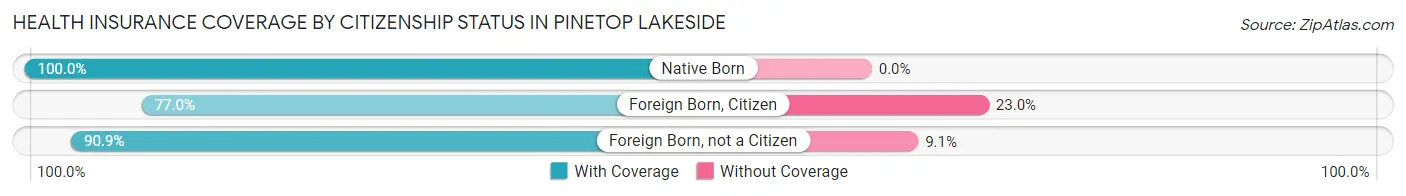
| Citizenship Status | With Coverage | Without Coverage |
| Native Born | 149 (100.0%) | 0 (0.0%) |
| Foreign Born, Citizen | 485 (77.0%) | 145 (23.0%) |
| Foreign Born, not a Citizen | 199 (90.9%) | 20 (9.1%) |
Health Insurance Coverage by Household Income in Pinetop Lakeside
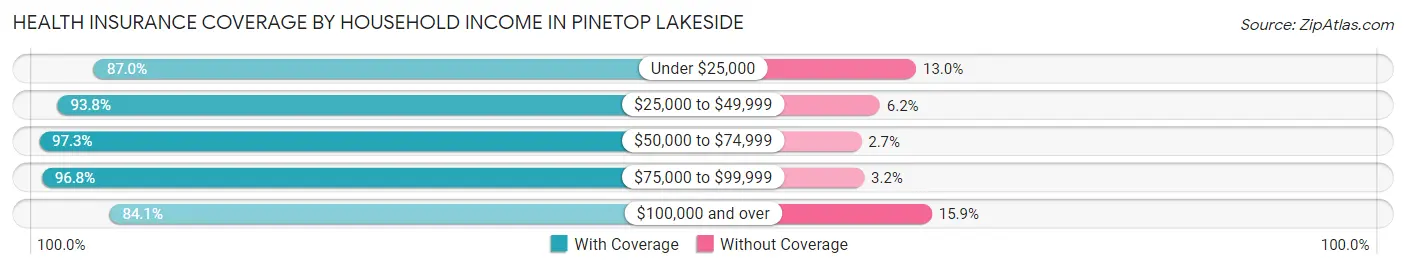
| Household Income | With Coverage | Without Coverage |
| Under $25,000 | 584 (87.0%) | 87 (13.0%) |
| $25,000 to $49,999 | 743 (93.8%) | 49 (6.2%) |
| $50,000 to $74,999 | 681 (97.3%) | 19 (2.7%) |
| $75,000 to $99,999 | 567 (96.8%) | 19 (3.2%) |
| $100,000 and over | 1,088 (84.1%) | 206 (15.9%) |
Public vs Private Health Insurance Coverage by Age in Pinetop Lakeside
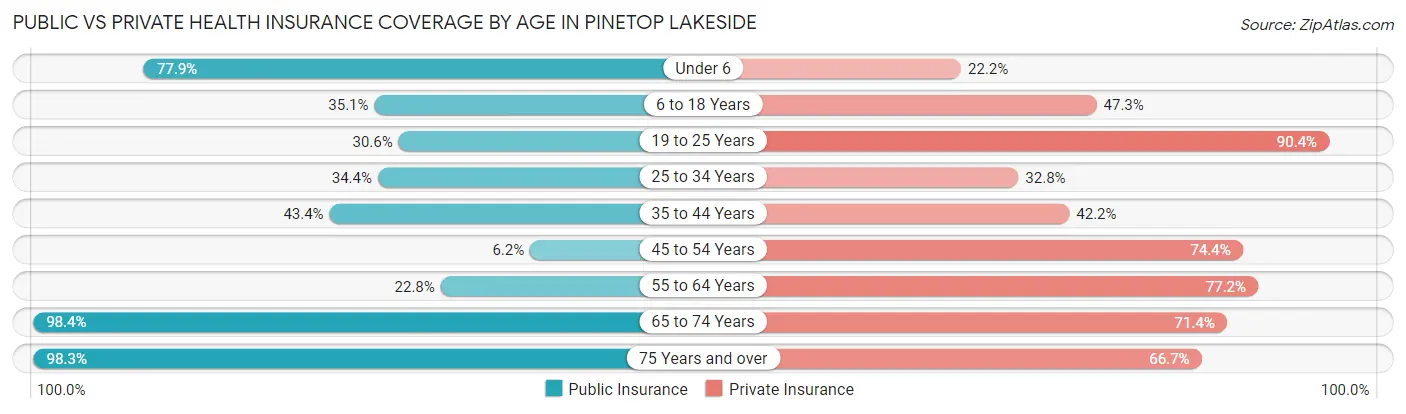
| Age Bracket | Public Insurance | Private Insurance |
| Under 6 | 116 (77.8%) | 33 (22.2%) |
| 6 to 18 Years | 221 (35.1%) | 298 (47.3%) |
| 19 to 25 Years | 67 (30.6%) | 198 (90.4%) |
| 25 to 34 Years | 62 (34.4%) | 59 (32.8%) |
| 35 to 44 Years | 221 (43.4%) | 215 (42.2%) |
| 45 to 54 Years | 28 (6.2%) | 337 (74.4%) |
| 55 to 64 Years | 128 (22.8%) | 434 (77.2%) |
| 65 to 74 Years | 861 (98.4%) | 625 (71.4%) |
| 75 Years and over | 470 (98.3%) | 319 (66.7%) |
| Total | 2,174 (53.6%) | 2,518 (62.1%) |
Disability Status by Sex by Age in Pinetop Lakeside
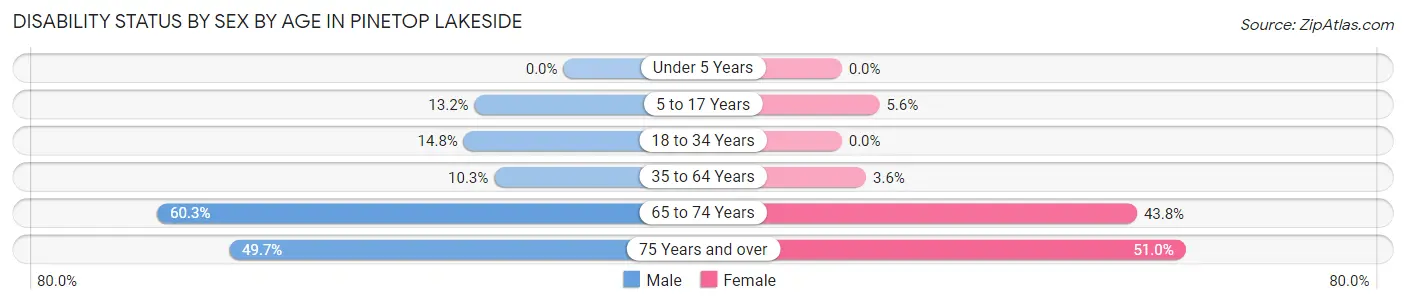
| Age Bracket | Male | Female |
| Under 5 Years | 0 (0.0%) | 0 (0.0%) |
| 5 to 17 Years | 35 (13.2%) | 18 (5.6%) |
| 18 to 34 Years | 33 (14.8%) | 0 (0.0%) |
| 35 to 64 Years | 74 (10.3%) | 29 (3.6%) |
| 65 to 74 Years | 254 (60.3%) | 199 (43.8%) |
| 75 Years and over | 141 (49.6%) | 99 (51.0%) |
Disability Class by Sex by Age in Pinetop Lakeside
Disability Class: Hearing Difficulty
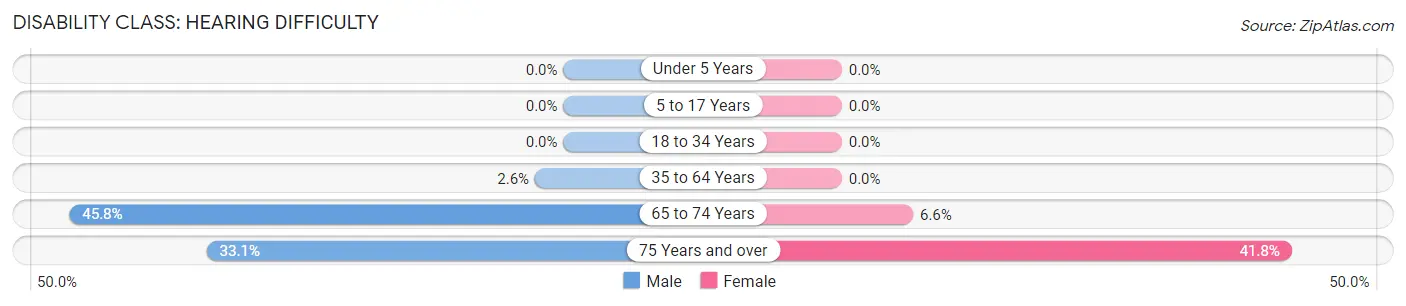
| Age Bracket | Male | Female |
| Under 5 Years | 0 (0.0%) | 0 (0.0%) |
| 5 to 17 Years | 0 (0.0%) | 0 (0.0%) |
| 18 to 34 Years | 0 (0.0%) | 0 (0.0%) |
| 35 to 64 Years | 19 (2.6%) | 0 (0.0%) |
| 65 to 74 Years | 193 (45.8%) | 30 (6.6%) |
| 75 Years and over | 94 (33.1%) | 81 (41.7%) |
Disability Class: Vision Difficulty
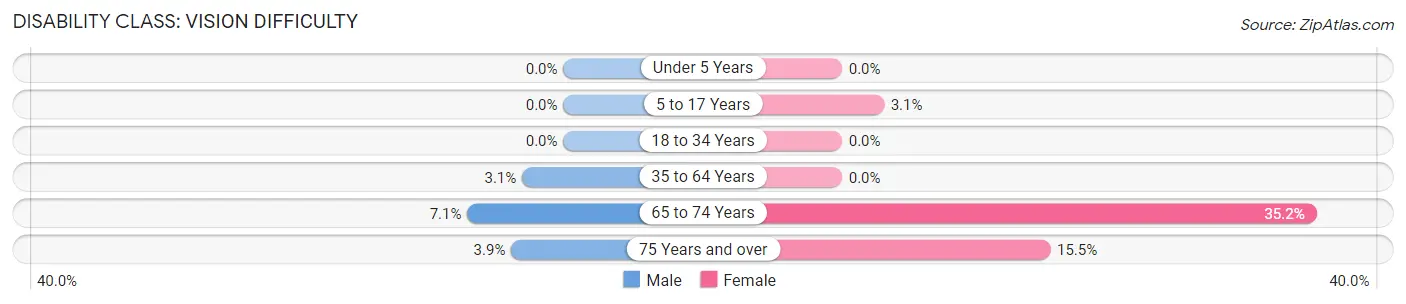
| Age Bracket | Male | Female |
| Under 5 Years | 0 (0.0%) | 0 (0.0%) |
| 5 to 17 Years | 0 (0.0%) | 10 (3.1%) |
| 18 to 34 Years | 0 (0.0%) | 0 (0.0%) |
| 35 to 64 Years | 22 (3.1%) | 0 (0.0%) |
| 65 to 74 Years | 30 (7.1%) | 160 (35.2%) |
| 75 Years and over | 11 (3.9%) | 30 (15.5%) |
Disability Class: Cognitive Difficulty
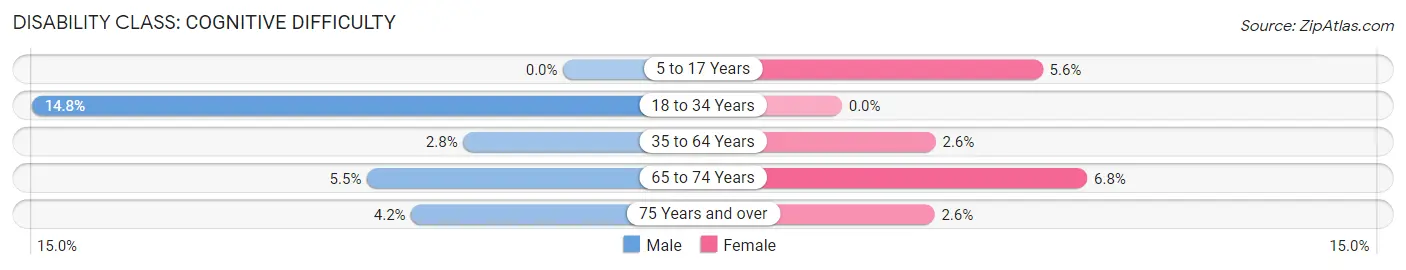
| Age Bracket | Male | Female |
| 5 to 17 Years | 0 (0.0%) | 18 (5.6%) |
| 18 to 34 Years | 33 (14.8%) | 0 (0.0%) |
| 35 to 64 Years | 20 (2.8%) | 21 (2.6%) |
| 65 to 74 Years | 23 (5.5%) | 31 (6.8%) |
| 75 Years and over | 12 (4.2%) | 5 (2.6%) |
Disability Class: Ambulatory Difficulty
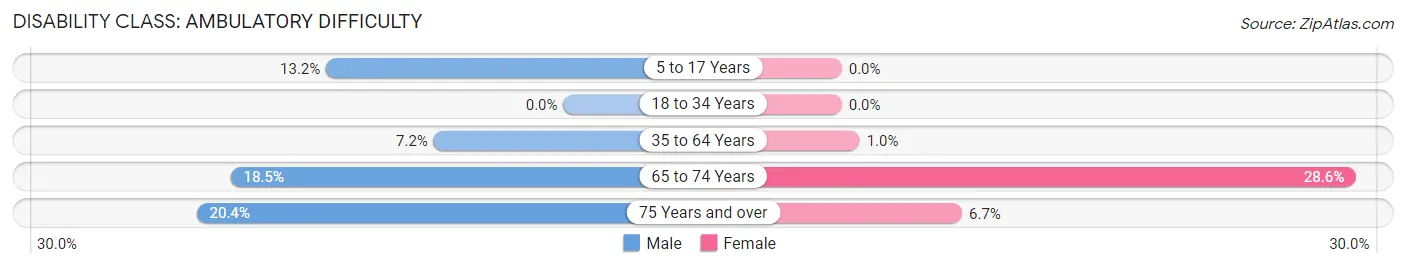
| Age Bracket | Male | Female |
| 5 to 17 Years | 35 (13.2%) | 0 (0.0%) |
| 18 to 34 Years | 0 (0.0%) | 0 (0.0%) |
| 35 to 64 Years | 52 (7.2%) | 8 (1.0%) |
| 65 to 74 Years | 78 (18.5%) | 130 (28.6%) |
| 75 Years and over | 58 (20.4%) | 13 (6.7%) |
Disability Class: Self-Care Difficulty
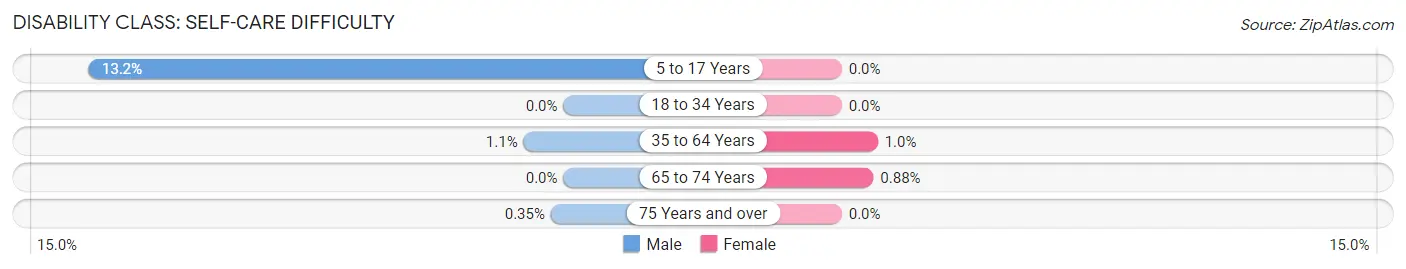
| Age Bracket | Male | Female |
| 5 to 17 Years | 35 (13.2%) | 0 (0.0%) |
| 18 to 34 Years | 0 (0.0%) | 0 (0.0%) |
| 35 to 64 Years | 8 (1.1%) | 8 (1.0%) |
| 65 to 74 Years | 0 (0.0%) | 4 (0.9%) |
| 75 Years and over | 1 (0.4%) | 0 (0.0%) |
Technology Access in Pinetop Lakeside
Computing Device Access in Pinetop Lakeside
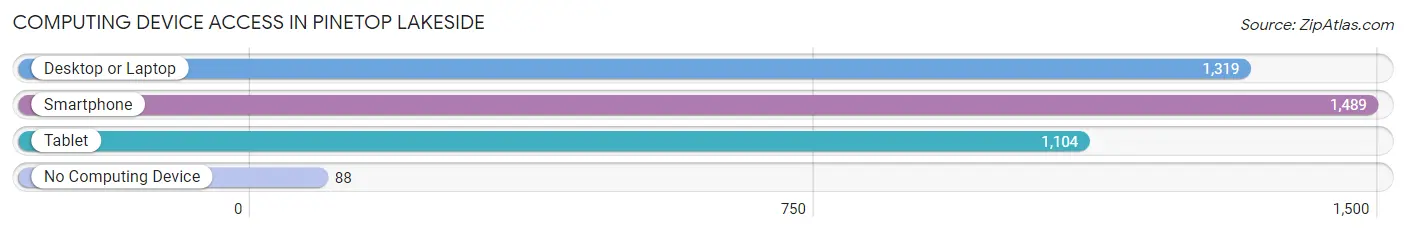
| Device Type | # Households | % Households |
| Desktop or Laptop | 1,319 | 74.6% |
| Smartphone | 1,489 | 84.2% |
| Tablet | 1,104 | 62.4% |
| No Computing Device | 88 | 5.0% |
| Total | 1,769 | 100.0% |
Internet Access in Pinetop Lakeside
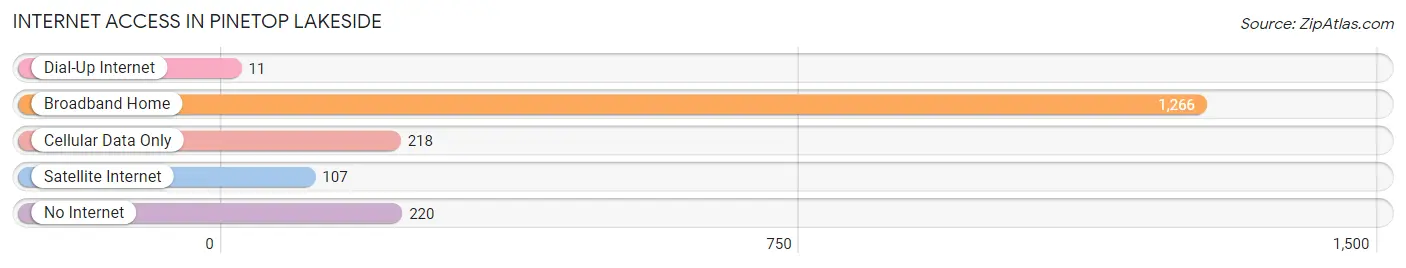
| Internet Type | # Households | % Households |
| Dial-Up Internet | 11 | 0.6% |
| Broadband Home | 1,266 | 71.6% |
| Cellular Data Only | 218 | 12.3% |
| Satellite Internet | 107 | 6.0% |
| No Internet | 220 | 12.4% |
| Total | 1,769 | 100.0% |
Pinetop Lakeside Summary
Pinetop Lakeside, Arizona is a small town located in Navajo County, Arizona. It is situated in the White Mountains of Arizona, approximately two hours east of Flagstaff. The town is surrounded by the Apache-Sitgreaves National Forest and is home to a variety of outdoor activities, including fishing, camping, hiking, and skiing.
History
Pinetop Lakeside was founded in the early 1900s as a logging camp. The town was named after the nearby Pinetop Lake, which was named after the Pinetop tree, a species of pine tree native to the area. The town was incorporated in 1948 and has since grown to become a popular tourist destination.
Geography
Pinetop Lakeside is located in the White Mountains of Arizona, approximately two hours east of Flagstaff. The town is situated at an elevation of 6,400 feet and is surrounded by the Apache-Sitgreaves National Forest. The town is located in a temperate climate, with temperatures ranging from the low 30s in the winter to the high 80s in the summer.
Economy
The economy of Pinetop Lakeside is largely driven by tourism. The town is home to a variety of outdoor activities, including fishing, camping, hiking, and skiing. The town is also home to a number of restaurants, shops, and lodging options. Additionally, the town is home to a number of businesses, including a lumber mill, a sawmill, and a woodworking shop.
Demographics
As of the 2010 census, the population of Pinetop Lakeside was 2,735. The town is predominantly white, with approximately 90% of the population identifying as white. The median household income in the town is $41,000, and the median age is 44. The town is home to a variety of religious denominations, including Catholic, Protestant, and Mormon.
Conclusion
Pinetop Lakeside, Arizona is a small town located in Navajo County, Arizona. It is situated in the White Mountains of Arizona, approximately two hours east of Flagstaff. The town is surrounded by the Apache-Sitgreaves National Forest and is home to a variety of outdoor activities, including fishing, camping, hiking, and skiing. The economy of Pinetop Lakeside is largely driven by tourism, and the town is home to a variety of businesses, restaurants, shops, and lodging options. As of the 2010 census, the population of Pinetop Lakeside was 2,735, and the town is predominantly white. Pinetop Lakeside is a popular tourist destination and is home to a variety of religious denominations.
Common Questions
What is Per Capita Income in Pinetop Lakeside?
Per Capita income in Pinetop Lakeside is $33,617.
What is the Median Family Income in Pinetop Lakeside?
Median Family Income in Pinetop Lakeside is $61,402.
What is the Median Household income in Pinetop Lakeside?
Median Household Income in Pinetop Lakeside is $57,125.
What is Income or Wage Gap in Pinetop Lakeside?
Income or Wage Gap in Pinetop Lakeside is 47.7%.
Women in Pinetop Lakeside earn 52.3 cents for every dollar earned by a man.
What is Inequality or Gini Index in Pinetop Lakeside?
Inequality or Gini Index in Pinetop Lakeside is 0.41.
What is the Total Population of Pinetop Lakeside?
Total Population of Pinetop Lakeside is 4,080.
What is the Total Male Population of Pinetop Lakeside?
Total Male Population of Pinetop Lakeside is 1,943.
What is the Total Female Population of Pinetop Lakeside?
Total Female Population of Pinetop Lakeside is 2,137.
What is the Ratio of Males per 100 Females in Pinetop Lakeside?
There are 90.92 Males per 100 Females in Pinetop Lakeside.
What is the Ratio of Females per 100 Males in Pinetop Lakeside?
There are 109.98 Females per 100 Males in Pinetop Lakeside.
What is the Median Population Age in Pinetop Lakeside?
Median Population Age in Pinetop Lakeside is 51.9 Years.
What is the Average Family Size in Pinetop Lakeside
Average Family Size in Pinetop Lakeside is 2.8 People.
What is the Average Household Size in Pinetop Lakeside
Average Household Size in Pinetop Lakeside is 2.3 People.
How Large is the Labor Force in Pinetop Lakeside?
There are 1,830 People in the Labor Forcein in Pinetop Lakeside.
What is the Percentage of People in the Labor Force in Pinetop Lakeside?
51.6% of People are in the Labor Force in Pinetop Lakeside.
What is the Unemployment Rate in Pinetop Lakeside?
Unemployment Rate in Pinetop Lakeside is 4.9%.