Powers Lake, WI Map & Demographics
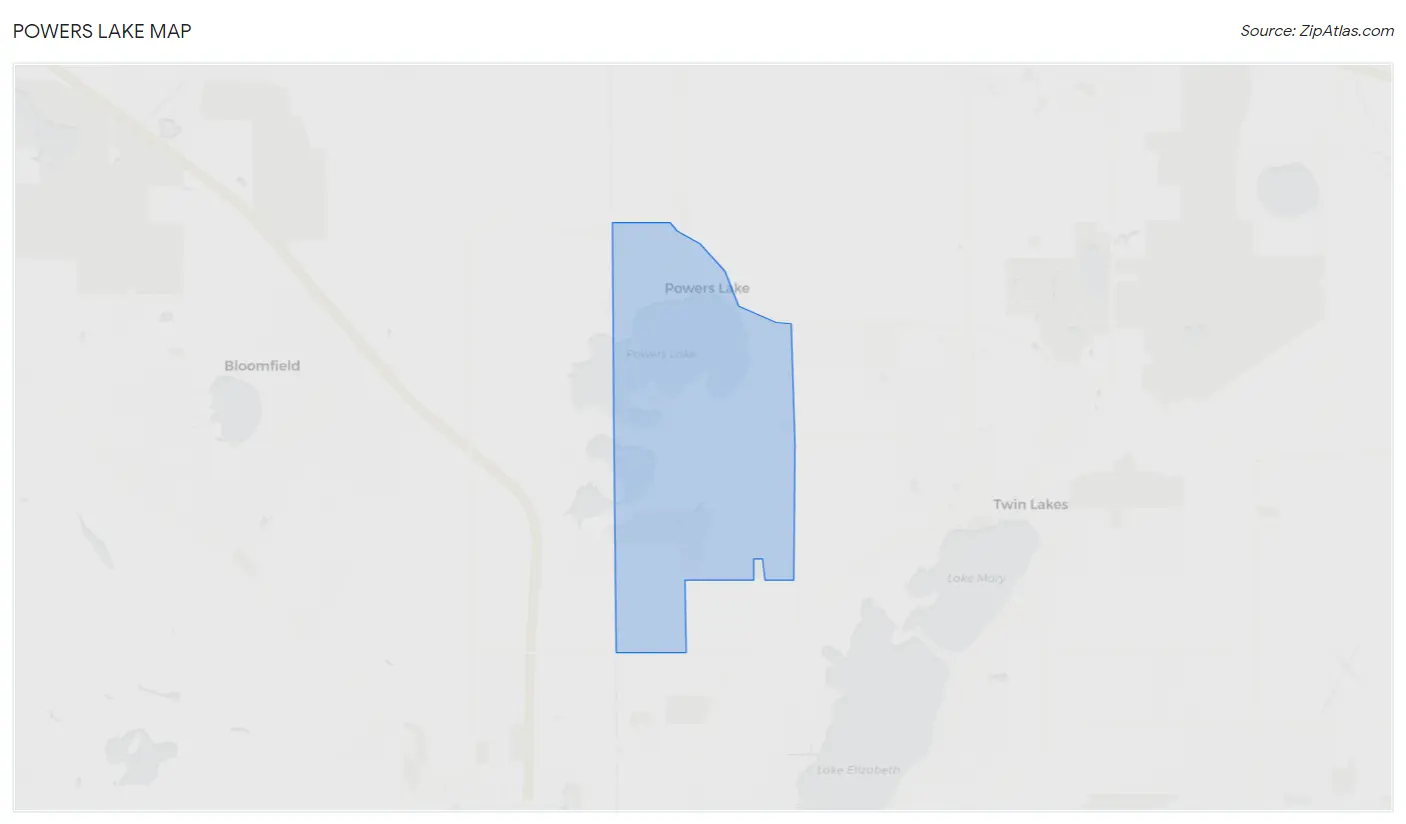
Powers Lake Map
Powers Lake Overview
$47,996
PER CAPITA INCOME
$103,409
AVG FAMILY INCOME
$102,614
AVG HOUSEHOLD INCOME
0.37
INEQUALITY / GINI INDEX
1,381
TOTAL POPULATION
599
MALE POPULATION
782
FEMALE POPULATION
76.60
MALES / 100 FEMALES
130.55
FEMALES / 100 MALES
49.6
MEDIAN AGE
2.5
AVG FAMILY SIZE
2.5
AVG HOUSEHOLD SIZE
914
LABOR FORCE [ PEOPLE ]
78.4%
PERCENT IN LABOR FORCE
4.9%
UNEMPLOYMENT RATE
Powers Lake Area Codes
Income in Powers Lake
Income Overview in Powers Lake
Per Capita Income in Powers Lake is $47,996, while median incomes of families and households are $103,409 and $102,614 respectively.
| Characteristic | Number | Measure |
| Per Capita Income | 1,381 | $47,996 |
| Median Family Income | 534 | $103,409 |
| Mean Family Income | 534 | $125,486 |
| Median Household Income | 561 | $102,614 |
| Mean Household Income | 561 | $124,258 |
| Income Deficit | 534 | $0 |
| Wage / Income Gap (%) | 1,381 | 0.00% |
| Wage / Income Gap ($) | 1,381 | 100.00¢ per $1 |
| Gini / Inequality Index | 1,381 | 0.37 |
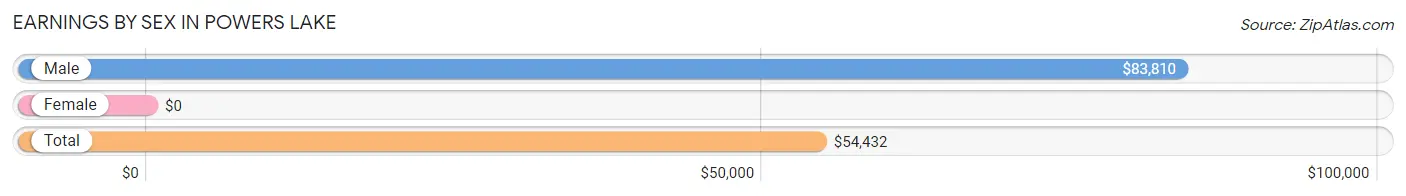
Earnings by Sex in Powers Lake
| Sex | Number | Average Earnings |
| Male | 384 (42.0%) | $83,810 |
| Female | 531 (58.0%) | $0 |
| Total | 915 (100.0%) | $54,432 |
Earnings by Sex by Income Bracket in Powers Lake
The most common earnings brackets in Powers Lake are $100,000+ for men (149 | 38.8%) and $7,500 to $9,999 for women (157 | 29.6%).
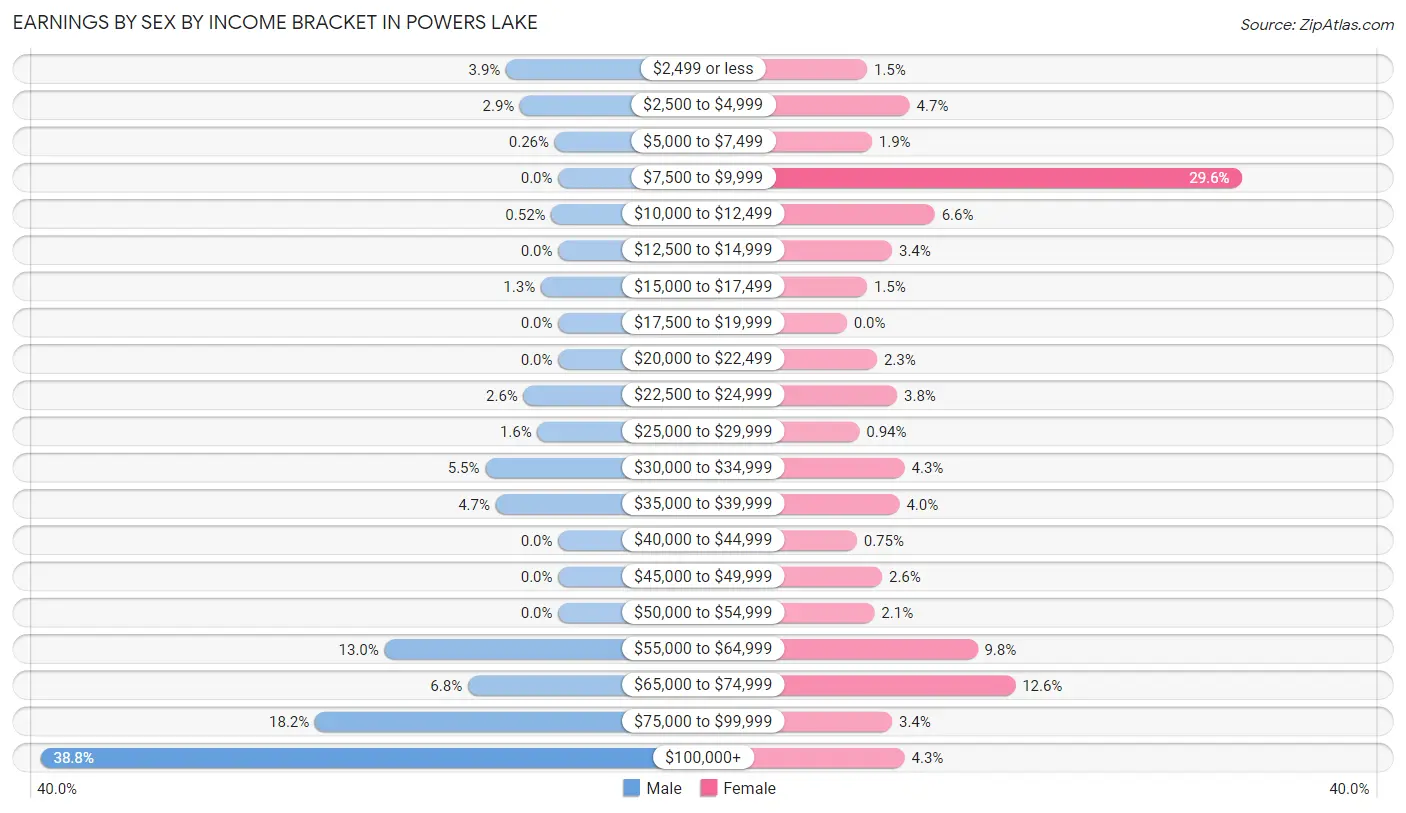
| Income | Male | Female |
| $2,499 or less | 15 (3.9%) | 8 (1.5%) |
| $2,500 to $4,999 | 11 (2.9%) | 25 (4.7%) |
| $5,000 to $7,499 | 1 (0.3%) | 10 (1.9%) |
| $7,500 to $9,999 | 0 (0.0%) | 157 (29.6%) |
| $10,000 to $12,499 | 2 (0.5%) | 35 (6.6%) |
| $12,500 to $14,999 | 0 (0.0%) | 18 (3.4%) |
| $15,000 to $17,499 | 5 (1.3%) | 8 (1.5%) |
| $17,500 to $19,999 | 0 (0.0%) | 0 (0.0%) |
| $20,000 to $22,499 | 0 (0.0%) | 12 (2.3%) |
| $22,500 to $24,999 | 10 (2.6%) | 20 (3.8%) |
| $25,000 to $29,999 | 6 (1.6%) | 5 (0.9%) |
| $30,000 to $34,999 | 21 (5.5%) | 23 (4.3%) |
| $35,000 to $39,999 | 18 (4.7%) | 21 (4.0%) |
| $40,000 to $44,999 | 0 (0.0%) | 4 (0.7%) |
| $45,000 to $49,999 | 0 (0.0%) | 14 (2.6%) |
| $50,000 to $54,999 | 0 (0.0%) | 11 (2.1%) |
| $55,000 to $64,999 | 50 (13.0%) | 52 (9.8%) |
| $65,000 to $74,999 | 26 (6.8%) | 67 (12.6%) |
| $75,000 to $99,999 | 70 (18.2%) | 18 (3.4%) |
| $100,000+ | 149 (38.8%) | 23 (4.3%) |
| Total | 384 (100.0%) | 531 (100.0%) |
Earnings by Sex by Educational Attainment in Powers Lake
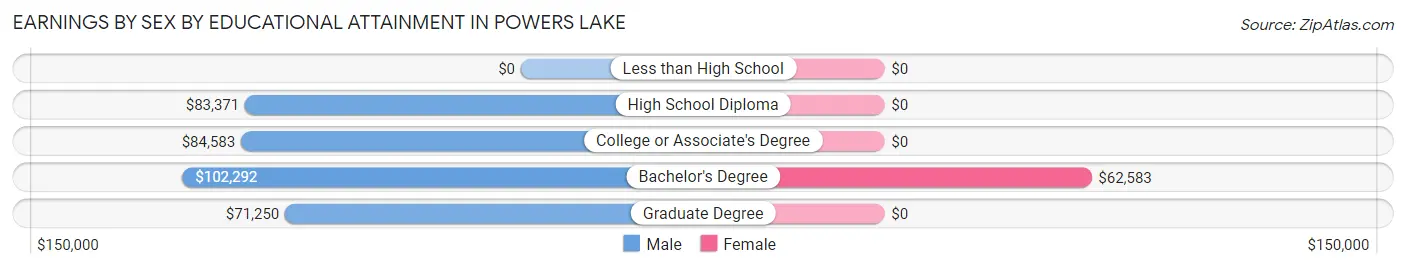
| Educational Attainment | Male Income | Female Income |
| Less than High School | - | - |
| High School Diploma | $83,371 | $0 |
| College or Associate's Degree | $84,583 | $0 |
| Bachelor's Degree | $102,292 | $62,583 |
| Graduate Degree | $71,250 | $0 |
| Total | $84,673 | $0 |
Family Income in Powers Lake
Family Income Brackets in Powers Lake
According to the Powers Lake family income data, there are 179 families falling into the $50,000 to $74,999 income range, which is the most common income bracket and makes up 33.5% of all families.
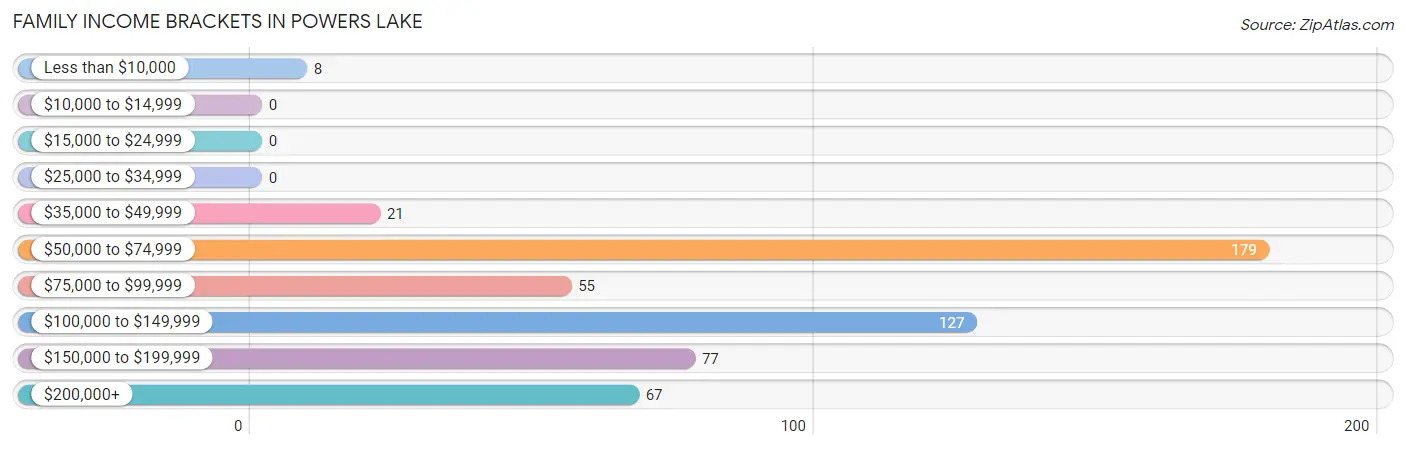
| Income Bracket | # Families | % Families |
| Less than $10,000 | 8 | 1.5% |
| $10,000 to $14,999 | 0 | 0.0% |
| $15,000 to $24,999 | 0 | 0.0% |
| $25,000 to $34,999 | 0 | 0.0% |
| $35,000 to $49,999 | 21 | 3.9% |
| $50,000 to $74,999 | 179 | 33.5% |
| $75,000 to $99,999 | 55 | 10.3% |
| $100,000 to $149,999 | 127 | 23.8% |
| $150,000 to $199,999 | 77 | 14.4% |
| $200,000+ | 67 | 12.5% |
Family Income by Famaliy Size in Powers Lake
4-person families (57 | 10.7%) account for the highest median family income in Powers Lake with $161,780 per family, while 3-person families (81 | 15.2%) have the highest median income of $41,875 per family member.
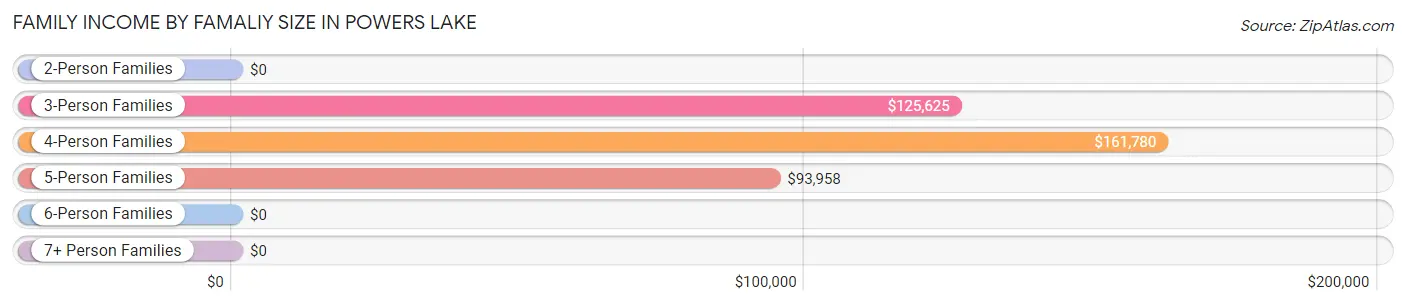
| Income Bracket | # Families | Median Income |
| 2-Person Families | 340 (63.7%) | $0 |
| 3-Person Families | 81 (15.2%) | $125,625 |
| 4-Person Families | 57 (10.7%) | $161,780 |
| 5-Person Families | 46 (8.6%) | $93,958 |
| 6-Person Families | 10 (1.9%) | $0 |
| 7+ Person Families | 0 (0.0%) | $0 |
| Total | 534 (100.0%) | $103,409 |
Family Income by Number of Earners in Powers Lake
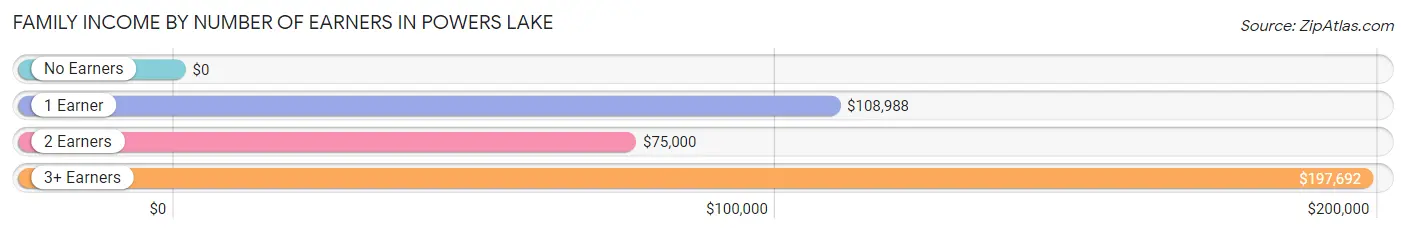
| Number of Earners | # Families | Median Income |
| No Earners | 27 (5.1%) | $0 |
| 1 Earner | 93 (17.4%) | $108,988 |
| 2 Earners | 320 (59.9%) | $75,000 |
| 3+ Earners | 94 (17.6%) | $197,692 |
| Total | 534 (100.0%) | $103,409 |
Household Income in Powers Lake
Household Income Brackets in Powers Lake
With 201 households falling in the category, the $50,000 to $74,999 income range is the most frequent in Powers Lake, accounting for 35.8% of all households.
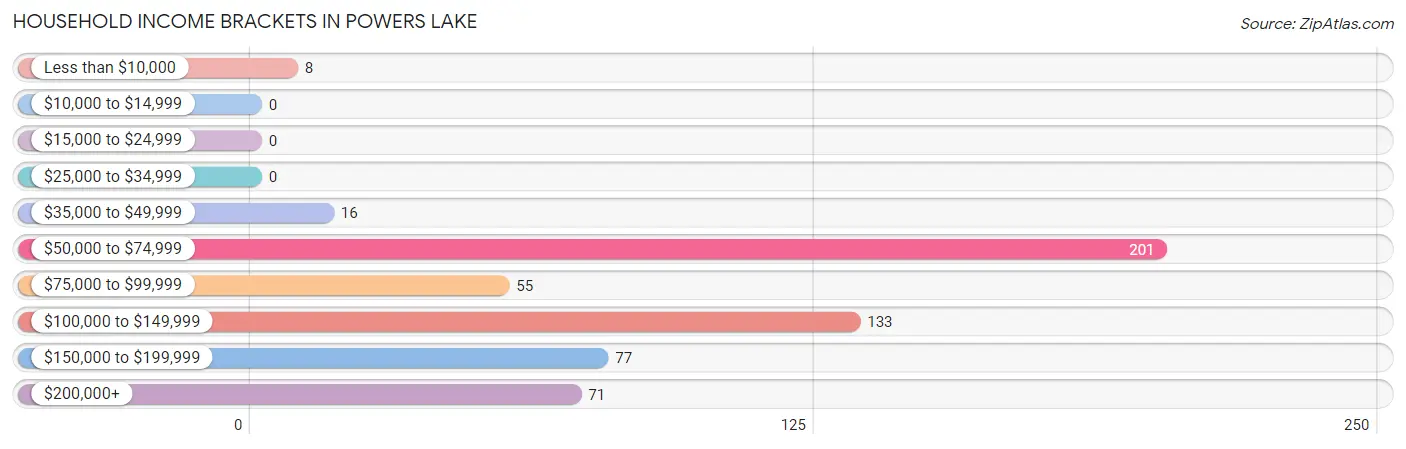
| Income Bracket | # Households | % Households |
| Less than $10,000 | 8 | 1.4% |
| $10,000 to $14,999 | 0 | 0.0% |
| $15,000 to $24,999 | 0 | 0.0% |
| $25,000 to $34,999 | 0 | 0.0% |
| $35,000 to $49,999 | 16 | 2.9% |
| $50,000 to $74,999 | 201 | 35.8% |
| $75,000 to $99,999 | 55 | 9.8% |
| $100,000 to $149,999 | 133 | 23.7% |
| $150,000 to $199,999 | 77 | 13.7% |
| $200,000+ | 71 | 12.7% |
Household Income by Householder Age in Powers Lake
The median household income in Powers Lake is $102,614, with the highest median household income of $139,625 found in the 45 to 64 years age bracket for the primary householder. A total of 251 households (44.7%) fall into this category. Meanwhile, the 15 to 24 years age bracket for the primary householder has the lowest median household income of $0, with 6 households (1.1%) in this group.
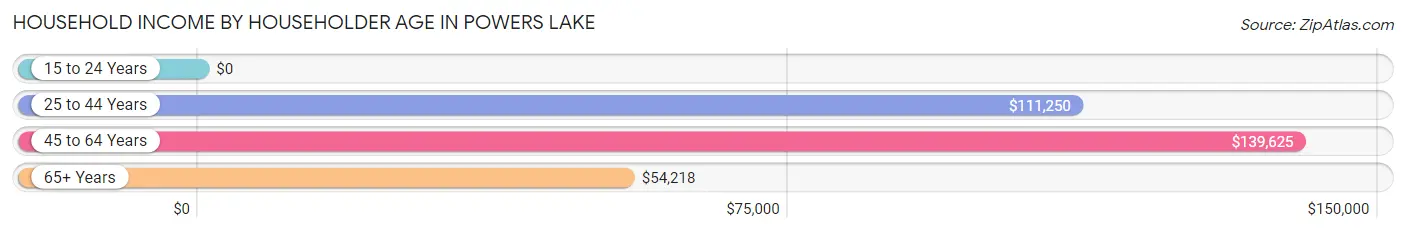
| Income Bracket | # Households | Median Income |
| 15 to 24 Years | 6 (1.1%) | $0 |
| 25 to 44 Years | 91 (16.2%) | $111,250 |
| 45 to 64 Years | 251 (44.7%) | $139,625 |
| 65+ Years | 213 (38.0%) | $54,218 |
| Total | 561 (100.0%) | $102,614 |
Poverty in Powers Lake
Income Below Poverty by Sex and Age in Powers Lake
With 4.8% poverty level for males and 1.9% for females among the residents of Powers Lake, 35 to 44 year old males and 18 to 24 year old females are the most vulnerable to poverty, with 17 males (28.8%) and 7 females (8.5%) in their respective age groups living below the poverty level.
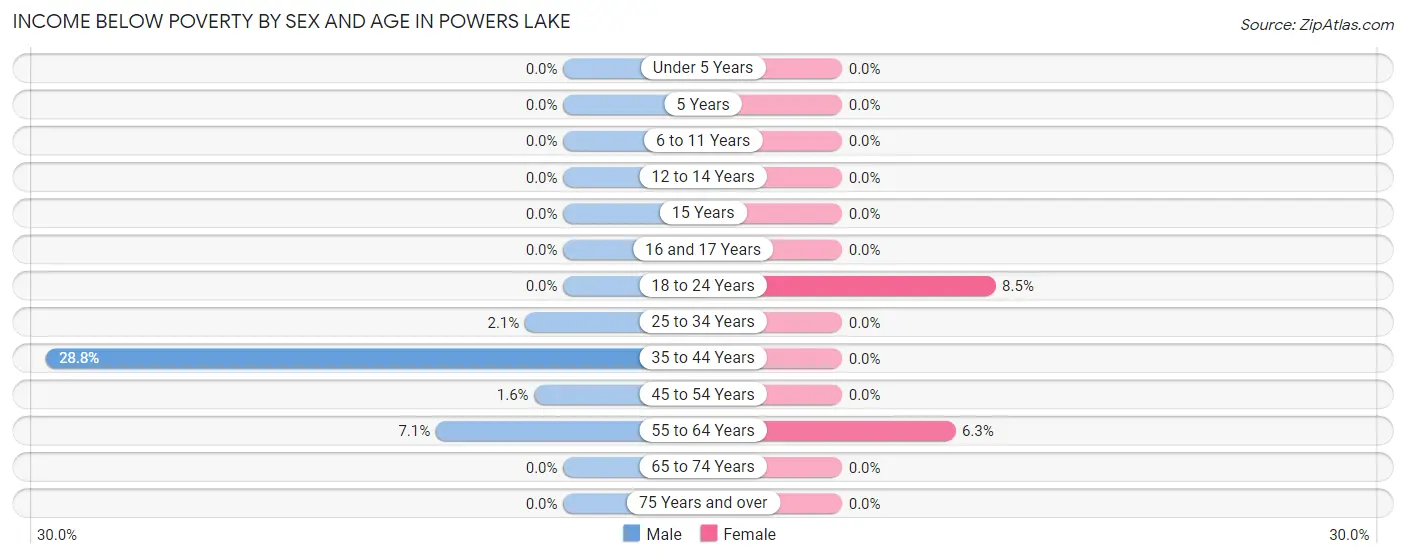
| Age Bracket | Male | Female |
| Under 5 Years | 0 (0.0%) | 0 (0.0%) |
| 5 Years | 0 (0.0%) | 0 (0.0%) |
| 6 to 11 Years | 0 (0.0%) | 0 (0.0%) |
| 12 to 14 Years | 0 (0.0%) | 0 (0.0%) |
| 15 Years | 0 (0.0%) | 0 (0.0%) |
| 16 and 17 Years | 0 (0.0%) | 0 (0.0%) |
| 18 to 24 Years | 0 (0.0%) | 7 (8.5%) |
| 25 to 34 Years | 1 (2.1%) | 0 (0.0%) |
| 35 to 44 Years | 17 (28.8%) | 0 (0.0%) |
| 45 to 54 Years | 2 (1.6%) | 0 (0.0%) |
| 55 to 64 Years | 9 (7.1%) | 8 (6.3%) |
| 65 to 74 Years | 0 (0.0%) | 0 (0.0%) |
| 75 Years and over | 0 (0.0%) | 0 (0.0%) |
| Total | 29 (4.8%) | 15 (1.9%) |
Income Above Poverty by Sex and Age in Powers Lake
According to the poverty statistics in Powers Lake, males aged under 5 years and females aged under 5 years are the age groups that are most secure financially, with 100.0% of males and 100.0% of females in these age groups living above the poverty line.
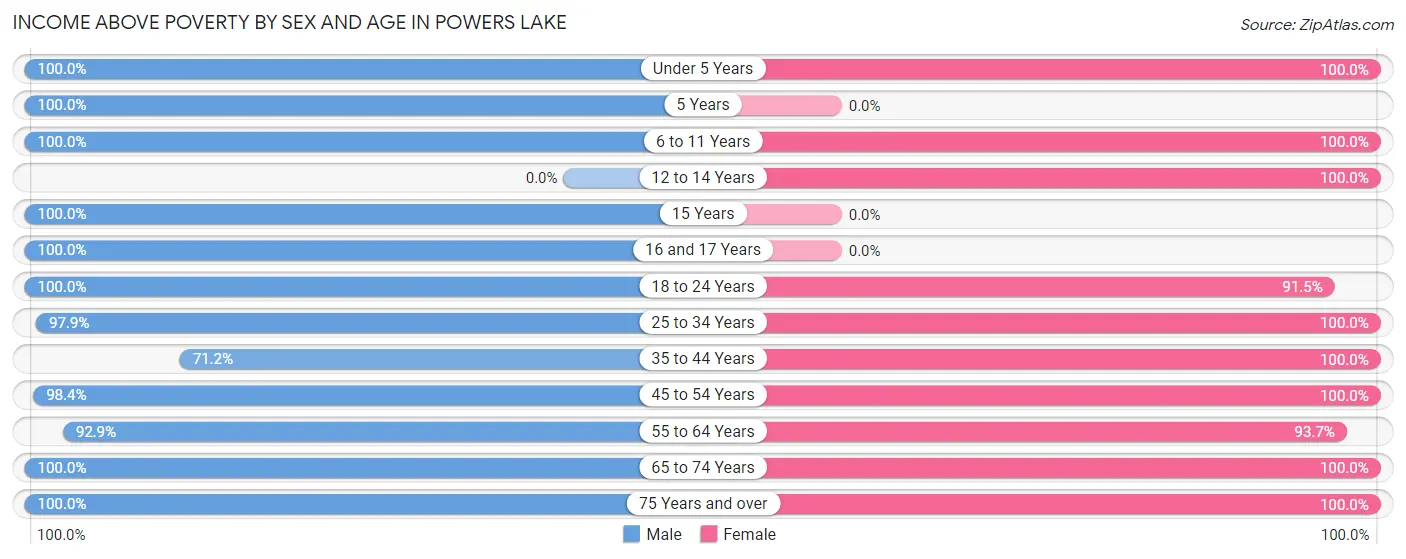
| Age Bracket | Male | Female |
| Under 5 Years | 25 (100.0%) | 45 (100.0%) |
| 5 Years | 11 (100.0%) | 0 (0.0%) |
| 6 to 11 Years | 32 (100.0%) | 66 (100.0%) |
| 12 to 14 Years | 0 (0.0%) | 26 (100.0%) |
| 15 Years | 10 (100.0%) | 0 (0.0%) |
| 16 and 17 Years | 12 (100.0%) | 0 (0.0%) |
| 18 to 24 Years | 71 (100.0%) | 75 (91.5%) |
| 25 to 34 Years | 46 (97.9%) | 71 (100.0%) |
| 35 to 44 Years | 42 (71.2%) | 33 (100.0%) |
| 45 to 54 Years | 122 (98.4%) | 121 (100.0%) |
| 55 to 64 Years | 118 (92.9%) | 119 (93.7%) |
| 65 to 74 Years | 56 (100.0%) | 195 (100.0%) |
| 75 Years and over | 25 (100.0%) | 16 (100.0%) |
| Total | 570 (95.2%) | 767 (98.1%) |
Income Below Poverty Among Married-Couple Families in Powers Lake
The poverty statistics for married-couple families in Powers Lake show that 1.6% or 8 of the total 504 families live below the poverty line. Families with no children have the highest poverty rate of 1.9%, comprising of 8 families. On the other hand, families with 1 or 2 children have the lowest poverty rate of 0.0%, which includes 0 families.
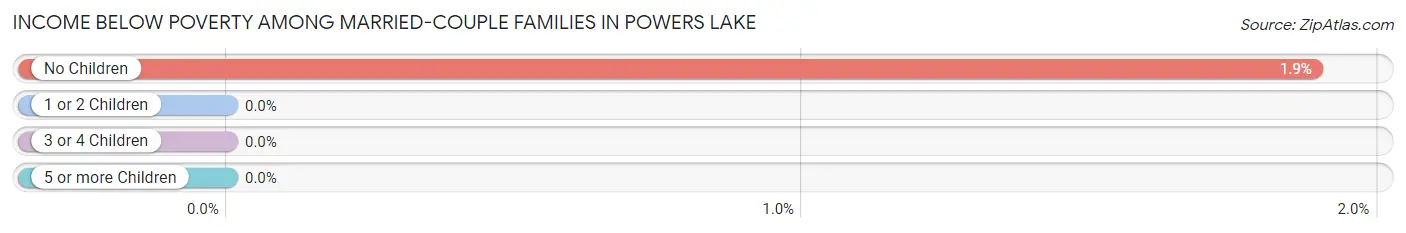
| Children | Above Poverty | Below Poverty |
| No Children | 416 (98.1%) | 8 (1.9%) |
| 1 or 2 Children | 34 (100.0%) | 0 (0.0%) |
| 3 or 4 Children | 46 (100.0%) | 0 (0.0%) |
| 5 or more Children | 0 (0.0%) | 0 (0.0%) |
| Total | 496 (98.4%) | 8 (1.6%) |
Income Below Poverty Among Single-Parent Households in Powers Lake
| Children | Single Father | Single Mother |
| No Children | 0 (0.0%) | 0 (0.0%) |
| 1 or 2 Children | 0 (0.0%) | 0 (0.0%) |
| 3 or 4 Children | 0 (0.0%) | 0 (0.0%) |
| 5 or more Children | 0 (0.0%) | 0 (0.0%) |
| Total | 0 (0.0%) | 0 (0.0%) |
Income Below Poverty Among Married-Couple vs Single-Parent Households in Powers Lake
| Children | Married-Couple Families | Single-Parent Households |
| No Children | 8 (1.9%) | 0 (0.0%) |
| 1 or 2 Children | 0 (0.0%) | 0 (0.0%) |
| 3 or 4 Children | 0 (0.0%) | 0 (0.0%) |
| 5 or more Children | 0 (0.0%) | 0 (0.0%) |
| Total | 8 (1.6%) | 0 (0.0%) |
Race in Powers Lake
The most populous races in Powers Lake are White / Caucasian (1,361 | 98.6%), Two or more Races (18 | 1.3%), and Hispanic or Latino (12 | 0.9%).
| Race | # Population | % Population |
| Asian | 0 | 0.0% |
| Black / African American | 2 | 0.1% |
| Hawaiian / Pacific | 0 | 0.0% |
| Hispanic or Latino | 12 | 0.9% |
| Native / Alaskan | 0 | 0.0% |
| White / Caucasian | 1,361 | 98.6% |
| Two or more Races | 18 | 1.3% |
| Some other Race | 0 | 0.0% |
| Total | 1,381 | 100.0% |
Ancestry in Powers Lake
The most populous ancestries reported in Powers Lake are German (721 | 52.2%), Irish (274 | 19.8%), English (138 | 10.0%), Italian (115 | 8.3%), and Scottish (96 | 7.0%), together accounting for 97.3% of all Powers Lake residents.
| Ancestry | # Population | % Population |
| American | 13 | 0.9% |
| Austrian | 9 | 0.6% |
| Belgian | 10 | 0.7% |
| Bulgarian | 17 | 1.2% |
| Cherokee | 5 | 0.4% |
| Czech | 10 | 0.7% |
| Czechoslovakian | 5 | 0.4% |
| Danish | 15 | 1.1% |
| Dutch | 22 | 1.6% |
| English | 138 | 10.0% |
| European | 10 | 0.7% |
| Finnish | 17 | 1.2% |
| French | 9 | 0.6% |
| French Canadian | 22 | 1.6% |
| German | 721 | 52.2% |
| Irish | 274 | 19.8% |
| Italian | 115 | 8.3% |
| Mexican | 12 | 0.9% |
| Norwegian | 22 | 1.6% |
| Polish | 82 | 5.9% |
| Scotch-Irish | 59 | 4.3% |
| Scottish | 96 | 7.0% |
| Swedish | 69 | 5.0% |
| Swiss | 35 | 2.5% |
| Ukrainian | 9 | 0.6% |
| Welsh | 6 | 0.4% | View All 26 Rows |
Immigrants in Powers Lake
The most numerous immigrant groups reported in Powers Lake came from Europe (26 | 1.9%), Bulgaria (17 | 1.2%), Eastern Europe (17 | 1.2%), Netherlands (9 | 0.6%), and Western Europe (9 | 0.6%), together accounting for 5.6% of all Powers Lake residents.
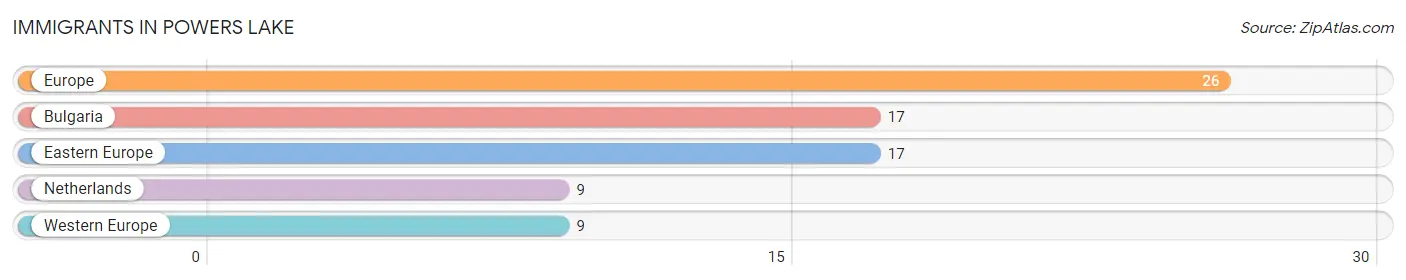
| Immigration Origin | # Population | % Population |
| Bulgaria | 17 | 1.2% |
| Eastern Europe | 17 | 1.2% |
| Europe | 26 | 1.9% |
| Netherlands | 9 | 0.6% |
| Western Europe | 9 | 0.6% | View All 5 Rows |
Sex and Age in Powers Lake
Sex and Age in Powers Lake
The most populous age groups in Powers Lake are 50 to 54 Years (77 | 12.9%) for men and 70 to 74 Years (159 | 20.3%) for women.
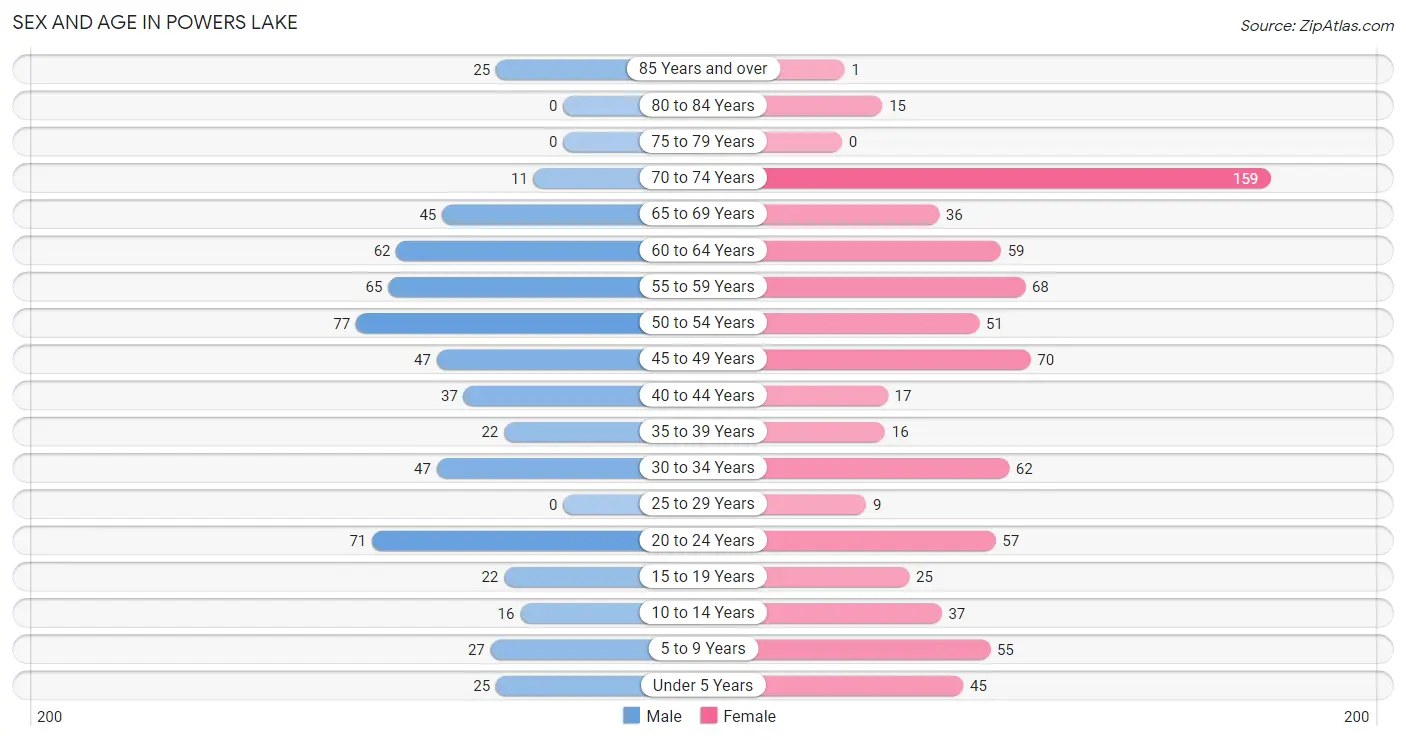
| Age Bracket | Male | Female |
| Under 5 Years | 25 (4.2%) | 45 (5.8%) |
| 5 to 9 Years | 27 (4.5%) | 55 (7.0%) |
| 10 to 14 Years | 16 (2.7%) | 37 (4.7%) |
| 15 to 19 Years | 22 (3.7%) | 25 (3.2%) |
| 20 to 24 Years | 71 (11.8%) | 57 (7.3%) |
| 25 to 29 Years | 0 (0.0%) | 9 (1.1%) |
| 30 to 34 Years | 47 (7.9%) | 62 (7.9%) |
| 35 to 39 Years | 22 (3.7%) | 16 (2.1%) |
| 40 to 44 Years | 37 (6.2%) | 17 (2.2%) |
| 45 to 49 Years | 47 (7.9%) | 70 (8.9%) |
| 50 to 54 Years | 77 (12.9%) | 51 (6.5%) |
| 55 to 59 Years | 65 (10.8%) | 68 (8.7%) |
| 60 to 64 Years | 62 (10.3%) | 59 (7.5%) |
| 65 to 69 Years | 45 (7.5%) | 36 (4.6%) |
| 70 to 74 Years | 11 (1.8%) | 159 (20.3%) |
| 75 to 79 Years | 0 (0.0%) | 0 (0.0%) |
| 80 to 84 Years | 0 (0.0%) | 15 (1.9%) |
| 85 Years and over | 25 (4.2%) | 1 (0.1%) |
| Total | 599 (100.0%) | 782 (100.0%) |
Families and Households in Powers Lake
Median Family Size in Powers Lake
The median family size in Powers Lake is 2.48 persons per family, with single female/mother families (21 | 3.9%) accounting for the largest median family size of 4.14 persons per family. On the other hand, single male/father families (9 | 1.7%) represent the smallest median family size with 1.78 persons per family.
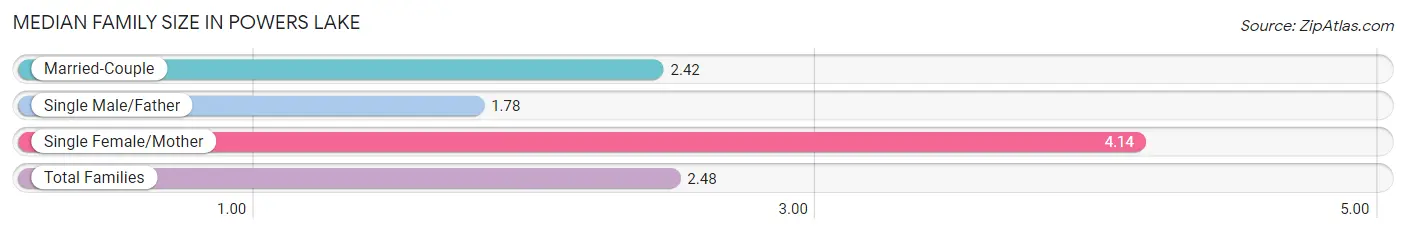
| Family Type | # Families | Family Size |
| Married-Couple | 504 (94.4%) | 2.42 |
| Single Male/Father | 9 (1.7%) | 1.78 |
| Single Female/Mother | 21 (3.9%) | 4.14 |
| Total Families | 534 (100.0%) | 2.48 |
Median Household Size in Powers Lake
The median household size in Powers Lake is 2.45 persons per household, with single female/mother households (21 | 3.7%) accounting for the largest median household size of 4.95 persons per household. non-family households (27 | 4.8%) represent the smallest median household size with 1.41 persons per household.
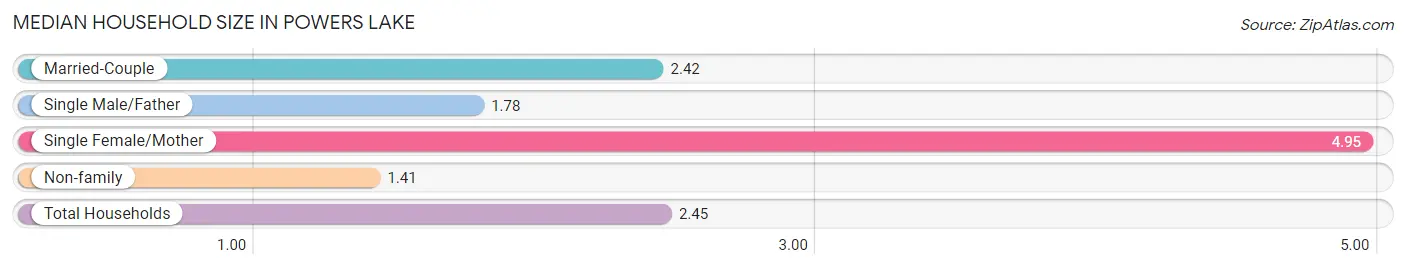
| Household Type | # Households | Household Size |
| Married-Couple | 504 (89.8%) | 2.42 |
| Single Male/Father | 9 (1.6%) | 1.78 |
| Single Female/Mother | 21 (3.7%) | 4.95 |
| Non-family | 27 (4.8%) | 1.41 |
| Total Households | 561 (100.0%) | 2.45 |
Household Size by Marriage Status in Powers Lake
Out of a total of 561 households in Powers Lake, 534 (95.2%) are family households, while 27 (4.8%) are nonfamily households. The most numerous type of family households are 2-person households, comprising 340, and the most common type of nonfamily households are 1-person households, comprising 17.
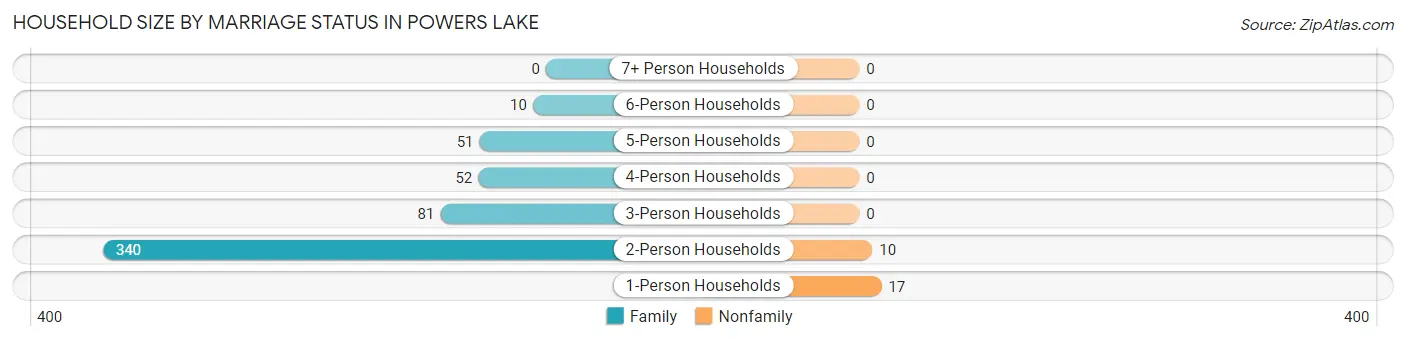
| Household Size | Family Households | Nonfamily Households |
| 1-Person Households | - | 17 (3.0%) |
| 2-Person Households | 340 (60.6%) | 10 (1.8%) |
| 3-Person Households | 81 (14.4%) | 0 (0.0%) |
| 4-Person Households | 52 (9.3%) | 0 (0.0%) |
| 5-Person Households | 51 (9.1%) | 0 (0.0%) |
| 6-Person Households | 10 (1.8%) | 0 (0.0%) |
| 7+ Person Households | 0 (0.0%) | 0 (0.0%) |
| Total | 534 (95.2%) | 27 (4.8%) |
Female Fertility in Powers Lake
Fertility by Age in Powers Lake
Average fertility rate in Powers Lake is 88.0 births per 1,000 women. Women in the age bracket of 20 to 34 years have the highest fertility rate with 180.0 births per 1,000 women. Women in the age bracket of 20 to 34 years acount for 100.0% of all women with births.
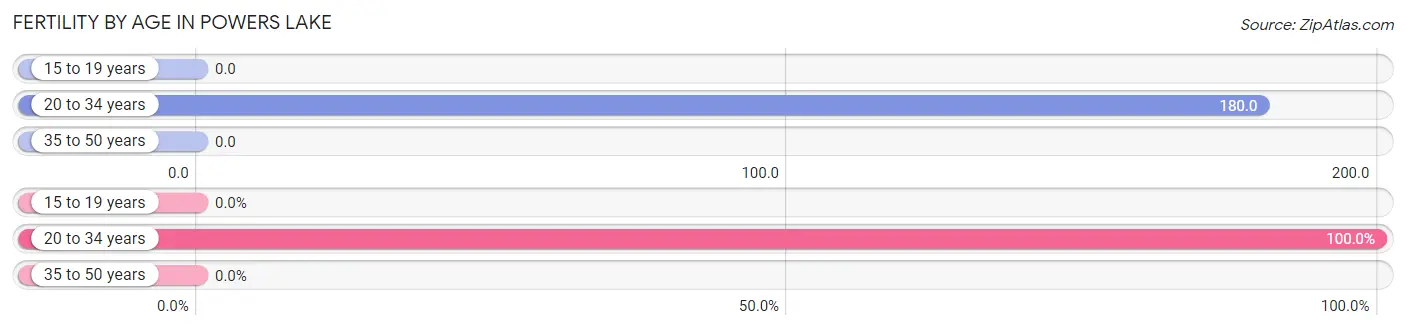
| Age Bracket | Women with Births | Births / 1,000 Women |
| 15 to 19 years | 0 (0.0%) | 0.0 |
| 20 to 34 years | 23 (100.0%) | 180.0 |
| 35 to 50 years | 0 (0.0%) | 0.0 |
| Total | 23 (100.0%) | 88.0 |
Fertility by Age by Marriage Status in Powers Lake
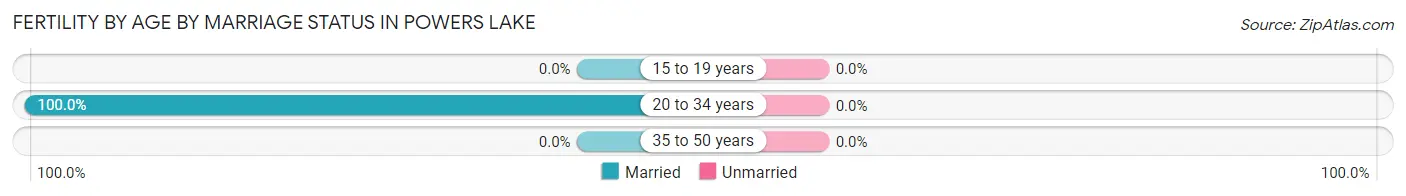
| Age Bracket | Married | Unmarried |
| 15 to 19 years | 0 (0.0%) | 0 (0.0%) |
| 20 to 34 years | 23 (100.0%) | 0 (0.0%) |
| 35 to 50 years | 0 (0.0%) | 0 (0.0%) |
| Total | 23 (100.0%) | 0 (0.0%) |
Fertility by Education in Powers Lake
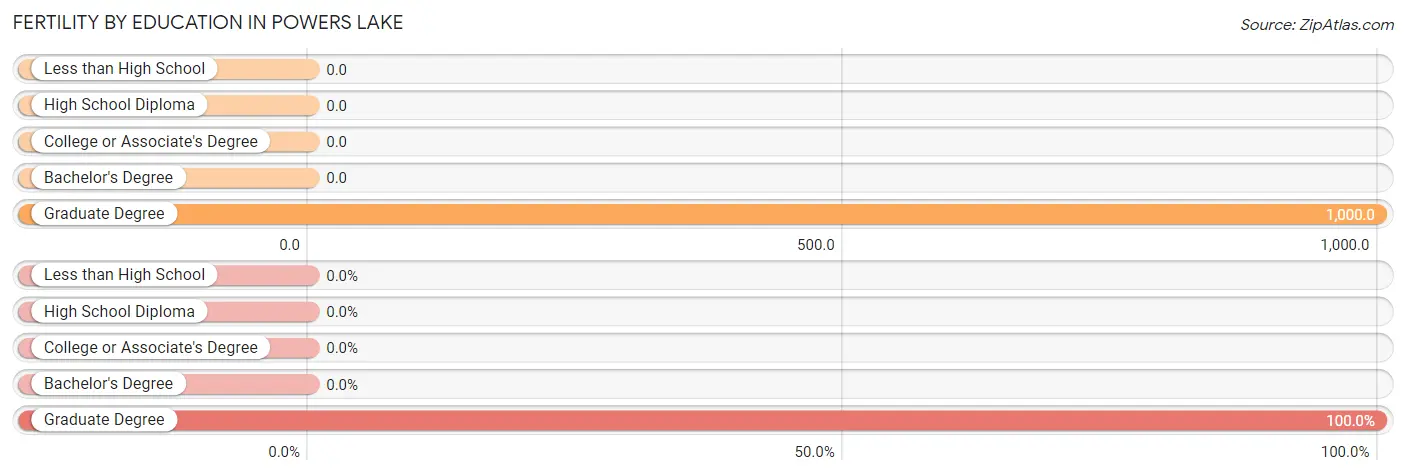
| Educational Attainment | Women with Births | Births / 1,000 Women |
| Less than High School | 0 (0.0%) | 0.0 |
| High School Diploma | 0 (0.0%) | 0.0 |
| College or Associate's Degree | 0 (0.0%) | 0.0 |
| Bachelor's Degree | 0 (0.0%) | 0.0 |
| Graduate Degree | 23 (100.0%) | 1,000.0 |
| Total | 23 (100.0%) | 88.0 |
Fertility by Education by Marriage Status in Powers Lake
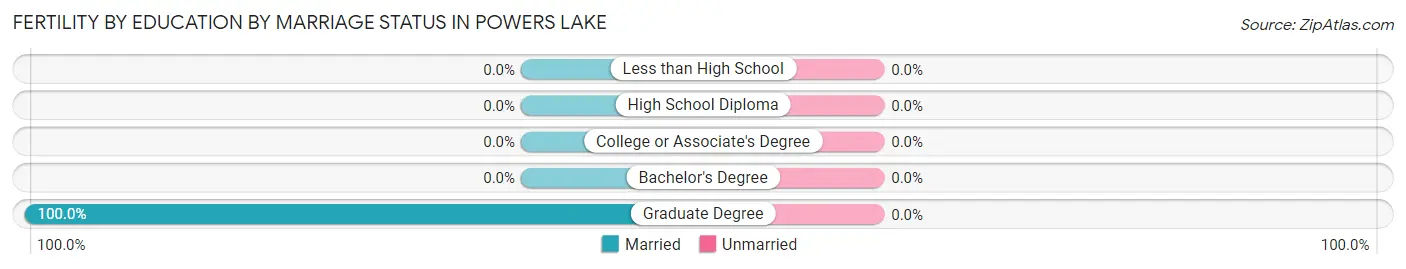
| Educational Attainment | Married | Unmarried |
| Less than High School | 0 (0.0%) | 0 (0.0%) |
| High School Diploma | 0 (0.0%) | 0 (0.0%) |
| College or Associate's Degree | 0 (0.0%) | 0 (0.0%) |
| Bachelor's Degree | 0 (0.0%) | 0 (0.0%) |
| Graduate Degree | 23 (100.0%) | 0 (0.0%) |
| Total | 23 (100.0%) | 0 (0.0%) |
Employment Characteristics in Powers Lake
Employment by Class of Employer in Powers Lake
Among the 853 employed individuals in Powers Lake, private company employees (460 | 53.9%), local government employees (223 | 26.1%), and self-employed (incorporated) (56 | 6.6%) make up the most common classes of employment.
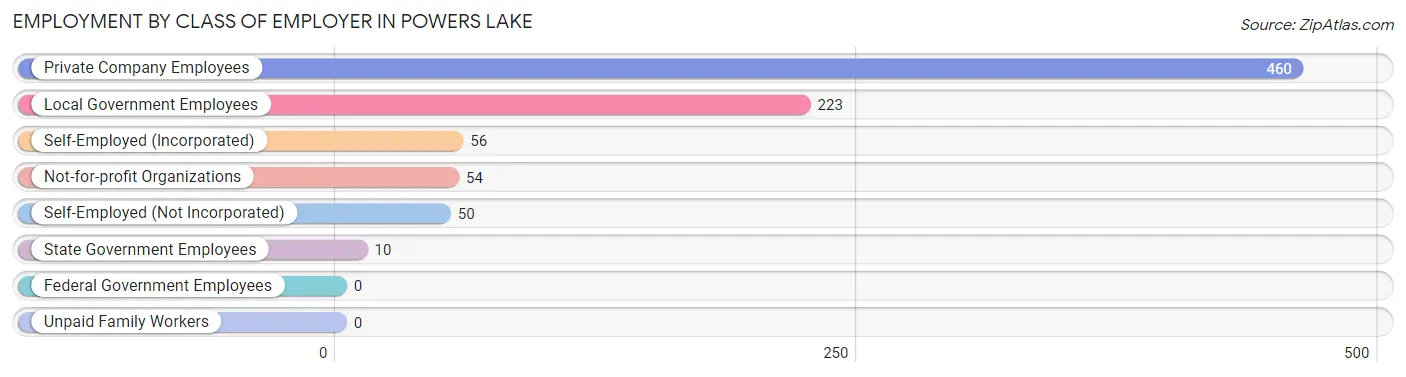
| Employer Class | # Employees | % Employees |
| Private Company Employees | 460 | 53.9% |
| Self-Employed (Incorporated) | 56 | 6.6% |
| Self-Employed (Not Incorporated) | 50 | 5.9% |
| Not-for-profit Organizations | 54 | 6.3% |
| Local Government Employees | 223 | 26.1% |
| State Government Employees | 10 | 1.2% |
| Federal Government Employees | 0 | 0.0% |
| Unpaid Family Workers | 0 | 0.0% |
| Total | 853 | 100.0% |
Employment Status by Age in Powers Lake
According to the labor force statistics for Powers Lake, out of the total population over 16 years of age (1,166), 78.4% or 914 individuals are in the labor force, with 4.9% or 45 of them unemployed. The age group with the highest labor force participation rate is 25 to 29 years, with 100.0% or 9 individuals in the labor force. Within the labor force, the 35 to 44 years age range has the highest percentage of unemployed individuals, with 18.5% or 17 of them being unemployed.
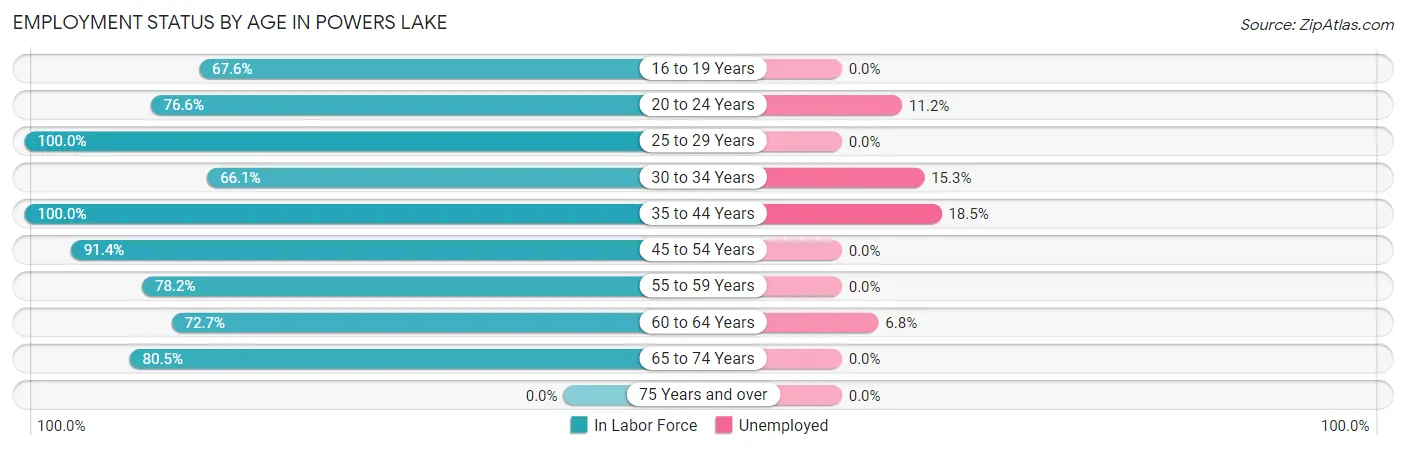
| Age Bracket | In Labor Force | Unemployed |
| 16 to 19 Years | 25 (67.6%) | 0 (0.0%) |
| 20 to 24 Years | 98 (76.6%) | 11 (11.2%) |
| 25 to 29 Years | 9 (100.0%) | 0 (0.0%) |
| 30 to 34 Years | 72 (66.1%) | 11 (15.3%) |
| 35 to 44 Years | 92 (100.0%) | 17 (18.5%) |
| 45 to 54 Years | 224 (91.4%) | 0 (0.0%) |
| 55 to 59 Years | 104 (78.2%) | 0 (0.0%) |
| 60 to 64 Years | 88 (72.7%) | 6 (6.8%) |
| 65 to 74 Years | 202 (80.5%) | 0 (0.0%) |
| 75 Years and over | 0 (0.0%) | 0 (0.0%) |
| Total | 914 (78.4%) | 45 (4.9%) |
Employment Status by Educational Attainment in Powers Lake
According to labor force statistics for Powers Lake, 83.1% of individuals (589) out of the total population between 25 and 64 years of age (709) are in the labor force, with 5.8% or 34 of them being unemployed. The group with the highest labor force participation rate are those with the educational attainment of bachelor's degree or higher, with 90.6% or 260 individuals in the labor force. Within the labor force, individuals with high school diploma education have the highest percentage of unemployment, with 16.1% or 23 of them being unemployed.
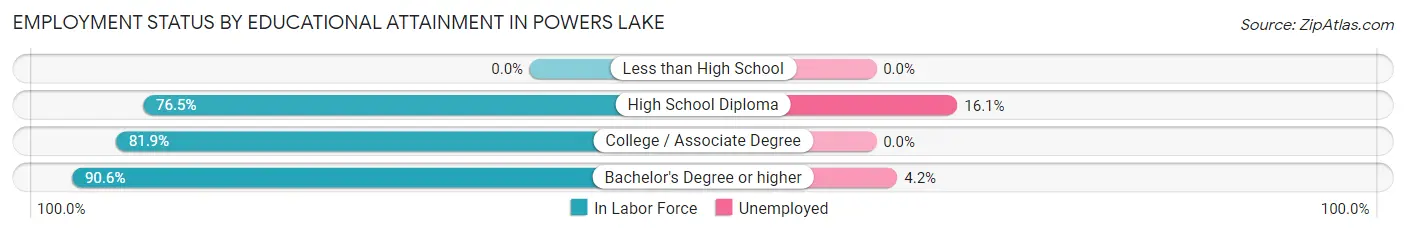
| Educational Attainment | In Labor Force | Unemployed |
| Less than High School | 0 (0.0%) | 0 (0.0%) |
| High School Diploma | 143 (76.5%) | 30 (16.1%) |
| College / Associate Degree | 186 (81.9%) | 0 (0.0%) |
| Bachelor's Degree or higher | 260 (90.6%) | 12 (4.2%) |
| Total | 589 (83.1%) | 41 (5.8%) |
Employment Occupations by Sex in Powers Lake
Management, Business, Science and Arts Occupations
The most common Management, Business, Science and Arts occupations in Powers Lake are Community & Social Service (213 | 24.5%), Education Instruction & Library (202 | 23.3%), Health Diagnosing & Treating (61 | 7.0%), Health Technologists (61 | 7.0%), and Management (54 | 6.2%).
Management, Business, Science and Arts Occupations by Sex
Within the Management, Business, Science and Arts occupations in Powers Lake, the most male-oriented occupations are Architecture & Engineering (100.0%), Arts, Media & Entertainment (100.0%), and Management (90.7%), while the most female-oriented occupations are Education Instruction & Library (94.1%), Community & Social Service (89.2%), and Computers & Mathematics (70.4%).
| Occupation | Male | Female |
| Management | 49 (90.7%) | 5 (9.3%) |
| Business & Financial | 35 (67.3%) | 17 (32.7%) |
| Computers, Engineering & Science | 29 (60.4%) | 19 (39.6%) |
| Computers & Mathematics | 8 (29.6%) | 19 (70.4%) |
| Architecture & Engineering | 21 (100.0%) | 0 (0.0%) |
| Life, Physical & Social Science | 0 (0.0%) | 0 (0.0%) |
| Community & Social Service | 23 (10.8%) | 190 (89.2%) |
| Education, Arts & Media | 0 (0.0%) | 0 (0.0%) |
| Legal Services & Support | 0 (0.0%) | 0 (0.0%) |
| Education Instruction & Library | 12 (5.9%) | 190 (94.1%) |
| Arts, Media & Entertainment | 11 (100.0%) | 0 (0.0%) |
| Health Diagnosing & Treating | 37 (60.7%) | 24 (39.3%) |
| Health Technologists | 37 (60.7%) | 24 (39.3%) |
| Total (Category) | 173 (40.4%) | 255 (59.6%) |
| Total (Overall) | 357 (41.1%) | 512 (58.9%) |
Services Occupations
The most common Services occupations in Powers Lake are Cleaning & Maintenance (25 | 2.9%), Personal Care & Service (20 | 2.3%), Healthcare Support (17 | 2.0%), Security & Protection (9 | 1.0%), and Law Enforcement (9 | 1.0%).
Services Occupations by Sex
Within the Services occupations in Powers Lake, the most male-oriented occupations are Security & Protection (100.0%), Law Enforcement (100.0%), and Personal Care & Service (40.0%), while the most female-oriented occupations are Healthcare Support (100.0%), Cleaning & Maintenance (100.0%), and Personal Care & Service (60.0%).
| Occupation | Male | Female |
| Healthcare Support | 0 (0.0%) | 17 (100.0%) |
| Security & Protection | 9 (100.0%) | 0 (0.0%) |
| Firefighting & Prevention | 0 (0.0%) | 0 (0.0%) |
| Law Enforcement | 9 (100.0%) | 0 (0.0%) |
| Food Preparation & Serving | 0 (0.0%) | 0 (0.0%) |
| Cleaning & Maintenance | 0 (0.0%) | 25 (100.0%) |
| Personal Care & Service | 8 (40.0%) | 12 (60.0%) |
| Total (Category) | 17 (23.9%) | 54 (76.1%) |
| Total (Overall) | 357 (41.1%) | 512 (58.9%) |
Sales and Office Occupations
The most common Sales and Office occupations in Powers Lake are Office & Administration (124 | 14.3%), and Sales & Related (105 | 12.1%).
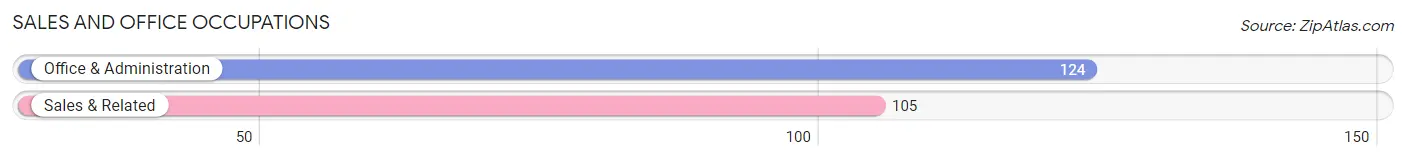
Sales and Office Occupations by Sex
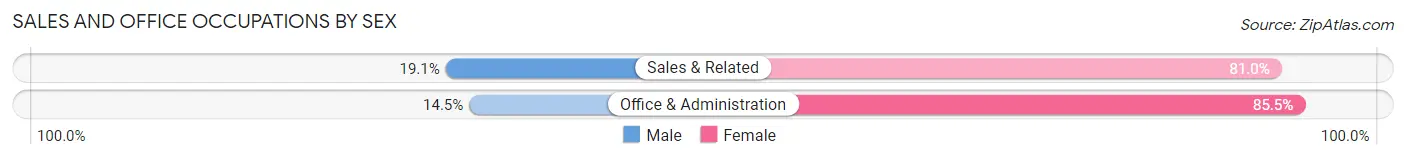
| Occupation | Male | Female |
| Sales & Related | 20 (19.1%) | 85 (80.9%) |
| Office & Administration | 18 (14.5%) | 106 (85.5%) |
| Total (Category) | 38 (16.6%) | 191 (83.4%) |
| Total (Overall) | 357 (41.1%) | 512 (58.9%) |
Natural Resources, Construction and Maintenance Occupations
The most common Natural Resources, Construction and Maintenance occupations in Powers Lake are Construction & Extraction (47 | 5.4%), and Installation, Maintenance & Repair (5 | 0.6%).
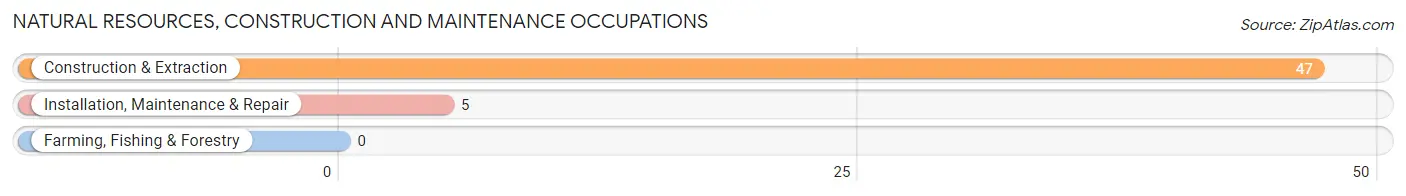
Natural Resources, Construction and Maintenance Occupations by Sex
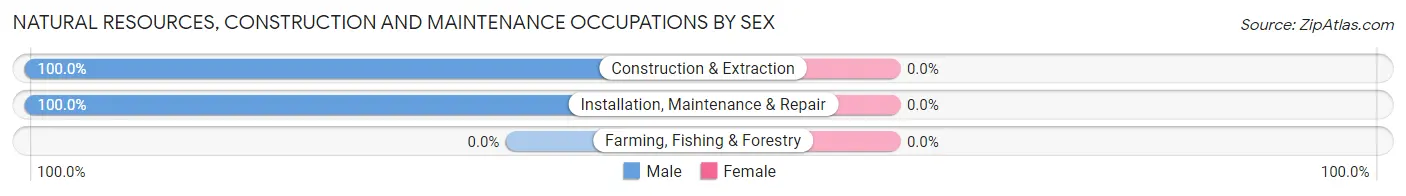
| Occupation | Male | Female |
| Farming, Fishing & Forestry | 0 (0.0%) | 0 (0.0%) |
| Construction & Extraction | 47 (100.0%) | 0 (0.0%) |
| Installation, Maintenance & Repair | 5 (100.0%) | 0 (0.0%) |
| Total (Category) | 52 (100.0%) | 0 (0.0%) |
| Total (Overall) | 357 (41.1%) | 512 (58.9%) |
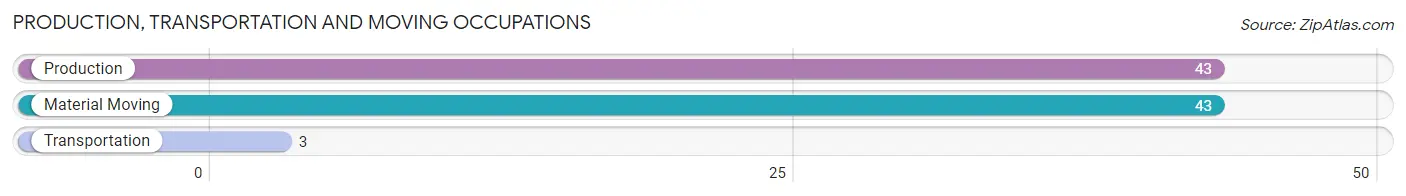
Production, Transportation and Moving Occupations
The most common Production, Transportation and Moving occupations in Powers Lake are Production (43 | 5.0%), Material Moving (43 | 5.0%), and Transportation (3 | 0.4%).
Production, Transportation and Moving Occupations by Sex
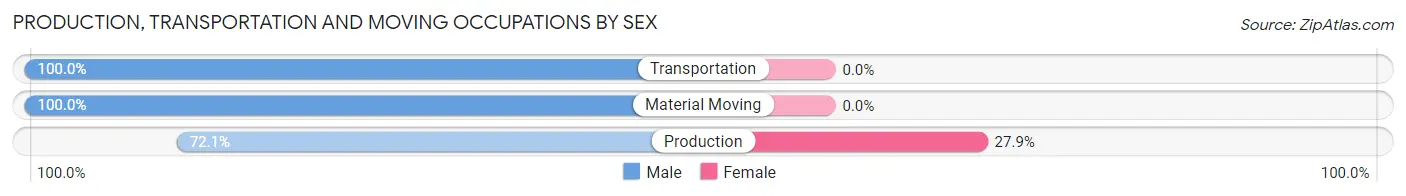
| Occupation | Male | Female |
| Production | 31 (72.1%) | 12 (27.9%) |
| Transportation | 3 (100.0%) | 0 (0.0%) |
| Material Moving | 43 (100.0%) | 0 (0.0%) |
| Total (Category) | 77 (86.5%) | 12 (13.5%) |
| Total (Overall) | 357 (41.1%) | 512 (58.9%) |
Employment Industries by Sex in Powers Lake
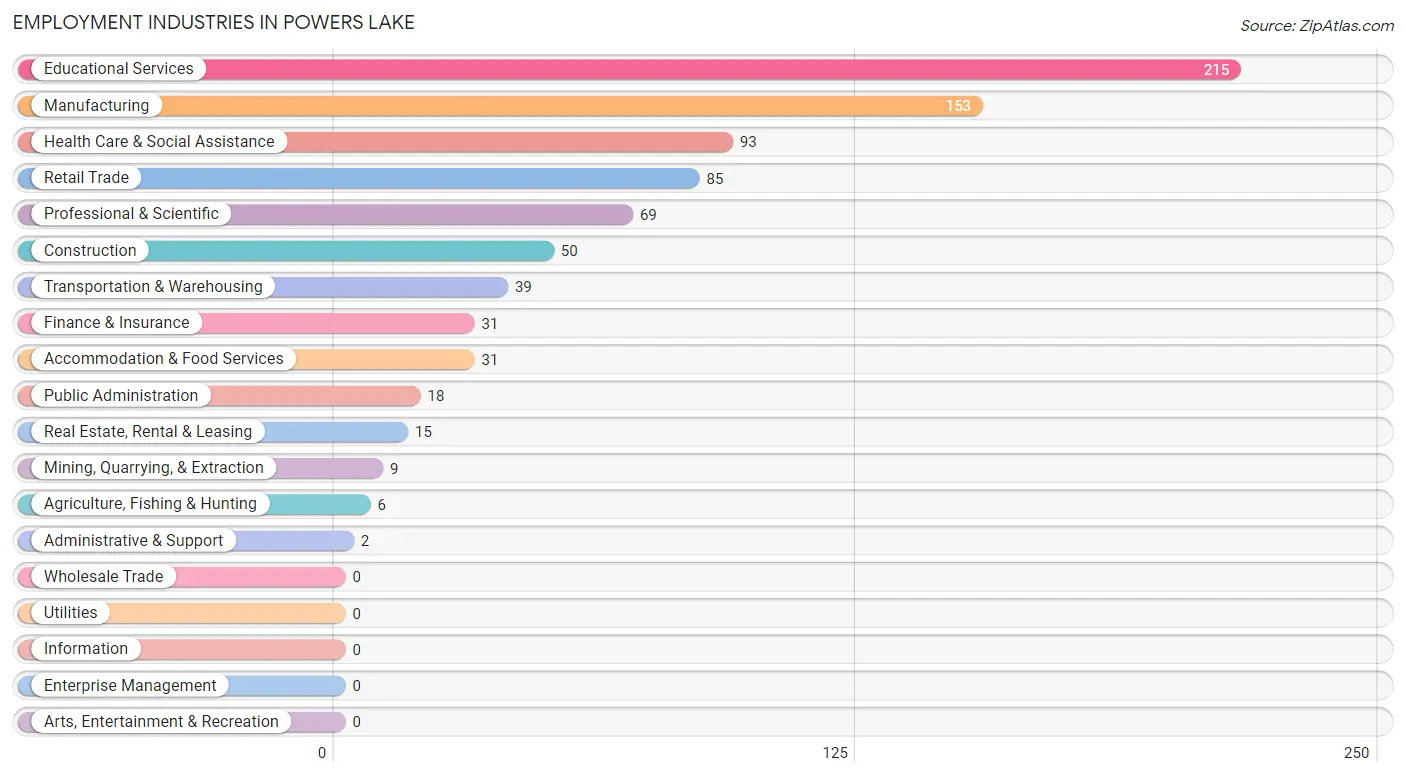
Employment Industries in Powers Lake
The major employment industries in Powers Lake include Educational Services (215 | 24.7%), Manufacturing (153 | 17.6%), Health Care & Social Assistance (93 | 10.7%), Retail Trade (85 | 9.8%), and Professional & Scientific (69 | 7.9%).
Employment Industries by Sex in Powers Lake
The Powers Lake industries that see more men than women are Agriculture, Fishing & Hunting (100.0%), Mining, Quarrying, & Extraction (100.0%), and Construction (100.0%), whereas the industries that tend to have a higher number of women are Real Estate, Rental & Leasing (100.0%), Educational Services (94.4%), and Accommodation & Food Services (80.6%).
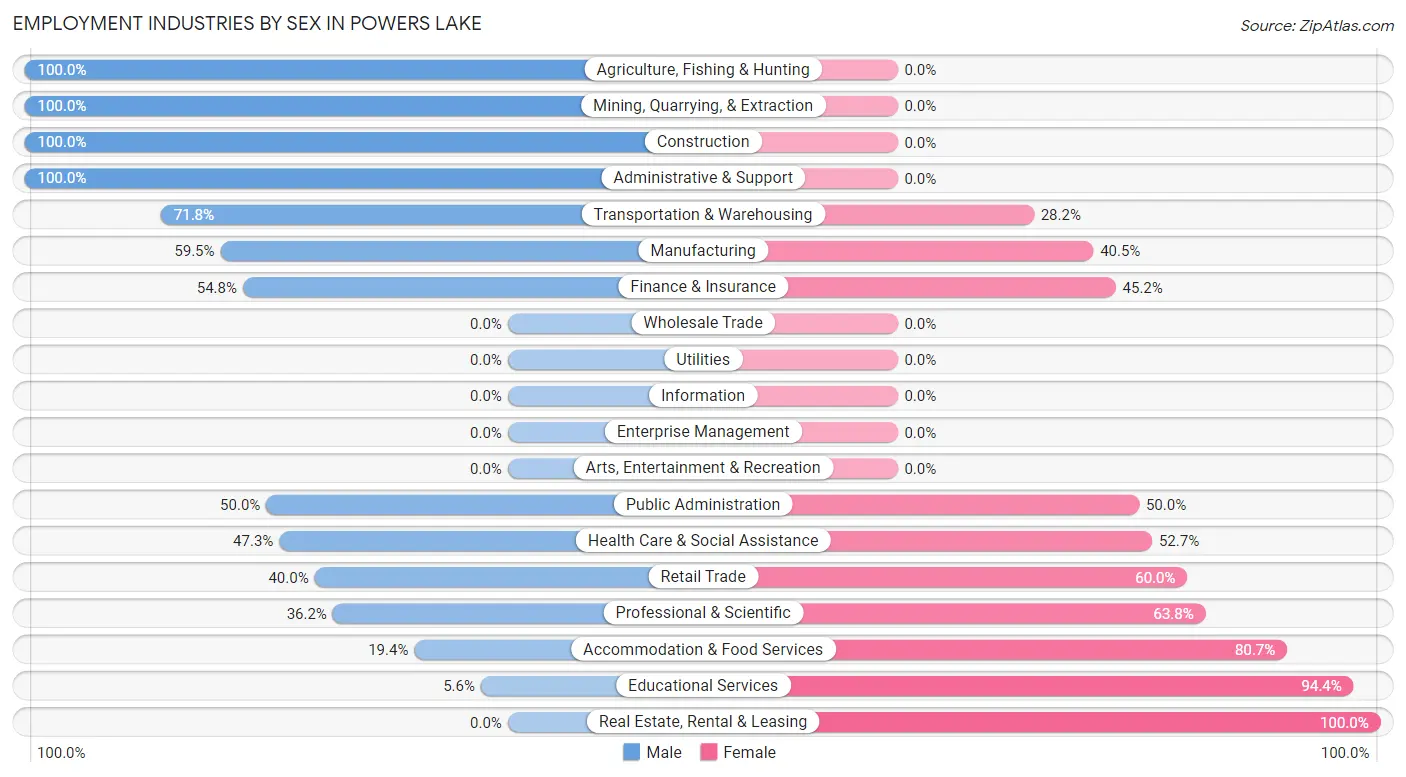
| Industry | Male | Female |
| Agriculture, Fishing & Hunting | 6 (100.0%) | 0 (0.0%) |
| Mining, Quarrying, & Extraction | 9 (100.0%) | 0 (0.0%) |
| Construction | 50 (100.0%) | 0 (0.0%) |
| Manufacturing | 91 (59.5%) | 62 (40.5%) |
| Wholesale Trade | 0 (0.0%) | 0 (0.0%) |
| Retail Trade | 34 (40.0%) | 51 (60.0%) |
| Transportation & Warehousing | 28 (71.8%) | 11 (28.2%) |
| Utilities | 0 (0.0%) | 0 (0.0%) |
| Information | 0 (0.0%) | 0 (0.0%) |
| Finance & Insurance | 17 (54.8%) | 14 (45.2%) |
| Real Estate, Rental & Leasing | 0 (0.0%) | 15 (100.0%) |
| Professional & Scientific | 25 (36.2%) | 44 (63.8%) |
| Enterprise Management | 0 (0.0%) | 0 (0.0%) |
| Administrative & Support | 2 (100.0%) | 0 (0.0%) |
| Educational Services | 12 (5.6%) | 203 (94.4%) |
| Health Care & Social Assistance | 44 (47.3%) | 49 (52.7%) |
| Arts, Entertainment & Recreation | 0 (0.0%) | 0 (0.0%) |
| Accommodation & Food Services | 6 (19.4%) | 25 (80.6%) |
| Public Administration | 9 (50.0%) | 9 (50.0%) |
| Total | 357 (41.1%) | 512 (58.9%) |
Education in Powers Lake
School Enrollment in Powers Lake
The most common levels of schooling among the 257 students in Powers Lake are college / undergraduate (84 | 32.7%), elementary school (71 | 27.6%), and middle school (53 | 20.6%).
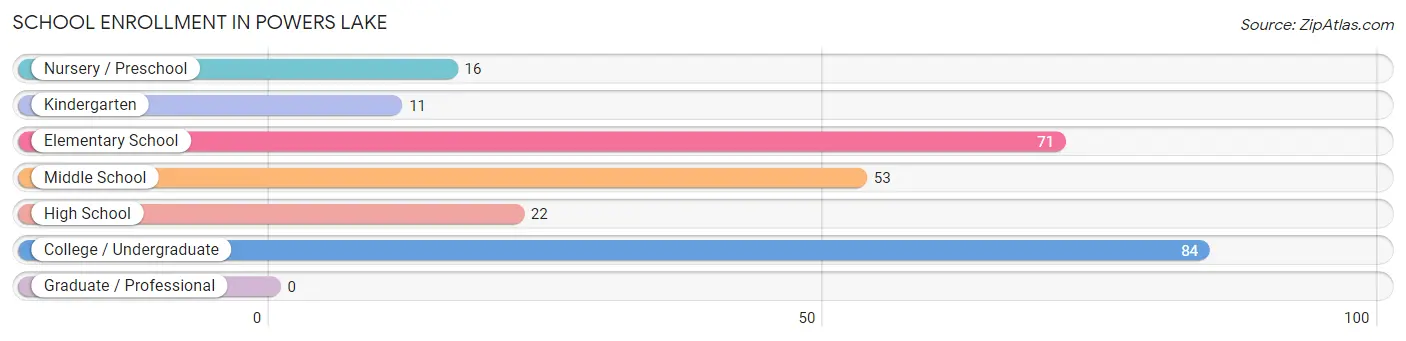
| School Level | # Students | % Students |
| Nursery / Preschool | 16 | 6.2% |
| Kindergarten | 11 | 4.3% |
| Elementary School | 71 | 27.6% |
| Middle School | 53 | 20.6% |
| High School | 22 | 8.6% |
| College / Undergraduate | 84 | 32.7% |
| Graduate / Professional | 0 | 0.0% |
| Total | 257 | 100.0% |
School Enrollment by Age by Funding Source in Powers Lake
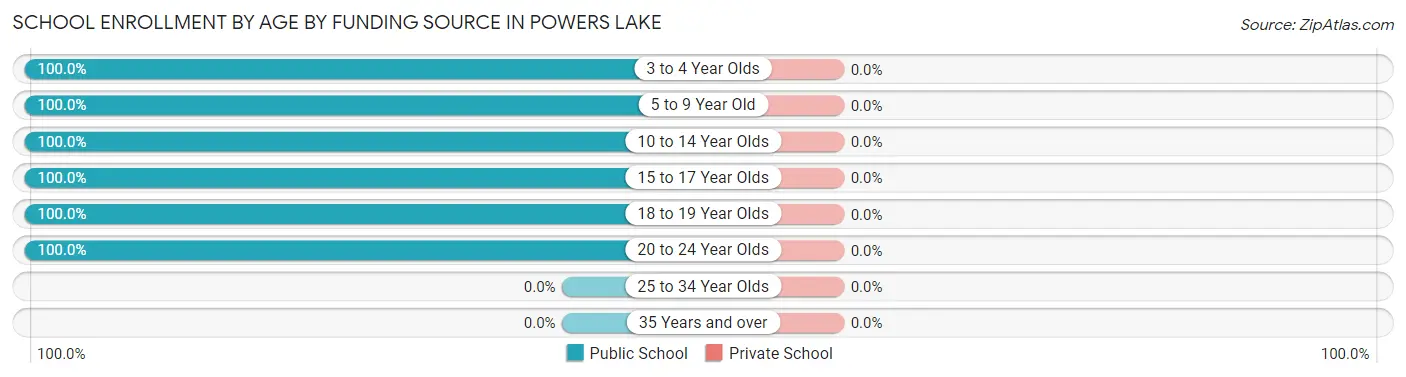
| Age Bracket | Public School | Private School |
| 3 to 4 Year Olds | 16 (100.0%) | 0 (0.0%) |
| 5 to 9 Year Old | 82 (100.0%) | 0 (0.0%) |
| 10 to 14 Year Olds | 53 (100.0%) | 0 (0.0%) |
| 15 to 17 Year Olds | 22 (100.0%) | 0 (0.0%) |
| 18 to 19 Year Olds | 25 (100.0%) | 0 (0.0%) |
| 20 to 24 Year Olds | 59 (100.0%) | 0 (0.0%) |
| 25 to 34 Year Olds | 0 (0.0%) | 0 (0.0%) |
| 35 Years and over | 0 (0.0%) | 0 (0.0%) |
| Total | 257 (100.0%) | 0 (0.0%) |
Educational Attainment by Field of Study in Powers Lake
Business (85 | 22.5%), arts & humanities (61 | 16.1%), social sciences (38 | 10.1%), education (38 | 10.1%), and science & technology (35 | 9.3%) are the most common fields of study among 378 individuals in Powers Lake who have obtained a bachelor's degree or higher.
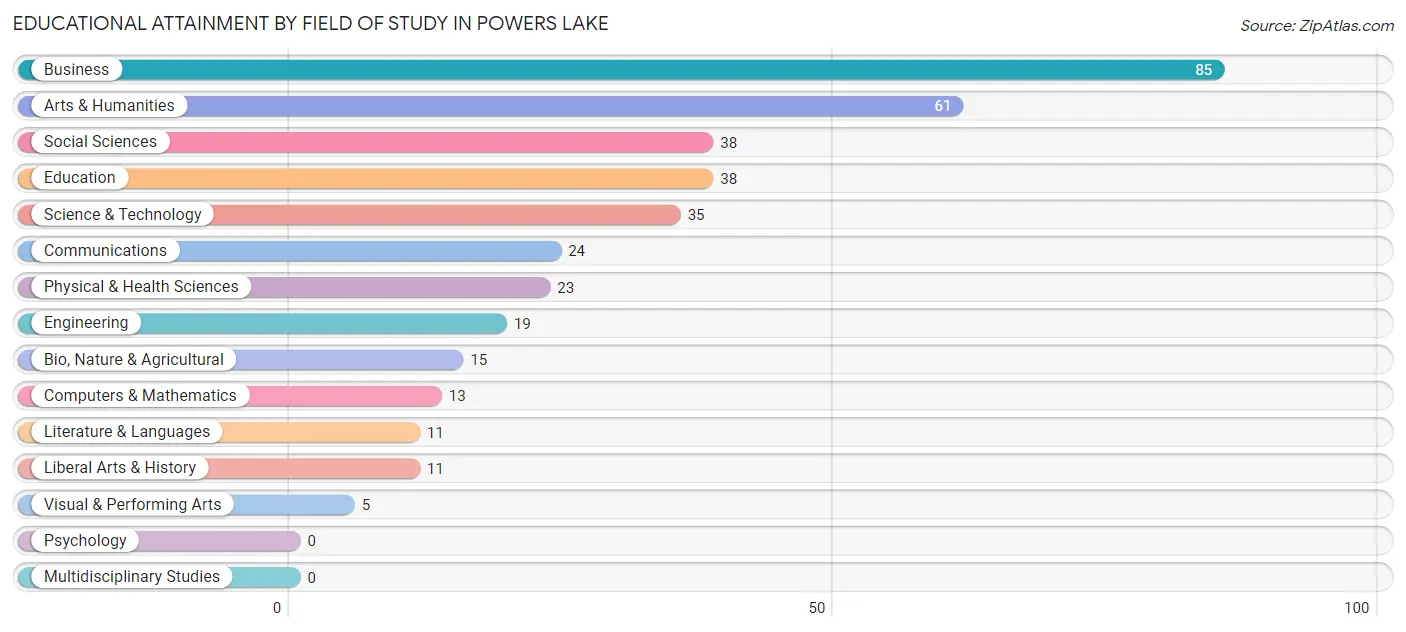
| Field of Study | # Graduates | % Graduates |
| Computers & Mathematics | 13 | 3.4% |
| Bio, Nature & Agricultural | 15 | 4.0% |
| Physical & Health Sciences | 23 | 6.1% |
| Psychology | 0 | 0.0% |
| Social Sciences | 38 | 10.1% |
| Engineering | 19 | 5.0% |
| Multidisciplinary Studies | 0 | 0.0% |
| Science & Technology | 35 | 9.3% |
| Business | 85 | 22.5% |
| Education | 38 | 10.1% |
| Literature & Languages | 11 | 2.9% |
| Liberal Arts & History | 11 | 2.9% |
| Visual & Performing Arts | 5 | 1.3% |
| Communications | 24 | 6.4% |
| Arts & Humanities | 61 | 16.1% |
| Total | 378 | 100.0% |
Transportation & Commute in Powers Lake
Vehicle Availability by Sex in Powers Lake
The most prevalent vehicle ownership categories in Powers Lake are males with 2 vehicles (130, accounting for 36.6%) and females with 2 vehicles (230, making up 26.2%).

| Vehicles Available | Male | Female |
| No Vehicle | 0 (0.0%) | 0 (0.0%) |
| 1 Vehicle | 17 (4.8%) | 0 (0.0%) |
| 2 Vehicles | 130 (36.6%) | 230 (46.4%) |
| 3 Vehicles | 90 (25.4%) | 136 (27.4%) |
| 4 Vehicles | 85 (23.9%) | 114 (23.0%) |
| 5 or more Vehicles | 33 (9.3%) | 16 (3.2%) |
| Total | 355 (100.0%) | 496 (100.0%) |
Commute Time in Powers Lake
The most frequently occuring commute durations in Powers Lake are 30 to 34 minutes (143 commuters, 22.7%), 20 to 24 minutes (77 commuters, 12.2%), and 45 to 59 minutes (74 commuters, 11.7%).
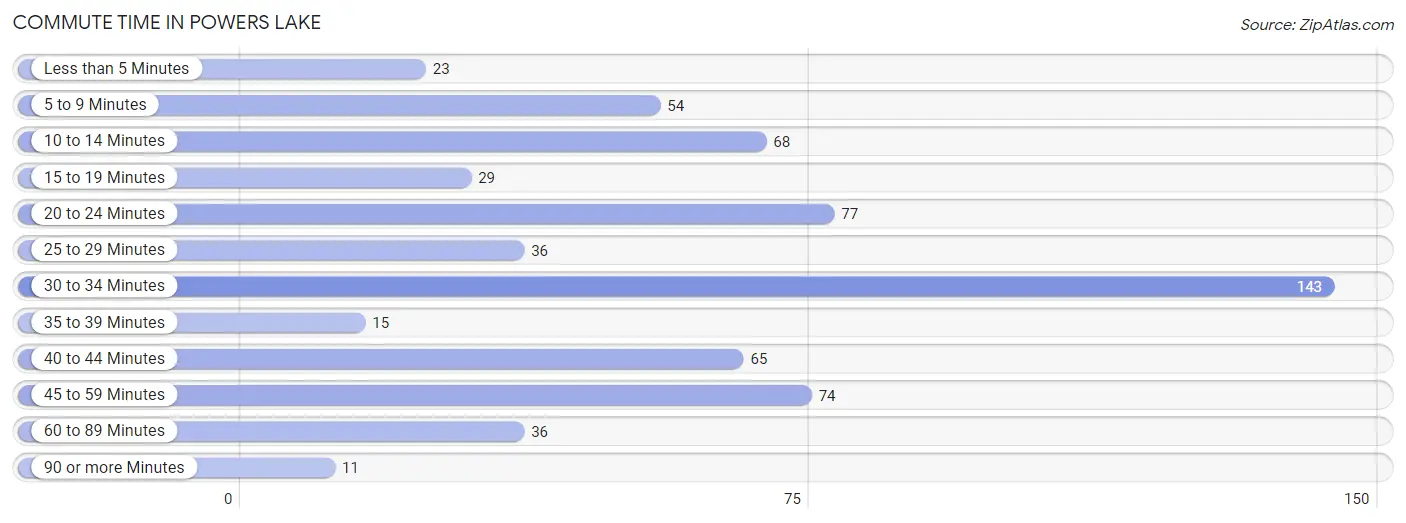
| Commute Time | # Commuters | % Commuters |
| Less than 5 Minutes | 23 | 3.6% |
| 5 to 9 Minutes | 54 | 8.6% |
| 10 to 14 Minutes | 68 | 10.8% |
| 15 to 19 Minutes | 29 | 4.6% |
| 20 to 24 Minutes | 77 | 12.2% |
| 25 to 29 Minutes | 36 | 5.7% |
| 30 to 34 Minutes | 143 | 22.7% |
| 35 to 39 Minutes | 15 | 2.4% |
| 40 to 44 Minutes | 65 | 10.3% |
| 45 to 59 Minutes | 74 | 11.7% |
| 60 to 89 Minutes | 36 | 5.7% |
| 90 or more Minutes | 11 | 1.7% |
Commute Time by Sex in Powers Lake
The most common commute times in Powers Lake are 45 to 59 minutes (66 commuters, 21.0%) for males and 30 to 34 minutes (91 commuters, 28.7%) for females.
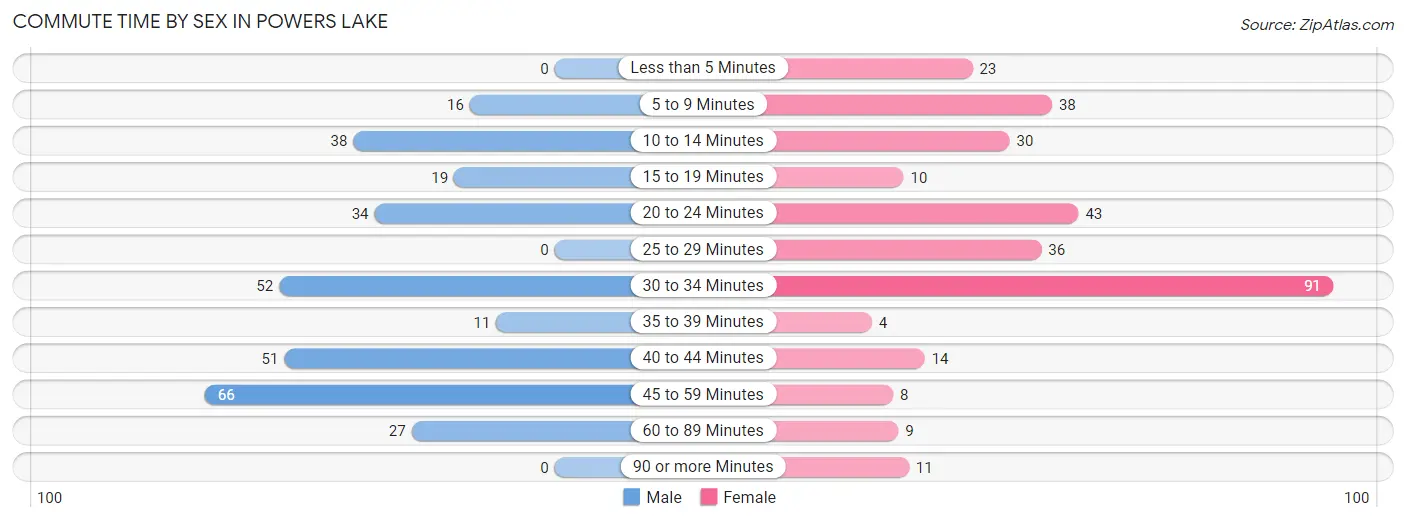
| Commute Time | Male | Female |
| Less than 5 Minutes | 0 (0.0%) | 23 (7.3%) |
| 5 to 9 Minutes | 16 (5.1%) | 38 (12.0%) |
| 10 to 14 Minutes | 38 (12.1%) | 30 (9.5%) |
| 15 to 19 Minutes | 19 (6.0%) | 10 (3.2%) |
| 20 to 24 Minutes | 34 (10.8%) | 43 (13.6%) |
| 25 to 29 Minutes | 0 (0.0%) | 36 (11.4%) |
| 30 to 34 Minutes | 52 (16.6%) | 91 (28.7%) |
| 35 to 39 Minutes | 11 (3.5%) | 4 (1.3%) |
| 40 to 44 Minutes | 51 (16.2%) | 14 (4.4%) |
| 45 to 59 Minutes | 66 (21.0%) | 8 (2.5%) |
| 60 to 89 Minutes | 27 (8.6%) | 9 (2.8%) |
| 90 or more Minutes | 0 (0.0%) | 11 (3.5%) |
Time of Departure to Work by Sex in Powers Lake
The most frequent times of departure to work in Powers Lake are 12:00 AM to 4:59 AM (67, 21.3%) for males and 6:30 AM to 6:59 AM (65, 20.5%) for females.
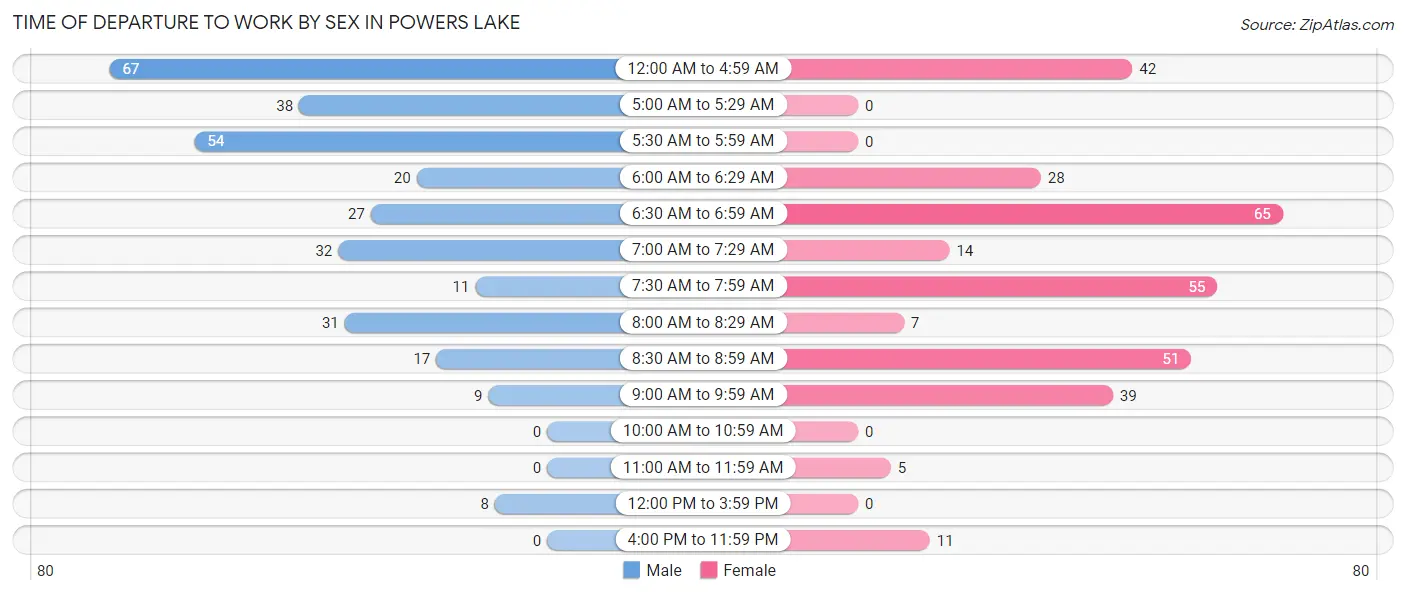
| Time of Departure | Male | Female |
| 12:00 AM to 4:59 AM | 67 (21.3%) | 42 (13.3%) |
| 5:00 AM to 5:29 AM | 38 (12.1%) | 0 (0.0%) |
| 5:30 AM to 5:59 AM | 54 (17.2%) | 0 (0.0%) |
| 6:00 AM to 6:29 AM | 20 (6.4%) | 28 (8.8%) |
| 6:30 AM to 6:59 AM | 27 (8.6%) | 65 (20.5%) |
| 7:00 AM to 7:29 AM | 32 (10.2%) | 14 (4.4%) |
| 7:30 AM to 7:59 AM | 11 (3.5%) | 55 (17.3%) |
| 8:00 AM to 8:29 AM | 31 (9.9%) | 7 (2.2%) |
| 8:30 AM to 8:59 AM | 17 (5.4%) | 51 (16.1%) |
| 9:00 AM to 9:59 AM | 9 (2.9%) | 39 (12.3%) |
| 10:00 AM to 10:59 AM | 0 (0.0%) | 0 (0.0%) |
| 11:00 AM to 11:59 AM | 0 (0.0%) | 5 (1.6%) |
| 12:00 PM to 3:59 PM | 8 (2.5%) | 0 (0.0%) |
| 4:00 PM to 11:59 PM | 0 (0.0%) | 11 (3.5%) |
| Total | 314 (100.0%) | 317 (100.0%) |
Housing Occupancy in Powers Lake
Occupancy by Ownership in Powers Lake
Of the total 561 dwellings in Powers Lake, owner-occupied units account for 552 (98.4%), while renter-occupied units make up 9 (1.6%).
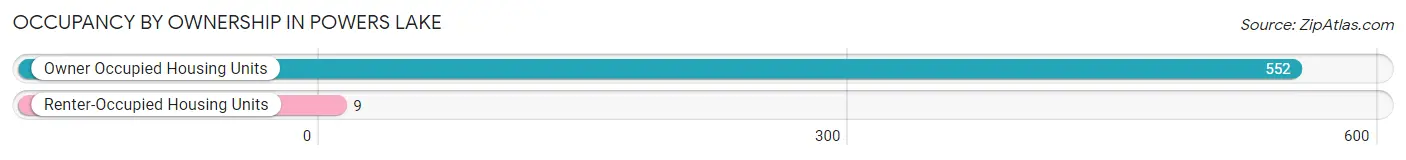
| Occupancy | # Housing Units | % Housing Units |
| Owner Occupied Housing Units | 552 | 98.4% |
| Renter-Occupied Housing Units | 9 | 1.6% |
| Total Occupied Housing Units | 561 | 100.0% |
Occupancy by Household Size in Powers Lake
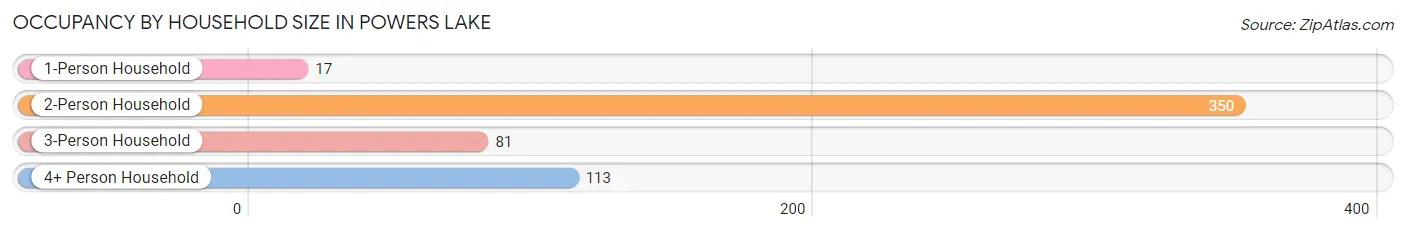
| Household Size | # Housing Units | % Housing Units |
| 1-Person Household | 17 | 3.0% |
| 2-Person Household | 350 | 62.4% |
| 3-Person Household | 81 | 14.4% |
| 4+ Person Household | 113 | 20.1% |
| Total Housing Units | 561 | 100.0% |
Occupancy by Ownership by Household Size in Powers Lake
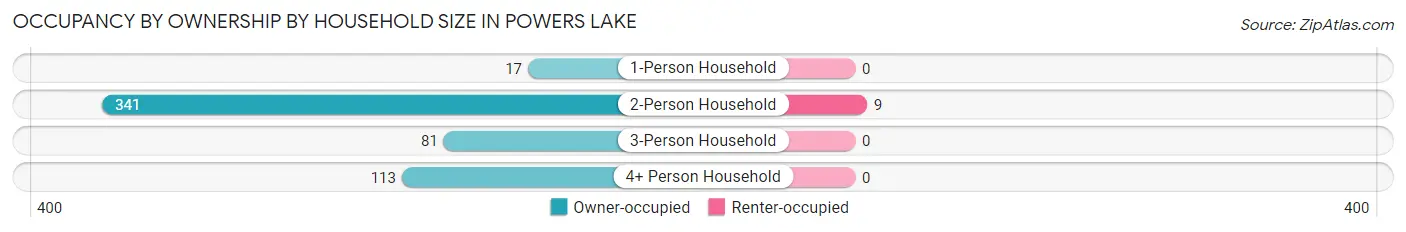
| Household Size | Owner-occupied | Renter-occupied |
| 1-Person Household | 17 (100.0%) | 0 (0.0%) |
| 2-Person Household | 341 (97.4%) | 9 (2.6%) |
| 3-Person Household | 81 (100.0%) | 0 (0.0%) |
| 4+ Person Household | 113 (100.0%) | 0 (0.0%) |
| Total Housing Units | 552 (98.4%) | 9 (1.6%) |
Occupancy by Educational Attainment in Powers Lake
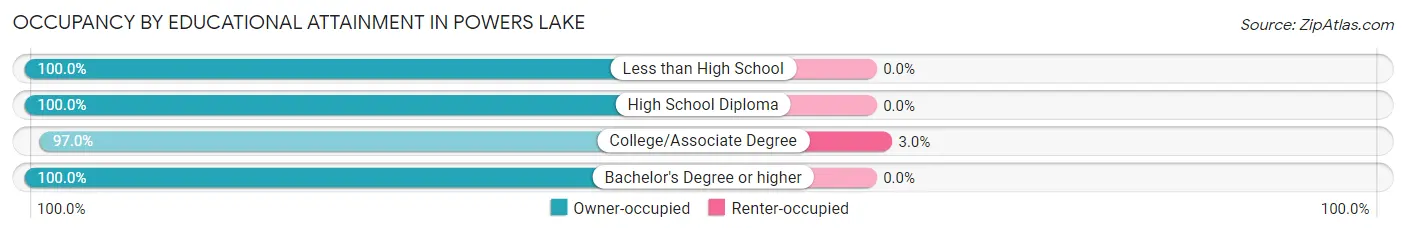
| Household Size | Owner-occupied | Renter-occupied |
| Less than High School | 8 (100.0%) | 0 (0.0%) |
| High School Diploma | 85 (100.0%) | 0 (0.0%) |
| College/Associate Degree | 287 (97.0%) | 9 (3.0%) |
| Bachelor's Degree or higher | 172 (100.0%) | 0 (0.0%) |
Occupancy by Age of Householder in Powers Lake
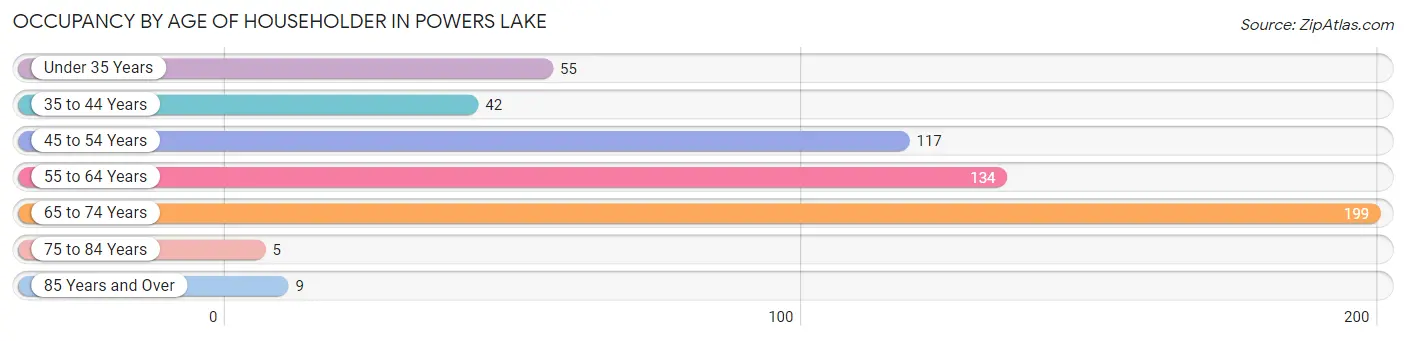
| Age Bracket | # Households | % Households |
| Under 35 Years | 55 | 9.8% |
| 35 to 44 Years | 42 | 7.5% |
| 45 to 54 Years | 117 | 20.9% |
| 55 to 64 Years | 134 | 23.9% |
| 65 to 74 Years | 199 | 35.5% |
| 75 to 84 Years | 5 | 0.9% |
| 85 Years and Over | 9 | 1.6% |
| Total | 561 | 100.0% |
Housing Finances in Powers Lake
Median Income by Occupancy in Powers Lake
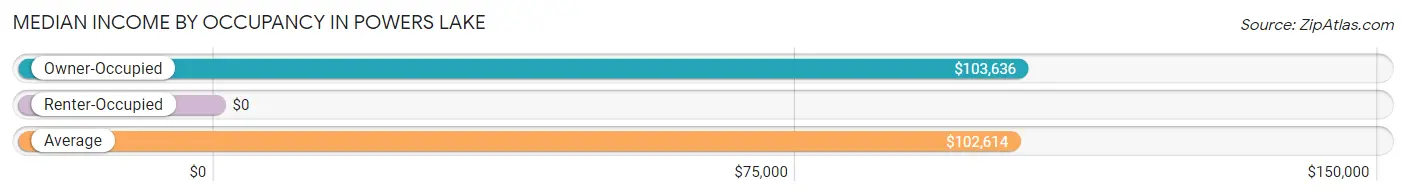
| Occupancy Type | # Households | Median Income |
| Owner-Occupied | 552 (98.4%) | $103,636 |
| Renter-Occupied | 9 (1.6%) | $0 |
| Average | 561 (100.0%) | $102,614 |
Occupancy by Householder Income Bracket in Powers Lake
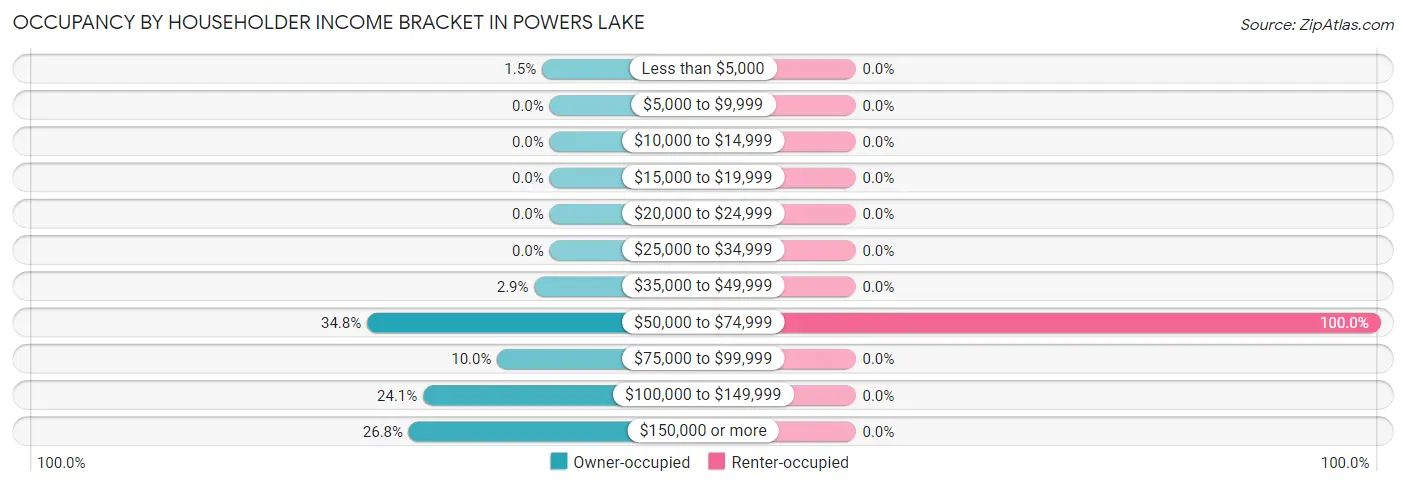
| Income Bracket | Owner-occupied | Renter-occupied |
| Less than $5,000 | 8 (1.5%) | 0 (0.0%) |
| $5,000 to $9,999 | 0 (0.0%) | 0 (0.0%) |
| $10,000 to $14,999 | 0 (0.0%) | 0 (0.0%) |
| $15,000 to $19,999 | 0 (0.0%) | 0 (0.0%) |
| $20,000 to $24,999 | 0 (0.0%) | 0 (0.0%) |
| $25,000 to $34,999 | 0 (0.0%) | 0 (0.0%) |
| $35,000 to $49,999 | 16 (2.9%) | 0 (0.0%) |
| $50,000 to $74,999 | 192 (34.8%) | 9 (100.0%) |
| $75,000 to $99,999 | 55 (10.0%) | 0 (0.0%) |
| $100,000 to $149,999 | 133 (24.1%) | 0 (0.0%) |
| $150,000 or more | 148 (26.8%) | 0 (0.0%) |
| Total | 552 (100.0%) | 9 (100.0%) |
Monthly Housing Cost Tiers in Powers Lake
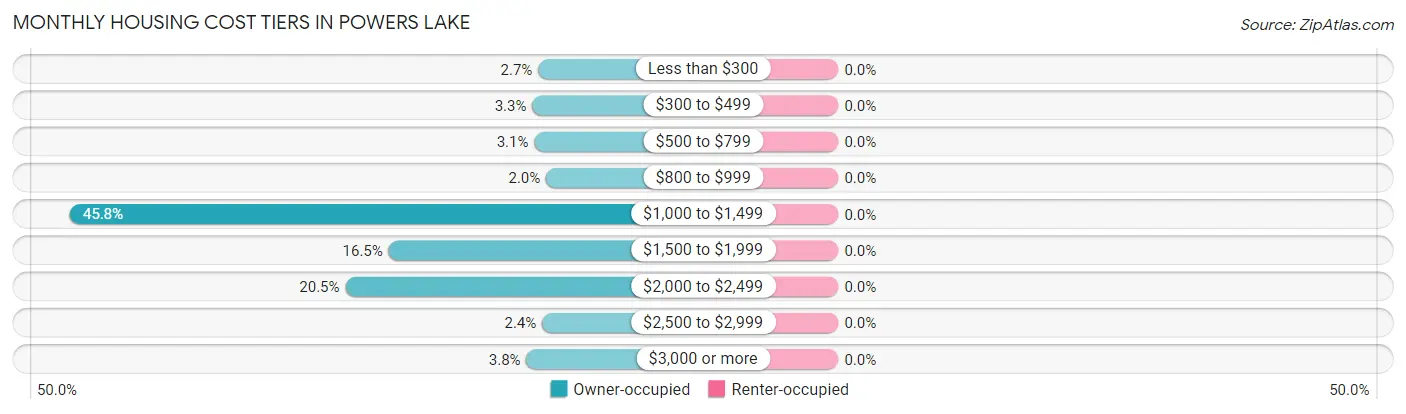
| Monthly Cost | Owner-occupied | Renter-occupied |
| Less than $300 | 15 (2.7%) | 0 (0.0%) |
| $300 to $499 | 18 (3.3%) | 0 (0.0%) |
| $500 to $799 | 17 (3.1%) | 0 (0.0%) |
| $800 to $999 | 11 (2.0%) | 0 (0.0%) |
| $1,000 to $1,499 | 253 (45.8%) | 0 (0.0%) |
| $1,500 to $1,999 | 91 (16.5%) | 0 (0.0%) |
| $2,000 to $2,499 | 113 (20.5%) | 0 (0.0%) |
| $2,500 to $2,999 | 13 (2.4%) | 0 (0.0%) |
| $3,000 or more | 21 (3.8%) | 0 (0.0%) |
| Total | 552 (100.0%) | 9 (100.0%) |
Physical Housing Characteristics in Powers Lake
Housing Structures in Powers Lake
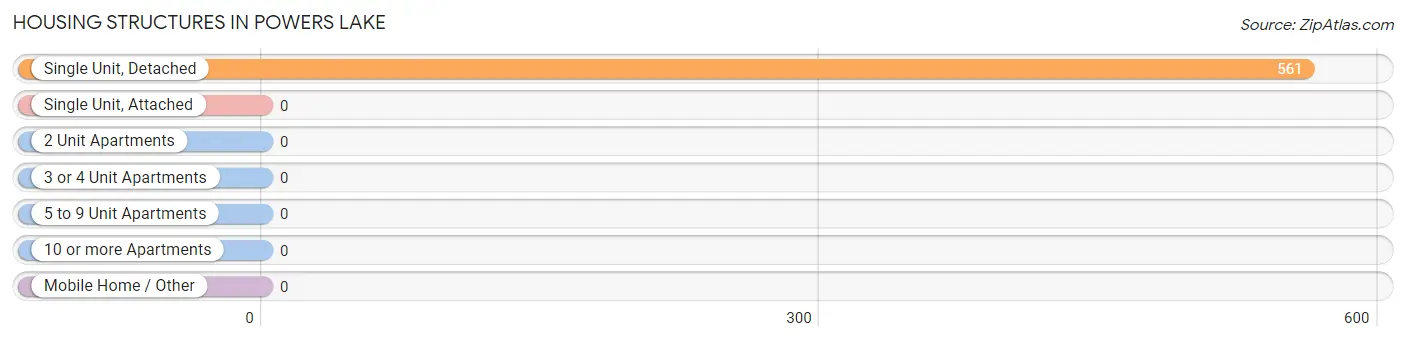
| Structure Type | # Housing Units | % Housing Units |
| Single Unit, Detached | 561 | 100.0% |
| Single Unit, Attached | 0 | 0.0% |
| 2 Unit Apartments | 0 | 0.0% |
| 3 or 4 Unit Apartments | 0 | 0.0% |
| 5 to 9 Unit Apartments | 0 | 0.0% |
| 10 or more Apartments | 0 | 0.0% |
| Mobile Home / Other | 0 | 0.0% |
| Total | 561 | 100.0% |
Housing Structures by Occupancy in Powers Lake
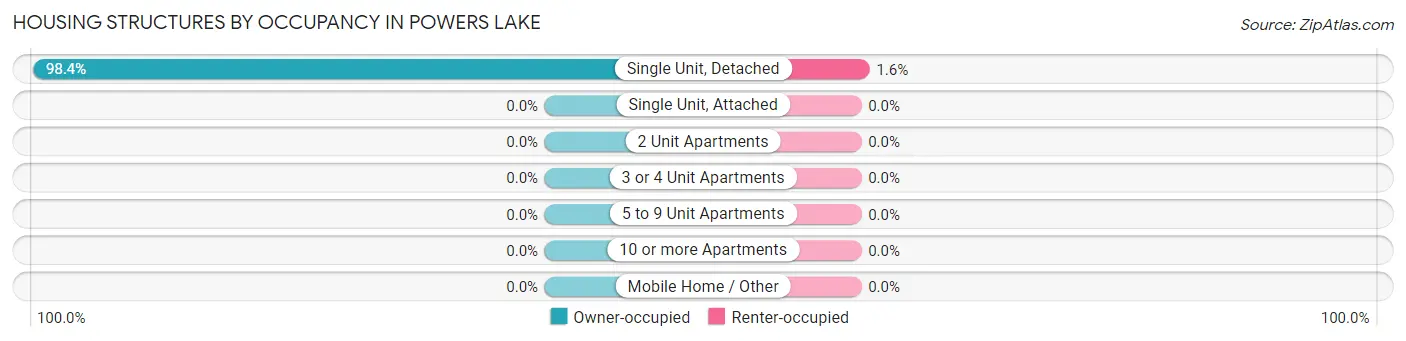
| Structure Type | Owner-occupied | Renter-occupied |
| Single Unit, Detached | 552 (98.4%) | 9 (1.6%) |
| Single Unit, Attached | 0 (0.0%) | 0 (0.0%) |
| 2 Unit Apartments | 0 (0.0%) | 0 (0.0%) |
| 3 or 4 Unit Apartments | 0 (0.0%) | 0 (0.0%) |
| 5 to 9 Unit Apartments | 0 (0.0%) | 0 (0.0%) |
| 10 or more Apartments | 0 (0.0%) | 0 (0.0%) |
| Mobile Home / Other | 0 (0.0%) | 0 (0.0%) |
| Total | 552 (98.4%) | 9 (1.6%) |
Housing Structures by Number of Rooms in Powers Lake
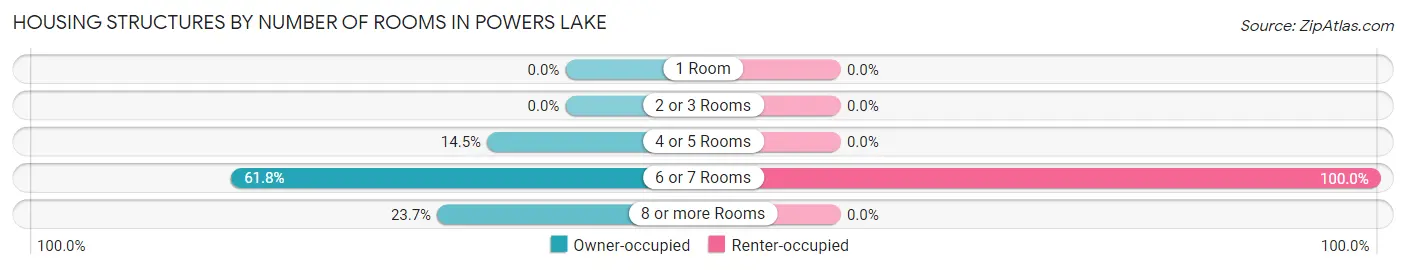
| Number of Rooms | Owner-occupied | Renter-occupied |
| 1 Room | 0 (0.0%) | 0 (0.0%) |
| 2 or 3 Rooms | 0 (0.0%) | 0 (0.0%) |
| 4 or 5 Rooms | 80 (14.5%) | 0 (0.0%) |
| 6 or 7 Rooms | 341 (61.8%) | 9 (100.0%) |
| 8 or more Rooms | 131 (23.7%) | 0 (0.0%) |
| Total | 552 (100.0%) | 9 (100.0%) |
Housing Structure by Heating Type in Powers Lake
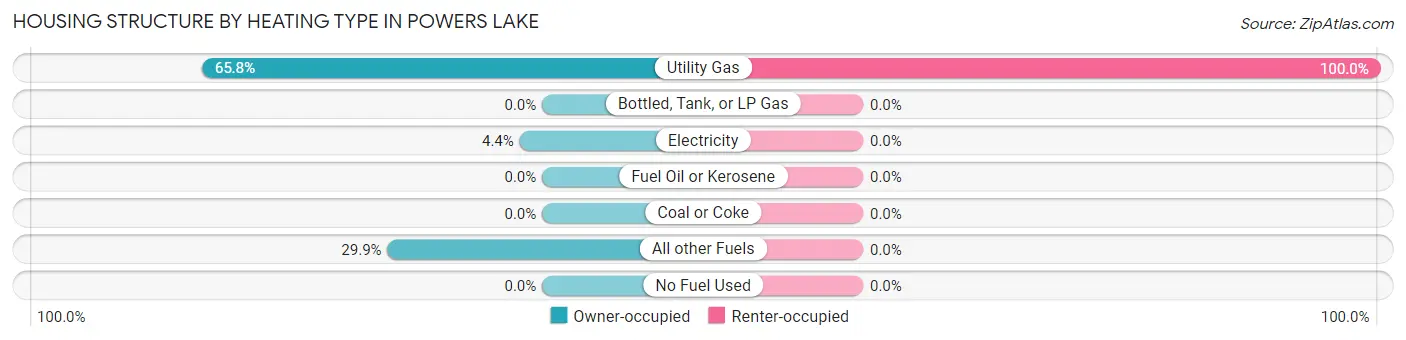
| Heating Type | Owner-occupied | Renter-occupied |
| Utility Gas | 363 (65.8%) | 9 (100.0%) |
| Bottled, Tank, or LP Gas | 0 (0.0%) | 0 (0.0%) |
| Electricity | 24 (4.3%) | 0 (0.0%) |
| Fuel Oil or Kerosene | 0 (0.0%) | 0 (0.0%) |
| Coal or Coke | 0 (0.0%) | 0 (0.0%) |
| All other Fuels | 165 (29.9%) | 0 (0.0%) |
| No Fuel Used | 0 (0.0%) | 0 (0.0%) |
| Total | 552 (100.0%) | 9 (100.0%) |
Household Vehicle Usage in Powers Lake
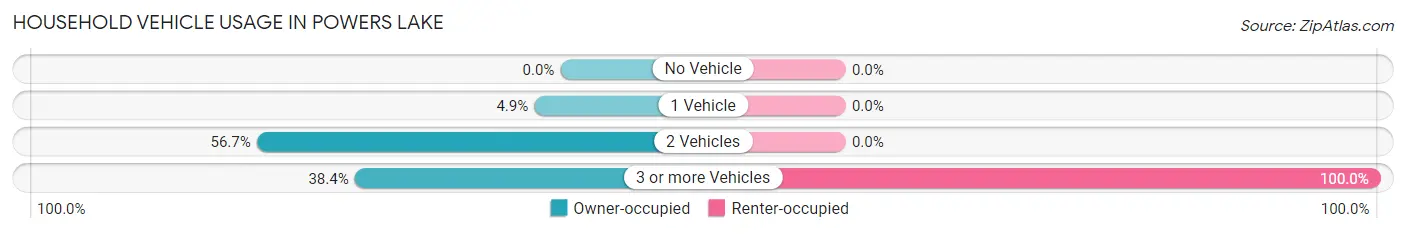
| Vehicles per Household | Owner-occupied | Renter-occupied |
| No Vehicle | 0 (0.0%) | 0 (0.0%) |
| 1 Vehicle | 27 (4.9%) | 0 (0.0%) |
| 2 Vehicles | 313 (56.7%) | 0 (0.0%) |
| 3 or more Vehicles | 212 (38.4%) | 9 (100.0%) |
| Total | 552 (100.0%) | 9 (100.0%) |
Real Estate & Mortgages in Powers Lake
Real Estate and Mortgage Overview in Powers Lake
| Characteristic | Without Mortgage | With Mortgage |
| Housing Units | 76 | 476 |
| Median Property Value | $284,200 | $269,400 |
| Median Household Income | $103,864 | $125 |
| Monthly Housing Costs | $529 | $21 |
| Real Estate Taxes | $3,941 | $0 |
Property Value by Mortgage Status in Powers Lake
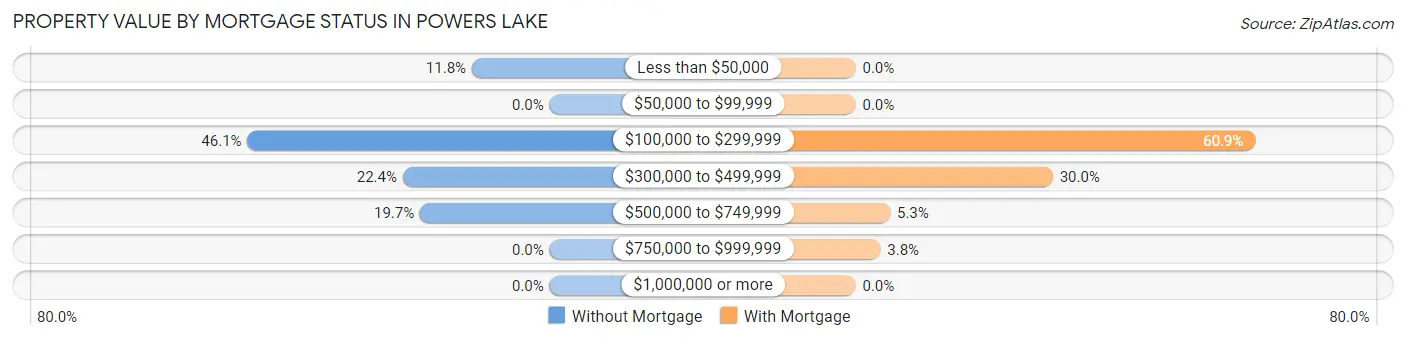
| Property Value | Without Mortgage | With Mortgage |
| Less than $50,000 | 9 (11.8%) | 0 (0.0%) |
| $50,000 to $99,999 | 0 (0.0%) | 0 (0.0%) |
| $100,000 to $299,999 | 35 (46.1%) | 290 (60.9%) |
| $300,000 to $499,999 | 17 (22.4%) | 143 (30.0%) |
| $500,000 to $749,999 | 15 (19.7%) | 25 (5.2%) |
| $750,000 to $999,999 | 0 (0.0%) | 18 (3.8%) |
| $1,000,000 or more | 0 (0.0%) | 0 (0.0%) |
| Total | 76 (100.0%) | 476 (100.0%) |
Household Income by Mortgage Status in Powers Lake
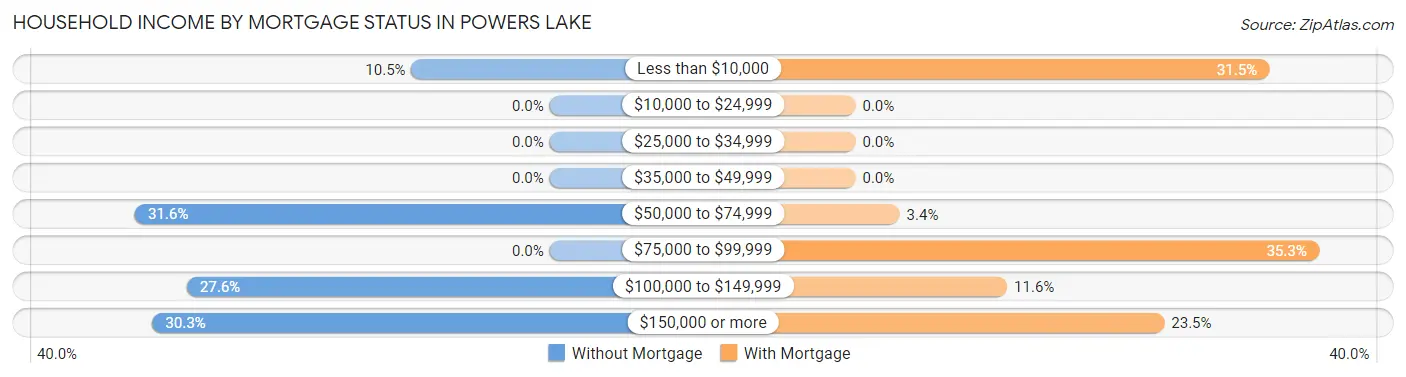
| Household Income | Without Mortgage | With Mortgage |
| Less than $10,000 | 8 (10.5%) | 150 (31.5%) |
| $10,000 to $24,999 | 0 (0.0%) | 0 (0.0%) |
| $25,000 to $34,999 | 0 (0.0%) | 0 (0.0%) |
| $35,000 to $49,999 | 0 (0.0%) | 0 (0.0%) |
| $50,000 to $74,999 | 24 (31.6%) | 16 (3.4%) |
| $75,000 to $99,999 | 0 (0.0%) | 168 (35.3%) |
| $100,000 to $149,999 | 21 (27.6%) | 55 (11.6%) |
| $150,000 or more | 23 (30.3%) | 112 (23.5%) |
| Total | 76 (100.0%) | 476 (100.0%) |
Property Value to Household Income Ratio in Powers Lake
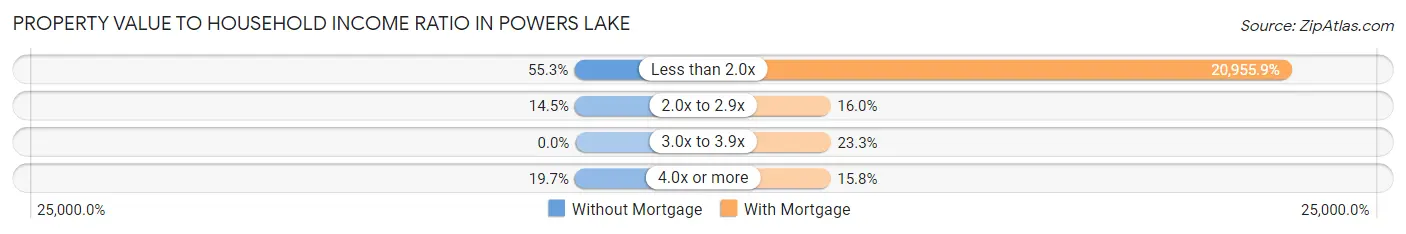
| Value-to-Income Ratio | Without Mortgage | With Mortgage |
| Less than 2.0x | 42 (55.3%) | 99,750 (20,955.9%) |
| 2.0x to 2.9x | 11 (14.5%) | 76 (16.0%) |
| 3.0x to 3.9x | 0 (0.0%) | 111 (23.3%) |
| 4.0x or more | 15 (19.7%) | 75 (15.8%) |
| Total | 76 (100.0%) | 476 (100.0%) |
Real Estate Taxes by Mortgage Status in Powers Lake
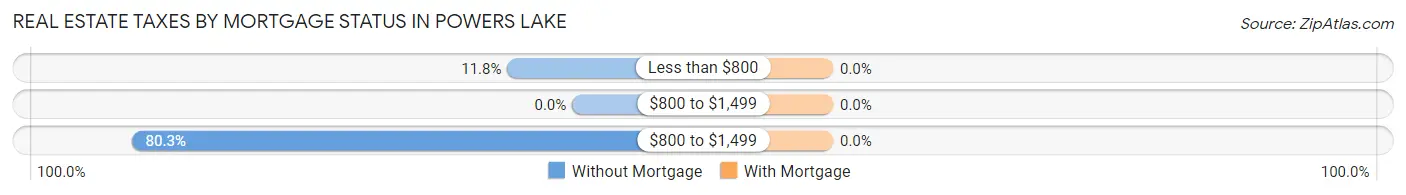
| Property Taxes | Without Mortgage | With Mortgage |
| Less than $800 | 9 (11.8%) | 0 (0.0%) |
| $800 to $1,499 | 0 (0.0%) | 0 (0.0%) |
| $800 to $1,499 | 61 (80.3%) | 0 (0.0%) |
| Total | 76 (100.0%) | 476 (100.0%) |
Health & Disability in Powers Lake
Health Insurance Coverage by Age in Powers Lake
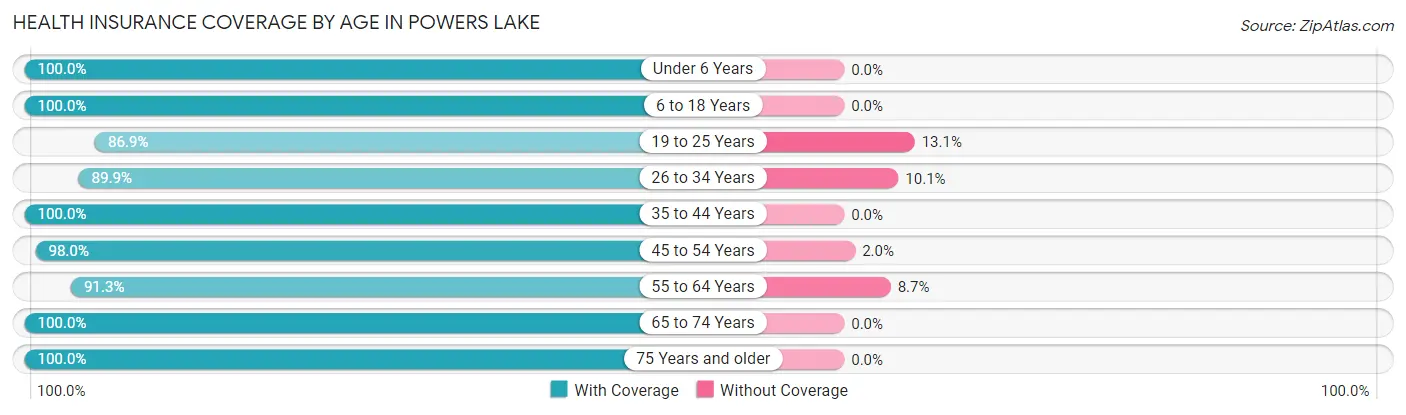
| Age Bracket | With Coverage | Without Coverage |
| Under 6 Years | 81 (100.0%) | 0 (0.0%) |
| 6 to 18 Years | 171 (100.0%) | 0 (0.0%) |
| 19 to 25 Years | 119 (86.9%) | 18 (13.1%) |
| 26 to 34 Years | 98 (89.9%) | 11 (10.1%) |
| 35 to 44 Years | 92 (100.0%) | 0 (0.0%) |
| 45 to 54 Years | 240 (98.0%) | 5 (2.0%) |
| 55 to 64 Years | 232 (91.3%) | 22 (8.7%) |
| 65 to 74 Years | 251 (100.0%) | 0 (0.0%) |
| 75 Years and older | 41 (100.0%) | 0 (0.0%) |
| Total | 1,325 (95.9%) | 56 (4.1%) |
Health Insurance Coverage by Citizenship Status in Powers Lake
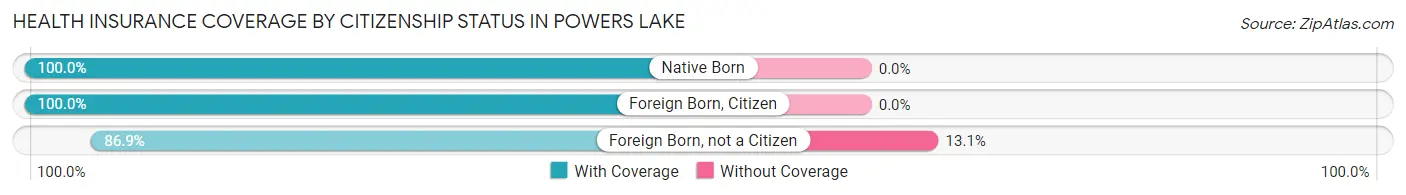
| Citizenship Status | With Coverage | Without Coverage |
| Native Born | 81 (100.0%) | 0 (0.0%) |
| Foreign Born, Citizen | 171 (100.0%) | 0 (0.0%) |
| Foreign Born, not a Citizen | 119 (86.9%) | 18 (13.1%) |
Health Insurance Coverage by Household Income in Powers Lake
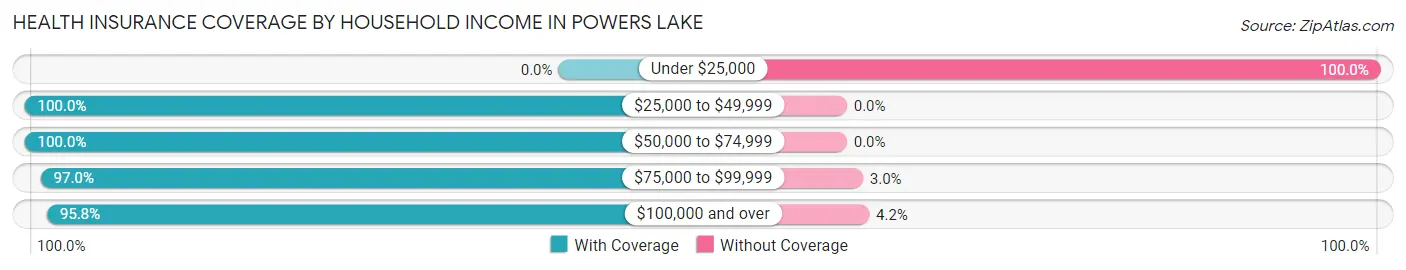
| Household Income | With Coverage | Without Coverage |
| Under $25,000 | 0 (0.0%) | 17 (100.0%) |
| $25,000 to $49,999 | 79 (100.0%) | 0 (0.0%) |
| $50,000 to $74,999 | 302 (100.0%) | 0 (0.0%) |
| $75,000 to $99,999 | 161 (97.0%) | 5 (3.0%) |
| $100,000 and over | 779 (95.8%) | 34 (4.2%) |
Public vs Private Health Insurance Coverage by Age in Powers Lake
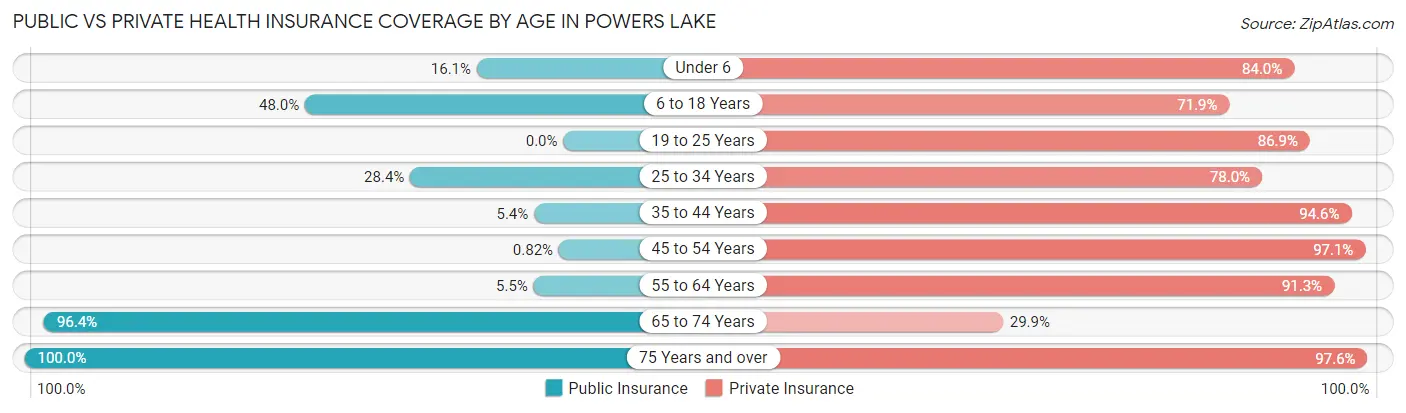
| Age Bracket | Public Insurance | Private Insurance |
| Under 6 | 13 (16.1%) | 68 (84.0%) |
| 6 to 18 Years | 82 (47.9%) | 123 (71.9%) |
| 19 to 25 Years | 0 (0.0%) | 119 (86.9%) |
| 25 to 34 Years | 31 (28.4%) | 85 (78.0%) |
| 35 to 44 Years | 5 (5.4%) | 87 (94.6%) |
| 45 to 54 Years | 2 (0.8%) | 238 (97.1%) |
| 55 to 64 Years | 14 (5.5%) | 232 (91.3%) |
| 65 to 74 Years | 242 (96.4%) | 75 (29.9%) |
| 75 Years and over | 41 (100.0%) | 40 (97.6%) |
| Total | 430 (31.1%) | 1,067 (77.3%) |
Disability Status by Sex by Age in Powers Lake
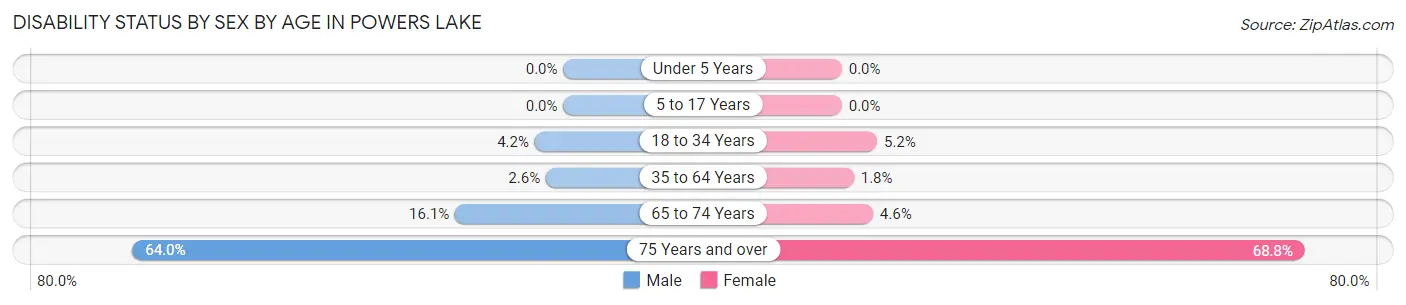
| Age Bracket | Male | Female |
| Under 5 Years | 0 (0.0%) | 0 (0.0%) |
| 5 to 17 Years | 0 (0.0%) | 0 (0.0%) |
| 18 to 34 Years | 5 (4.2%) | 8 (5.2%) |
| 35 to 64 Years | 8 (2.6%) | 5 (1.8%) |
| 65 to 74 Years | 9 (16.1%) | 9 (4.6%) |
| 75 Years and over | 16 (64.0%) | 11 (68.8%) |
Disability Class by Sex by Age in Powers Lake
Disability Class: Hearing Difficulty
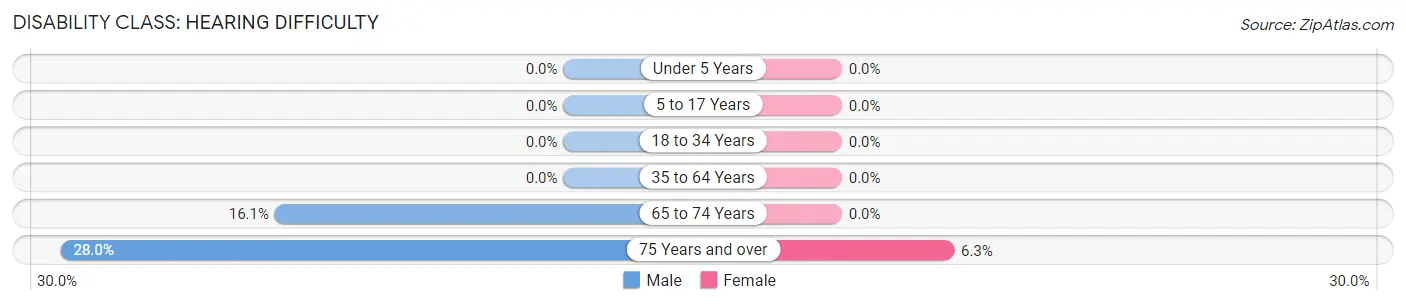
| Age Bracket | Male | Female |
| Under 5 Years | 0 (0.0%) | 0 (0.0%) |
| 5 to 17 Years | 0 (0.0%) | 0 (0.0%) |
| 18 to 34 Years | 0 (0.0%) | 0 (0.0%) |
| 35 to 64 Years | 0 (0.0%) | 0 (0.0%) |
| 65 to 74 Years | 9 (16.1%) | 0 (0.0%) |
| 75 Years and over | 7 (28.0%) | 1 (6.2%) |
Disability Class: Vision Difficulty
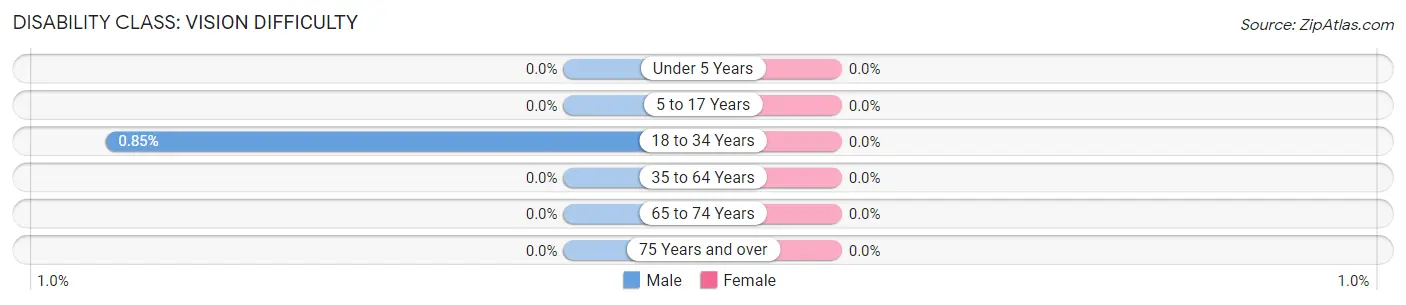
| Age Bracket | Male | Female |
| Under 5 Years | 0 (0.0%) | 0 (0.0%) |
| 5 to 17 Years | 0 (0.0%) | 0 (0.0%) |
| 18 to 34 Years | 1 (0.9%) | 0 (0.0%) |
| 35 to 64 Years | 0 (0.0%) | 0 (0.0%) |
| 65 to 74 Years | 0 (0.0%) | 0 (0.0%) |
| 75 Years and over | 0 (0.0%) | 0 (0.0%) |
Disability Class: Cognitive Difficulty
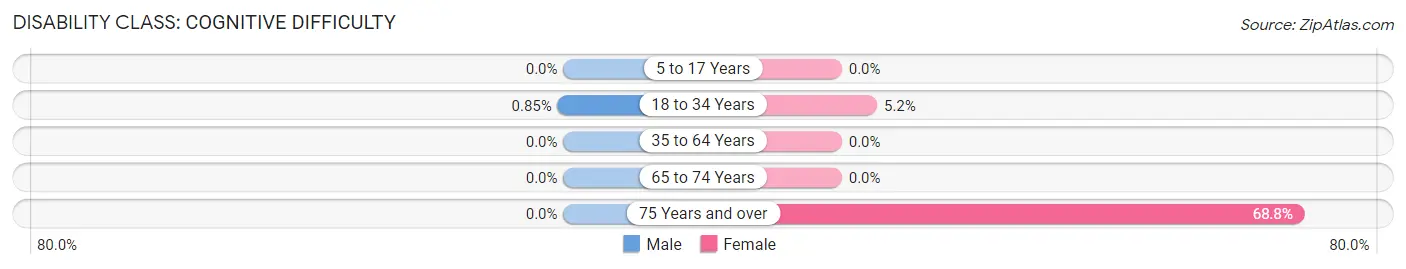
| Age Bracket | Male | Female |
| 5 to 17 Years | 0 (0.0%) | 0 (0.0%) |
| 18 to 34 Years | 1 (0.9%) | 8 (5.2%) |
| 35 to 64 Years | 0 (0.0%) | 0 (0.0%) |
| 65 to 74 Years | 0 (0.0%) | 0 (0.0%) |
| 75 Years and over | 0 (0.0%) | 11 (68.8%) |
Disability Class: Ambulatory Difficulty
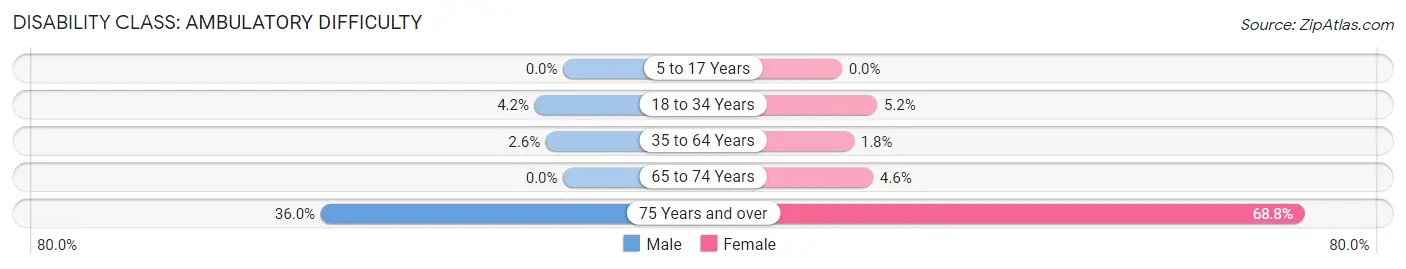
| Age Bracket | Male | Female |
| 5 to 17 Years | 0 (0.0%) | 0 (0.0%) |
| 18 to 34 Years | 5 (4.2%) | 8 (5.2%) |
| 35 to 64 Years | 8 (2.6%) | 5 (1.8%) |
| 65 to 74 Years | 0 (0.0%) | 9 (4.6%) |
| 75 Years and over | 9 (36.0%) | 11 (68.8%) |
Disability Class: Self-Care Difficulty

| Age Bracket | Male | Female |
| 5 to 17 Years | 0 (0.0%) | 0 (0.0%) |
| 18 to 34 Years | 1 (0.9%) | 8 (5.2%) |
| 35 to 64 Years | 0 (0.0%) | 5 (1.8%) |
| 65 to 74 Years | 0 (0.0%) | 0 (0.0%) |
| 75 Years and over | 0 (0.0%) | 11 (68.8%) |
Technology Access in Powers Lake
Computing Device Access in Powers Lake
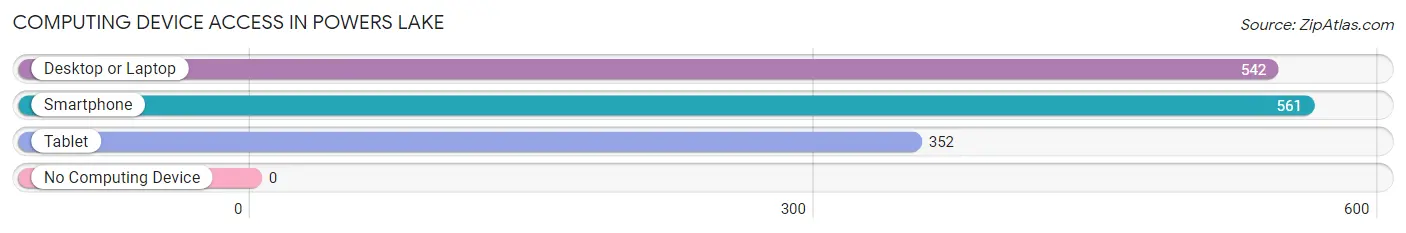
| Device Type | # Households | % Households |
| Desktop or Laptop | 542 | 96.6% |
| Smartphone | 561 | 100.0% |
| Tablet | 352 | 62.7% |
| No Computing Device | 0 | 0.0% |
| Total | 561 | 100.0% |
Internet Access in Powers Lake
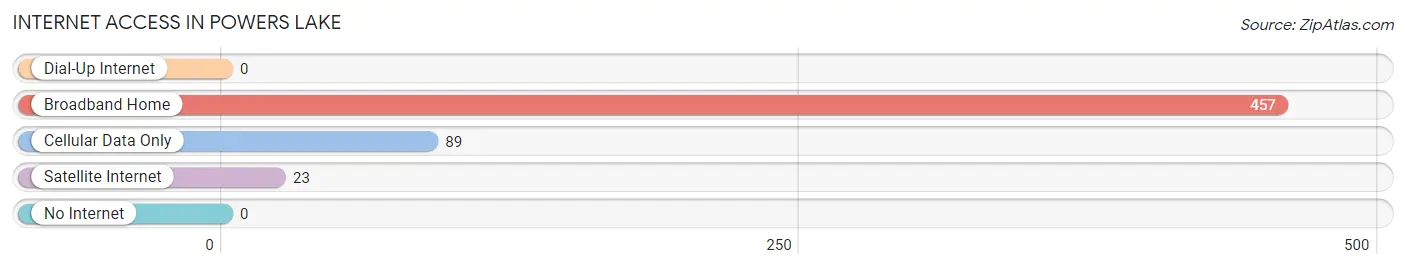
| Internet Type | # Households | % Households |
| Dial-Up Internet | 0 | 0.0% |
| Broadband Home | 457 | 81.5% |
| Cellular Data Only | 89 | 15.9% |
| Satellite Internet | 23 | 4.1% |
| No Internet | 0 | 0.0% |
| Total | 561 | 100.0% |
Powers Lake Summary
Powers Lake is a small village located in Kenosha County, Wisconsin, United States. The village is situated on the western shore of Powers Lake, a natural lake of approximately 1,000 acres. The village is located approximately 25 miles south of Milwaukee and 40 miles north of Chicago. As of the 2010 census, the village had a population of 1,845.
History
The area around Powers Lake was first settled in the early 1800s by settlers from New England. The first settler in the area was William Powers, who arrived in 1836 and established a homestead on the lake. The lake was named after him. In 1845, the first post office was established in the area, and the village was officially incorporated in 1891.
Geography
Powers Lake is located at 42°30'25"N 88°7'25"W (42.506944, -88.123611). According to the United States Census Bureau, the village has a total area of 1.2 square miles, all of it land.
Economy
The economy of Powers Lake is largely based on tourism and recreation. The village is home to several resorts and marinas, as well as a number of restaurants and shops. The village is also home to a number of small businesses, including a grocery store, a hardware store, and a gas station.
Demographics
As of the 2010 census, there were 1,845 people, 745 households, and 517 families residing in the village. The population density was 1,539.2 people per square mile. The racial makeup of the village was 97.2% White, 0.7% African American, 0.3% Native American, 0.3% Asian, 0.2% from other races, and 1.4% from two or more races. Hispanic or Latino of any race were 1.2% of the population.
The median age in the village was 44.2 years. 22.2% of residents were under the age of 18; 6.2% were between the ages of 18 and 24; 22.7% were from 25 to 44; 33.2% were from 45 to 64; and 15.7% were 65 years of age or older. The gender makeup of the village was 48.7% male and 51.3% female.
The median income for a household in the village was $60,938, and the median income for a family was $71,250. Males had a median income of $50,000 versus $35,000 for females. The per capita income for the village was $30,945. About 4.2% of families and 5.3% of the population were below the poverty line, including 6.2% of those under age 18 and 4.2% of those age 65 or over.
Common Questions
What is Per Capita Income in Powers Lake?
Per Capita income in Powers Lake is $47,996.
What is the Median Family Income in Powers Lake?
Median Family Income in Powers Lake is $103,409.
What is the Median Household income in Powers Lake?
Median Household Income in Powers Lake is $102,614.
What is Inequality or Gini Index in Powers Lake?
Inequality or Gini Index in Powers Lake is 0.37.
What is the Total Population of Powers Lake?
Total Population of Powers Lake is 1,381.
What is the Total Male Population of Powers Lake?
Total Male Population of Powers Lake is 599.
What is the Total Female Population of Powers Lake?
Total Female Population of Powers Lake is 782.
What is the Ratio of Males per 100 Females in Powers Lake?
There are 76.60 Males per 100 Females in Powers Lake.
What is the Ratio of Females per 100 Males in Powers Lake?
There are 130.55 Females per 100 Males in Powers Lake.
What is the Median Population Age in Powers Lake?
Median Population Age in Powers Lake is 49.6 Years.
What is the Average Family Size in Powers Lake
Average Family Size in Powers Lake is 2.5 People.
What is the Average Household Size in Powers Lake
Average Household Size in Powers Lake is 2.5 People.
How Large is the Labor Force in Powers Lake?
There are 914 People in the Labor Forcein in Powers Lake.
What is the Percentage of People in the Labor Force in Powers Lake?
78.4% of People are in the Labor Force in Powers Lake.
What is the Unemployment Rate in Powers Lake?
Unemployment Rate in Powers Lake is 4.9%.