Centralia, MO Map & Demographics
Centralia Map
Centralia Overview
$26,699
PER CAPITA INCOME
$69,583
AVG FAMILY INCOME
$61,172
AVG HOUSEHOLD INCOME
33.9%
WAGE / INCOME GAP [ % ]
66.1¢/ $1
WAGE / INCOME GAP [ $ ]
0.38
INEQUALITY / GINI INDEX
4,570
TOTAL POPULATION
2,170
MALE POPULATION
2,400
FEMALE POPULATION
90.42
MALES / 100 FEMALES
110.60
FEMALES / 100 MALES
38.7
MEDIAN AGE
2.8
AVG FAMILY SIZE
2.3
AVG HOUSEHOLD SIZE
2,159
LABOR FORCE [ PEOPLE ]
55.4%
PERCENT IN LABOR FORCE
4.2%
UNEMPLOYMENT RATE
Centralia Zip Codes
Centralia Area Codes
Income in Centralia
Income Overview in Centralia
Per Capita Income in Centralia is $26,699, while median incomes of families and households are $69,583 and $61,172 respectively.
| Characteristic | Number | Measure |
| Per Capita Income | 4,570 | $26,699 |
| Median Family Income | 1,270 | $69,583 |
| Mean Family Income | 1,270 | $79,151 |
| Median Household Income | 1,923 | $61,172 |
| Mean Household Income | 1,923 | $63,351 |
| Income Deficit | 1,270 | $0 |
| Wage / Income Gap (%) | 4,570 | 33.95% |
| Wage / Income Gap ($) | 4,570 | 66.05¢ per $1 |
| Gini / Inequality Index | 4,570 | 0.38 |
Earnings by Sex in Centralia
Average Earnings in Centralia are $37,752, $40,260 for men and $26,592 for women, a difference of 34.0%.
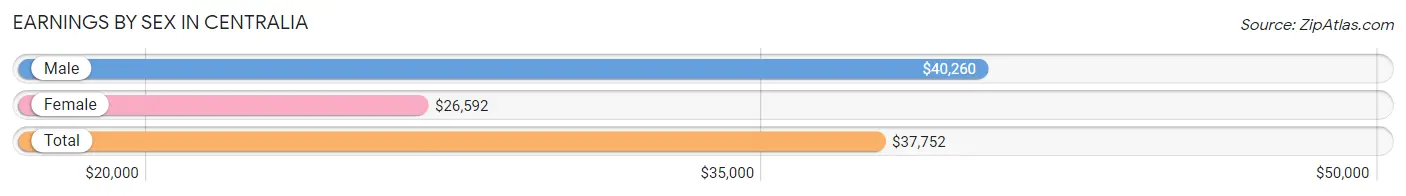
| Sex | Number | Average Earnings |
| Male | 1,307 (53.6%) | $40,260 |
| Female | 1,133 (46.4%) | $26,592 |
| Total | 2,440 (100.0%) | $37,752 |
Earnings by Sex by Income Bracket in Centralia
The most common earnings brackets in Centralia are $2,499 or less for men (218 | 16.7%) and $25,000 to $29,999 for women (171 | 15.1%).
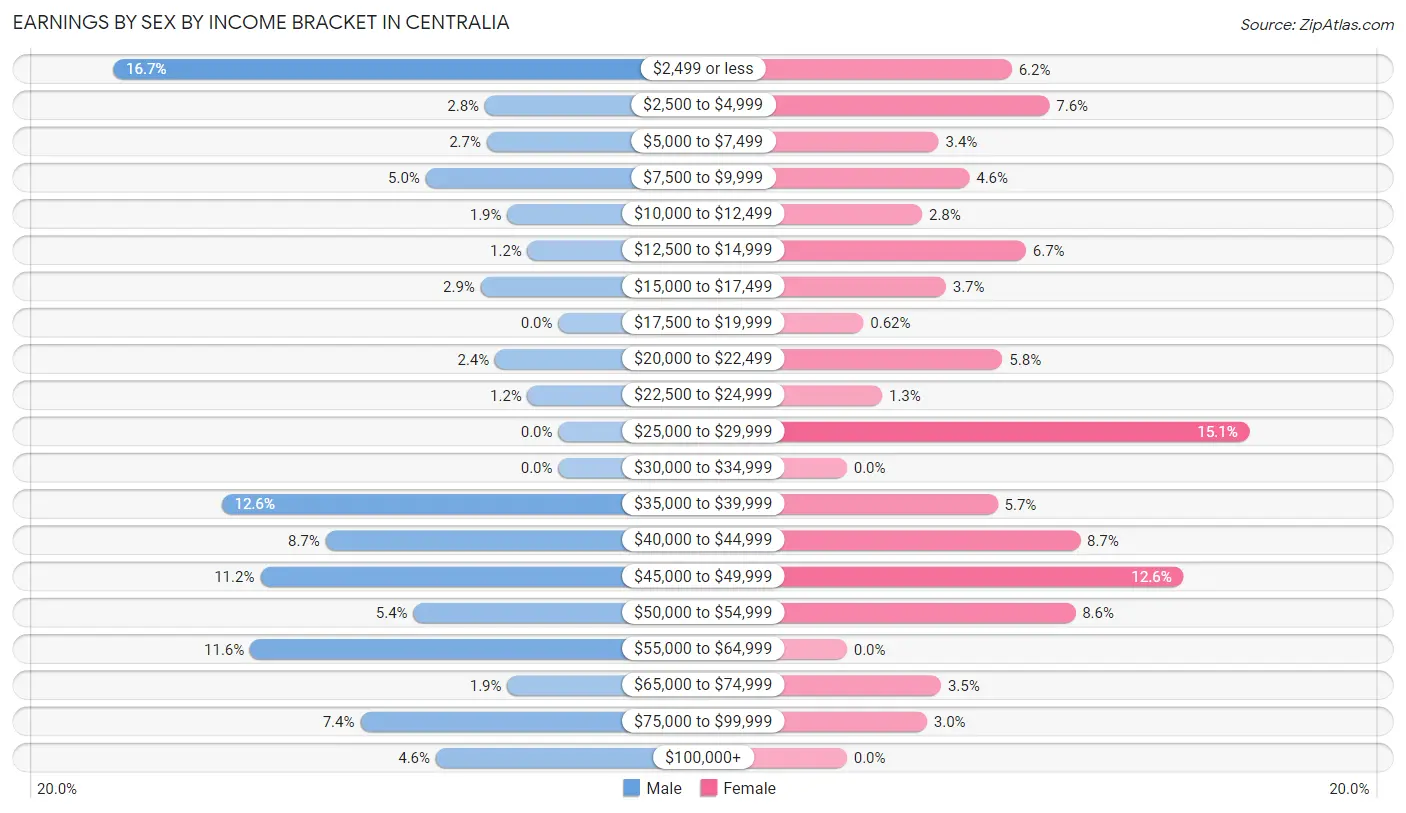
| Income | Male | Female |
| $2,499 or less | 218 (16.7%) | 70 (6.2%) |
| $2,500 to $4,999 | 36 (2.8%) | 86 (7.6%) |
| $5,000 to $7,499 | 35 (2.7%) | 39 (3.4%) |
| $7,500 to $9,999 | 65 (5.0%) | 52 (4.6%) |
| $10,000 to $12,499 | 25 (1.9%) | 32 (2.8%) |
| $12,500 to $14,999 | 15 (1.1%) | 76 (6.7%) |
| $15,000 to $17,499 | 38 (2.9%) | 42 (3.7%) |
| $17,500 to $19,999 | 0 (0.0%) | 7 (0.6%) |
| $20,000 to $22,499 | 31 (2.4%) | 66 (5.8%) |
| $22,500 to $24,999 | 15 (1.1%) | 15 (1.3%) |
| $25,000 to $29,999 | 0 (0.0%) | 171 (15.1%) |
| $30,000 to $34,999 | 0 (0.0%) | 0 (0.0%) |
| $35,000 to $39,999 | 165 (12.6%) | 64 (5.7%) |
| $40,000 to $44,999 | 114 (8.7%) | 99 (8.7%) |
| $45,000 to $49,999 | 146 (11.2%) | 143 (12.6%) |
| $50,000 to $54,999 | 71 (5.4%) | 97 (8.6%) |
| $55,000 to $64,999 | 151 (11.6%) | 0 (0.0%) |
| $65,000 to $74,999 | 25 (1.9%) | 40 (3.5%) |
| $75,000 to $99,999 | 97 (7.4%) | 34 (3.0%) |
| $100,000+ | 60 (4.6%) | 0 (0.0%) |
| Total | 1,307 (100.0%) | 1,133 (100.0%) |
Earnings by Sex by Educational Attainment in Centralia
Average earnings in Centralia are $45,754 for men and $37,037 for women, a difference of 19.1%. Men with an educational attainment of bachelor's degree enjoy the highest average annual earnings of $72,450, while those with high school diploma education earn the least with $38,351. Women with an educational attainment of bachelor's degree earn the most with the average annual earnings of $50,889, while those with high school diploma education have the smallest earnings of $25,897.
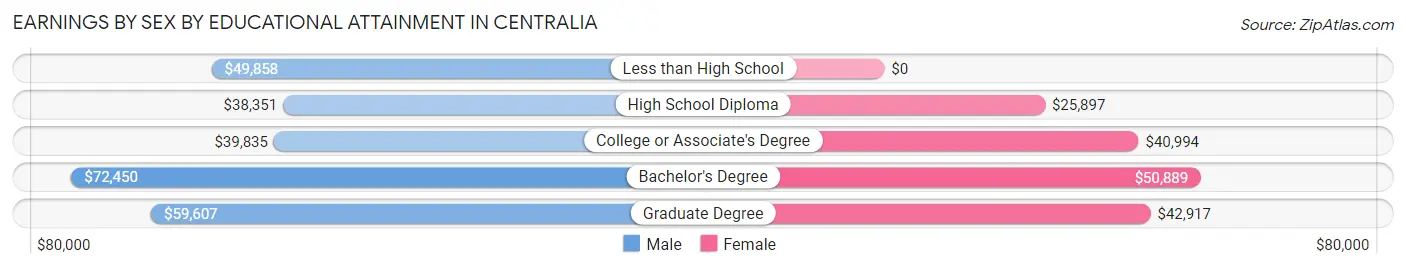
| Educational Attainment | Male Income | Female Income |
| Less than High School | $49,858 | $0 |
| High School Diploma | $38,351 | $25,897 |
| College or Associate's Degree | $39,835 | $40,994 |
| Bachelor's Degree | $72,450 | $50,889 |
| Graduate Degree | $59,607 | $42,917 |
| Total | $45,754 | $37,037 |
Family Income in Centralia
Family Income Brackets in Centralia
According to the Centralia family income data, there are 387 families falling into the $50,000 to $74,999 income range, which is the most common income bracket and makes up 30.5% of all families.
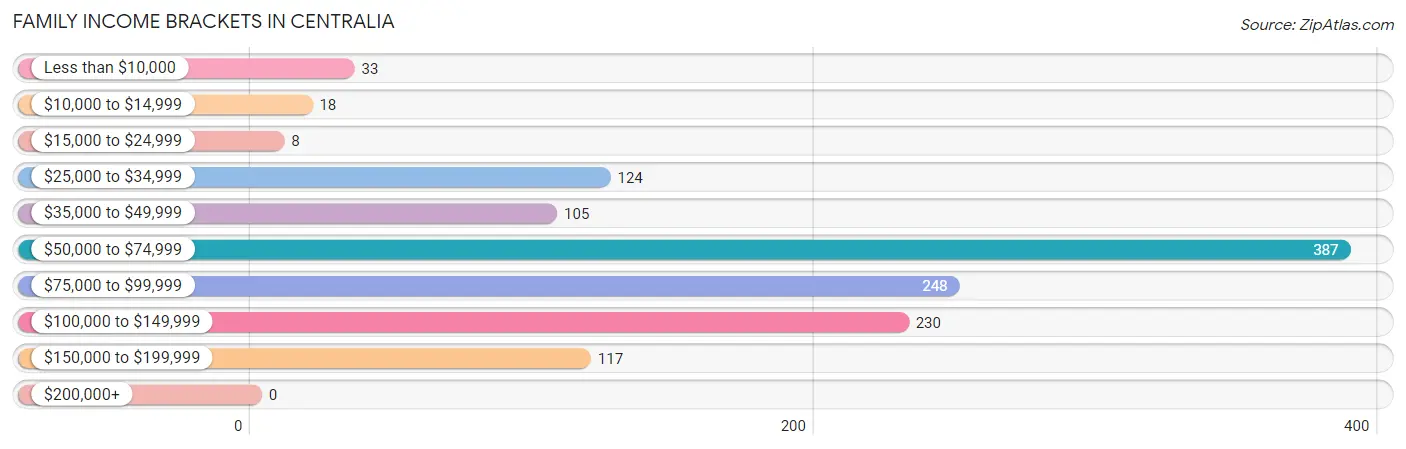
| Income Bracket | # Families | % Families |
| Less than $10,000 | 33 | 2.6% |
| $10,000 to $14,999 | 18 | 1.4% |
| $15,000 to $24,999 | 8 | 0.6% |
| $25,000 to $34,999 | 124 | 9.8% |
| $35,000 to $49,999 | 105 | 8.3% |
| $50,000 to $74,999 | 387 | 30.5% |
| $75,000 to $99,999 | 248 | 19.5% |
| $100,000 to $149,999 | 230 | 18.1% |
| $150,000 to $199,999 | 117 | 9.2% |
| $200,000+ | 0 | 0.0% |
Family Income by Famaliy Size in Centralia
3-person families (224 | 17.6%) account for the highest median family income in Centralia with $101,667 per family, while 3-person families (224 | 17.6%) have the highest median income of $33,889 per family member.
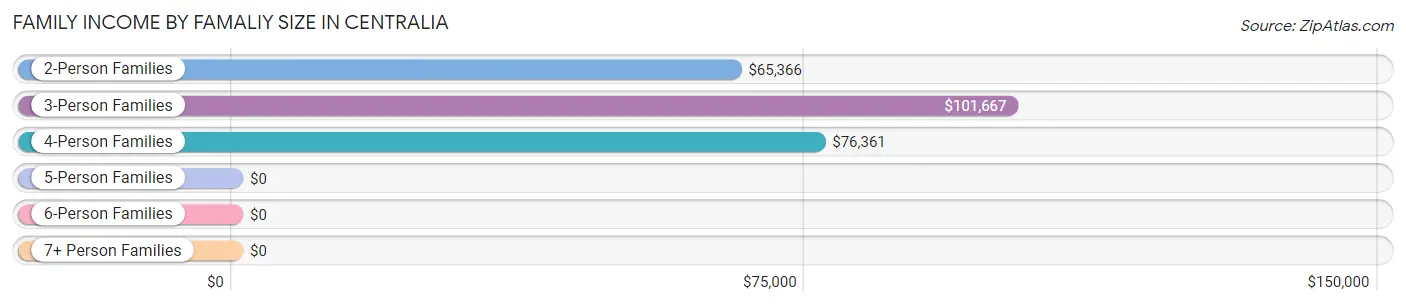
| Income Bracket | # Families | Median Income |
| 2-Person Families | 661 (52.0%) | $65,366 |
| 3-Person Families | 224 (17.6%) | $101,667 |
| 4-Person Families | 303 (23.9%) | $76,361 |
| 5-Person Families | 60 (4.7%) | $0 |
| 6-Person Families | 0 (0.0%) | $0 |
| 7+ Person Families | 22 (1.7%) | $0 |
| Total | 1,270 (100.0%) | $69,583 |
Family Income by Number of Earners in Centralia
The median family income in Centralia is $69,583, with families comprising 3+ earners (255) having the highest median family income of $116,138, while families with 1 earner (265) have the lowest median family income of $55,221, accounting for 20.1% and 20.9% of families, respectively.
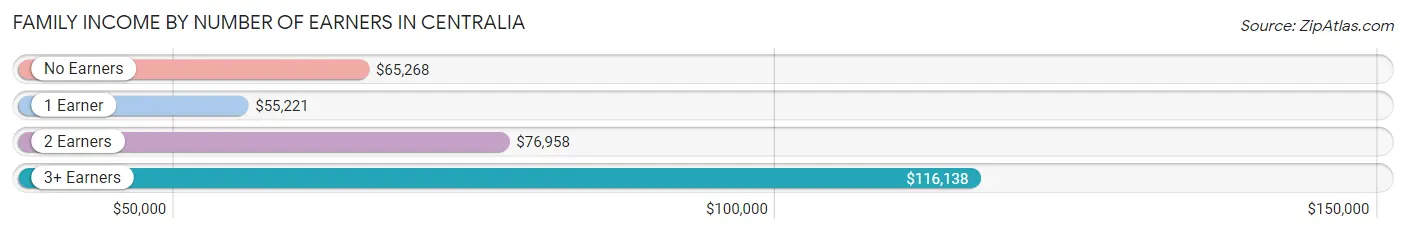
| Number of Earners | # Families | Median Income |
| No Earners | 328 (25.8%) | $65,268 |
| 1 Earner | 265 (20.9%) | $55,221 |
| 2 Earners | 422 (33.2%) | $76,958 |
| 3+ Earners | 255 (20.1%) | $116,138 |
| Total | 1,270 (100.0%) | $69,583 |
Household Income in Centralia
Household Income Brackets in Centralia
With 463 households falling in the category, the $50,000 to $74,999 income range is the most frequent in Centralia, accounting for 24.1% of all households.
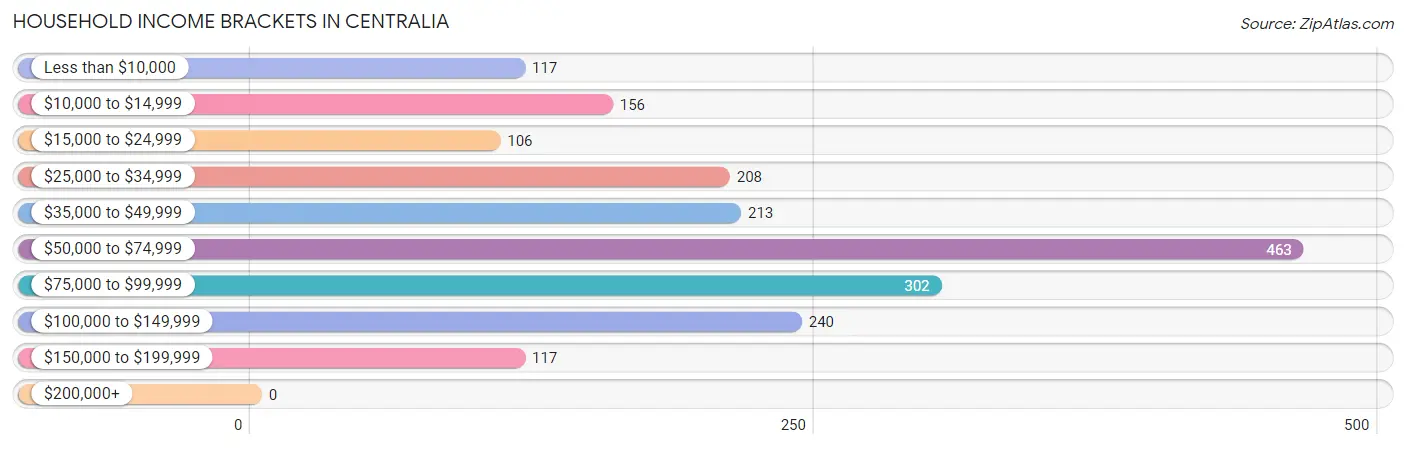
| Income Bracket | # Households | % Households |
| Less than $10,000 | 117 | 6.1% |
| $10,000 to $14,999 | 156 | 8.1% |
| $15,000 to $24,999 | 106 | 5.5% |
| $25,000 to $34,999 | 208 | 10.8% |
| $35,000 to $49,999 | 213 | 11.1% |
| $50,000 to $74,999 | 463 | 24.1% |
| $75,000 to $99,999 | 302 | 15.7% |
| $100,000 to $149,999 | 240 | 12.5% |
| $150,000 to $199,999 | 117 | 6.1% |
| $200,000+ | 0 | 0.0% |
Household Income by Householder Age in Centralia
The median household income in Centralia is $61,172, with the highest median household income of $76,130 found in the 25 to 44 years age bracket for the primary householder. A total of 611 households (31.8%) fall into this category. Meanwhile, the 15 to 24 years age bracket for the primary householder has the lowest median household income of $27,995, with 85 households (4.4%) in this group.
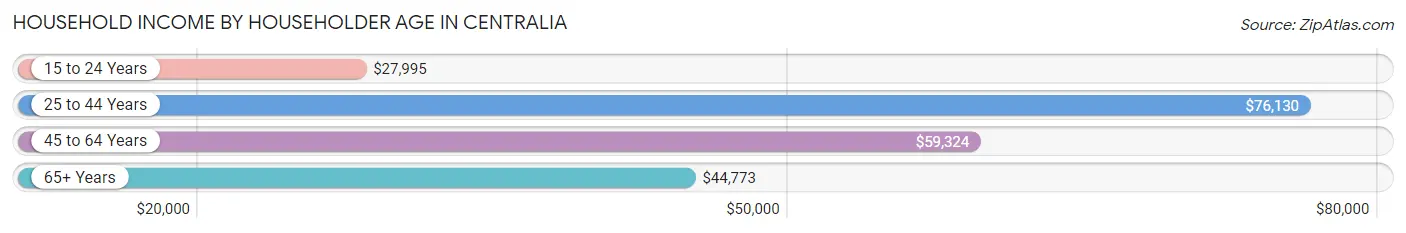
| Income Bracket | # Households | Median Income |
| 15 to 24 Years | 85 (4.4%) | $27,995 |
| 25 to 44 Years | 611 (31.8%) | $76,130 |
| 45 to 64 Years | 603 (31.4%) | $59,324 |
| 65+ Years | 624 (32.5%) | $44,773 |
| Total | 1,923 (100.0%) | $61,172 |
Poverty in Centralia
Income Below Poverty by Sex and Age in Centralia
With 13.8% poverty level for males and 9.6% for females among the residents of Centralia, 45 to 54 year old males and 18 to 24 year old females are the most vulnerable to poverty, with 68 males (51.9%) and 86 females (46.2%) in their respective age groups living below the poverty level.
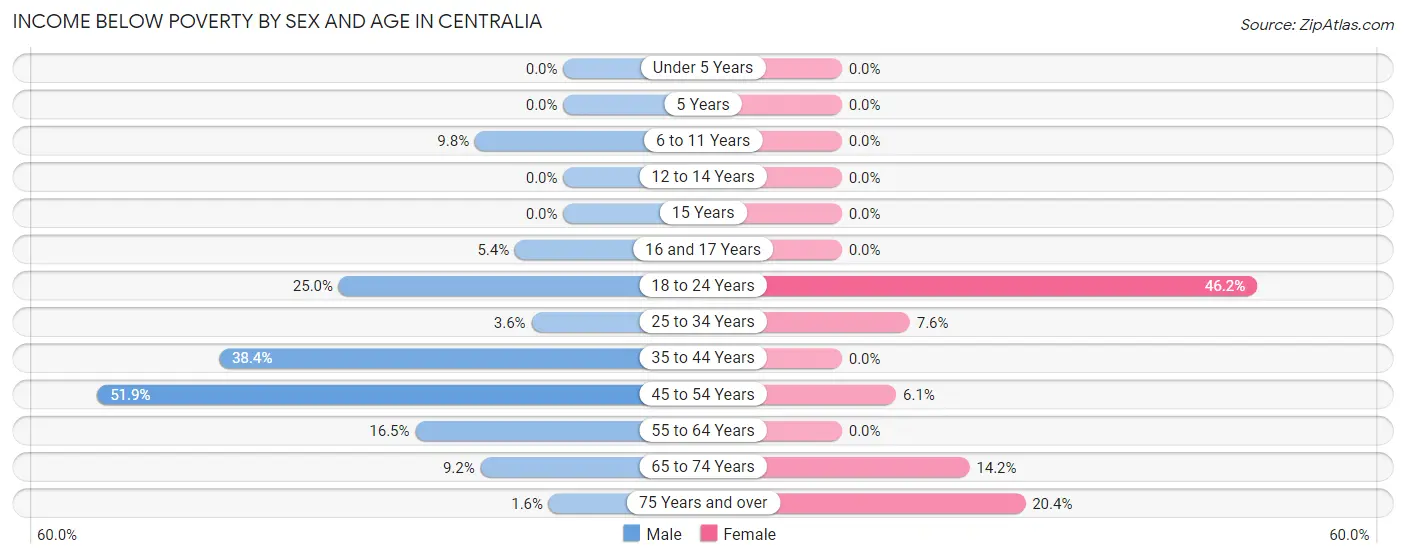
| Age Bracket | Male | Female |
| Under 5 Years | 0 (0.0%) | 0 (0.0%) |
| 5 Years | 0 (0.0%) | 0 (0.0%) |
| 6 to 11 Years | 12 (9.8%) | 0 (0.0%) |
| 12 to 14 Years | 0 (0.0%) | 0 (0.0%) |
| 15 Years | 0 (0.0%) | 0 (0.0%) |
| 16 and 17 Years | 10 (5.4%) | 0 (0.0%) |
| 18 to 24 Years | 32 (25.0%) | 86 (46.2%) |
| 25 to 34 Years | 16 (3.5%) | 29 (7.6%) |
| 35 to 44 Years | 79 (38.4%) | 0 (0.0%) |
| 45 to 54 Years | 68 (51.9%) | 19 (6.0%) |
| 55 to 64 Years | 58 (16.5%) | 0 (0.0%) |
| 65 to 74 Years | 20 (9.2%) | 51 (14.2%) |
| 75 Years and over | 2 (1.6%) | 38 (20.4%) |
| Total | 297 (13.8%) | 223 (9.6%) |
Income Above Poverty by Sex and Age in Centralia
According to the poverty statistics in Centralia, males aged under 5 years and females aged under 5 years are the age groups that are most secure financially, with 100.0% of males and 100.0% of females in these age groups living above the poverty line.
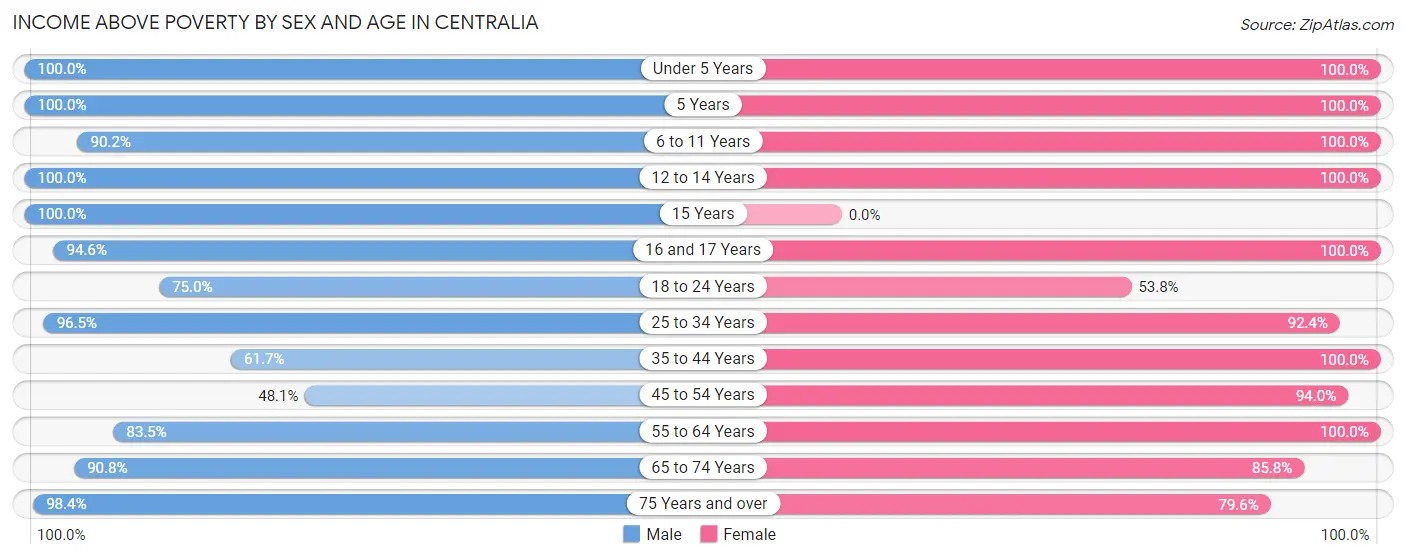
| Age Bracket | Male | Female |
| Under 5 Years | 64 (100.0%) | 227 (100.0%) |
| 5 Years | 47 (100.0%) | 39 (100.0%) |
| 6 to 11 Years | 110 (90.2%) | 16 (100.0%) |
| 12 to 14 Years | 48 (100.0%) | 3 (100.0%) |
| 15 Years | 73 (100.0%) | 0 (0.0%) |
| 16 and 17 Years | 176 (94.6%) | 61 (100.0%) |
| 18 to 24 Years | 96 (75.0%) | 100 (53.8%) |
| 25 to 34 Years | 435 (96.5%) | 354 (92.4%) |
| 35 to 44 Years | 127 (61.7%) | 225 (100.0%) |
| 45 to 54 Years | 63 (48.1%) | 295 (94.0%) |
| 55 to 64 Years | 294 (83.5%) | 323 (100.0%) |
| 65 to 74 Years | 197 (90.8%) | 308 (85.8%) |
| 75 Years and over | 122 (98.4%) | 148 (79.6%) |
| Total | 1,852 (86.2%) | 2,099 (90.4%) |
Income Below Poverty Among Married-Couple Families in Centralia
The poverty statistics for married-couple families in Centralia show that 3.2% or 32 of the total 988 families live below the poverty line. Families with 1 or 2 children have the highest poverty rate of 4.2%, comprising of 14 families. On the other hand, families with 3 or 4 children have the lowest poverty rate of 0.0%, which includes 0 families.
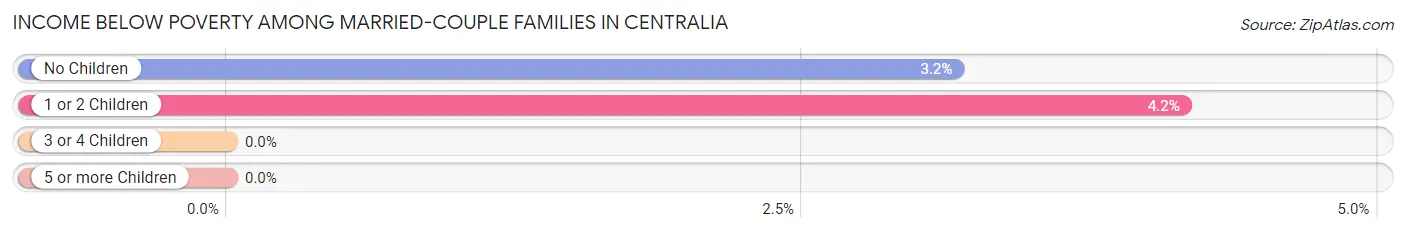
| Children | Above Poverty | Below Poverty |
| No Children | 551 (96.8%) | 18 (3.2%) |
| 1 or 2 Children | 323 (95.9%) | 14 (4.2%) |
| 3 or 4 Children | 82 (100.0%) | 0 (0.0%) |
| 5 or more Children | 0 (0.0%) | 0 (0.0%) |
| Total | 956 (96.8%) | 32 (3.2%) |
Income Below Poverty Among Single-Parent Households in Centralia
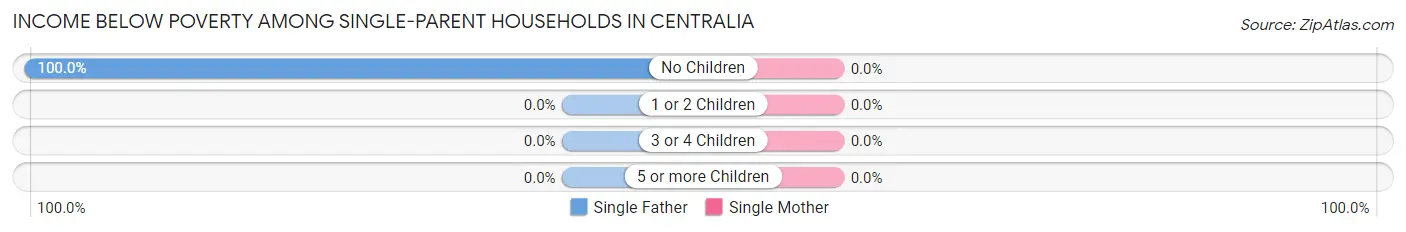
| Children | Single Father | Single Mother |
| No Children | 19 (100.0%) | 0 (0.0%) |
| 1 or 2 Children | 0 (0.0%) | 0 (0.0%) |
| 3 or 4 Children | 0 (0.0%) | 0 (0.0%) |
| 5 or more Children | 0 (0.0%) | 0 (0.0%) |
| Total | 19 (100.0%) | 0 (0.0%) |
Income Below Poverty Among Married-Couple vs Single-Parent Households in Centralia
The poverty data for Centralia shows that 32 of the married-couple family households (3.2%) and 19 of the single-parent households (6.7%) are living below the poverty level. Within the married-couple family households, those with 1 or 2 children have the highest poverty rate, with 14 households (4.2%) falling below the poverty line. Among the single-parent households, those with no children have the highest poverty rate, with 19 household (16.4%) living below poverty.
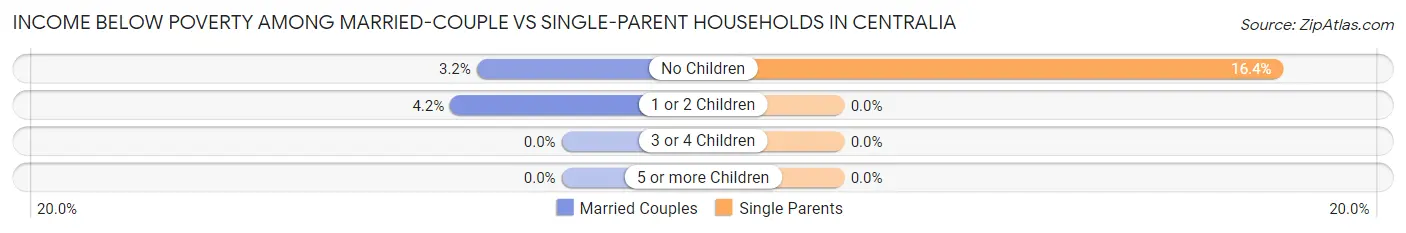
| Children | Married-Couple Families | Single-Parent Households |
| No Children | 18 (3.2%) | 19 (16.4%) |
| 1 or 2 Children | 14 (4.2%) | 0 (0.0%) |
| 3 or 4 Children | 0 (0.0%) | 0 (0.0%) |
| 5 or more Children | 0 (0.0%) | 0 (0.0%) |
| Total | 32 (3.2%) | 19 (6.7%) |
Race in Centralia
The most populous races in Centralia are White / Caucasian (4,076 | 89.2%), Two or more Races (452 | 9.9%), and Some other Race (41 | 0.9%).
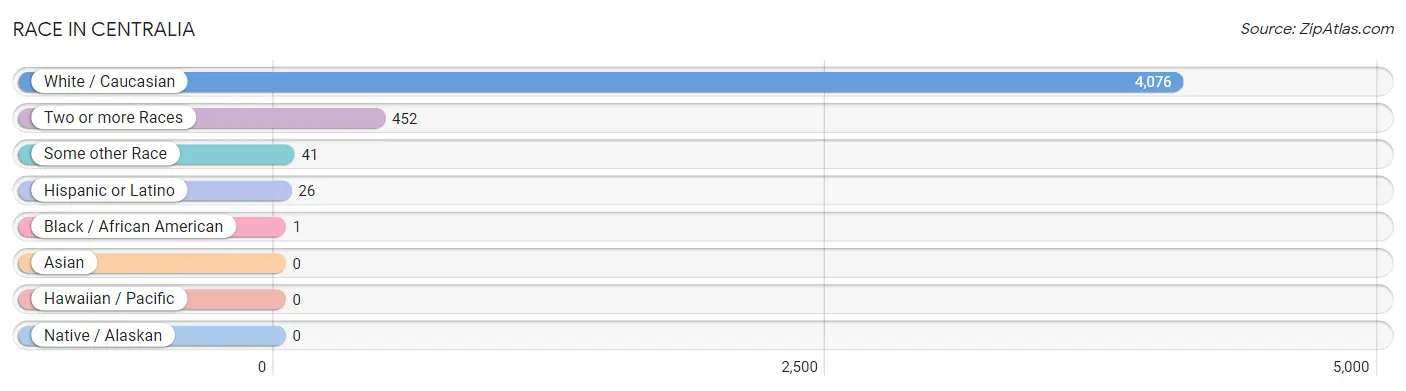
| Race | # Population | % Population |
| Asian | 0 | 0.0% |
| Black / African American | 1 | 0.0% |
| Hawaiian / Pacific | 0 | 0.0% |
| Hispanic or Latino | 26 | 0.6% |
| Native / Alaskan | 0 | 0.0% |
| White / Caucasian | 4,076 | 89.2% |
| Two or more Races | 452 | 9.9% |
| Some other Race | 41 | 0.9% |
| Total | 4,570 | 100.0% |
Ancestry in Centralia
The most populous ancestries reported in Centralia are German (969 | 21.2%), American (522 | 11.4%), Irish (465 | 10.2%), English (355 | 7.8%), and European (256 | 5.6%), together accounting for 56.2% of all Centralia residents.
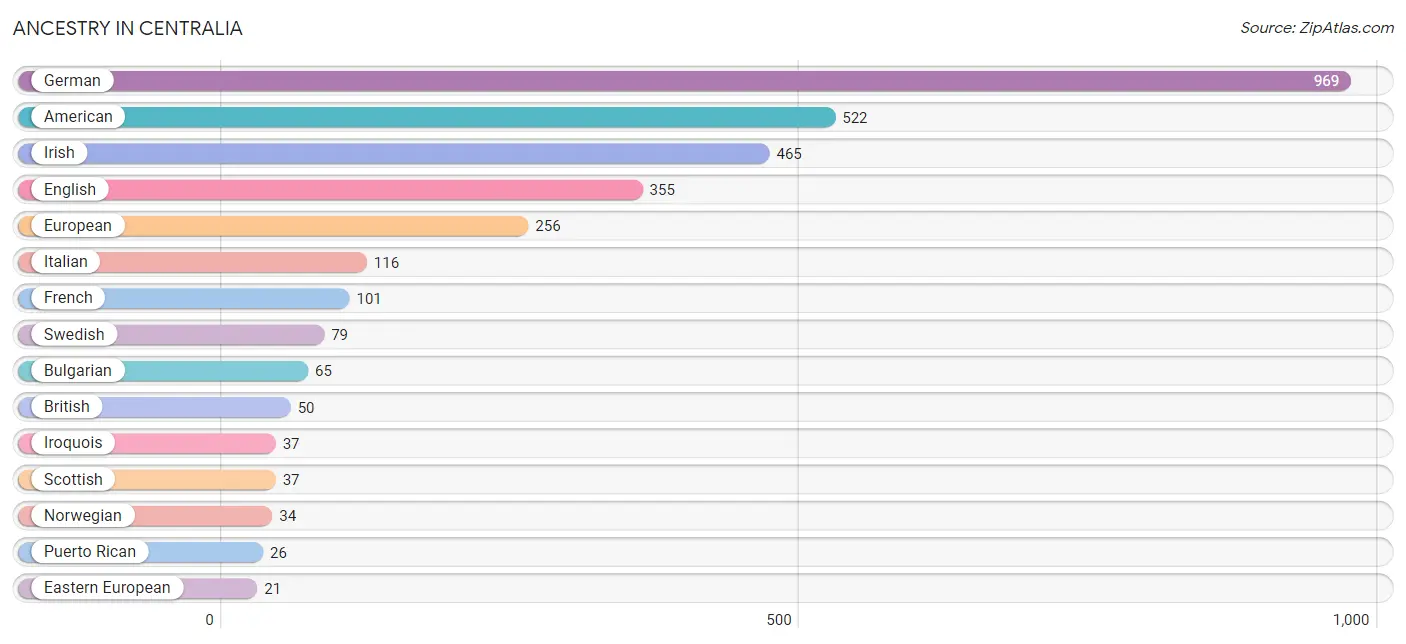
| Ancestry | # Population | % Population |
| American | 522 | 11.4% |
| British | 50 | 1.1% |
| Bulgarian | 65 | 1.4% |
| Dutch | 17 | 0.4% |
| Eastern European | 21 | 0.5% |
| English | 355 | 7.8% |
| European | 256 | 5.6% |
| French | 101 | 2.2% |
| German | 969 | 21.2% |
| Irish | 465 | 10.2% |
| Iroquois | 37 | 0.8% |
| Italian | 116 | 2.5% |
| Norwegian | 34 | 0.7% |
| Puerto Rican | 26 | 0.6% |
| Scandinavian | 15 | 0.3% |
| Scottish | 37 | 0.8% |
| Swedish | 79 | 1.7% | View All 17 Rows |
Immigrants in Centralia
The most numerous immigrant groups reported in Centralia came from Europe (46 | 1.0%), Bulgaria (39 | 0.9%), Eastern Europe (39 | 0.9%), Germany (7 | 0.2%), and Western Europe (7 | 0.2%), together accounting for 3.0% of all Centralia residents.
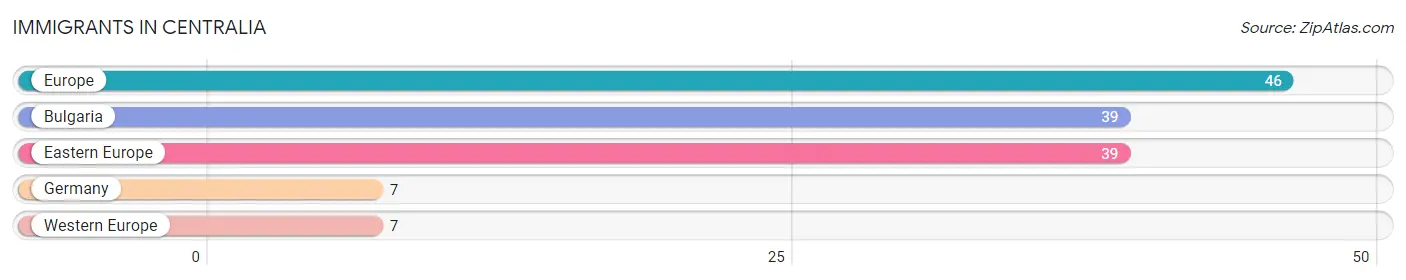
| Immigration Origin | # Population | % Population |
| Bulgaria | 39 | 0.9% |
| Eastern Europe | 39 | 0.9% |
| Europe | 46 | 1.0% |
| Germany | 7 | 0.2% |
| Western Europe | 7 | 0.2% | View All 5 Rows |
Sex and Age in Centralia
Sex and Age in Centralia
The most populous age groups in Centralia are 15 to 19 Years (310 | 14.3%) for men and Under 5 Years (245 | 10.2%) for women.
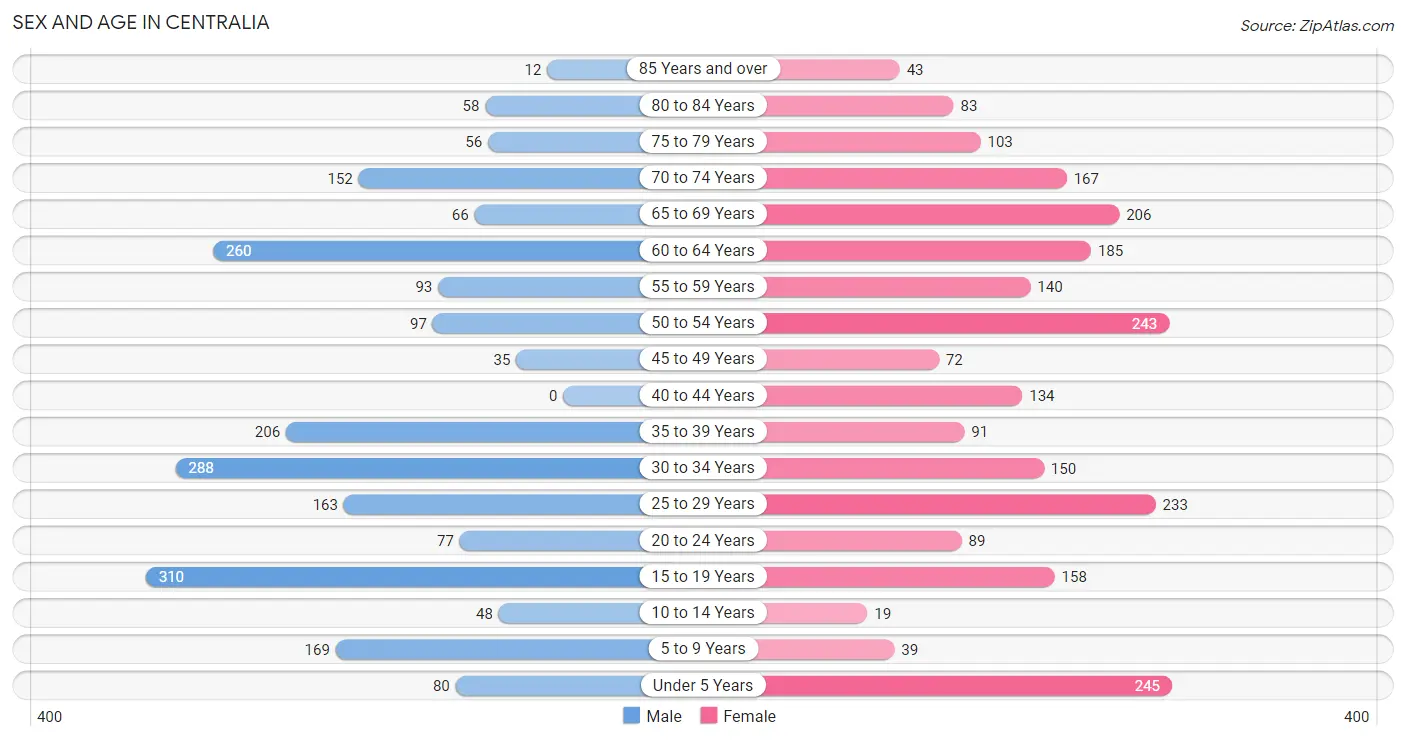
| Age Bracket | Male | Female |
| Under 5 Years | 80 (3.7%) | 245 (10.2%) |
| 5 to 9 Years | 169 (7.8%) | 39 (1.6%) |
| 10 to 14 Years | 48 (2.2%) | 19 (0.8%) |
| 15 to 19 Years | 310 (14.3%) | 158 (6.6%) |
| 20 to 24 Years | 77 (3.5%) | 89 (3.7%) |
| 25 to 29 Years | 163 (7.5%) | 233 (9.7%) |
| 30 to 34 Years | 288 (13.3%) | 150 (6.2%) |
| 35 to 39 Years | 206 (9.5%) | 91 (3.8%) |
| 40 to 44 Years | 0 (0.0%) | 134 (5.6%) |
| 45 to 49 Years | 35 (1.6%) | 72 (3.0%) |
| 50 to 54 Years | 97 (4.5%) | 243 (10.1%) |
| 55 to 59 Years | 93 (4.3%) | 140 (5.8%) |
| 60 to 64 Years | 260 (12.0%) | 185 (7.7%) |
| 65 to 69 Years | 66 (3.0%) | 206 (8.6%) |
| 70 to 74 Years | 152 (7.0%) | 167 (7.0%) |
| 75 to 79 Years | 56 (2.6%) | 103 (4.3%) |
| 80 to 84 Years | 58 (2.7%) | 83 (3.5%) |
| 85 Years and over | 12 (0.5%) | 43 (1.8%) |
| Total | 2,170 (100.0%) | 2,400 (100.0%) |
Families and Households in Centralia
Median Family Size in Centralia
The median family size in Centralia is 2.83 persons per family, with married-couple families (988 | 77.8%) accounting for the largest median family size of 2.89 persons per family. On the other hand, single female/mother families (263 | 20.7%) represent the smallest median family size with 2.61 persons per family.
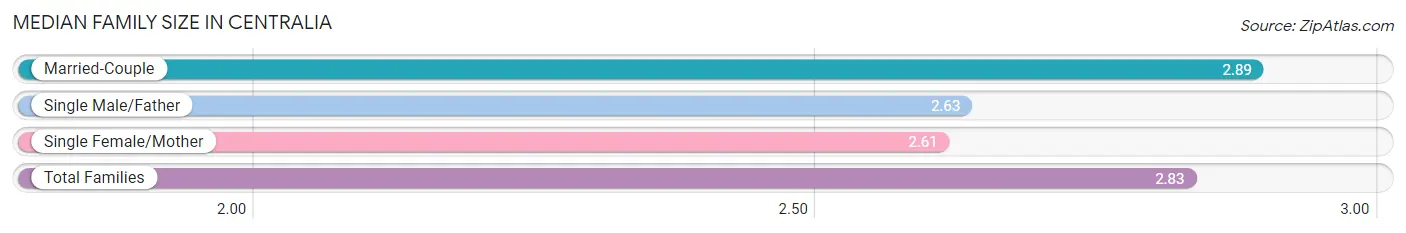
| Family Type | # Families | Family Size |
| Married-Couple | 988 (77.8%) | 2.89 |
| Single Male/Father | 19 (1.5%) | 2.63 |
| Single Female/Mother | 263 (20.7%) | 2.61 |
| Total Families | 1,270 (100.0%) | 2.83 |
Median Household Size in Centralia
The median household size in Centralia is 2.34 persons per household, with married-couple households (988 | 51.4%) accounting for the largest median household size of 2.89 persons per household. non-family households (653 | 34.0%) represent the smallest median household size with 1.31 persons per household.
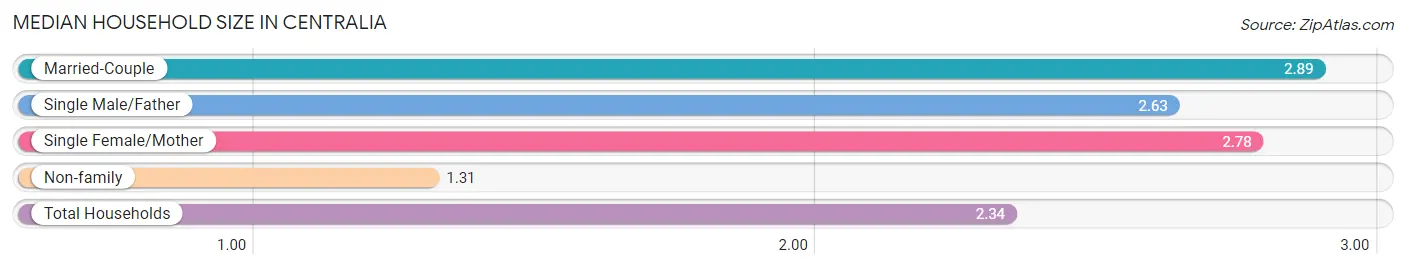
| Household Type | # Households | Household Size |
| Married-Couple | 988 (51.4%) | 2.89 |
| Single Male/Father | 19 (1.0%) | 2.63 |
| Single Female/Mother | 263 (13.7%) | 2.78 |
| Non-family | 653 (34.0%) | 1.31 |
| Total Households | 1,923 (100.0%) | 2.34 |
Household Size by Marriage Status in Centralia
Out of a total of 1,923 households in Centralia, 1,270 (66.0%) are family households, while 653 (34.0%) are nonfamily households. The most numerous type of family households are 2-person households, comprising 661, and the most common type of nonfamily households are 1-person households, comprising 520.
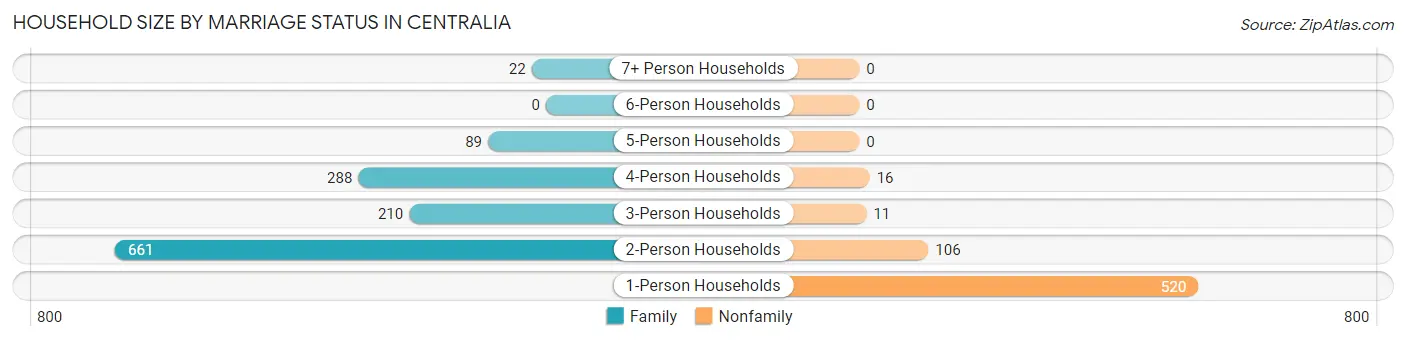
| Household Size | Family Households | Nonfamily Households |
| 1-Person Households | - | 520 (27.0%) |
| 2-Person Households | 661 (34.4%) | 106 (5.5%) |
| 3-Person Households | 210 (10.9%) | 11 (0.6%) |
| 4-Person Households | 288 (15.0%) | 16 (0.8%) |
| 5-Person Households | 89 (4.6%) | 0 (0.0%) |
| 6-Person Households | 0 (0.0%) | 0 (0.0%) |
| 7+ Person Households | 22 (1.1%) | 0 (0.0%) |
| Total | 1,270 (66.0%) | 653 (34.0%) |
Female Fertility in Centralia
Fertility by Age in Centralia
Average fertility rate in Centralia is 115.0 births per 1,000 women. Women in the age bracket of 20 to 34 years have the highest fertility rate with 227.0 births per 1,000 women. Women in the age bracket of 20 to 34 years acount for 100.0% of all women with births.
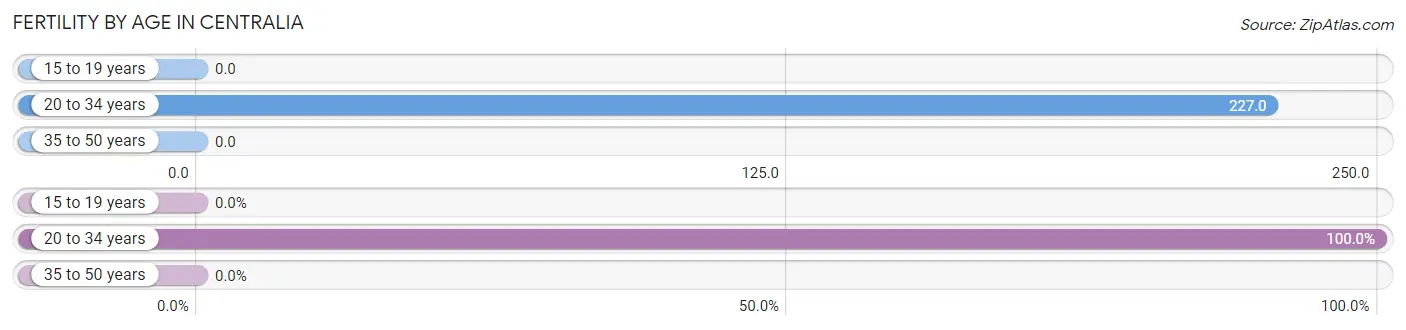
| Age Bracket | Women with Births | Births / 1,000 Women |
| 15 to 19 years | 0 (0.0%) | 0.0 |
| 20 to 34 years | 107 (100.0%) | 227.0 |
| 35 to 50 years | 0 (0.0%) | 0.0 |
| Total | 107 (100.0%) | 115.0 |
Fertility by Age by Marriage Status in Centralia
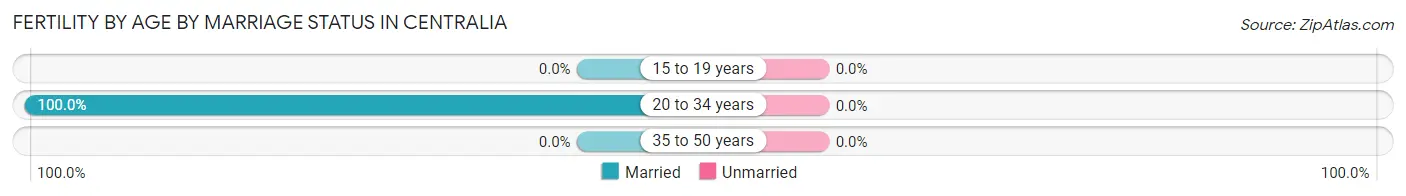
| Age Bracket | Married | Unmarried |
| 15 to 19 years | 0 (0.0%) | 0 (0.0%) |
| 20 to 34 years | 107 (100.0%) | 0 (0.0%) |
| 35 to 50 years | 0 (0.0%) | 0 (0.0%) |
| Total | 107 (100.0%) | 0 (0.0%) |
Fertility by Education in Centralia
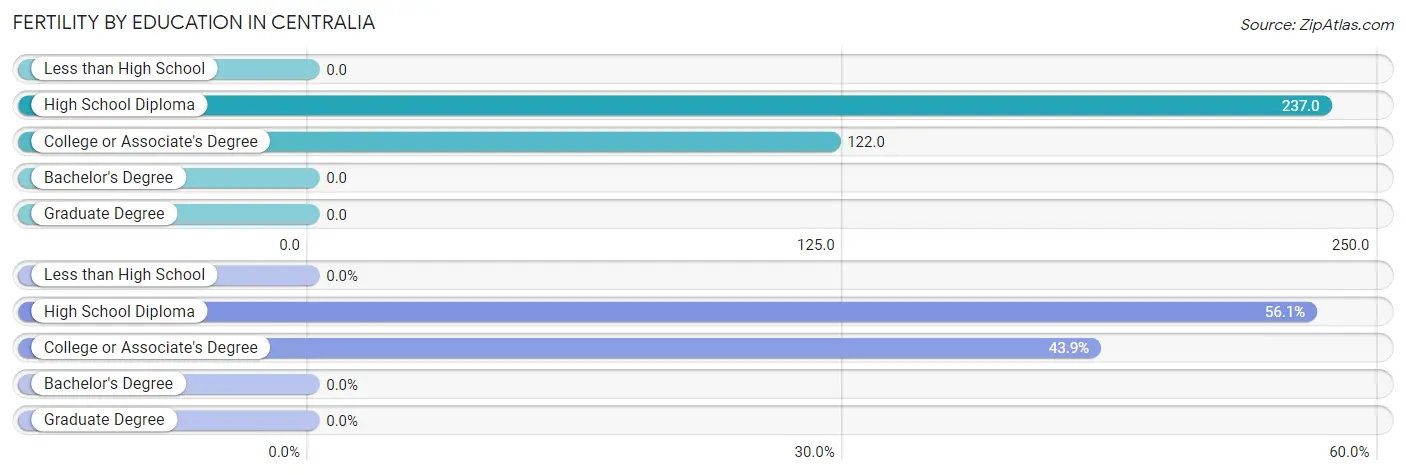
| Educational Attainment | Women with Births | Births / 1,000 Women |
| Less than High School | 0 (0.0%) | 0.0 |
| High School Diploma | 60 (56.1%) | 237.0 |
| College or Associate's Degree | 47 (43.9%) | 122.0 |
| Bachelor's Degree | 0 (0.0%) | 0.0 |
| Graduate Degree | 0 (0.0%) | 0.0 |
| Total | 107 (100.0%) | 115.0 |
Fertility by Education by Marriage Status in Centralia
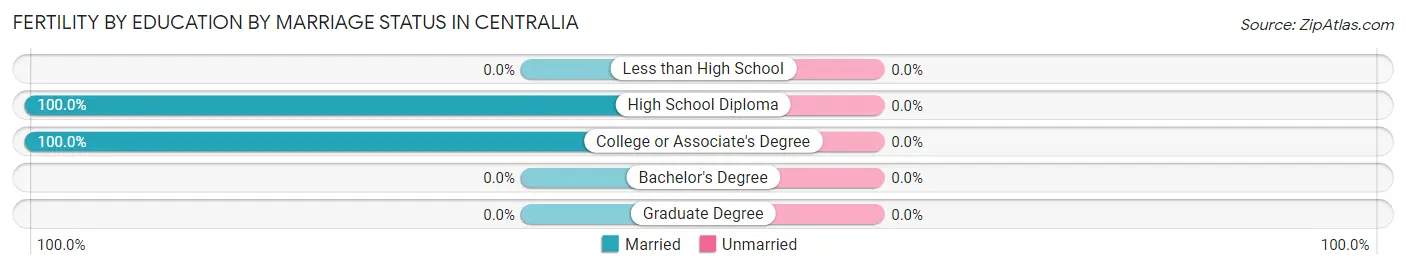
| Educational Attainment | Married | Unmarried |
| Less than High School | 0 (0.0%) | 0 (0.0%) |
| High School Diploma | 60 (100.0%) | 0 (0.0%) |
| College or Associate's Degree | 47 (100.0%) | 0 (0.0%) |
| Bachelor's Degree | 0 (0.0%) | 0 (0.0%) |
| Graduate Degree | 0 (0.0%) | 0 (0.0%) |
| Total | 107 (100.0%) | 0 (0.0%) |
Employment Characteristics in Centralia
Employment by Class of Employer in Centralia
Among the 2,034 employed individuals in Centralia, private company employees (1,437 | 70.7%), local government employees (224 | 11.0%), and not-for-profit organizations (176 | 8.6%) make up the most common classes of employment.
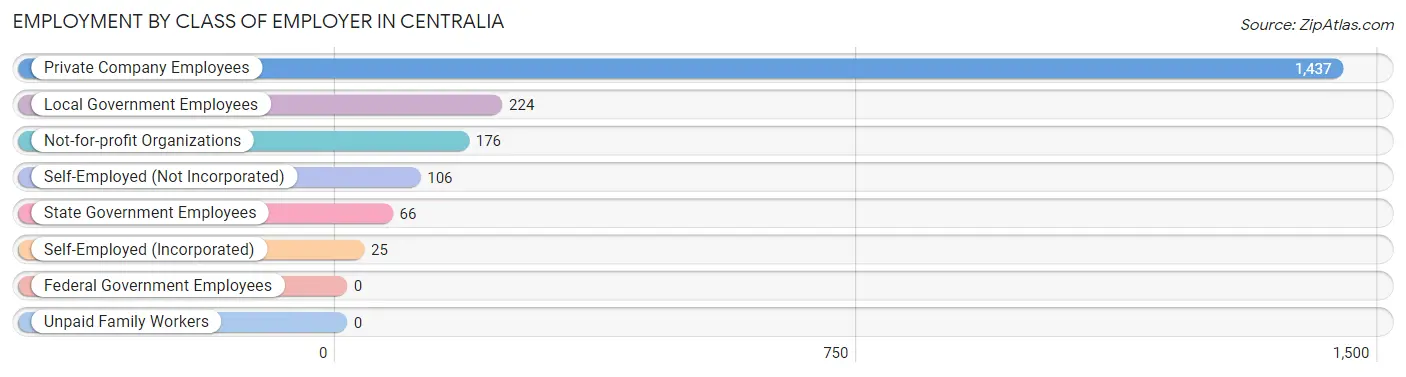
| Employer Class | # Employees | % Employees |
| Private Company Employees | 1,437 | 70.7% |
| Self-Employed (Incorporated) | 25 | 1.2% |
| Self-Employed (Not Incorporated) | 106 | 5.2% |
| Not-for-profit Organizations | 176 | 8.6% |
| Local Government Employees | 224 | 11.0% |
| State Government Employees | 66 | 3.2% |
| Federal Government Employees | 0 | 0.0% |
| Unpaid Family Workers | 0 | 0.0% |
| Total | 2,034 | 100.0% |
Employment Status by Age in Centralia
According to the labor force statistics for Centralia, out of the total population over 16 years of age (3,897), 55.4% or 2,159 individuals are in the labor force, with 4.2% or 91 of them unemployed. The age group with the highest labor force participation rate is 20 to 24 years, with 92.2% or 153 individuals in the labor force. Within the labor force, the 20 to 24 years age range has the highest percentage of unemployed individuals, with 34.6% or 53 of them being unemployed.
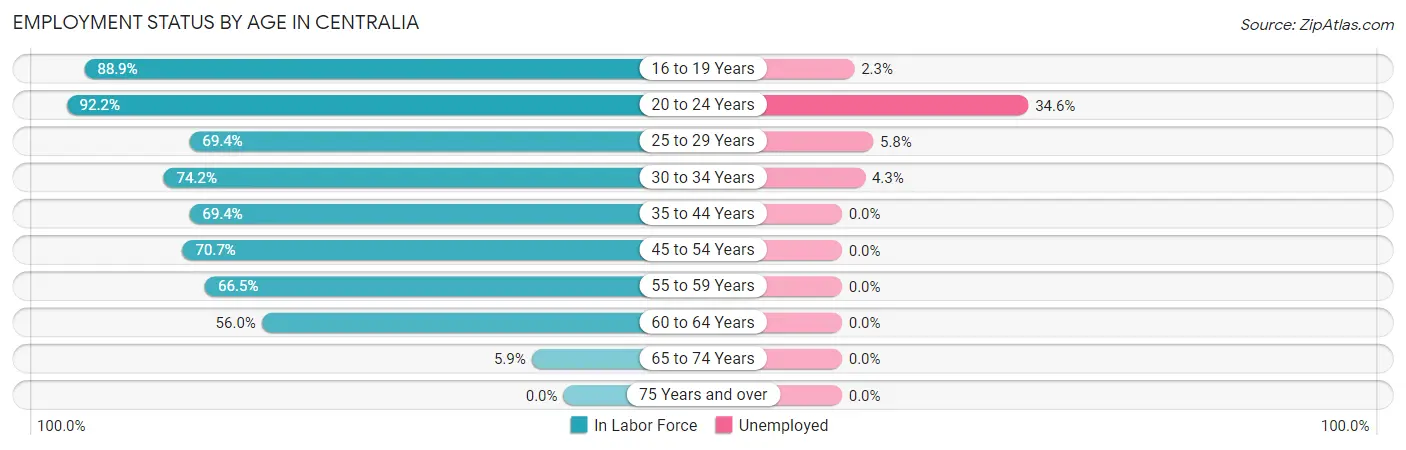
| Age Bracket | In Labor Force | Unemployed |
| 16 to 19 Years | 351 (88.9%) | 8 (2.3%) |
| 20 to 24 Years | 153 (92.2%) | 53 (34.6%) |
| 25 to 29 Years | 275 (69.4%) | 16 (5.8%) |
| 30 to 34 Years | 325 (74.2%) | 14 (4.3%) |
| 35 to 44 Years | 299 (69.4%) | 0 (0.0%) |
| 45 to 54 Years | 316 (70.7%) | 0 (0.0%) |
| 55 to 59 Years | 155 (66.5%) | 0 (0.0%) |
| 60 to 64 Years | 249 (56.0%) | 0 (0.0%) |
| 65 to 74 Years | 35 (5.9%) | 0 (0.0%) |
| 75 Years and over | 0 (0.0%) | 0 (0.0%) |
| Total | 2,159 (55.4%) | 91 (4.2%) |
Employment Status by Educational Attainment in Centralia
According to labor force statistics for Centralia, 67.7% of individuals (1,618) out of the total population between 25 and 64 years of age (2,390) are in the labor force, with 1.9% or 31 of them being unemployed. The group with the highest labor force participation rate are those with the educational attainment of bachelor's degree or higher, with 83.1% or 527 individuals in the labor force. Within the labor force, individuals with less than high school education have the highest percentage of unemployment, with 8.6% or 14 of them being unemployed.
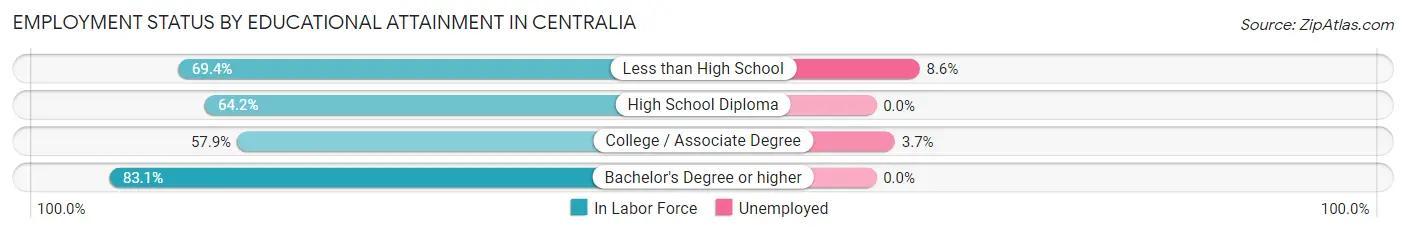
| Educational Attainment | In Labor Force | Unemployed |
| Less than High School | 163 (69.4%) | 20 (8.6%) |
| High School Diploma | 491 (64.2%) | 0 (0.0%) |
| College / Associate Degree | 438 (57.9%) | 28 (3.7%) |
| Bachelor's Degree or higher | 527 (83.1%) | 0 (0.0%) |
| Total | 1,618 (67.7%) | 45 (1.9%) |
Employment Occupations by Sex in Centralia
Management, Business, Science and Arts Occupations
The most common Management, Business, Science and Arts occupations in Centralia are Health Diagnosing & Treating (132 | 6.4%), Computers, Engineering & Science (119 | 5.8%), Management (108 | 5.2%), Community & Social Service (103 | 5.0%), and Health Technologists (100 | 4.8%).
Management, Business, Science and Arts Occupations by Sex
Within the Management, Business, Science and Arts occupations in Centralia, the most male-oriented occupations are Computers, Engineering & Science (100.0%), Computers & Mathematics (100.0%), and Architecture & Engineering (100.0%), while the most female-oriented occupations are Arts, Media & Entertainment (100.0%), Health Technologists (86.0%), and Community & Social Service (79.6%).
| Occupation | Male | Female |
| Management | 61 (56.5%) | 47 (43.5%) |
| Business & Financial | 12 (22.6%) | 41 (77.4%) |
| Computers, Engineering & Science | 119 (100.0%) | 0 (0.0%) |
| Computers & Mathematics | 51 (100.0%) | 0 (0.0%) |
| Architecture & Engineering | 43 (100.0%) | 0 (0.0%) |
| Life, Physical & Social Science | 25 (100.0%) | 0 (0.0%) |
| Community & Social Service | 21 (20.4%) | 82 (79.6%) |
| Education, Arts & Media | 0 (0.0%) | 0 (0.0%) |
| Legal Services & Support | 0 (0.0%) | 0 (0.0%) |
| Education Instruction & Library | 21 (23.9%) | 67 (76.1%) |
| Arts, Media & Entertainment | 0 (0.0%) | 15 (100.0%) |
| Health Diagnosing & Treating | 33 (25.0%) | 99 (75.0%) |
| Health Technologists | 14 (14.0%) | 86 (86.0%) |
| Total (Category) | 246 (47.8%) | 269 (52.2%) |
| Total (Overall) | 1,162 (56.2%) | 905 (43.8%) |
Services Occupations
The most common Services occupations in Centralia are Food Preparation & Serving (130 | 6.3%), Cleaning & Maintenance (130 | 6.3%), Personal Care & Service (85 | 4.1%), Healthcare Support (63 | 3.0%), and Security & Protection (15 | 0.7%).
Services Occupations by Sex
Within the Services occupations in Centralia, the most male-oriented occupations are Security & Protection (100.0%), Law Enforcement (100.0%), and Cleaning & Maintenance (90.0%), while the most female-oriented occupations are Personal Care & Service (100.0%), Healthcare Support (63.5%), and Food Preparation & Serving (33.9%).
| Occupation | Male | Female |
| Healthcare Support | 23 (36.5%) | 40 (63.5%) |
| Security & Protection | 15 (100.0%) | 0 (0.0%) |
| Firefighting & Prevention | 0 (0.0%) | 0 (0.0%) |
| Law Enforcement | 15 (100.0%) | 0 (0.0%) |
| Food Preparation & Serving | 86 (66.1%) | 44 (33.9%) |
| Cleaning & Maintenance | 117 (90.0%) | 13 (10.0%) |
| Personal Care & Service | 0 (0.0%) | 85 (100.0%) |
| Total (Category) | 241 (57.0%) | 182 (43.0%) |
| Total (Overall) | 1,162 (56.2%) | 905 (43.8%) |
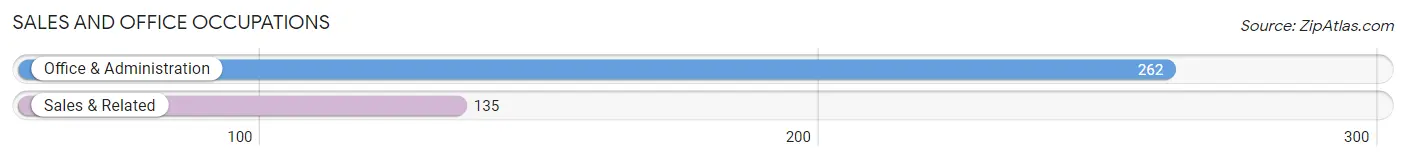
Sales and Office Occupations
The most common Sales and Office occupations in Centralia are Office & Administration (262 | 12.7%), and Sales & Related (135 | 6.5%).
Sales and Office Occupations by Sex
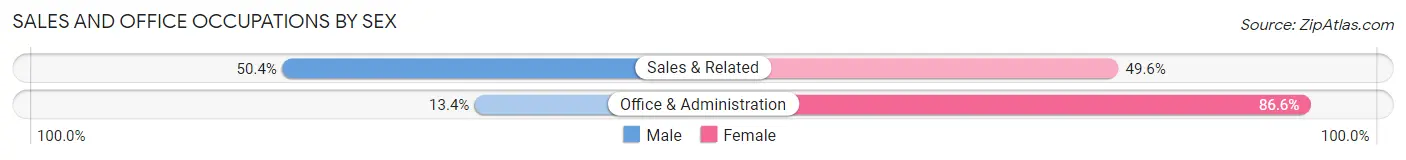
| Occupation | Male | Female |
| Sales & Related | 68 (50.4%) | 67 (49.6%) |
| Office & Administration | 35 (13.4%) | 227 (86.6%) |
| Total (Category) | 103 (25.9%) | 294 (74.1%) |
| Total (Overall) | 1,162 (56.2%) | 905 (43.8%) |
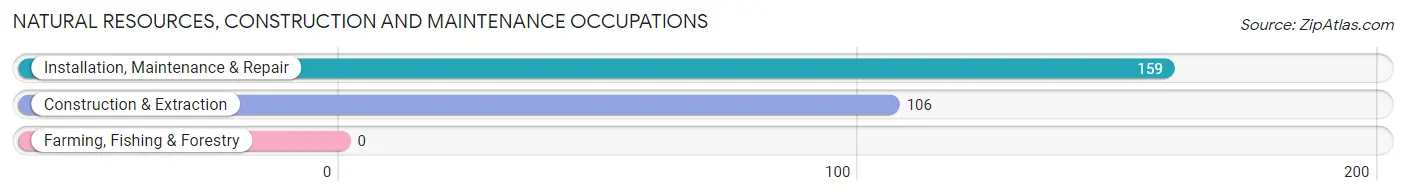
Natural Resources, Construction and Maintenance Occupations
The most common Natural Resources, Construction and Maintenance occupations in Centralia are Installation, Maintenance & Repair (159 | 7.7%), and Construction & Extraction (106 | 5.1%).
Natural Resources, Construction and Maintenance Occupations by Sex
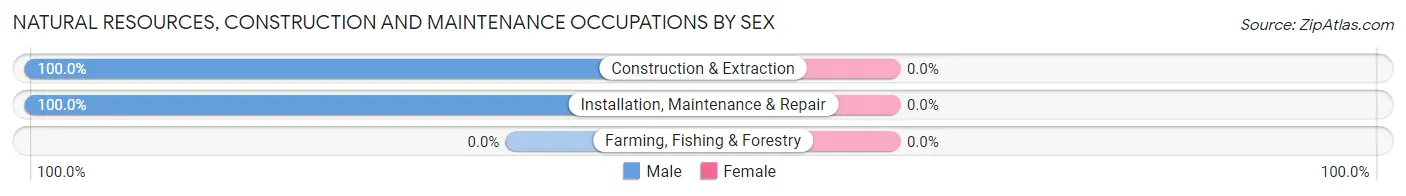
| Occupation | Male | Female |
| Farming, Fishing & Forestry | 0 (0.0%) | 0 (0.0%) |
| Construction & Extraction | 106 (100.0%) | 0 (0.0%) |
| Installation, Maintenance & Repair | 159 (100.0%) | 0 (0.0%) |
| Total (Category) | 265 (100.0%) | 0 (0.0%) |
| Total (Overall) | 1,162 (56.2%) | 905 (43.8%) |
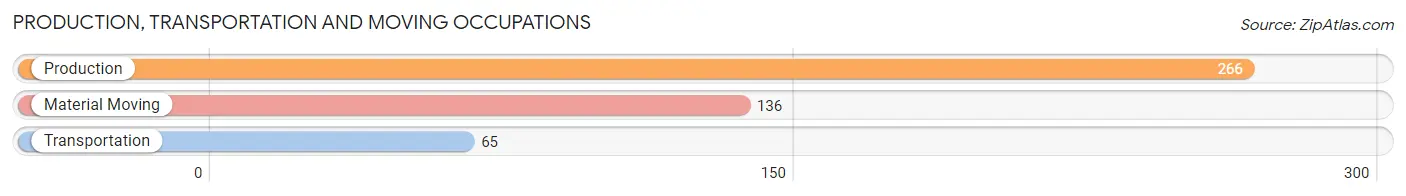
Production, Transportation and Moving Occupations
The most common Production, Transportation and Moving occupations in Centralia are Production (266 | 12.9%), Material Moving (136 | 6.6%), and Transportation (65 | 3.1%).
Production, Transportation and Moving Occupations by Sex
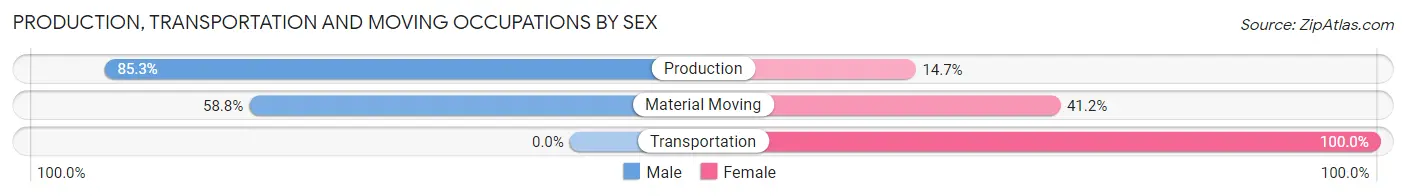
| Occupation | Male | Female |
| Production | 227 (85.3%) | 39 (14.7%) |
| Transportation | 0 (0.0%) | 65 (100.0%) |
| Material Moving | 80 (58.8%) | 56 (41.2%) |
| Total (Category) | 307 (65.7%) | 160 (34.3%) |
| Total (Overall) | 1,162 (56.2%) | 905 (43.8%) |
Employment Industries by Sex in Centralia
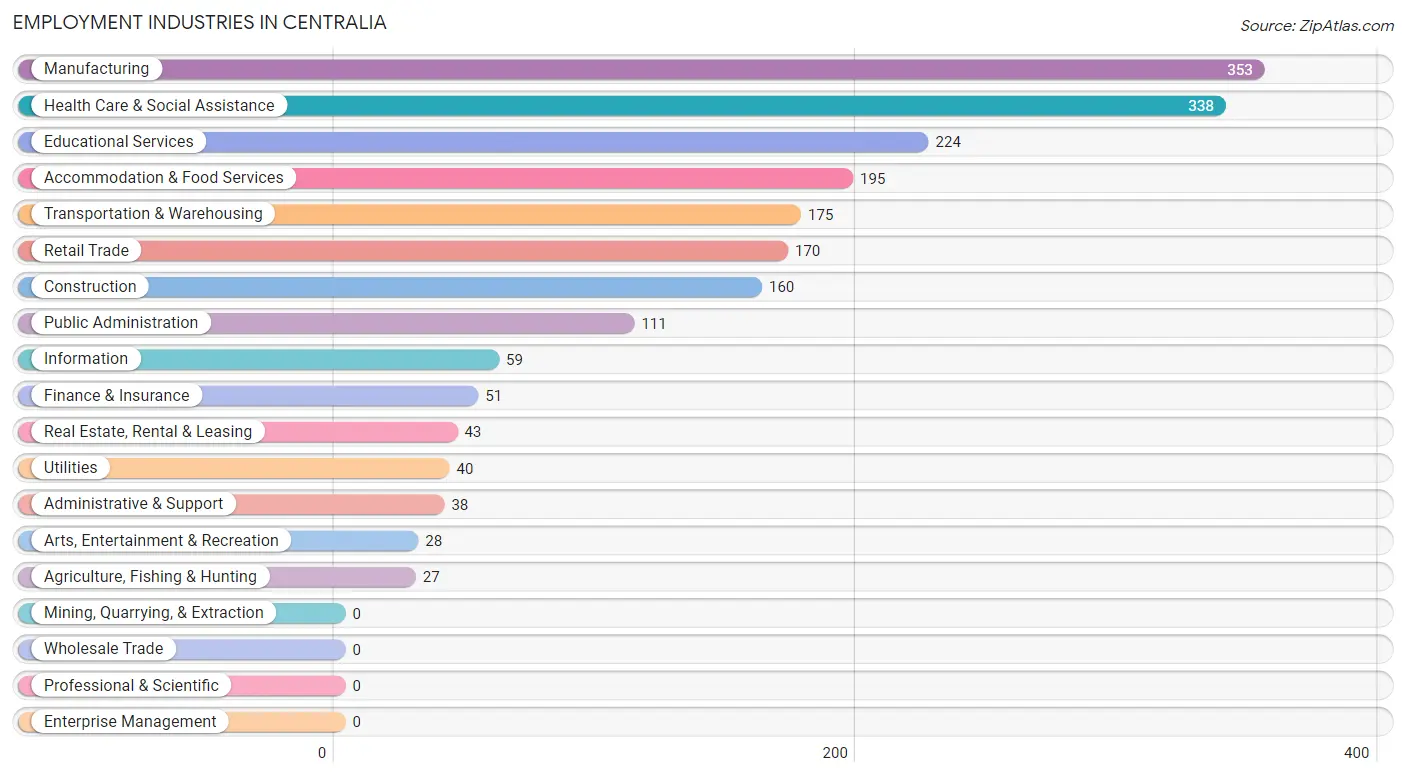
Employment Industries in Centralia
The major employment industries in Centralia include Manufacturing (353 | 17.1%), Health Care & Social Assistance (338 | 16.4%), Educational Services (224 | 10.8%), Accommodation & Food Services (195 | 9.4%), and Transportation & Warehousing (175 | 8.5%).
Employment Industries by Sex in Centralia
The Centralia industries that see more men than women are Construction (100.0%), Transportation & Warehousing (100.0%), and Utilities (100.0%), whereas the industries that tend to have a higher number of women are Agriculture, Fishing & Hunting (100.0%), Finance & Insurance (100.0%), and Public Administration (82.0%).
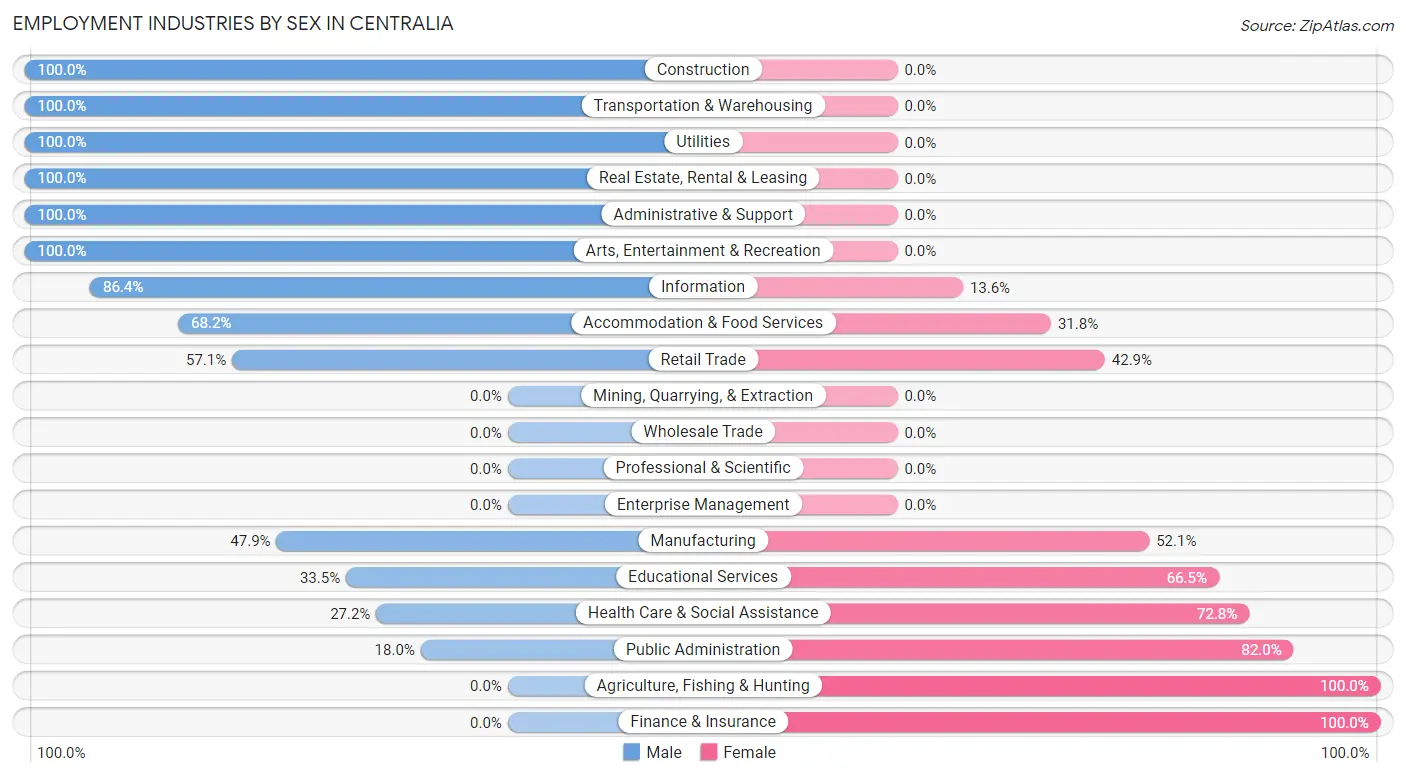
| Industry | Male | Female |
| Agriculture, Fishing & Hunting | 0 (0.0%) | 27 (100.0%) |
| Mining, Quarrying, & Extraction | 0 (0.0%) | 0 (0.0%) |
| Construction | 160 (100.0%) | 0 (0.0%) |
| Manufacturing | 169 (47.9%) | 184 (52.1%) |
| Wholesale Trade | 0 (0.0%) | 0 (0.0%) |
| Retail Trade | 97 (57.1%) | 73 (42.9%) |
| Transportation & Warehousing | 175 (100.0%) | 0 (0.0%) |
| Utilities | 40 (100.0%) | 0 (0.0%) |
| Information | 51 (86.4%) | 8 (13.6%) |
| Finance & Insurance | 0 (0.0%) | 51 (100.0%) |
| Real Estate, Rental & Leasing | 43 (100.0%) | 0 (0.0%) |
| Professional & Scientific | 0 (0.0%) | 0 (0.0%) |
| Enterprise Management | 0 (0.0%) | 0 (0.0%) |
| Administrative & Support | 38 (100.0%) | 0 (0.0%) |
| Educational Services | 75 (33.5%) | 149 (66.5%) |
| Health Care & Social Assistance | 92 (27.2%) | 246 (72.8%) |
| Arts, Entertainment & Recreation | 28 (100.0%) | 0 (0.0%) |
| Accommodation & Food Services | 133 (68.2%) | 62 (31.8%) |
| Public Administration | 20 (18.0%) | 91 (82.0%) |
| Total | 1,162 (56.2%) | 905 (43.8%) |
Education in Centralia
School Enrollment in Centralia
The most common levels of schooling among the 858 students in Centralia are high school (347 | 40.4%), nursery / preschool (175 | 20.4%), and college / undergraduate (147 | 17.1%).
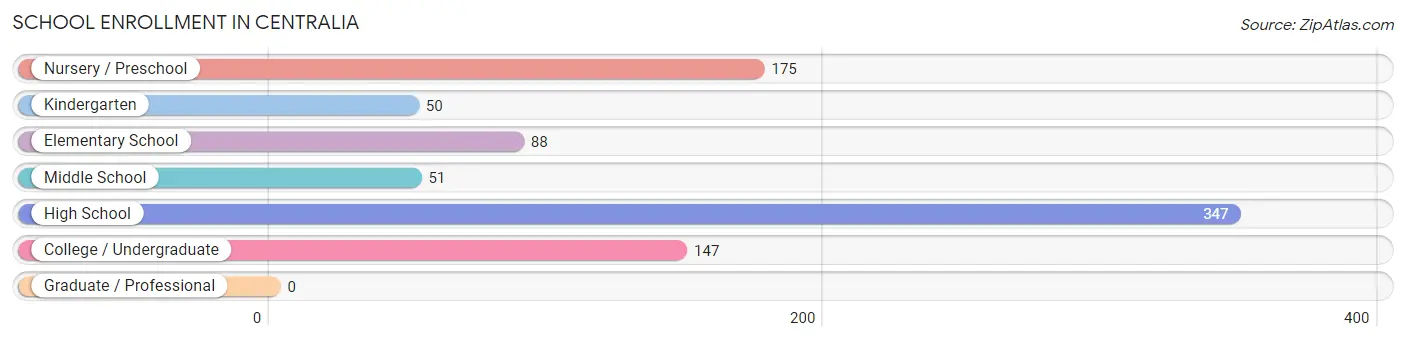
| School Level | # Students | % Students |
| Nursery / Preschool | 175 | 20.4% |
| Kindergarten | 50 | 5.8% |
| Elementary School | 88 | 10.3% |
| Middle School | 51 | 5.9% |
| High School | 347 | 40.4% |
| College / Undergraduate | 147 | 17.1% |
| Graduate / Professional | 0 | 0.0% |
| Total | 858 | 100.0% |
School Enrollment by Age by Funding Source in Centralia
Out of a total of 858 students who are enrolled in schools in Centralia, 171 (19.9%) attend a private institution, while the remaining 687 (80.1%) are enrolled in public schools. The age group of 3 to 4 year olds has the highest likelihood of being enrolled in private schools, with 39 (43.8% in the age bracket) enrolled. Conversely, the age group of 20 to 24 year olds has the lowest likelihood of being enrolled in a private school, with 53 (100.0% in the age bracket) attending a public institution.
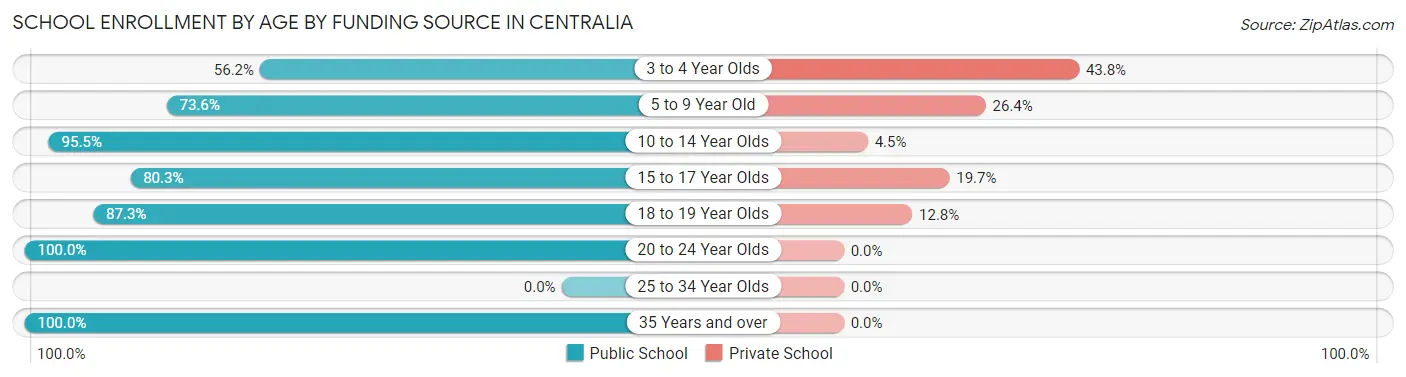
| Age Bracket | Public School | Private School |
| 3 to 4 Year Olds | 50 (56.2%) | 39 (43.8%) |
| 5 to 9 Year Old | 153 (73.6%) | 55 (26.4%) |
| 10 to 14 Year Olds | 64 (95.5%) | 3 (4.5%) |
| 15 to 17 Year Olds | 249 (80.3%) | 61 (19.7%) |
| 18 to 19 Year Olds | 89 (87.3%) | 13 (12.8%) |
| 20 to 24 Year Olds | 53 (100.0%) | 0 (0.0%) |
| 25 to 34 Year Olds | 0 (0.0%) | 0 (0.0%) |
| 35 Years and over | 29 (100.0%) | 0 (0.0%) |
| Total | 687 (80.1%) | 171 (19.9%) |
Educational Attainment by Field of Study in Centralia
Education (490 | 46.6%), science & technology (105 | 10.0%), bio, nature & agricultural (88 | 8.4%), business (84 | 8.0%), and physical & health sciences (70 | 6.7%) are the most common fields of study among 1,052 individuals in Centralia who have obtained a bachelor's degree or higher.
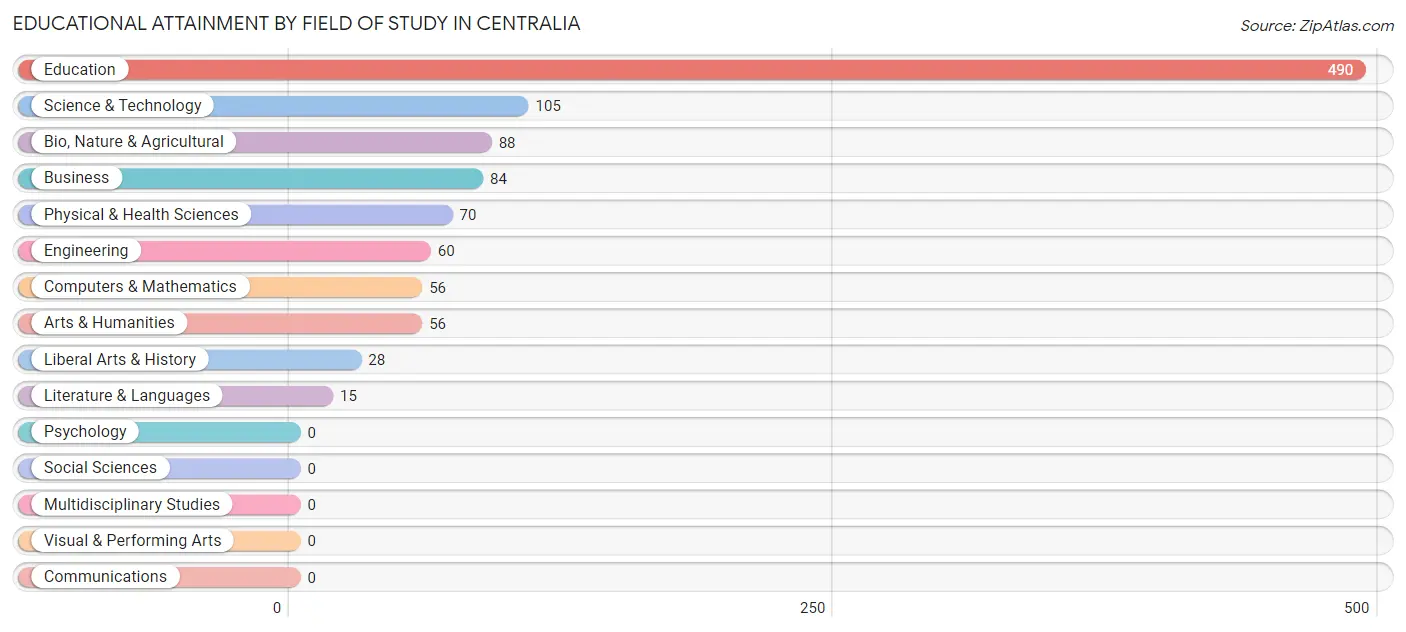
| Field of Study | # Graduates | % Graduates |
| Computers & Mathematics | 56 | 5.3% |
| Bio, Nature & Agricultural | 88 | 8.4% |
| Physical & Health Sciences | 70 | 6.7% |
| Psychology | 0 | 0.0% |
| Social Sciences | 0 | 0.0% |
| Engineering | 60 | 5.7% |
| Multidisciplinary Studies | 0 | 0.0% |
| Science & Technology | 105 | 10.0% |
| Business | 84 | 8.0% |
| Education | 490 | 46.6% |
| Literature & Languages | 15 | 1.4% |
| Liberal Arts & History | 28 | 2.7% |
| Visual & Performing Arts | 0 | 0.0% |
| Communications | 0 | 0.0% |
| Arts & Humanities | 56 | 5.3% |
| Total | 1,052 | 100.0% |
Transportation & Commute in Centralia
Vehicle Availability by Sex in Centralia
The most prevalent vehicle ownership categories in Centralia are males with 3 vehicles (475, accounting for 40.9%) and females with 3 vehicles (243, making up 54.5%).
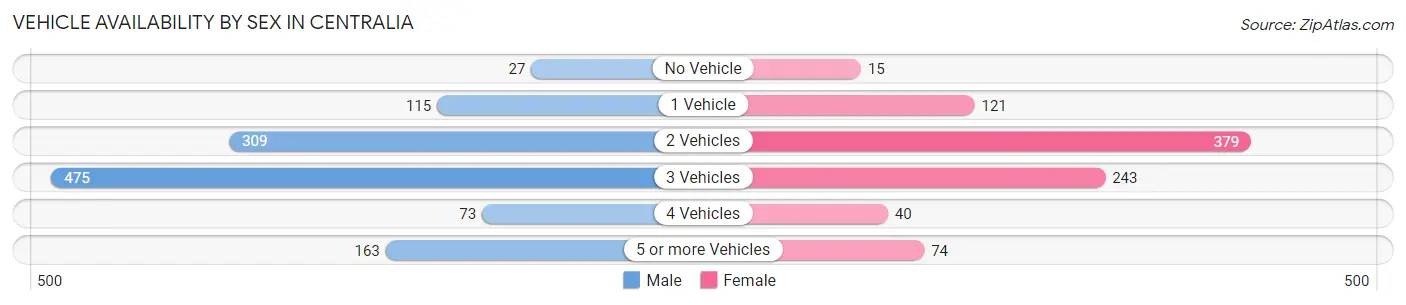
| Vehicles Available | Male | Female |
| No Vehicle | 27 (2.3%) | 15 (1.7%) |
| 1 Vehicle | 115 (9.9%) | 121 (13.9%) |
| 2 Vehicles | 309 (26.6%) | 379 (43.5%) |
| 3 Vehicles | 475 (40.9%) | 243 (27.9%) |
| 4 Vehicles | 73 (6.3%) | 40 (4.6%) |
| 5 or more Vehicles | 163 (14.0%) | 74 (8.5%) |
| Total | 1,162 (100.0%) | 872 (100.0%) |
Commute Time in Centralia
The most frequently occuring commute durations in Centralia are 30 to 34 minutes (500 commuters, 26.1%), 5 to 9 minutes (285 commuters, 14.9%), and less than 5 minutes (263 commuters, 13.7%).
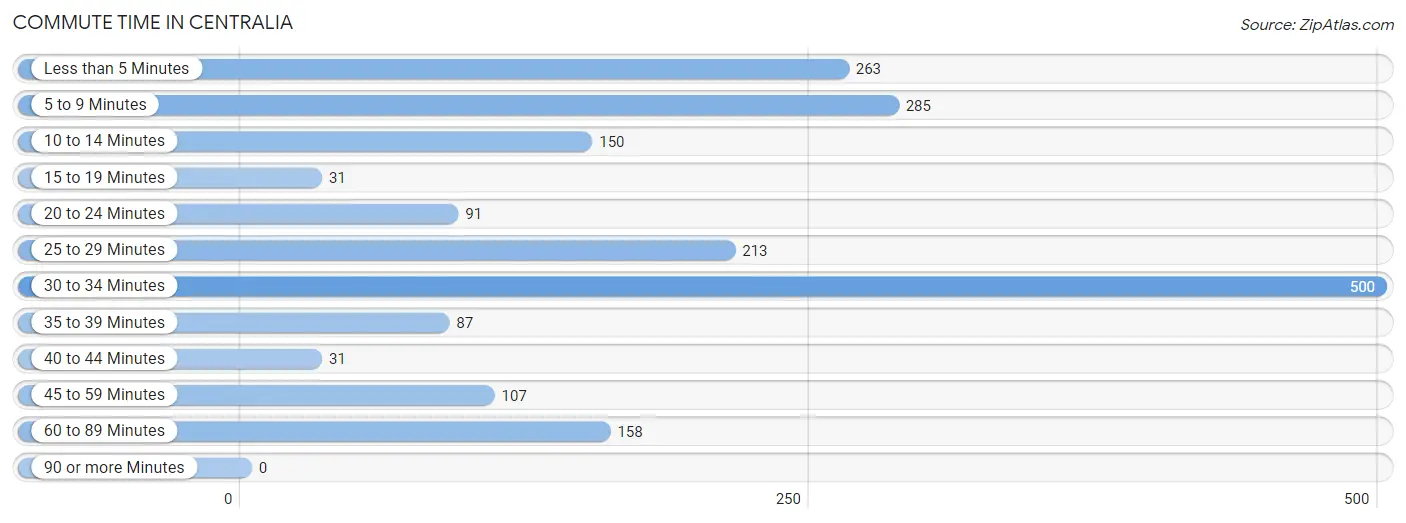
| Commute Time | # Commuters | % Commuters |
| Less than 5 Minutes | 263 | 13.7% |
| 5 to 9 Minutes | 285 | 14.9% |
| 10 to 14 Minutes | 150 | 7.8% |
| 15 to 19 Minutes | 31 | 1.6% |
| 20 to 24 Minutes | 91 | 4.8% |
| 25 to 29 Minutes | 213 | 11.1% |
| 30 to 34 Minutes | 500 | 26.1% |
| 35 to 39 Minutes | 87 | 4.5% |
| 40 to 44 Minutes | 31 | 1.6% |
| 45 to 59 Minutes | 107 | 5.6% |
| 60 to 89 Minutes | 158 | 8.3% |
| 90 or more Minutes | 0 | 0.0% |
Commute Time by Sex in Centralia
The most common commute times in Centralia are 30 to 34 minutes (313 commuters, 26.9%) for males and 30 to 34 minutes (187 commuters, 24.8%) for females.
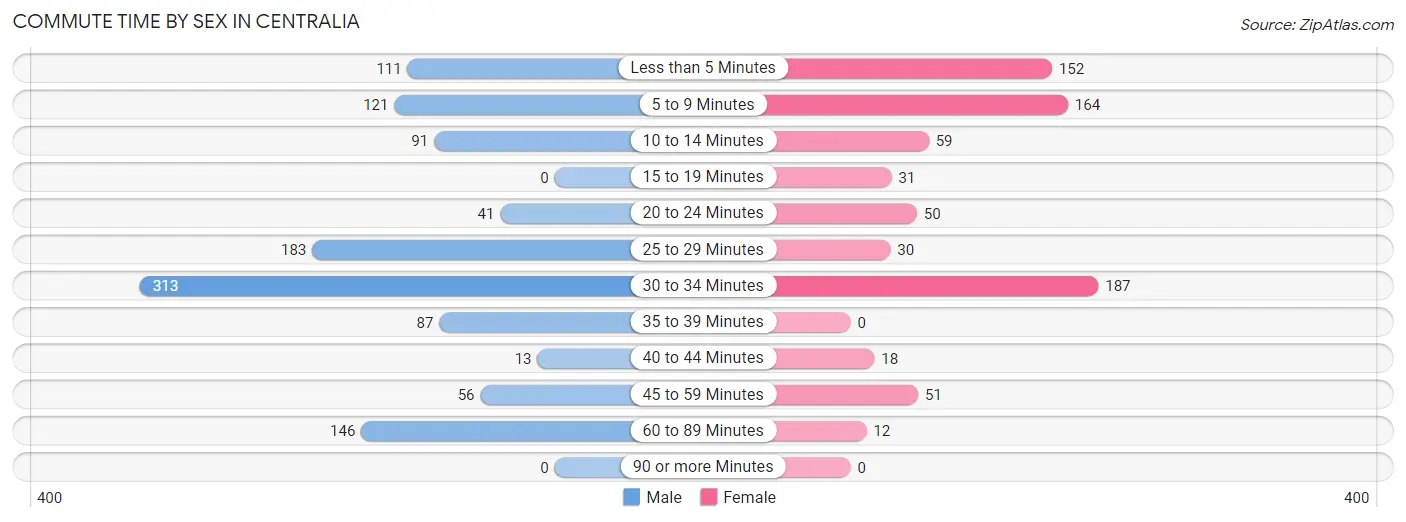
| Commute Time | Male | Female |
| Less than 5 Minutes | 111 (9.6%) | 152 (20.2%) |
| 5 to 9 Minutes | 121 (10.4%) | 164 (21.7%) |
| 10 to 14 Minutes | 91 (7.8%) | 59 (7.8%) |
| 15 to 19 Minutes | 0 (0.0%) | 31 (4.1%) |
| 20 to 24 Minutes | 41 (3.5%) | 50 (6.6%) |
| 25 to 29 Minutes | 183 (15.8%) | 30 (4.0%) |
| 30 to 34 Minutes | 313 (26.9%) | 187 (24.8%) |
| 35 to 39 Minutes | 87 (7.5%) | 0 (0.0%) |
| 40 to 44 Minutes | 13 (1.1%) | 18 (2.4%) |
| 45 to 59 Minutes | 56 (4.8%) | 51 (6.8%) |
| 60 to 89 Minutes | 146 (12.6%) | 12 (1.6%) |
| 90 or more Minutes | 0 (0.0%) | 0 (0.0%) |
Time of Departure to Work by Sex in Centralia
The most frequent times of departure to work in Centralia are 6:30 AM to 6:59 AM (335, 28.8%) for males and 7:00 AM to 7:29 AM (194, 25.7%) for females.
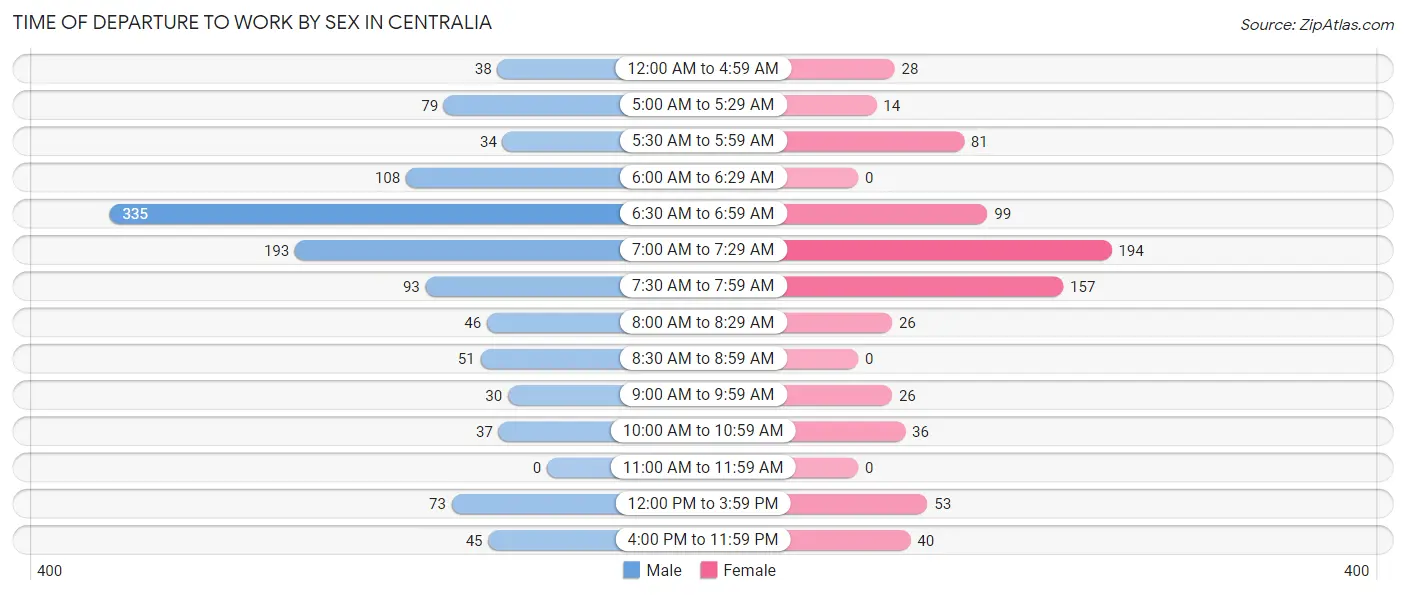
| Time of Departure | Male | Female |
| 12:00 AM to 4:59 AM | 38 (3.3%) | 28 (3.7%) |
| 5:00 AM to 5:29 AM | 79 (6.8%) | 14 (1.9%) |
| 5:30 AM to 5:59 AM | 34 (2.9%) | 81 (10.7%) |
| 6:00 AM to 6:29 AM | 108 (9.3%) | 0 (0.0%) |
| 6:30 AM to 6:59 AM | 335 (28.8%) | 99 (13.1%) |
| 7:00 AM to 7:29 AM | 193 (16.6%) | 194 (25.7%) |
| 7:30 AM to 7:59 AM | 93 (8.0%) | 157 (20.8%) |
| 8:00 AM to 8:29 AM | 46 (4.0%) | 26 (3.5%) |
| 8:30 AM to 8:59 AM | 51 (4.4%) | 0 (0.0%) |
| 9:00 AM to 9:59 AM | 30 (2.6%) | 26 (3.5%) |
| 10:00 AM to 10:59 AM | 37 (3.2%) | 36 (4.8%) |
| 11:00 AM to 11:59 AM | 0 (0.0%) | 0 (0.0%) |
| 12:00 PM to 3:59 PM | 73 (6.3%) | 53 (7.0%) |
| 4:00 PM to 11:59 PM | 45 (3.9%) | 40 (5.3%) |
| Total | 1,162 (100.0%) | 754 (100.0%) |
Housing Occupancy in Centralia
Occupancy by Ownership in Centralia
Of the total 1,923 dwellings in Centralia, owner-occupied units account for 1,299 (67.5%), while renter-occupied units make up 624 (32.5%).
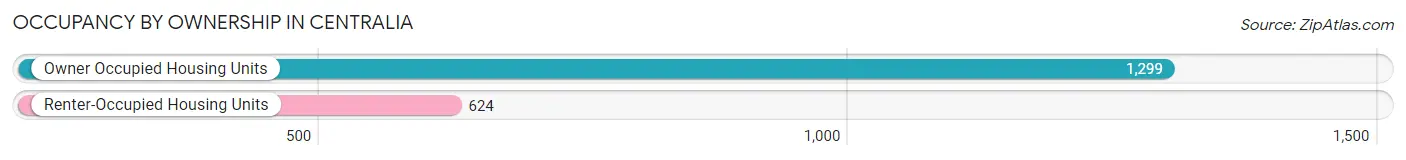
| Occupancy | # Housing Units | % Housing Units |
| Owner Occupied Housing Units | 1,299 | 67.5% |
| Renter-Occupied Housing Units | 624 | 32.5% |
| Total Occupied Housing Units | 1,923 | 100.0% |
Occupancy by Household Size in Centralia
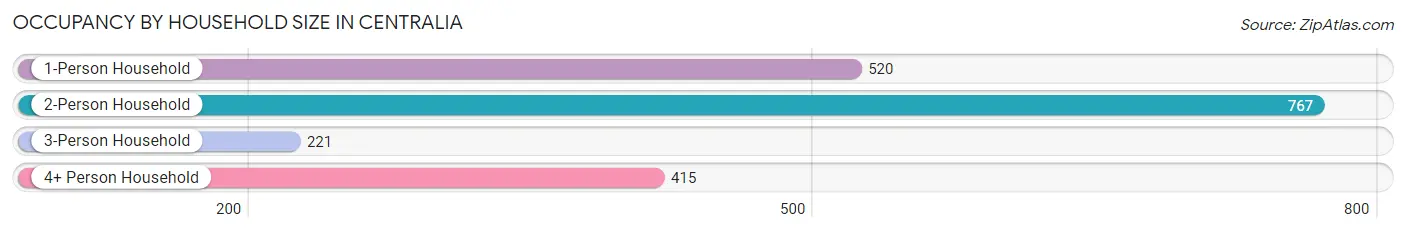
| Household Size | # Housing Units | % Housing Units |
| 1-Person Household | 520 | 27.0% |
| 2-Person Household | 767 | 39.9% |
| 3-Person Household | 221 | 11.5% |
| 4+ Person Household | 415 | 21.6% |
| Total Housing Units | 1,923 | 100.0% |
Occupancy by Ownership by Household Size in Centralia
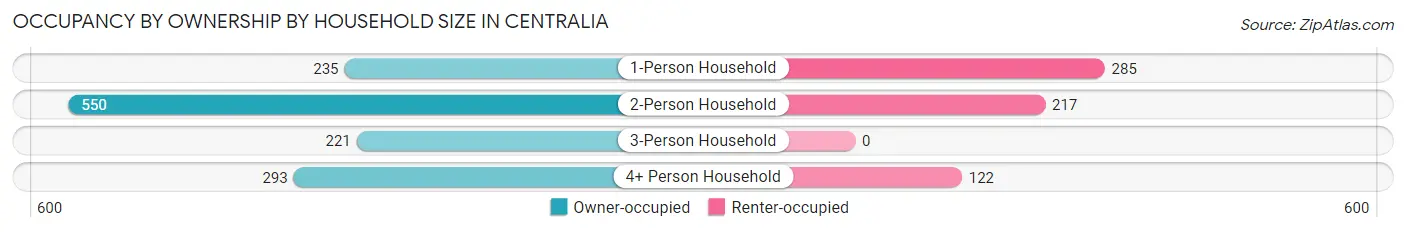
| Household Size | Owner-occupied | Renter-occupied |
| 1-Person Household | 235 (45.2%) | 285 (54.8%) |
| 2-Person Household | 550 (71.7%) | 217 (28.3%) |
| 3-Person Household | 221 (100.0%) | 0 (0.0%) |
| 4+ Person Household | 293 (70.6%) | 122 (29.4%) |
| Total Housing Units | 1,299 (67.5%) | 624 (32.5%) |
Occupancy by Educational Attainment in Centralia
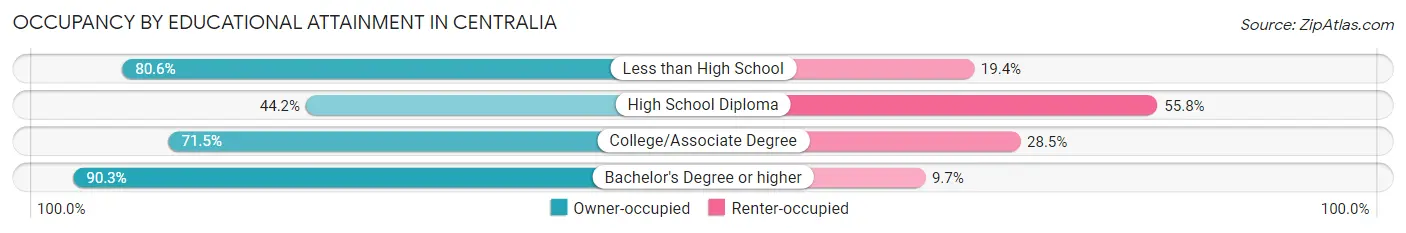
| Household Size | Owner-occupied | Renter-occupied |
| Less than High School | 104 (80.6%) | 25 (19.4%) |
| High School Diploma | 319 (44.2%) | 402 (55.8%) |
| College/Associate Degree | 353 (71.5%) | 141 (28.5%) |
| Bachelor's Degree or higher | 523 (90.3%) | 56 (9.7%) |
Occupancy by Age of Householder in Centralia
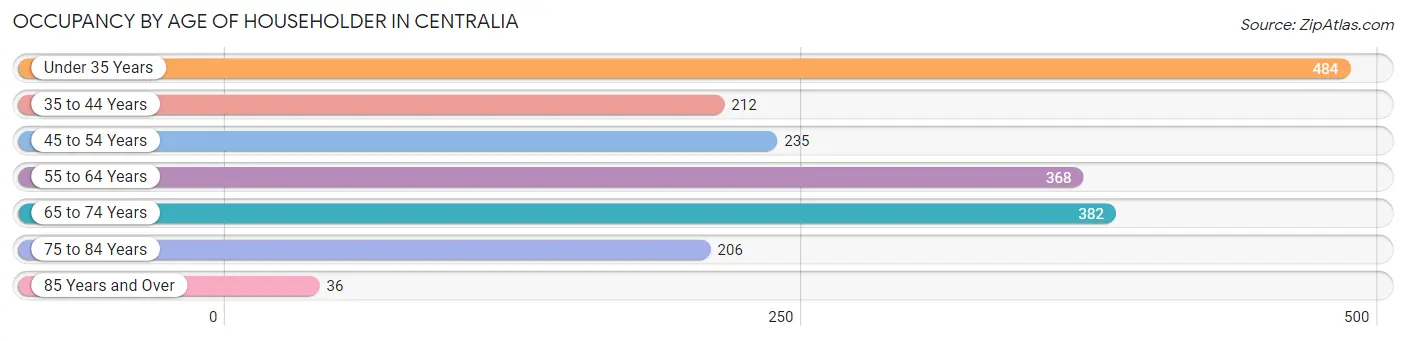
| Age Bracket | # Households | % Households |
| Under 35 Years | 484 | 25.2% |
| 35 to 44 Years | 212 | 11.0% |
| 45 to 54 Years | 235 | 12.2% |
| 55 to 64 Years | 368 | 19.1% |
| 65 to 74 Years | 382 | 19.9% |
| 75 to 84 Years | 206 | 10.7% |
| 85 Years and Over | 36 | 1.9% |
| Total | 1,923 | 100.0% |
Housing Finances in Centralia
Median Income by Occupancy in Centralia
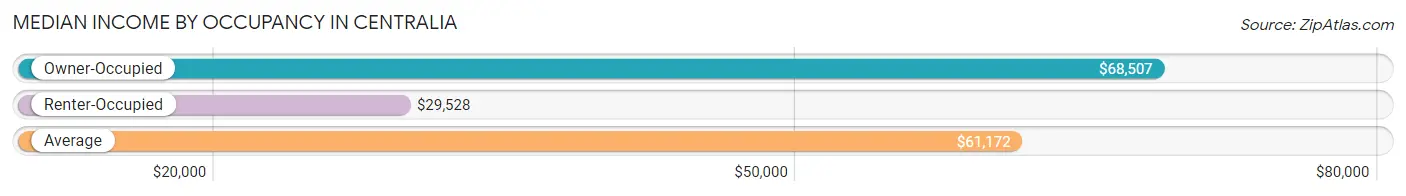
| Occupancy Type | # Households | Median Income |
| Owner-Occupied | 1,299 (67.5%) | $68,507 |
| Renter-Occupied | 624 (32.5%) | $29,528 |
| Average | 1,923 (100.0%) | $61,172 |
Occupancy by Householder Income Bracket in Centralia

| Income Bracket | Owner-occupied | Renter-occupied |
| Less than $5,000 | 19 (1.5%) | 48 (7.7%) |
| $5,000 to $9,999 | 19 (1.5%) | 31 (5.0%) |
| $10,000 to $14,999 | 48 (3.7%) | 107 (17.2%) |
| $15,000 to $19,999 | 44 (3.4%) | 18 (2.9%) |
| $20,000 to $24,999 | 17 (1.3%) | 26 (4.2%) |
| $25,000 to $34,999 | 101 (7.8%) | 107 (17.2%) |
| $35,000 to $49,999 | 130 (10.0%) | 84 (13.5%) |
| $50,000 to $74,999 | 311 (23.9%) | 153 (24.5%) |
| $75,000 to $99,999 | 270 (20.8%) | 32 (5.1%) |
| $100,000 to $149,999 | 241 (18.5%) | 0 (0.0%) |
| $150,000 or more | 99 (7.6%) | 18 (2.9%) |
| Total | 1,299 (100.0%) | 624 (100.0%) |
Monthly Housing Cost Tiers in Centralia
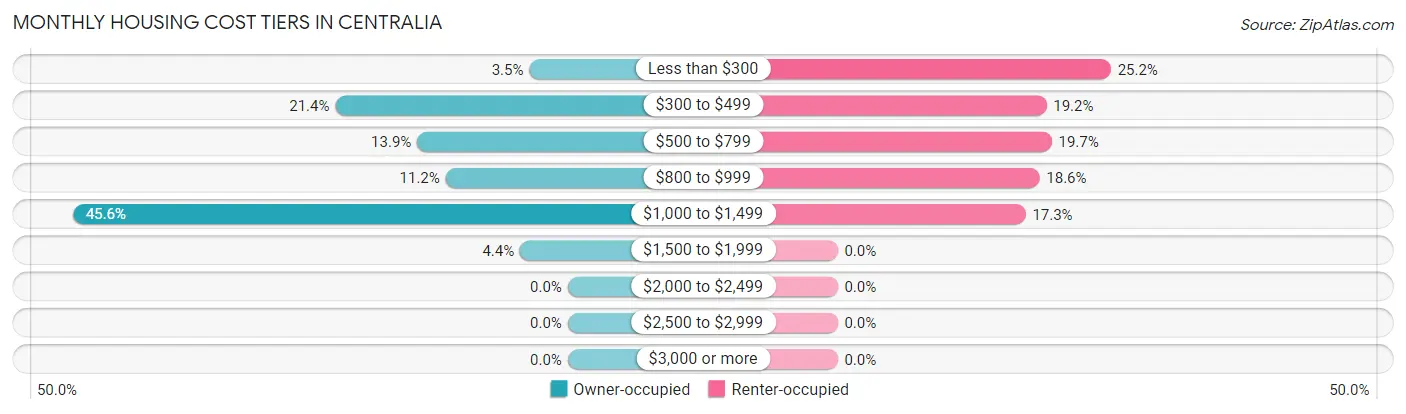
| Monthly Cost | Owner-occupied | Renter-occupied |
| Less than $300 | 46 (3.5%) | 157 (25.2%) |
| $300 to $499 | 278 (21.4%) | 120 (19.2%) |
| $500 to $799 | 180 (13.9%) | 123 (19.7%) |
| $800 to $999 | 146 (11.2%) | 116 (18.6%) |
| $1,000 to $1,499 | 592 (45.6%) | 108 (17.3%) |
| $1,500 to $1,999 | 57 (4.4%) | 0 (0.0%) |
| $2,000 to $2,499 | 0 (0.0%) | 0 (0.0%) |
| $2,500 to $2,999 | 0 (0.0%) | 0 (0.0%) |
| $3,000 or more | 0 (0.0%) | 0 (0.0%) |
| Total | 1,299 (100.0%) | 624 (100.0%) |
Physical Housing Characteristics in Centralia
Housing Structures in Centralia
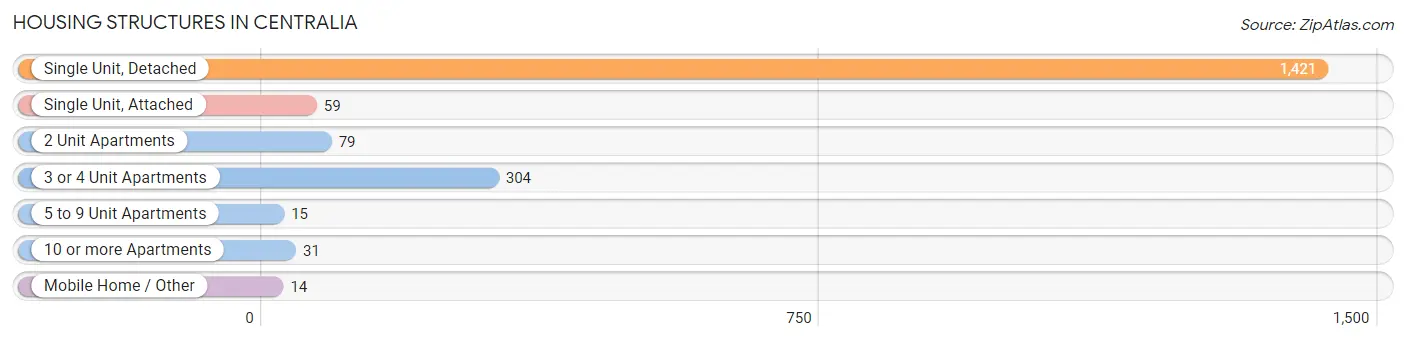
| Structure Type | # Housing Units | % Housing Units |
| Single Unit, Detached | 1,421 | 73.9% |
| Single Unit, Attached | 59 | 3.1% |
| 2 Unit Apartments | 79 | 4.1% |
| 3 or 4 Unit Apartments | 304 | 15.8% |
| 5 to 9 Unit Apartments | 15 | 0.8% |
| 10 or more Apartments | 31 | 1.6% |
| Mobile Home / Other | 14 | 0.7% |
| Total | 1,923 | 100.0% |
Housing Structures by Occupancy in Centralia
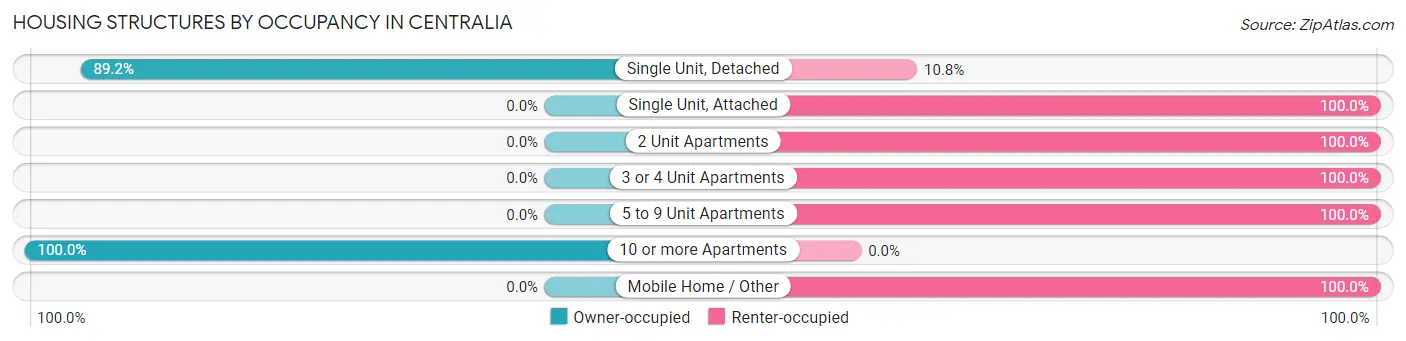
| Structure Type | Owner-occupied | Renter-occupied |
| Single Unit, Detached | 1,268 (89.2%) | 153 (10.8%) |
| Single Unit, Attached | 0 (0.0%) | 59 (100.0%) |
| 2 Unit Apartments | 0 (0.0%) | 79 (100.0%) |
| 3 or 4 Unit Apartments | 0 (0.0%) | 304 (100.0%) |
| 5 to 9 Unit Apartments | 0 (0.0%) | 15 (100.0%) |
| 10 or more Apartments | 31 (100.0%) | 0 (0.0%) |
| Mobile Home / Other | 0 (0.0%) | 14 (100.0%) |
| Total | 1,299 (67.5%) | 624 (32.5%) |
Housing Structures by Number of Rooms in Centralia
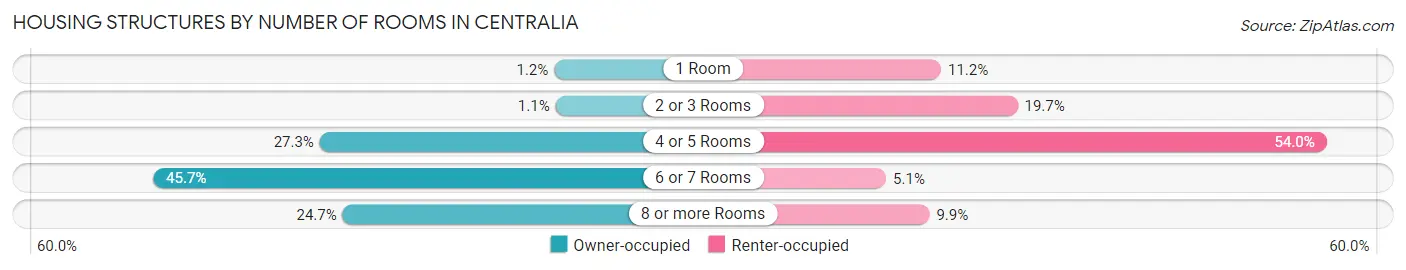
| Number of Rooms | Owner-occupied | Renter-occupied |
| 1 Room | 16 (1.2%) | 70 (11.2%) |
| 2 or 3 Rooms | 14 (1.1%) | 123 (19.7%) |
| 4 or 5 Rooms | 354 (27.3%) | 337 (54.0%) |
| 6 or 7 Rooms | 594 (45.7%) | 32 (5.1%) |
| 8 or more Rooms | 321 (24.7%) | 62 (9.9%) |
| Total | 1,299 (100.0%) | 624 (100.0%) |
Housing Structure by Heating Type in Centralia
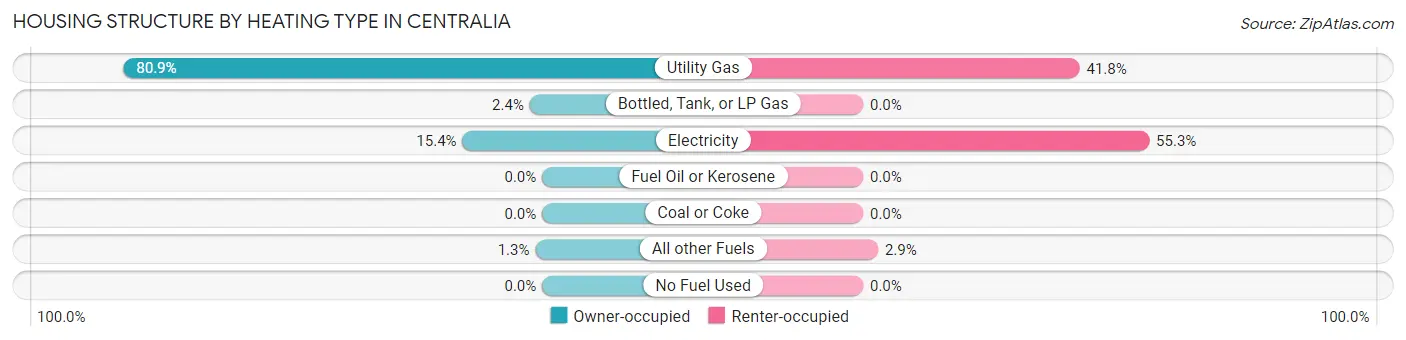
| Heating Type | Owner-occupied | Renter-occupied |
| Utility Gas | 1,051 (80.9%) | 261 (41.8%) |
| Bottled, Tank, or LP Gas | 31 (2.4%) | 0 (0.0%) |
| Electricity | 200 (15.4%) | 345 (55.3%) |
| Fuel Oil or Kerosene | 0 (0.0%) | 0 (0.0%) |
| Coal or Coke | 0 (0.0%) | 0 (0.0%) |
| All other Fuels | 17 (1.3%) | 18 (2.9%) |
| No Fuel Used | 0 (0.0%) | 0 (0.0%) |
| Total | 1,299 (100.0%) | 624 (100.0%) |
Household Vehicle Usage in Centralia
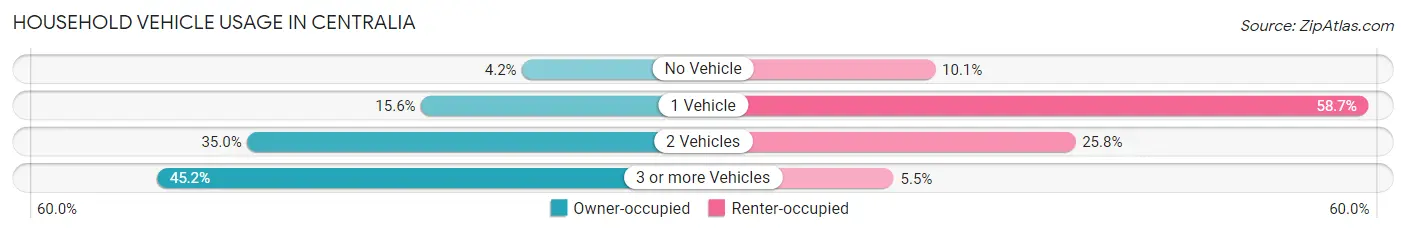
| Vehicles per Household | Owner-occupied | Renter-occupied |
| No Vehicle | 55 (4.2%) | 63 (10.1%) |
| 1 Vehicle | 202 (15.5%) | 366 (58.7%) |
| 2 Vehicles | 455 (35.0%) | 161 (25.8%) |
| 3 or more Vehicles | 587 (45.2%) | 34 (5.4%) |
| Total | 1,299 (100.0%) | 624 (100.0%) |
Real Estate & Mortgages in Centralia
Real Estate and Mortgage Overview in Centralia
| Characteristic | Without Mortgage | With Mortgage |
| Housing Units | 469 | 830 |
| Median Property Value | $159,300 | $143,600 |
| Median Household Income | $69,132 | $43 |
| Monthly Housing Costs | $443 | $0 |
| Real Estate Taxes | $1,102 | $0 |
Property Value by Mortgage Status in Centralia
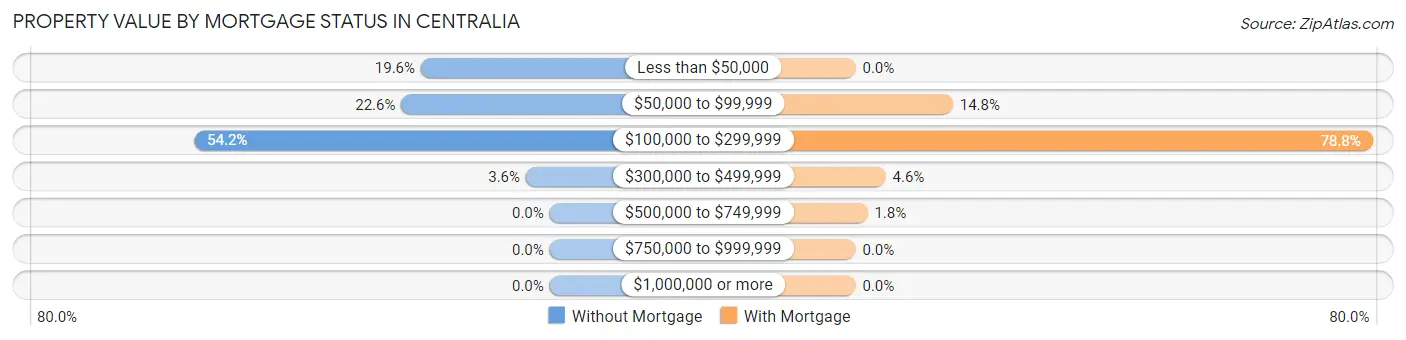
| Property Value | Without Mortgage | With Mortgage |
| Less than $50,000 | 92 (19.6%) | 0 (0.0%) |
| $50,000 to $99,999 | 106 (22.6%) | 123 (14.8%) |
| $100,000 to $299,999 | 254 (54.2%) | 654 (78.8%) |
| $300,000 to $499,999 | 17 (3.6%) | 38 (4.6%) |
| $500,000 to $749,999 | 0 (0.0%) | 15 (1.8%) |
| $750,000 to $999,999 | 0 (0.0%) | 0 (0.0%) |
| $1,000,000 or more | 0 (0.0%) | 0 (0.0%) |
| Total | 469 (100.0%) | 830 (100.0%) |
Household Income by Mortgage Status in Centralia
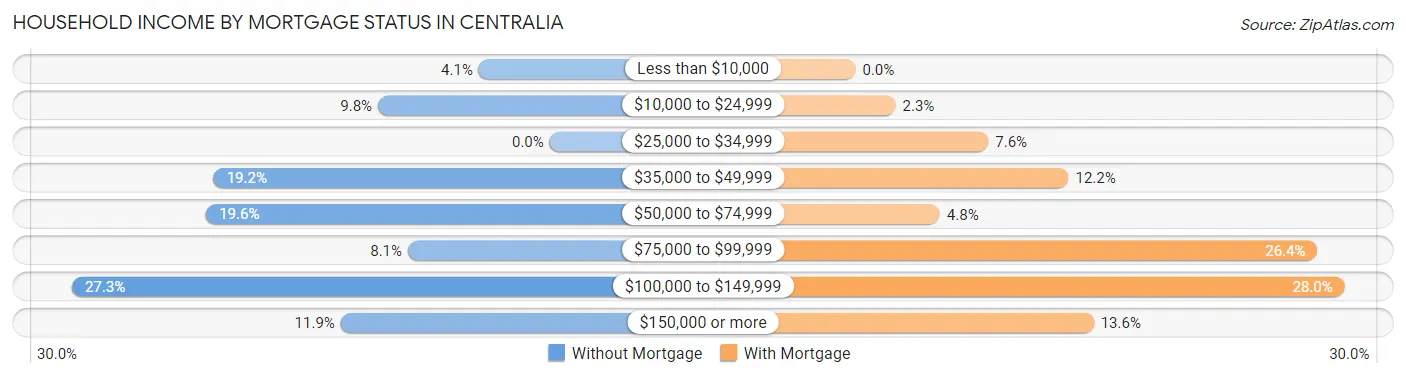
| Household Income | Without Mortgage | With Mortgage |
| Less than $10,000 | 19 (4.1%) | 0 (0.0%) |
| $10,000 to $24,999 | 46 (9.8%) | 19 (2.3%) |
| $25,000 to $34,999 | 0 (0.0%) | 63 (7.6%) |
| $35,000 to $49,999 | 90 (19.2%) | 101 (12.2%) |
| $50,000 to $74,999 | 92 (19.6%) | 40 (4.8%) |
| $75,000 to $99,999 | 38 (8.1%) | 219 (26.4%) |
| $100,000 to $149,999 | 128 (27.3%) | 232 (28.0%) |
| $150,000 or more | 56 (11.9%) | 113 (13.6%) |
| Total | 469 (100.0%) | 830 (100.0%) |
Property Value to Household Income Ratio in Centralia
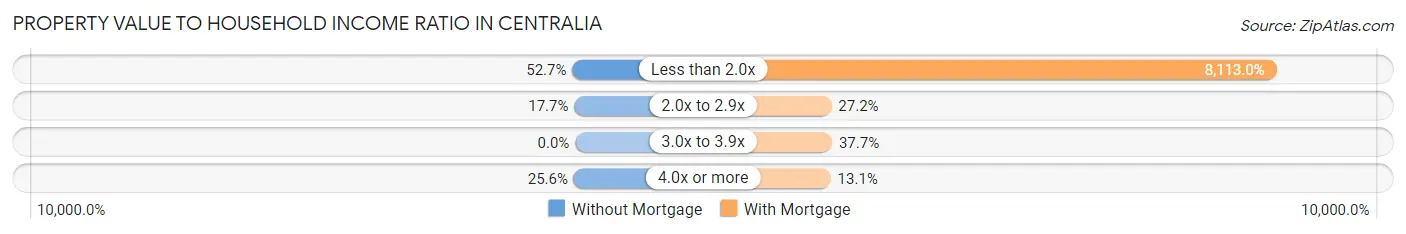
| Value-to-Income Ratio | Without Mortgage | With Mortgage |
| Less than 2.0x | 247 (52.7%) | 67,338 (8,113.0%) |
| 2.0x to 2.9x | 83 (17.7%) | 226 (27.2%) |
| 3.0x to 3.9x | 0 (0.0%) | 313 (37.7%) |
| 4.0x or more | 120 (25.6%) | 109 (13.1%) |
| Total | 469 (100.0%) | 830 (100.0%) |
Real Estate Taxes by Mortgage Status in Centralia
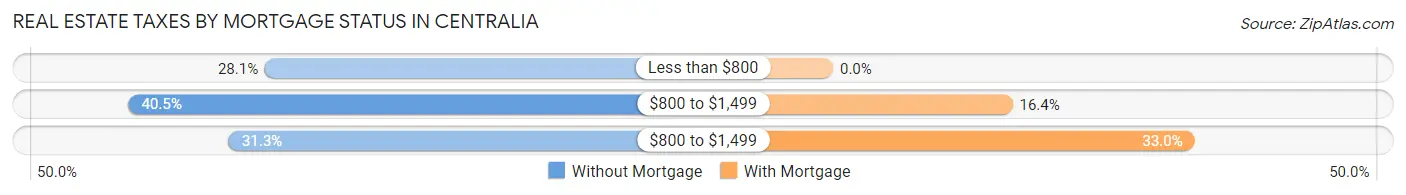
| Property Taxes | Without Mortgage | With Mortgage |
| Less than $800 | 132 (28.1%) | 0 (0.0%) |
| $800 to $1,499 | 190 (40.5%) | 136 (16.4%) |
| $800 to $1,499 | 147 (31.3%) | 274 (33.0%) |
| Total | 469 (100.0%) | 830 (100.0%) |
Health & Disability in Centralia
Health Insurance Coverage by Age in Centralia
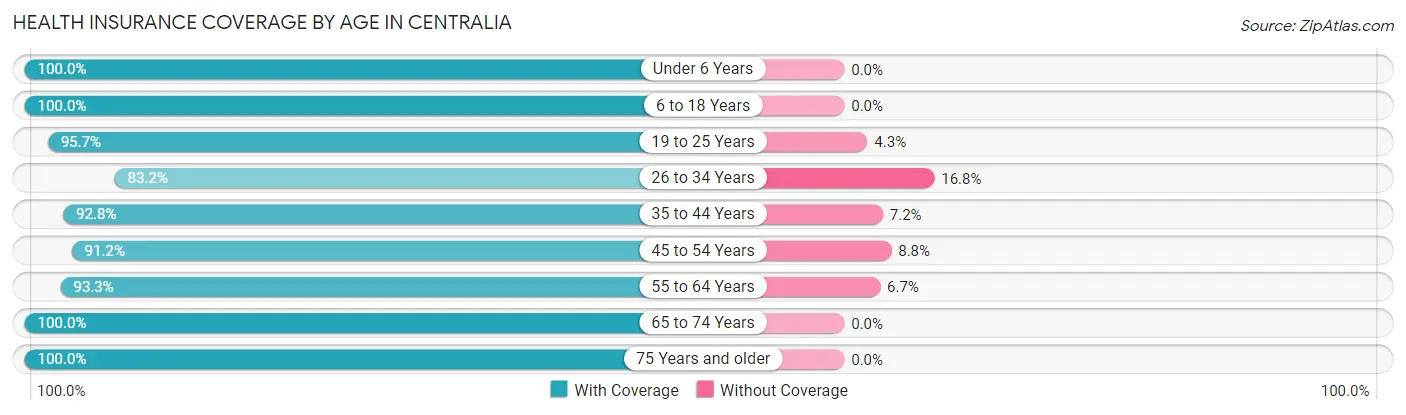
| Age Bracket | With Coverage | Without Coverage |
| Under 6 Years | 411 (100.0%) | 0 (0.0%) |
| 6 to 18 Years | 530 (100.0%) | 0 (0.0%) |
| 19 to 25 Years | 400 (95.7%) | 18 (4.3%) |
| 26 to 34 Years | 590 (83.2%) | 119 (16.8%) |
| 35 to 44 Years | 400 (92.8%) | 31 (7.2%) |
| 45 to 54 Years | 406 (91.2%) | 39 (8.8%) |
| 55 to 64 Years | 630 (93.3%) | 45 (6.7%) |
| 65 to 74 Years | 576 (100.0%) | 0 (0.0%) |
| 75 Years and older | 310 (100.0%) | 0 (0.0%) |
| Total | 4,253 (94.4%) | 252 (5.6%) |
Health Insurance Coverage by Citizenship Status in Centralia
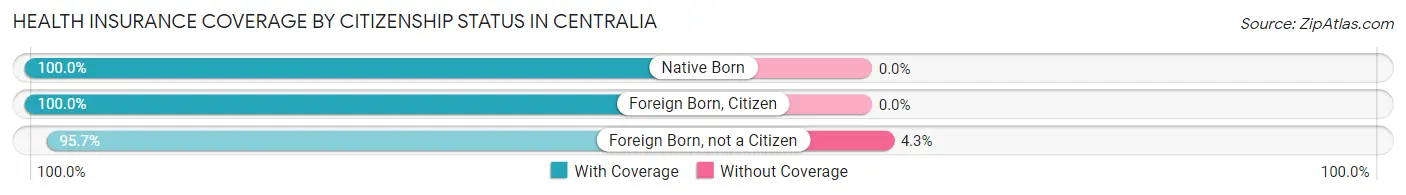
| Citizenship Status | With Coverage | Without Coverage |
| Native Born | 411 (100.0%) | 0 (0.0%) |
| Foreign Born, Citizen | 530 (100.0%) | 0 (0.0%) |
| Foreign Born, not a Citizen | 400 (95.7%) | 18 (4.3%) |
Health Insurance Coverage by Household Income in Centralia
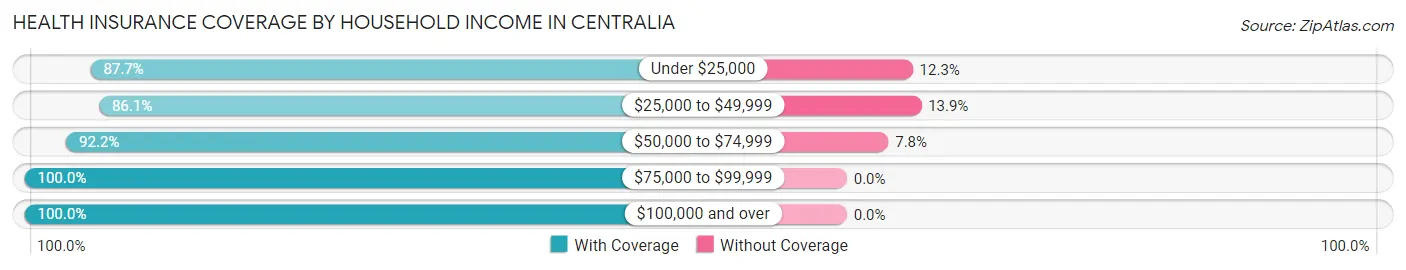
| Household Income | With Coverage | Without Coverage |
| Under $25,000 | 419 (87.7%) | 59 (12.3%) |
| $25,000 to $49,999 | 611 (86.1%) | 99 (13.9%) |
| $50,000 to $74,999 | 1,116 (92.2%) | 94 (7.8%) |
| $75,000 to $99,999 | 1,038 (100.0%) | 0 (0.0%) |
| $100,000 and over | 1,059 (100.0%) | 0 (0.0%) |
Public vs Private Health Insurance Coverage by Age in Centralia
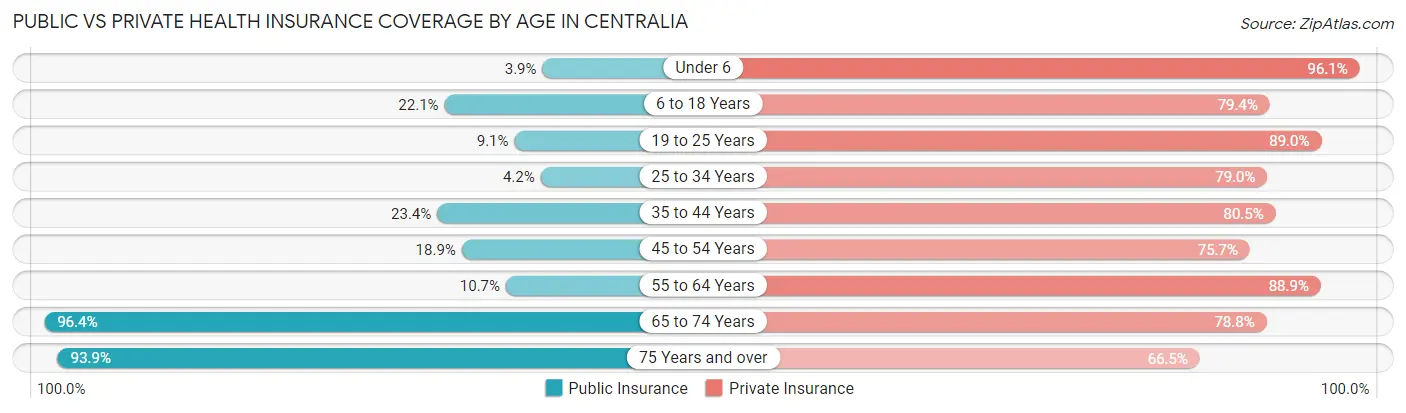
| Age Bracket | Public Insurance | Private Insurance |
| Under 6 | 16 (3.9%) | 395 (96.1%) |
| 6 to 18 Years | 117 (22.1%) | 421 (79.4%) |
| 19 to 25 Years | 38 (9.1%) | 372 (89.0%) |
| 25 to 34 Years | 30 (4.2%) | 560 (79.0%) |
| 35 to 44 Years | 101 (23.4%) | 347 (80.5%) |
| 45 to 54 Years | 84 (18.9%) | 337 (75.7%) |
| 55 to 64 Years | 72 (10.7%) | 600 (88.9%) |
| 65 to 74 Years | 555 (96.4%) | 454 (78.8%) |
| 75 Years and over | 291 (93.9%) | 206 (66.4%) |
| Total | 1,304 (28.9%) | 3,692 (82.0%) |
Disability Status by Sex by Age in Centralia
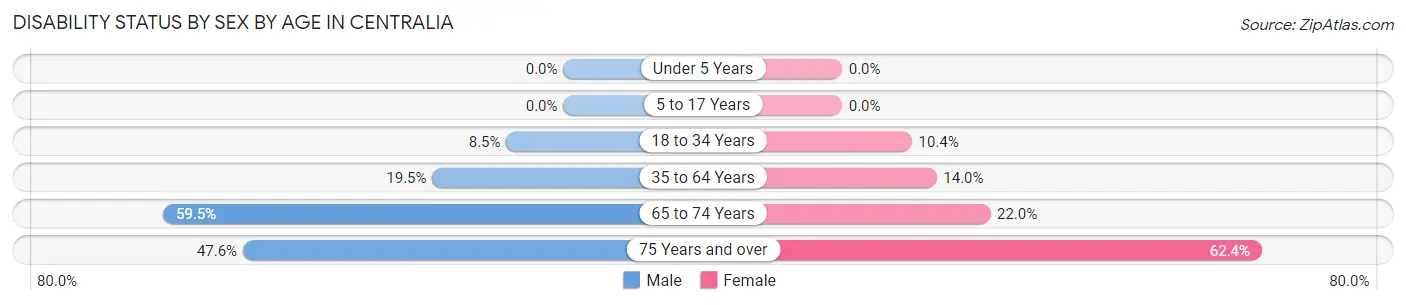
| Age Bracket | Male | Female |
| Under 5 Years | 0 (0.0%) | 0 (0.0%) |
| 5 to 17 Years | 0 (0.0%) | 0 (0.0%) |
| 18 to 34 Years | 49 (8.5%) | 59 (10.4%) |
| 35 to 64 Years | 134 (19.5%) | 121 (14.0%) |
| 65 to 74 Years | 129 (59.5%) | 79 (22.0%) |
| 75 Years and over | 59 (47.6%) | 116 (62.4%) |
Disability Class by Sex by Age in Centralia
Disability Class: Hearing Difficulty
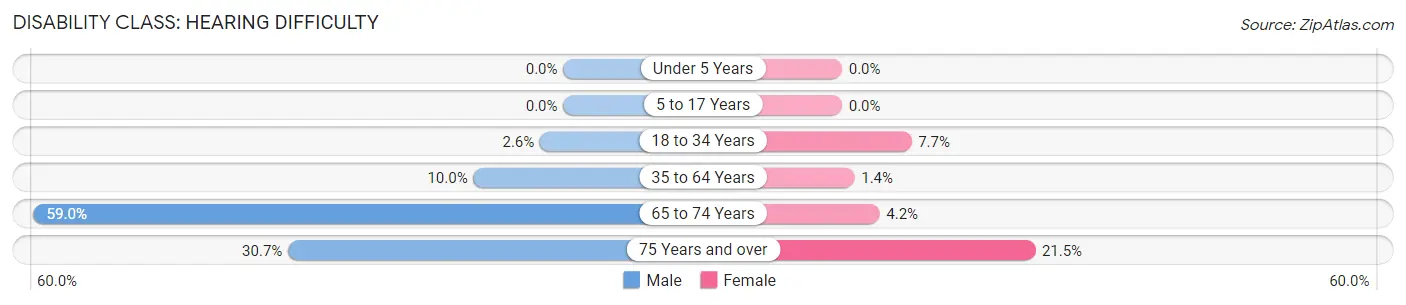
| Age Bracket | Male | Female |
| Under 5 Years | 0 (0.0%) | 0 (0.0%) |
| 5 to 17 Years | 0 (0.0%) | 0 (0.0%) |
| 18 to 34 Years | 15 (2.6%) | 44 (7.7%) |
| 35 to 64 Years | 69 (10.0%) | 12 (1.4%) |
| 65 to 74 Years | 128 (59.0%) | 15 (4.2%) |
| 75 Years and over | 38 (30.6%) | 40 (21.5%) |
Disability Class: Vision Difficulty
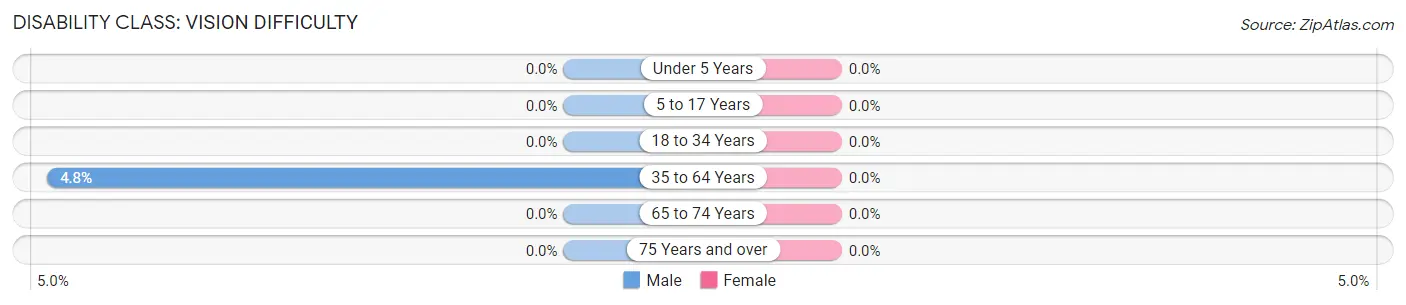
| Age Bracket | Male | Female |
| Under 5 Years | 0 (0.0%) | 0 (0.0%) |
| 5 to 17 Years | 0 (0.0%) | 0 (0.0%) |
| 18 to 34 Years | 0 (0.0%) | 0 (0.0%) |
| 35 to 64 Years | 33 (4.8%) | 0 (0.0%) |
| 65 to 74 Years | 0 (0.0%) | 0 (0.0%) |
| 75 Years and over | 0 (0.0%) | 0 (0.0%) |
Disability Class: Cognitive Difficulty
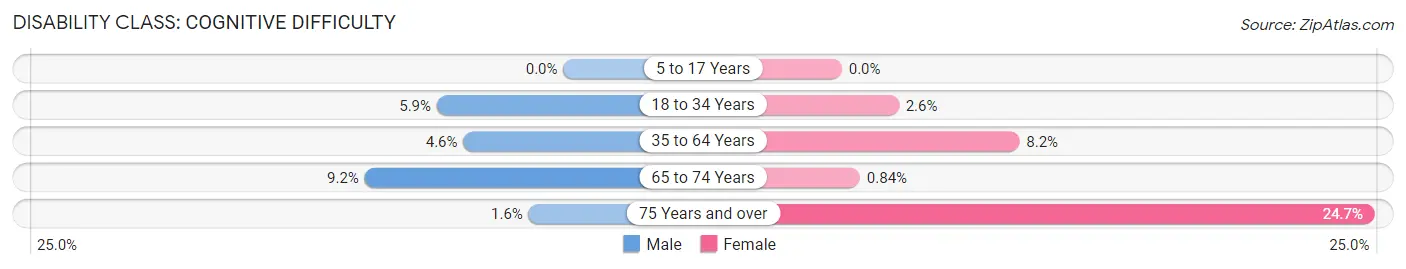
| Age Bracket | Male | Female |
| 5 to 17 Years | 0 (0.0%) | 0 (0.0%) |
| 18 to 34 Years | 34 (5.9%) | 15 (2.6%) |
| 35 to 64 Years | 32 (4.6%) | 71 (8.2%) |
| 65 to 74 Years | 20 (9.2%) | 3 (0.8%) |
| 75 Years and over | 2 (1.6%) | 46 (24.7%) |
Disability Class: Ambulatory Difficulty
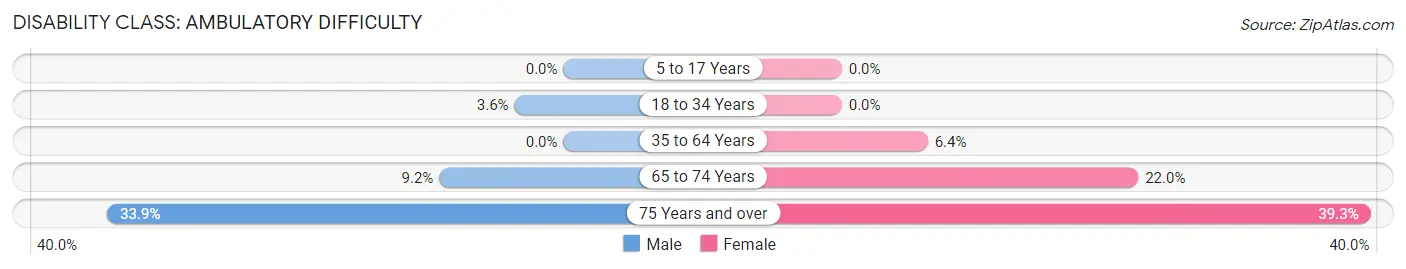
| Age Bracket | Male | Female |
| 5 to 17 Years | 0 (0.0%) | 0 (0.0%) |
| 18 to 34 Years | 21 (3.6%) | 0 (0.0%) |
| 35 to 64 Years | 0 (0.0%) | 55 (6.4%) |
| 65 to 74 Years | 20 (9.2%) | 79 (22.0%) |
| 75 Years and over | 42 (33.9%) | 73 (39.3%) |
Disability Class: Self-Care Difficulty
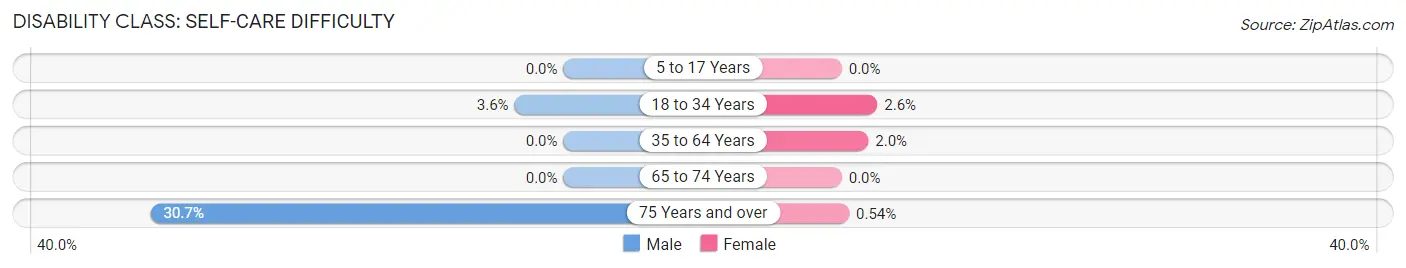
| Age Bracket | Male | Female |
| 5 to 17 Years | 0 (0.0%) | 0 (0.0%) |
| 18 to 34 Years | 21 (3.6%) | 15 (2.6%) |
| 35 to 64 Years | 0 (0.0%) | 17 (2.0%) |
| 65 to 74 Years | 0 (0.0%) | 0 (0.0%) |
| 75 Years and over | 38 (30.6%) | 1 (0.5%) |
Technology Access in Centralia
Computing Device Access in Centralia
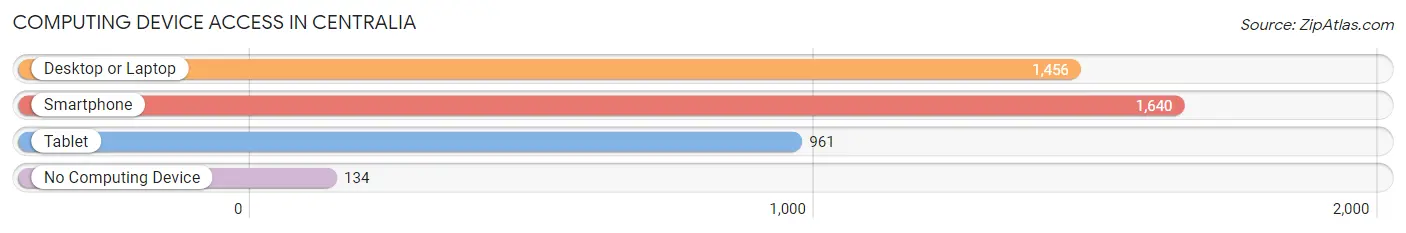
| Device Type | # Households | % Households |
| Desktop or Laptop | 1,456 | 75.7% |
| Smartphone | 1,640 | 85.3% |
| Tablet | 961 | 50.0% |
| No Computing Device | 134 | 7.0% |
| Total | 1,923 | 100.0% |
Internet Access in Centralia
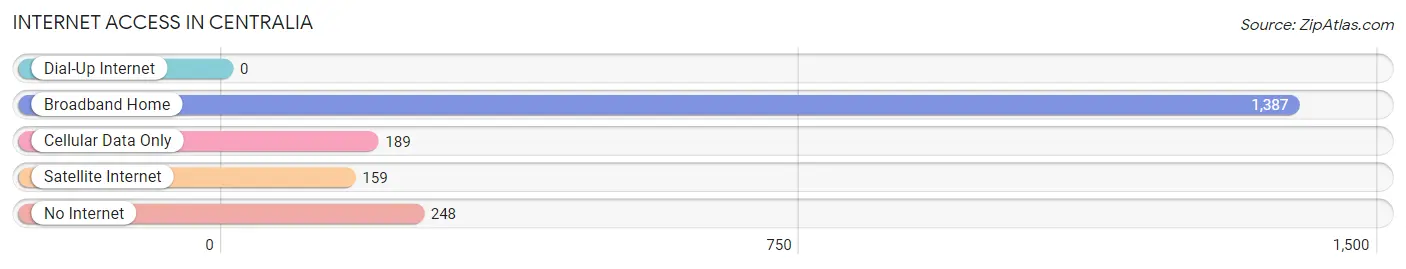
| Internet Type | # Households | % Households |
| Dial-Up Internet | 0 | 0.0% |
| Broadband Home | 1,387 | 72.1% |
| Cellular Data Only | 189 | 9.8% |
| Satellite Internet | 159 | 8.3% |
| No Internet | 248 | 12.9% |
| Total | 1,923 | 100.0% |
Centralia Summary
History
The city of Centralia, Missouri is located in Boone County, Missouri, and is part of the Columbia Metropolitan Statistical Area. The city was founded in 1866 and was named after the Centralia Coal Company, which was the first coal mining company in the area. The city was originally a small farming community, but the discovery of coal in the area in the late 1800s led to the development of the coal mining industry in the area.
The coal mining industry in Centralia was a major contributor to the city’s economy for many years. The coal mines provided jobs for many of the city’s residents and helped to fuel the local economy. The coal industry also helped to bring in new businesses and industries to the area, such as the Centralia Car Works, which was a major employer in the city.
The city of Centralia was also home to a number of other businesses and industries, including a flour mill, a brickyard, a sawmill, and a furniture factory. The city also had a number of churches, schools, and other civic organizations.
In the early 1900s, the city of Centralia experienced a period of growth and prosperity. The city was home to a number of businesses and industries, and the population of the city grew to over 3,000 people.
However, the city’s prosperity was short-lived. In the late 1920s, the coal industry in Centralia began to decline, and the city’s population began to decline as well. By the 1950s, the city’s population had dropped to just over 1,000 people.
Geography
Centralia is located in Boone County, Missouri, and is part of the Columbia Metropolitan Statistical Area. The city is situated in the northern part of the county, and is located about 25 miles north of Columbia. The city is located in the Missouri River Valley, and is surrounded by rolling hills and farmland.
The city of Centralia covers an area of approximately 2.5 square miles, and has an elevation of 845 feet above sea level. The city is located in a humid continental climate zone, and experiences hot, humid summers and cold, wet winters.
Economy
The city of Centralia has a diverse economy, and is home to a number of businesses and industries. The city is home to a number of manufacturing companies, including a furniture factory, a brickyard, and a sawmill. The city is also home to a number of retail stores, restaurants, and other businesses.
The city is also home to a number of educational institutions, including Centralia High School, Centralia Junior High School, and Centralia Elementary School. The city is also home to a number of churches, and is home to the Centralia United Methodist Church.
The city of Centralia is also home to a number of parks and recreational facilities, including Centralia City Park, Centralia Lake, and Centralia Golf Course. The city is also home to a number of cultural and historical attractions, including the Centralia Historical Museum and the Centralia Coal Mine Museum.
Demographics
As of the 2010 census, the city of Centralia had a population of 1,918 people. The city has a population density of 745 people per square mile, and a median household income of $37,917. The city is predominantly white, with 87.3% of the population being white, and 8.3% being African American. The city also has a large Hispanic population, with 8.3% of the population being Hispanic or Latino.
The city of Centralia is home to a number of educational institutions, and the city has a high school graduation rate of 87.3%. The city also has a high rate of college graduates, with 28.3% of the population having a bachelor’s degree or higher. The city also has a high rate of employment, with 79.3% of the population being employed.
Common Questions
What is Per Capita Income in Centralia?
Per Capita income in Centralia is $26,699.
What is the Median Family Income in Centralia?
Median Family Income in Centralia is $69,583.
What is the Median Household income in Centralia?
Median Household Income in Centralia is $61,172.
What is Income or Wage Gap in Centralia?
Income or Wage Gap in Centralia is 33.9%.
Women in Centralia earn 66.1 cents for every dollar earned by a man.
What is Inequality or Gini Index in Centralia?
Inequality or Gini Index in Centralia is 0.38.
What is the Total Population of Centralia?
Total Population of Centralia is 4,570.
What is the Total Male Population of Centralia?
Total Male Population of Centralia is 2,170.
What is the Total Female Population of Centralia?
Total Female Population of Centralia is 2,400.
What is the Ratio of Males per 100 Females in Centralia?
There are 90.42 Males per 100 Females in Centralia.
What is the Ratio of Females per 100 Males in Centralia?
There are 110.60 Females per 100 Males in Centralia.
What is the Median Population Age in Centralia?
Median Population Age in Centralia is 38.7 Years.
What is the Average Family Size in Centralia
Average Family Size in Centralia is 2.8 People.
What is the Average Household Size in Centralia
Average Household Size in Centralia is 2.3 People.
How Large is the Labor Force in Centralia?
There are 2,159 People in the Labor Forcein in Centralia.
What is the Percentage of People in the Labor Force in Centralia?
55.4% of People are in the Labor Force in Centralia.
What is the Unemployment Rate in Centralia?
Unemployment Rate in Centralia is 4.2%.