Riverdale, NE Map & Demographics
Riverdale Map
Riverdale Overview
$23,079
PER CAPITA INCOME
$80,000
AVG FAMILY INCOME
$70,625
AVG HOUSEHOLD INCOME
1.9%
WAGE / INCOME GAP [ % ]
98.1¢/ $1
WAGE / INCOME GAP [ $ ]
0.26
INEQUALITY / GINI INDEX
313
TOTAL POPULATION
181
MALE POPULATION
132
FEMALE POPULATION
137.12
MALES / 100 FEMALES
72.93
FEMALES / 100 MALES
30.1
MEDIAN AGE
3.7
AVG FAMILY SIZE
3.2
AVG HOUSEHOLD SIZE
146
LABOR FORCE [ PEOPLE ]
67.0%
PERCENT IN LABOR FORCE
2.1%
UNEMPLOYMENT RATE
Riverdale Zip Codes
Riverdale Area Codes
Income in Riverdale
Income Overview in Riverdale
Per Capita Income in Riverdale is $23,079, while median incomes of families and households are $80,000 and $70,625 respectively.
| Characteristic | Number | Measure |
| Per Capita Income | 313 | $23,079 |
| Median Family Income | 76 | $80,000 |
| Mean Family Income | 76 | $79,901 |
| Median Household Income | 99 | $70,625 |
| Mean Household Income | 99 | $75,174 |
| Income Deficit | 76 | $0 |
| Wage / Income Gap (%) | 313 | 1.89% |
| Wage / Income Gap ($) | 313 | 98.11¢ per $1 |
| Gini / Inequality Index | 313 | 0.26 |
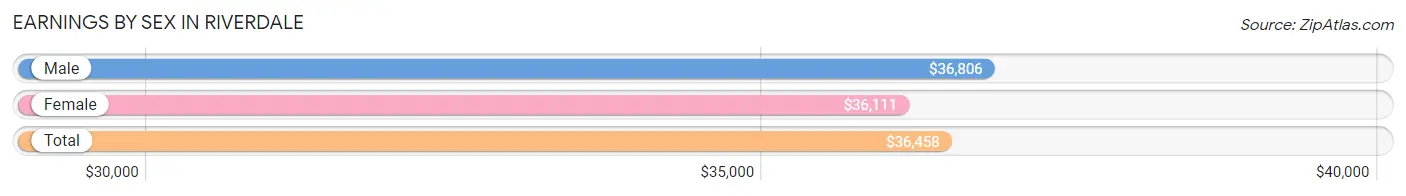
Earnings by Sex in Riverdale
Average Earnings in Riverdale are $36,458, $36,806 for men and $36,111 for women, a difference of 1.9%.
| Sex | Number | Average Earnings |
| Male | 97 (63.4%) | $36,806 |
| Female | 56 (36.6%) | $36,111 |
| Total | 153 (100.0%) | $36,458 |
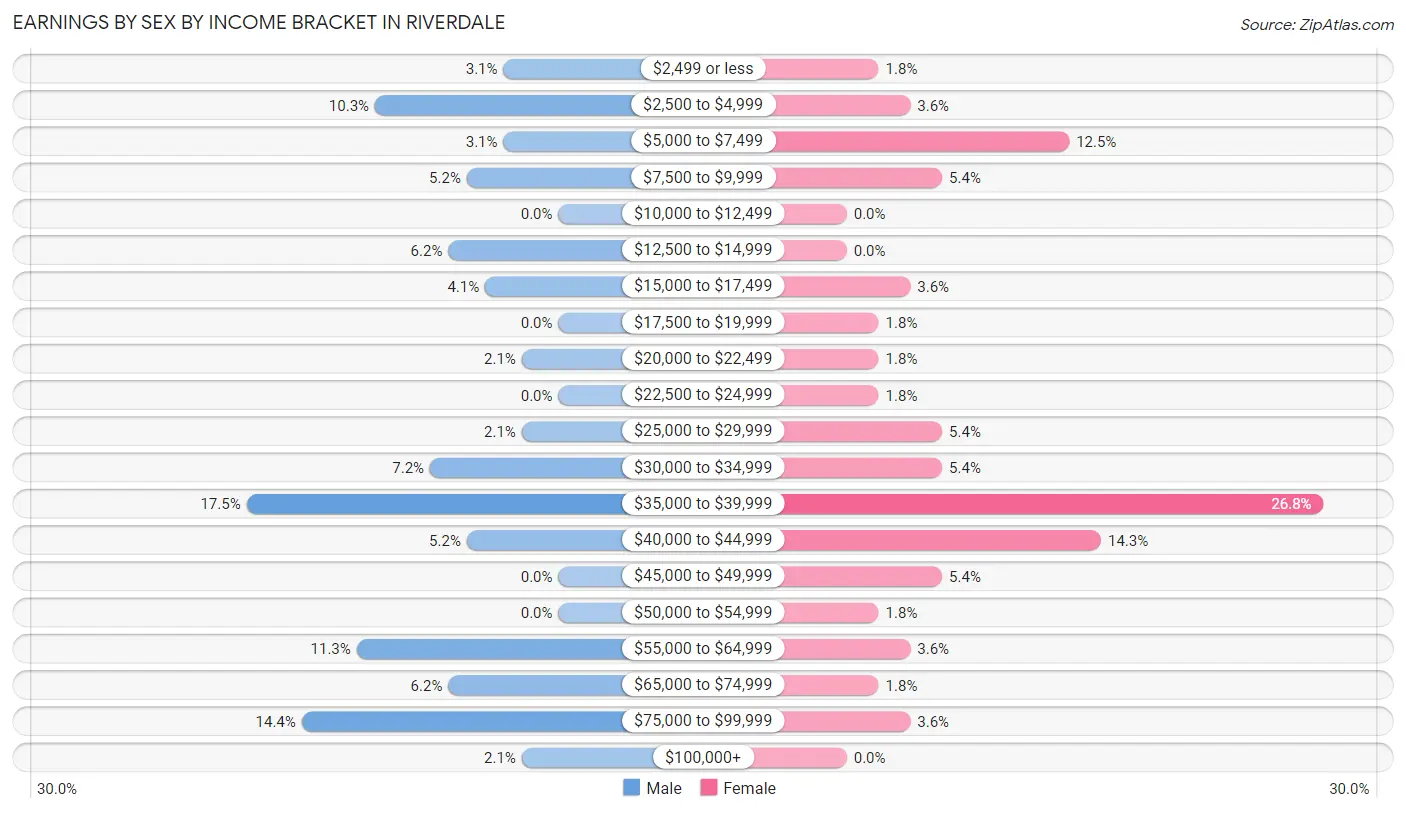
Earnings by Sex by Income Bracket in Riverdale
The most common earnings brackets in Riverdale are $35,000 to $39,999 for men (17 | 17.5%) and $35,000 to $39,999 for women (15 | 26.8%).
| Income | Male | Female |
| $2,499 or less | 3 (3.1%) | 1 (1.8%) |
| $2,500 to $4,999 | 10 (10.3%) | 2 (3.6%) |
| $5,000 to $7,499 | 3 (3.1%) | 7 (12.5%) |
| $7,500 to $9,999 | 5 (5.1%) | 3 (5.4%) |
| $10,000 to $12,499 | 0 (0.0%) | 0 (0.0%) |
| $12,500 to $14,999 | 6 (6.2%) | 0 (0.0%) |
| $15,000 to $17,499 | 4 (4.1%) | 2 (3.6%) |
| $17,500 to $19,999 | 0 (0.0%) | 1 (1.8%) |
| $20,000 to $22,499 | 2 (2.1%) | 1 (1.8%) |
| $22,500 to $24,999 | 0 (0.0%) | 1 (1.8%) |
| $25,000 to $29,999 | 2 (2.1%) | 3 (5.4%) |
| $30,000 to $34,999 | 7 (7.2%) | 3 (5.4%) |
| $35,000 to $39,999 | 17 (17.5%) | 15 (26.8%) |
| $40,000 to $44,999 | 5 (5.1%) | 8 (14.3%) |
| $45,000 to $49,999 | 0 (0.0%) | 3 (5.4%) |
| $50,000 to $54,999 | 0 (0.0%) | 1 (1.8%) |
| $55,000 to $64,999 | 11 (11.3%) | 2 (3.6%) |
| $65,000 to $74,999 | 6 (6.2%) | 1 (1.8%) |
| $75,000 to $99,999 | 14 (14.4%) | 2 (3.6%) |
| $100,000+ | 2 (2.1%) | 0 (0.0%) |
| Total | 97 (100.0%) | 56 (100.0%) |
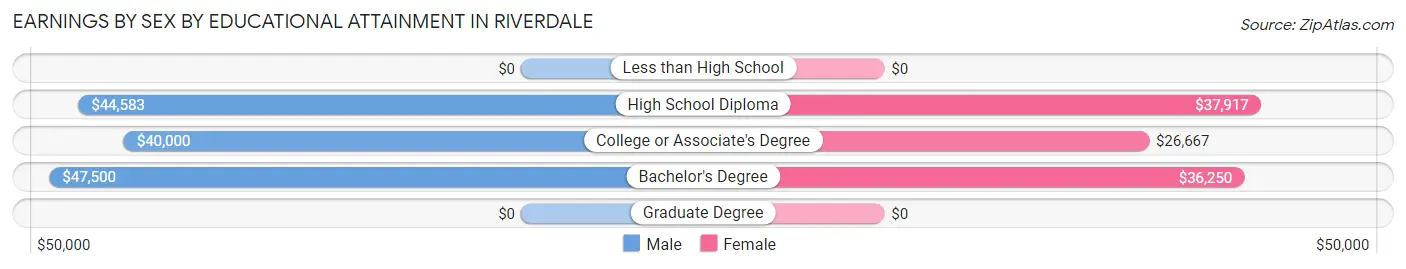
Earnings by Sex by Educational Attainment in Riverdale
Average earnings in Riverdale are $42,813 for men and $36,667 for women, a difference of 14.4%. Men with an educational attainment of bachelor's degree enjoy the highest average annual earnings of $47,500, while those with college or associate's degree education earn the least with $40,000. Women with an educational attainment of high school diploma earn the most with the average annual earnings of $37,917, while those with college or associate's degree education have the smallest earnings of $26,667.
| Educational Attainment | Male Income | Female Income |
| Less than High School | - | - |
| High School Diploma | $44,583 | $37,917 |
| College or Associate's Degree | $40,000 | $26,667 |
| Bachelor's Degree | $47,500 | $36,250 |
| Graduate Degree | - | - |
| Total | $42,813 | $36,667 |
Family Income in Riverdale
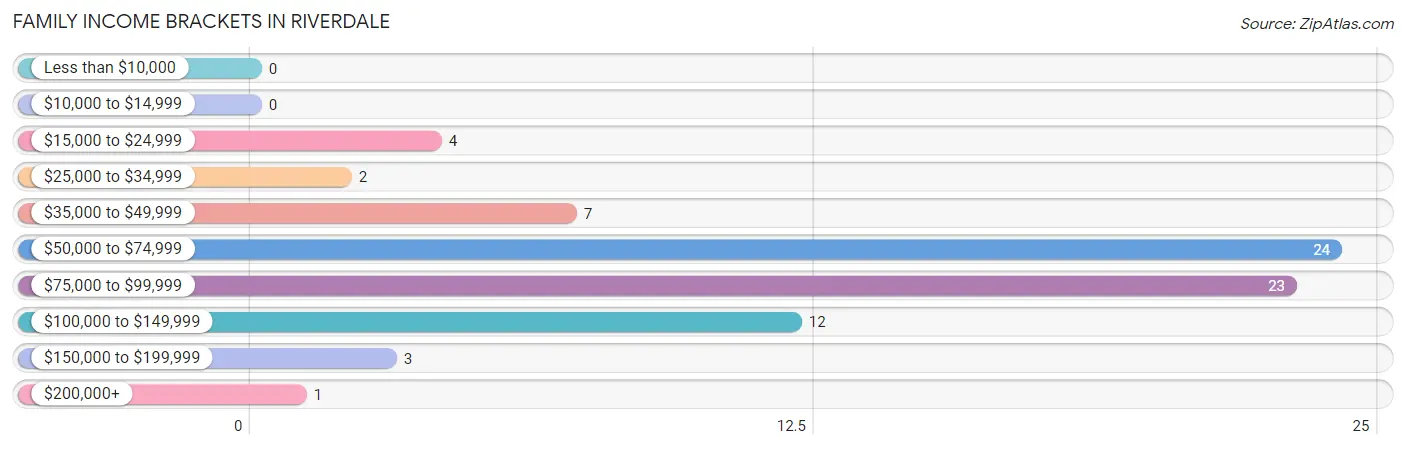
Family Income Brackets in Riverdale
According to the Riverdale family income data, there are 24 families falling into the $50,000 to $74,999 income range, which is the most common income bracket and makes up 31.6% of all families.
| Income Bracket | # Families | % Families |
| Less than $10,000 | 0 | 0.0% |
| $10,000 to $14,999 | 0 | 0.0% |
| $15,000 to $24,999 | 4 | 5.3% |
| $25,000 to $34,999 | 2 | 2.6% |
| $35,000 to $49,999 | 7 | 9.2% |
| $50,000 to $74,999 | 24 | 31.6% |
| $75,000 to $99,999 | 23 | 30.3% |
| $100,000 to $149,999 | 12 | 15.8% |
| $150,000 to $199,999 | 3 | 3.9% |
| $200,000+ | 1 | 1.3% |
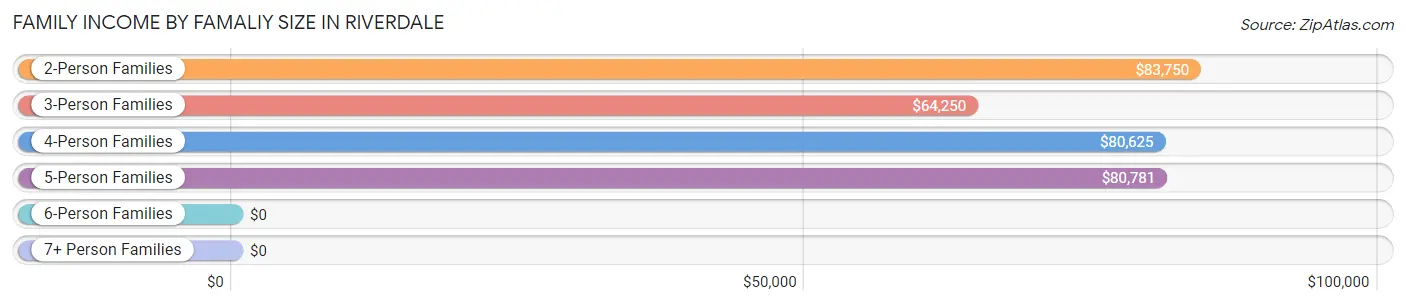
Family Income by Famaliy Size in Riverdale
2-person families (29 | 38.2%) account for the highest median family income in Riverdale with $83,750 per family, while 2-person families (29 | 38.2%) have the highest median income of $41,875 per family member.
| Income Bracket | # Families | Median Income |
| 2-Person Families | 29 (38.2%) | $83,750 |
| 3-Person Families | 15 (19.7%) | $64,250 |
| 4-Person Families | 11 (14.5%) | $80,625 |
| 5-Person Families | 13 (17.1%) | $80,781 |
| 6-Person Families | 3 (4.0%) | $0 |
| 7+ Person Families | 5 (6.6%) | $0 |
| Total | 76 (100.0%) | $80,000 |
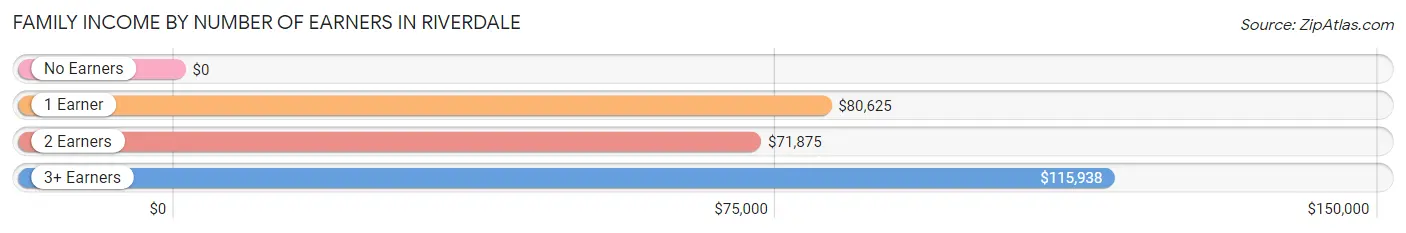
Family Income by Number of Earners in Riverdale
| Number of Earners | # Families | Median Income |
| No Earners | 6 (7.9%) | $0 |
| 1 Earner | 28 (36.8%) | $80,625 |
| 2 Earners | 35 (46.1%) | $71,875 |
| 3+ Earners | 7 (9.2%) | $115,938 |
| Total | 76 (100.0%) | $80,000 |
Household Income in Riverdale
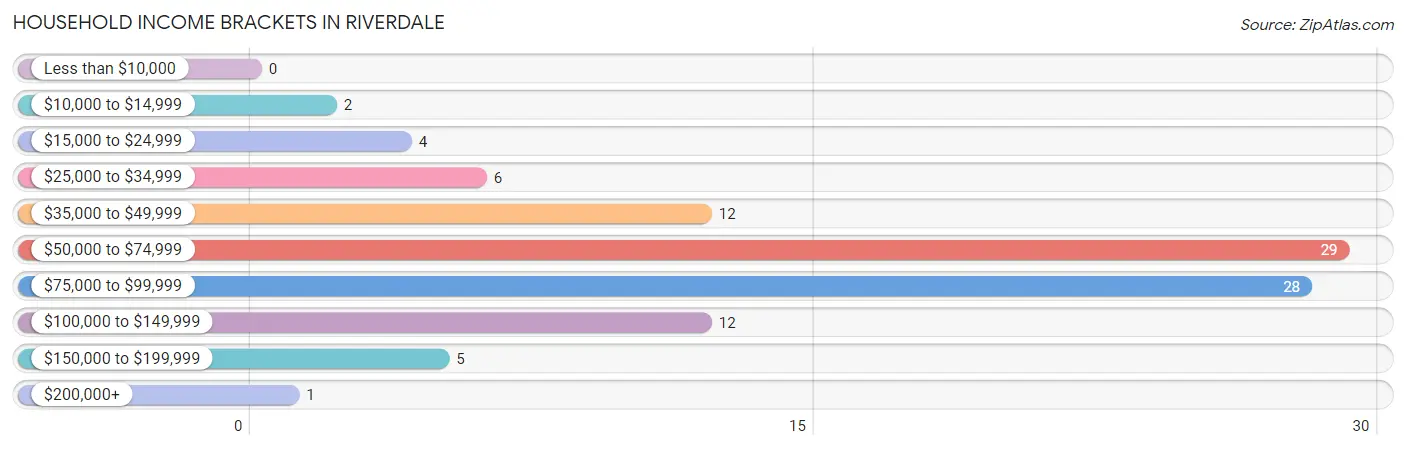
Household Income Brackets in Riverdale
With 29 households falling in the category, the $50,000 to $74,999 income range is the most frequent in Riverdale, accounting for 29.3% of all households.
| Income Bracket | # Households | % Households |
| Less than $10,000 | 0 | 0.0% |
| $10,000 to $14,999 | 2 | 2.0% |
| $15,000 to $24,999 | 4 | 4.0% |
| $25,000 to $34,999 | 6 | 6.1% |
| $35,000 to $49,999 | 12 | 12.1% |
| $50,000 to $74,999 | 29 | 29.3% |
| $75,000 to $99,999 | 28 | 28.3% |
| $100,000 to $149,999 | 12 | 12.1% |
| $150,000 to $199,999 | 5 | 5.1% |
| $200,000+ | 1 | 1.0% |
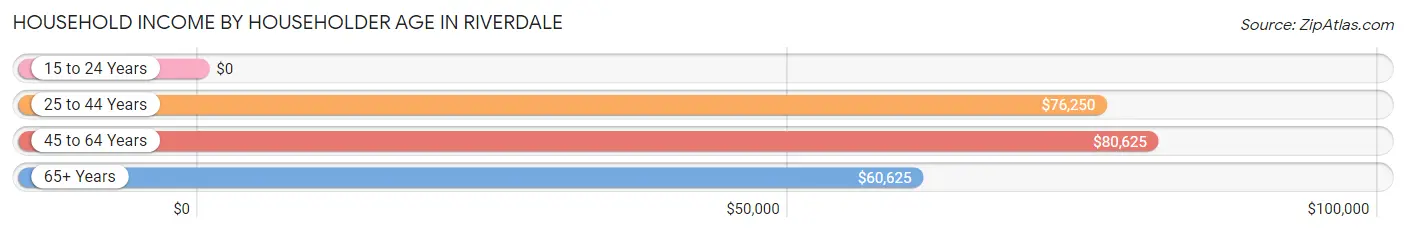
Household Income by Householder Age in Riverdale
The median household income in Riverdale is $70,625, with the highest median household income of $80,625 found in the 45 to 64 years age bracket for the primary householder. A total of 26 households (26.3%) fall into this category. Meanwhile, the 15 to 24 years age bracket for the primary householder has the lowest median household income of $0, with 6 households (6.1%) in this group.
| Income Bracket | # Households | Median Income |
| 15 to 24 Years | 6 (6.1%) | $0 |
| 25 to 44 Years | 44 (44.4%) | $76,250 |
| 45 to 64 Years | 26 (26.3%) | $80,625 |
| 65+ Years | 23 (23.2%) | $60,625 |
| Total | 99 (100.0%) | $70,625 |
Poverty in Riverdale
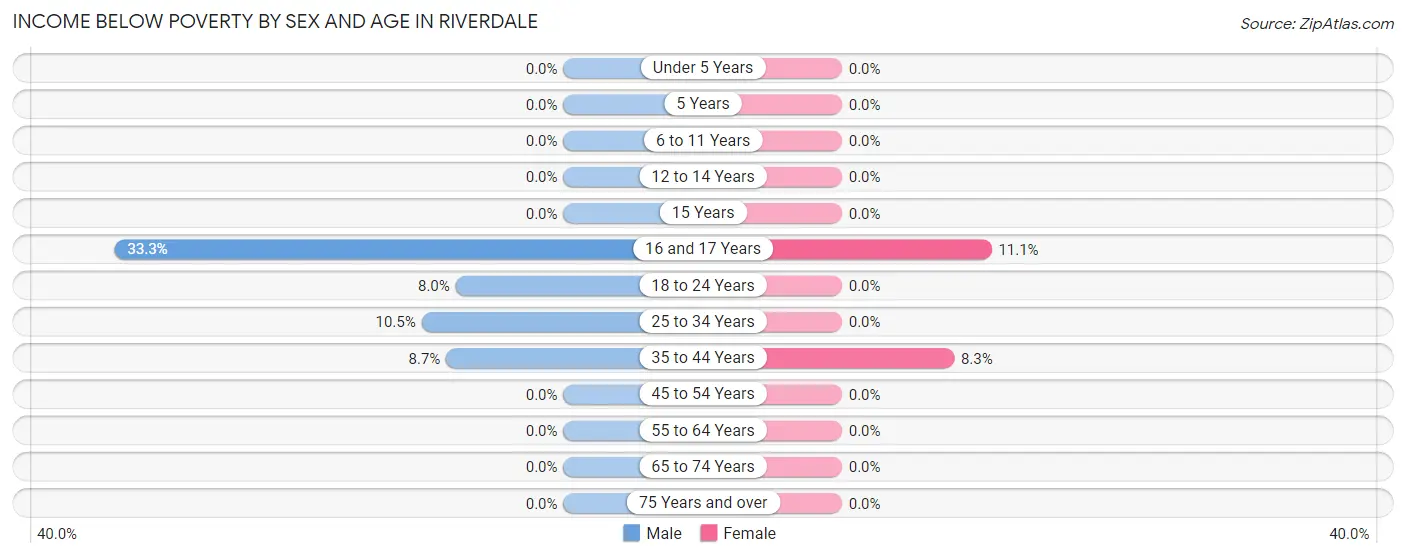
Income Below Poverty by Sex and Age in Riverdale
With 4.4% poverty level for males and 2.3% for females among the residents of Riverdale, 16 and 17 year old males and 16 and 17 year old females are the most vulnerable to poverty, with 2 males (33.3%) and 1 females (11.1%) in their respective age groups living below the poverty level.
| Age Bracket | Male | Female |
| Under 5 Years | 0 (0.0%) | 0 (0.0%) |
| 5 Years | 0 (0.0%) | 0 (0.0%) |
| 6 to 11 Years | 0 (0.0%) | 0 (0.0%) |
| 12 to 14 Years | 0 (0.0%) | 0 (0.0%) |
| 15 Years | 0 (0.0%) | 0 (0.0%) |
| 16 and 17 Years | 2 (33.3%) | 1 (11.1%) |
| 18 to 24 Years | 2 (8.0%) | 0 (0.0%) |
| 25 to 34 Years | 2 (10.5%) | 0 (0.0%) |
| 35 to 44 Years | 2 (8.7%) | 2 (8.3%) |
| 45 to 54 Years | 0 (0.0%) | 0 (0.0%) |
| 55 to 64 Years | 0 (0.0%) | 0 (0.0%) |
| 65 to 74 Years | 0 (0.0%) | 0 (0.0%) |
| 75 Years and over | 0 (0.0%) | 0 (0.0%) |
| Total | 8 (4.4%) | 3 (2.3%) |
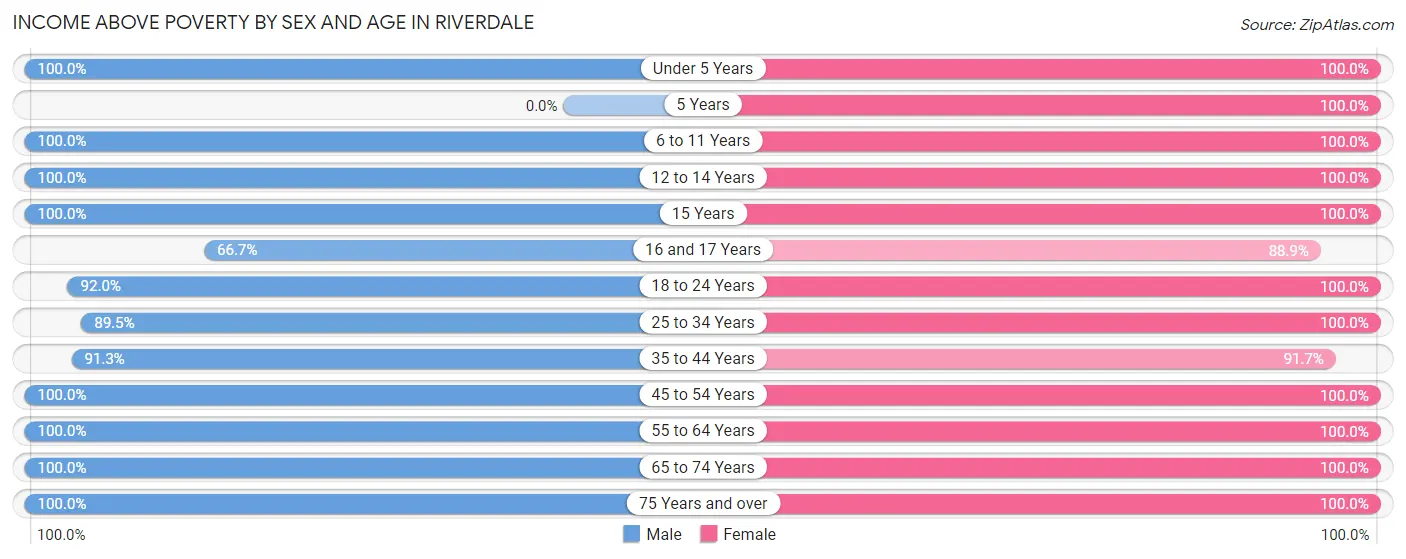
Income Above Poverty by Sex and Age in Riverdale
According to the poverty statistics in Riverdale, males aged under 5 years and females aged under 5 years are the age groups that are most secure financially, with 100.0% of males and 100.0% of females in these age groups living above the poverty line.
| Age Bracket | Male | Female |
| Under 5 Years | 3 (100.0%) | 6 (100.0%) |
| 5 Years | 0 (0.0%) | 4 (100.0%) |
| 6 to 11 Years | 43 (100.0%) | 11 (100.0%) |
| 12 to 14 Years | 18 (100.0%) | 7 (100.0%) |
| 15 Years | 1 (100.0%) | 1 (100.0%) |
| 16 and 17 Years | 4 (66.7%) | 8 (88.9%) |
| 18 to 24 Years | 23 (92.0%) | 11 (100.0%) |
| 25 to 34 Years | 17 (89.5%) | 12 (100.0%) |
| 35 to 44 Years | 21 (91.3%) | 22 (91.7%) |
| 45 to 54 Years | 17 (100.0%) | 15 (100.0%) |
| 55 to 64 Years | 13 (100.0%) | 10 (100.0%) |
| 65 to 74 Years | 7 (100.0%) | 8 (100.0%) |
| 75 Years and over | 6 (100.0%) | 13 (100.0%) |
| Total | 173 (95.6%) | 128 (97.7%) |
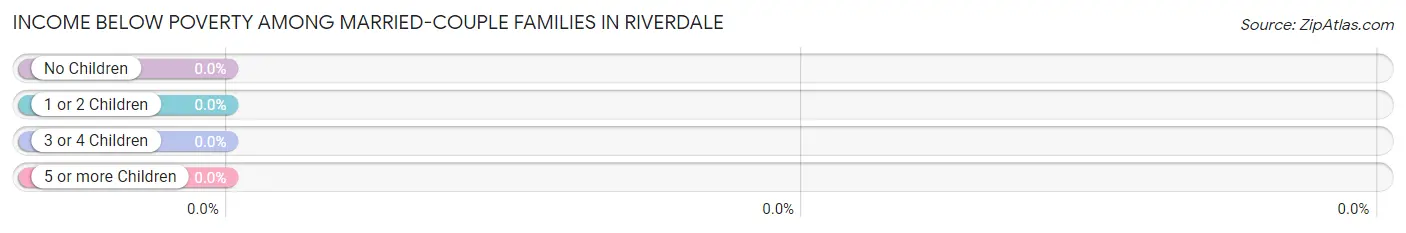
Income Below Poverty Among Married-Couple Families in Riverdale
| Children | Above Poverty | Below Poverty |
| No Children | 22 (100.0%) | 0 (0.0%) |
| 1 or 2 Children | 21 (100.0%) | 0 (0.0%) |
| 3 or 4 Children | 19 (100.0%) | 0 (0.0%) |
| 5 or more Children | 1 (100.0%) | 0 (0.0%) |
| Total | 63 (100.0%) | 0 (0.0%) |
Income Below Poverty Among Single-Parent Households in Riverdale
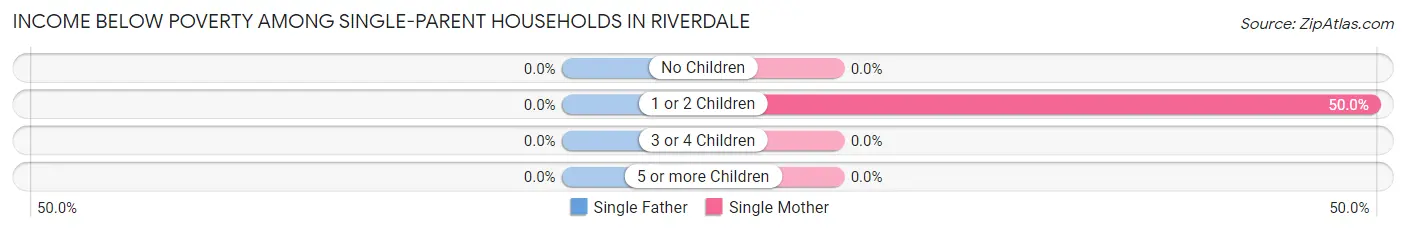
| Children | Single Father | Single Mother |
| No Children | 0 (0.0%) | 0 (0.0%) |
| 1 or 2 Children | 0 (0.0%) | 2 (50.0%) |
| 3 or 4 Children | 0 (0.0%) | 0 (0.0%) |
| 5 or more Children | 0 (0.0%) | 0 (0.0%) |
| Total | 0 (0.0%) | 2 (22.2%) |
Income Below Poverty Among Married-Couple vs Single-Parent Households in Riverdale
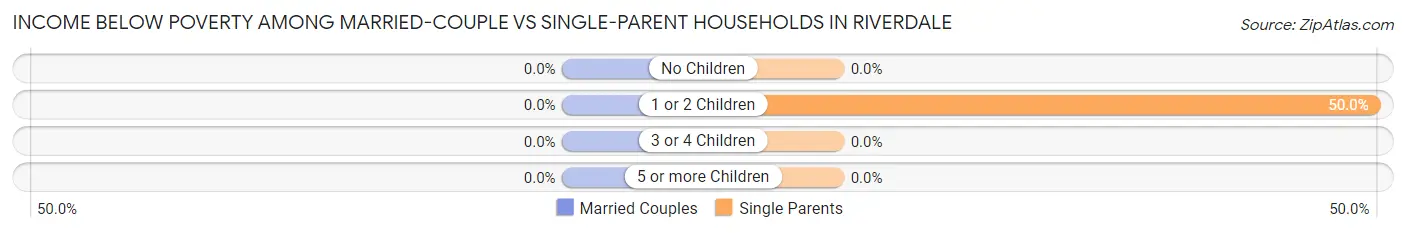
| Children | Married-Couple Families | Single-Parent Households |
| No Children | 0 (0.0%) | 0 (0.0%) |
| 1 or 2 Children | 0 (0.0%) | 2 (50.0%) |
| 3 or 4 Children | 0 (0.0%) | 0 (0.0%) |
| 5 or more Children | 0 (0.0%) | 0 (0.0%) |
| Total | 0 (0.0%) | 2 (15.4%) |
Race in Riverdale
The most populous races in Riverdale are White / Caucasian (307 | 98.1%), Hispanic or Latino (19 | 6.1%), and Native / Alaskan (3 | 1.0%).
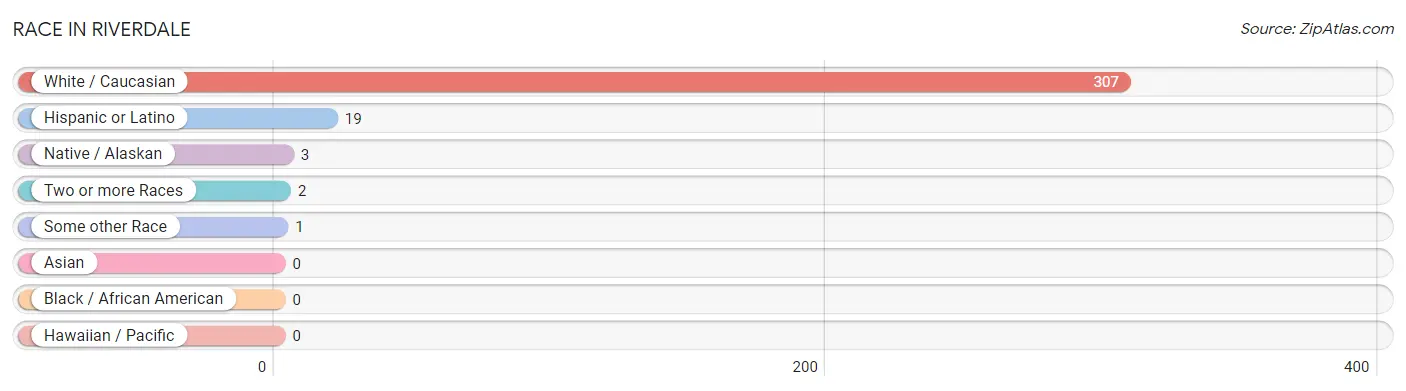
| Race | # Population | % Population |
| Asian | 0 | 0.0% |
| Black / African American | 0 | 0.0% |
| Hawaiian / Pacific | 0 | 0.0% |
| Hispanic or Latino | 19 | 6.1% |
| Native / Alaskan | 3 | 1.0% |
| White / Caucasian | 307 | 98.1% |
| Two or more Races | 2 | 0.6% |
| Some other Race | 1 | 0.3% |
| Total | 313 | 100.0% |
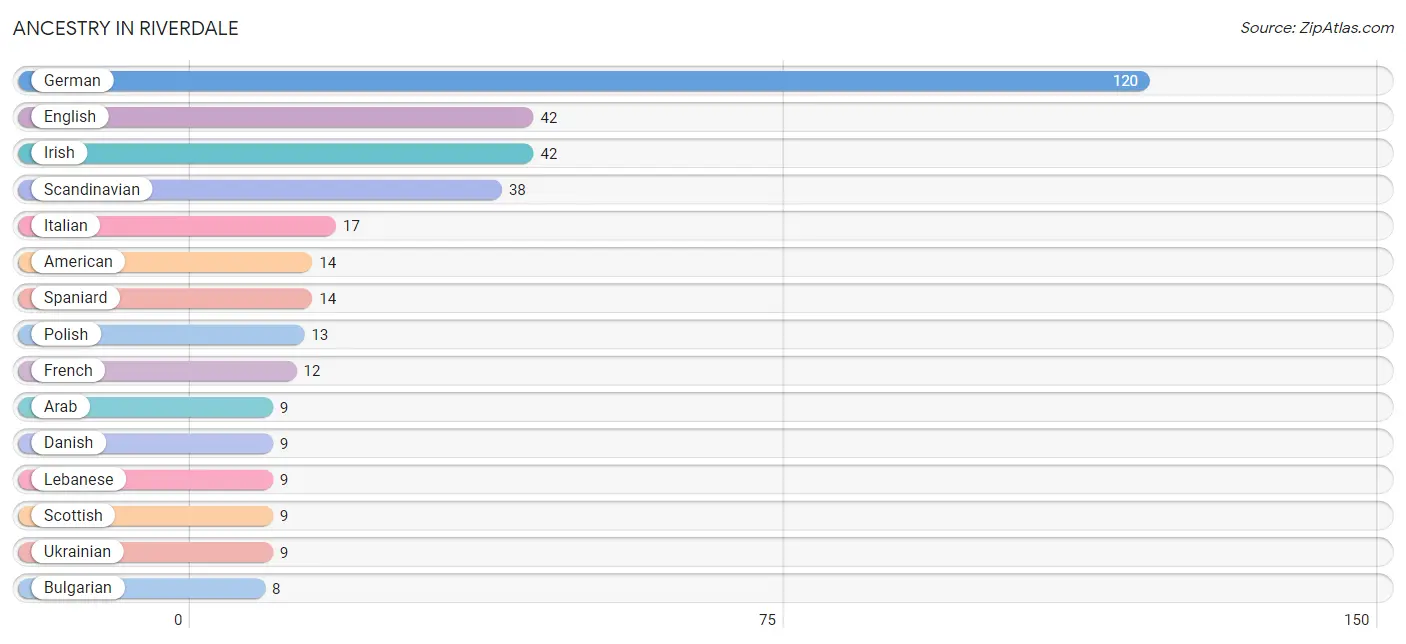
Ancestry in Riverdale
The most populous ancestries reported in Riverdale are German (120 | 38.3%), English (42 | 13.4%), Irish (42 | 13.4%), Scandinavian (38 | 12.1%), and Italian (17 | 5.4%), together accounting for 82.8% of all Riverdale residents.
| Ancestry | # Population | % Population |
| American | 14 | 4.5% |
| Arab | 9 | 2.9% |
| Bulgarian | 8 | 2.6% |
| Czech | 5 | 1.6% |
| Czechoslovakian | 2 | 0.6% |
| Danish | 9 | 2.9% |
| Dutch | 5 | 1.6% |
| English | 42 | 13.4% |
| European | 3 | 1.0% |
| French | 12 | 3.8% |
| German | 120 | 38.3% |
| Irish | 42 | 13.4% |
| Italian | 17 | 5.4% |
| Lebanese | 9 | 2.9% |
| Mexican | 5 | 1.6% |
| Northern European | 2 | 0.6% |
| Norwegian | 6 | 1.9% |
| Polish | 13 | 4.2% |
| Russian | 2 | 0.6% |
| Scandinavian | 38 | 12.1% |
| Scotch-Irish | 6 | 1.9% |
| Scottish | 9 | 2.9% |
| Sioux | 3 | 1.0% |
| Spaniard | 14 | 4.5% |
| Swedish | 5 | 1.6% |
| Ukrainian | 9 | 2.9% | View All 26 Rows |
Immigrants in Riverdale
The most numerous immigrant groups reported in Riverdale came from Eastern Europe (17 | 5.4%), Europe (17 | 5.4%), Ukraine (9 | 2.9%), and Bulgaria (8 | 2.6%), together accounting for 16.3% of all Riverdale residents.
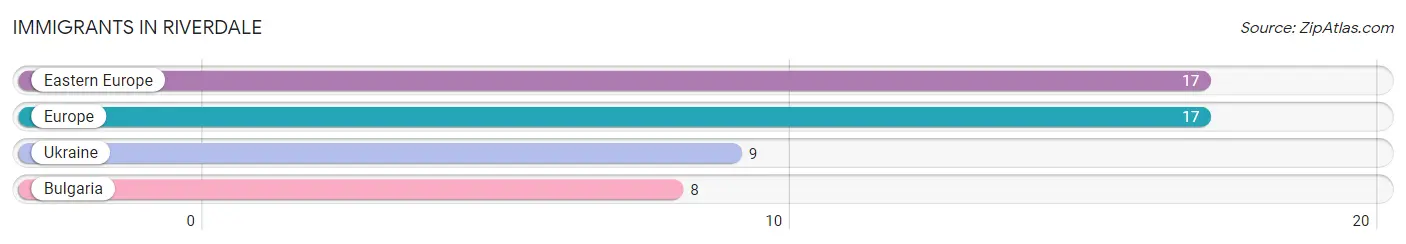
| Immigration Origin | # Population | % Population |
| Bulgaria | 8 | 2.6% |
| Eastern Europe | 17 | 5.4% |
| Europe | 17 | 5.4% |
| Ukraine | 9 | 2.9% | View All 4 Rows |
Sex and Age in Riverdale
Sex and Age in Riverdale
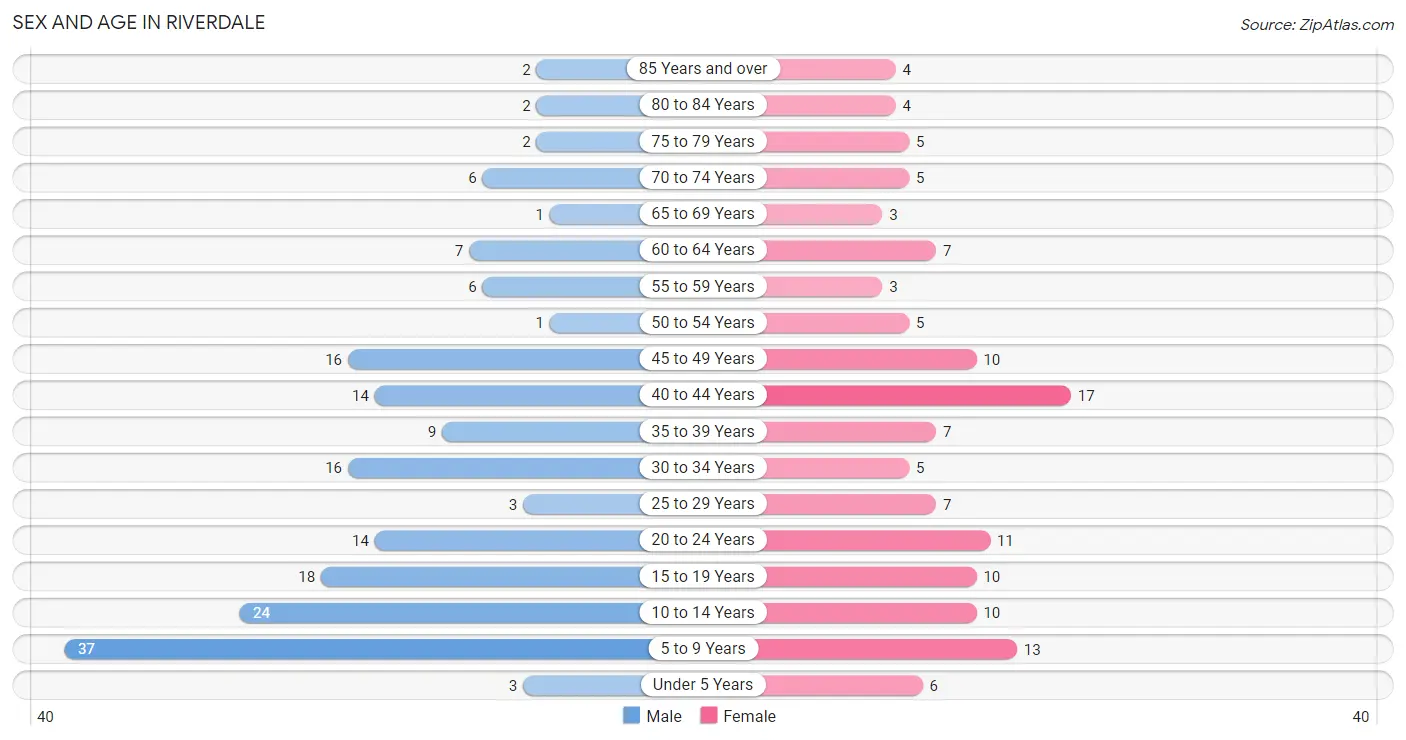
The most populous age groups in Riverdale are 5 to 9 Years (37 | 20.4%) for men and 40 to 44 Years (17 | 12.9%) for women.
| Age Bracket | Male | Female |
| Under 5 Years | 3 (1.7%) | 6 (4.5%) |
| 5 to 9 Years | 37 (20.4%) | 13 (9.9%) |
| 10 to 14 Years | 24 (13.3%) | 10 (7.6%) |
| 15 to 19 Years | 18 (9.9%) | 10 (7.6%) |
| 20 to 24 Years | 14 (7.7%) | 11 (8.3%) |
| 25 to 29 Years | 3 (1.7%) | 7 (5.3%) |
| 30 to 34 Years | 16 (8.8%) | 5 (3.8%) |
| 35 to 39 Years | 9 (5.0%) | 7 (5.3%) |
| 40 to 44 Years | 14 (7.7%) | 17 (12.9%) |
| 45 to 49 Years | 16 (8.8%) | 10 (7.6%) |
| 50 to 54 Years | 1 (0.5%) | 5 (3.8%) |
| 55 to 59 Years | 6 (3.3%) | 3 (2.3%) |
| 60 to 64 Years | 7 (3.9%) | 7 (5.3%) |
| 65 to 69 Years | 1 (0.5%) | 3 (2.3%) |
| 70 to 74 Years | 6 (3.3%) | 5 (3.8%) |
| 75 to 79 Years | 2 (1.1%) | 5 (3.8%) |
| 80 to 84 Years | 2 (1.1%) | 4 (3.0%) |
| 85 Years and over | 2 (1.1%) | 4 (3.0%) |
| Total | 181 (100.0%) | 132 (100.0%) |
Families and Households in Riverdale
Median Family Size in Riverdale
The median family size in Riverdale is 3.66 persons per family, with married-couple families (63 | 82.9%) accounting for the largest median family size of 3.89 persons per family. On the other hand, single male/father families (4 | 5.3%) represent the smallest median family size with 2.50 persons per family.
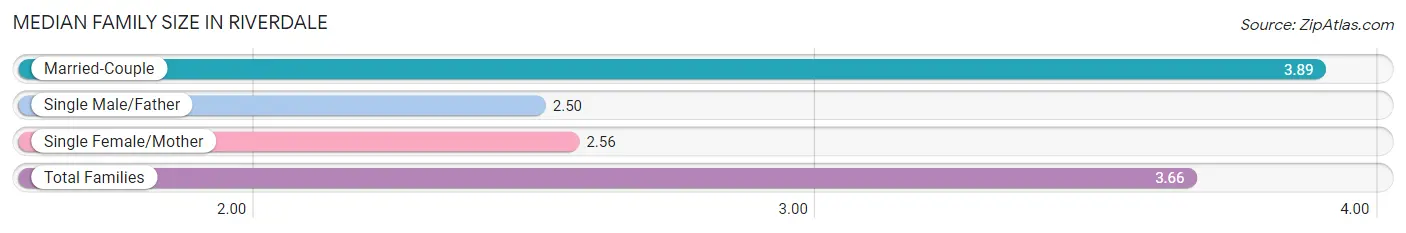
| Family Type | # Families | Family Size |
| Married-Couple | 63 (82.9%) | 3.89 |
| Single Male/Father | 4 (5.3%) | 2.50 |
| Single Female/Mother | 9 (11.8%) | 2.56 |
| Total Families | 76 (100.0%) | 3.66 |
Median Household Size in Riverdale
The median household size in Riverdale is 3.16 persons per household, with married-couple households (63 | 63.6%) accounting for the largest median household size of 3.92 persons per household. non-family households (23 | 23.2%) represent the smallest median household size with 1.26 persons per household.
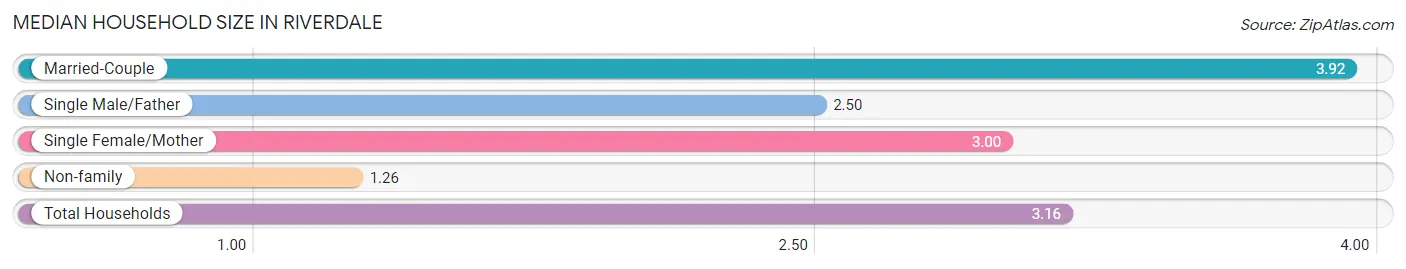
| Household Type | # Households | Household Size |
| Married-Couple | 63 (63.6%) | 3.92 |
| Single Male/Father | 4 (4.0%) | 2.50 |
| Single Female/Mother | 9 (9.1%) | 3.00 |
| Non-family | 23 (23.2%) | 1.26 |
| Total Households | 99 (100.0%) | 3.16 |
Household Size by Marriage Status in Riverdale
Out of a total of 99 households in Riverdale, 76 (76.8%) are family households, while 23 (23.2%) are nonfamily households. The most numerous type of family households are 2-person households, comprising 26, and the most common type of nonfamily households are 1-person households, comprising 18.
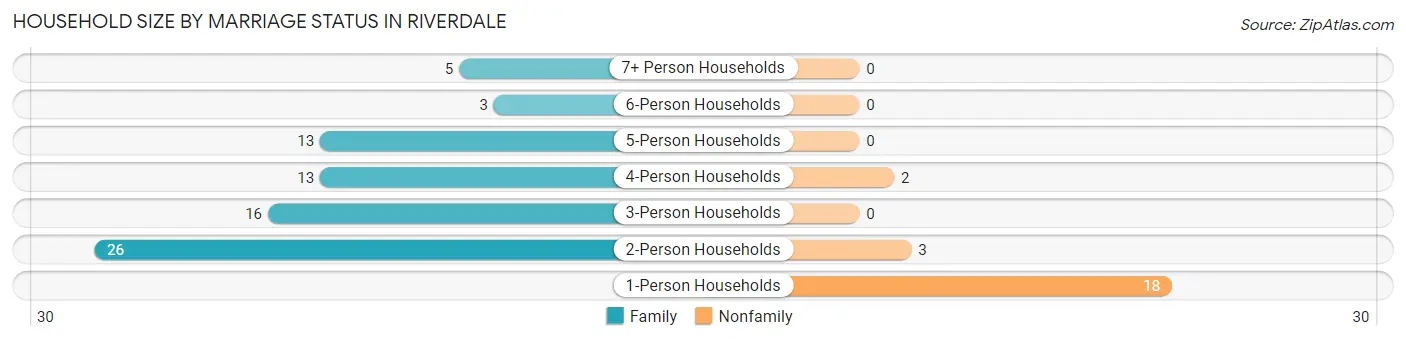
| Household Size | Family Households | Nonfamily Households |
| 1-Person Households | - | 18 (18.2%) |
| 2-Person Households | 26 (26.3%) | 3 (3.0%) |
| 3-Person Households | 16 (16.2%) | 0 (0.0%) |
| 4-Person Households | 13 (13.1%) | 2 (2.0%) |
| 5-Person Households | 13 (13.1%) | 0 (0.0%) |
| 6-Person Households | 3 (3.0%) | 0 (0.0%) |
| 7+ Person Households | 5 (5.1%) | 0 (0.0%) |
| Total | 76 (76.8%) | 23 (23.2%) |
Female Fertility in Riverdale
Fertility by Age in Riverdale
Average fertility rate in Riverdale is 90.0 births per 1,000 women. Women in the age bracket of 35 to 50 years have the highest fertility rate with 118.0 births per 1,000 women. Women in the age bracket of 35 to 50 years acount for 66.7% of all women with births.
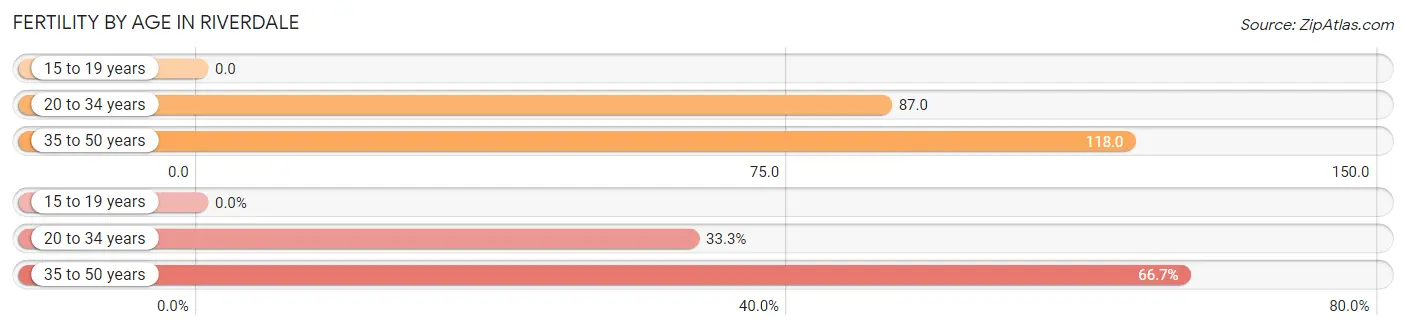
| Age Bracket | Women with Births | Births / 1,000 Women |
| 15 to 19 years | 0 (0.0%) | 0.0 |
| 20 to 34 years | 2 (33.3%) | 87.0 |
| 35 to 50 years | 4 (66.7%) | 118.0 |
| Total | 6 (100.0%) | 90.0 |
Fertility by Age by Marriage Status in Riverdale
66.7% of women with births (6) in Riverdale are married. The highest percentage of unmarried women with births falls into 20 to 34 years age bracket with 100.0% of them unmarried at the time of birth, while the lowest percentage of unmarried women with births belong to 35 to 50 years age bracket with 0.0% of them unmarried.
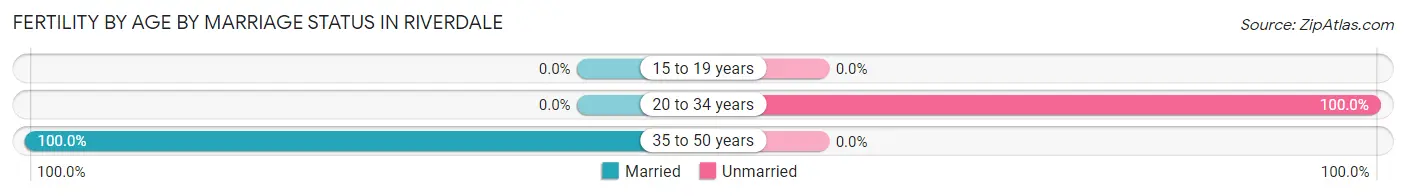
| Age Bracket | Married | Unmarried |
| 15 to 19 years | 0 (0.0%) | 0 (0.0%) |
| 20 to 34 years | 0 (0.0%) | 2 (100.0%) |
| 35 to 50 years | 4 (100.0%) | 0 (0.0%) |
| Total | 4 (66.7%) | 2 (33.3%) |
Fertility by Education in Riverdale
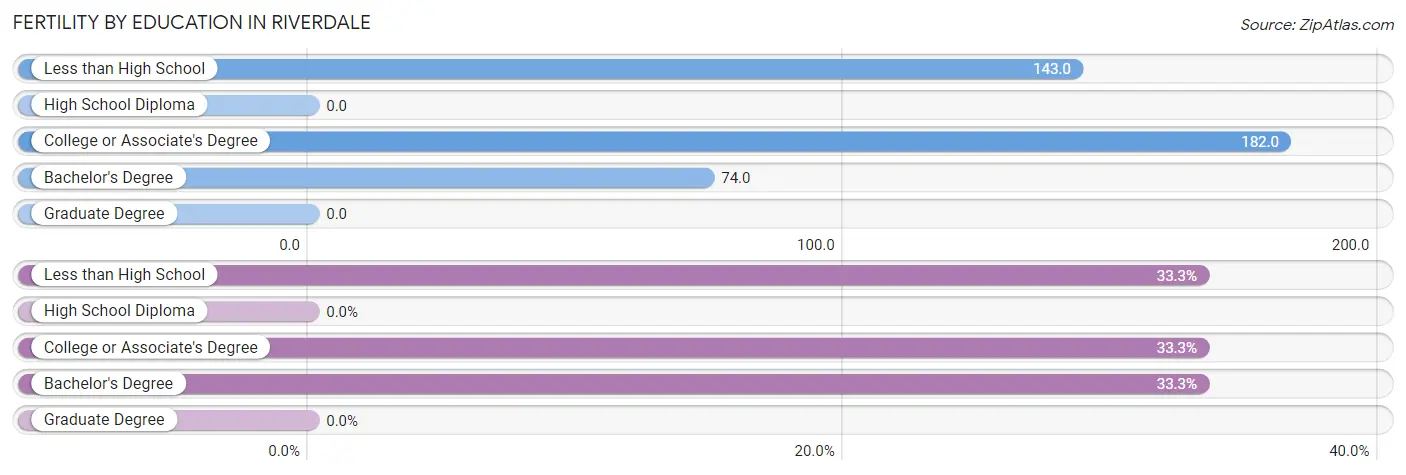
| Educational Attainment | Women with Births | Births / 1,000 Women |
| Less than High School | 2 (33.3%) | 143.0 |
| High School Diploma | 0 (0.0%) | 0.0 |
| College or Associate's Degree | 2 (33.3%) | 182.0 |
| Bachelor's Degree | 2 (33.3%) | 74.0 |
| Graduate Degree | 0 (0.0%) | 0.0 |
| Total | 6 (100.0%) | 90.0 |
Fertility by Education by Marriage Status in Riverdale
33.3% of women with births in Riverdale are unmarried. Women with the educational attainment of college or associate's degree are most likely to be married with 100.0% of them married at childbirth, while women with the educational attainment of less than high school are least likely to be married with 100.0% of them unmarried at childbirth.
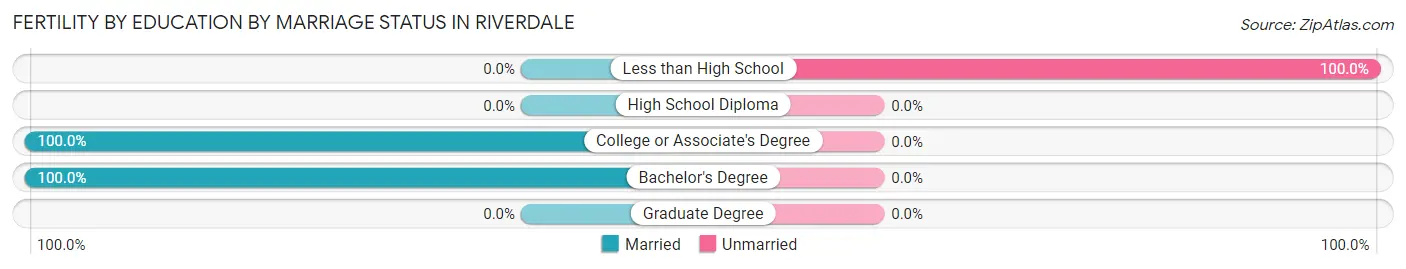
| Educational Attainment | Married | Unmarried |
| Less than High School | 0 (0.0%) | 2 (100.0%) |
| High School Diploma | 0 (0.0%) | 0 (0.0%) |
| College or Associate's Degree | 2 (100.0%) | 0 (0.0%) |
| Bachelor's Degree | 2 (100.0%) | 0 (0.0%) |
| Graduate Degree | 0 (0.0%) | 0 (0.0%) |
| Total | 4 (66.7%) | 2 (33.3%) |
Employment Characteristics in Riverdale
Employment by Class of Employer in Riverdale
Among the 142 employed individuals in Riverdale, private company employees (109 | 76.8%), self-employed (incorporated) (15 | 10.6%), and self-employed (not incorporated) (7 | 4.9%) make up the most common classes of employment.
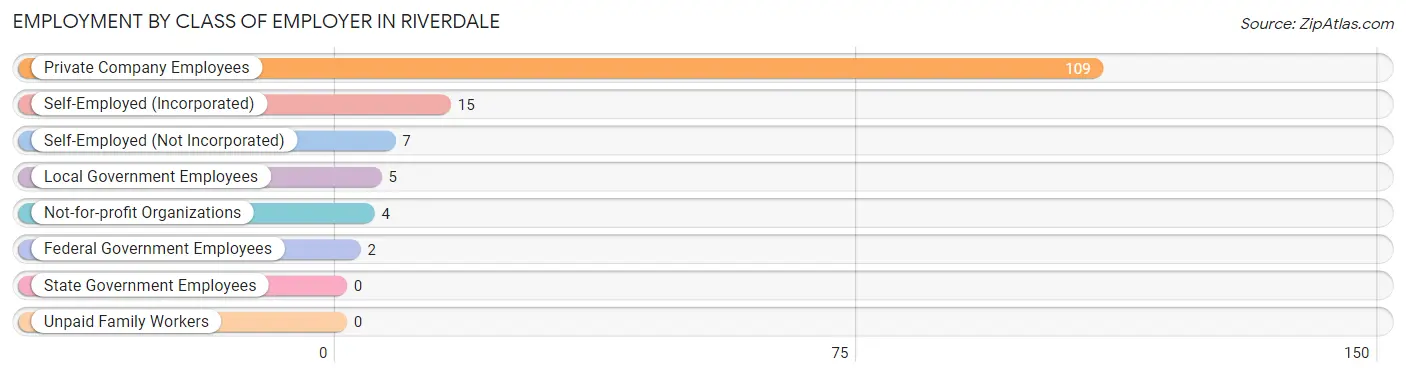
| Employer Class | # Employees | % Employees |
| Private Company Employees | 109 | 76.8% |
| Self-Employed (Incorporated) | 15 | 10.6% |
| Self-Employed (Not Incorporated) | 7 | 4.9% |
| Not-for-profit Organizations | 4 | 2.8% |
| Local Government Employees | 5 | 3.5% |
| State Government Employees | 0 | 0.0% |
| Federal Government Employees | 2 | 1.4% |
| Unpaid Family Workers | 0 | 0.0% |
| Total | 142 | 100.0% |
Employment Status by Age in Riverdale
According to the labor force statistics for Riverdale, out of the total population over 16 years of age (218), 67.0% or 146 individuals are in the labor force, with 2.1% or 3 of them unemployed. The age group with the highest labor force participation rate is 25 to 29 years, with 100.0% or 10 individuals in the labor force. Within the labor force, the 30 to 34 years age range has the highest percentage of unemployed individuals, with 10.5% or 2 of them being unemployed.
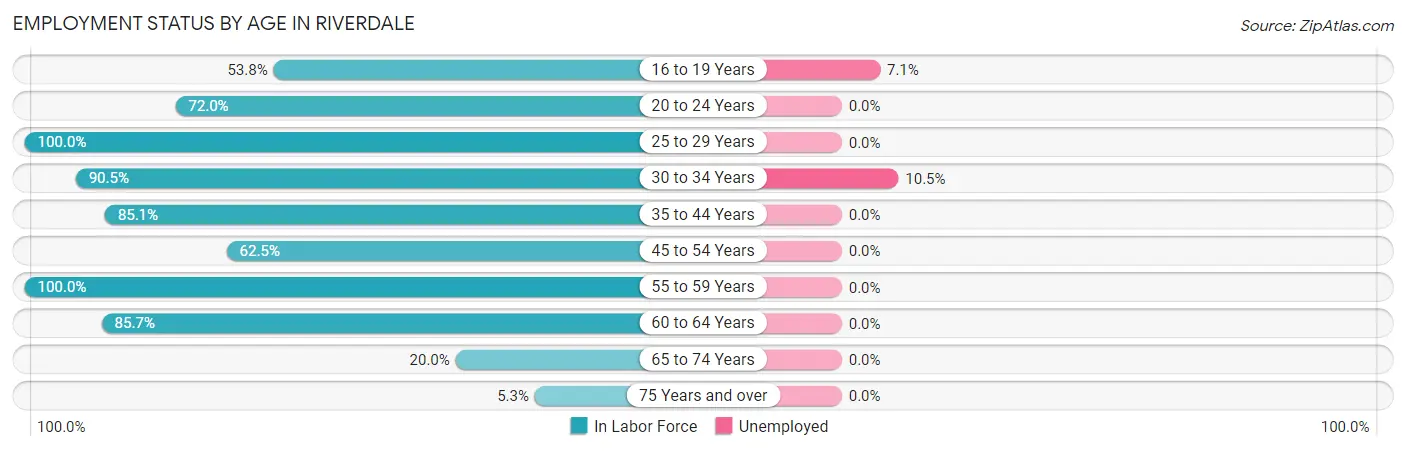
| Age Bracket | In Labor Force | Unemployed |
| 16 to 19 Years | 14 (53.8%) | 1 (7.1%) |
| 20 to 24 Years | 18 (72.0%) | 0 (0.0%) |
| 25 to 29 Years | 10 (100.0%) | 0 (0.0%) |
| 30 to 34 Years | 19 (90.5%) | 2 (10.5%) |
| 35 to 44 Years | 40 (85.1%) | 0 (0.0%) |
| 45 to 54 Years | 20 (62.5%) | 0 (0.0%) |
| 55 to 59 Years | 9 (100.0%) | 0 (0.0%) |
| 60 to 64 Years | 12 (85.7%) | 0 (0.0%) |
| 65 to 74 Years | 3 (20.0%) | 0 (0.0%) |
| 75 Years and over | 1 (5.3%) | 0 (0.0%) |
| Total | 146 (67.0%) | 3 (2.1%) |
Employment Status by Educational Attainment in Riverdale
According to labor force statistics for Riverdale, 82.7% of individuals (110) out of the total population between 25 and 64 years of age (133) are in the labor force, with 1.8% or 2 of them being unemployed. The group with the highest labor force participation rate are those with the educational attainment of less than high school, with 100.0% or 6 individuals in the labor force. Within the labor force, individuals with less than high school education have the highest percentage of unemployment, with 33.3% or 2 of them being unemployed.
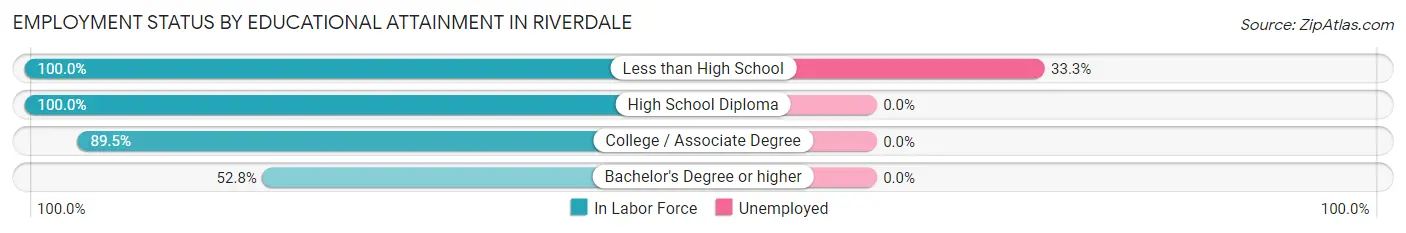
| Educational Attainment | In Labor Force | Unemployed |
| Less than High School | 6 (100.0%) | 2 (33.3%) |
| High School Diploma | 34 (100.0%) | 0 (0.0%) |
| College / Associate Degree | 51 (89.5%) | 0 (0.0%) |
| Bachelor's Degree or higher | 19 (52.8%) | 0 (0.0%) |
| Total | 110 (82.7%) | 2 (1.8%) |
Employment Occupations by Sex in Riverdale
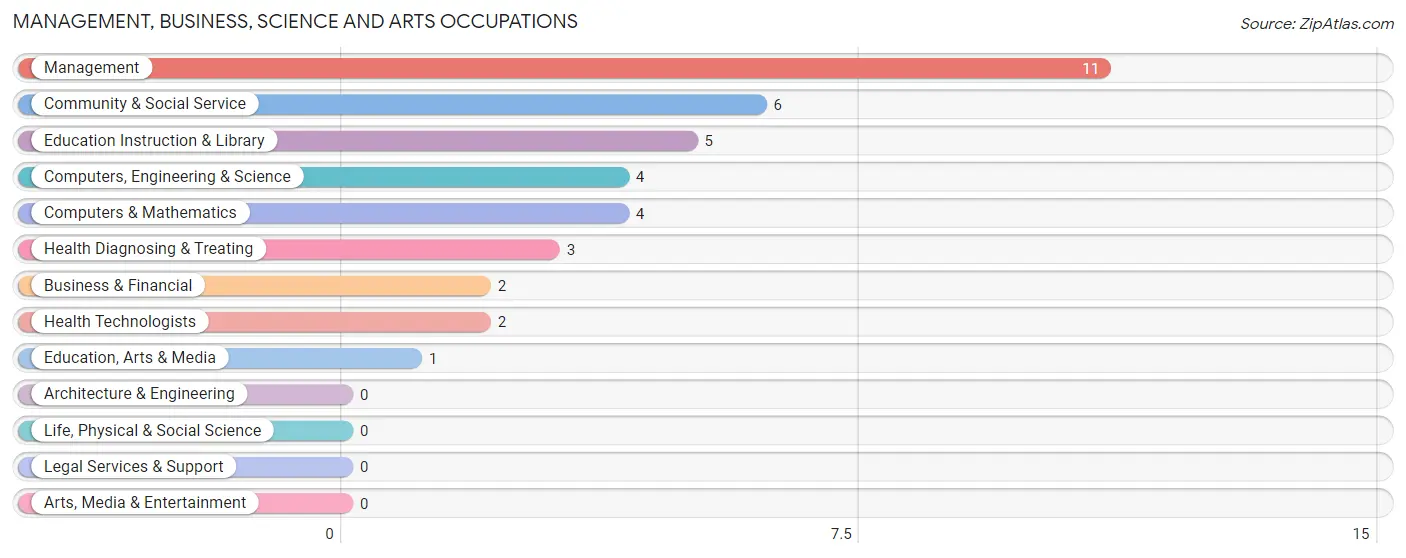
Management, Business, Science and Arts Occupations
The most common Management, Business, Science and Arts occupations in Riverdale are Management (11 | 7.7%), Community & Social Service (6 | 4.2%), Education Instruction & Library (5 | 3.5%), Computers, Engineering & Science (4 | 2.8%), and Computers & Mathematics (4 | 2.8%).
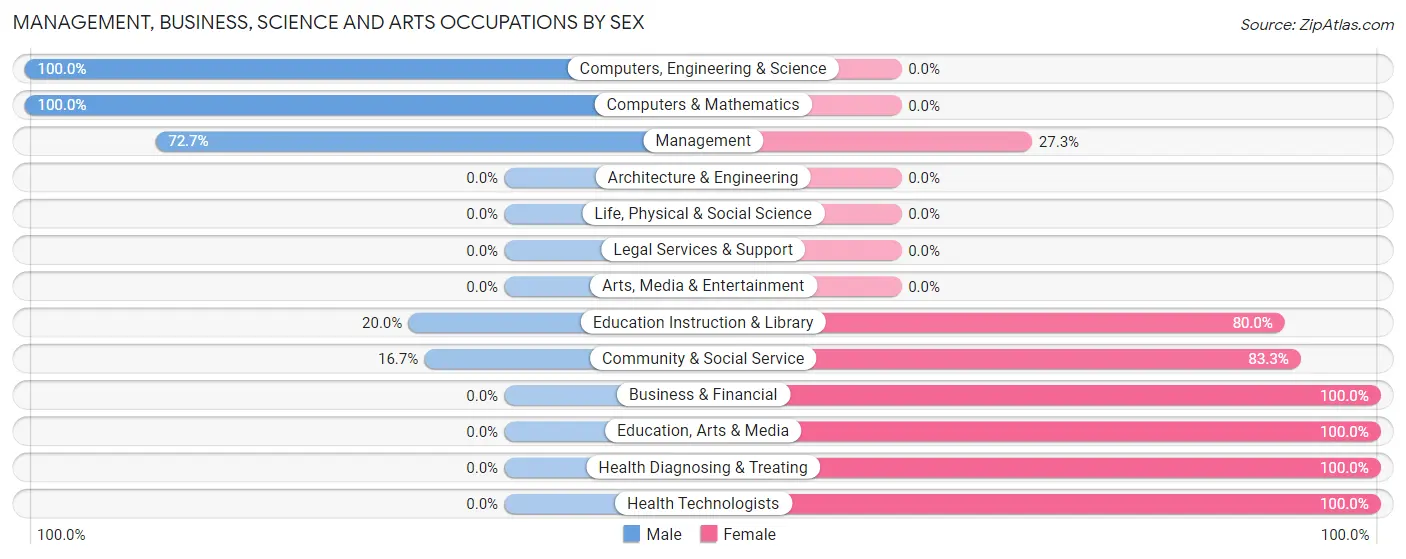
Management, Business, Science and Arts Occupations by Sex
Within the Management, Business, Science and Arts occupations in Riverdale, the most male-oriented occupations are Computers, Engineering & Science (100.0%), Computers & Mathematics (100.0%), and Management (72.7%), while the most female-oriented occupations are Business & Financial (100.0%), Education, Arts & Media (100.0%), and Health Diagnosing & Treating (100.0%).
| Occupation | Male | Female |
| Management | 8 (72.7%) | 3 (27.3%) |
| Business & Financial | 0 (0.0%) | 2 (100.0%) |
| Computers, Engineering & Science | 4 (100.0%) | 0 (0.0%) |
| Computers & Mathematics | 4 (100.0%) | 0 (0.0%) |
| Architecture & Engineering | 0 (0.0%) | 0 (0.0%) |
| Life, Physical & Social Science | 0 (0.0%) | 0 (0.0%) |
| Community & Social Service | 1 (16.7%) | 5 (83.3%) |
| Education, Arts & Media | 0 (0.0%) | 1 (100.0%) |
| Legal Services & Support | 0 (0.0%) | 0 (0.0%) |
| Education Instruction & Library | 1 (20.0%) | 4 (80.0%) |
| Arts, Media & Entertainment | 0 (0.0%) | 0 (0.0%) |
| Health Diagnosing & Treating | 0 (0.0%) | 3 (100.0%) |
| Health Technologists | 0 (0.0%) | 2 (100.0%) |
| Total (Category) | 13 (50.0%) | 13 (50.0%) |
| Total (Overall) | 91 (63.6%) | 52 (36.4%) |
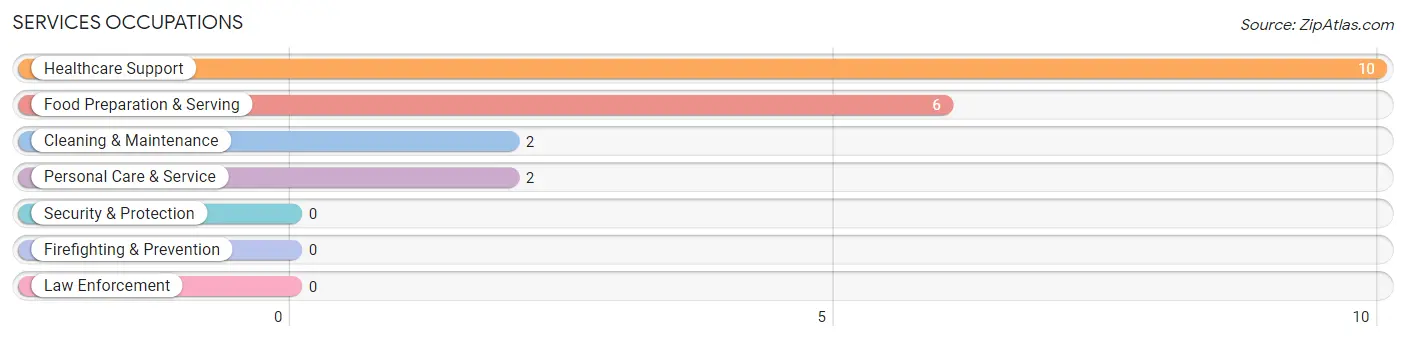
Services Occupations
The most common Services occupations in Riverdale are Healthcare Support (10 | 7.0%), Food Preparation & Serving (6 | 4.2%), Cleaning & Maintenance (2 | 1.4%), and Personal Care & Service (2 | 1.4%).
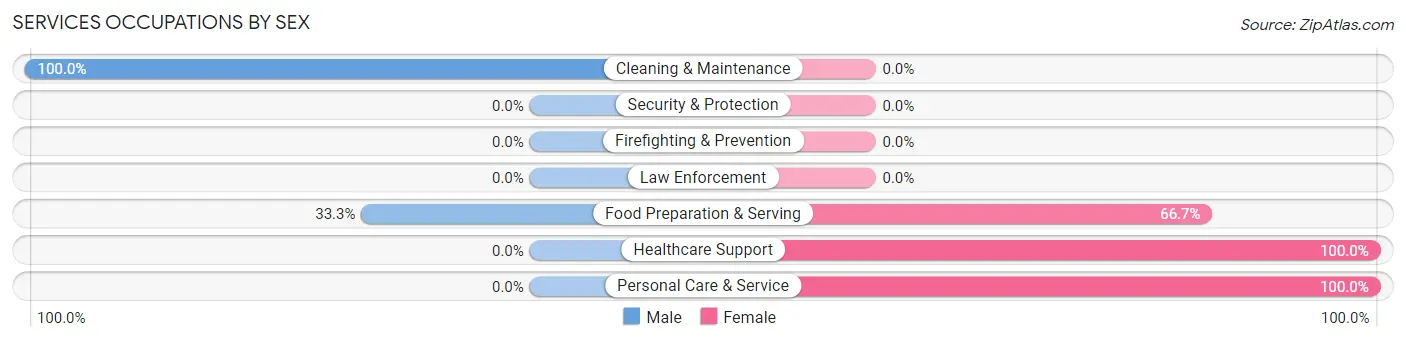
Services Occupations by Sex
Within the Services occupations in Riverdale, the most male-oriented occupations are Cleaning & Maintenance (100.0%), and Food Preparation & Serving (33.3%), while the most female-oriented occupations are Healthcare Support (100.0%), Personal Care & Service (100.0%), and Food Preparation & Serving (66.7%).
| Occupation | Male | Female |
| Healthcare Support | 0 (0.0%) | 10 (100.0%) |
| Security & Protection | 0 (0.0%) | 0 (0.0%) |
| Firefighting & Prevention | 0 (0.0%) | 0 (0.0%) |
| Law Enforcement | 0 (0.0%) | 0 (0.0%) |
| Food Preparation & Serving | 2 (33.3%) | 4 (66.7%) |
| Cleaning & Maintenance | 2 (100.0%) | 0 (0.0%) |
| Personal Care & Service | 0 (0.0%) | 2 (100.0%) |
| Total (Category) | 4 (20.0%) | 16 (80.0%) |
| Total (Overall) | 91 (63.6%) | 52 (36.4%) |
Sales and Office Occupations
The most common Sales and Office occupations in Riverdale are Office & Administration (16 | 11.2%), and Sales & Related (7 | 4.9%).
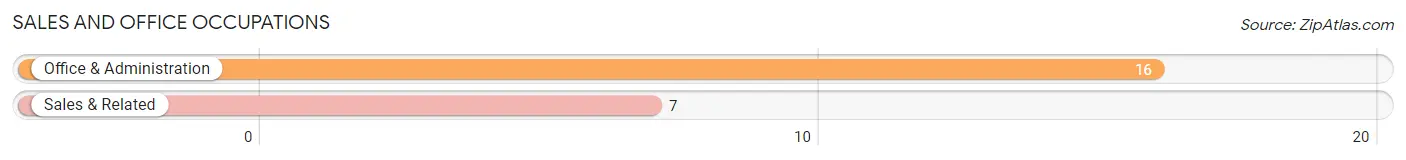
Sales and Office Occupations by Sex
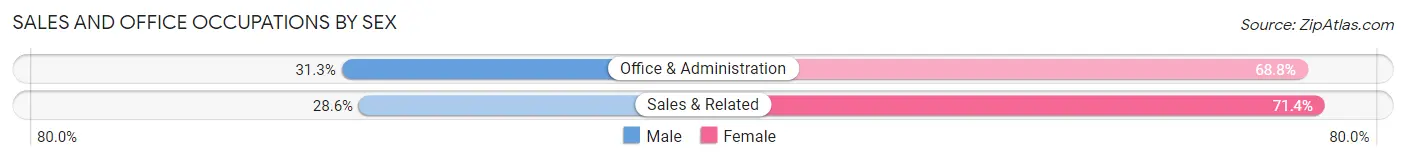
| Occupation | Male | Female |
| Sales & Related | 2 (28.6%) | 5 (71.4%) |
| Office & Administration | 5 (31.2%) | 11 (68.8%) |
| Total (Category) | 7 (30.4%) | 16 (69.6%) |
| Total (Overall) | 91 (63.6%) | 52 (36.4%) |
Natural Resources, Construction and Maintenance Occupations
The most common Natural Resources, Construction and Maintenance occupations in Riverdale are Construction & Extraction (13 | 9.1%), and Installation, Maintenance & Repair (6 | 4.2%).
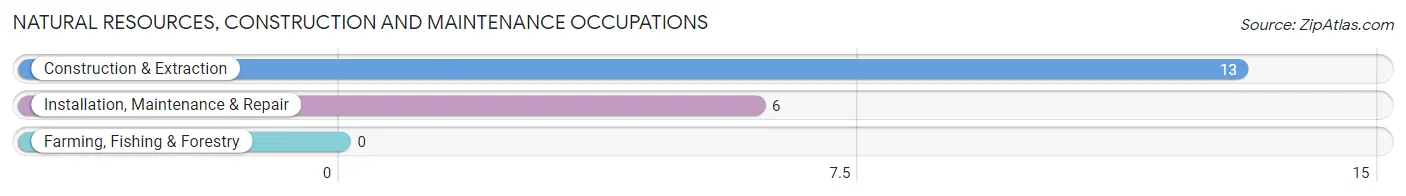
Natural Resources, Construction and Maintenance Occupations by Sex
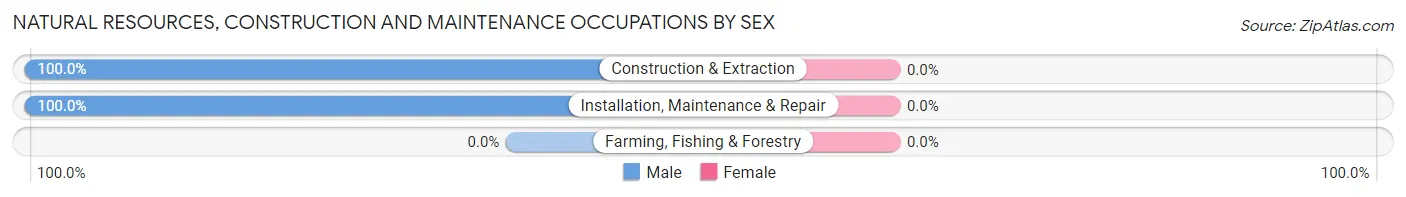
| Occupation | Male | Female |
| Farming, Fishing & Forestry | 0 (0.0%) | 0 (0.0%) |
| Construction & Extraction | 13 (100.0%) | 0 (0.0%) |
| Installation, Maintenance & Repair | 6 (100.0%) | 0 (0.0%) |
| Total (Category) | 19 (100.0%) | 0 (0.0%) |
| Total (Overall) | 91 (63.6%) | 52 (36.4%) |
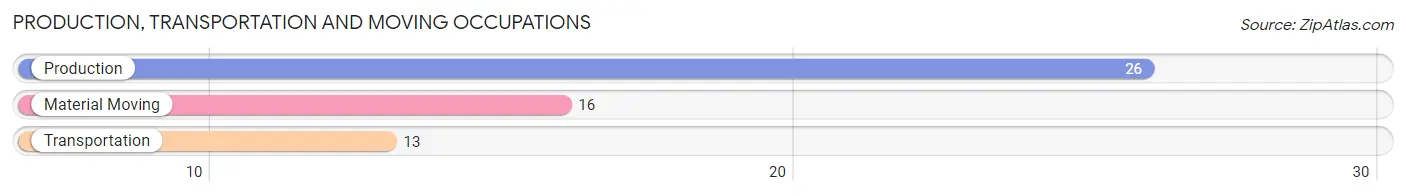
Production, Transportation and Moving Occupations
The most common Production, Transportation and Moving occupations in Riverdale are Production (26 | 18.2%), Material Moving (16 | 11.2%), and Transportation (13 | 9.1%).
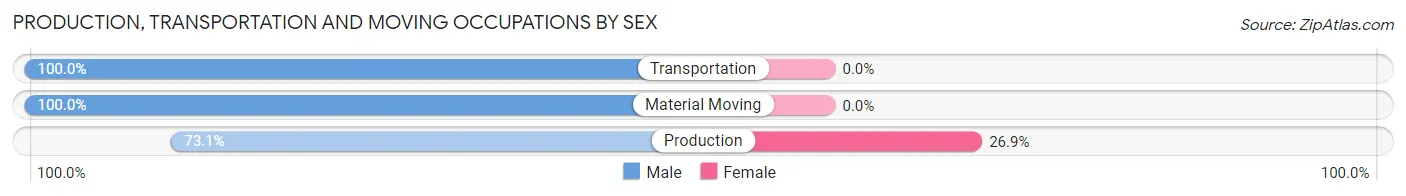
Production, Transportation and Moving Occupations by Sex
| Occupation | Male | Female |
| Production | 19 (73.1%) | 7 (26.9%) |
| Transportation | 13 (100.0%) | 0 (0.0%) |
| Material Moving | 16 (100.0%) | 0 (0.0%) |
| Total (Category) | 48 (87.3%) | 7 (12.7%) |
| Total (Overall) | 91 (63.6%) | 52 (36.4%) |
Employment Industries by Sex in Riverdale
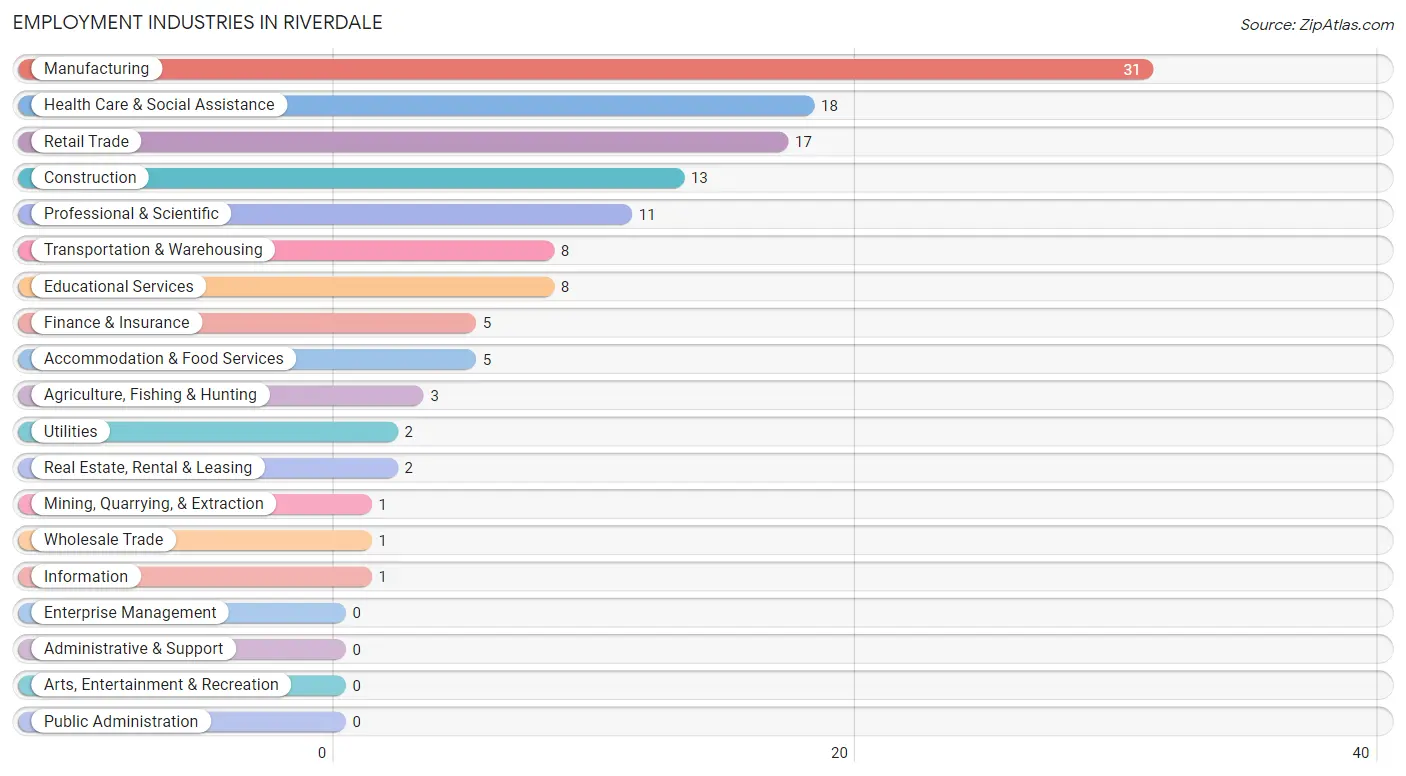
Employment Industries in Riverdale
The major employment industries in Riverdale include Manufacturing (31 | 21.7%), Health Care & Social Assistance (18 | 12.6%), Retail Trade (17 | 11.9%), Construction (13 | 9.1%), and Professional & Scientific (11 | 7.7%).
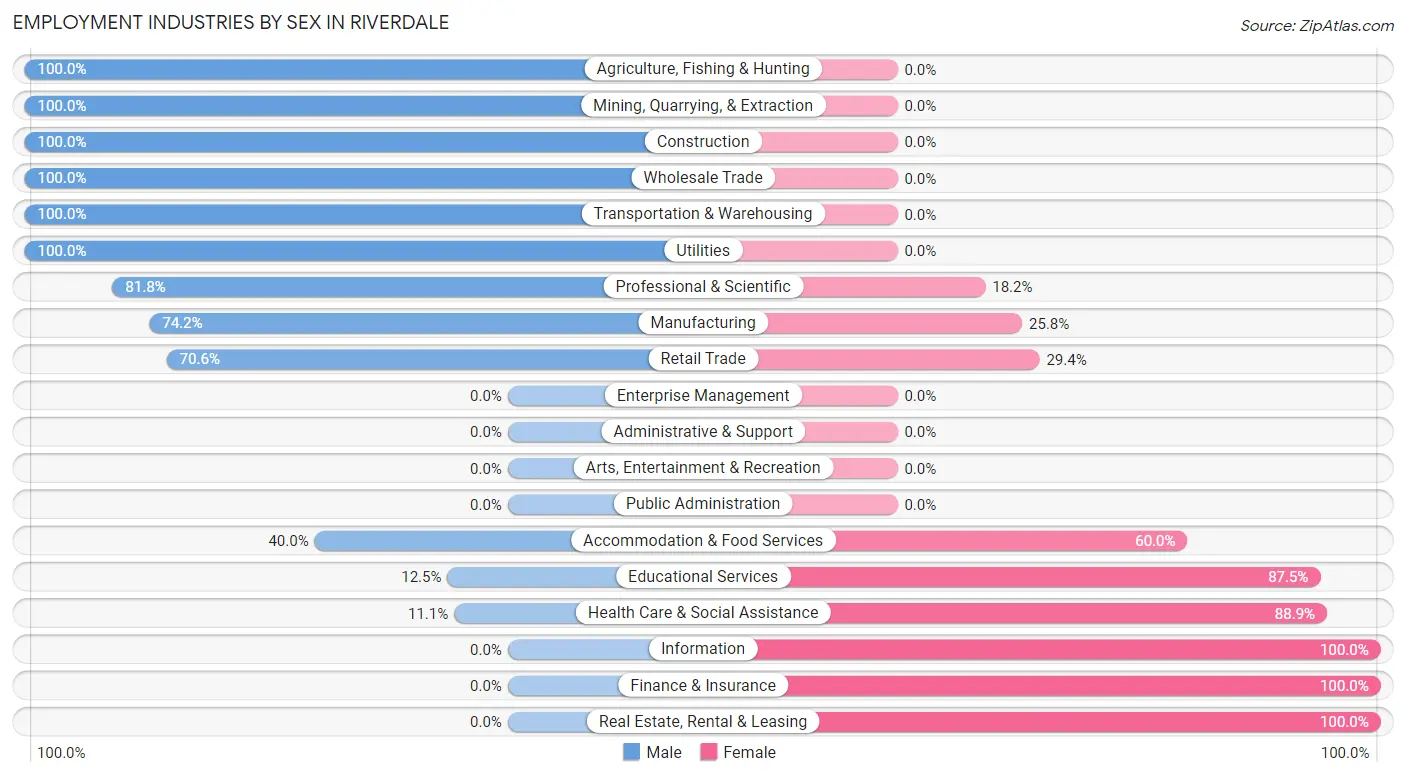
Employment Industries by Sex in Riverdale
The Riverdale industries that see more men than women are Agriculture, Fishing & Hunting (100.0%), Mining, Quarrying, & Extraction (100.0%), and Construction (100.0%), whereas the industries that tend to have a higher number of women are Information (100.0%), Finance & Insurance (100.0%), and Real Estate, Rental & Leasing (100.0%).
| Industry | Male | Female |
| Agriculture, Fishing & Hunting | 3 (100.0%) | 0 (0.0%) |
| Mining, Quarrying, & Extraction | 1 (100.0%) | 0 (0.0%) |
| Construction | 13 (100.0%) | 0 (0.0%) |
| Manufacturing | 23 (74.2%) | 8 (25.8%) |
| Wholesale Trade | 1 (100.0%) | 0 (0.0%) |
| Retail Trade | 12 (70.6%) | 5 (29.4%) |
| Transportation & Warehousing | 8 (100.0%) | 0 (0.0%) |
| Utilities | 2 (100.0%) | 0 (0.0%) |
| Information | 0 (0.0%) | 1 (100.0%) |
| Finance & Insurance | 0 (0.0%) | 5 (100.0%) |
| Real Estate, Rental & Leasing | 0 (0.0%) | 2 (100.0%) |
| Professional & Scientific | 9 (81.8%) | 2 (18.2%) |
| Enterprise Management | 0 (0.0%) | 0 (0.0%) |
| Administrative & Support | 0 (0.0%) | 0 (0.0%) |
| Educational Services | 1 (12.5%) | 7 (87.5%) |
| Health Care & Social Assistance | 2 (11.1%) | 16 (88.9%) |
| Arts, Entertainment & Recreation | 0 (0.0%) | 0 (0.0%) |
| Accommodation & Food Services | 2 (40.0%) | 3 (60.0%) |
| Public Administration | 0 (0.0%) | 0 (0.0%) |
| Total | 91 (63.6%) | 52 (36.4%) |
Education in Riverdale
School Enrollment in Riverdale
The most common levels of schooling among the 111 students in Riverdale are elementary school (35 | 31.5%), high school (32 | 28.8%), and middle school (24 | 21.6%).
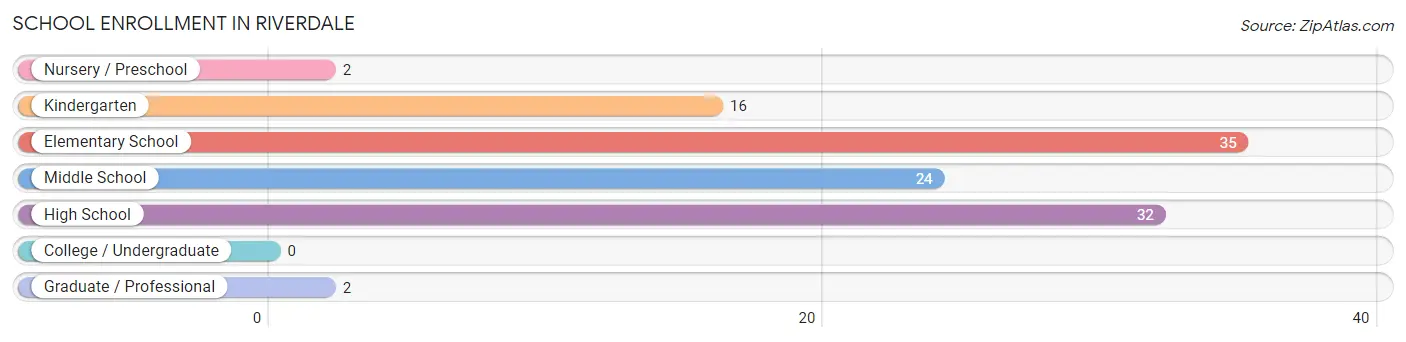
| School Level | # Students | % Students |
| Nursery / Preschool | 2 | 1.8% |
| Kindergarten | 16 | 14.4% |
| Elementary School | 35 | 31.5% |
| Middle School | 24 | 21.6% |
| High School | 32 | 28.8% |
| College / Undergraduate | 0 | 0.0% |
| Graduate / Professional | 2 | 1.8% |
| Total | 111 | 100.0% |
School Enrollment by Age by Funding Source in Riverdale
Out of a total of 111 students who are enrolled in schools in Riverdale, 22 (19.8%) attend a private institution, while the remaining 89 (80.2%) are enrolled in public schools. The age group of 15 to 17 year olds has the highest likelihood of being enrolled in private schools, with 4 (23.5% in the age bracket) enrolled. Conversely, the age group of 18 to 19 year olds has the lowest likelihood of being enrolled in a private school, with 10 (100.0% in the age bracket) attending a public institution.
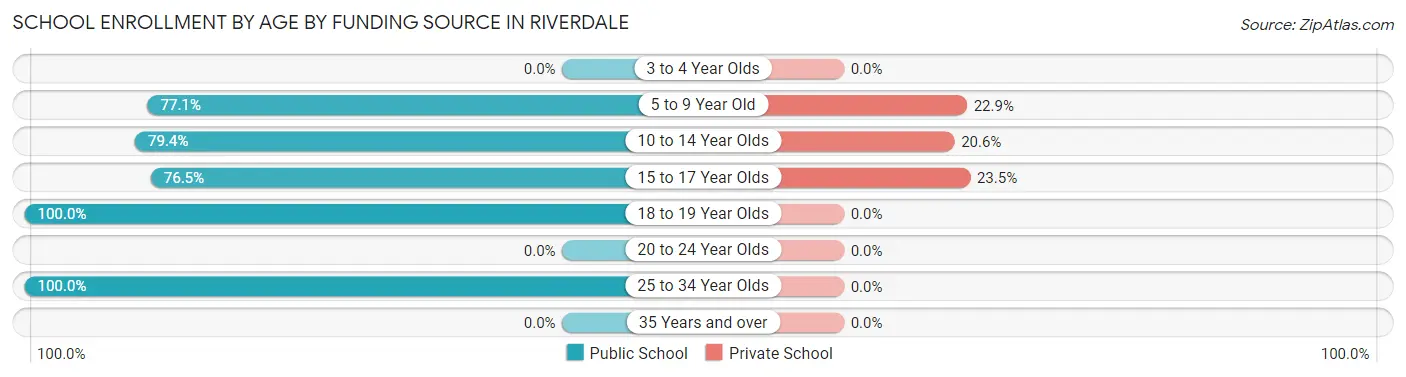
| Age Bracket | Public School | Private School |
| 3 to 4 Year Olds | 0 (0.0%) | 0 (0.0%) |
| 5 to 9 Year Old | 37 (77.1%) | 11 (22.9%) |
| 10 to 14 Year Olds | 27 (79.4%) | 7 (20.6%) |
| 15 to 17 Year Olds | 13 (76.5%) | 4 (23.5%) |
| 18 to 19 Year Olds | 10 (100.0%) | 0 (0.0%) |
| 20 to 24 Year Olds | 0 (0.0%) | 0 (0.0%) |
| 25 to 34 Year Olds | 2 (100.0%) | 0 (0.0%) |
| 35 Years and over | 0 (0.0%) | 0 (0.0%) |
| Total | 89 (80.2%) | 22 (19.8%) |
Educational Attainment by Field of Study in Riverdale
Education (16 | 38.1%), arts & humanities (9 | 21.4%), science & technology (5 | 11.9%), communications (4 | 9.5%), and computers & mathematics (2 | 4.8%) are the most common fields of study among 42 individuals in Riverdale who have obtained a bachelor's degree or higher.
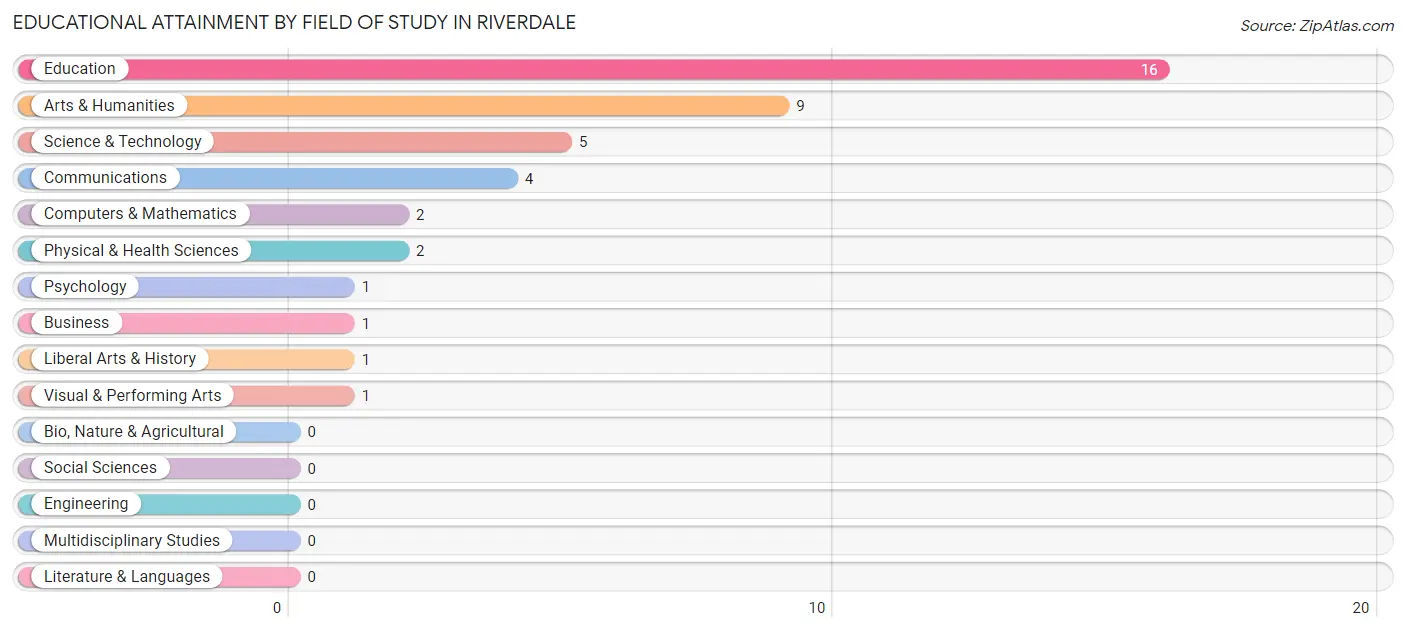
| Field of Study | # Graduates | % Graduates |
| Computers & Mathematics | 2 | 4.8% |
| Bio, Nature & Agricultural | 0 | 0.0% |
| Physical & Health Sciences | 2 | 4.8% |
| Psychology | 1 | 2.4% |
| Social Sciences | 0 | 0.0% |
| Engineering | 0 | 0.0% |
| Multidisciplinary Studies | 0 | 0.0% |
| Science & Technology | 5 | 11.9% |
| Business | 1 | 2.4% |
| Education | 16 | 38.1% |
| Literature & Languages | 0 | 0.0% |
| Liberal Arts & History | 1 | 2.4% |
| Visual & Performing Arts | 1 | 2.4% |
| Communications | 4 | 9.5% |
| Arts & Humanities | 9 | 21.4% |
| Total | 42 | 100.0% |
Transportation & Commute in Riverdale
Vehicle Availability by Sex in Riverdale
The most prevalent vehicle ownership categories in Riverdale are males with 3 vehicles (28, accounting for 30.8%) and females with 3 vehicles (21, making up 54.9%).
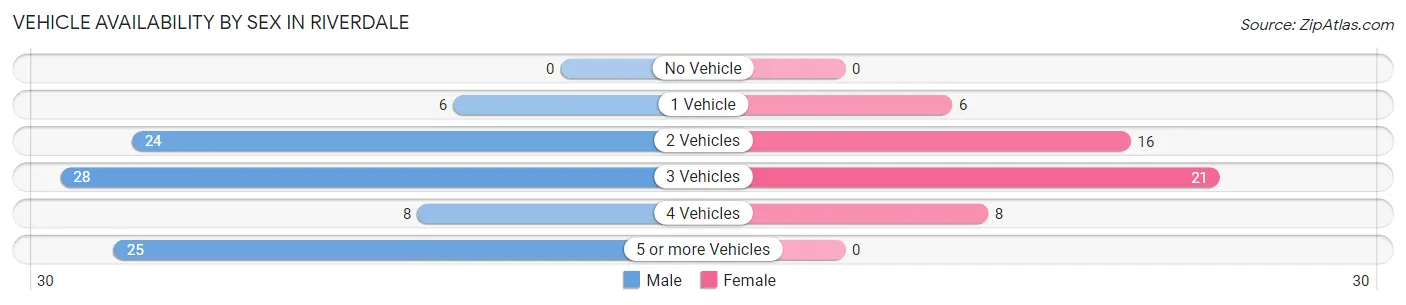
| Vehicles Available | Male | Female |
| No Vehicle | 0 (0.0%) | 0 (0.0%) |
| 1 Vehicle | 6 (6.6%) | 6 (11.8%) |
| 2 Vehicles | 24 (26.4%) | 16 (31.4%) |
| 3 Vehicles | 28 (30.8%) | 21 (41.2%) |
| 4 Vehicles | 8 (8.8%) | 8 (15.7%) |
| 5 or more Vehicles | 25 (27.5%) | 0 (0.0%) |
| Total | 91 (100.0%) | 51 (100.0%) |
Commute Time in Riverdale
The most frequently occuring commute durations in Riverdale are 15 to 19 minutes (47 commuters, 33.8%), 20 to 24 minutes (38 commuters, 27.3%), and 10 to 14 minutes (30 commuters, 21.6%).
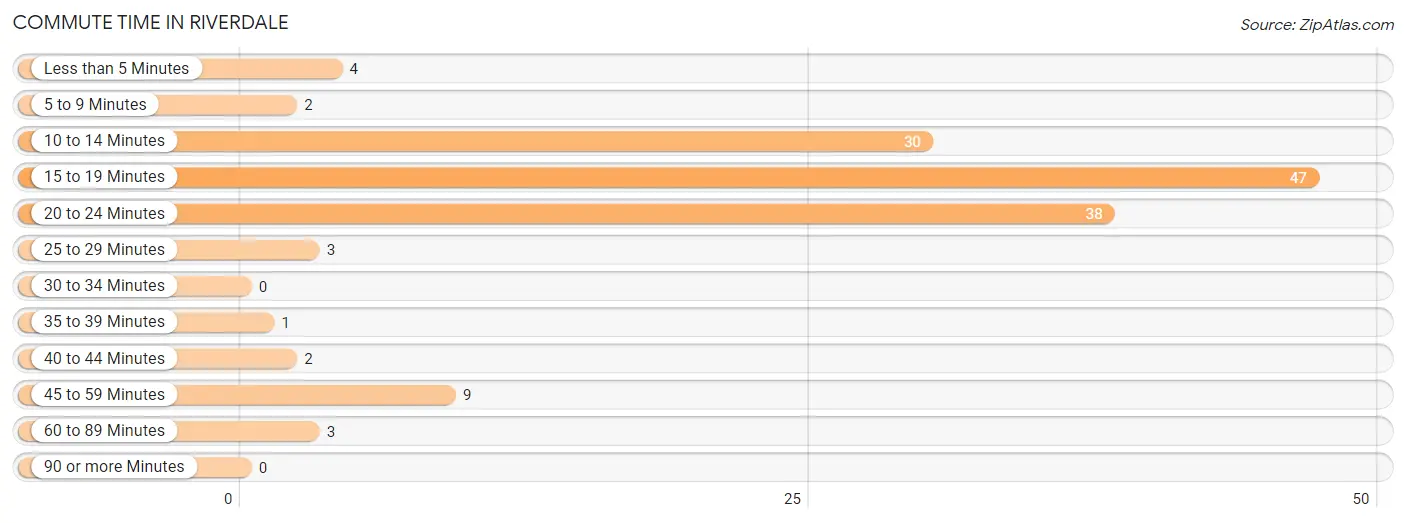
| Commute Time | # Commuters | % Commuters |
| Less than 5 Minutes | 4 | 2.9% |
| 5 to 9 Minutes | 2 | 1.4% |
| 10 to 14 Minutes | 30 | 21.6% |
| 15 to 19 Minutes | 47 | 33.8% |
| 20 to 24 Minutes | 38 | 27.3% |
| 25 to 29 Minutes | 3 | 2.2% |
| 30 to 34 Minutes | 0 | 0.0% |
| 35 to 39 Minutes | 1 | 0.7% |
| 40 to 44 Minutes | 2 | 1.4% |
| 45 to 59 Minutes | 9 | 6.5% |
| 60 to 89 Minutes | 3 | 2.2% |
| 90 or more Minutes | 0 | 0.0% |
Commute Time by Sex in Riverdale
The most common commute times in Riverdale are 15 to 19 minutes (36 commuters, 40.0%) for males and 20 to 24 minutes (21 commuters, 42.9%) for females.
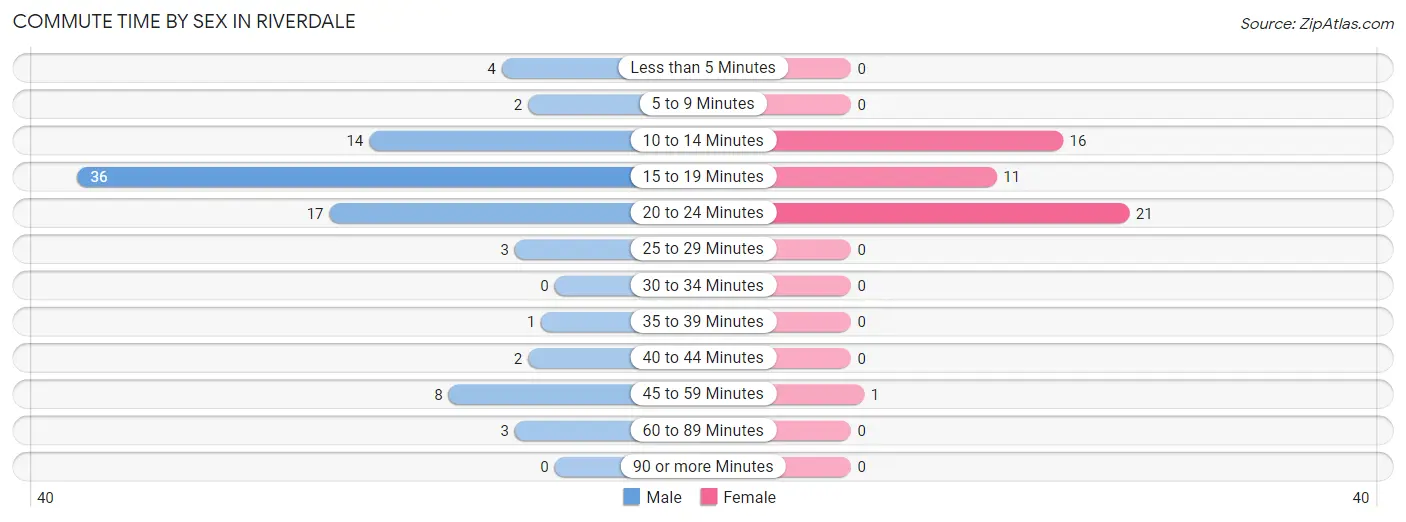
| Commute Time | Male | Female |
| Less than 5 Minutes | 4 (4.4%) | 0 (0.0%) |
| 5 to 9 Minutes | 2 (2.2%) | 0 (0.0%) |
| 10 to 14 Minutes | 14 (15.6%) | 16 (32.7%) |
| 15 to 19 Minutes | 36 (40.0%) | 11 (22.5%) |
| 20 to 24 Minutes | 17 (18.9%) | 21 (42.9%) |
| 25 to 29 Minutes | 3 (3.3%) | 0 (0.0%) |
| 30 to 34 Minutes | 0 (0.0%) | 0 (0.0%) |
| 35 to 39 Minutes | 1 (1.1%) | 0 (0.0%) |
| 40 to 44 Minutes | 2 (2.2%) | 0 (0.0%) |
| 45 to 59 Minutes | 8 (8.9%) | 1 (2.0%) |
| 60 to 89 Minutes | 3 (3.3%) | 0 (0.0%) |
| 90 or more Minutes | 0 (0.0%) | 0 (0.0%) |
Time of Departure to Work by Sex in Riverdale
The most frequent times of departure to work in Riverdale are 8:00 AM to 8:29 AM (18, 20.0%) for males and 7:30 AM to 7:59 AM (14, 28.6%) for females.
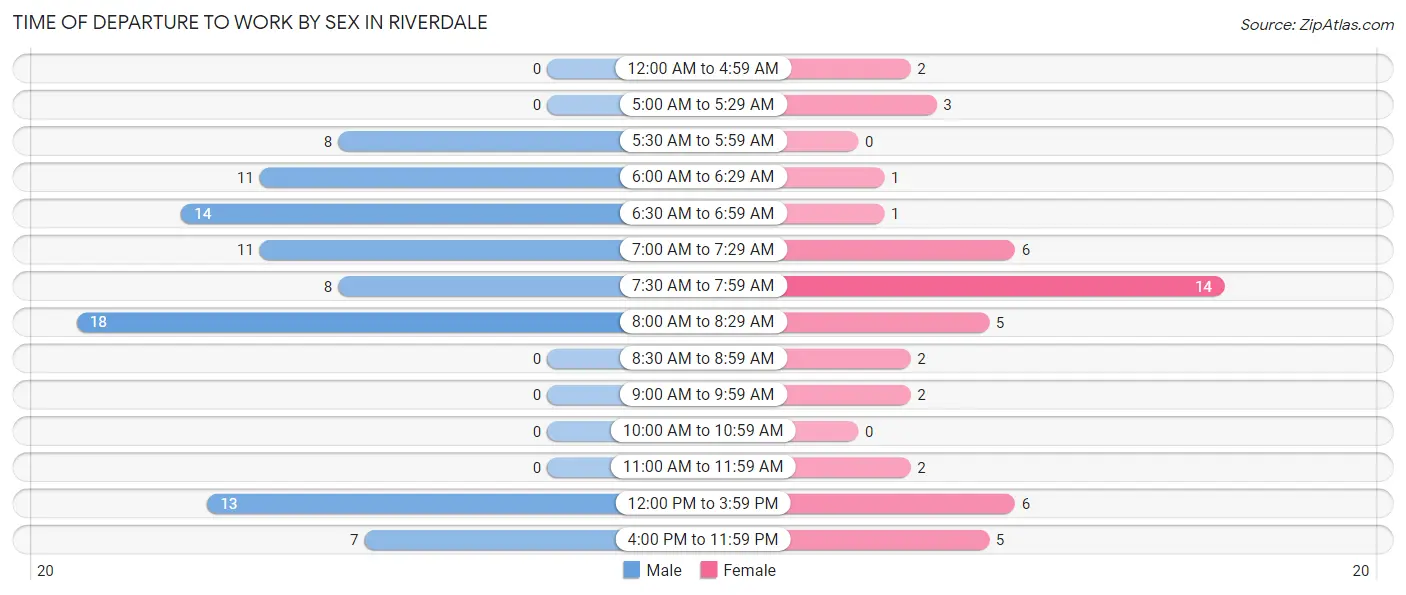
| Time of Departure | Male | Female |
| 12:00 AM to 4:59 AM | 0 (0.0%) | 2 (4.1%) |
| 5:00 AM to 5:29 AM | 0 (0.0%) | 3 (6.1%) |
| 5:30 AM to 5:59 AM | 8 (8.9%) | 0 (0.0%) |
| 6:00 AM to 6:29 AM | 11 (12.2%) | 1 (2.0%) |
| 6:30 AM to 6:59 AM | 14 (15.6%) | 1 (2.0%) |
| 7:00 AM to 7:29 AM | 11 (12.2%) | 6 (12.2%) |
| 7:30 AM to 7:59 AM | 8 (8.9%) | 14 (28.6%) |
| 8:00 AM to 8:29 AM | 18 (20.0%) | 5 (10.2%) |
| 8:30 AM to 8:59 AM | 0 (0.0%) | 2 (4.1%) |
| 9:00 AM to 9:59 AM | 0 (0.0%) | 2 (4.1%) |
| 10:00 AM to 10:59 AM | 0 (0.0%) | 0 (0.0%) |
| 11:00 AM to 11:59 AM | 0 (0.0%) | 2 (4.1%) |
| 12:00 PM to 3:59 PM | 13 (14.4%) | 6 (12.2%) |
| 4:00 PM to 11:59 PM | 7 (7.8%) | 5 (10.2%) |
| Total | 90 (100.0%) | 49 (100.0%) |
Housing Occupancy in Riverdale
Occupancy by Ownership in Riverdale
Of the total 99 dwellings in Riverdale, owner-occupied units account for 91 (91.9%), while renter-occupied units make up 8 (8.1%).
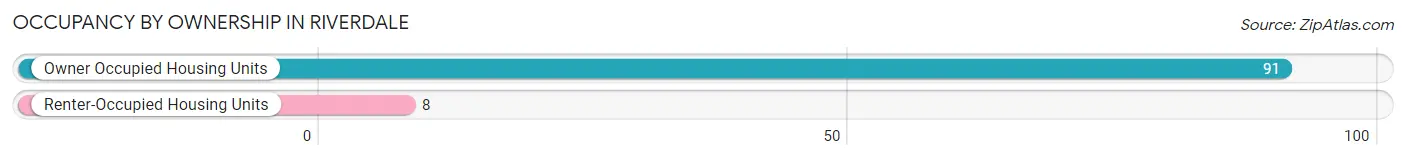
| Occupancy | # Housing Units | % Housing Units |
| Owner Occupied Housing Units | 91 | 91.9% |
| Renter-Occupied Housing Units | 8 | 8.1% |
| Total Occupied Housing Units | 99 | 100.0% |
Occupancy by Household Size in Riverdale
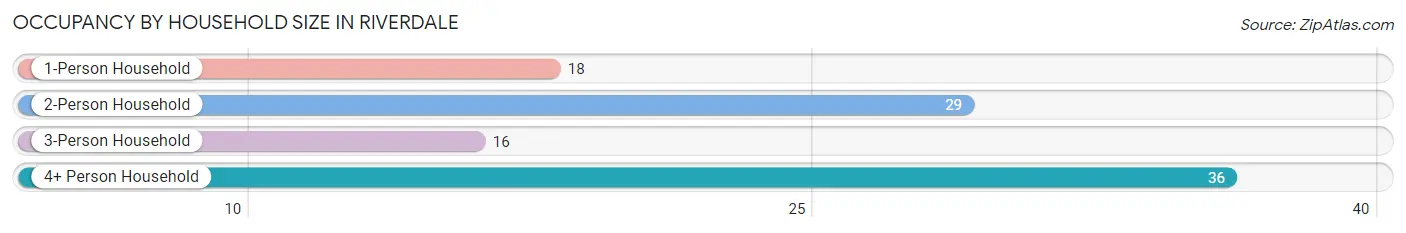
| Household Size | # Housing Units | % Housing Units |
| 1-Person Household | 18 | 18.2% |
| 2-Person Household | 29 | 29.3% |
| 3-Person Household | 16 | 16.2% |
| 4+ Person Household | 36 | 36.4% |
| Total Housing Units | 99 | 100.0% |
Occupancy by Ownership by Household Size in Riverdale
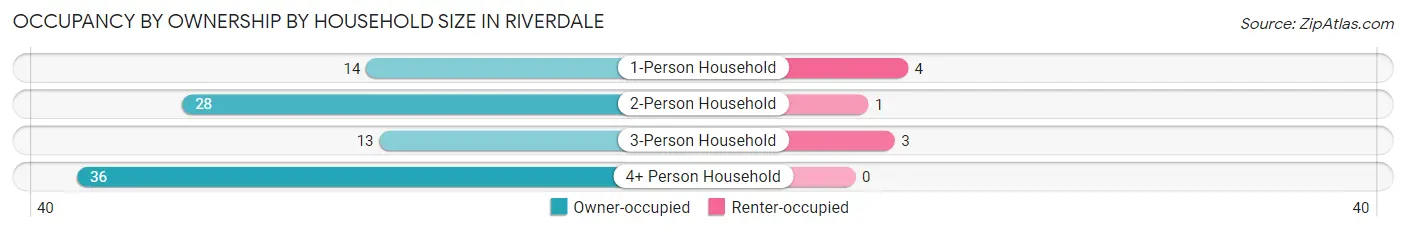
| Household Size | Owner-occupied | Renter-occupied |
| 1-Person Household | 14 (77.8%) | 4 (22.2%) |
| 2-Person Household | 28 (96.6%) | 1 (3.5%) |
| 3-Person Household | 13 (81.2%) | 3 (18.8%) |
| 4+ Person Household | 36 (100.0%) | 0 (0.0%) |
| Total Housing Units | 91 (91.9%) | 8 (8.1%) |
Occupancy by Educational Attainment in Riverdale
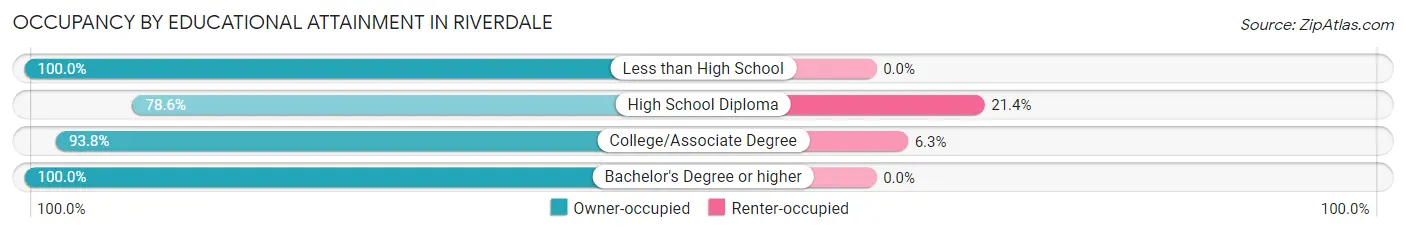
| Household Size | Owner-occupied | Renter-occupied |
| Less than High School | 5 (100.0%) | 0 (0.0%) |
| High School Diploma | 22 (78.6%) | 6 (21.4%) |
| College/Associate Degree | 30 (93.8%) | 2 (6.2%) |
| Bachelor's Degree or higher | 34 (100.0%) | 0 (0.0%) |
Occupancy by Age of Householder in Riverdale
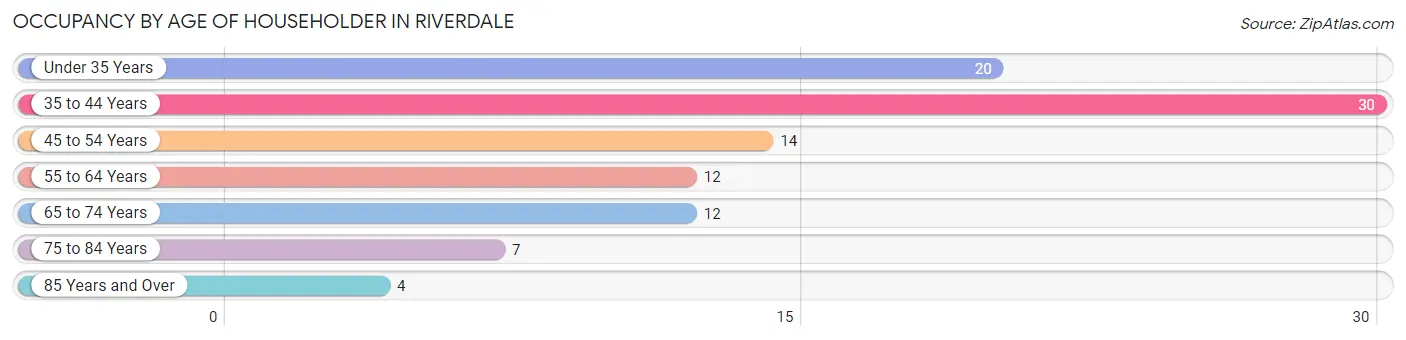
| Age Bracket | # Households | % Households |
| Under 35 Years | 20 | 20.2% |
| 35 to 44 Years | 30 | 30.3% |
| 45 to 54 Years | 14 | 14.1% |
| 55 to 64 Years | 12 | 12.1% |
| 65 to 74 Years | 12 | 12.1% |
| 75 to 84 Years | 7 | 7.1% |
| 85 Years and Over | 4 | 4.0% |
| Total | 99 | 100.0% |
Housing Finances in Riverdale
Median Income by Occupancy in Riverdale
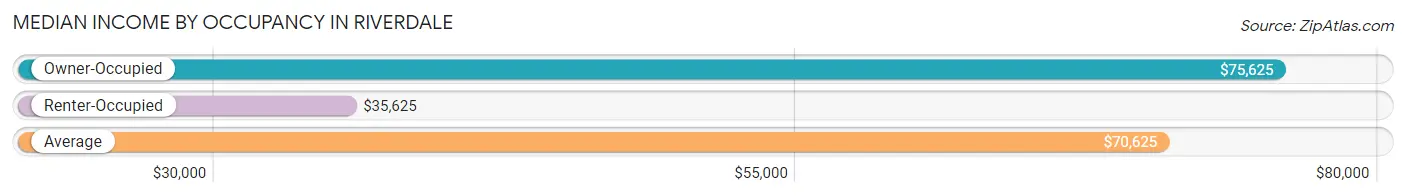
| Occupancy Type | # Households | Median Income |
| Owner-Occupied | 91 (91.9%) | $75,625 |
| Renter-Occupied | 8 (8.1%) | $35,625 |
| Average | 99 (100.0%) | $70,625 |
Occupancy by Householder Income Bracket in Riverdale
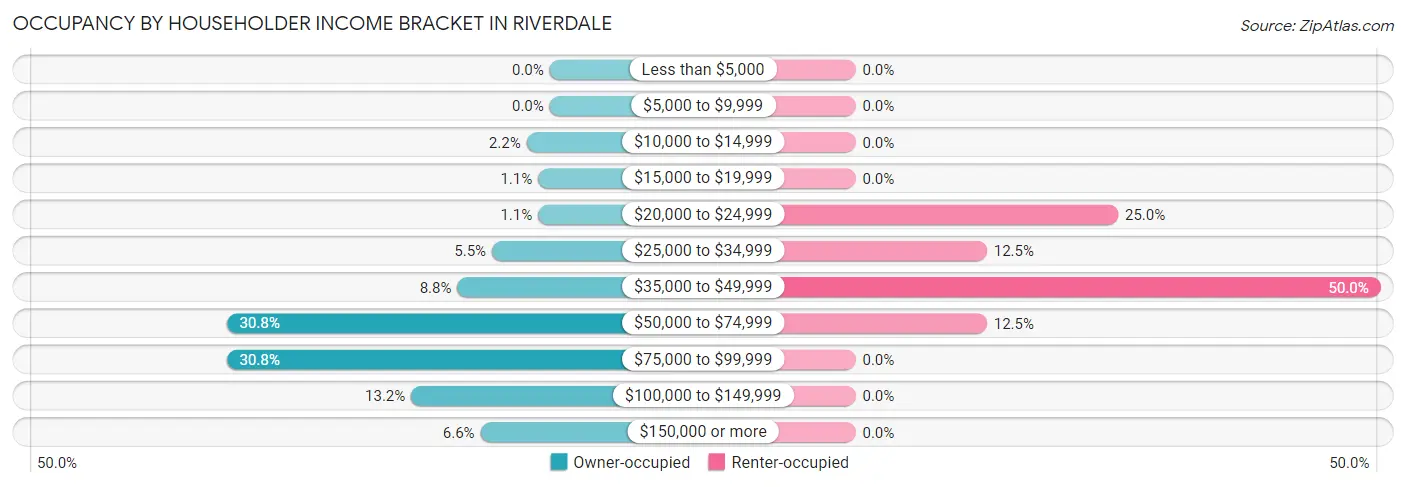
| Income Bracket | Owner-occupied | Renter-occupied |
| Less than $5,000 | 0 (0.0%) | 0 (0.0%) |
| $5,000 to $9,999 | 0 (0.0%) | 0 (0.0%) |
| $10,000 to $14,999 | 2 (2.2%) | 0 (0.0%) |
| $15,000 to $19,999 | 1 (1.1%) | 0 (0.0%) |
| $20,000 to $24,999 | 1 (1.1%) | 2 (25.0%) |
| $25,000 to $34,999 | 5 (5.5%) | 1 (12.5%) |
| $35,000 to $49,999 | 8 (8.8%) | 4 (50.0%) |
| $50,000 to $74,999 | 28 (30.8%) | 1 (12.5%) |
| $75,000 to $99,999 | 28 (30.8%) | 0 (0.0%) |
| $100,000 to $149,999 | 12 (13.2%) | 0 (0.0%) |
| $150,000 or more | 6 (6.6%) | 0 (0.0%) |
| Total | 91 (100.0%) | 8 (100.0%) |
Monthly Housing Cost Tiers in Riverdale
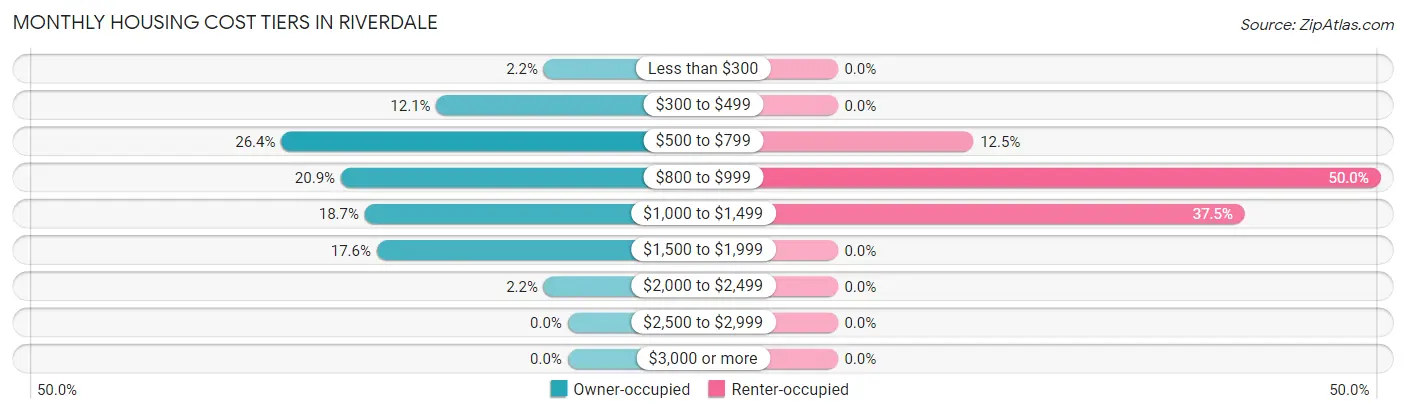
| Monthly Cost | Owner-occupied | Renter-occupied |
| Less than $300 | 2 (2.2%) | 0 (0.0%) |
| $300 to $499 | 11 (12.1%) | 0 (0.0%) |
| $500 to $799 | 24 (26.4%) | 1 (12.5%) |
| $800 to $999 | 19 (20.9%) | 4 (50.0%) |
| $1,000 to $1,499 | 17 (18.7%) | 3 (37.5%) |
| $1,500 to $1,999 | 16 (17.6%) | 0 (0.0%) |
| $2,000 to $2,499 | 2 (2.2%) | 0 (0.0%) |
| $2,500 to $2,999 | 0 (0.0%) | 0 (0.0%) |
| $3,000 or more | 0 (0.0%) | 0 (0.0%) |
| Total | 91 (100.0%) | 8 (100.0%) |
Physical Housing Characteristics in Riverdale
Housing Structures in Riverdale
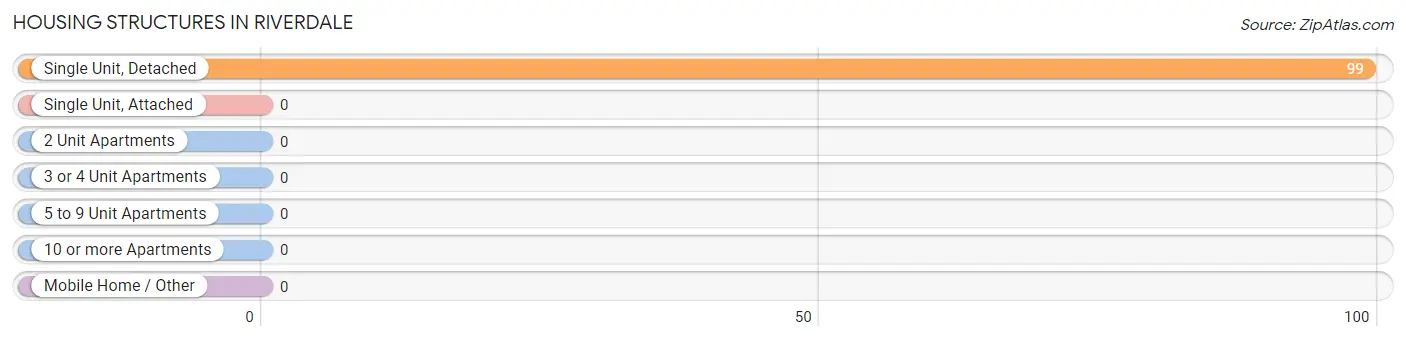
| Structure Type | # Housing Units | % Housing Units |
| Single Unit, Detached | 99 | 100.0% |
| Single Unit, Attached | 0 | 0.0% |
| 2 Unit Apartments | 0 | 0.0% |
| 3 or 4 Unit Apartments | 0 | 0.0% |
| 5 to 9 Unit Apartments | 0 | 0.0% |
| 10 or more Apartments | 0 | 0.0% |
| Mobile Home / Other | 0 | 0.0% |
| Total | 99 | 100.0% |
Housing Structures by Occupancy in Riverdale
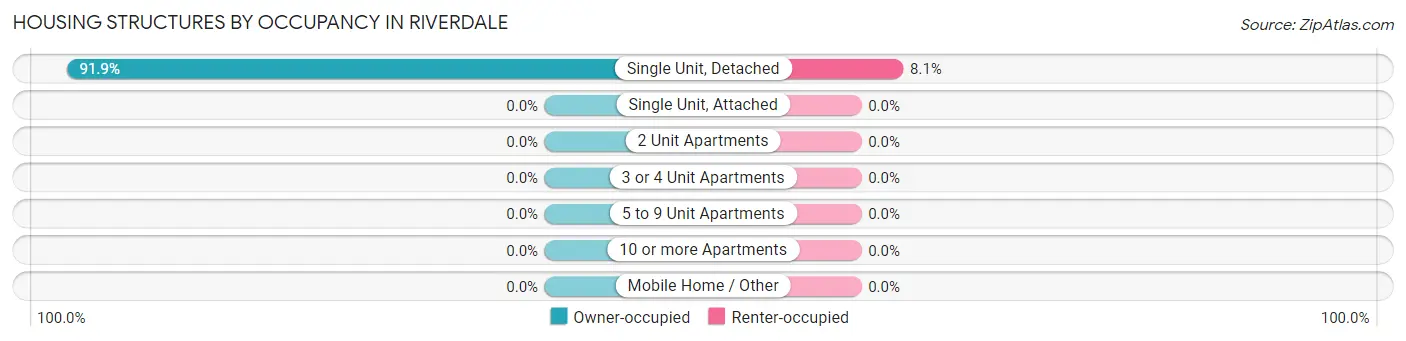
| Structure Type | Owner-occupied | Renter-occupied |
| Single Unit, Detached | 91 (91.9%) | 8 (8.1%) |
| Single Unit, Attached | 0 (0.0%) | 0 (0.0%) |
| 2 Unit Apartments | 0 (0.0%) | 0 (0.0%) |
| 3 or 4 Unit Apartments | 0 (0.0%) | 0 (0.0%) |
| 5 to 9 Unit Apartments | 0 (0.0%) | 0 (0.0%) |
| 10 or more Apartments | 0 (0.0%) | 0 (0.0%) |
| Mobile Home / Other | 0 (0.0%) | 0 (0.0%) |
| Total | 91 (91.9%) | 8 (8.1%) |
Housing Structures by Number of Rooms in Riverdale
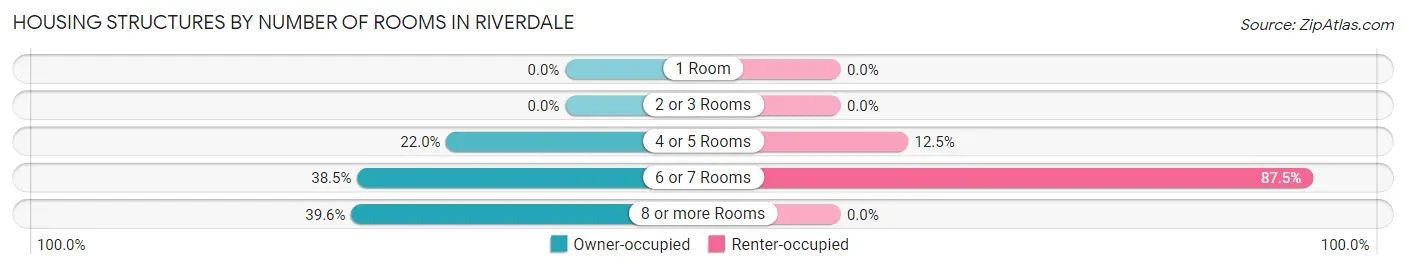
| Number of Rooms | Owner-occupied | Renter-occupied |
| 1 Room | 0 (0.0%) | 0 (0.0%) |
| 2 or 3 Rooms | 0 (0.0%) | 0 (0.0%) |
| 4 or 5 Rooms | 20 (22.0%) | 1 (12.5%) |
| 6 or 7 Rooms | 35 (38.5%) | 7 (87.5%) |
| 8 or more Rooms | 36 (39.6%) | 0 (0.0%) |
| Total | 91 (100.0%) | 8 (100.0%) |
Housing Structure by Heating Type in Riverdale
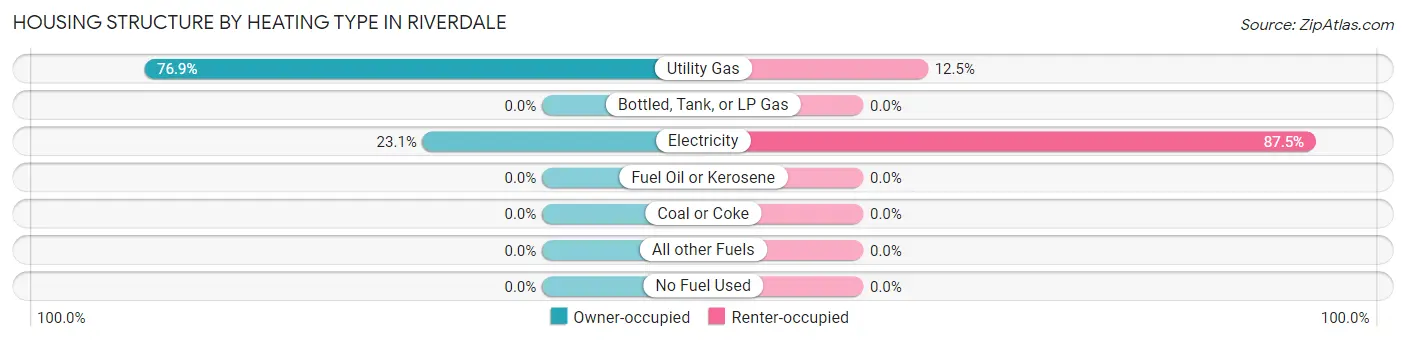
| Heating Type | Owner-occupied | Renter-occupied |
| Utility Gas | 70 (76.9%) | 1 (12.5%) |
| Bottled, Tank, or LP Gas | 0 (0.0%) | 0 (0.0%) |
| Electricity | 21 (23.1%) | 7 (87.5%) |
| Fuel Oil or Kerosene | 0 (0.0%) | 0 (0.0%) |
| Coal or Coke | 0 (0.0%) | 0 (0.0%) |
| All other Fuels | 0 (0.0%) | 0 (0.0%) |
| No Fuel Used | 0 (0.0%) | 0 (0.0%) |
| Total | 91 (100.0%) | 8 (100.0%) |
Household Vehicle Usage in Riverdale
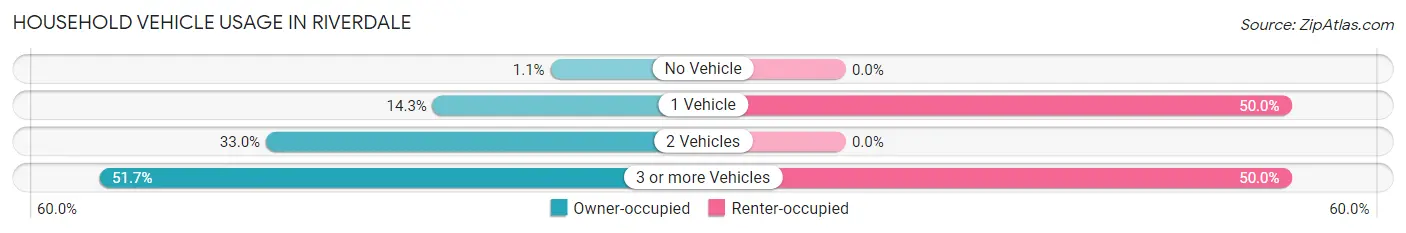
| Vehicles per Household | Owner-occupied | Renter-occupied |
| No Vehicle | 1 (1.1%) | 0 (0.0%) |
| 1 Vehicle | 13 (14.3%) | 4 (50.0%) |
| 2 Vehicles | 30 (33.0%) | 0 (0.0%) |
| 3 or more Vehicles | 47 (51.6%) | 4 (50.0%) |
| Total | 91 (100.0%) | 8 (100.0%) |
Real Estate & Mortgages in Riverdale
Real Estate and Mortgage Overview in Riverdale
| Characteristic | Without Mortgage | With Mortgage |
| Housing Units | 30 | 61 |
| Median Property Value | $150,000 | $126,800 |
| Median Household Income | $66,250 | $4 |
| Monthly Housing Costs | $520 | $0 |
| Real Estate Taxes | $2,000 | $4 |
Property Value by Mortgage Status in Riverdale
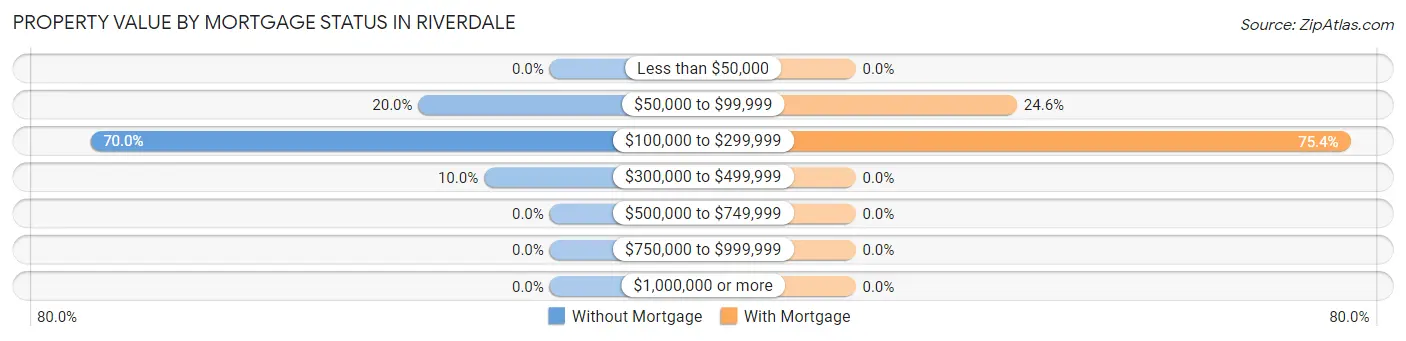
| Property Value | Without Mortgage | With Mortgage |
| Less than $50,000 | 0 (0.0%) | 0 (0.0%) |
| $50,000 to $99,999 | 6 (20.0%) | 15 (24.6%) |
| $100,000 to $299,999 | 21 (70.0%) | 46 (75.4%) |
| $300,000 to $499,999 | 3 (10.0%) | 0 (0.0%) |
| $500,000 to $749,999 | 0 (0.0%) | 0 (0.0%) |
| $750,000 to $999,999 | 0 (0.0%) | 0 (0.0%) |
| $1,000,000 or more | 0 (0.0%) | 0 (0.0%) |
| Total | 30 (100.0%) | 61 (100.0%) |
Household Income by Mortgage Status in Riverdale
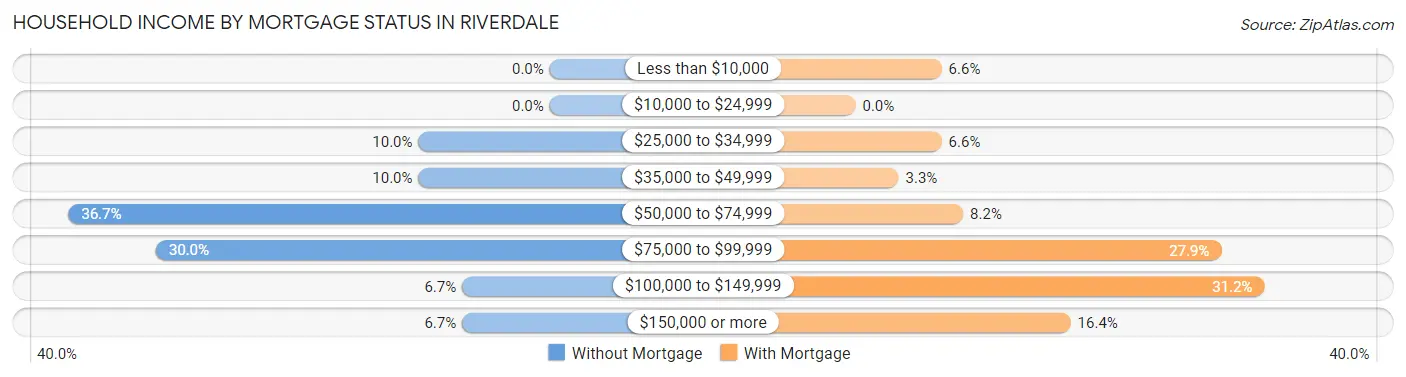
| Household Income | Without Mortgage | With Mortgage |
| Less than $10,000 | 0 (0.0%) | 4 (6.6%) |
| $10,000 to $24,999 | 0 (0.0%) | 0 (0.0%) |
| $25,000 to $34,999 | 3 (10.0%) | 4 (6.6%) |
| $35,000 to $49,999 | 3 (10.0%) | 2 (3.3%) |
| $50,000 to $74,999 | 11 (36.7%) | 5 (8.2%) |
| $75,000 to $99,999 | 9 (30.0%) | 17 (27.9%) |
| $100,000 to $149,999 | 2 (6.7%) | 19 (31.1%) |
| $150,000 or more | 2 (6.7%) | 10 (16.4%) |
| Total | 30 (100.0%) | 61 (100.0%) |
Property Value to Household Income Ratio in Riverdale
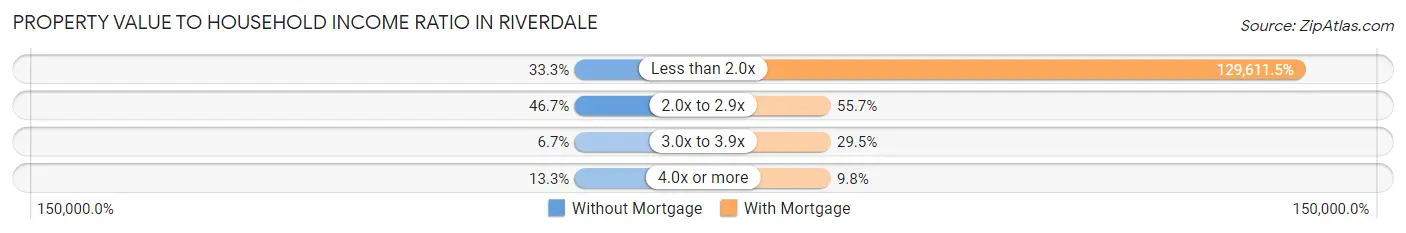
| Value-to-Income Ratio | Without Mortgage | With Mortgage |
| Less than 2.0x | 10 (33.3%) | 79,063 (129,611.5%) |
| 2.0x to 2.9x | 14 (46.7%) | 34 (55.7%) |
| 3.0x to 3.9x | 2 (6.7%) | 18 (29.5%) |
| 4.0x or more | 4 (13.3%) | 6 (9.8%) |
| Total | 30 (100.0%) | 61 (100.0%) |
Real Estate Taxes by Mortgage Status in Riverdale
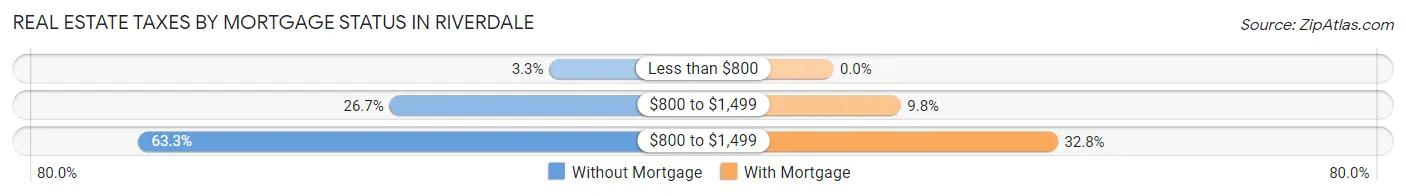
| Property Taxes | Without Mortgage | With Mortgage |
| Less than $800 | 1 (3.3%) | 0 (0.0%) |
| $800 to $1,499 | 8 (26.7%) | 6 (9.8%) |
| $800 to $1,499 | 19 (63.3%) | 20 (32.8%) |
| Total | 30 (100.0%) | 61 (100.0%) |
Health & Disability in Riverdale
Health Insurance Coverage by Age in Riverdale
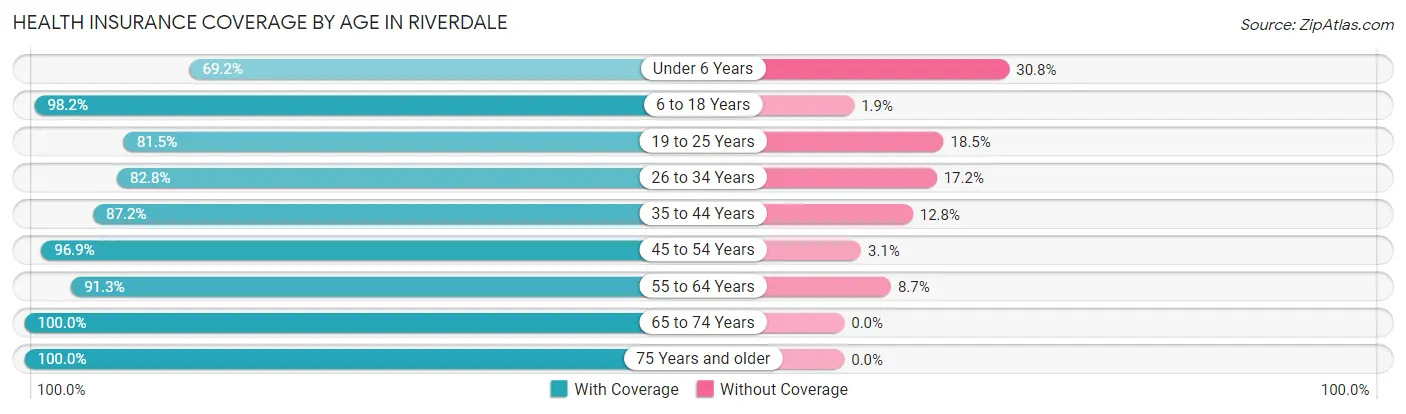
| Age Bracket | With Coverage | Without Coverage |
| Under 6 Years | 9 (69.2%) | 4 (30.8%) |
| 6 to 18 Years | 106 (98.2%) | 2 (1.8%) |
| 19 to 25 Years | 22 (81.5%) | 5 (18.5%) |
| 26 to 34 Years | 24 (82.8%) | 5 (17.2%) |
| 35 to 44 Years | 41 (87.2%) | 6 (12.8%) |
| 45 to 54 Years | 31 (96.9%) | 1 (3.1%) |
| 55 to 64 Years | 21 (91.3%) | 2 (8.7%) |
| 65 to 74 Years | 15 (100.0%) | 0 (0.0%) |
| 75 Years and older | 19 (100.0%) | 0 (0.0%) |
| Total | 288 (92.0%) | 25 (8.0%) |
Health Insurance Coverage by Citizenship Status in Riverdale
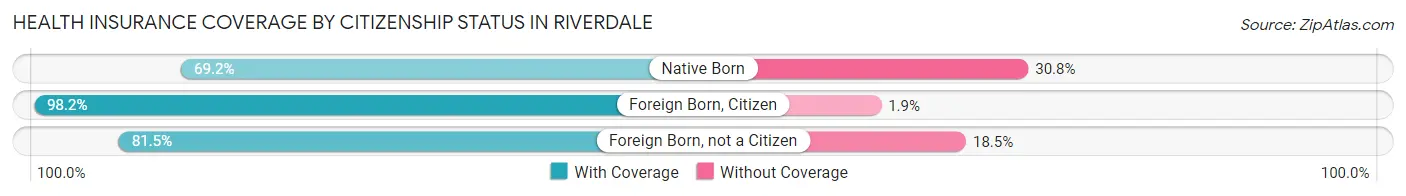
| Citizenship Status | With Coverage | Without Coverage |
| Native Born | 9 (69.2%) | 4 (30.8%) |
| Foreign Born, Citizen | 106 (98.2%) | 2 (1.8%) |
| Foreign Born, not a Citizen | 22 (81.5%) | 5 (18.5%) |
Health Insurance Coverage by Household Income in Riverdale
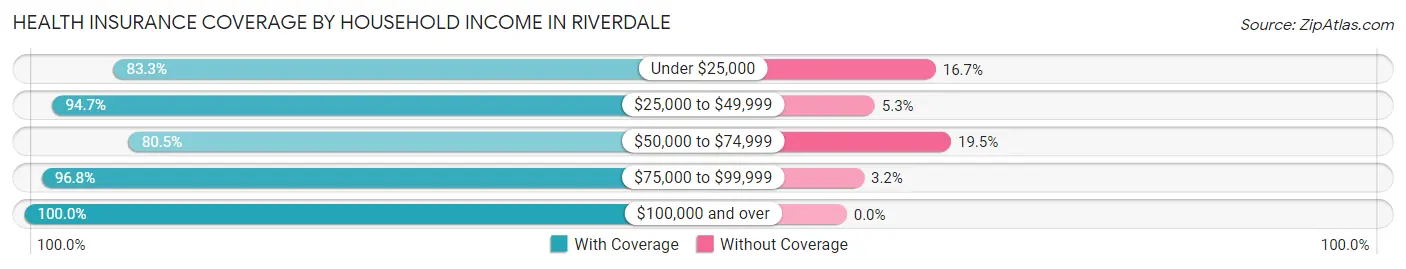
| Household Income | With Coverage | Without Coverage |
| Under $25,000 | 10 (83.3%) | 2 (16.7%) |
| $25,000 to $49,999 | 36 (94.7%) | 2 (5.3%) |
| $50,000 to $74,999 | 70 (80.5%) | 17 (19.5%) |
| $75,000 to $99,999 | 120 (96.8%) | 4 (3.2%) |
| $100,000 and over | 52 (100.0%) | 0 (0.0%) |
Public vs Private Health Insurance Coverage by Age in Riverdale
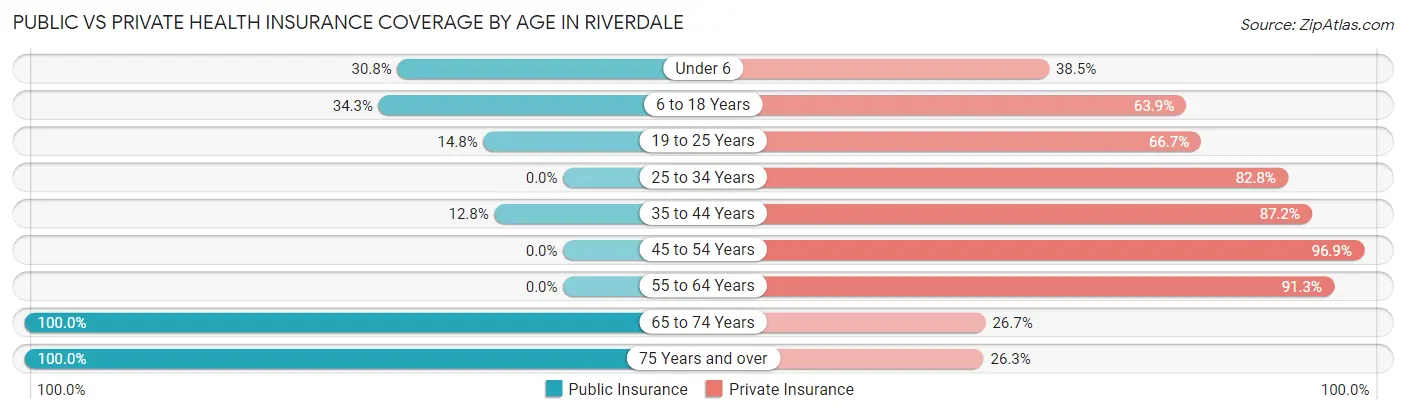
| Age Bracket | Public Insurance | Private Insurance |
| Under 6 | 4 (30.8%) | 5 (38.5%) |
| 6 to 18 Years | 37 (34.3%) | 69 (63.9%) |
| 19 to 25 Years | 4 (14.8%) | 18 (66.7%) |
| 25 to 34 Years | 0 (0.0%) | 24 (82.8%) |
| 35 to 44 Years | 6 (12.8%) | 41 (87.2%) |
| 45 to 54 Years | 0 (0.0%) | 31 (96.9%) |
| 55 to 64 Years | 0 (0.0%) | 21 (91.3%) |
| 65 to 74 Years | 15 (100.0%) | 4 (26.7%) |
| 75 Years and over | 19 (100.0%) | 5 (26.3%) |
| Total | 85 (27.2%) | 218 (69.7%) |
Disability Status by Sex by Age in Riverdale
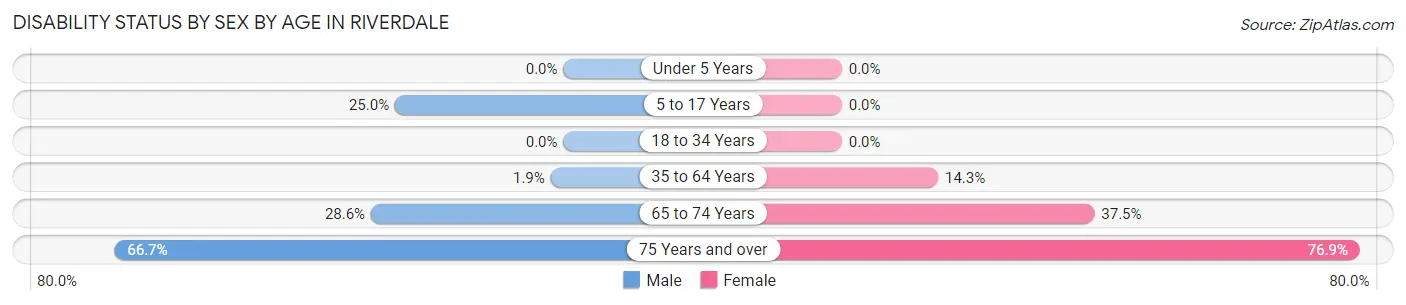
| Age Bracket | Male | Female |
| Under 5 Years | 0 (0.0%) | 0 (0.0%) |
| 5 to 17 Years | 17 (25.0%) | 0 (0.0%) |
| 18 to 34 Years | 0 (0.0%) | 0 (0.0%) |
| 35 to 64 Years | 1 (1.9%) | 7 (14.3%) |
| 65 to 74 Years | 2 (28.6%) | 3 (37.5%) |
| 75 Years and over | 4 (66.7%) | 10 (76.9%) |
Disability Class by Sex by Age in Riverdale
Disability Class: Hearing Difficulty
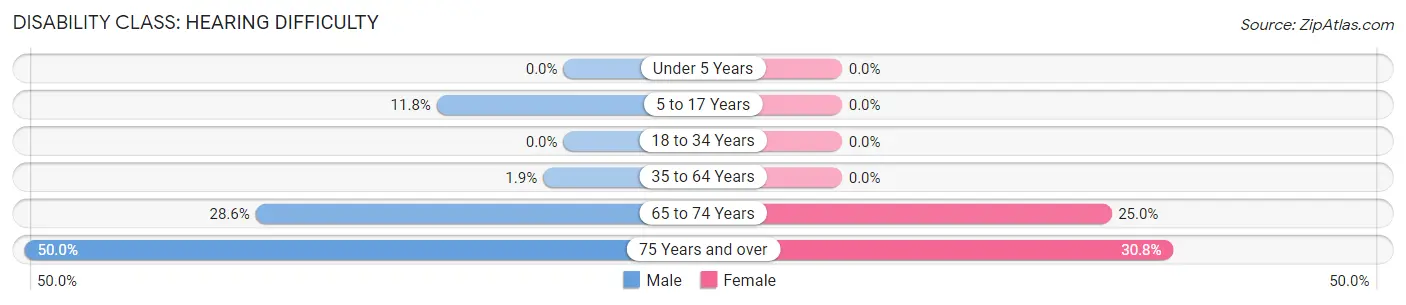
| Age Bracket | Male | Female |
| Under 5 Years | 0 (0.0%) | 0 (0.0%) |
| 5 to 17 Years | 8 (11.8%) | 0 (0.0%) |
| 18 to 34 Years | 0 (0.0%) | 0 (0.0%) |
| 35 to 64 Years | 1 (1.9%) | 0 (0.0%) |
| 65 to 74 Years | 2 (28.6%) | 2 (25.0%) |
| 75 Years and over | 3 (50.0%) | 4 (30.8%) |
Disability Class: Vision Difficulty
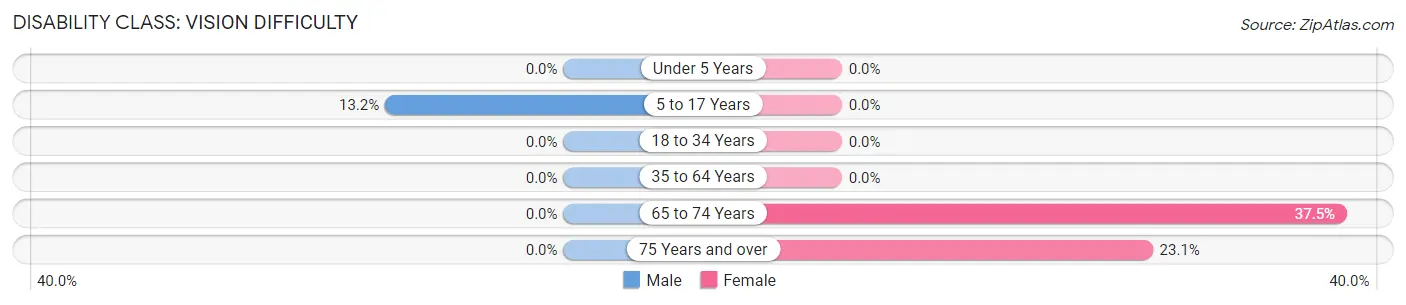
| Age Bracket | Male | Female |
| Under 5 Years | 0 (0.0%) | 0 (0.0%) |
| 5 to 17 Years | 9 (13.2%) | 0 (0.0%) |
| 18 to 34 Years | 0 (0.0%) | 0 (0.0%) |
| 35 to 64 Years | 0 (0.0%) | 0 (0.0%) |
| 65 to 74 Years | 0 (0.0%) | 3 (37.5%) |
| 75 Years and over | 0 (0.0%) | 3 (23.1%) |
Disability Class: Cognitive Difficulty
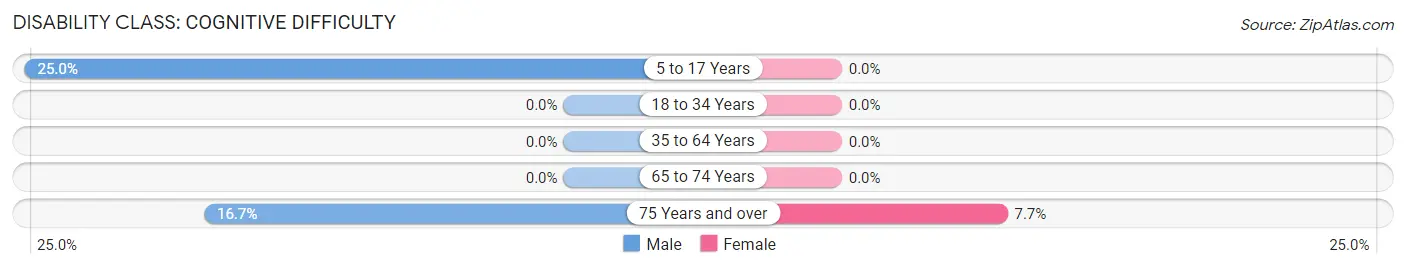
| Age Bracket | Male | Female |
| 5 to 17 Years | 17 (25.0%) | 0 (0.0%) |
| 18 to 34 Years | 0 (0.0%) | 0 (0.0%) |
| 35 to 64 Years | 0 (0.0%) | 0 (0.0%) |
| 65 to 74 Years | 0 (0.0%) | 0 (0.0%) |
| 75 Years and over | 1 (16.7%) | 1 (7.7%) |
Disability Class: Ambulatory Difficulty
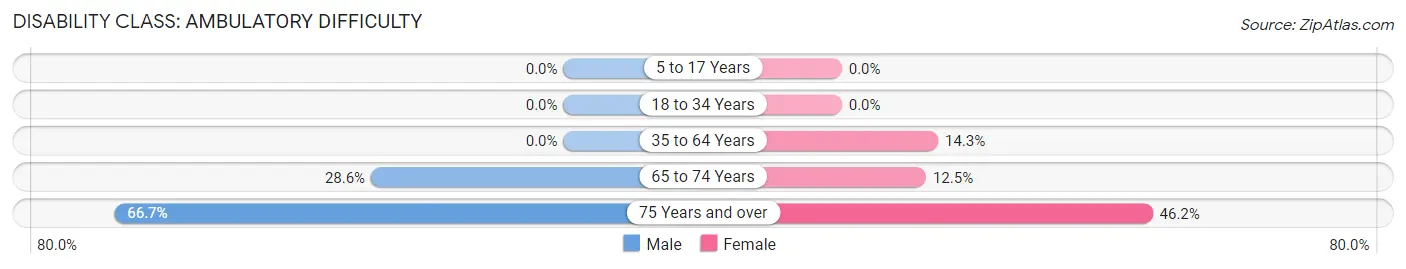
| Age Bracket | Male | Female |
| 5 to 17 Years | 0 (0.0%) | 0 (0.0%) |
| 18 to 34 Years | 0 (0.0%) | 0 (0.0%) |
| 35 to 64 Years | 0 (0.0%) | 7 (14.3%) |
| 65 to 74 Years | 2 (28.6%) | 1 (12.5%) |
| 75 Years and over | 4 (66.7%) | 6 (46.2%) |
Disability Class: Self-Care Difficulty
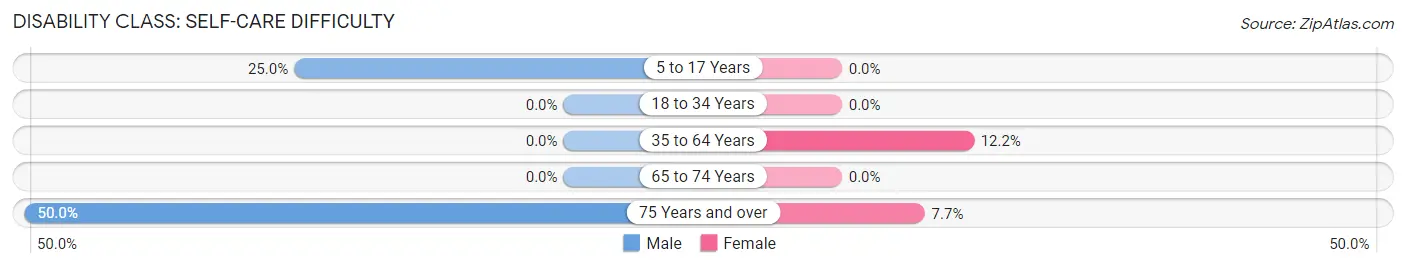
| Age Bracket | Male | Female |
| 5 to 17 Years | 17 (25.0%) | 0 (0.0%) |
| 18 to 34 Years | 0 (0.0%) | 0 (0.0%) |
| 35 to 64 Years | 0 (0.0%) | 6 (12.2%) |
| 65 to 74 Years | 0 (0.0%) | 0 (0.0%) |
| 75 Years and over | 3 (50.0%) | 1 (7.7%) |
Technology Access in Riverdale
Computing Device Access in Riverdale
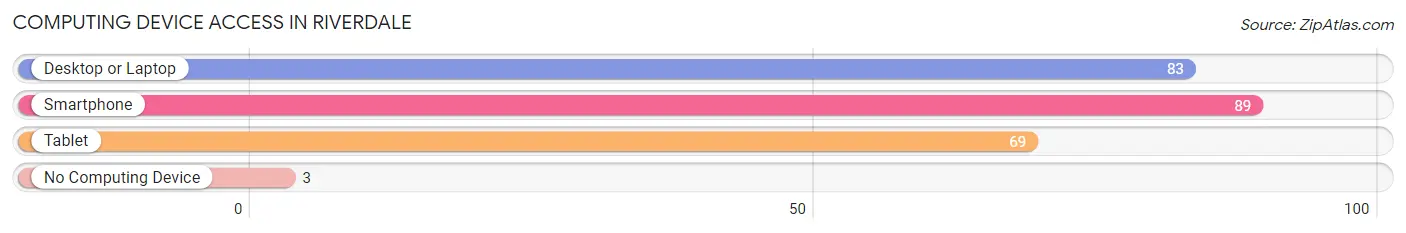
| Device Type | # Households | % Households |
| Desktop or Laptop | 83 | 83.8% |
| Smartphone | 89 | 89.9% |
| Tablet | 69 | 69.7% |
| No Computing Device | 3 | 3.0% |
| Total | 99 | 100.0% |
Internet Access in Riverdale
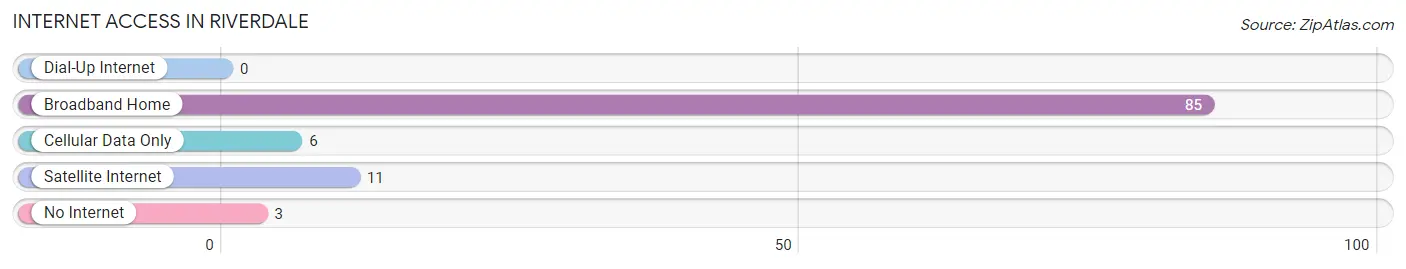
| Internet Type | # Households | % Households |
| Dial-Up Internet | 0 | 0.0% |
| Broadband Home | 85 | 85.9% |
| Cellular Data Only | 6 | 6.1% |
| Satellite Internet | 11 | 11.1% |
| No Internet | 3 | 3.0% |
| Total | 99 | 100.0% |
Riverdale Summary
Riverdale, Nebraska is a small town located in the southeastern corner of the state, just north of the city of Omaha. It is part of Douglas County and is home to a population of just over 1,000 people. The town was founded in 1856 and has a rich history of farming and ranching.
Geography
Riverdale is located in the southeastern corner of Nebraska, just north of Omaha. It is part of Douglas County and is bordered by the Platte River to the east and the Elkhorn River to the west. The town is situated on a flat plain, with the highest elevation being just over 1,000 feet. The climate is generally mild, with hot summers and cold winters.
Economy
The economy of Riverdale is largely based on agriculture. The town is home to several farms and ranches, which produce a variety of crops and livestock. The town also has a few small businesses, including a grocery store, a hardware store, and a few restaurants.
Demographics
As of the 2010 census, the population of Riverdale was 1,072. The racial makeup of the town was 97.3% White, 0.7% African American, 0.3% Native American, 0.2% Asian, 0.1% Pacific Islander, and 1.4% from two or more races. The median household income was $45,000, and the median family income was $50,000.
History
Riverdale was founded in 1856 by a group of settlers from Iowa. The town was originally called “Riverdale Station”, as it was a stop on the Union Pacific Railroad. The town was officially incorporated in 1887.
In the early 1900s, Riverdale was a thriving agricultural community. The town was home to several farms and ranches, which produced a variety of crops and livestock. The town also had a few small businesses, including a grocery store, a hardware store, and a few restaurants.
In the 1950s, Riverdale began to experience a decline in population as many of its residents moved away in search of better job opportunities. The town’s population has remained relatively stable since then, and it continues to be a small, rural community.
Today, Riverdale is a quiet, peaceful town with a strong sense of community. The town is home to several farms and ranches, as well as a few small businesses. The town also has a few parks and recreational areas, including a golf course and a swimming pool. The town is also home to a few churches, including the Riverdale United Methodist Church.
Common Questions
What is Per Capita Income in Riverdale?
Per Capita income in Riverdale is $23,079.
What is the Median Family Income in Riverdale?
Median Family Income in Riverdale is $80,000.
What is the Median Household income in Riverdale?
Median Household Income in Riverdale is $70,625.
What is Income or Wage Gap in Riverdale?
Income or Wage Gap in Riverdale is 1.9%.
Women in Riverdale earn 98.1 cents for every dollar earned by a man.
What is Inequality or Gini Index in Riverdale?
Inequality or Gini Index in Riverdale is 0.26.
What is the Total Population of Riverdale?
Total Population of Riverdale is 313.
What is the Total Male Population of Riverdale?
Total Male Population of Riverdale is 181.
What is the Total Female Population of Riverdale?
Total Female Population of Riverdale is 132.
What is the Ratio of Males per 100 Females in Riverdale?
There are 137.12 Males per 100 Females in Riverdale.
What is the Ratio of Females per 100 Males in Riverdale?
There are 72.93 Females per 100 Males in Riverdale.
What is the Median Population Age in Riverdale?
Median Population Age in Riverdale is 30.1 Years.
What is the Average Family Size in Riverdale
Average Family Size in Riverdale is 3.7 People.
What is the Average Household Size in Riverdale
Average Household Size in Riverdale is 3.2 People.
How Large is the Labor Force in Riverdale?
There are 146 People in the Labor Forcein in Riverdale.
What is the Percentage of People in the Labor Force in Riverdale?
67.0% of People are in the Labor Force in Riverdale.
What is the Unemployment Rate in Riverdale?
Unemployment Rate in Riverdale is 2.1%.