Springfield, LA Map & Demographics
Springfield Map
Springfield Overview
$30,103
PER CAPITA INCOME
$58,750
AVG FAMILY INCOME
$46,477
AVG HOUSEHOLD INCOME
46.9%
WAGE / INCOME GAP [ % ]
53.1¢/ $1
WAGE / INCOME GAP [ $ ]
0.46
INEQUALITY / GINI INDEX
464
TOTAL POPULATION
225
MALE POPULATION
239
FEMALE POPULATION
94.14
MALES / 100 FEMALES
106.22
FEMALES / 100 MALES
37.8
MEDIAN AGE
2.9
AVG FAMILY SIZE
2.4
AVG HOUSEHOLD SIZE
193
LABOR FORCE [ PEOPLE ]
54.4%
PERCENT IN LABOR FORCE
10.9%
UNEMPLOYMENT RATE
Springfield Zip Codes
Springfield Area Codes
Income in Springfield
Income Overview in Springfield
Per Capita Income in Springfield is $30,103, while median incomes of families and households are $58,750 and $46,477 respectively.
| Characteristic | Number | Measure |
| Per Capita Income | 464 | $30,103 |
| Median Family Income | 131 | $58,750 |
| Mean Family Income | 131 | $83,837 |
| Median Household Income | 191 | $46,477 |
| Mean Household Income | 191 | $69,209 |
| Income Deficit | 131 | $0 |
| Wage / Income Gap (%) | 464 | 46.94% |
| Wage / Income Gap ($) | 464 | 53.06¢ per $1 |
| Gini / Inequality Index | 464 | 0.46 |
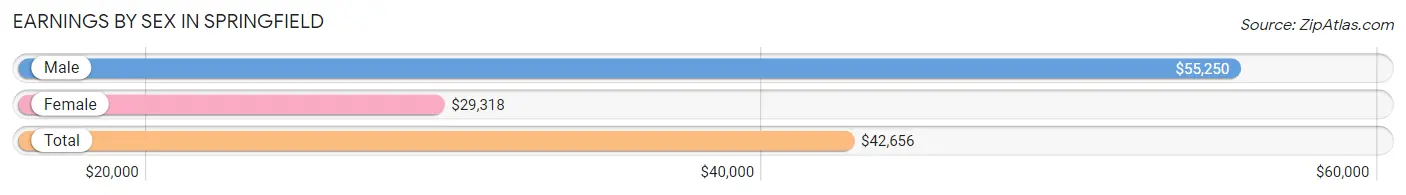
Earnings by Sex in Springfield
Average Earnings in Springfield are $42,656, $55,250 for men and $29,318 for women, a difference of 46.9%.
| Sex | Number | Average Earnings |
| Male | 103 (49.3%) | $55,250 |
| Female | 106 (50.7%) | $29,318 |
| Total | 209 (100.0%) | $42,656 |
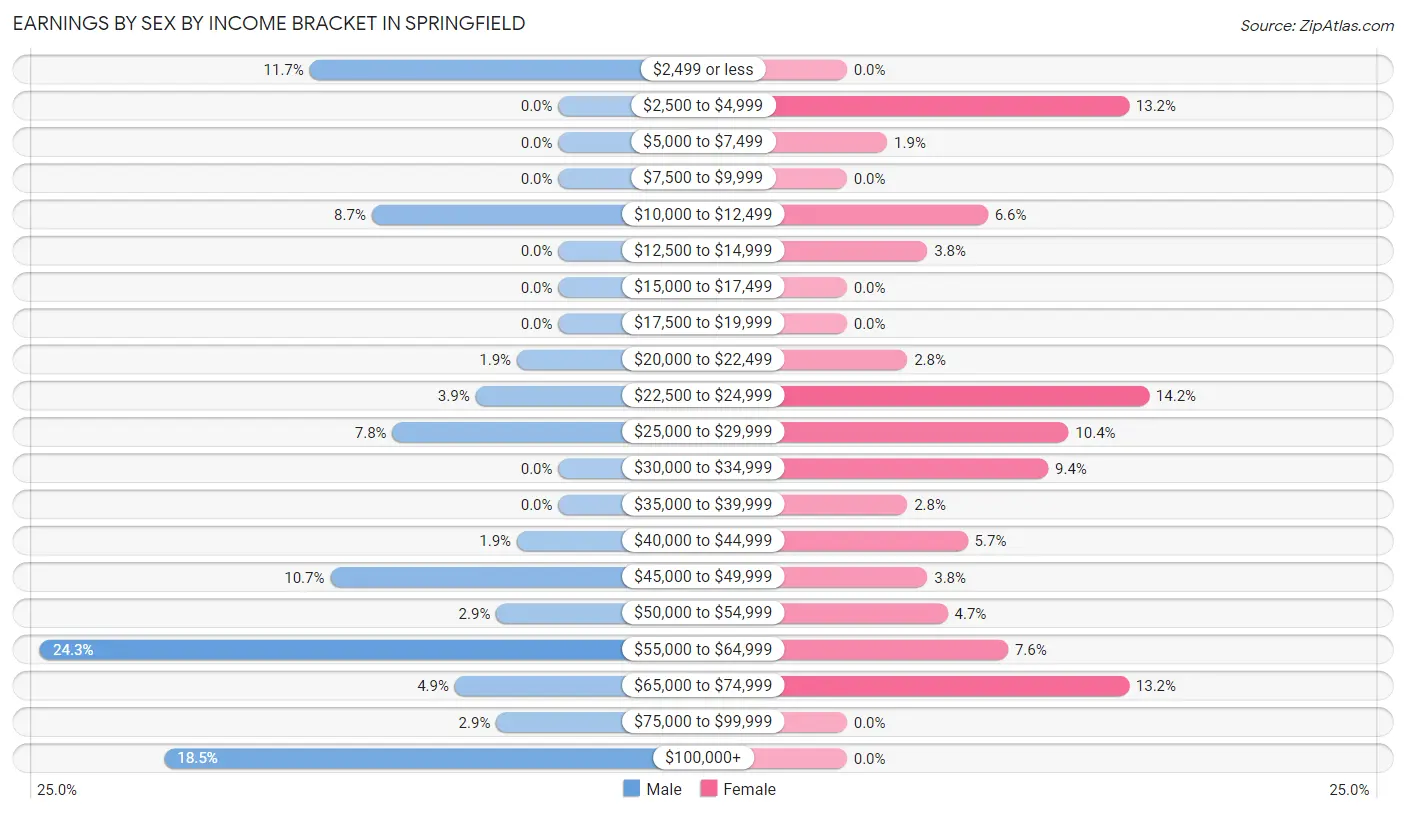
Earnings by Sex by Income Bracket in Springfield
The most common earnings brackets in Springfield are $55,000 to $64,999 for men (25 | 24.3%) and $22,500 to $24,999 for women (15 | 14.1%).
| Income | Male | Female |
| $2,499 or less | 12 (11.7%) | 0 (0.0%) |
| $2,500 to $4,999 | 0 (0.0%) | 14 (13.2%) |
| $5,000 to $7,499 | 0 (0.0%) | 2 (1.9%) |
| $7,500 to $9,999 | 0 (0.0%) | 0 (0.0%) |
| $10,000 to $12,499 | 9 (8.7%) | 7 (6.6%) |
| $12,500 to $14,999 | 0 (0.0%) | 4 (3.8%) |
| $15,000 to $17,499 | 0 (0.0%) | 0 (0.0%) |
| $17,500 to $19,999 | 0 (0.0%) | 0 (0.0%) |
| $20,000 to $22,499 | 2 (1.9%) | 3 (2.8%) |
| $22,500 to $24,999 | 4 (3.9%) | 15 (14.1%) |
| $25,000 to $29,999 | 8 (7.8%) | 11 (10.4%) |
| $30,000 to $34,999 | 0 (0.0%) | 10 (9.4%) |
| $35,000 to $39,999 | 0 (0.0%) | 3 (2.8%) |
| $40,000 to $44,999 | 2 (1.9%) | 6 (5.7%) |
| $45,000 to $49,999 | 11 (10.7%) | 4 (3.8%) |
| $50,000 to $54,999 | 3 (2.9%) | 5 (4.7%) |
| $55,000 to $64,999 | 25 (24.3%) | 8 (7.5%) |
| $65,000 to $74,999 | 5 (4.9%) | 14 (13.2%) |
| $75,000 to $99,999 | 3 (2.9%) | 0 (0.0%) |
| $100,000+ | 19 (18.4%) | 0 (0.0%) |
| Total | 103 (100.0%) | 106 (100.0%) |
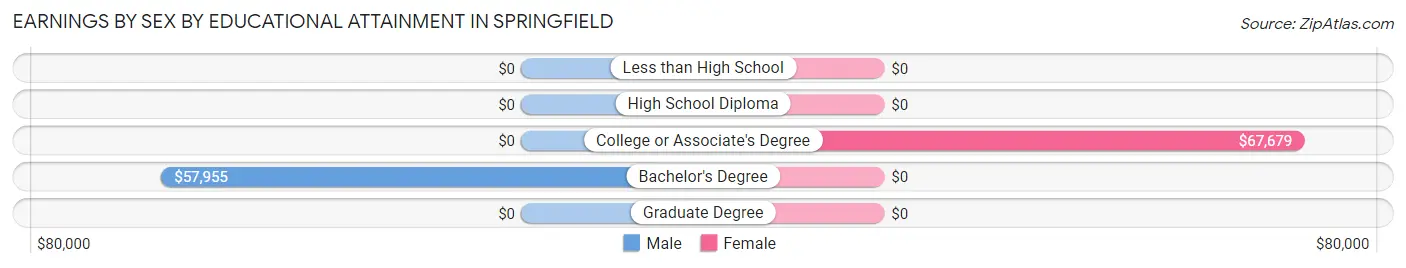
Earnings by Sex by Educational Attainment in Springfield
Average earnings in Springfield are $55,250 for men and $38,750 for women, a difference of 29.9%. Men with an educational attainment of bachelor's degree enjoy the highest average annual earnings of $57,955, while those with bachelor's degree education earn the least with $57,955. Women with an educational attainment of college or associate's degree earn the most with the average annual earnings of $67,679, while those with college or associate's degree education have the smallest earnings of $67,679.
| Educational Attainment | Male Income | Female Income |
| Less than High School | - | - |
| High School Diploma | - | - |
| College or Associate's Degree | - | - |
| Bachelor's Degree | $57,955 | $0 |
| Graduate Degree | - | - |
| Total | $55,250 | $38,750 |
Family Income in Springfield
Family Income Brackets in Springfield
According to the Springfield family income data, there are 30 families falling into the $50,000 to $74,999 income range, which is the most common income bracket and makes up 22.9% of all families.
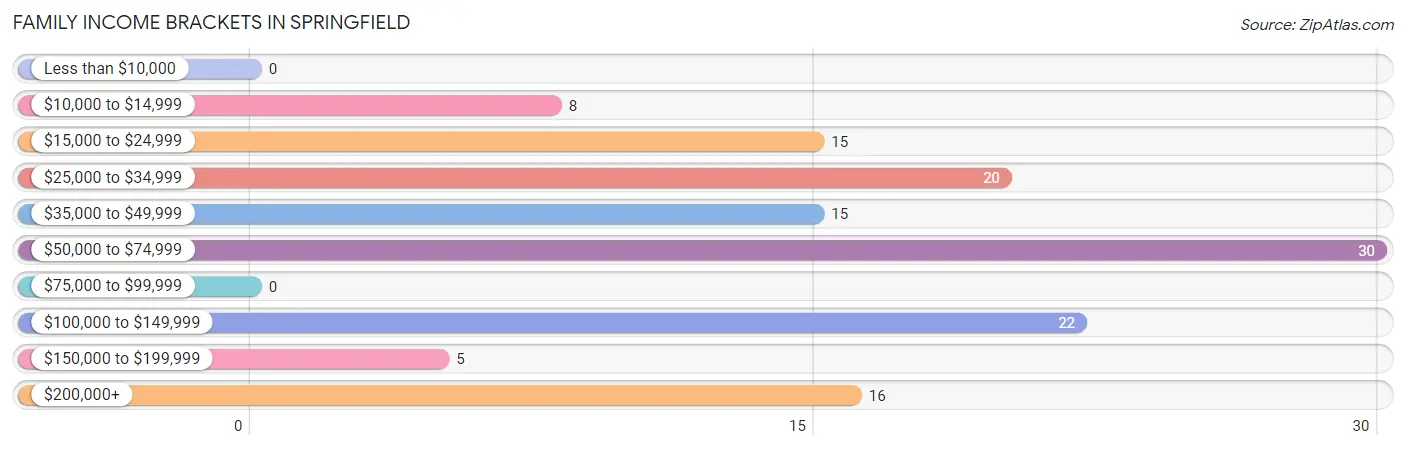
| Income Bracket | # Families | % Families |
| Less than $10,000 | 0 | 0.0% |
| $10,000 to $14,999 | 8 | 6.1% |
| $15,000 to $24,999 | 15 | 11.5% |
| $25,000 to $34,999 | 20 | 15.3% |
| $35,000 to $49,999 | 15 | 11.5% |
| $50,000 to $74,999 | 30 | 22.9% |
| $75,000 to $99,999 | 0 | 0.0% |
| $100,000 to $149,999 | 22 | 16.8% |
| $150,000 to $199,999 | 5 | 3.8% |
| $200,000+ | 16 | 12.2% |
Family Income by Famaliy Size in Springfield
2-person families (77 | 58.8%) account for the highest median family income in Springfield with $68,036 per family, while 2-person families (77 | 58.8%) have the highest median income of $34,018 per family member.
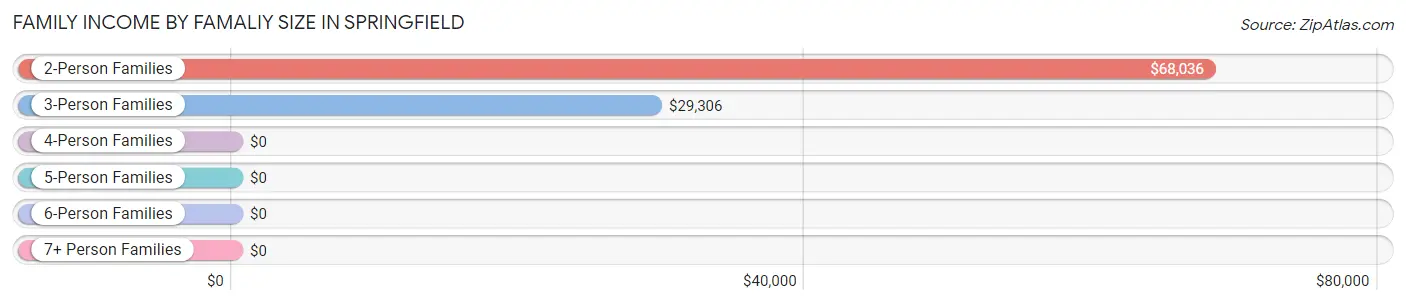
| Income Bracket | # Families | Median Income |
| 2-Person Families | 77 (58.8%) | $68,036 |
| 3-Person Families | 31 (23.7%) | $29,306 |
| 4-Person Families | 19 (14.5%) | $0 |
| 5-Person Families | 4 (3.0%) | $0 |
| 6-Person Families | 0 (0.0%) | $0 |
| 7+ Person Families | 0 (0.0%) | $0 |
| Total | 131 (100.0%) | $58,750 |
Family Income by Number of Earners in Springfield
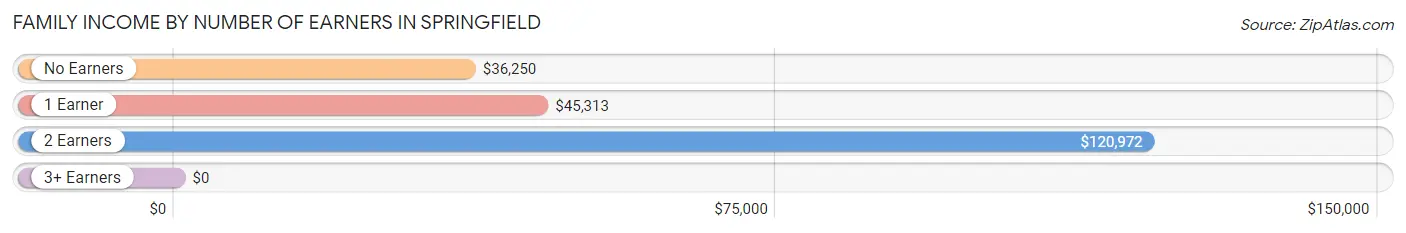
| Number of Earners | # Families | Median Income |
| No Earners | 24 (18.3%) | $36,250 |
| 1 Earner | 62 (47.3%) | $45,313 |
| 2 Earners | 39 (29.8%) | $120,972 |
| 3+ Earners | 6 (4.6%) | $0 |
| Total | 131 (100.0%) | $58,750 |
Household Income in Springfield
Household Income Brackets in Springfield
With 44 households falling in the category, the $50,000 to $74,999 income range is the most frequent in Springfield, accounting for 23.0% of all households.
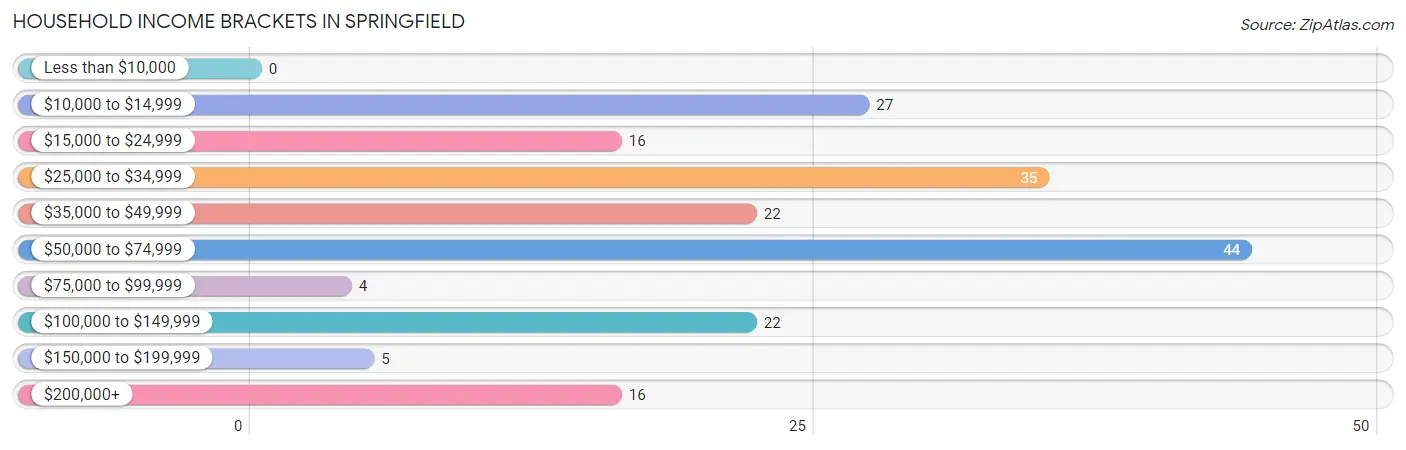
| Income Bracket | # Households | % Households |
| Less than $10,000 | 0 | 0.0% |
| $10,000 to $14,999 | 27 | 14.1% |
| $15,000 to $24,999 | 16 | 8.4% |
| $25,000 to $34,999 | 35 | 18.3% |
| $35,000 to $49,999 | 22 | 11.5% |
| $50,000 to $74,999 | 44 | 23.0% |
| $75,000 to $99,999 | 4 | 2.1% |
| $100,000 to $149,999 | 22 | 11.5% |
| $150,000 to $199,999 | 5 | 2.6% |
| $200,000+ | 16 | 8.4% |
Household Income by Householder Age in Springfield
The median household income in Springfield is $46,477, with the highest median household income of $68,304 found in the 45 to 64 years age bracket for the primary householder. A total of 81 households (42.4%) fall into this category. Meanwhile, the 15 to 24 years age bracket for the primary householder has the lowest median household income of $0, with 11 households (5.8%) in this group.
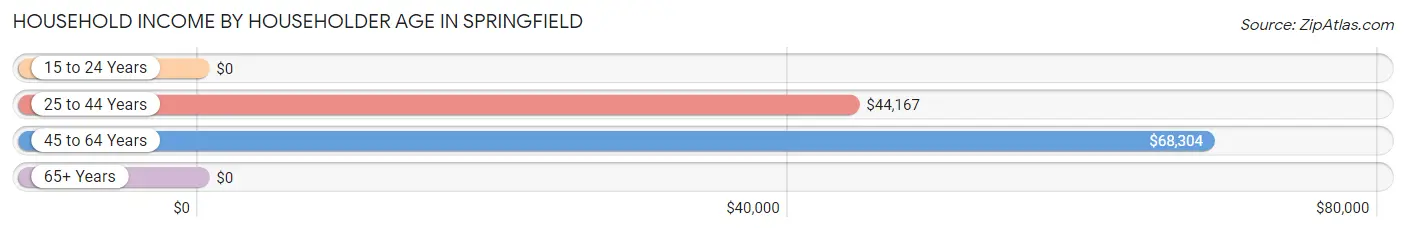
| Income Bracket | # Households | Median Income |
| 15 to 24 Years | 11 (5.8%) | $0 |
| 25 to 44 Years | 52 (27.2%) | $44,167 |
| 45 to 64 Years | 81 (42.4%) | $68,304 |
| 65+ Years | 47 (24.6%) | $0 |
| Total | 191 (100.0%) | $46,477 |
Poverty in Springfield
Income Below Poverty by Sex and Age in Springfield
With 18.2% poverty level for males and 15.1% for females among the residents of Springfield, 45 to 54 year old males and 35 to 44 year old females are the most vulnerable to poverty, with 11 males (50.0%) and 5 females (55.6%) in their respective age groups living below the poverty level.
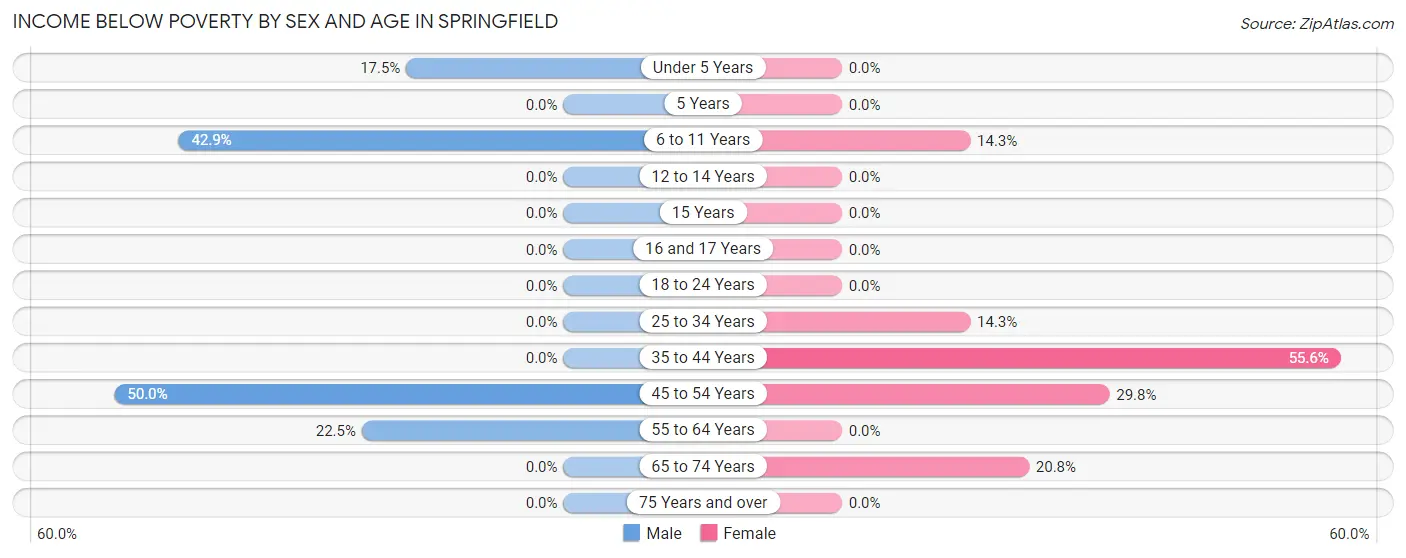
| Age Bracket | Male | Female |
| Under 5 Years | 7 (17.5%) | 0 (0.0%) |
| 5 Years | 0 (0.0%) | 0 (0.0%) |
| 6 to 11 Years | 12 (42.9%) | 5 (14.3%) |
| 12 to 14 Years | 0 (0.0%) | 0 (0.0%) |
| 15 Years | 0 (0.0%) | 0 (0.0%) |
| 16 and 17 Years | 0 (0.0%) | 0 (0.0%) |
| 18 to 24 Years | 0 (0.0%) | 0 (0.0%) |
| 25 to 34 Years | 0 (0.0%) | 7 (14.3%) |
| 35 to 44 Years | 0 (0.0%) | 5 (55.6%) |
| 45 to 54 Years | 11 (50.0%) | 14 (29.8%) |
| 55 to 64 Years | 11 (22.5%) | 0 (0.0%) |
| 65 to 74 Years | 0 (0.0%) | 5 (20.8%) |
| 75 Years and over | 0 (0.0%) | 0 (0.0%) |
| Total | 41 (18.2%) | 36 (15.1%) |
Income Above Poverty by Sex and Age in Springfield
According to the poverty statistics in Springfield, males aged 25 to 34 years and females aged under 5 years are the age groups that are most secure financially, with 100.0% of males and 100.0% of females in these age groups living above the poverty line.
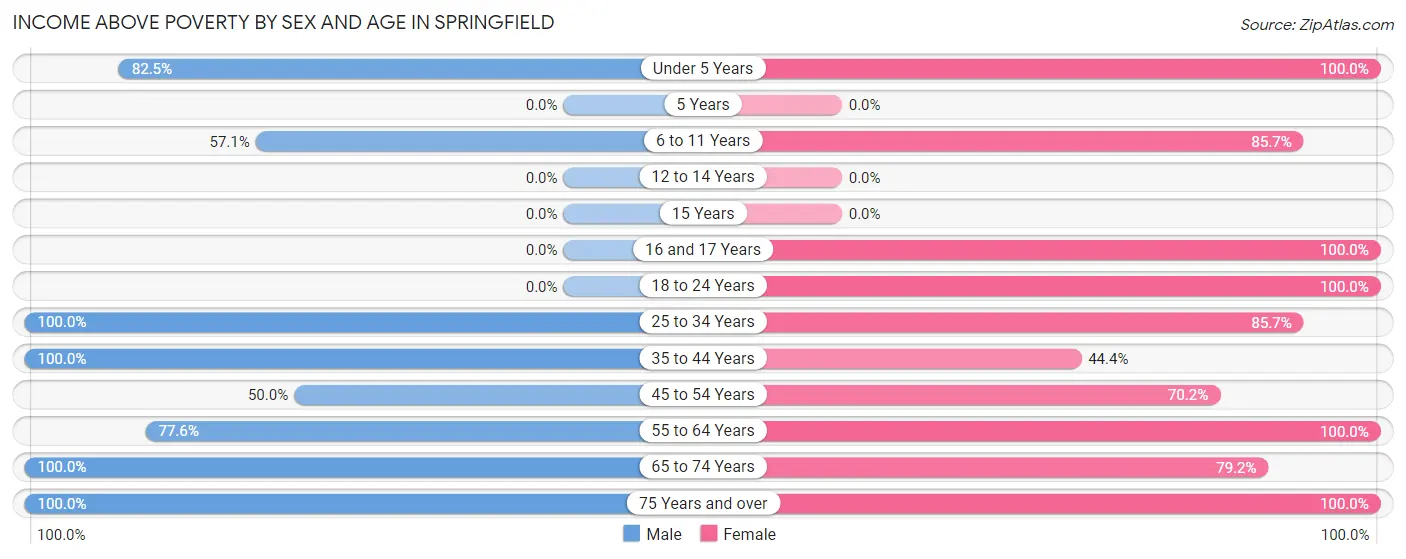
| Age Bracket | Male | Female |
| Under 5 Years | 33 (82.5%) | 6 (100.0%) |
| 5 Years | 0 (0.0%) | 0 (0.0%) |
| 6 to 11 Years | 16 (57.1%) | 30 (85.7%) |
| 12 to 14 Years | 0 (0.0%) | 0 (0.0%) |
| 15 Years | 0 (0.0%) | 0 (0.0%) |
| 16 and 17 Years | 0 (0.0%) | 2 (100.0%) |
| 18 to 24 Years | 0 (0.0%) | 29 (100.0%) |
| 25 to 34 Years | 28 (100.0%) | 42 (85.7%) |
| 35 to 44 Years | 30 (100.0%) | 4 (44.4%) |
| 45 to 54 Years | 11 (50.0%) | 33 (70.2%) |
| 55 to 64 Years | 38 (77.5%) | 21 (100.0%) |
| 65 to 74 Years | 11 (100.0%) | 19 (79.2%) |
| 75 Years and over | 17 (100.0%) | 17 (100.0%) |
| Total | 184 (81.8%) | 203 (84.9%) |
Income Below Poverty Among Married-Couple Families in Springfield
The poverty statistics for married-couple families in Springfield show that 1.1% or 1 of the total 91 families live below the poverty line. Families with no children have the highest poverty rate of 1.6%, comprising of 1 families. On the other hand, families with 1 or 2 children have the lowest poverty rate of 0.0%, which includes 0 families.
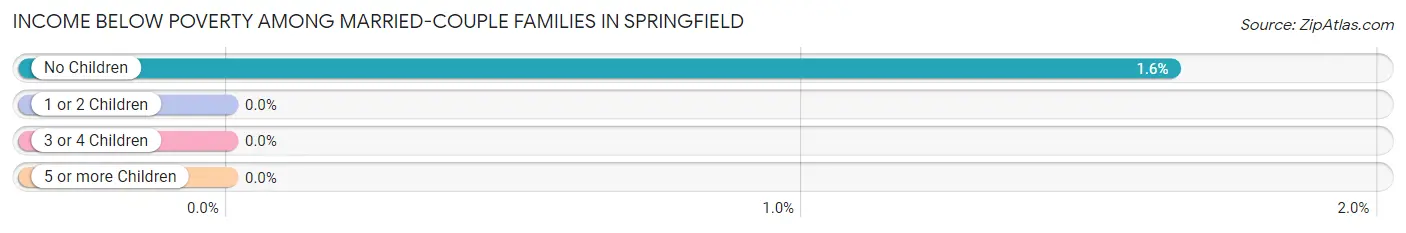
| Children | Above Poverty | Below Poverty |
| No Children | 60 (98.4%) | 1 (1.6%) |
| 1 or 2 Children | 30 (100.0%) | 0 (0.0%) |
| 3 or 4 Children | 0 (0.0%) | 0 (0.0%) |
| 5 or more Children | 0 (0.0%) | 0 (0.0%) |
| Total | 90 (98.9%) | 1 (1.1%) |
Income Below Poverty Among Single-Parent Households in Springfield
According to the poverty data in Springfield, 100.0% or 2 single-father households and 23.7% or 9 single-mother households are living below the poverty line. Among single-father households, those with 1 or 2 children have the highest poverty rate, with 2 households (100.0%) experiencing poverty. Likewise, among single-mother households, those with 1 or 2 children have the highest poverty rate, with 7 households (25.9%) falling below the poverty line.
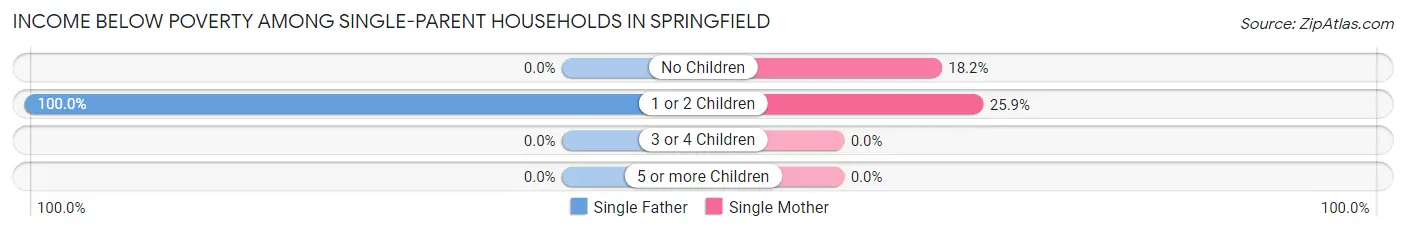
| Children | Single Father | Single Mother |
| No Children | 0 (0.0%) | 2 (18.2%) |
| 1 or 2 Children | 2 (100.0%) | 7 (25.9%) |
| 3 or 4 Children | 0 (0.0%) | 0 (0.0%) |
| 5 or more Children | 0 (0.0%) | 0 (0.0%) |
| Total | 2 (100.0%) | 9 (23.7%) |
Income Below Poverty Among Married-Couple vs Single-Parent Households in Springfield
The poverty data for Springfield shows that 1 of the married-couple family households (1.1%) and 11 of the single-parent households (27.5%) are living below the poverty level. Within the married-couple family households, those with no children have the highest poverty rate, with 1 households (1.6%) falling below the poverty line. Among the single-parent households, those with 1 or 2 children have the highest poverty rate, with 9 household (31.0%) living below poverty.
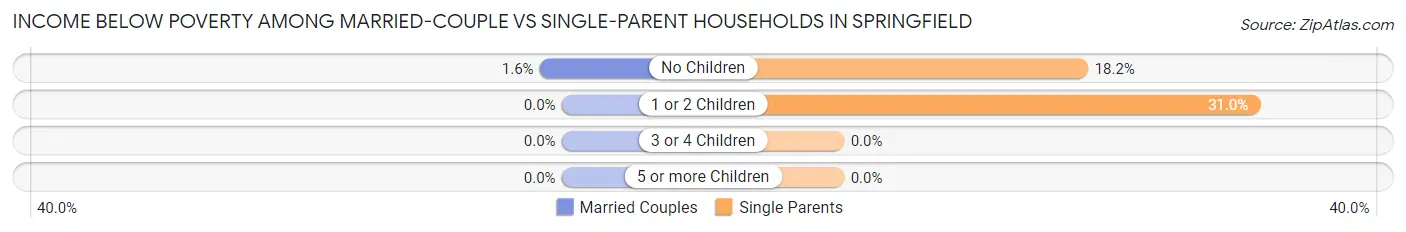
| Children | Married-Couple Families | Single-Parent Households |
| No Children | 1 (1.6%) | 2 (18.2%) |
| 1 or 2 Children | 0 (0.0%) | 9 (31.0%) |
| 3 or 4 Children | 0 (0.0%) | 0 (0.0%) |
| 5 or more Children | 0 (0.0%) | 0 (0.0%) |
| Total | 1 (1.1%) | 11 (27.5%) |
Race in Springfield
The most populous races in Springfield are White / Caucasian (361 | 77.8%), Black / African American (63 | 13.6%), and Two or more Races (28 | 6.0%).
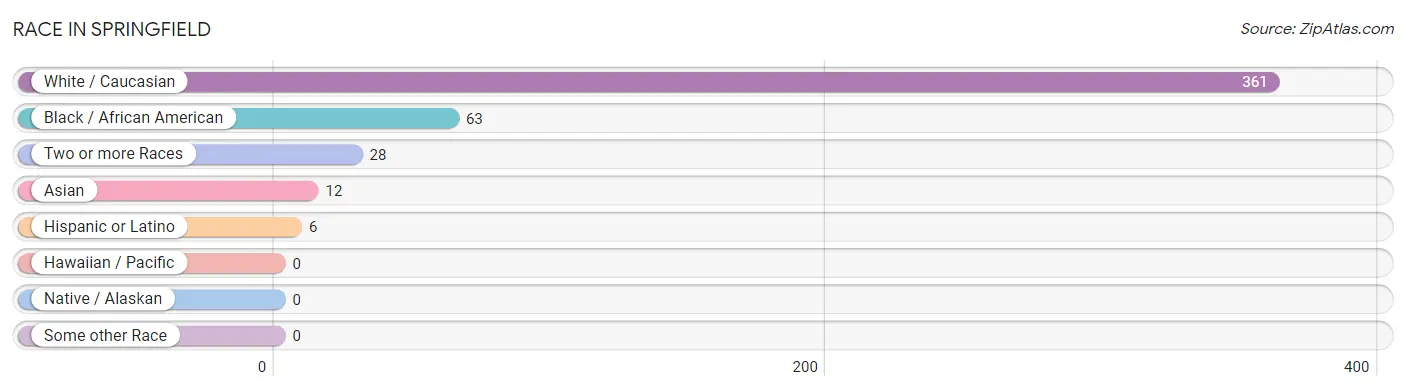
| Race | # Population | % Population |
| Asian | 12 | 2.6% |
| Black / African American | 63 | 13.6% |
| Hawaiian / Pacific | 0 | 0.0% |
| Hispanic or Latino | 6 | 1.3% |
| Native / Alaskan | 0 | 0.0% |
| White / Caucasian | 361 | 77.8% |
| Two or more Races | 28 | 6.0% |
| Some other Race | 0 | 0.0% |
| Total | 464 | 100.0% |
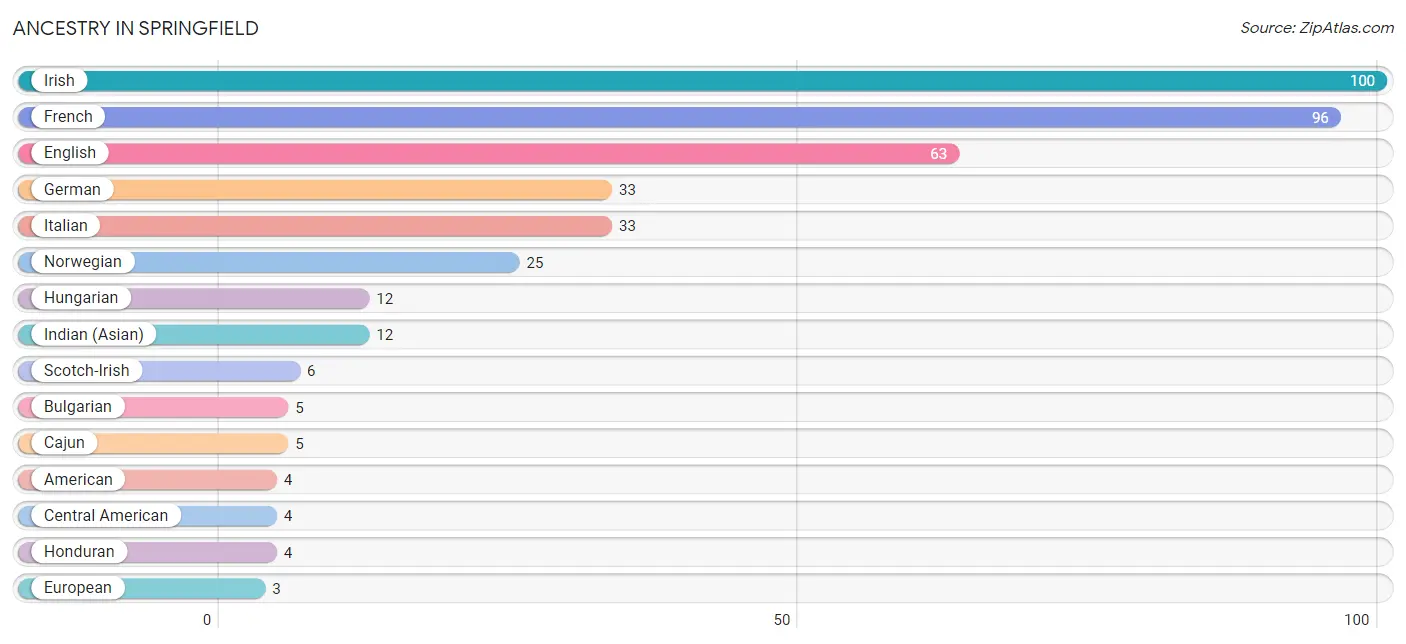
Ancestry in Springfield
The most populous ancestries reported in Springfield are Irish (100 | 21.5%), French (96 | 20.7%), English (63 | 13.6%), German (33 | 7.1%), and Italian (33 | 7.1%), together accounting for 70.0% of all Springfield residents.
| Ancestry | # Population | % Population |
| American | 4 | 0.9% |
| Bulgarian | 5 | 1.1% |
| Cajun | 5 | 1.1% |
| Central American | 4 | 0.9% |
| Cherokee | 1 | 0.2% |
| Choctaw | 1 | 0.2% |
| English | 63 | 13.6% |
| European | 3 | 0.6% |
| French | 96 | 20.7% |
| German | 33 | 7.1% |
| Honduran | 4 | 0.9% |
| Hungarian | 12 | 2.6% |
| Indian (Asian) | 12 | 2.6% |
| Irish | 100 | 21.5% |
| Italian | 33 | 7.1% |
| Norwegian | 25 | 5.4% |
| Scotch-Irish | 6 | 1.3% |
| Scottish | 3 | 0.6% |
| Spanish | 2 | 0.4% |
| Swedish | 2 | 0.4% | View All 20 Rows |
Immigrants in Springfield
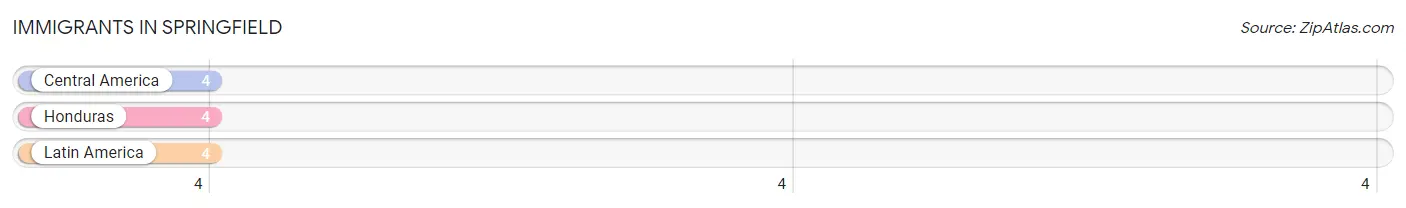
The most numerous immigrant groups reported in Springfield came from Central America (4 | 0.9%), Honduras (4 | 0.9%), and Latin America (4 | 0.9%), together accounting for 2.6% of all Springfield residents.
| Immigration Origin | # Population | % Population |
| Central America | 4 | 0.9% |
| Honduras | 4 | 0.9% |
| Latin America | 4 | 0.9% | View All 3 Rows |
Sex and Age in Springfield
Sex and Age in Springfield
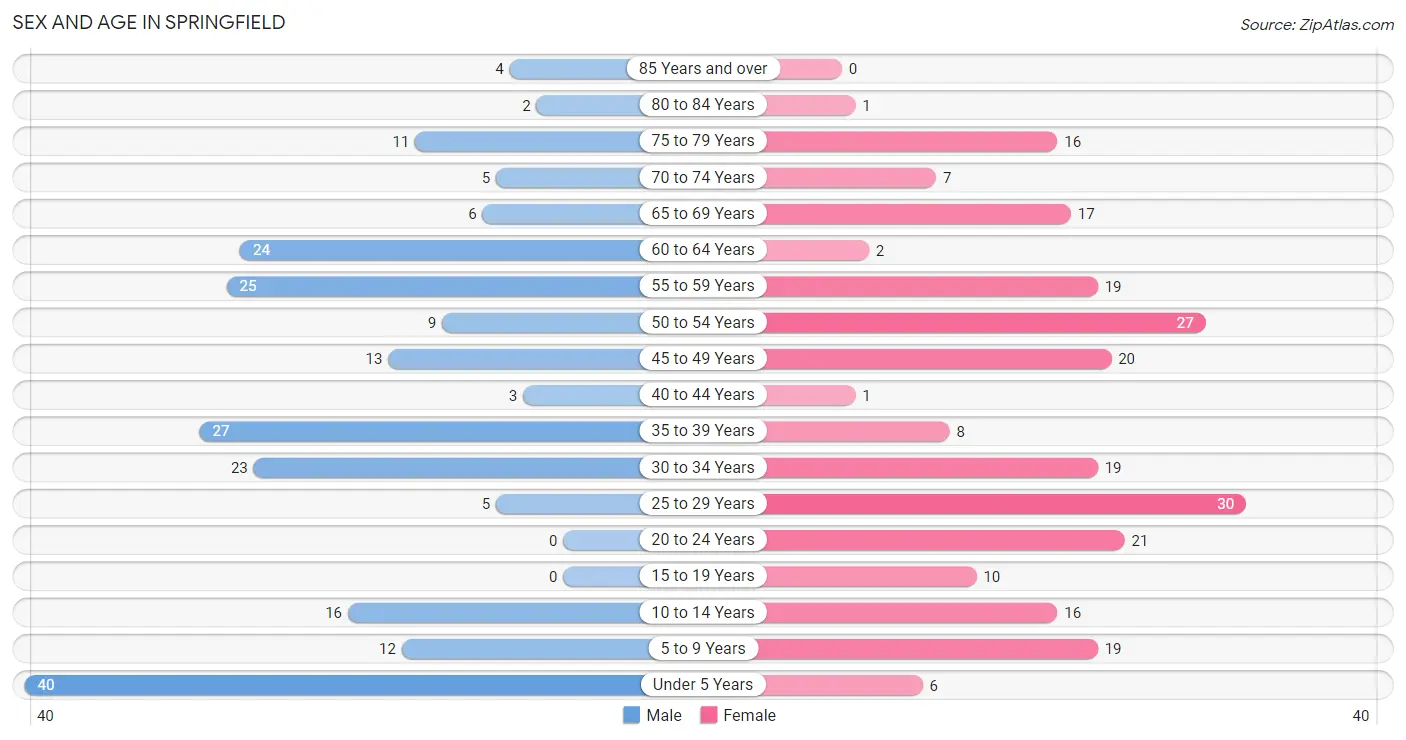
The most populous age groups in Springfield are Under 5 Years (40 | 17.8%) for men and 25 to 29 Years (30 | 12.6%) for women.
| Age Bracket | Male | Female |
| Under 5 Years | 40 (17.8%) | 6 (2.5%) |
| 5 to 9 Years | 12 (5.3%) | 19 (8.0%) |
| 10 to 14 Years | 16 (7.1%) | 16 (6.7%) |
| 15 to 19 Years | 0 (0.0%) | 10 (4.2%) |
| 20 to 24 Years | 0 (0.0%) | 21 (8.8%) |
| 25 to 29 Years | 5 (2.2%) | 30 (12.6%) |
| 30 to 34 Years | 23 (10.2%) | 19 (8.0%) |
| 35 to 39 Years | 27 (12.0%) | 8 (3.4%) |
| 40 to 44 Years | 3 (1.3%) | 1 (0.4%) |
| 45 to 49 Years | 13 (5.8%) | 20 (8.4%) |
| 50 to 54 Years | 9 (4.0%) | 27 (11.3%) |
| 55 to 59 Years | 25 (11.1%) | 19 (8.0%) |
| 60 to 64 Years | 24 (10.7%) | 2 (0.8%) |
| 65 to 69 Years | 6 (2.7%) | 17 (7.1%) |
| 70 to 74 Years | 5 (2.2%) | 7 (2.9%) |
| 75 to 79 Years | 11 (4.9%) | 16 (6.7%) |
| 80 to 84 Years | 2 (0.9%) | 1 (0.4%) |
| 85 Years and over | 4 (1.8%) | 0 (0.0%) |
| Total | 225 (100.0%) | 239 (100.0%) |
Families and Households in Springfield
Median Family Size in Springfield
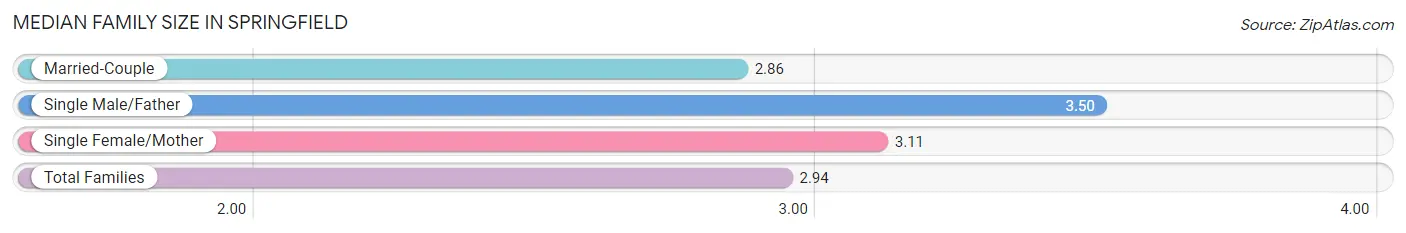
The median family size in Springfield is 2.94 persons per family, with single male/father families (2 | 1.5%) accounting for the largest median family size of 3.5 persons per family. On the other hand, married-couple families (91 | 69.5%) represent the smallest median family size with 2.86 persons per family.
| Family Type | # Families | Family Size |
| Married-Couple | 91 (69.5%) | 2.86 |
| Single Male/Father | 2 (1.5%) | 3.50 |
| Single Female/Mother | 38 (29.0%) | 3.11 |
| Total Families | 131 (100.0%) | 2.94 |
Median Household Size in Springfield
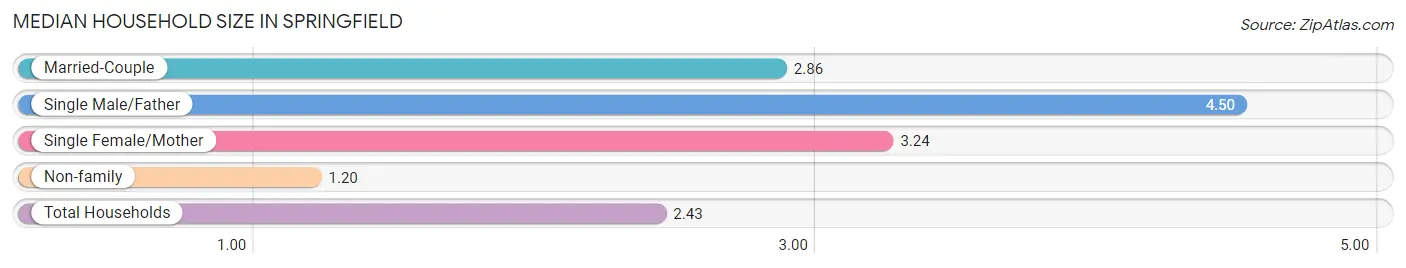
The median household size in Springfield is 2.43 persons per household, with single male/father households (2 | 1.1%) accounting for the largest median household size of 4.5 persons per household. non-family households (60 | 31.4%) represent the smallest median household size with 1.20 persons per household.
| Household Type | # Households | Household Size |
| Married-Couple | 91 (47.6%) | 2.86 |
| Single Male/Father | 2 (1.1%) | 4.50 |
| Single Female/Mother | 38 (19.9%) | 3.24 |
| Non-family | 60 (31.4%) | 1.20 |
| Total Households | 191 (100.0%) | 2.43 |
Household Size by Marriage Status in Springfield
Out of a total of 191 households in Springfield, 131 (68.6%) are family households, while 60 (31.4%) are nonfamily households. The most numerous type of family households are 2-person households, comprising 75, and the most common type of nonfamily households are 1-person households, comprising 48.
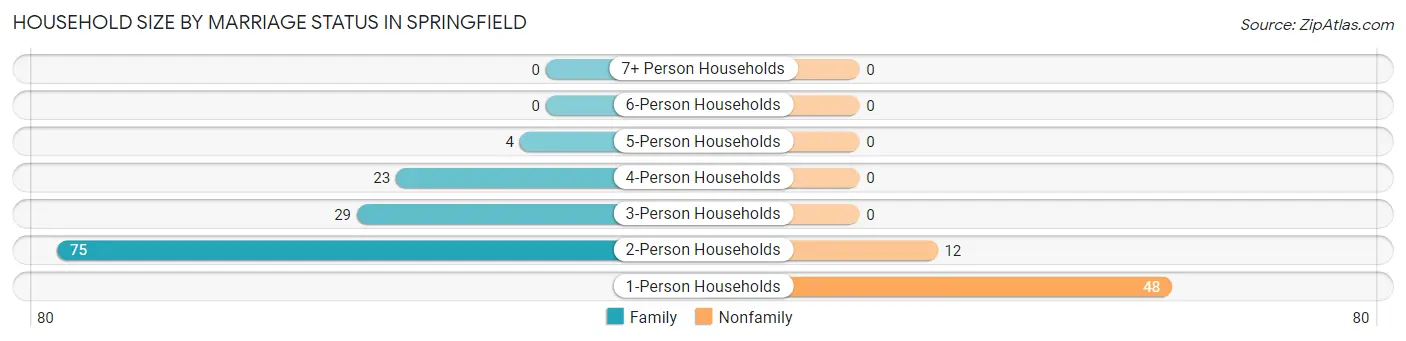
| Household Size | Family Households | Nonfamily Households |
| 1-Person Households | - | 48 (25.1%) |
| 2-Person Households | 75 (39.3%) | 12 (6.3%) |
| 3-Person Households | 29 (15.2%) | 0 (0.0%) |
| 4-Person Households | 23 (12.0%) | 0 (0.0%) |
| 5-Person Households | 4 (2.1%) | 0 (0.0%) |
| 6-Person Households | 0 (0.0%) | 0 (0.0%) |
| 7+ Person Households | 0 (0.0%) | 0 (0.0%) |
| Total | 131 (68.6%) | 60 (31.4%) |
Female Fertility in Springfield
Fertility by Age in Springfield
Average fertility rate in Springfield is 130.0 births per 1,000 women. Women in the age bracket of 20 to 34 years have the highest fertility rate with 229.0 births per 1,000 women. Women in the age bracket of 20 to 34 years acount for 100.0% of all women with births.
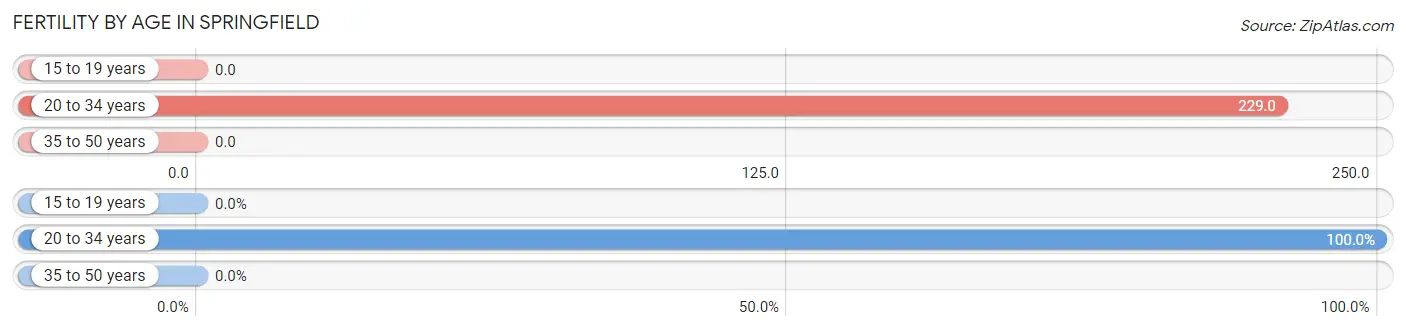
| Age Bracket | Women with Births | Births / 1,000 Women |
| 15 to 19 years | 0 (0.0%) | 0.0 |
| 20 to 34 years | 16 (100.0%) | 229.0 |
| 35 to 50 years | 0 (0.0%) | 0.0 |
| Total | 16 (100.0%) | 130.0 |
Fertility by Age by Marriage Status in Springfield
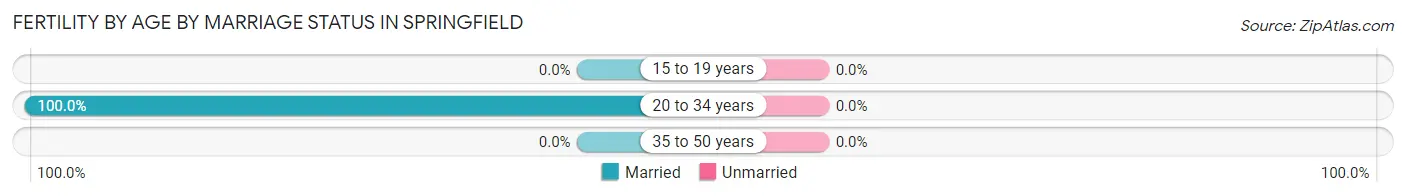
| Age Bracket | Married | Unmarried |
| 15 to 19 years | 0 (0.0%) | 0 (0.0%) |
| 20 to 34 years | 16 (100.0%) | 0 (0.0%) |
| 35 to 50 years | 0 (0.0%) | 0 (0.0%) |
| Total | 16 (100.0%) | 0 (0.0%) |
Fertility by Education in Springfield
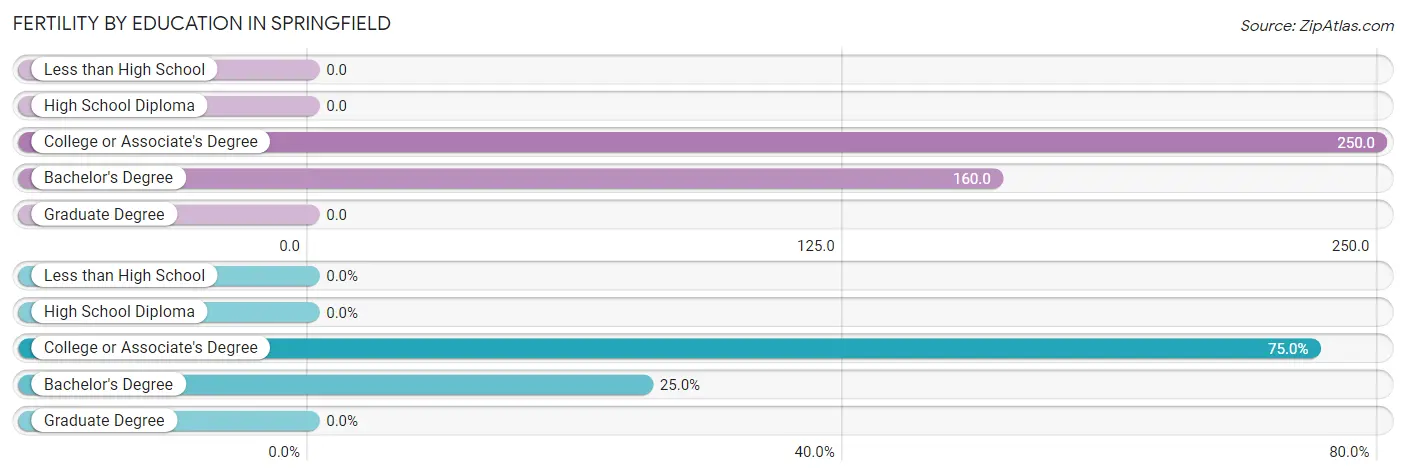
| Educational Attainment | Women with Births | Births / 1,000 Women |
| Less than High School | 0 (0.0%) | 0.0 |
| High School Diploma | 0 (0.0%) | 0.0 |
| College or Associate's Degree | 12 (75.0%) | 250.0 |
| Bachelor's Degree | 4 (25.0%) | 160.0 |
| Graduate Degree | 0 (0.0%) | 0.0 |
| Total | 16 (100.0%) | 130.0 |
Fertility by Education by Marriage Status in Springfield
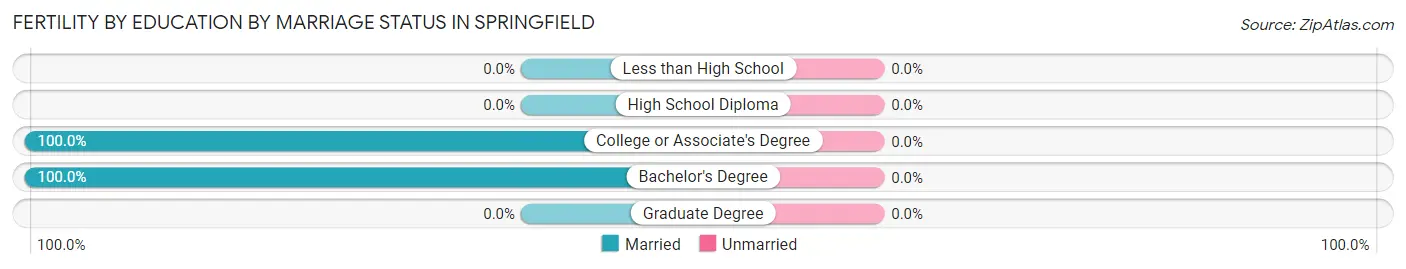
| Educational Attainment | Married | Unmarried |
| Less than High School | 0 (0.0%) | 0 (0.0%) |
| High School Diploma | 0 (0.0%) | 0 (0.0%) |
| College or Associate's Degree | 12 (100.0%) | 0 (0.0%) |
| Bachelor's Degree | 4 (100.0%) | 0 (0.0%) |
| Graduate Degree | 0 (0.0%) | 0 (0.0%) |
| Total | 16 (100.0%) | 0 (0.0%) |
Employment Characteristics in Springfield
Employment by Class of Employer in Springfield
Among the 172 employed individuals in Springfield, private company employees (114 | 66.3%), local government employees (23 | 13.4%), and self-employed (not incorporated) (12 | 7.0%) make up the most common classes of employment.
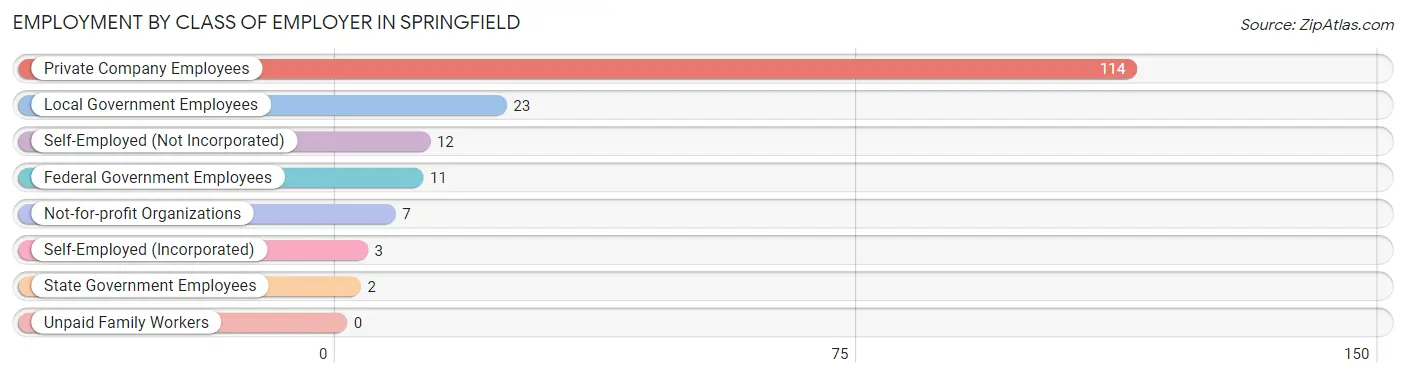
| Employer Class | # Employees | % Employees |
| Private Company Employees | 114 | 66.3% |
| Self-Employed (Incorporated) | 3 | 1.7% |
| Self-Employed (Not Incorporated) | 12 | 7.0% |
| Not-for-profit Organizations | 7 | 4.1% |
| Local Government Employees | 23 | 13.4% |
| State Government Employees | 2 | 1.2% |
| Federal Government Employees | 11 | 6.4% |
| Unpaid Family Workers | 0 | 0.0% |
| Total | 172 | 100.0% |
Employment Status by Age in Springfield
According to the labor force statistics for Springfield, out of the total population over 16 years of age (355), 54.4% or 193 individuals are in the labor force, with 10.9% or 21 of them unemployed. The age group with the highest labor force participation rate is 20 to 24 years, with 100.0% or 21 individuals in the labor force. Within the labor force, the 30 to 34 years age range has the highest percentage of unemployed individuals, with 38.5% or 10 of them being unemployed.
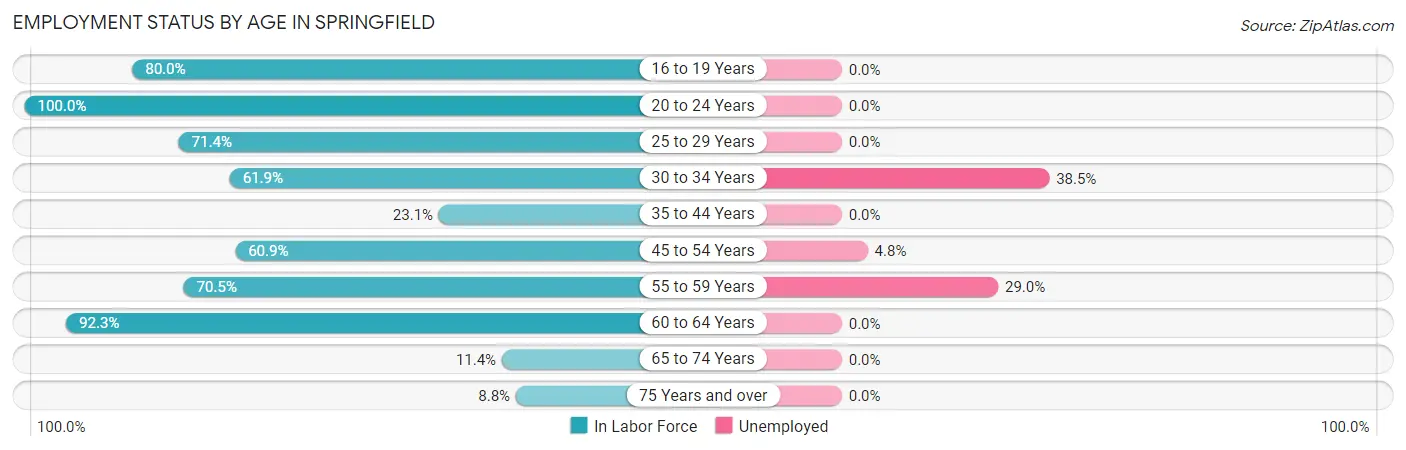
| Age Bracket | In Labor Force | Unemployed |
| 16 to 19 Years | 8 (80.0%) | 0 (0.0%) |
| 20 to 24 Years | 21 (100.0%) | 0 (0.0%) |
| 25 to 29 Years | 25 (71.4%) | 0 (0.0%) |
| 30 to 34 Years | 26 (61.9%) | 10 (38.5%) |
| 35 to 44 Years | 9 (23.1%) | 0 (0.0%) |
| 45 to 54 Years | 42 (60.9%) | 2 (4.8%) |
| 55 to 59 Years | 31 (70.5%) | 9 (29.0%) |
| 60 to 64 Years | 24 (92.3%) | 0 (0.0%) |
| 65 to 74 Years | 4 (11.4%) | 0 (0.0%) |
| 75 Years and over | 3 (8.8%) | 0 (0.0%) |
| Total | 193 (54.4%) | 21 (10.9%) |
Employment Status by Educational Attainment in Springfield
According to labor force statistics for Springfield, 61.6% of individuals (157) out of the total population between 25 and 64 years of age (255) are in the labor force, with 13.4% or 21 of them being unemployed. The group with the highest labor force participation rate are those with the educational attainment of bachelor's degree or higher, with 78.7% or 48 individuals in the labor force. Within the labor force, individuals with college / associate degree education have the highest percentage of unemployment, with 23.1% or 15 of them being unemployed.
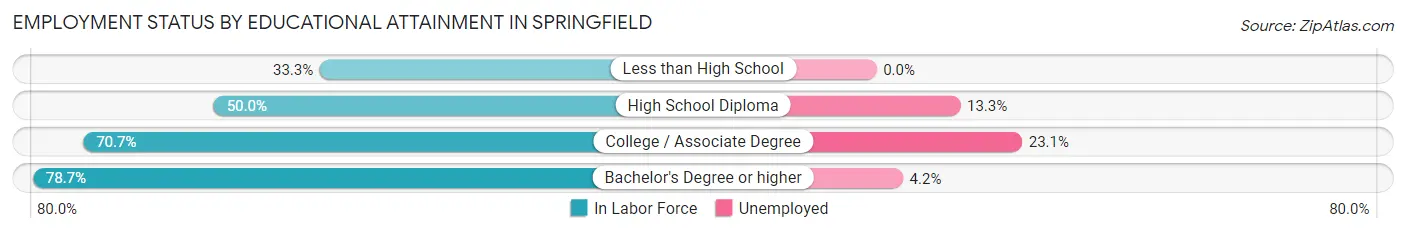
| Educational Attainment | In Labor Force | Unemployed |
| Less than High School | 14 (33.3%) | 0 (0.0%) |
| High School Diploma | 30 (50.0%) | 8 (13.3%) |
| College / Associate Degree | 65 (70.7%) | 21 (23.1%) |
| Bachelor's Degree or higher | 48 (78.7%) | 3 (4.2%) |
| Total | 157 (61.6%) | 34 (13.4%) |
Employment Occupations by Sex in Springfield
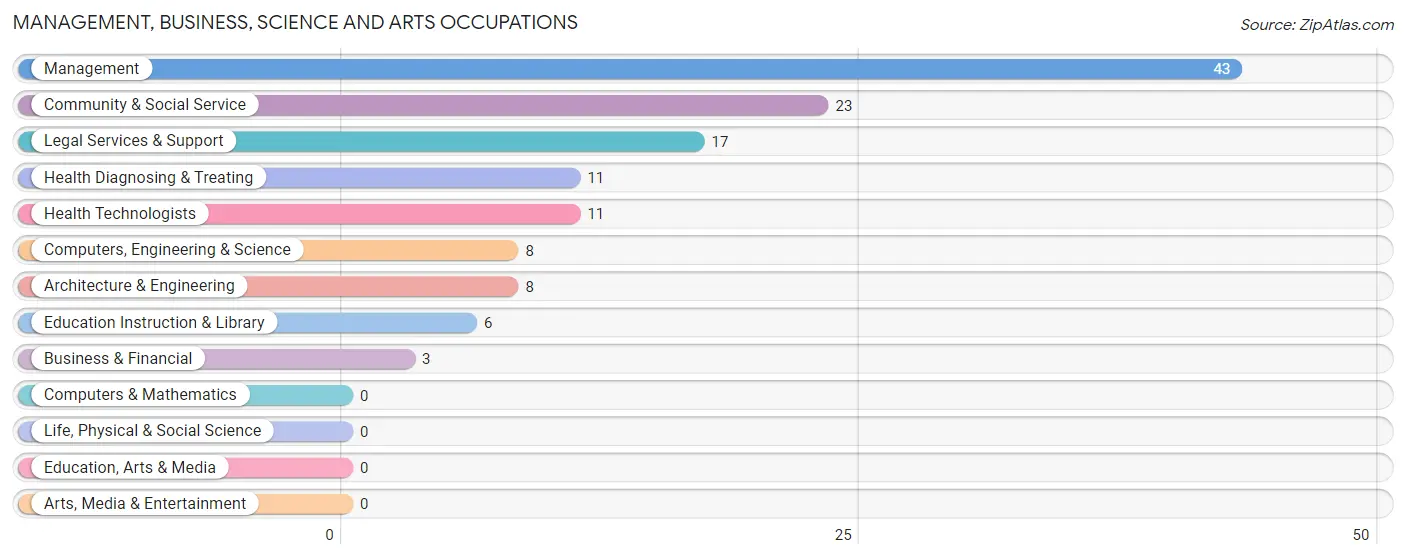
Management, Business, Science and Arts Occupations
The most common Management, Business, Science and Arts occupations in Springfield are Management (43 | 25.0%), Community & Social Service (23 | 13.4%), Legal Services & Support (17 | 9.9%), Health Diagnosing & Treating (11 | 6.4%), and Health Technologists (11 | 6.4%).
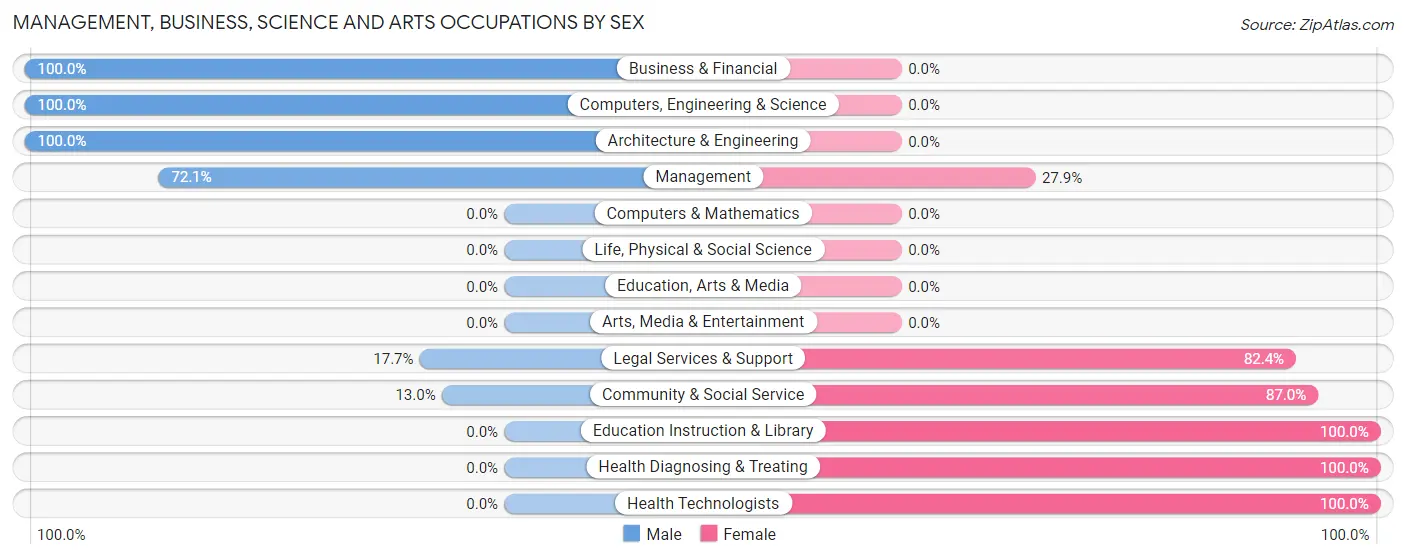
Management, Business, Science and Arts Occupations by Sex
Within the Management, Business, Science and Arts occupations in Springfield, the most male-oriented occupations are Business & Financial (100.0%), Computers, Engineering & Science (100.0%), and Architecture & Engineering (100.0%), while the most female-oriented occupations are Education Instruction & Library (100.0%), Health Diagnosing & Treating (100.0%), and Health Technologists (100.0%).
| Occupation | Male | Female |
| Management | 31 (72.1%) | 12 (27.9%) |
| Business & Financial | 3 (100.0%) | 0 (0.0%) |
| Computers, Engineering & Science | 8 (100.0%) | 0 (0.0%) |
| Computers & Mathematics | 0 (0.0%) | 0 (0.0%) |
| Architecture & Engineering | 8 (100.0%) | 0 (0.0%) |
| Life, Physical & Social Science | 0 (0.0%) | 0 (0.0%) |
| Community & Social Service | 3 (13.0%) | 20 (87.0%) |
| Education, Arts & Media | 0 (0.0%) | 0 (0.0%) |
| Legal Services & Support | 3 (17.6%) | 14 (82.4%) |
| Education Instruction & Library | 0 (0.0%) | 6 (100.0%) |
| Arts, Media & Entertainment | 0 (0.0%) | 0 (0.0%) |
| Health Diagnosing & Treating | 0 (0.0%) | 11 (100.0%) |
| Health Technologists | 0 (0.0%) | 11 (100.0%) |
| Total (Category) | 45 (51.1%) | 43 (48.9%) |
| Total (Overall) | 72 (41.9%) | 100 (58.1%) |
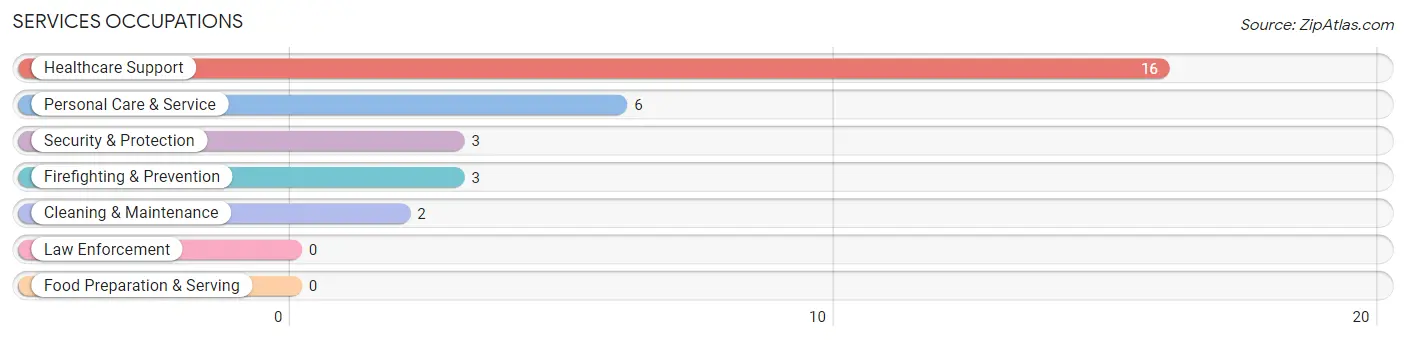
Services Occupations
The most common Services occupations in Springfield are Healthcare Support (16 | 9.3%), Personal Care & Service (6 | 3.5%), Security & Protection (3 | 1.7%), Firefighting & Prevention (3 | 1.7%), and Cleaning & Maintenance (2 | 1.2%).
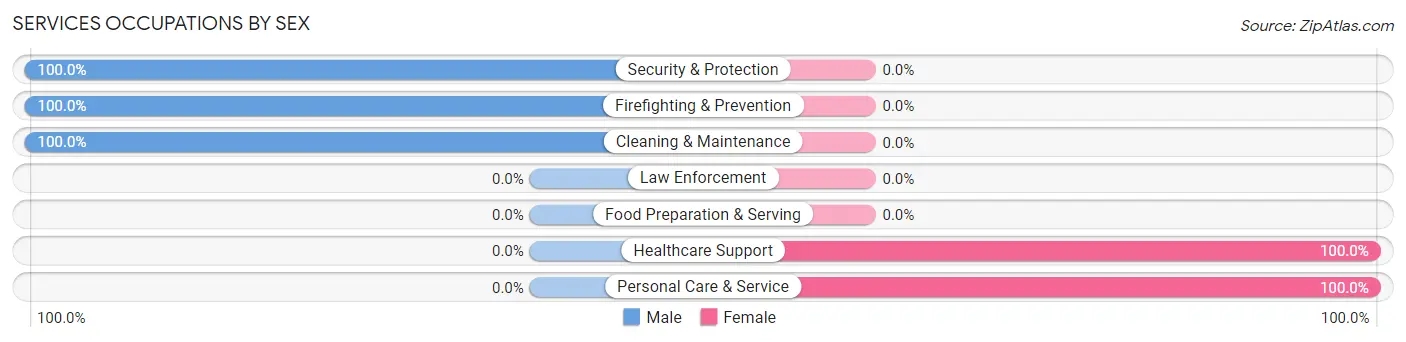
Services Occupations by Sex
Within the Services occupations in Springfield, the most male-oriented occupations are Security & Protection (100.0%), Firefighting & Prevention (100.0%), and Cleaning & Maintenance (100.0%), while the most female-oriented occupations are Healthcare Support (100.0%), and Personal Care & Service (100.0%).
| Occupation | Male | Female |
| Healthcare Support | 0 (0.0%) | 16 (100.0%) |
| Security & Protection | 3 (100.0%) | 0 (0.0%) |
| Firefighting & Prevention | 3 (100.0%) | 0 (0.0%) |
| Law Enforcement | 0 (0.0%) | 0 (0.0%) |
| Food Preparation & Serving | 0 (0.0%) | 0 (0.0%) |
| Cleaning & Maintenance | 2 (100.0%) | 0 (0.0%) |
| Personal Care & Service | 0 (0.0%) | 6 (100.0%) |
| Total (Category) | 5 (18.5%) | 22 (81.5%) |
| Total (Overall) | 72 (41.9%) | 100 (58.1%) |
Sales and Office Occupations
The most common Sales and Office occupations in Springfield are , and Office & Administration (46 | 26.7%).
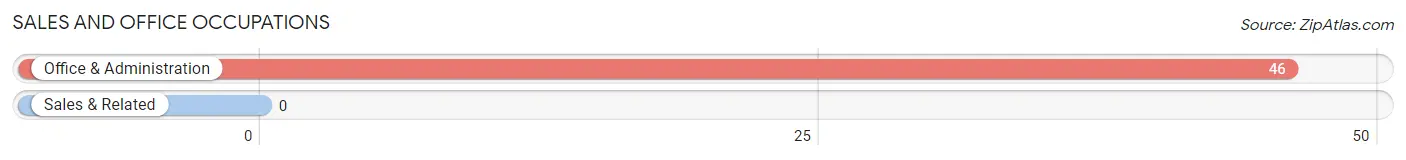
Sales and Office Occupations by Sex
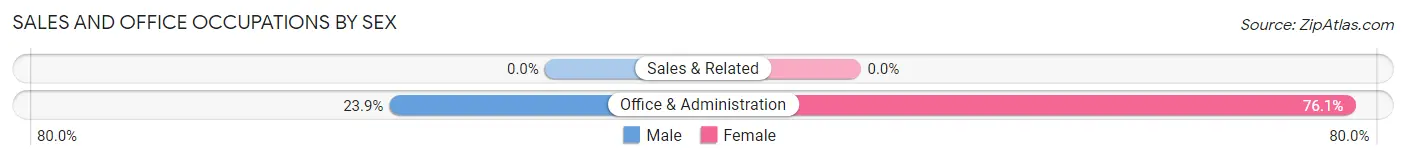
| Occupation | Male | Female |
| Sales & Related | 0 (0.0%) | 0 (0.0%) |
| Office & Administration | 11 (23.9%) | 35 (76.1%) |
| Total (Category) | 11 (23.9%) | 35 (76.1%) |
| Total (Overall) | 72 (41.9%) | 100 (58.1%) |
Natural Resources, Construction and Maintenance Occupations
The most common Natural Resources, Construction and Maintenance occupations in Springfield are , and Construction & Extraction (5 | 2.9%).
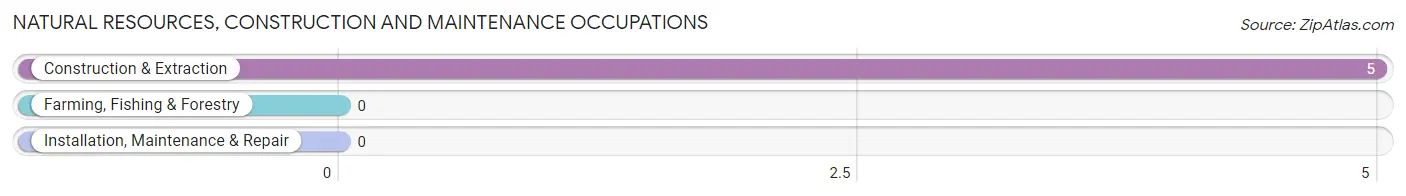
Natural Resources, Construction and Maintenance Occupations by Sex
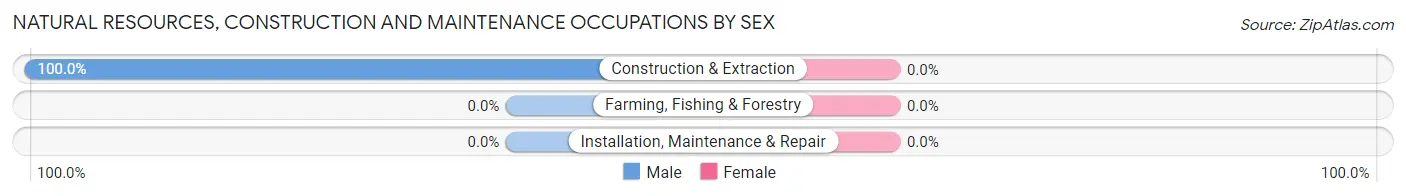
| Occupation | Male | Female |
| Farming, Fishing & Forestry | 0 (0.0%) | 0 (0.0%) |
| Construction & Extraction | 5 (100.0%) | 0 (0.0%) |
| Installation, Maintenance & Repair | 0 (0.0%) | 0 (0.0%) |
| Total (Category) | 5 (100.0%) | 0 (0.0%) |
| Total (Overall) | 72 (41.9%) | 100 (58.1%) |
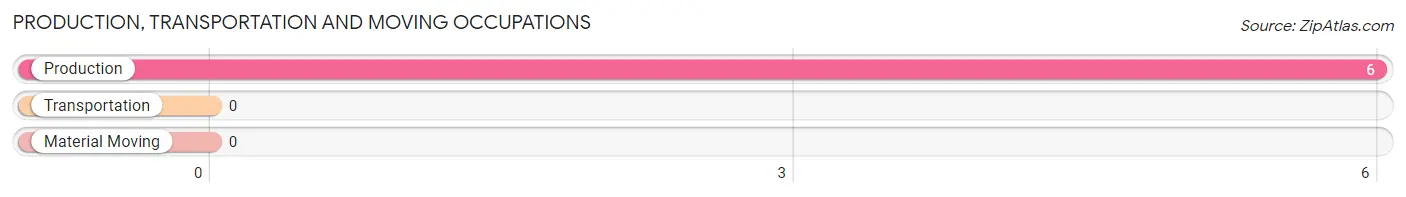
Production, Transportation and Moving Occupations
The most common Production, Transportation and Moving occupations in Springfield are , and Production (6 | 3.5%).
Production, Transportation and Moving Occupations by Sex
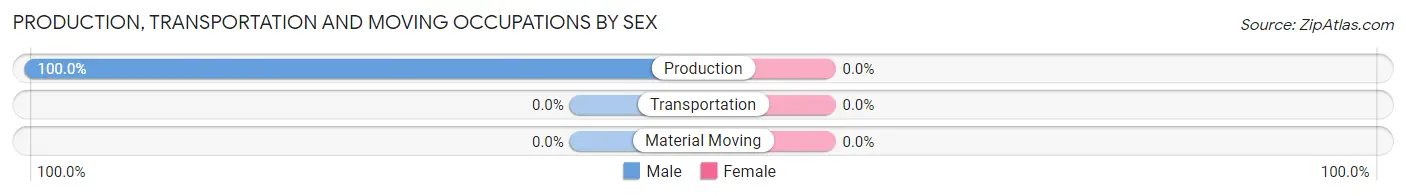
| Occupation | Male | Female |
| Production | 6 (100.0%) | 0 (0.0%) |
| Transportation | 0 (0.0%) | 0 (0.0%) |
| Material Moving | 0 (0.0%) | 0 (0.0%) |
| Total (Category) | 6 (100.0%) | 0 (0.0%) |
| Total (Overall) | 72 (41.9%) | 100 (58.1%) |
Employment Industries by Sex in Springfield
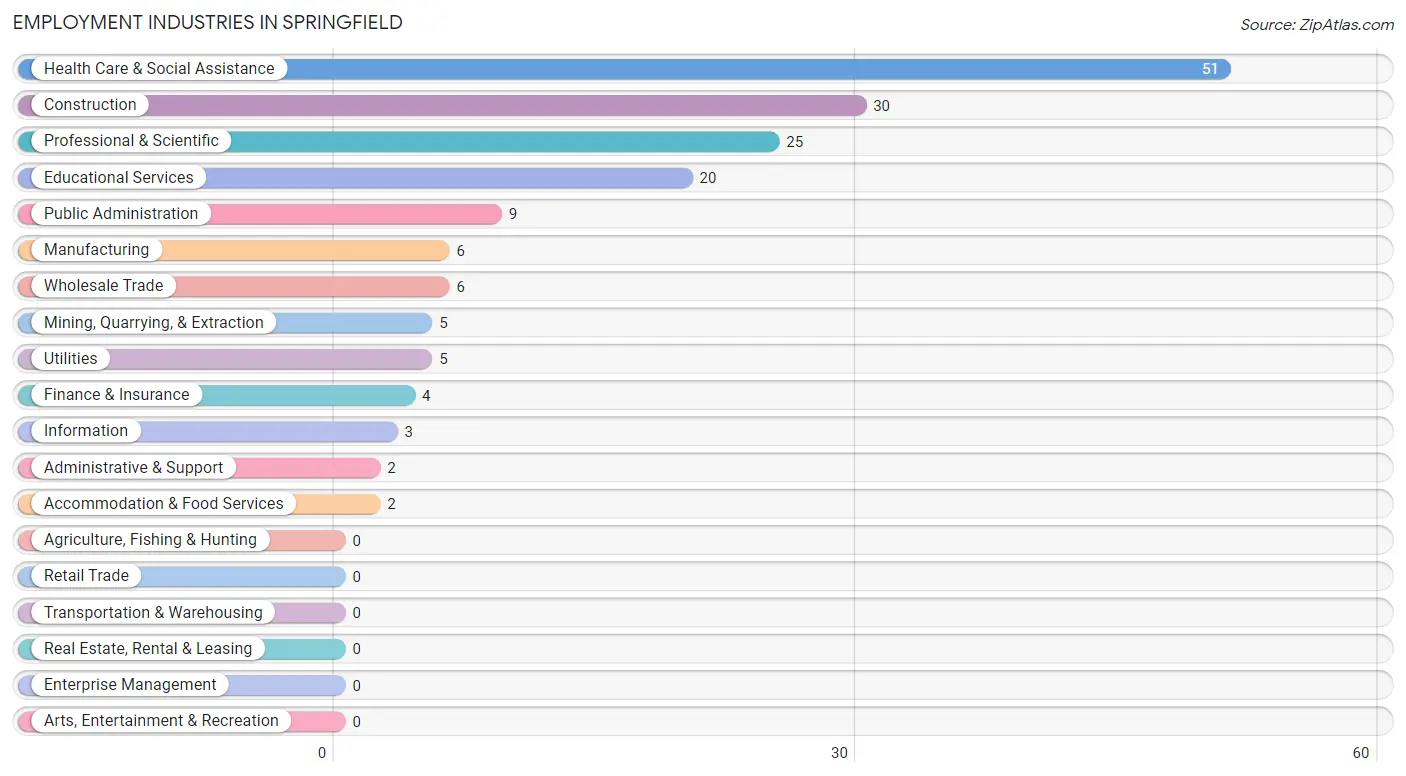
Employment Industries in Springfield
The major employment industries in Springfield include Health Care & Social Assistance (51 | 29.6%), Construction (30 | 17.4%), Professional & Scientific (25 | 14.5%), Educational Services (20 | 11.6%), and Public Administration (9 | 5.2%).
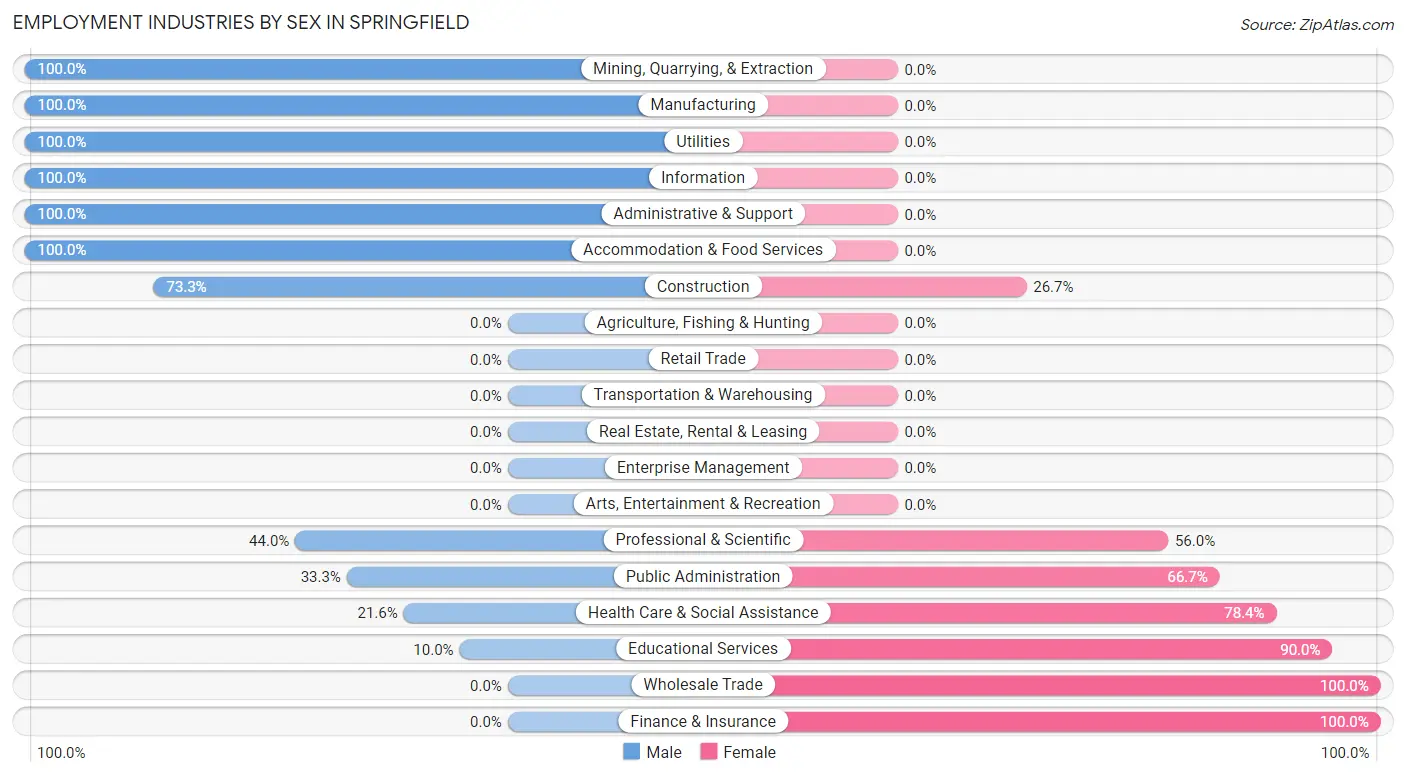
Employment Industries by Sex in Springfield
The Springfield industries that see more men than women are Mining, Quarrying, & Extraction (100.0%), Manufacturing (100.0%), and Utilities (100.0%), whereas the industries that tend to have a higher number of women are Wholesale Trade (100.0%), Finance & Insurance (100.0%), and Educational Services (90.0%).
| Industry | Male | Female |
| Agriculture, Fishing & Hunting | 0 (0.0%) | 0 (0.0%) |
| Mining, Quarrying, & Extraction | 5 (100.0%) | 0 (0.0%) |
| Construction | 22 (73.3%) | 8 (26.7%) |
| Manufacturing | 6 (100.0%) | 0 (0.0%) |
| Wholesale Trade | 0 (0.0%) | 6 (100.0%) |
| Retail Trade | 0 (0.0%) | 0 (0.0%) |
| Transportation & Warehousing | 0 (0.0%) | 0 (0.0%) |
| Utilities | 5 (100.0%) | 0 (0.0%) |
| Information | 3 (100.0%) | 0 (0.0%) |
| Finance & Insurance | 0 (0.0%) | 4 (100.0%) |
| Real Estate, Rental & Leasing | 0 (0.0%) | 0 (0.0%) |
| Professional & Scientific | 11 (44.0%) | 14 (56.0%) |
| Enterprise Management | 0 (0.0%) | 0 (0.0%) |
| Administrative & Support | 2 (100.0%) | 0 (0.0%) |
| Educational Services | 2 (10.0%) | 18 (90.0%) |
| Health Care & Social Assistance | 11 (21.6%) | 40 (78.4%) |
| Arts, Entertainment & Recreation | 0 (0.0%) | 0 (0.0%) |
| Accommodation & Food Services | 2 (100.0%) | 0 (0.0%) |
| Public Administration | 3 (33.3%) | 6 (66.7%) |
| Total | 72 (41.9%) | 100 (58.1%) |
Education in Springfield
School Enrollment in Springfield
The most common levels of schooling among the 91 students in Springfield are elementary school (59 | 64.8%), graduate / professional (11 | 12.1%), and college / undergraduate (8 | 8.8%).
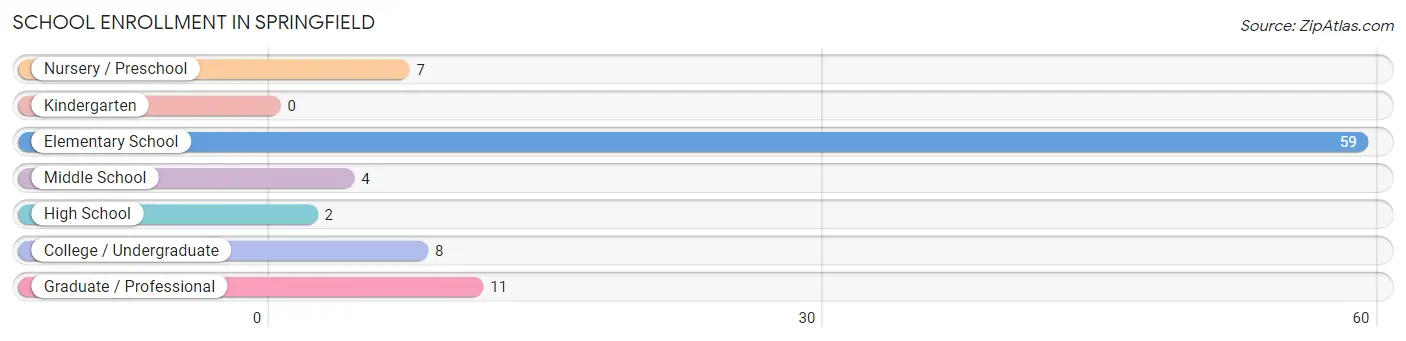
| School Level | # Students | % Students |
| Nursery / Preschool | 7 | 7.7% |
| Kindergarten | 0 | 0.0% |
| Elementary School | 59 | 64.8% |
| Middle School | 4 | 4.4% |
| High School | 2 | 2.2% |
| College / Undergraduate | 8 | 8.8% |
| Graduate / Professional | 11 | 12.1% |
| Total | 91 | 100.0% |
School Enrollment by Age by Funding Source in Springfield
Out of a total of 91 students who are enrolled in schools in Springfield, 11 (12.1%) attend a private institution, while the remaining 80 (87.9%) are enrolled in public schools. The age group of 35 years and over has the highest likelihood of being enrolled in private schools, with 11 (100.0% in the age bracket) enrolled. Conversely, the age group of 3 to 4 year olds has the lowest likelihood of being enrolled in a private school, with 7 (100.0% in the age bracket) attending a public institution.
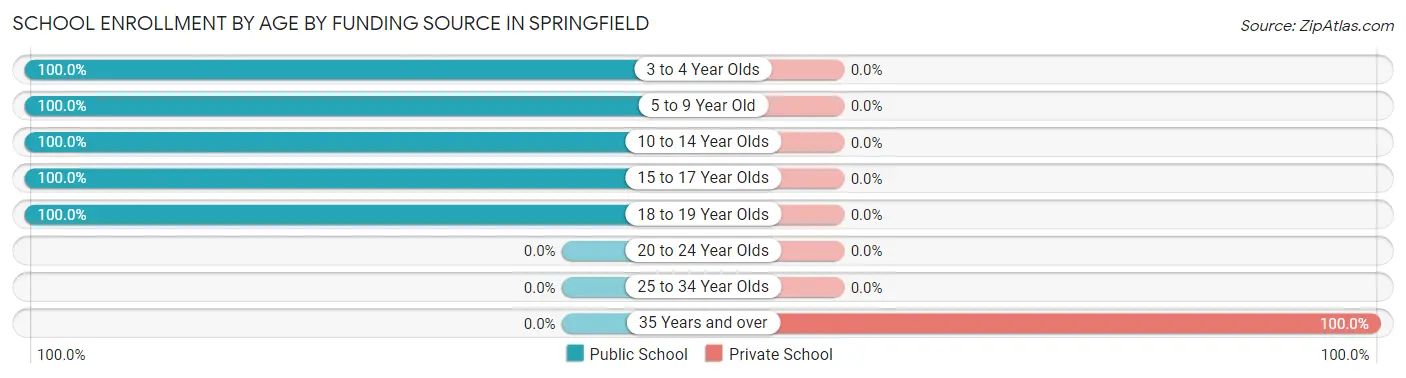
| Age Bracket | Public School | Private School |
| 3 to 4 Year Olds | 7 (100.0%) | 0 (0.0%) |
| 5 to 9 Year Old | 31 (100.0%) | 0 (0.0%) |
| 10 to 14 Year Olds | 32 (100.0%) | 0 (0.0%) |
| 15 to 17 Year Olds | 2 (100.0%) | 0 (0.0%) |
| 18 to 19 Year Olds | 8 (100.0%) | 0 (0.0%) |
| 20 to 24 Year Olds | 0 (0.0%) | 0 (0.0%) |
| 25 to 34 Year Olds | 0 (0.0%) | 0 (0.0%) |
| 35 Years and over | 0 (0.0%) | 11 (100.0%) |
| Total | 80 (87.9%) | 11 (12.1%) |
Educational Attainment by Field of Study in Springfield
Liberal arts & history (30 | 39.0%), education (18 | 23.4%), social sciences (11 | 14.3%), science & technology (10 | 13.0%), and visual & performing arts (4 | 5.2%) are the most common fields of study among 77 individuals in Springfield who have obtained a bachelor's degree or higher.
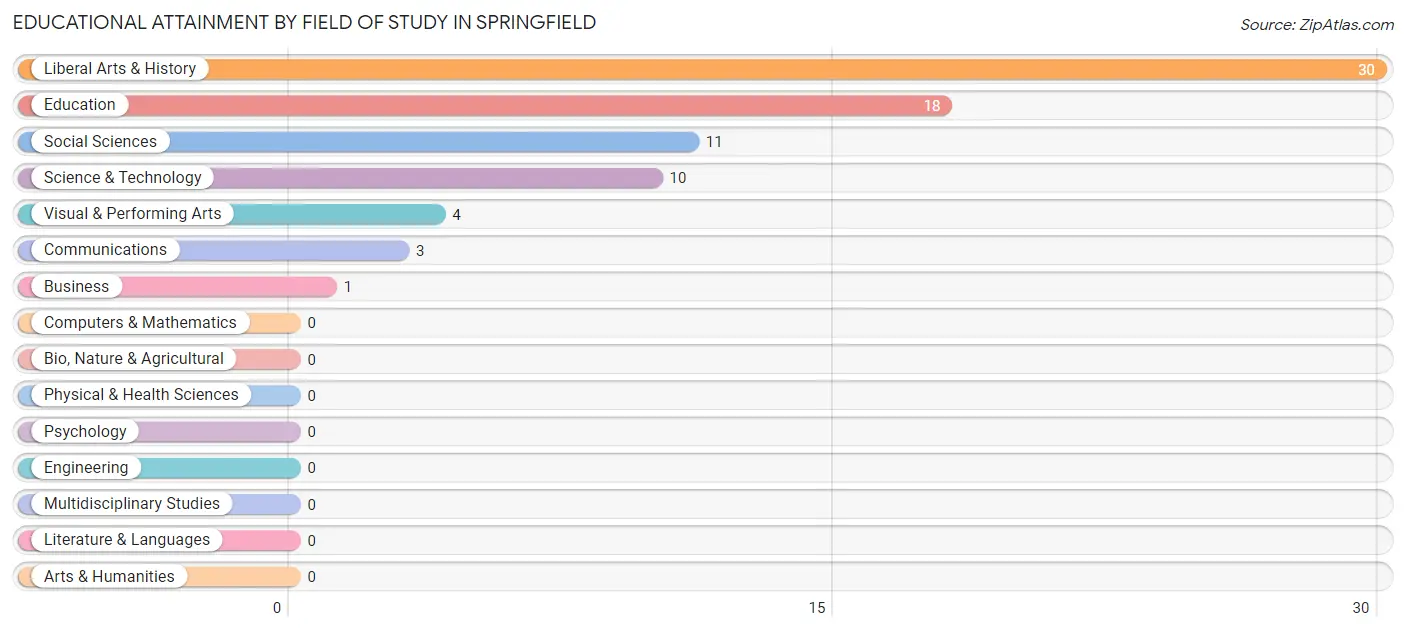
| Field of Study | # Graduates | % Graduates |
| Computers & Mathematics | 0 | 0.0% |
| Bio, Nature & Agricultural | 0 | 0.0% |
| Physical & Health Sciences | 0 | 0.0% |
| Psychology | 0 | 0.0% |
| Social Sciences | 11 | 14.3% |
| Engineering | 0 | 0.0% |
| Multidisciplinary Studies | 0 | 0.0% |
| Science & Technology | 10 | 13.0% |
| Business | 1 | 1.3% |
| Education | 18 | 23.4% |
| Literature & Languages | 0 | 0.0% |
| Liberal Arts & History | 30 | 39.0% |
| Visual & Performing Arts | 4 | 5.2% |
| Communications | 3 | 3.9% |
| Arts & Humanities | 0 | 0.0% |
| Total | 77 | 100.0% |
Transportation & Commute in Springfield
Vehicle Availability by Sex in Springfield
The most prevalent vehicle ownership categories in Springfield are males with 3 vehicles (36, accounting for 50.0%) and females with 3 vehicles (21, making up 36.0%).
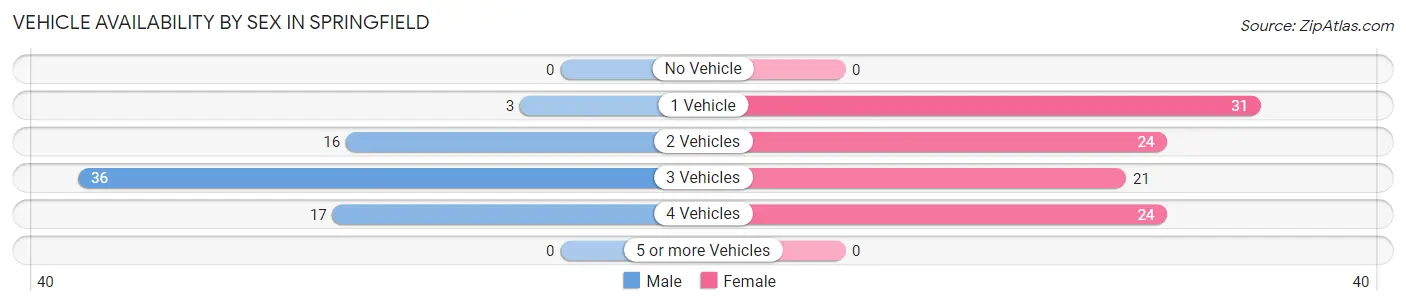
| Vehicles Available | Male | Female |
| No Vehicle | 0 (0.0%) | 0 (0.0%) |
| 1 Vehicle | 3 (4.2%) | 31 (31.0%) |
| 2 Vehicles | 16 (22.2%) | 24 (24.0%) |
| 3 Vehicles | 36 (50.0%) | 21 (21.0%) |
| 4 Vehicles | 17 (23.6%) | 24 (24.0%) |
| 5 or more Vehicles | 0 (0.0%) | 0 (0.0%) |
| Total | 72 (100.0%) | 100 (100.0%) |
Commute Time in Springfield
The most frequently occuring commute durations in Springfield are 20 to 24 minutes (40 commuters, 23.7%), 30 to 34 minutes (27 commuters, 16.0%), and 60 to 89 minutes (25 commuters, 14.8%).
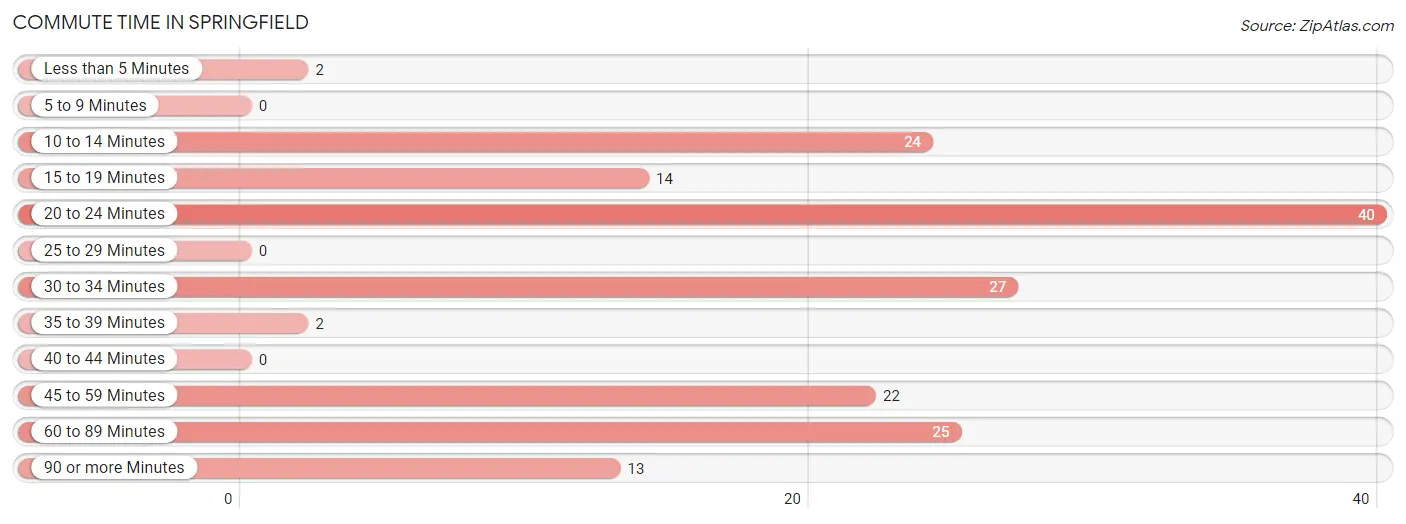
| Commute Time | # Commuters | % Commuters |
| Less than 5 Minutes | 2 | 1.2% |
| 5 to 9 Minutes | 0 | 0.0% |
| 10 to 14 Minutes | 24 | 14.2% |
| 15 to 19 Minutes | 14 | 8.3% |
| 20 to 24 Minutes | 40 | 23.7% |
| 25 to 29 Minutes | 0 | 0.0% |
| 30 to 34 Minutes | 27 | 16.0% |
| 35 to 39 Minutes | 2 | 1.2% |
| 40 to 44 Minutes | 0 | 0.0% |
| 45 to 59 Minutes | 22 | 13.0% |
| 60 to 89 Minutes | 25 | 14.8% |
| 90 or more Minutes | 13 | 7.7% |
Commute Time by Sex in Springfield
The most common commute times in Springfield are 60 to 89 minutes (21 commuters, 30.4%) for males and 20 to 24 minutes (31 commuters, 31.0%) for females.
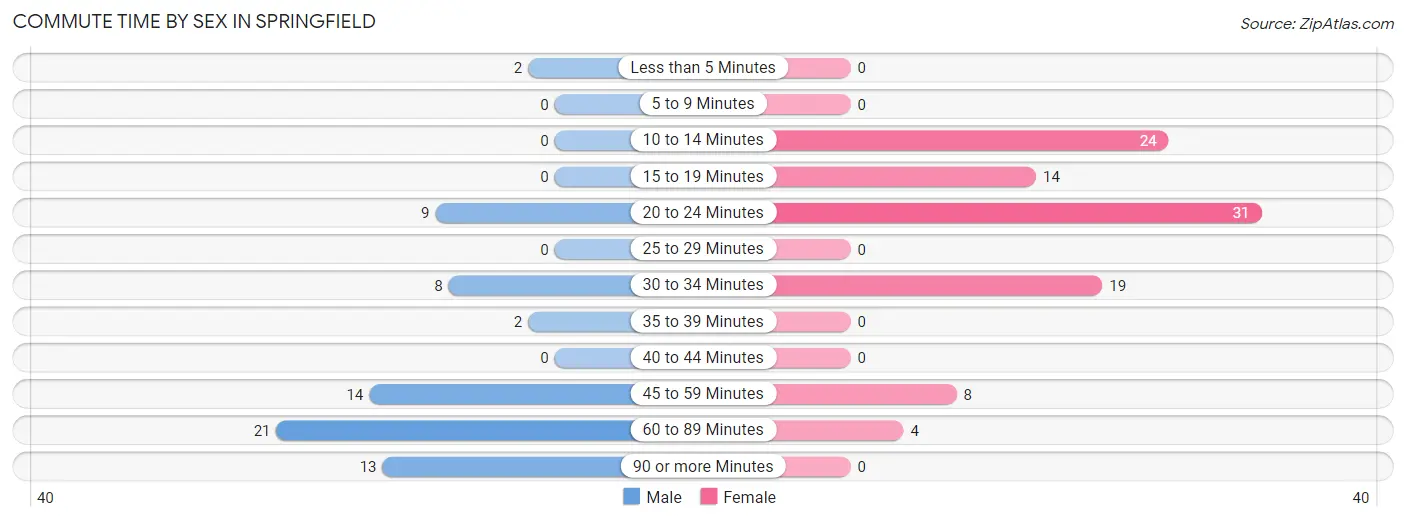
| Commute Time | Male | Female |
| Less than 5 Minutes | 2 (2.9%) | 0 (0.0%) |
| 5 to 9 Minutes | 0 (0.0%) | 0 (0.0%) |
| 10 to 14 Minutes | 0 (0.0%) | 24 (24.0%) |
| 15 to 19 Minutes | 0 (0.0%) | 14 (14.0%) |
| 20 to 24 Minutes | 9 (13.0%) | 31 (31.0%) |
| 25 to 29 Minutes | 0 (0.0%) | 0 (0.0%) |
| 30 to 34 Minutes | 8 (11.6%) | 19 (19.0%) |
| 35 to 39 Minutes | 2 (2.9%) | 0 (0.0%) |
| 40 to 44 Minutes | 0 (0.0%) | 0 (0.0%) |
| 45 to 59 Minutes | 14 (20.3%) | 8 (8.0%) |
| 60 to 89 Minutes | 21 (30.4%) | 4 (4.0%) |
| 90 or more Minutes | 13 (18.8%) | 0 (0.0%) |
Time of Departure to Work by Sex in Springfield
The most frequent times of departure to work in Springfield are 5:30 AM to 5:59 AM (24, 34.8%) for males and 7:00 AM to 7:29 AM (18, 18.0%) for females.
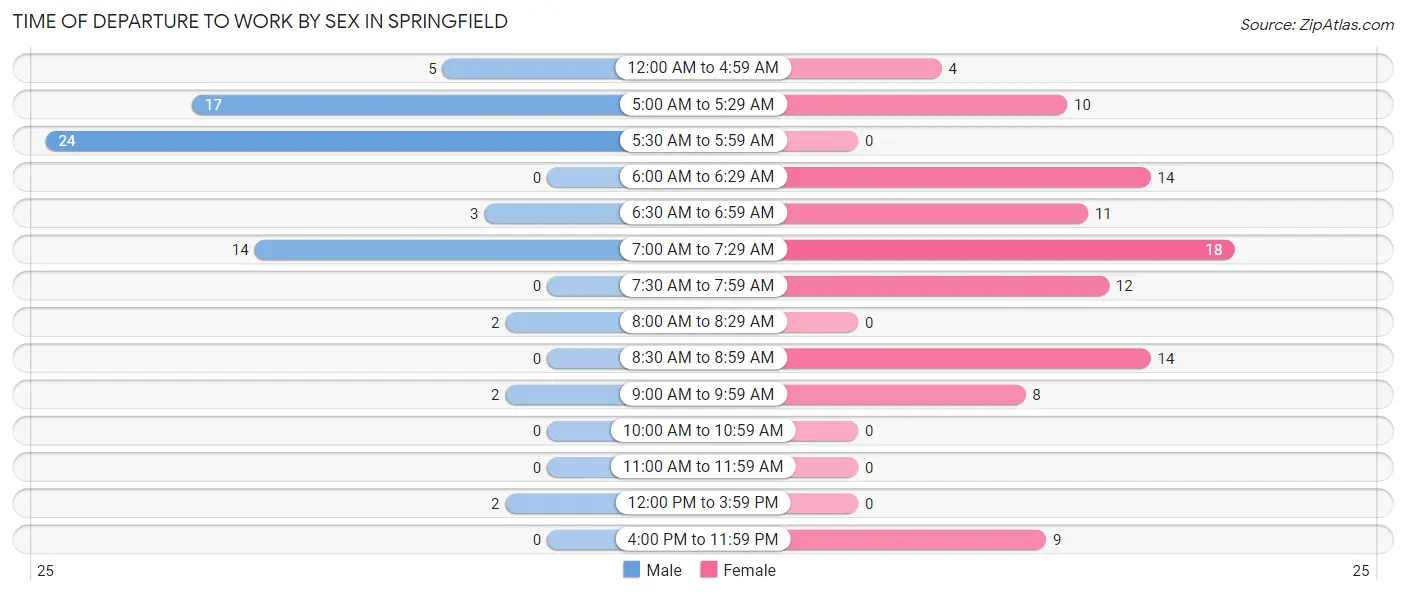
| Time of Departure | Male | Female |
| 12:00 AM to 4:59 AM | 5 (7.2%) | 4 (4.0%) |
| 5:00 AM to 5:29 AM | 17 (24.6%) | 10 (10.0%) |
| 5:30 AM to 5:59 AM | 24 (34.8%) | 0 (0.0%) |
| 6:00 AM to 6:29 AM | 0 (0.0%) | 14 (14.0%) |
| 6:30 AM to 6:59 AM | 3 (4.3%) | 11 (11.0%) |
| 7:00 AM to 7:29 AM | 14 (20.3%) | 18 (18.0%) |
| 7:30 AM to 7:59 AM | 0 (0.0%) | 12 (12.0%) |
| 8:00 AM to 8:29 AM | 2 (2.9%) | 0 (0.0%) |
| 8:30 AM to 8:59 AM | 0 (0.0%) | 14 (14.0%) |
| 9:00 AM to 9:59 AM | 2 (2.9%) | 8 (8.0%) |
| 10:00 AM to 10:59 AM | 0 (0.0%) | 0 (0.0%) |
| 11:00 AM to 11:59 AM | 0 (0.0%) | 0 (0.0%) |
| 12:00 PM to 3:59 PM | 2 (2.9%) | 0 (0.0%) |
| 4:00 PM to 11:59 PM | 0 (0.0%) | 9 (9.0%) |
| Total | 69 (100.0%) | 100 (100.0%) |
Housing Occupancy in Springfield
Occupancy by Ownership in Springfield
Of the total 191 dwellings in Springfield, owner-occupied units account for 151 (79.1%), while renter-occupied units make up 40 (20.9%).
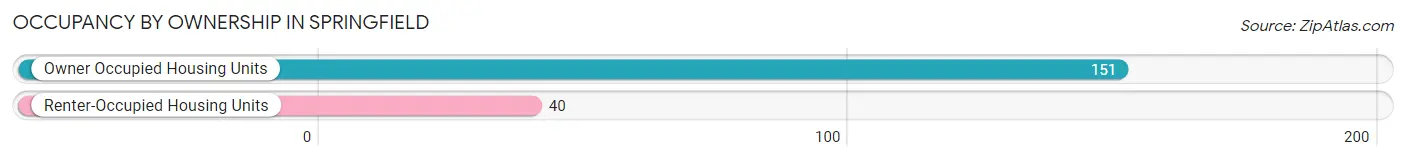
| Occupancy | # Housing Units | % Housing Units |
| Owner Occupied Housing Units | 151 | 79.1% |
| Renter-Occupied Housing Units | 40 | 20.9% |
| Total Occupied Housing Units | 191 | 100.0% |
Occupancy by Household Size in Springfield
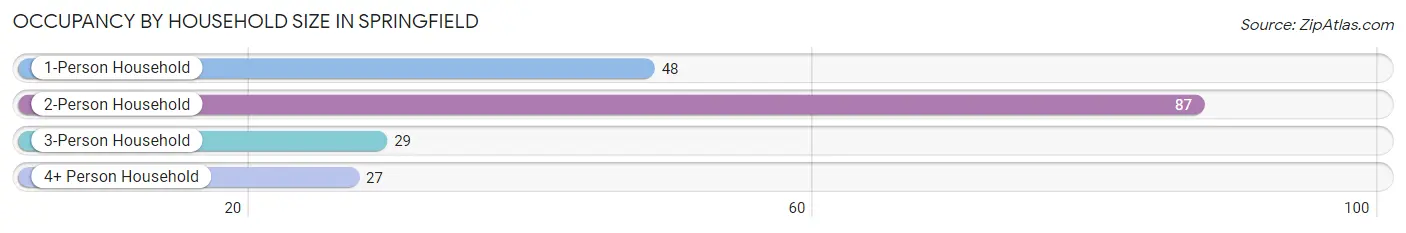
| Household Size | # Housing Units | % Housing Units |
| 1-Person Household | 48 | 25.1% |
| 2-Person Household | 87 | 45.6% |
| 3-Person Household | 29 | 15.2% |
| 4+ Person Household | 27 | 14.1% |
| Total Housing Units | 191 | 100.0% |
Occupancy by Ownership by Household Size in Springfield
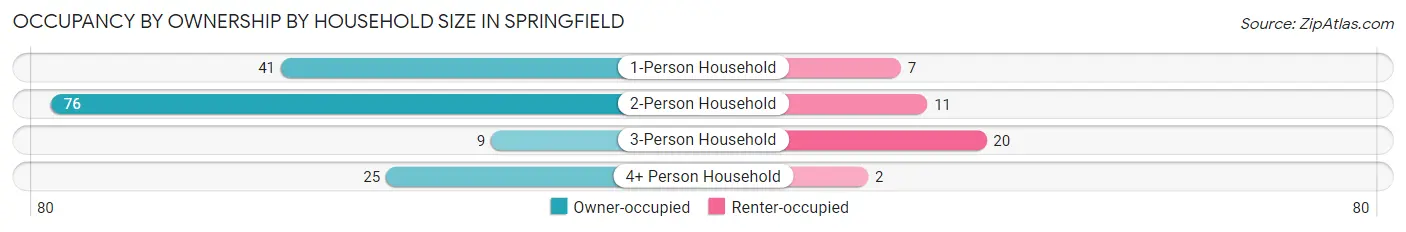
| Household Size | Owner-occupied | Renter-occupied |
| 1-Person Household | 41 (85.4%) | 7 (14.6%) |
| 2-Person Household | 76 (87.4%) | 11 (12.6%) |
| 3-Person Household | 9 (31.0%) | 20 (69.0%) |
| 4+ Person Household | 25 (92.6%) | 2 (7.4%) |
| Total Housing Units | 151 (79.1%) | 40 (20.9%) |
Occupancy by Educational Attainment in Springfield
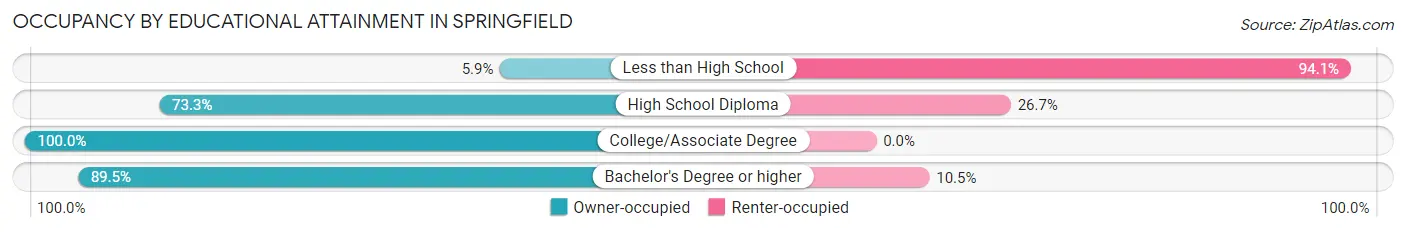
| Household Size | Owner-occupied | Renter-occupied |
| Less than High School | 1 (5.9%) | 16 (94.1%) |
| High School Diploma | 55 (73.3%) | 20 (26.7%) |
| College/Associate Degree | 61 (100.0%) | 0 (0.0%) |
| Bachelor's Degree or higher | 34 (89.5%) | 4 (10.5%) |
Occupancy by Age of Householder in Springfield
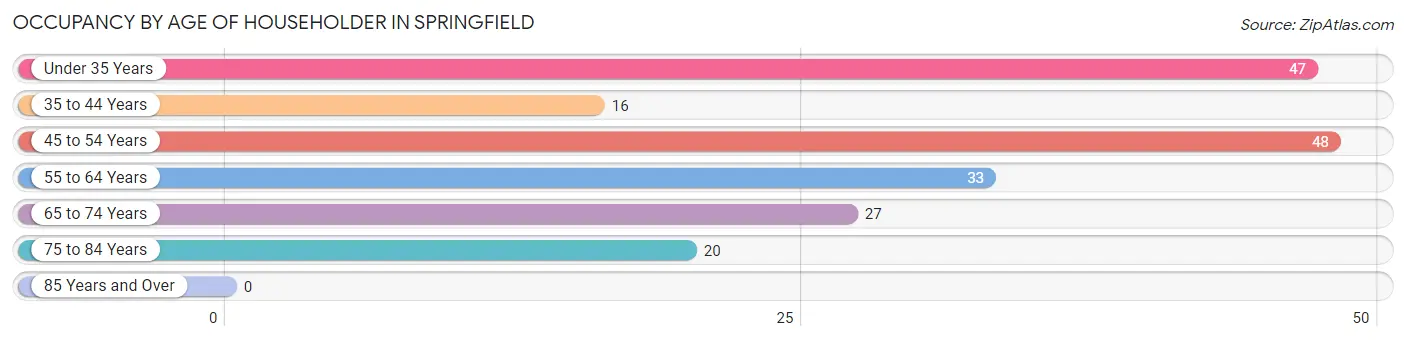
| Age Bracket | # Households | % Households |
| Under 35 Years | 47 | 24.6% |
| 35 to 44 Years | 16 | 8.4% |
| 45 to 54 Years | 48 | 25.1% |
| 55 to 64 Years | 33 | 17.3% |
| 65 to 74 Years | 27 | 14.1% |
| 75 to 84 Years | 20 | 10.5% |
| 85 Years and Over | 0 | 0.0% |
| Total | 191 | 100.0% |
Housing Finances in Springfield
Median Income by Occupancy in Springfield
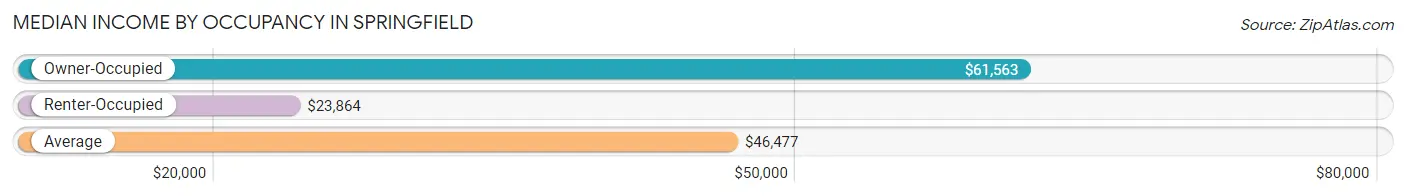
| Occupancy Type | # Households | Median Income |
| Owner-Occupied | 151 (79.1%) | $61,563 |
| Renter-Occupied | 40 (20.9%) | $23,864 |
| Average | 191 (100.0%) | $46,477 |
Occupancy by Householder Income Bracket in Springfield
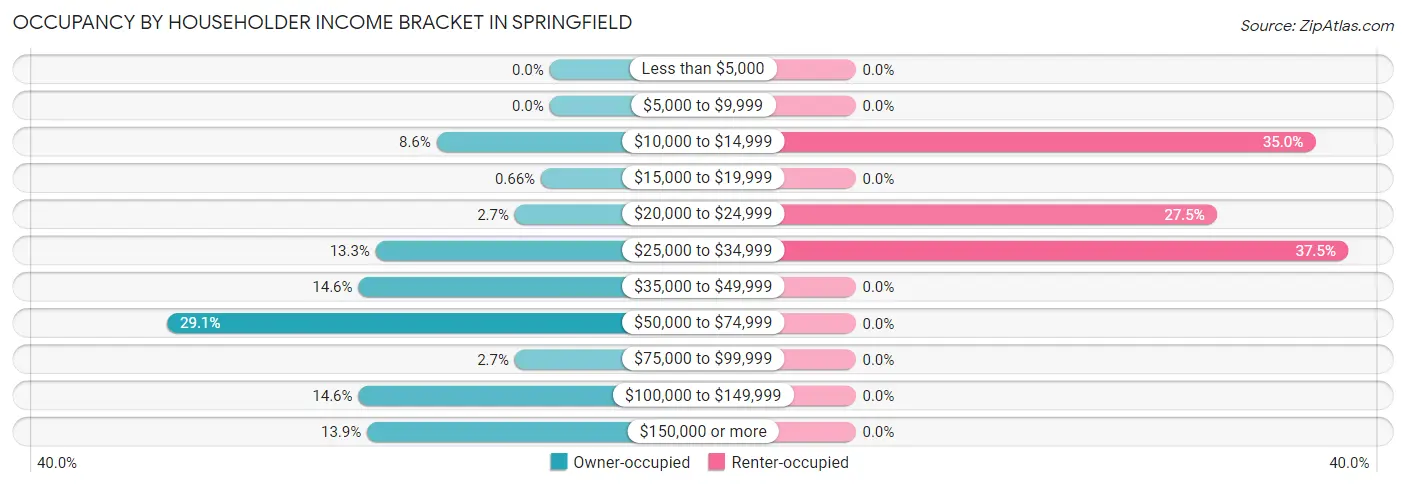
| Income Bracket | Owner-occupied | Renter-occupied |
| Less than $5,000 | 0 (0.0%) | 0 (0.0%) |
| $5,000 to $9,999 | 0 (0.0%) | 0 (0.0%) |
| $10,000 to $14,999 | 13 (8.6%) | 14 (35.0%) |
| $15,000 to $19,999 | 1 (0.7%) | 0 (0.0%) |
| $20,000 to $24,999 | 4 (2.6%) | 11 (27.5%) |
| $25,000 to $34,999 | 20 (13.3%) | 15 (37.5%) |
| $35,000 to $49,999 | 22 (14.6%) | 0 (0.0%) |
| $50,000 to $74,999 | 44 (29.1%) | 0 (0.0%) |
| $75,000 to $99,999 | 4 (2.6%) | 0 (0.0%) |
| $100,000 to $149,999 | 22 (14.6%) | 0 (0.0%) |
| $150,000 or more | 21 (13.9%) | 0 (0.0%) |
| Total | 151 (100.0%) | 40 (100.0%) |
Monthly Housing Cost Tiers in Springfield
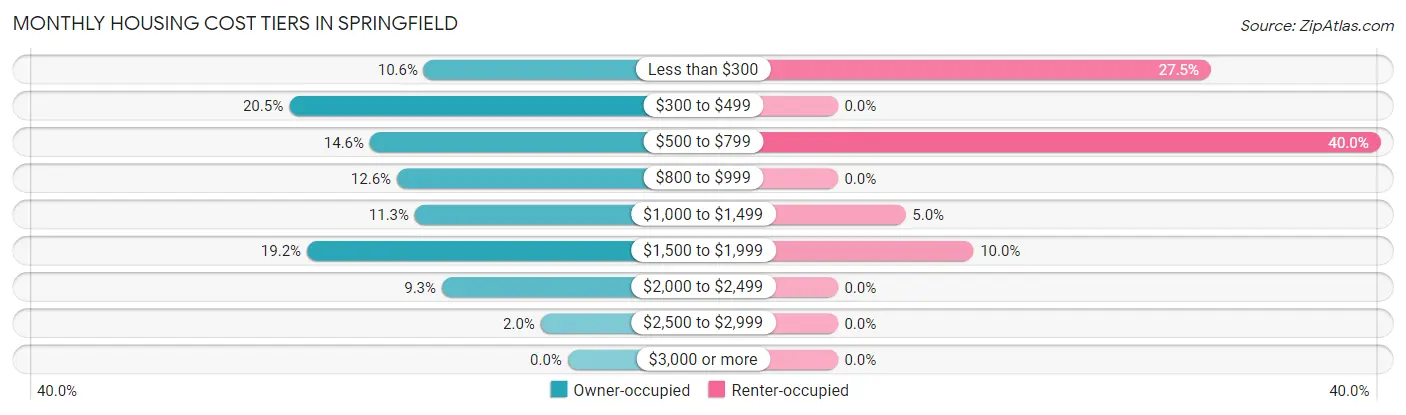
| Monthly Cost | Owner-occupied | Renter-occupied |
| Less than $300 | 16 (10.6%) | 11 (27.5%) |
| $300 to $499 | 31 (20.5%) | 0 (0.0%) |
| $500 to $799 | 22 (14.6%) | 16 (40.0%) |
| $800 to $999 | 19 (12.6%) | 0 (0.0%) |
| $1,000 to $1,499 | 17 (11.3%) | 2 (5.0%) |
| $1,500 to $1,999 | 29 (19.2%) | 4 (10.0%) |
| $2,000 to $2,499 | 14 (9.3%) | 0 (0.0%) |
| $2,500 to $2,999 | 3 (2.0%) | 0 (0.0%) |
| $3,000 or more | 0 (0.0%) | 0 (0.0%) |
| Total | 151 (100.0%) | 40 (100.0%) |
Physical Housing Characteristics in Springfield
Housing Structures in Springfield
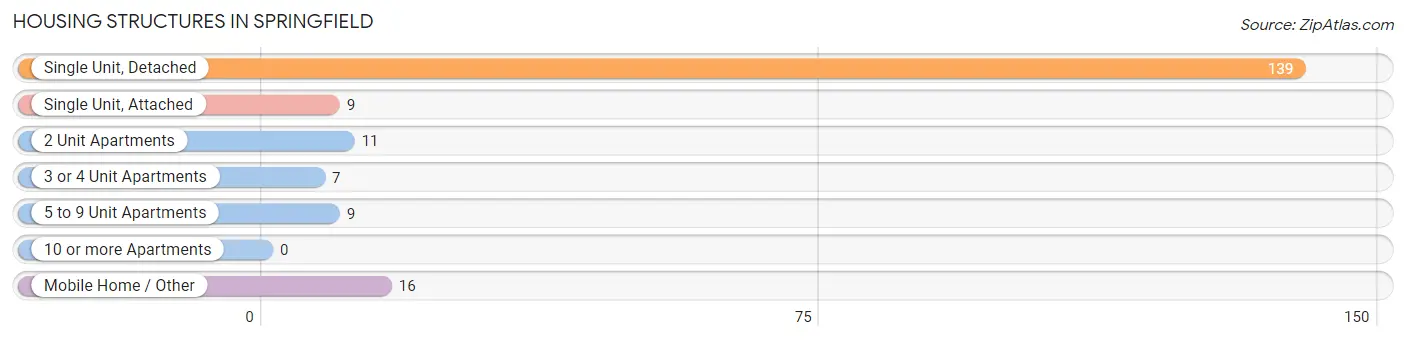
| Structure Type | # Housing Units | % Housing Units |
| Single Unit, Detached | 139 | 72.8% |
| Single Unit, Attached | 9 | 4.7% |
| 2 Unit Apartments | 11 | 5.8% |
| 3 or 4 Unit Apartments | 7 | 3.7% |
| 5 to 9 Unit Apartments | 9 | 4.7% |
| 10 or more Apartments | 0 | 0.0% |
| Mobile Home / Other | 16 | 8.4% |
| Total | 191 | 100.0% |
Housing Structures by Occupancy in Springfield
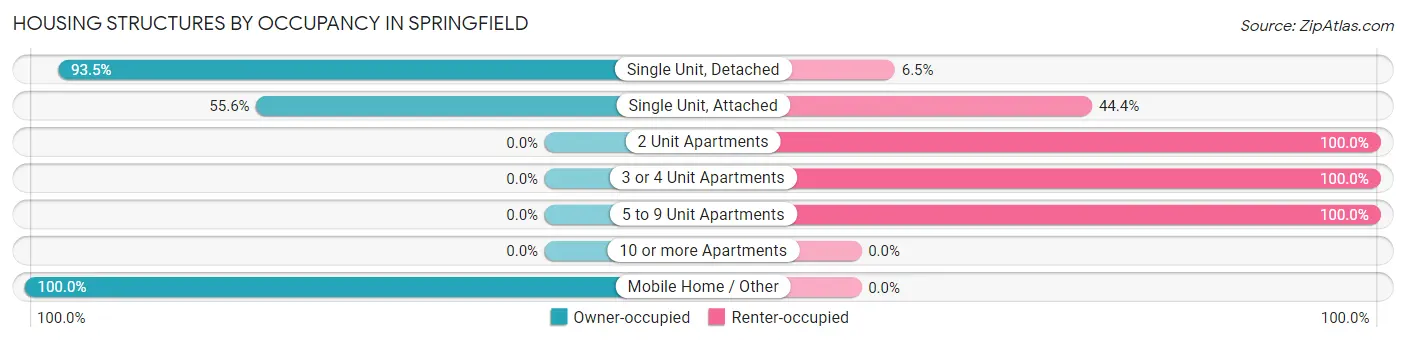
| Structure Type | Owner-occupied | Renter-occupied |
| Single Unit, Detached | 130 (93.5%) | 9 (6.5%) |
| Single Unit, Attached | 5 (55.6%) | 4 (44.4%) |
| 2 Unit Apartments | 0 (0.0%) | 11 (100.0%) |
| 3 or 4 Unit Apartments | 0 (0.0%) | 7 (100.0%) |
| 5 to 9 Unit Apartments | 0 (0.0%) | 9 (100.0%) |
| 10 or more Apartments | 0 (0.0%) | 0 (0.0%) |
| Mobile Home / Other | 16 (100.0%) | 0 (0.0%) |
| Total | 151 (79.1%) | 40 (20.9%) |
Housing Structures by Number of Rooms in Springfield
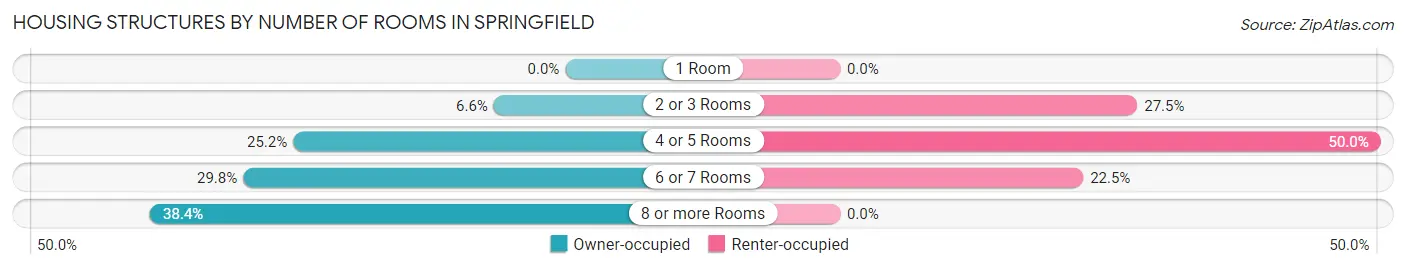
| Number of Rooms | Owner-occupied | Renter-occupied |
| 1 Room | 0 (0.0%) | 0 (0.0%) |
| 2 or 3 Rooms | 10 (6.6%) | 11 (27.5%) |
| 4 or 5 Rooms | 38 (25.2%) | 20 (50.0%) |
| 6 or 7 Rooms | 45 (29.8%) | 9 (22.5%) |
| 8 or more Rooms | 58 (38.4%) | 0 (0.0%) |
| Total | 151 (100.0%) | 40 (100.0%) |
Housing Structure by Heating Type in Springfield
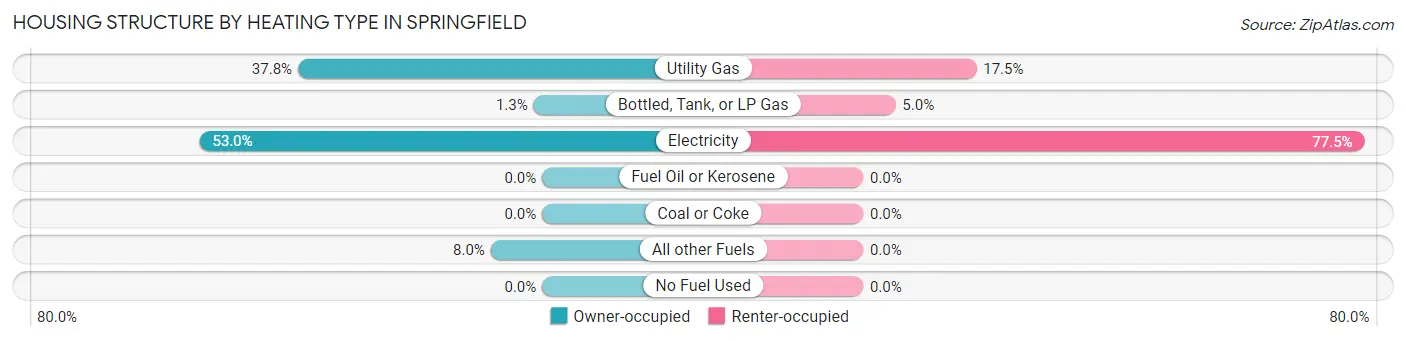
| Heating Type | Owner-occupied | Renter-occupied |
| Utility Gas | 57 (37.8%) | 7 (17.5%) |
| Bottled, Tank, or LP Gas | 2 (1.3%) | 2 (5.0%) |
| Electricity | 80 (53.0%) | 31 (77.5%) |
| Fuel Oil or Kerosene | 0 (0.0%) | 0 (0.0%) |
| Coal or Coke | 0 (0.0%) | 0 (0.0%) |
| All other Fuels | 12 (8.0%) | 0 (0.0%) |
| No Fuel Used | 0 (0.0%) | 0 (0.0%) |
| Total | 151 (100.0%) | 40 (100.0%) |
Household Vehicle Usage in Springfield
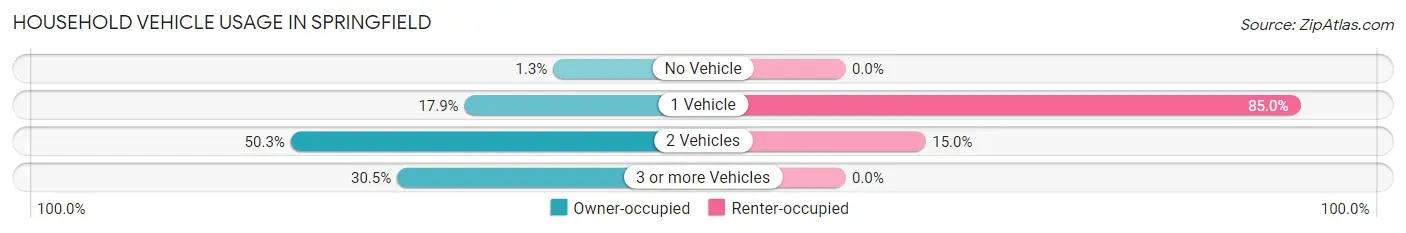
| Vehicles per Household | Owner-occupied | Renter-occupied |
| No Vehicle | 2 (1.3%) | 0 (0.0%) |
| 1 Vehicle | 27 (17.9%) | 34 (85.0%) |
| 2 Vehicles | 76 (50.3%) | 6 (15.0%) |
| 3 or more Vehicles | 46 (30.5%) | 0 (0.0%) |
| Total | 151 (100.0%) | 40 (100.0%) |
Real Estate & Mortgages in Springfield
Real Estate and Mortgage Overview in Springfield
| Characteristic | Without Mortgage | With Mortgage |
| Housing Units | 75 | 76 |
| Median Property Value | $211,800 | $172,700 |
| Median Household Income | $45,341 | $13 |
| Monthly Housing Costs | $441 | $0 |
| Real Estate Taxes | - | - |
Property Value by Mortgage Status in Springfield
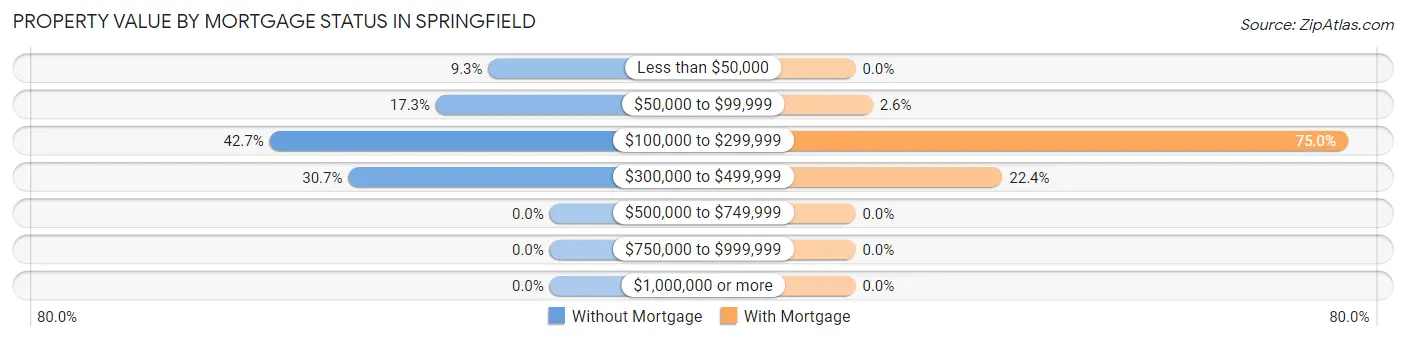
| Property Value | Without Mortgage | With Mortgage |
| Less than $50,000 | 7 (9.3%) | 0 (0.0%) |
| $50,000 to $99,999 | 13 (17.3%) | 2 (2.6%) |
| $100,000 to $299,999 | 32 (42.7%) | 57 (75.0%) |
| $300,000 to $499,999 | 23 (30.7%) | 17 (22.4%) |
| $500,000 to $749,999 | 0 (0.0%) | 0 (0.0%) |
| $750,000 to $999,999 | 0 (0.0%) | 0 (0.0%) |
| $1,000,000 or more | 0 (0.0%) | 0 (0.0%) |
| Total | 75 (100.0%) | 76 (100.0%) |
Household Income by Mortgage Status in Springfield
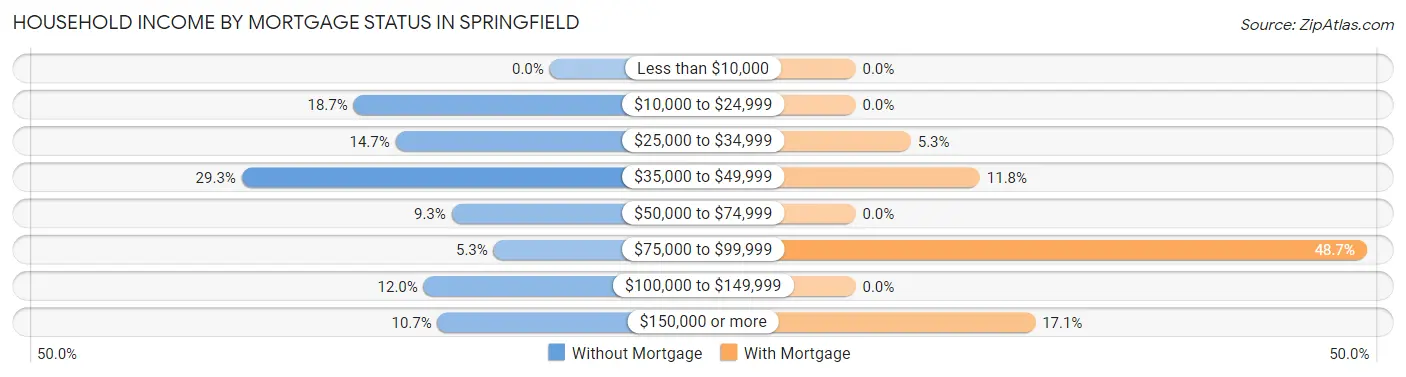
| Household Income | Without Mortgage | With Mortgage |
| Less than $10,000 | 0 (0.0%) | 0 (0.0%) |
| $10,000 to $24,999 | 14 (18.7%) | 0 (0.0%) |
| $25,000 to $34,999 | 11 (14.7%) | 4 (5.3%) |
| $35,000 to $49,999 | 22 (29.3%) | 9 (11.8%) |
| $50,000 to $74,999 | 7 (9.3%) | 0 (0.0%) |
| $75,000 to $99,999 | 4 (5.3%) | 37 (48.7%) |
| $100,000 to $149,999 | 9 (12.0%) | 0 (0.0%) |
| $150,000 or more | 8 (10.7%) | 13 (17.1%) |
| Total | 75 (100.0%) | 76 (100.0%) |
Property Value to Household Income Ratio in Springfield
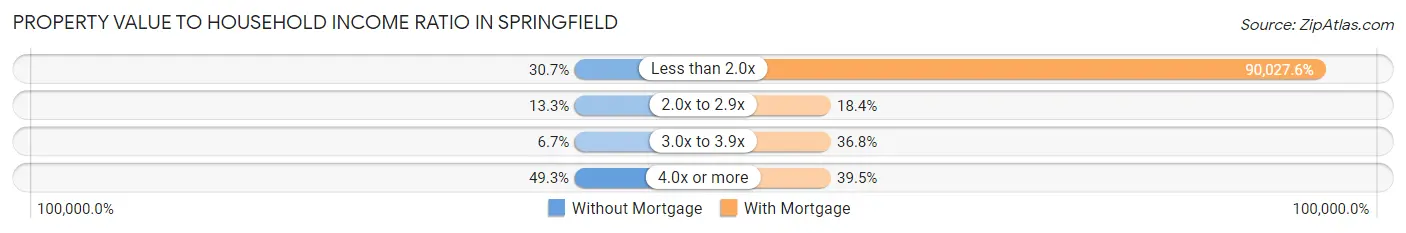
| Value-to-Income Ratio | Without Mortgage | With Mortgage |
| Less than 2.0x | 23 (30.7%) | 68,421 (90,027.6%) |
| 2.0x to 2.9x | 10 (13.3%) | 14 (18.4%) |
| 3.0x to 3.9x | 5 (6.7%) | 28 (36.8%) |
| 4.0x or more | 37 (49.3%) | 30 (39.5%) |
| Total | 75 (100.0%) | 76 (100.0%) |
Real Estate Taxes by Mortgage Status in Springfield
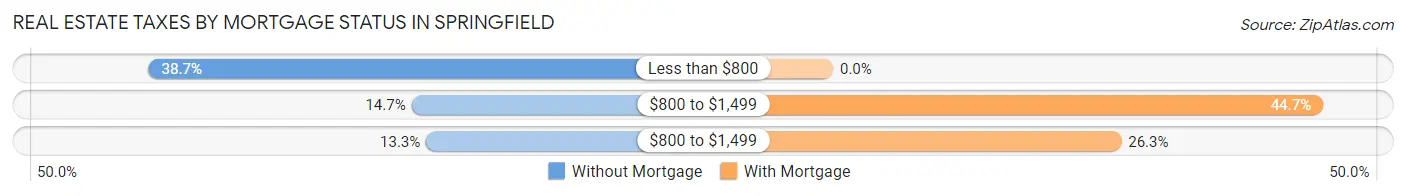
| Property Taxes | Without Mortgage | With Mortgage |
| Less than $800 | 29 (38.7%) | 0 (0.0%) |
| $800 to $1,499 | 11 (14.7%) | 34 (44.7%) |
| $800 to $1,499 | 10 (13.3%) | 20 (26.3%) |
| Total | 75 (100.0%) | 76 (100.0%) |
Health & Disability in Springfield
Health Insurance Coverage by Age in Springfield
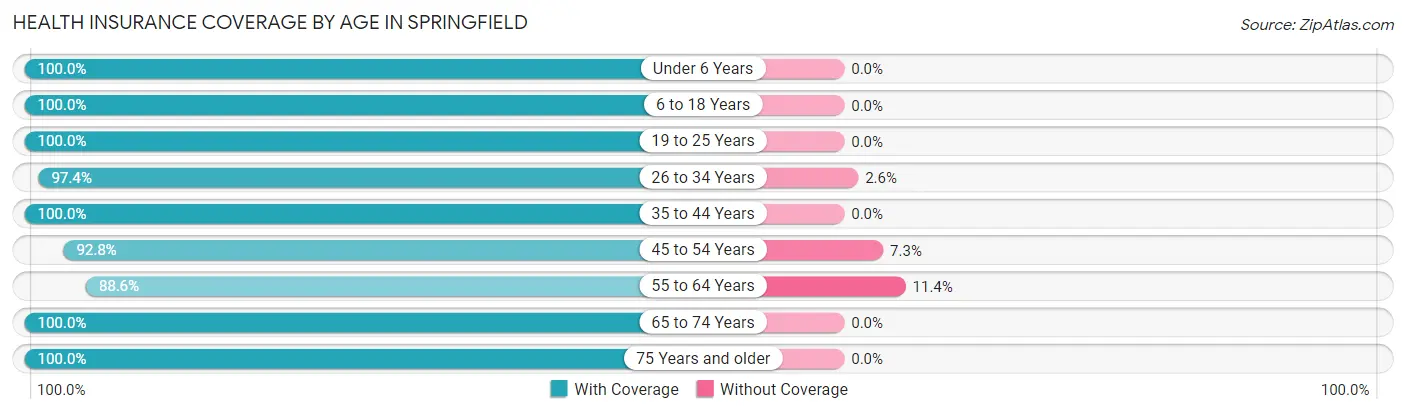
| Age Bracket | With Coverage | Without Coverage |
| Under 6 Years | 46 (100.0%) | 0 (0.0%) |
| 6 to 18 Years | 65 (100.0%) | 0 (0.0%) |
| 19 to 25 Years | 29 (100.0%) | 0 (0.0%) |
| 26 to 34 Years | 75 (97.4%) | 2 (2.6%) |
| 35 to 44 Years | 39 (100.0%) | 0 (0.0%) |
| 45 to 54 Years | 64 (92.7%) | 5 (7.2%) |
| 55 to 64 Years | 62 (88.6%) | 8 (11.4%) |
| 65 to 74 Years | 35 (100.0%) | 0 (0.0%) |
| 75 Years and older | 34 (100.0%) | 0 (0.0%) |
| Total | 449 (96.8%) | 15 (3.2%) |
Health Insurance Coverage by Citizenship Status in Springfield
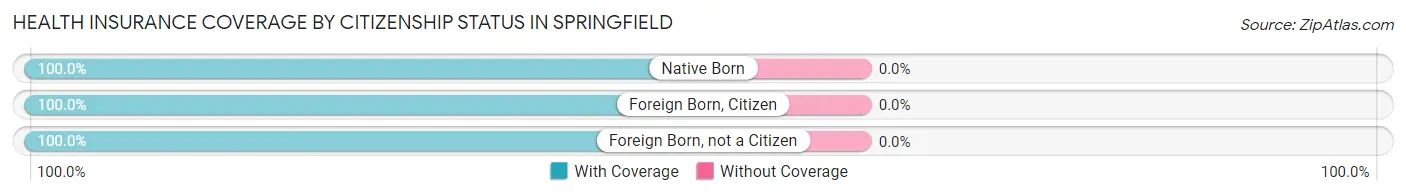
| Citizenship Status | With Coverage | Without Coverage |
| Native Born | 46 (100.0%) | 0 (0.0%) |
| Foreign Born, Citizen | 65 (100.0%) | 0 (0.0%) |
| Foreign Born, not a Citizen | 29 (100.0%) | 0 (0.0%) |
Health Insurance Coverage by Household Income in Springfield
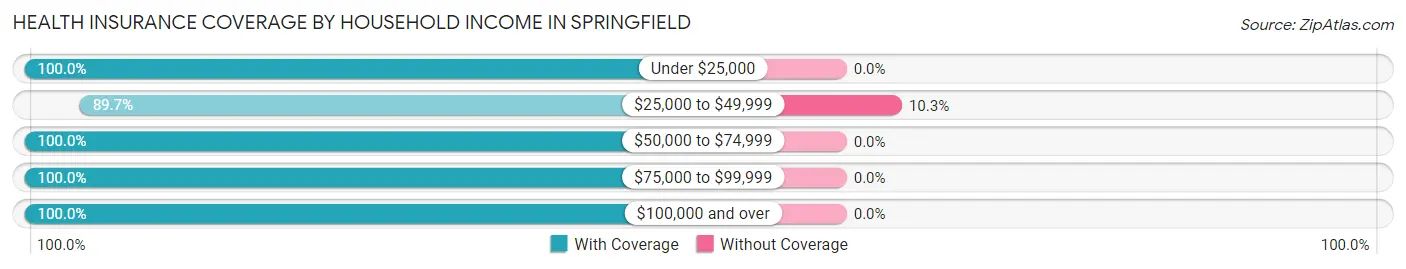
| Household Income | With Coverage | Without Coverage |
| Under $25,000 | 74 (100.0%) | 0 (0.0%) |
| $25,000 to $49,999 | 130 (89.7%) | 15 (10.3%) |
| $50,000 to $74,999 | 114 (100.0%) | 0 (0.0%) |
| $75,000 to $99,999 | 7 (100.0%) | 0 (0.0%) |
| $100,000 and over | 124 (100.0%) | 0 (0.0%) |
Public vs Private Health Insurance Coverage by Age in Springfield
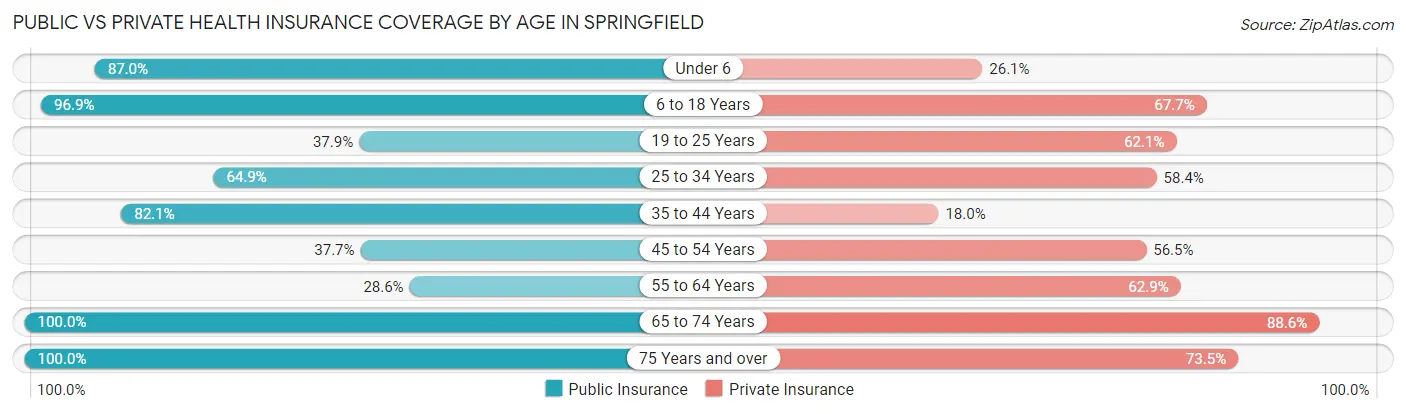
| Age Bracket | Public Insurance | Private Insurance |
| Under 6 | 40 (87.0%) | 12 (26.1%) |
| 6 to 18 Years | 63 (96.9%) | 44 (67.7%) |
| 19 to 25 Years | 11 (37.9%) | 18 (62.1%) |
| 25 to 34 Years | 50 (64.9%) | 45 (58.4%) |
| 35 to 44 Years | 32 (82.1%) | 7 (17.9%) |
| 45 to 54 Years | 26 (37.7%) | 39 (56.5%) |
| 55 to 64 Years | 20 (28.6%) | 44 (62.9%) |
| 65 to 74 Years | 35 (100.0%) | 31 (88.6%) |
| 75 Years and over | 34 (100.0%) | 25 (73.5%) |
| Total | 311 (67.0%) | 265 (57.1%) |
Disability Status by Sex by Age in Springfield
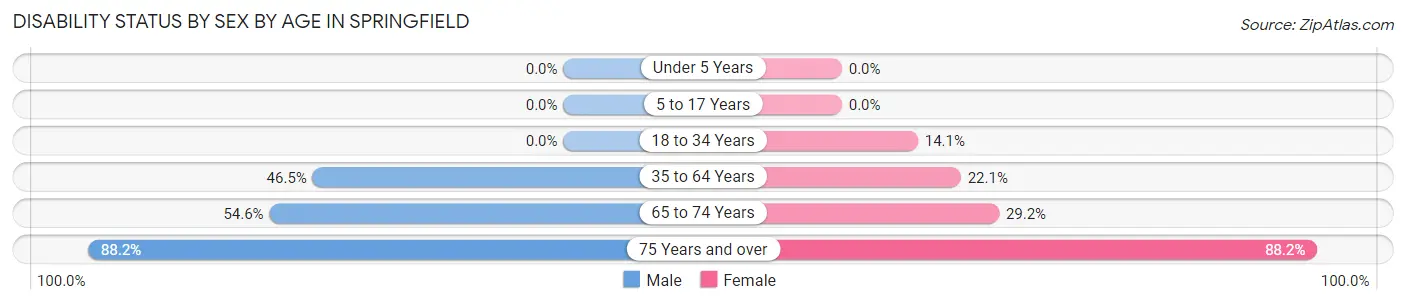
| Age Bracket | Male | Female |
| Under 5 Years | 0 (0.0%) | 0 (0.0%) |
| 5 to 17 Years | 0 (0.0%) | 0 (0.0%) |
| 18 to 34 Years | 0 (0.0%) | 11 (14.1%) |
| 35 to 64 Years | 47 (46.5%) | 17 (22.1%) |
| 65 to 74 Years | 6 (54.5%) | 7 (29.2%) |
| 75 Years and over | 15 (88.2%) | 15 (88.2%) |
Disability Class by Sex by Age in Springfield
Disability Class: Hearing Difficulty
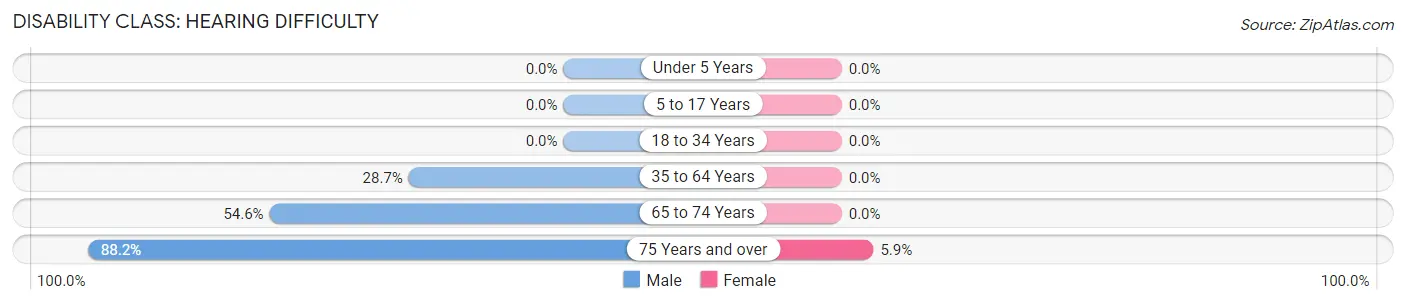
| Age Bracket | Male | Female |
| Under 5 Years | 0 (0.0%) | 0 (0.0%) |
| 5 to 17 Years | 0 (0.0%) | 0 (0.0%) |
| 18 to 34 Years | 0 (0.0%) | 0 (0.0%) |
| 35 to 64 Years | 29 (28.7%) | 0 (0.0%) |
| 65 to 74 Years | 6 (54.5%) | 0 (0.0%) |
| 75 Years and over | 15 (88.2%) | 1 (5.9%) |
Disability Class: Vision Difficulty
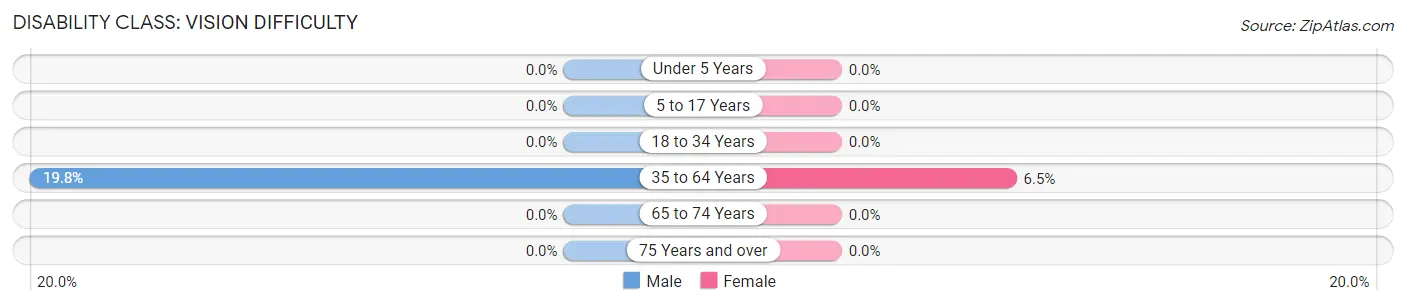
| Age Bracket | Male | Female |
| Under 5 Years | 0 (0.0%) | 0 (0.0%) |
| 5 to 17 Years | 0 (0.0%) | 0 (0.0%) |
| 18 to 34 Years | 0 (0.0%) | 0 (0.0%) |
| 35 to 64 Years | 20 (19.8%) | 5 (6.5%) |
| 65 to 74 Years | 0 (0.0%) | 0 (0.0%) |
| 75 Years and over | 0 (0.0%) | 0 (0.0%) |
Disability Class: Cognitive Difficulty
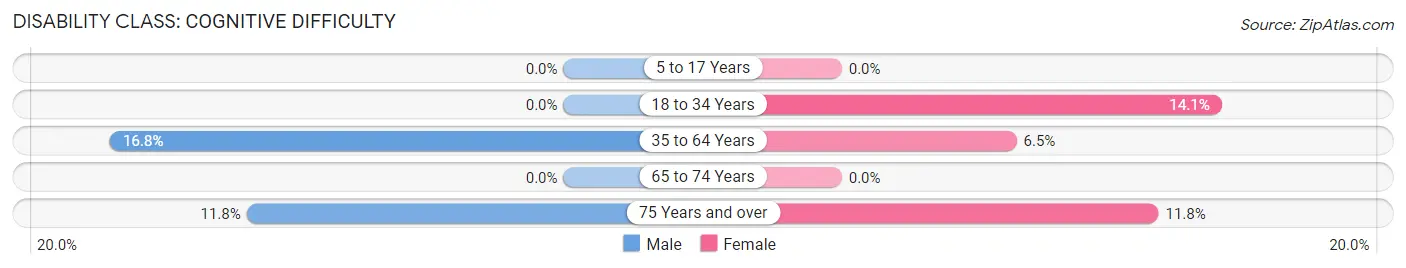
| Age Bracket | Male | Female |
| 5 to 17 Years | 0 (0.0%) | 0 (0.0%) |
| 18 to 34 Years | 0 (0.0%) | 11 (14.1%) |
| 35 to 64 Years | 17 (16.8%) | 5 (6.5%) |
| 65 to 74 Years | 0 (0.0%) | 0 (0.0%) |
| 75 Years and over | 2 (11.8%) | 2 (11.8%) |
Disability Class: Ambulatory Difficulty
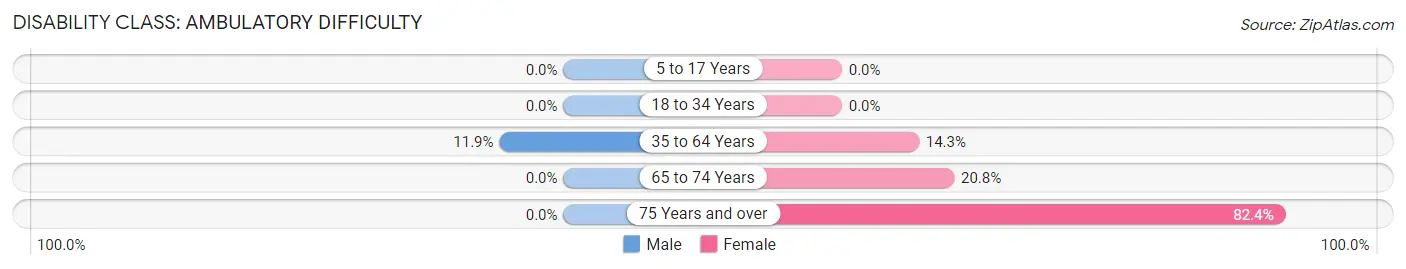
| Age Bracket | Male | Female |
| 5 to 17 Years | 0 (0.0%) | 0 (0.0%) |
| 18 to 34 Years | 0 (0.0%) | 0 (0.0%) |
| 35 to 64 Years | 12 (11.9%) | 11 (14.3%) |
| 65 to 74 Years | 0 (0.0%) | 5 (20.8%) |
| 75 Years and over | 0 (0.0%) | 14 (82.4%) |
Disability Class: Self-Care Difficulty
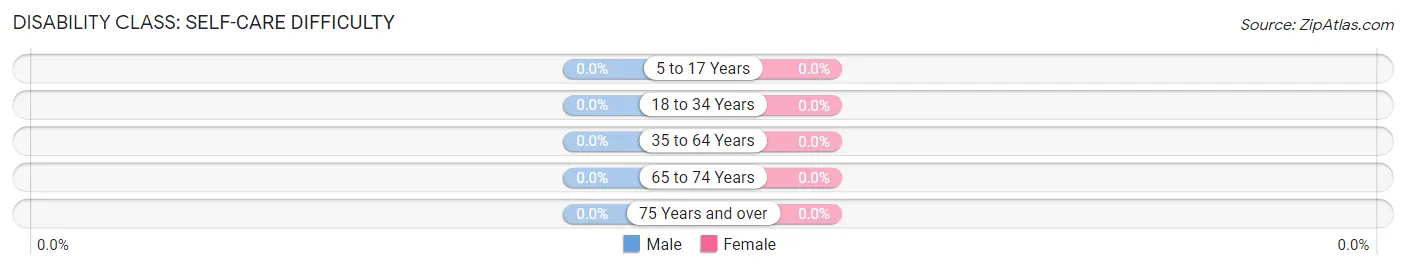
| Age Bracket | Male | Female |
| 5 to 17 Years | 0 (0.0%) | 0 (0.0%) |
| 18 to 34 Years | 0 (0.0%) | 0 (0.0%) |
| 35 to 64 Years | 0 (0.0%) | 0 (0.0%) |
| 65 to 74 Years | 0 (0.0%) | 0 (0.0%) |
| 75 Years and over | 0 (0.0%) | 0 (0.0%) |
Technology Access in Springfield
Computing Device Access in Springfield
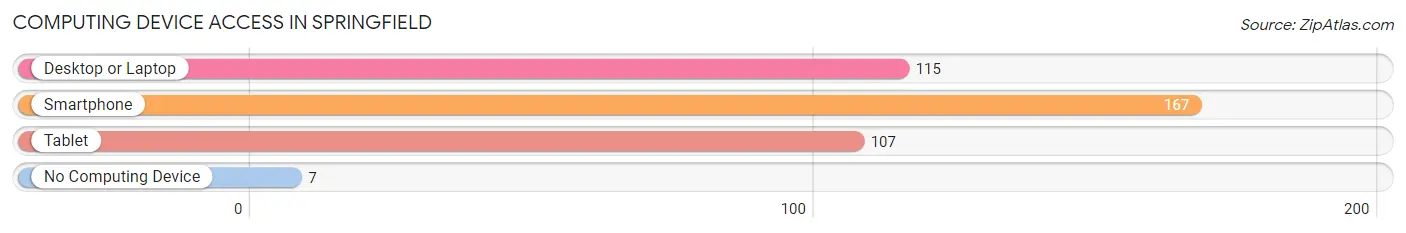
| Device Type | # Households | % Households |
| Desktop or Laptop | 115 | 60.2% |
| Smartphone | 167 | 87.4% |
| Tablet | 107 | 56.0% |
| No Computing Device | 7 | 3.7% |
| Total | 191 | 100.0% |
Internet Access in Springfield
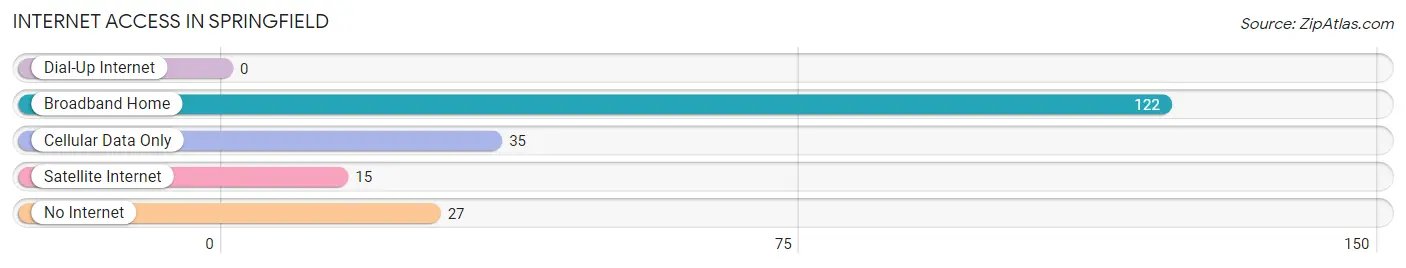
| Internet Type | # Households | % Households |
| Dial-Up Internet | 0 | 0.0% |
| Broadband Home | 122 | 63.9% |
| Cellular Data Only | 35 | 18.3% |
| Satellite Internet | 15 | 7.9% |
| No Internet | 27 | 14.1% |
| Total | 191 | 100.0% |
Springfield Summary
Springfield is a small town located in Livingston Parish, Louisiana. It is situated on the banks of the Amite River, about 25 miles northeast of Baton Rouge. The town has a population of approximately 1,500 people and is part of the Greater Baton Rouge Metropolitan Statistical Area.
History
The area that is now Springfield was first settled in the early 1800s by French-Canadian immigrants. The town was originally known as “La Petite Riviere”, or “Little River”, and was a small farming community. In 1845, the town was renamed Springfield after the nearby Springfield Plantation. The plantation was owned by the prominent local family of the same name.
In the late 1800s, the town began to grow and develop. The Springfield Railroad was built in 1887, connecting the town to nearby Baton Rouge. This allowed for the transportation of goods and services, and helped to spur economic growth.
In the early 1900s, the town experienced a period of rapid growth. The population increased from just over 500 in 1900 to over 1,000 by 1910. This growth was largely due to the development of the local timber industry. The town also became a popular destination for tourists, who came to enjoy the area’s natural beauty.
Geography
Springfield is located in southeastern Louisiana, in Livingston Parish. It is situated on the banks of the Amite River, about 25 miles northeast of Baton Rouge. The town is surrounded by a mix of rural farmland and wooded areas.
The climate in Springfield is humid subtropical, with hot, humid summers and mild winters. The average annual temperature is around 70 degrees Fahrenheit. The area receives an average of 54 inches of precipitation per year.
Economy
The economy of Springfield is largely based on agriculture and timber. The town is home to several large timber companies, which employ many of the local residents. The town also has a thriving tourism industry, with many visitors coming to enjoy the area’s natural beauty.
In addition, Springfield is home to several small businesses, including restaurants, retail stores, and service providers. The town also has a small manufacturing sector, with several small factories producing a variety of goods.
Demographics
As of the 2010 census, the population of Springfield was 1,521. The racial makeup of the town was 79.3% White, 17.2% African American, 0.7% Native American, 0.3% Asian, 0.1% Pacific Islander, and 2.4% from other races. The median household income was $37,917, and the median family income was $45,938.
The town is served by the Livingston Parish Public Schools system. The town is also home to several churches, including the First Baptist Church of Springfield and the Springfield United Methodist Church.
Conclusion
Springfield is a small town located in Livingston Parish, Louisiana. It is situated on the banks of the Amite River, about 25 miles northeast of Baton Rouge. The town has a population of approximately 1,500 people and is part of the Greater Baton Rouge Metropolitan Statistical Area. The economy of Springfield is largely based on agriculture and timber, and the town also has a thriving tourism industry. The town is served by the Livingston Parish Public Schools system, and is home to several churches.
Common Questions
What is Per Capita Income in Springfield?
Per Capita income in Springfield is $30,103.
What is the Median Family Income in Springfield?
Median Family Income in Springfield is $58,750.
What is the Median Household income in Springfield?
Median Household Income in Springfield is $46,477.
What is Income or Wage Gap in Springfield?
Income or Wage Gap in Springfield is 46.9%.
Women in Springfield earn 53.1 cents for every dollar earned by a man.
What is Inequality or Gini Index in Springfield?
Inequality or Gini Index in Springfield is 0.46.
What is the Total Population of Springfield?
Total Population of Springfield is 464.
What is the Total Male Population of Springfield?
Total Male Population of Springfield is 225.
What is the Total Female Population of Springfield?
Total Female Population of Springfield is 239.
What is the Ratio of Males per 100 Females in Springfield?
There are 94.14 Males per 100 Females in Springfield.
What is the Ratio of Females per 100 Males in Springfield?
There are 106.22 Females per 100 Males in Springfield.
What is the Median Population Age in Springfield?
Median Population Age in Springfield is 37.8 Years.
What is the Average Family Size in Springfield
Average Family Size in Springfield is 2.9 People.
What is the Average Household Size in Springfield
Average Household Size in Springfield is 2.4 People.
How Large is the Labor Force in Springfield?
There are 193 People in the Labor Forcein in Springfield.
What is the Percentage of People in the Labor Force in Springfield?
54.4% of People are in the Labor Force in Springfield.
What is the Unemployment Rate in Springfield?
Unemployment Rate in Springfield is 10.9%.