Elmwood, LA Map & Demographics
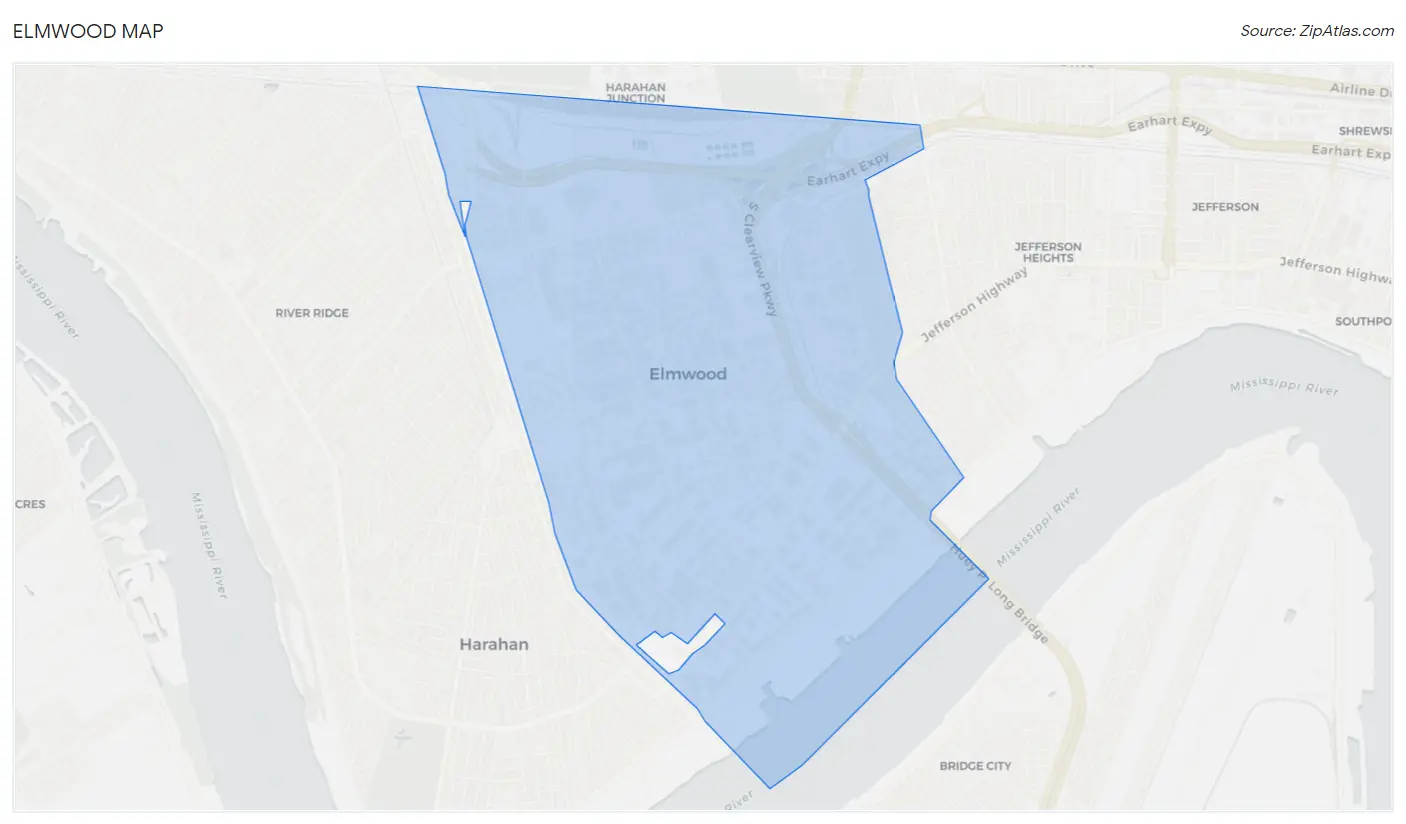
Elmwood Map
Elmwood Overview
$46,466
PER CAPITA INCOME
$88,836
AVG FAMILY INCOME
$80,822
AVG HOUSEHOLD INCOME
14.1%
WAGE / INCOME GAP [ % ]
85.9¢/ $1
WAGE / INCOME GAP [ $ ]
0.36
INEQUALITY / GINI INDEX
6,081
TOTAL POPULATION
2,832
MALE POPULATION
3,249
FEMALE POPULATION
87.17
MALES / 100 FEMALES
114.72
FEMALES / 100 MALES
32.1
MEDIAN AGE
2.8
AVG FAMILY SIZE
1.8
AVG HOUSEHOLD SIZE
4,065
LABOR FORCE [ PEOPLE ]
79.0%
PERCENT IN LABOR FORCE
6.5%
UNEMPLOYMENT RATE
Income in Elmwood
Income Overview in Elmwood
Per Capita Income in Elmwood is $46,466, while median incomes of families and households are $88,836 and $80,822 respectively.
| Characteristic | Number | Measure |
| Per Capita Income | 6,081 | $46,466 |
| Median Family Income | 1,174 | $88,836 |
| Mean Family Income | 1,174 | $93,561 |
| Median Household Income | 3,462 | $80,822 |
| Mean Household Income | 3,462 | $82,707 |
| Income Deficit | 1,174 | $0 |
| Wage / Income Gap (%) | 6,081 | 14.10% |
| Wage / Income Gap ($) | 6,081 | 85.90¢ per $1 |
| Gini / Inequality Index | 6,081 | 0.36 |
Earnings by Sex in Elmwood
Average Earnings in Elmwood are $43,118, $48,479 for men and $41,645 for women, a difference of 14.1%.
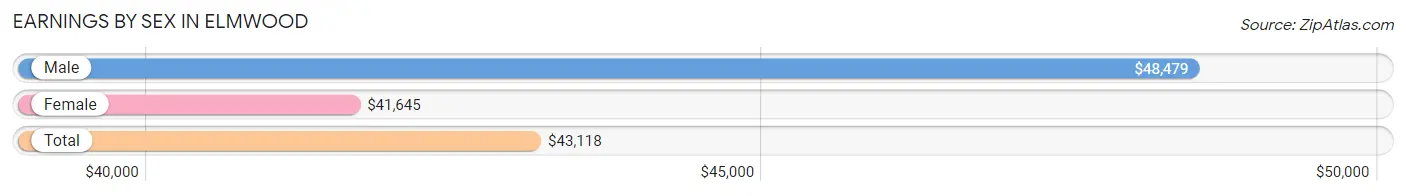
| Sex | Number | Average Earnings |
| Male | 2,067 (52.0%) | $48,479 |
| Female | 1,906 (48.0%) | $41,645 |
| Total | 3,973 (100.0%) | $43,118 |
Earnings by Sex by Income Bracket in Elmwood
The most common earnings brackets in Elmwood are $75,000 to $99,999 for men (339 | 16.4%) and $75,000 to $99,999 for women (222 | 11.7%).
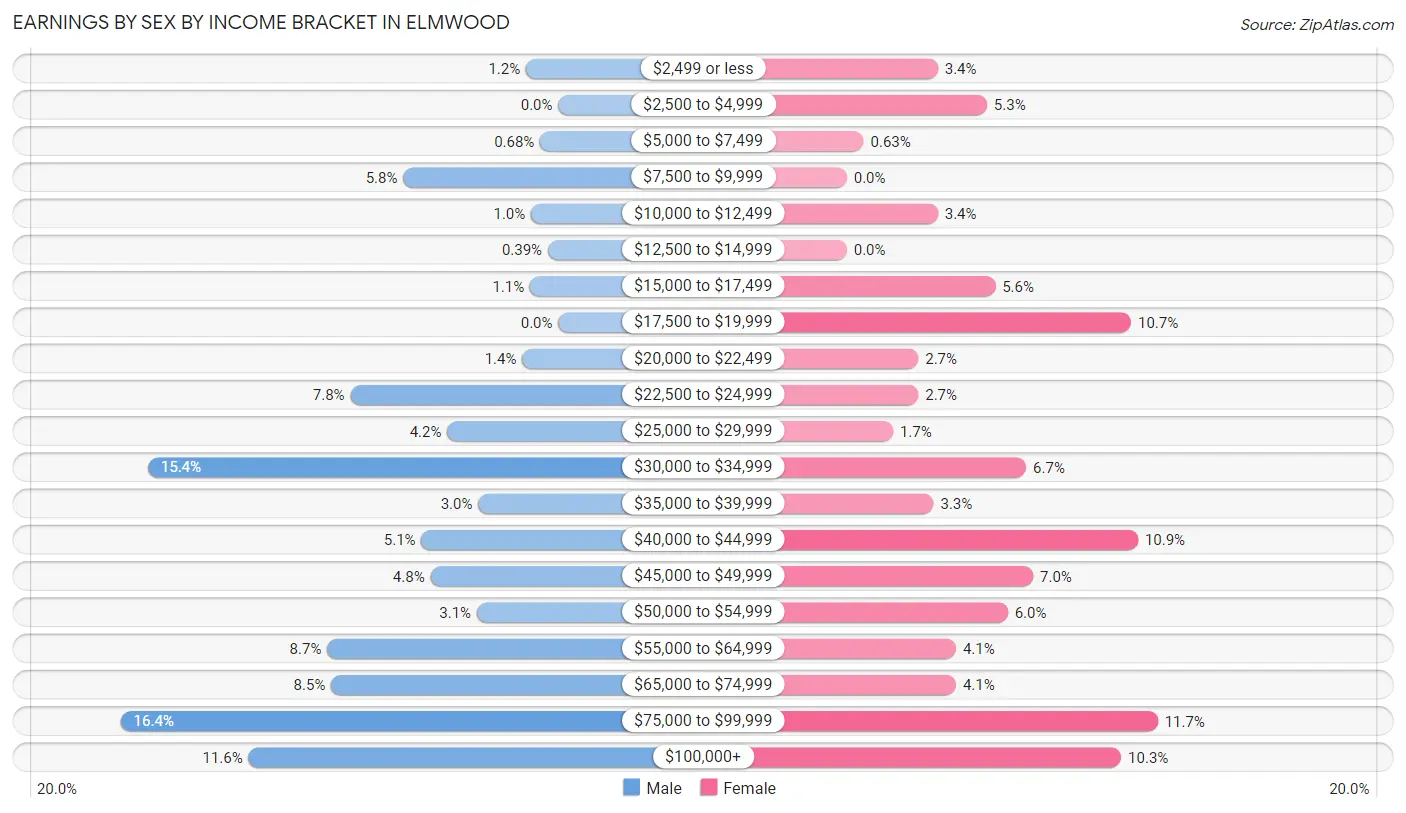
| Income | Male | Female |
| $2,499 or less | 25 (1.2%) | 65 (3.4%) |
| $2,500 to $4,999 | 0 (0.0%) | 100 (5.2%) |
| $5,000 to $7,499 | 14 (0.7%) | 12 (0.6%) |
| $7,500 to $9,999 | 120 (5.8%) | 0 (0.0%) |
| $10,000 to $12,499 | 21 (1.0%) | 65 (3.4%) |
| $12,500 to $14,999 | 8 (0.4%) | 0 (0.0%) |
| $15,000 to $17,499 | 22 (1.1%) | 106 (5.6%) |
| $17,500 to $19,999 | 0 (0.0%) | 203 (10.6%) |
| $20,000 to $22,499 | 28 (1.3%) | 51 (2.7%) |
| $22,500 to $24,999 | 161 (7.8%) | 51 (2.7%) |
| $25,000 to $29,999 | 86 (4.2%) | 33 (1.7%) |
| $30,000 to $34,999 | 318 (15.4%) | 128 (6.7%) |
| $35,000 to $39,999 | 62 (3.0%) | 62 (3.3%) |
| $40,000 to $44,999 | 106 (5.1%) | 208 (10.9%) |
| $45,000 to $49,999 | 99 (4.8%) | 133 (7.0%) |
| $50,000 to $54,999 | 63 (3.0%) | 115 (6.0%) |
| $55,000 to $64,999 | 179 (8.7%) | 78 (4.1%) |
| $65,000 to $74,999 | 176 (8.5%) | 78 (4.1%) |
| $75,000 to $99,999 | 339 (16.4%) | 222 (11.7%) |
| $100,000+ | 240 (11.6%) | 196 (10.3%) |
| Total | 2,067 (100.0%) | 1,906 (100.0%) |
Earnings by Sex by Educational Attainment in Elmwood
Average earnings in Elmwood are $49,083 for men and $41,513 for women, a difference of 15.4%. Men with an educational attainment of bachelor's degree enjoy the highest average annual earnings of $62,112, while those with college or associate's degree education earn the least with $31,817. Women with an educational attainment of bachelor's degree earn the most with the average annual earnings of $62,936, while those with college or associate's degree education have the smallest earnings of $19,347.
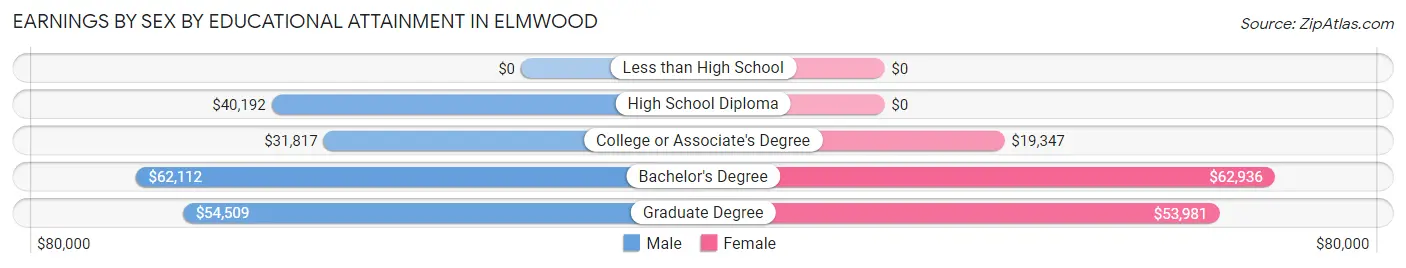
| Educational Attainment | Male Income | Female Income |
| Less than High School | - | - |
| High School Diploma | $40,192 | $0 |
| College or Associate's Degree | $31,817 | $19,347 |
| Bachelor's Degree | $62,112 | $62,936 |
| Graduate Degree | $54,509 | $53,981 |
| Total | $49,083 | $41,513 |
Family Income in Elmwood
Family Income Brackets in Elmwood
According to the Elmwood family income data, there are 377 families falling into the $75,000 to $99,999 income range, which is the most common income bracket and makes up 32.1% of all families.
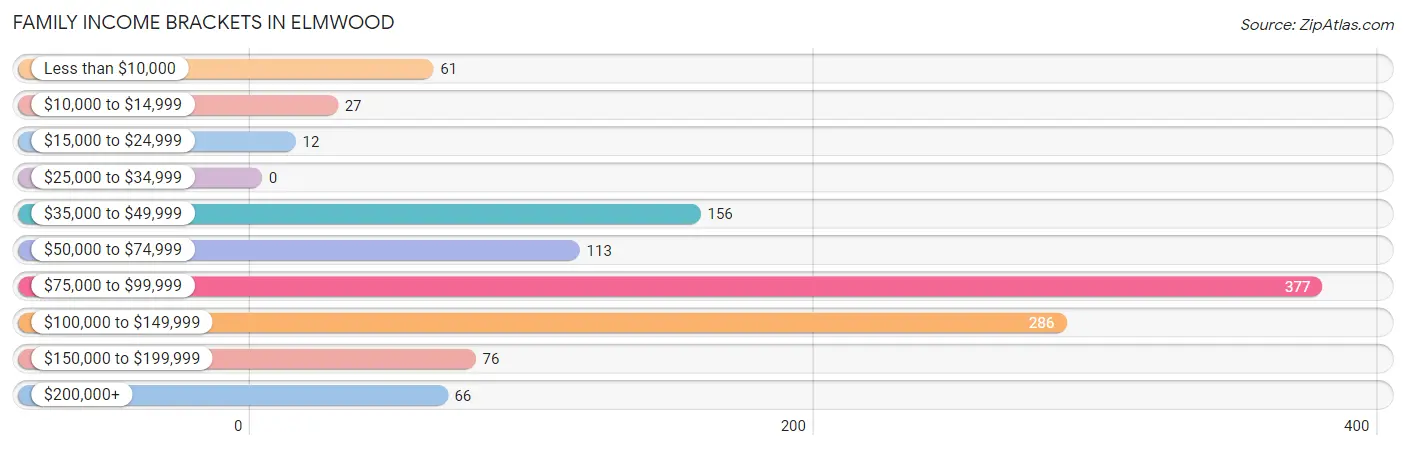
| Income Bracket | # Families | % Families |
| Less than $10,000 | 61 | 5.2% |
| $10,000 to $14,999 | 27 | 2.3% |
| $15,000 to $24,999 | 12 | 1.0% |
| $25,000 to $34,999 | 0 | 0.0% |
| $35,000 to $49,999 | 156 | 13.3% |
| $50,000 to $74,999 | 113 | 9.6% |
| $75,000 to $99,999 | 377 | 32.1% |
| $100,000 to $149,999 | 286 | 24.4% |
| $150,000 to $199,999 | 76 | 6.5% |
| $200,000+ | 66 | 5.6% |
Family Income by Famaliy Size in Elmwood
2-person families (794 | 67.6%) account for the highest median family income in Elmwood with $88,562 per family, while 2-person families (794 | 67.6%) have the highest median income of $44,281 per family member.
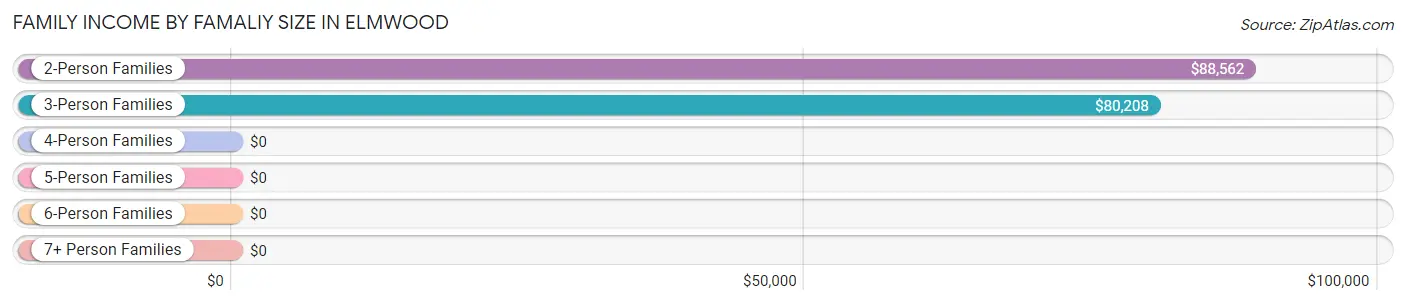
| Income Bracket | # Families | Median Income |
| 2-Person Families | 794 (67.6%) | $88,562 |
| 3-Person Families | 102 (8.7%) | $80,208 |
| 4-Person Families | 236 (20.1%) | $0 |
| 5-Person Families | 42 (3.6%) | $0 |
| 6-Person Families | 0 (0.0%) | $0 |
| 7+ Person Families | 0 (0.0%) | $0 |
| Total | 1,174 (100.0%) | $88,836 |
Family Income by Number of Earners in Elmwood
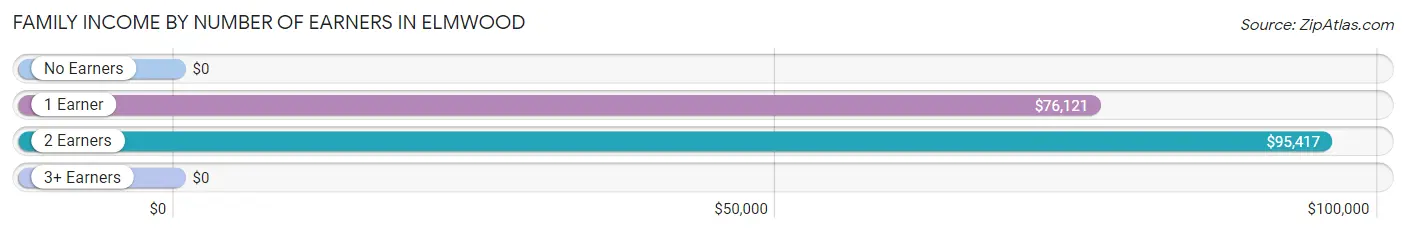
| Number of Earners | # Families | Median Income |
| No Earners | 142 (12.1%) | $0 |
| 1 Earner | 466 (39.7%) | $76,121 |
| 2 Earners | 553 (47.1%) | $95,417 |
| 3+ Earners | 13 (1.1%) | $0 |
| Total | 1,174 (100.0%) | $88,836 |
Household Income in Elmwood
Household Income Brackets in Elmwood
With 859 households falling in the category, the $75,000 to $99,999 income range is the most frequent in Elmwood, accounting for 24.8% of all households. In contrast, only 62 households (1.8%) fall into the $10,000 to $14,999 income bracket, making it the least populous group.
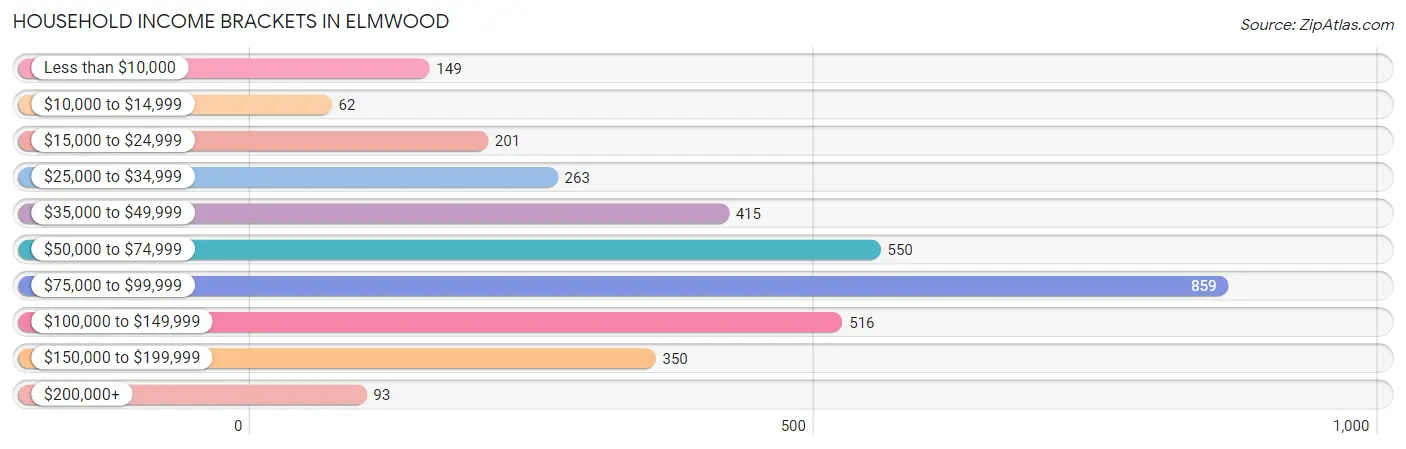
| Income Bracket | # Households | % Households |
| Less than $10,000 | 149 | 4.3% |
| $10,000 to $14,999 | 62 | 1.8% |
| $15,000 to $24,999 | 201 | 5.8% |
| $25,000 to $34,999 | 263 | 7.6% |
| $35,000 to $49,999 | 415 | 12.0% |
| $50,000 to $74,999 | 550 | 15.9% |
| $75,000 to $99,999 | 859 | 24.8% |
| $100,000 to $149,999 | 516 | 14.9% |
| $150,000 to $199,999 | 350 | 10.1% |
| $200,000+ | 93 | 2.7% |
Household Income by Householder Age in Elmwood
The median household income in Elmwood is $80,822, with the highest median household income of $140,644 found in the 65+ years age bracket for the primary householder. A total of 570 households (16.5%) fall into this category. Meanwhile, the 15 to 24 years age bracket for the primary householder has the lowest median household income of $55,938, with 283 households (8.2%) in this group.
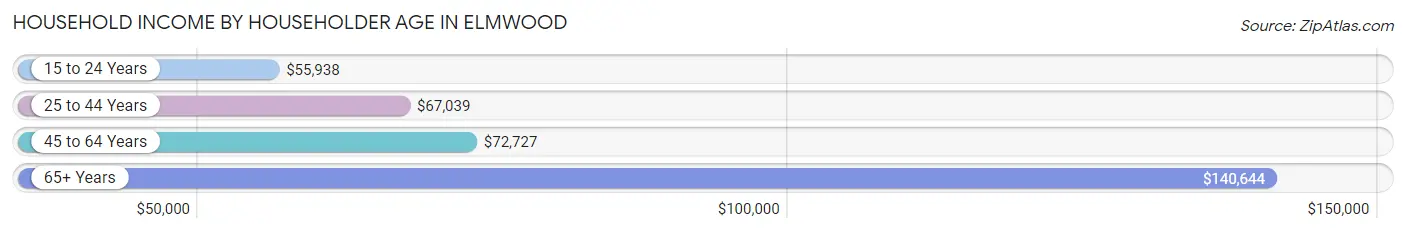
| Income Bracket | # Households | Median Income |
| 15 to 24 Years | 283 (8.2%) | $55,938 |
| 25 to 44 Years | 1,907 (55.1%) | $67,039 |
| 45 to 64 Years | 702 (20.3%) | $72,727 |
| 65+ Years | 570 (16.5%) | $140,644 |
| Total | 3,462 (100.0%) | $80,822 |
Poverty in Elmwood
Income Below Poverty by Sex and Age in Elmwood
With 4.8% poverty level for males and 12.2% for females among the residents of Elmwood, 25 to 34 year old males and 16 and 17 year old females are the most vulnerable to poverty, with 136 males (12.6%) and 30 females (100.0%) in their respective age groups living below the poverty level.
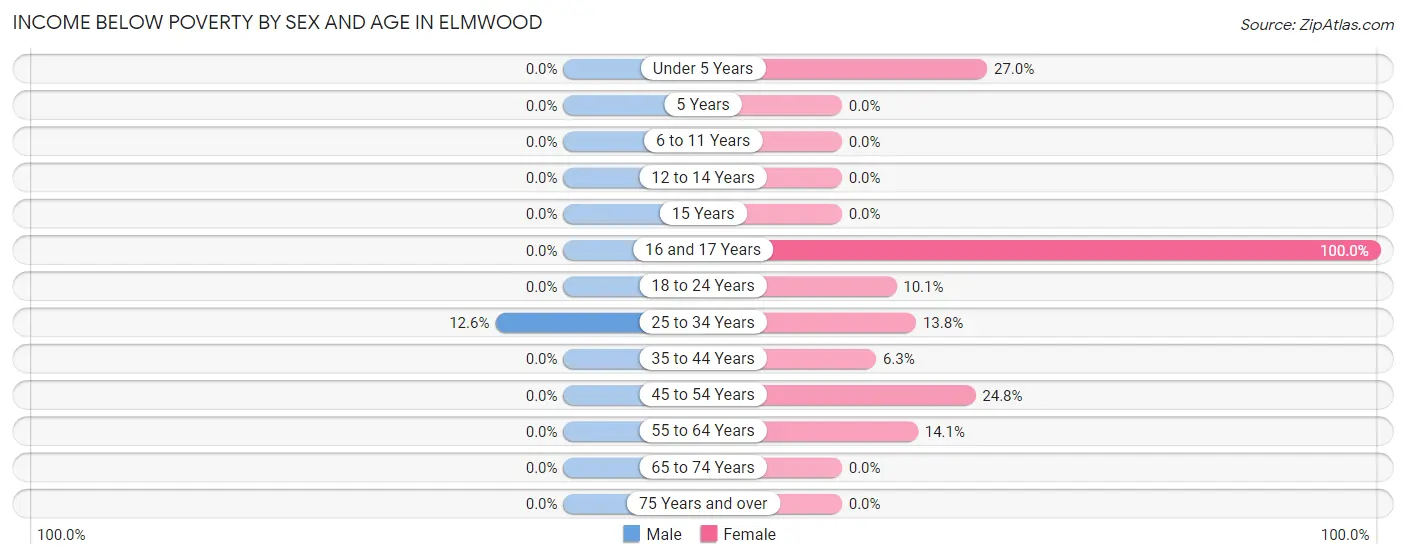
| Age Bracket | Male | Female |
| Under 5 Years | 0 (0.0%) | 62 (27.0%) |
| 5 Years | 0 (0.0%) | 0 (0.0%) |
| 6 to 11 Years | 0 (0.0%) | 0 (0.0%) |
| 12 to 14 Years | 0 (0.0%) | 0 (0.0%) |
| 15 Years | 0 (0.0%) | 0 (0.0%) |
| 16 and 17 Years | 0 (0.0%) | 30 (100.0%) |
| 18 to 24 Years | 0 (0.0%) | 26 (10.1%) |
| 25 to 34 Years | 136 (12.6%) | 168 (13.8%) |
| 35 to 44 Years | 0 (0.0%) | 18 (6.3%) |
| 45 to 54 Years | 0 (0.0%) | 58 (24.8%) |
| 55 to 64 Years | 0 (0.0%) | 35 (14.1%) |
| 65 to 74 Years | 0 (0.0%) | 0 (0.0%) |
| 75 Years and over | 0 (0.0%) | 0 (0.0%) |
| Total | 136 (4.8%) | 397 (12.2%) |
Income Above Poverty by Sex and Age in Elmwood
According to the poverty statistics in Elmwood, males aged under 5 years and females aged 5 years are the age groups that are most secure financially, with 100.0% of males and 100.0% of females in these age groups living above the poverty line.
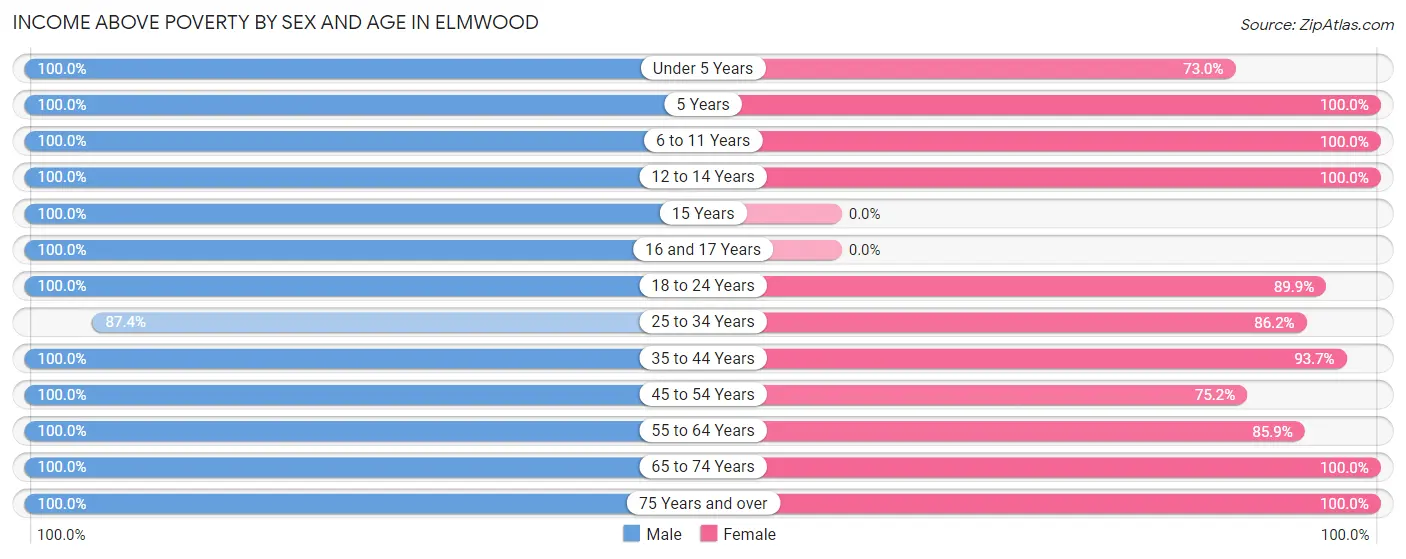
| Age Bracket | Male | Female |
| Under 5 Years | 123 (100.0%) | 168 (73.0%) |
| 5 Years | 107 (100.0%) | 31 (100.0%) |
| 6 to 11 Years | 142 (100.0%) | 153 (100.0%) |
| 12 to 14 Years | 54 (100.0%) | 83 (100.0%) |
| 15 Years | 12 (100.0%) | 0 (0.0%) |
| 16 and 17 Years | 129 (100.0%) | 0 (0.0%) |
| 18 to 24 Years | 136 (100.0%) | 231 (89.9%) |
| 25 to 34 Years | 940 (87.4%) | 1,052 (86.2%) |
| 35 to 44 Years | 263 (100.0%) | 266 (93.7%) |
| 45 to 54 Years | 245 (100.0%) | 176 (75.2%) |
| 55 to 64 Years | 285 (100.0%) | 213 (85.9%) |
| 65 to 74 Years | 209 (100.0%) | 342 (100.0%) |
| 75 Years and over | 51 (100.0%) | 137 (100.0%) |
| Total | 2,696 (95.2%) | 2,852 (87.8%) |
Income Below Poverty Among Married-Couple Families in Elmwood
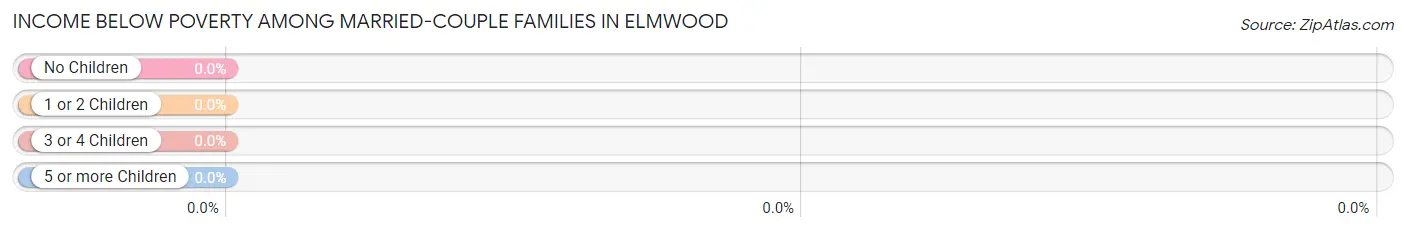
| Children | Above Poverty | Below Poverty |
| No Children | 459 (100.0%) | 0 (0.0%) |
| 1 or 2 Children | 207 (100.0%) | 0 (0.0%) |
| 3 or 4 Children | 42 (100.0%) | 0 (0.0%) |
| 5 or more Children | 0 (0.0%) | 0 (0.0%) |
| Total | 708 (100.0%) | 0 (0.0%) |
Income Below Poverty Among Single-Parent Households in Elmwood
| Children | Single Father | Single Mother |
| No Children | 0 (0.0%) | 0 (0.0%) |
| 1 or 2 Children | 0 (0.0%) | 88 (34.8%) |
| 3 or 4 Children | 0 (0.0%) | 0 (0.0%) |
| 5 or more Children | 0 (0.0%) | 0 (0.0%) |
| Total | 0 (0.0%) | 88 (22.3%) |
Income Below Poverty Among Married-Couple vs Single-Parent Households in Elmwood
| Children | Married-Couple Families | Single-Parent Households |
| No Children | 0 (0.0%) | 0 (0.0%) |
| 1 or 2 Children | 0 (0.0%) | 88 (30.8%) |
| 3 or 4 Children | 0 (0.0%) | 0 (0.0%) |
| 5 or more Children | 0 (0.0%) | 0 (0.0%) |
| Total | 0 (0.0%) | 88 (18.9%) |
Race in Elmwood
The most populous races in Elmwood are White / Caucasian (3,349 | 55.1%), Black / African American (1,902 | 31.3%), and Two or more Races (502 | 8.3%).
| Race | # Population | % Population |
| Asian | 310 | 5.1% |
| Black / African American | 1,902 | 31.3% |
| Hawaiian / Pacific | 0 | 0.0% |
| Hispanic or Latino | 486 | 8.0% |
| Native / Alaskan | 18 | 0.3% |
| White / Caucasian | 3,349 | 55.1% |
| Two or more Races | 502 | 8.3% |
| Some other Race | 0 | 0.0% |
| Total | 6,081 | 100.0% |
Ancestry in Elmwood
The most populous ancestries reported in Elmwood are German (946 | 15.6%), Italian (633 | 10.4%), French (612 | 10.1%), English (547 | 9.0%), and Irish (362 | 5.9%), together accounting for 51.0% of all Elmwood residents.
| Ancestry | # Population | % Population |
| African | 19 | 0.3% |
| American | 181 | 3.0% |
| Arab | 154 | 2.5% |
| Bhutanese | 94 | 1.5% |
| Brazilian | 14 | 0.2% |
| British | 25 | 0.4% |
| Bulgarian | 67 | 1.1% |
| Burmese | 12 | 0.2% |
| Central American | 146 | 2.4% |
| Cherokee | 13 | 0.2% |
| Colombian | 65 | 1.1% |
| Cuban | 210 | 3.5% |
| Czech | 13 | 0.2% |
| Czechoslovakian | 12 | 0.2% |
| English | 547 | 9.0% |
| European | 48 | 0.8% |
| French | 612 | 10.1% |
| French Canadian | 16 | 0.3% |
| German | 946 | 15.6% |
| Greek | 13 | 0.2% |
| Honduran | 67 | 1.1% |
| Indian (Asian) | 107 | 1.8% |
| Iranian | 46 | 0.8% |
| Irish | 362 | 5.9% |
| Italian | 633 | 10.4% |
| Jordanian | 22 | 0.4% |
| Lebanese | 36 | 0.6% |
| Lithuanian | 12 | 0.2% |
| Mexican | 19 | 0.3% |
| Norwegian | 43 | 0.7% |
| Panamanian | 71 | 1.2% |
| Polish | 25 | 0.4% |
| Portuguese | 65 | 1.1% |
| Puerto Rican | 9 | 0.2% |
| Romanian | 24 | 0.4% |
| Russian | 31 | 0.5% |
| Salvadoran | 8 | 0.1% |
| Scandinavian | 24 | 0.4% |
| Scottish | 37 | 0.6% |
| South American | 65 | 1.1% |
| Spanish | 37 | 0.6% |
| Sri Lankan | 62 | 1.0% |
| Subsaharan African | 19 | 0.3% |
| Thai | 164 | 2.7% |
| Welsh | 20 | 0.3% |
| West Indian | 56 | 0.9% |
| Yugoslavian | 7 | 0.1% | View All 47 Rows |
Immigrants in Elmwood
The most numerous immigrant groups reported in Elmwood came from Latin America (297 | 4.9%), Asia (223 | 3.7%), Caribbean (211 | 3.5%), Cuba (200 | 3.3%), and Europe (160 | 2.6%), together accounting for 17.9% of all Elmwood residents.
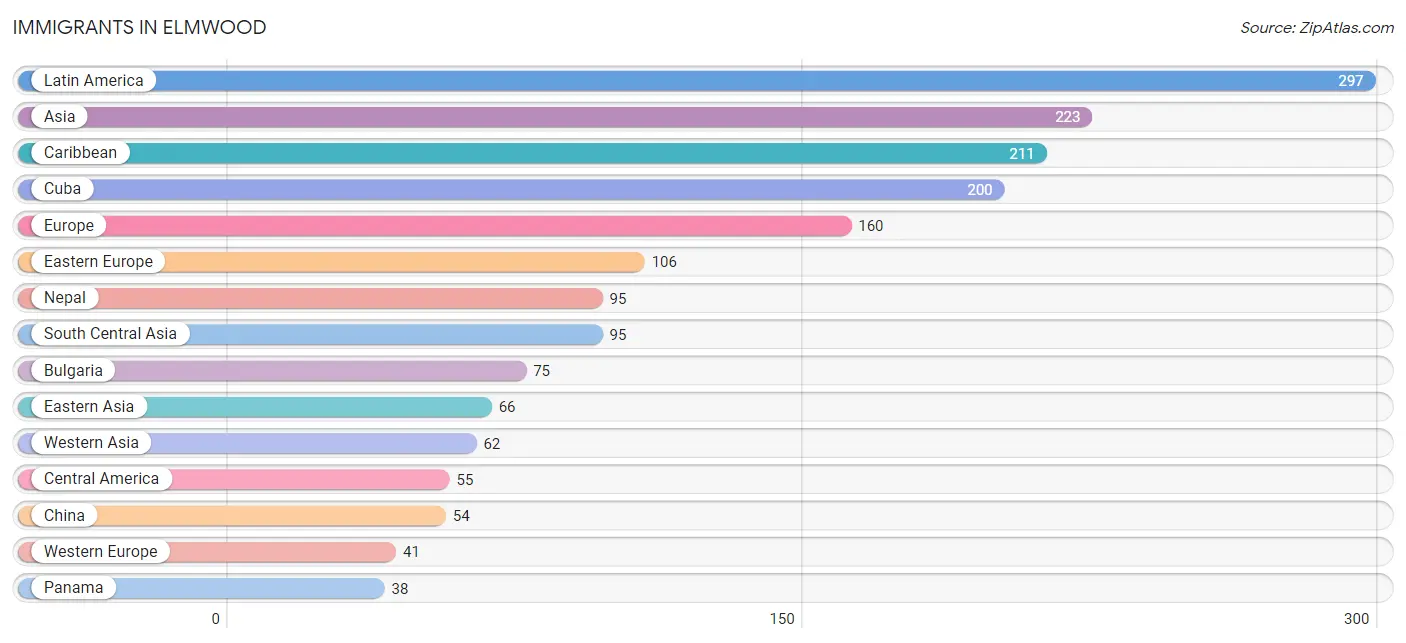
| Immigration Origin | # Population | % Population |
| Africa | 34 | 0.6% |
| Asia | 223 | 3.7% |
| Brazil | 31 | 0.5% |
| Bulgaria | 75 | 1.2% |
| Canada | 14 | 0.2% |
| Caribbean | 211 | 3.5% |
| Central America | 55 | 0.9% |
| China | 54 | 0.9% |
| Cuba | 200 | 3.3% |
| Eastern Africa | 34 | 0.6% |
| Eastern Asia | 66 | 1.1% |
| Eastern Europe | 106 | 1.7% |
| El Salvador | 8 | 0.1% |
| Europe | 160 | 2.6% |
| France | 23 | 0.4% |
| Germany | 18 | 0.3% |
| Honduras | 9 | 0.2% |
| Israel | 22 | 0.4% |
| Korea | 12 | 0.2% |
| Latin America | 297 | 4.9% |
| Nepal | 95 | 1.6% |
| Northern Europe | 13 | 0.2% |
| Panama | 38 | 0.6% |
| Russia | 31 | 0.5% |
| Saudi Arabia | 20 | 0.3% |
| South America | 31 | 0.5% |
| South Central Asia | 95 | 1.6% |
| Syria | 20 | 0.3% |
| Western Asia | 62 | 1.0% |
| Western Europe | 41 | 0.7% | View All 30 Rows |
Sex and Age in Elmwood
Sex and Age in Elmwood
The most populous age groups in Elmwood are 30 to 34 Years (648 | 22.9%) for men and 25 to 29 Years (772 | 23.8%) for women.
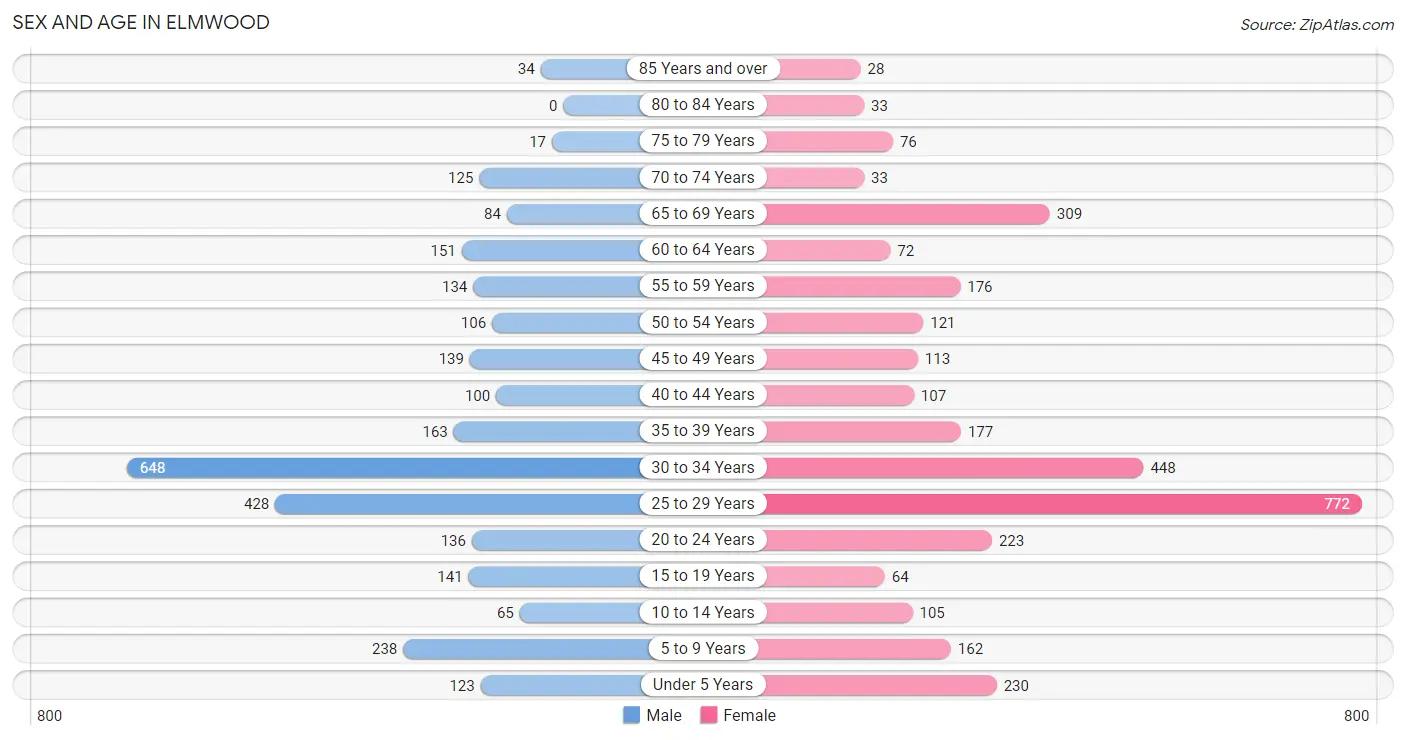
| Age Bracket | Male | Female |
| Under 5 Years | 123 (4.3%) | 230 (7.1%) |
| 5 to 9 Years | 238 (8.4%) | 162 (5.0%) |
| 10 to 14 Years | 65 (2.3%) | 105 (3.2%) |
| 15 to 19 Years | 141 (5.0%) | 64 (2.0%) |
| 20 to 24 Years | 136 (4.8%) | 223 (6.9%) |
| 25 to 29 Years | 428 (15.1%) | 772 (23.8%) |
| 30 to 34 Years | 648 (22.9%) | 448 (13.8%) |
| 35 to 39 Years | 163 (5.8%) | 177 (5.4%) |
| 40 to 44 Years | 100 (3.5%) | 107 (3.3%) |
| 45 to 49 Years | 139 (4.9%) | 113 (3.5%) |
| 50 to 54 Years | 106 (3.7%) | 121 (3.7%) |
| 55 to 59 Years | 134 (4.7%) | 176 (5.4%) |
| 60 to 64 Years | 151 (5.3%) | 72 (2.2%) |
| 65 to 69 Years | 84 (3.0%) | 309 (9.5%) |
| 70 to 74 Years | 125 (4.4%) | 33 (1.0%) |
| 75 to 79 Years | 17 (0.6%) | 76 (2.3%) |
| 80 to 84 Years | 0 (0.0%) | 33 (1.0%) |
| 85 Years and over | 34 (1.2%) | 28 (0.9%) |
| Total | 2,832 (100.0%) | 3,249 (100.0%) |
Families and Households in Elmwood
Median Family Size in Elmwood
The median family size in Elmwood is 2.78 persons per family, with married-couple families (708 | 60.3%) accounting for the largest median family size of 2.94 persons per family. On the other hand, single male/father families (72 | 6.1%) represent the smallest median family size with 2.15 persons per family.
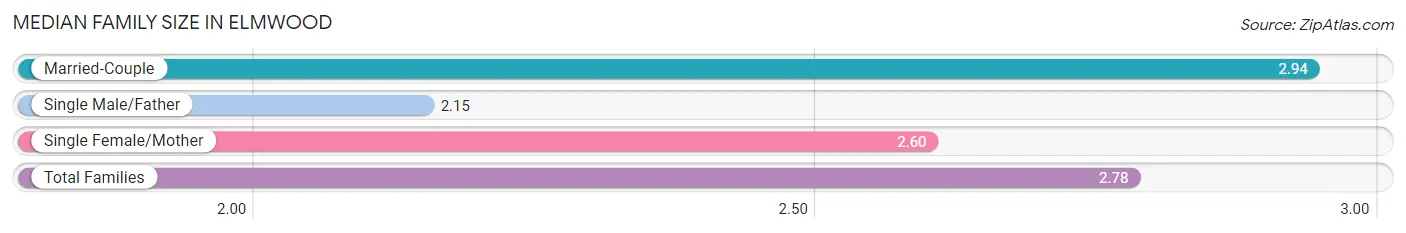
| Family Type | # Families | Family Size |
| Married-Couple | 708 (60.3%) | 2.94 |
| Single Male/Father | 72 (6.1%) | 2.15 |
| Single Female/Mother | 394 (33.6%) | 2.60 |
| Total Families | 1,174 (100.0%) | 2.78 |
Median Household Size in Elmwood
The median household size in Elmwood is 1.76 persons per household, with married-couple households (708 | 20.4%) accounting for the largest median household size of 2.94 persons per household. non-family households (2,288 | 66.1%) represent the smallest median household size with 1.20 persons per household.
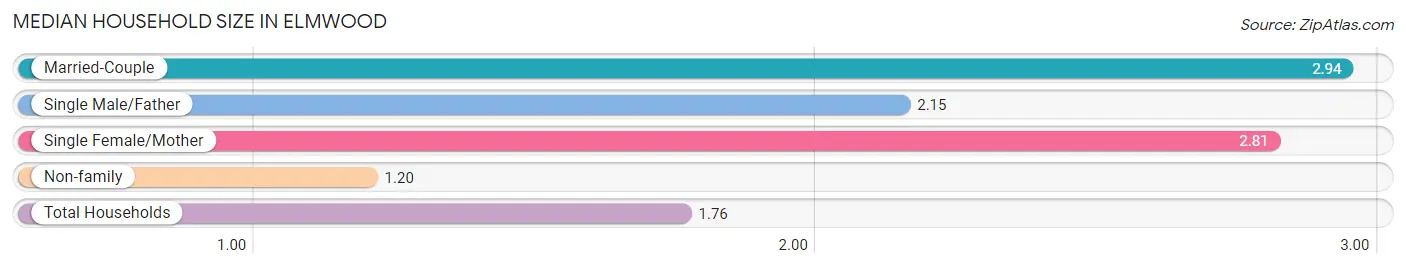
| Household Type | # Households | Household Size |
| Married-Couple | 708 (20.4%) | 2.94 |
| Single Male/Father | 72 (2.1%) | 2.15 |
| Single Female/Mother | 394 (11.4%) | 2.81 |
| Non-family | 2,288 (66.1%) | 1.20 |
| Total Households | 3,462 (100.0%) | 1.76 |
Household Size by Marriage Status in Elmwood
Out of a total of 3,462 households in Elmwood, 1,174 (33.9%) are family households, while 2,288 (66.1%) are nonfamily households. The most numerous type of family households are 2-person households, comprising 733, and the most common type of nonfamily households are 1-person households, comprising 1,753.
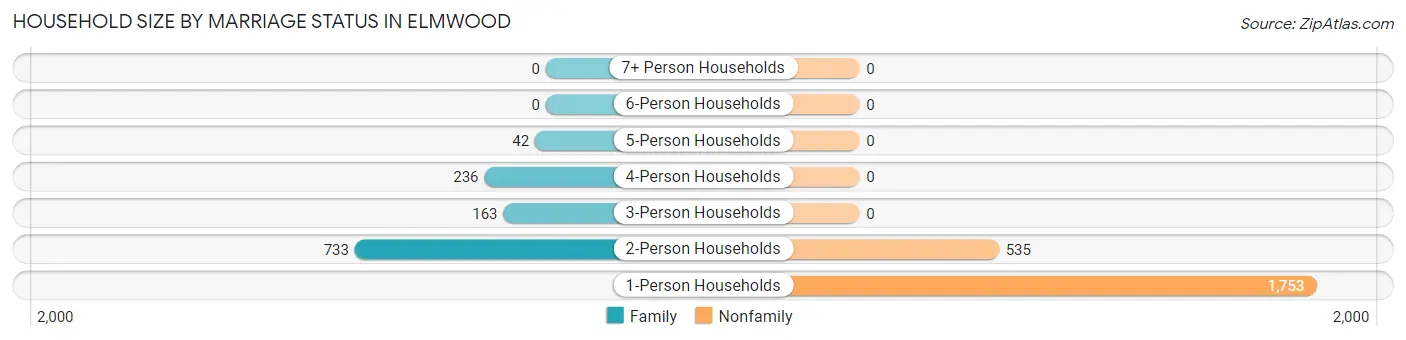
| Household Size | Family Households | Nonfamily Households |
| 1-Person Households | - | 1,753 (50.6%) |
| 2-Person Households | 733 (21.2%) | 535 (15.4%) |
| 3-Person Households | 163 (4.7%) | 0 (0.0%) |
| 4-Person Households | 236 (6.8%) | 0 (0.0%) |
| 5-Person Households | 42 (1.2%) | 0 (0.0%) |
| 6-Person Households | 0 (0.0%) | 0 (0.0%) |
| 7+ Person Households | 0 (0.0%) | 0 (0.0%) |
| Total | 1,174 (33.9%) | 2,288 (66.1%) |
Female Fertility in Elmwood
Fertility by Age in Elmwood
Average fertility rate in Elmwood is 100.0 births per 1,000 women. Women in the age bracket of 20 to 34 years have the highest fertility rate with 125.0 births per 1,000 women. Women in the age bracket of 20 to 34 years acount for 94.8% of all women with births.
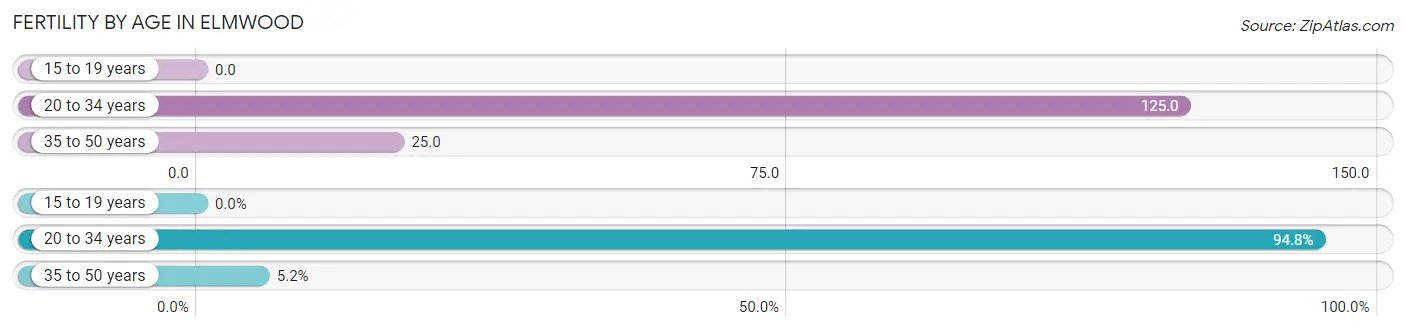
| Age Bracket | Women with Births | Births / 1,000 Women |
| 15 to 19 years | 0 (0.0%) | 0.0 |
| 20 to 34 years | 181 (94.8%) | 125.0 |
| 35 to 50 years | 10 (5.2%) | 25.0 |
| Total | 191 (100.0%) | 100.0 |
Fertility by Age by Marriage Status in Elmwood
68.1% of women with births (191) in Elmwood are married. The highest percentage of unmarried women with births falls into 20 to 34 years age bracket with 33.7% of them unmarried at the time of birth, while the lowest percentage of unmarried women with births belong to 35 to 50 years age bracket with 0.0% of them unmarried.
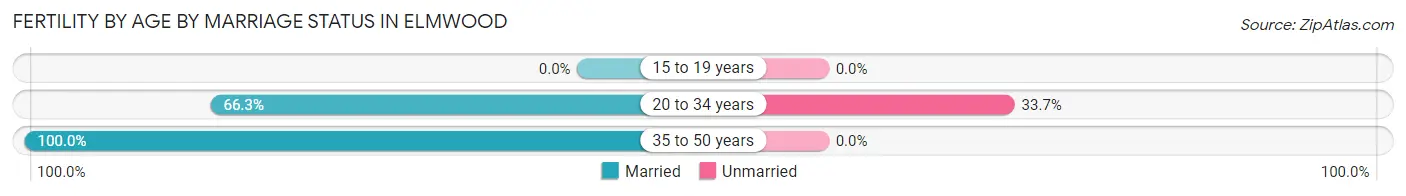
| Age Bracket | Married | Unmarried |
| 15 to 19 years | 0 (0.0%) | 0 (0.0%) |
| 20 to 34 years | 120 (66.3%) | 61 (33.7%) |
| 35 to 50 years | 10 (100.0%) | 0 (0.0%) |
| Total | 130 (68.1%) | 61 (31.9%) |
Fertility by Education in Elmwood
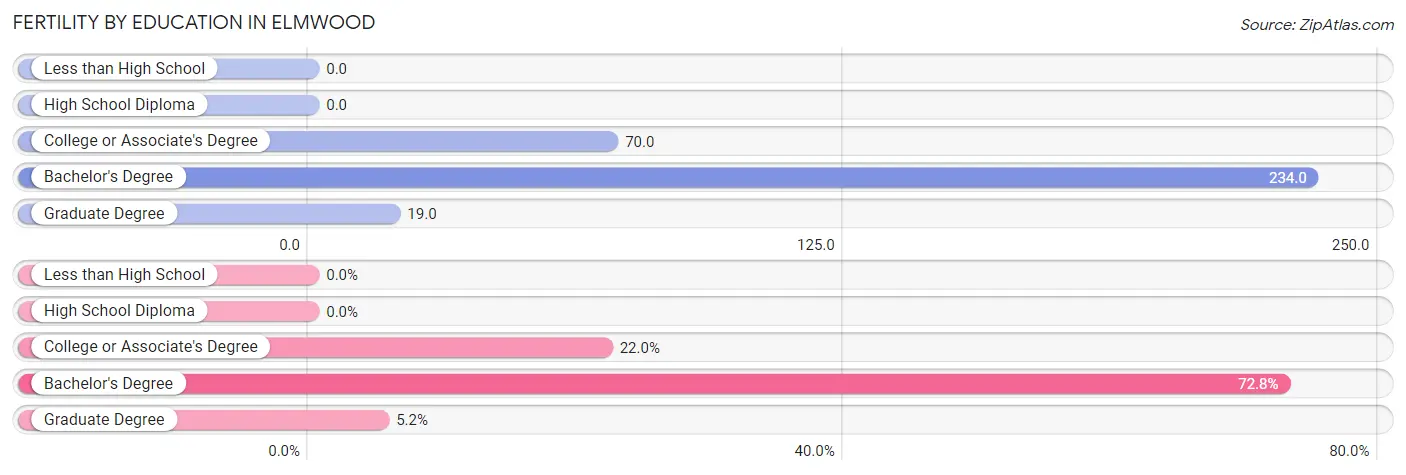
| Educational Attainment | Women with Births | Births / 1,000 Women |
| Less than High School | 0 (0.0%) | 0.0 |
| High School Diploma | 0 (0.0%) | 0.0 |
| College or Associate's Degree | 42 (22.0%) | 70.0 |
| Bachelor's Degree | 139 (72.8%) | 234.0 |
| Graduate Degree | 10 (5.2%) | 19.0 |
| Total | 191 (100.0%) | 100.0 |
Fertility by Education by Marriage Status in Elmwood
31.9% of women with births in Elmwood are unmarried. Women with the educational attainment of college or associate's degree are most likely to be married with 100.0% of them married at childbirth, while women with the educational attainment of bachelor's degree are least likely to be married with 43.9% of them unmarried at childbirth.
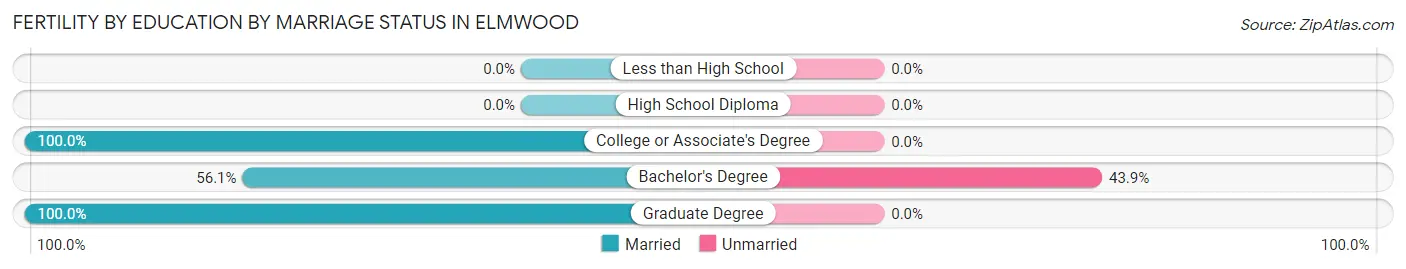
| Educational Attainment | Married | Unmarried |
| Less than High School | 0 (0.0%) | 0 (0.0%) |
| High School Diploma | 0 (0.0%) | 0 (0.0%) |
| College or Associate's Degree | 42 (100.0%) | 0 (0.0%) |
| Bachelor's Degree | 78 (56.1%) | 61 (43.9%) |
| Graduate Degree | 10 (100.0%) | 0 (0.0%) |
| Total | 130 (68.1%) | 61 (31.9%) |
Employment Characteristics in Elmwood
Employment by Class of Employer in Elmwood
Among the 3,730 employed individuals in Elmwood, private company employees (2,454 | 65.8%), not-for-profit organizations (541 | 14.5%), and self-employed (incorporated) (187 | 5.0%) make up the most common classes of employment.
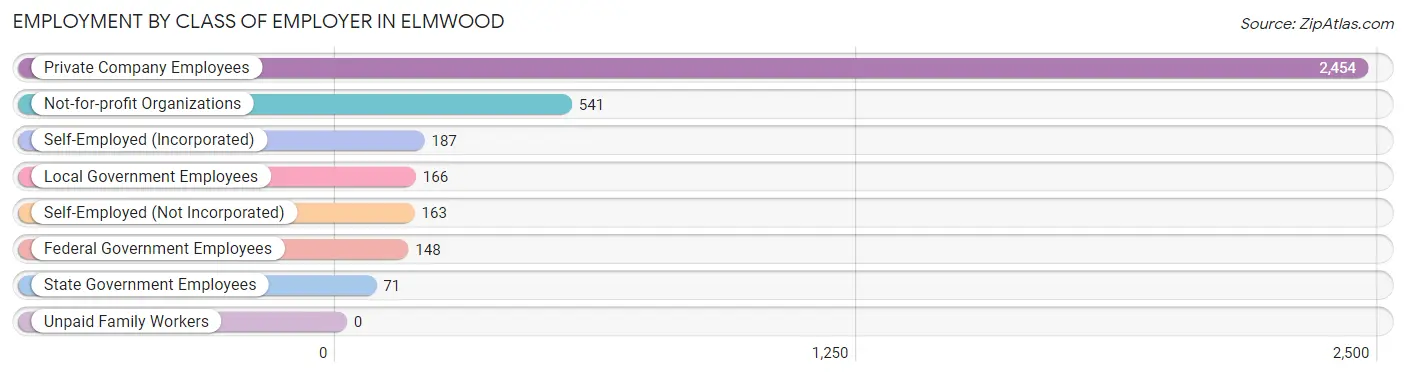
| Employer Class | # Employees | % Employees |
| Private Company Employees | 2,454 | 65.8% |
| Self-Employed (Incorporated) | 187 | 5.0% |
| Self-Employed (Not Incorporated) | 163 | 4.4% |
| Not-for-profit Organizations | 541 | 14.5% |
| Local Government Employees | 166 | 4.4% |
| State Government Employees | 71 | 1.9% |
| Federal Government Employees | 148 | 4.0% |
| Unpaid Family Workers | 0 | 0.0% |
| Total | 3,730 | 100.0% |
Employment Status by Age in Elmwood
According to the labor force statistics for Elmwood, out of the total population over 16 years of age (5,146), 79.0% or 4,065 individuals are in the labor force, with 6.5% or 264 of them unemployed. The age group with the highest labor force participation rate is 30 to 34 years, with 96.5% or 1,058 individuals in the labor force. Within the labor force, the 65 to 74 years age range has the highest percentage of unemployed individuals, with 30.8% or 66 of them being unemployed.
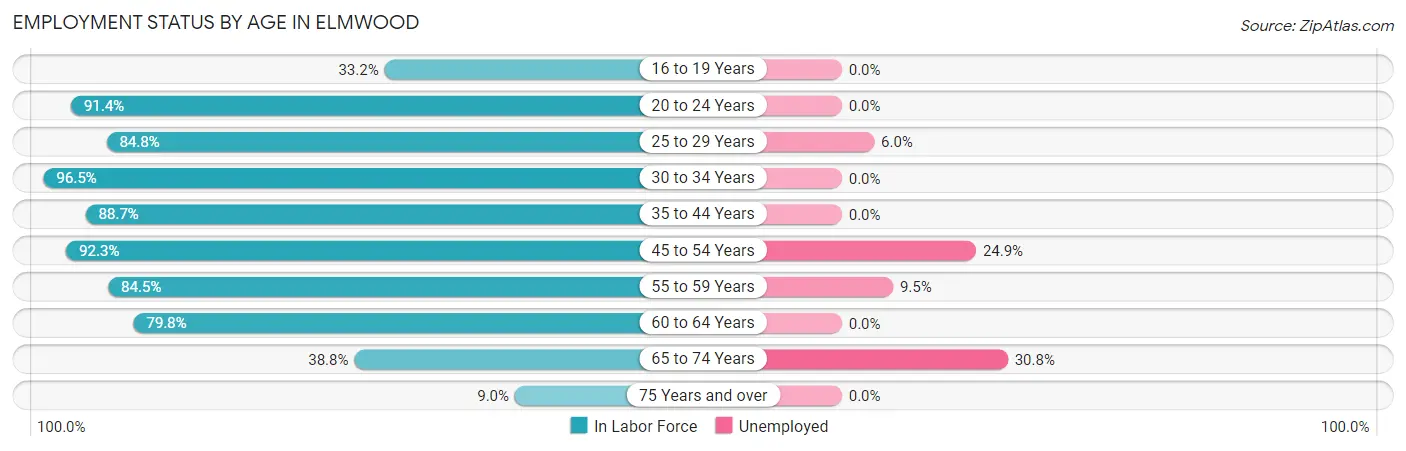
| Age Bracket | In Labor Force | Unemployed |
| 16 to 19 Years | 64 (33.2%) | 0 (0.0%) |
| 20 to 24 Years | 328 (91.4%) | 0 (0.0%) |
| 25 to 29 Years | 1,018 (84.8%) | 61 (6.0%) |
| 30 to 34 Years | 1,058 (96.5%) | 0 (0.0%) |
| 35 to 44 Years | 485 (88.7%) | 0 (0.0%) |
| 45 to 54 Years | 442 (92.3%) | 110 (24.9%) |
| 55 to 59 Years | 262 (84.5%) | 25 (9.5%) |
| 60 to 64 Years | 178 (79.8%) | 0 (0.0%) |
| 65 to 74 Years | 214 (38.8%) | 66 (30.8%) |
| 75 Years and over | 17 (9.0%) | 0 (0.0%) |
| Total | 4,065 (79.0%) | 264 (6.5%) |
Employment Status by Educational Attainment in Elmwood
According to labor force statistics for Elmwood, 89.3% of individuals (3,443) out of the total population between 25 and 64 years of age (3,855) are in the labor force, with 5.7% or 196 of them being unemployed. The group with the highest labor force participation rate are those with the educational attainment of college / associate degree, with 93.8% or 1,034 individuals in the labor force. Within the labor force, individuals with high school diploma education have the highest percentage of unemployment, with 14.0% or 31 of them being unemployed.
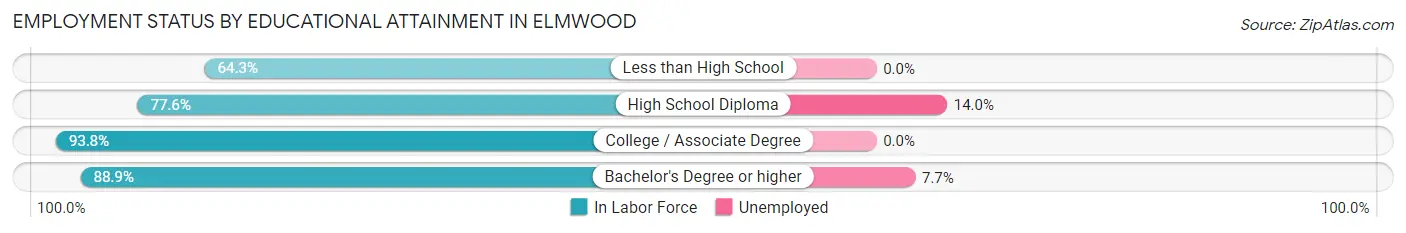
| Educational Attainment | In Labor Force | Unemployed |
| Less than High School | 18 (64.3%) | 0 (0.0%) |
| High School Diploma | 222 (77.6%) | 40 (14.0%) |
| College / Associate Degree | 1,034 (93.8%) | 0 (0.0%) |
| Bachelor's Degree or higher | 2,168 (88.9%) | 188 (7.7%) |
| Total | 3,443 (89.3%) | 220 (5.7%) |
Employment Occupations by Sex in Elmwood
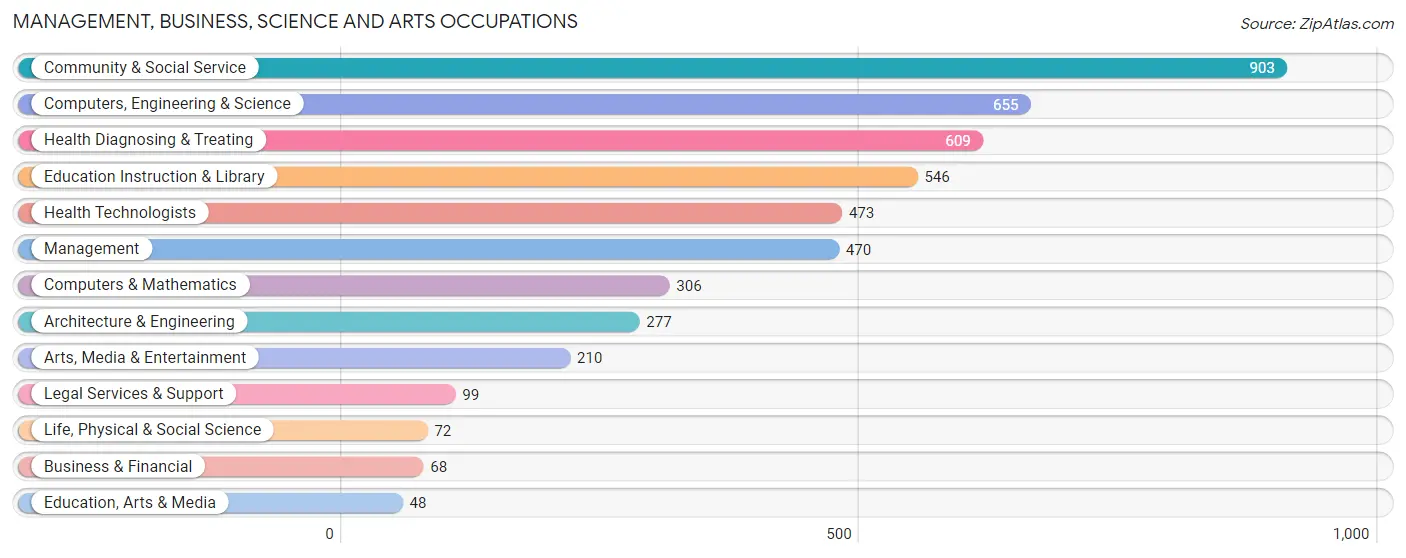
Management, Business, Science and Arts Occupations
The most common Management, Business, Science and Arts occupations in Elmwood are Community & Social Service (903 | 23.8%), Computers, Engineering & Science (655 | 17.3%), Health Diagnosing & Treating (609 | 16.1%), Education Instruction & Library (546 | 14.4%), and Health Technologists (473 | 12.5%).
Management, Business, Science and Arts Occupations by Sex
Within the Management, Business, Science and Arts occupations in Elmwood, the most male-oriented occupations are Life, Physical & Social Science (81.9%), Management (75.1%), and Computers & Mathematics (69.0%), while the most female-oriented occupations are Business & Financial (100.0%), Legal Services & Support (100.0%), and Health Diagnosing & Treating (74.1%).
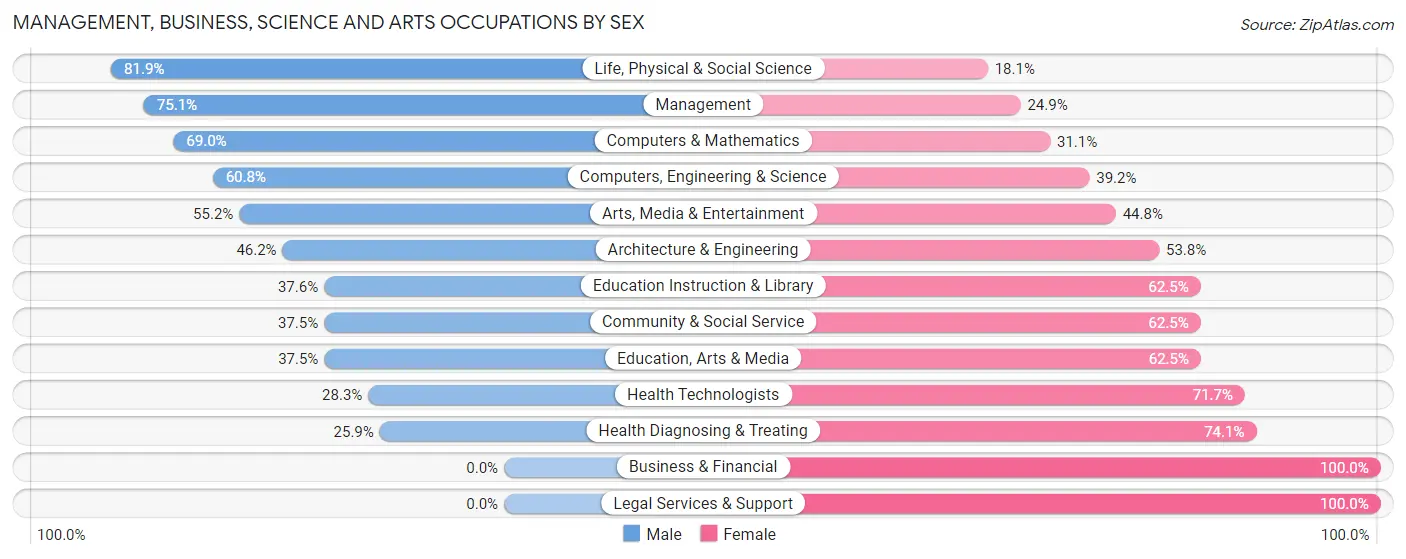
| Occupation | Male | Female |
| Management | 353 (75.1%) | 117 (24.9%) |
| Business & Financial | 0 (0.0%) | 68 (100.0%) |
| Computers, Engineering & Science | 398 (60.8%) | 257 (39.2%) |
| Computers & Mathematics | 211 (69.0%) | 95 (31.0%) |
| Architecture & Engineering | 128 (46.2%) | 149 (53.8%) |
| Life, Physical & Social Science | 59 (81.9%) | 13 (18.1%) |
| Community & Social Service | 339 (37.5%) | 564 (62.5%) |
| Education, Arts & Media | 18 (37.5%) | 30 (62.5%) |
| Legal Services & Support | 0 (0.0%) | 99 (100.0%) |
| Education Instruction & Library | 205 (37.6%) | 341 (62.5%) |
| Arts, Media & Entertainment | 116 (55.2%) | 94 (44.8%) |
| Health Diagnosing & Treating | 158 (25.9%) | 451 (74.1%) |
| Health Technologists | 134 (28.3%) | 339 (71.7%) |
| Total (Category) | 1,248 (46.1%) | 1,457 (53.9%) |
| Total (Overall) | 1,963 (51.8%) | 1,826 (48.2%) |
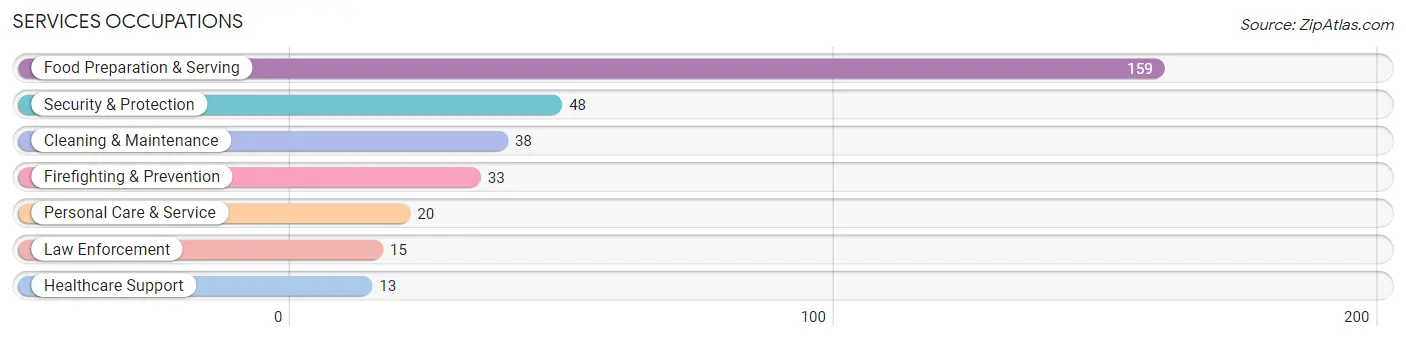
Services Occupations
The most common Services occupations in Elmwood are Food Preparation & Serving (159 | 4.2%), Security & Protection (48 | 1.3%), Cleaning & Maintenance (38 | 1.0%), Firefighting & Prevention (33 | 0.9%), and Personal Care & Service (20 | 0.5%).
Services Occupations by Sex
Within the Services occupations in Elmwood, the most male-oriented occupations are Security & Protection (100.0%), Firefighting & Prevention (100.0%), and Law Enforcement (100.0%), while the most female-oriented occupations are Healthcare Support (100.0%), Food Preparation & Serving (67.3%), and Personal Care & Service (60.0%).
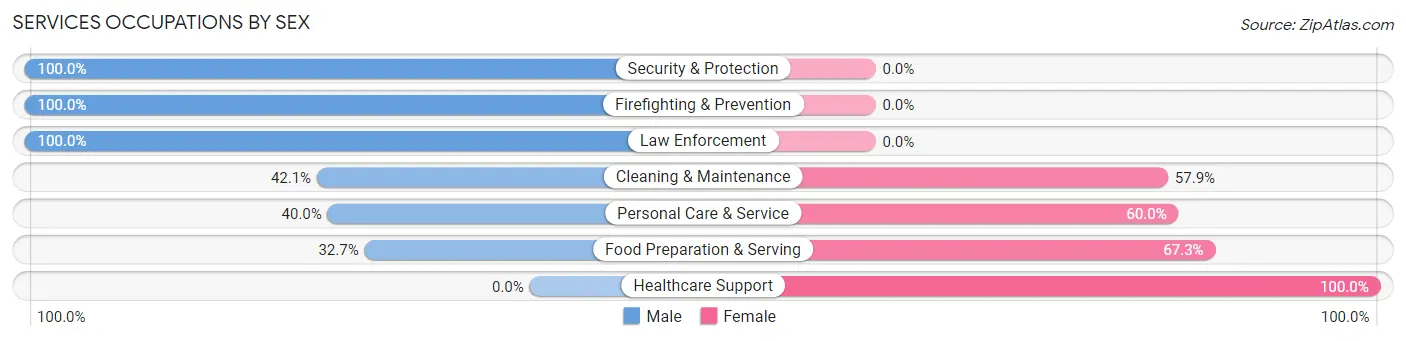
| Occupation | Male | Female |
| Healthcare Support | 0 (0.0%) | 13 (100.0%) |
| Security & Protection | 48 (100.0%) | 0 (0.0%) |
| Firefighting & Prevention | 33 (100.0%) | 0 (0.0%) |
| Law Enforcement | 15 (100.0%) | 0 (0.0%) |
| Food Preparation & Serving | 52 (32.7%) | 107 (67.3%) |
| Cleaning & Maintenance | 16 (42.1%) | 22 (57.9%) |
| Personal Care & Service | 8 (40.0%) | 12 (60.0%) |
| Total (Category) | 124 (44.6%) | 154 (55.4%) |
| Total (Overall) | 1,963 (51.8%) | 1,826 (48.2%) |
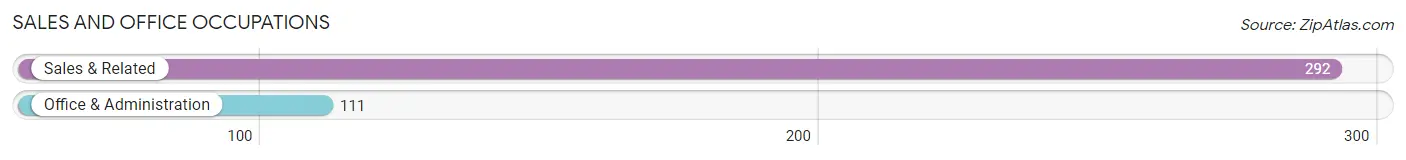
Sales and Office Occupations
The most common Sales and Office occupations in Elmwood are Sales & Related (292 | 7.7%), and Office & Administration (111 | 2.9%).
Sales and Office Occupations by Sex
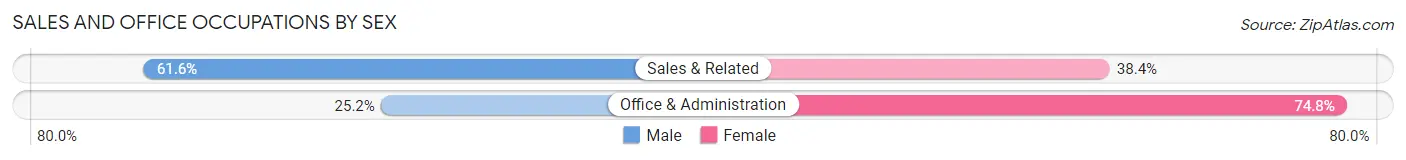
| Occupation | Male | Female |
| Sales & Related | 180 (61.6%) | 112 (38.4%) |
| Office & Administration | 28 (25.2%) | 83 (74.8%) |
| Total (Category) | 208 (51.6%) | 195 (48.4%) |
| Total (Overall) | 1,963 (51.8%) | 1,826 (48.2%) |
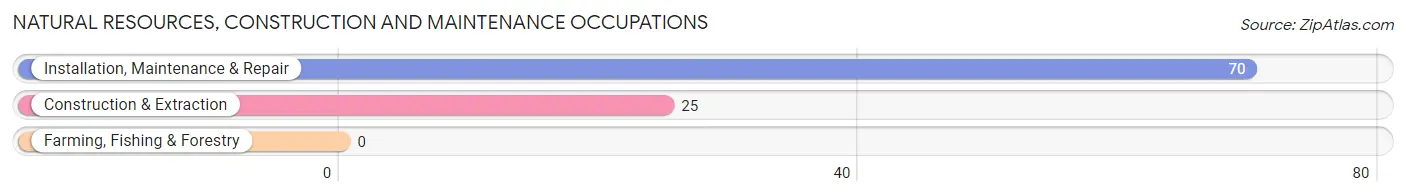
Natural Resources, Construction and Maintenance Occupations
The most common Natural Resources, Construction and Maintenance occupations in Elmwood are Installation, Maintenance & Repair (70 | 1.8%), and Construction & Extraction (25 | 0.7%).
Natural Resources, Construction and Maintenance Occupations by Sex
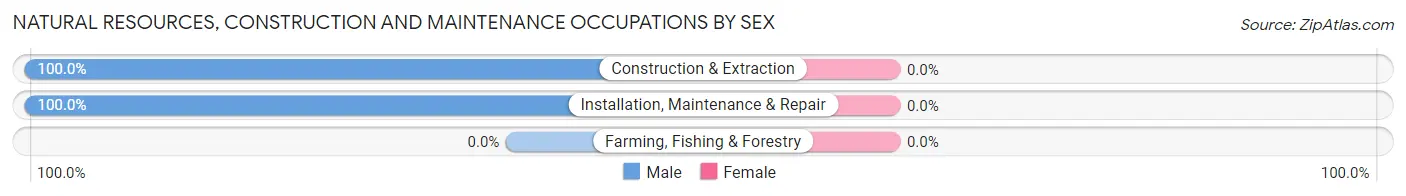
| Occupation | Male | Female |
| Farming, Fishing & Forestry | 0 (0.0%) | 0 (0.0%) |
| Construction & Extraction | 25 (100.0%) | 0 (0.0%) |
| Installation, Maintenance & Repair | 70 (100.0%) | 0 (0.0%) |
| Total (Category) | 95 (100.0%) | 0 (0.0%) |
| Total (Overall) | 1,963 (51.8%) | 1,826 (48.2%) |
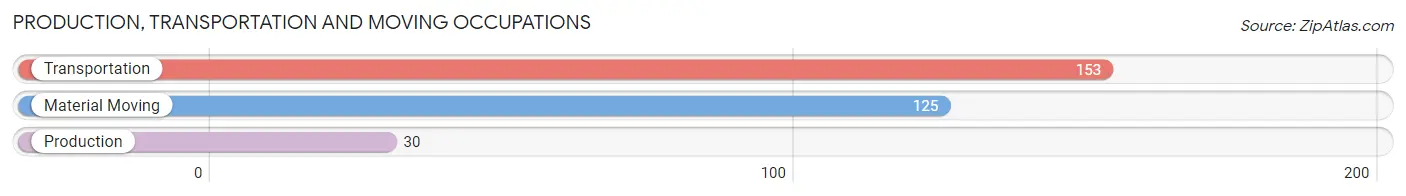
Production, Transportation and Moving Occupations
The most common Production, Transportation and Moving occupations in Elmwood are Transportation (153 | 4.0%), Material Moving (125 | 3.3%), and Production (30 | 0.8%).
Production, Transportation and Moving Occupations by Sex
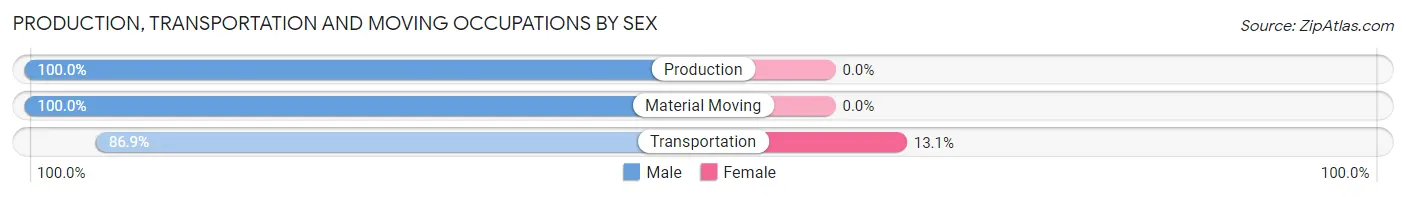
| Occupation | Male | Female |
| Production | 30 (100.0%) | 0 (0.0%) |
| Transportation | 133 (86.9%) | 20 (13.1%) |
| Material Moving | 125 (100.0%) | 0 (0.0%) |
| Total (Category) | 288 (93.5%) | 20 (6.5%) |
| Total (Overall) | 1,963 (51.8%) | 1,826 (48.2%) |
Employment Industries by Sex in Elmwood
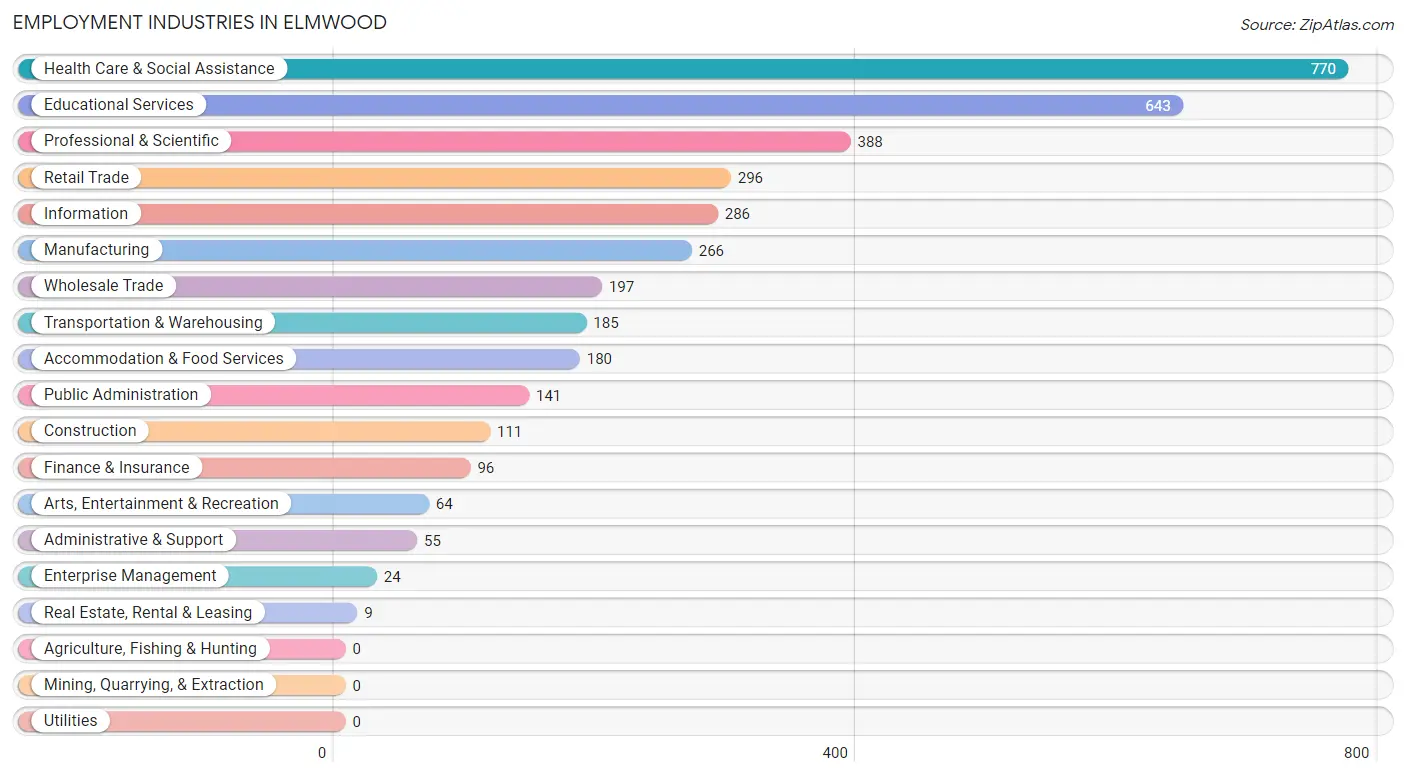
Employment Industries in Elmwood
The major employment industries in Elmwood include Health Care & Social Assistance (770 | 20.3%), Educational Services (643 | 17.0%), Professional & Scientific (388 | 10.2%), Retail Trade (296 | 7.8%), and Information (286 | 7.5%).
Employment Industries by Sex in Elmwood
The Elmwood industries that see more men than women are Construction (100.0%), Wholesale Trade (100.0%), and Real Estate, Rental & Leasing (100.0%), whereas the industries that tend to have a higher number of women are Health Care & Social Assistance (75.3%), Finance & Insurance (74.0%), and Accommodation & Food Services (59.4%).
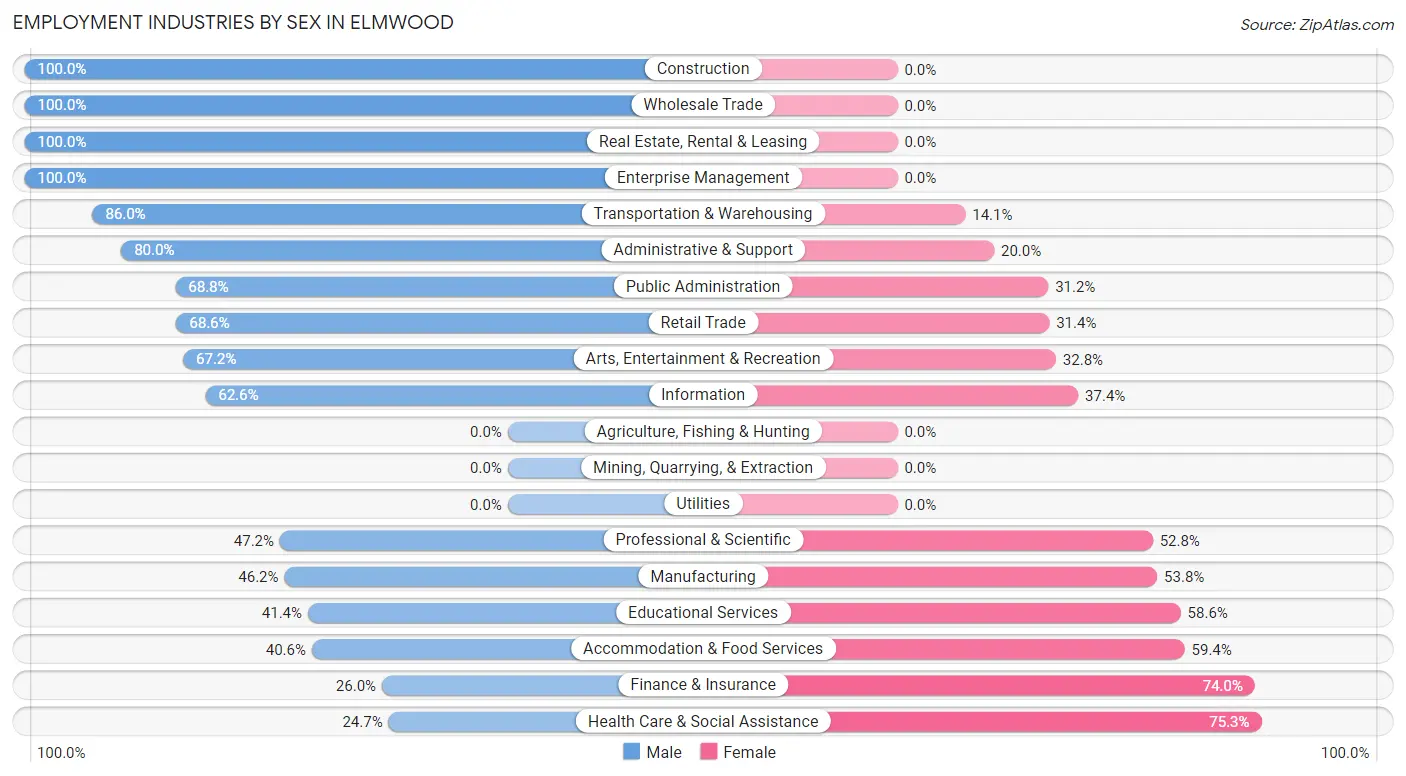
| Industry | Male | Female |
| Agriculture, Fishing & Hunting | 0 (0.0%) | 0 (0.0%) |
| Mining, Quarrying, & Extraction | 0 (0.0%) | 0 (0.0%) |
| Construction | 111 (100.0%) | 0 (0.0%) |
| Manufacturing | 123 (46.2%) | 143 (53.8%) |
| Wholesale Trade | 197 (100.0%) | 0 (0.0%) |
| Retail Trade | 203 (68.6%) | 93 (31.4%) |
| Transportation & Warehousing | 159 (86.0%) | 26 (14.1%) |
| Utilities | 0 (0.0%) | 0 (0.0%) |
| Information | 179 (62.6%) | 107 (37.4%) |
| Finance & Insurance | 25 (26.0%) | 71 (74.0%) |
| Real Estate, Rental & Leasing | 9 (100.0%) | 0 (0.0%) |
| Professional & Scientific | 183 (47.2%) | 205 (52.8%) |
| Enterprise Management | 24 (100.0%) | 0 (0.0%) |
| Administrative & Support | 44 (80.0%) | 11 (20.0%) |
| Educational Services | 266 (41.4%) | 377 (58.6%) |
| Health Care & Social Assistance | 190 (24.7%) | 580 (75.3%) |
| Arts, Entertainment & Recreation | 43 (67.2%) | 21 (32.8%) |
| Accommodation & Food Services | 73 (40.6%) | 107 (59.4%) |
| Public Administration | 97 (68.8%) | 44 (31.2%) |
| Total | 1,963 (51.8%) | 1,826 (48.2%) |
Education in Elmwood
School Enrollment in Elmwood
The most common levels of schooling among the 1,352 students in Elmwood are graduate / professional (461 | 34.1%), elementary school (248 | 18.3%), and high school (171 | 12.7%).
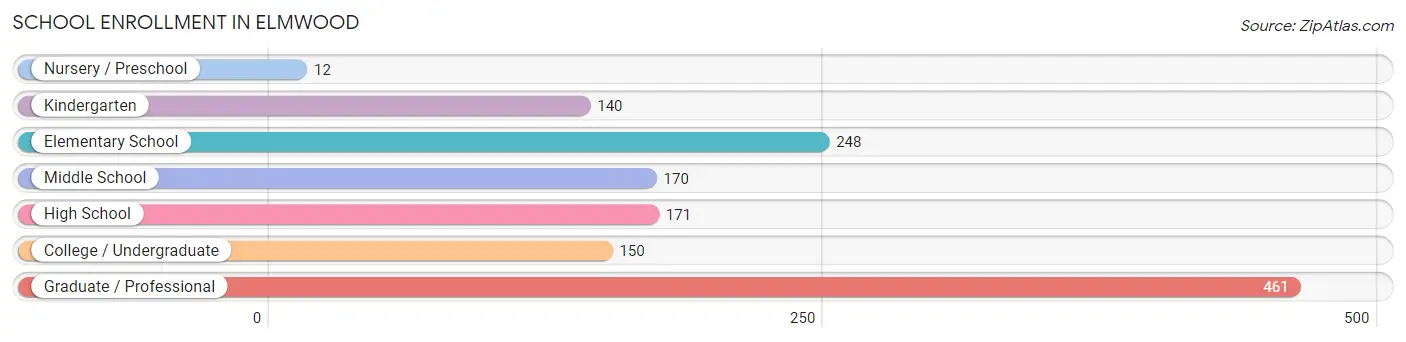
| School Level | # Students | % Students |
| Nursery / Preschool | 12 | 0.9% |
| Kindergarten | 140 | 10.4% |
| Elementary School | 248 | 18.3% |
| Middle School | 170 | 12.6% |
| High School | 171 | 12.7% |
| College / Undergraduate | 150 | 11.1% |
| Graduate / Professional | 461 | 34.1% |
| Total | 1,352 | 100.0% |
School Enrollment by Age by Funding Source in Elmwood
Out of a total of 1,352 students who are enrolled in schools in Elmwood, 742 (54.9%) attend a private institution, while the remaining 610 (45.1%) are enrolled in public schools. The age group of 25 to 34 year olds has the highest likelihood of being enrolled in private schools, with 383 (82.7% in the age bracket) enrolled. Conversely, the age group of 18 to 19 year olds has the lowest likelihood of being enrolled in a private school, with 17 (100.0% in the age bracket) attending a public institution.
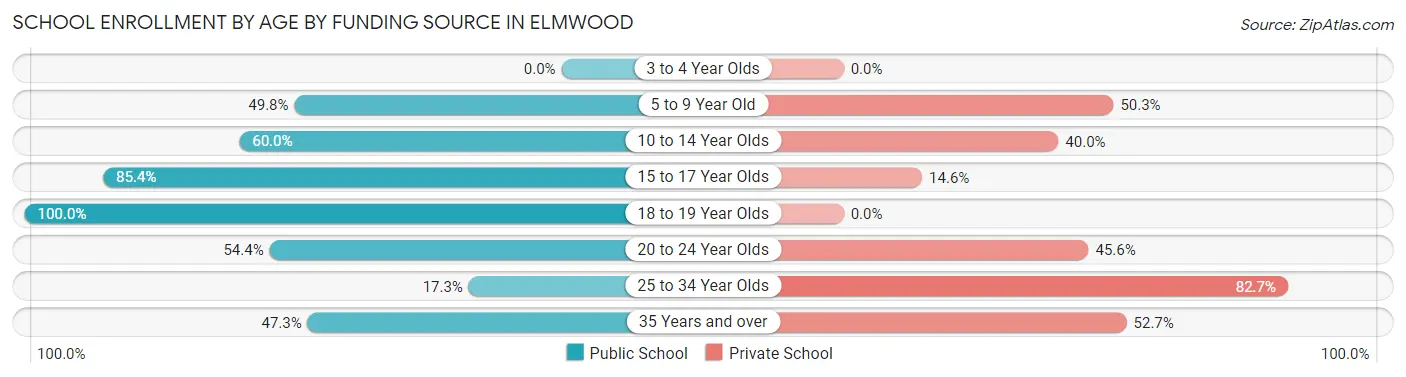
| Age Bracket | Public School | Private School |
| 3 to 4 Year Olds | 0 (0.0%) | 0 (0.0%) |
| 5 to 9 Year Old | 199 (49.7%) | 201 (50.2%) |
| 10 to 14 Year Olds | 102 (60.0%) | 68 (40.0%) |
| 15 to 17 Year Olds | 146 (85.4%) | 25 (14.6%) |
| 18 to 19 Year Olds | 17 (100.0%) | 0 (0.0%) |
| 20 to 24 Year Olds | 31 (54.4%) | 26 (45.6%) |
| 25 to 34 Year Olds | 80 (17.3%) | 383 (82.7%) |
| 35 Years and over | 35 (47.3%) | 39 (52.7%) |
| Total | 610 (45.1%) | 742 (54.9%) |
Educational Attainment by Field of Study in Elmwood
Social sciences (441 | 12.8%), liberal arts & history (390 | 11.3%), business (380 | 11.1%), science & technology (353 | 10.3%), and arts & humanities (316 | 9.2%) are the most common fields of study among 3,440 individuals in Elmwood who have obtained a bachelor's degree or higher.
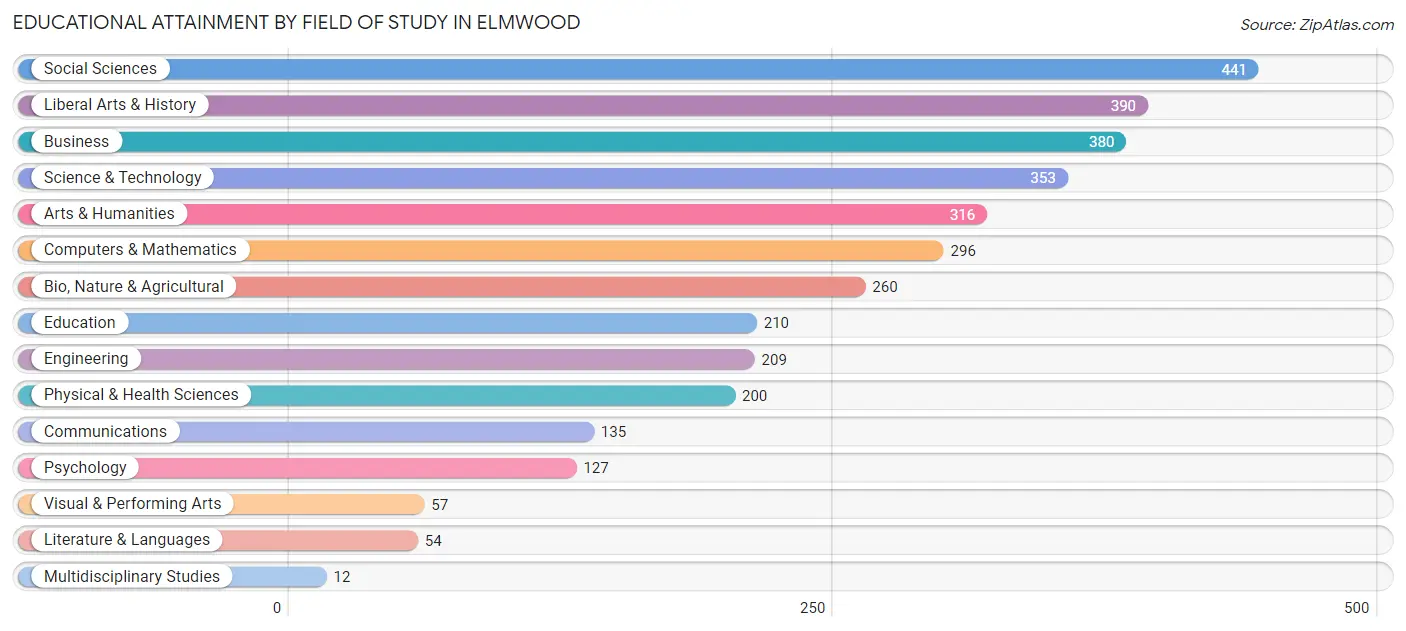
| Field of Study | # Graduates | % Graduates |
| Computers & Mathematics | 296 | 8.6% |
| Bio, Nature & Agricultural | 260 | 7.6% |
| Physical & Health Sciences | 200 | 5.8% |
| Psychology | 127 | 3.7% |
| Social Sciences | 441 | 12.8% |
| Engineering | 209 | 6.1% |
| Multidisciplinary Studies | 12 | 0.4% |
| Science & Technology | 353 | 10.3% |
| Business | 380 | 11.1% |
| Education | 210 | 6.1% |
| Literature & Languages | 54 | 1.6% |
| Liberal Arts & History | 390 | 11.3% |
| Visual & Performing Arts | 57 | 1.7% |
| Communications | 135 | 3.9% |
| Arts & Humanities | 316 | 9.2% |
| Total | 3,440 | 100.0% |
Transportation & Commute in Elmwood
Vehicle Availability by Sex in Elmwood
The most prevalent vehicle ownership categories in Elmwood are males with 1 vehicle (1,192, accounting for 60.3%) and females with 1 vehicle (1,049, making up 68.0%).
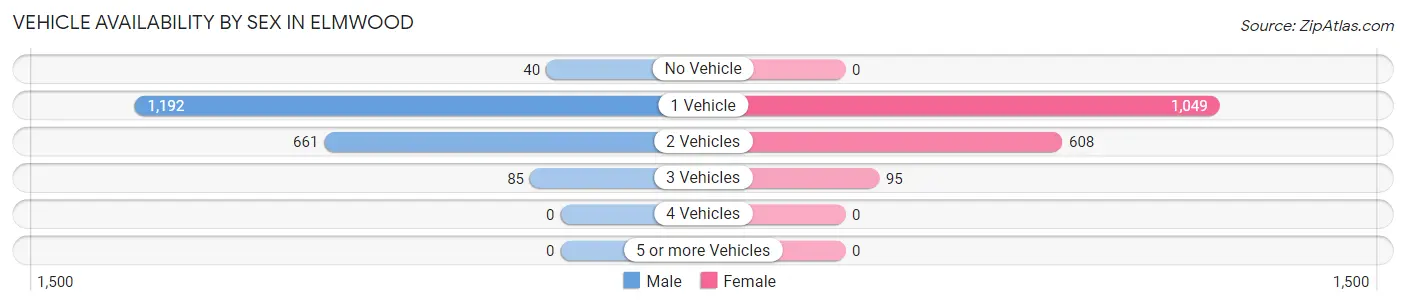
| Vehicles Available | Male | Female |
| No Vehicle | 40 (2.0%) | 0 (0.0%) |
| 1 Vehicle | 1,192 (60.3%) | 1,049 (59.9%) |
| 2 Vehicles | 661 (33.4%) | 608 (34.7%) |
| 3 Vehicles | 85 (4.3%) | 95 (5.4%) |
| 4 Vehicles | 0 (0.0%) | 0 (0.0%) |
| 5 or more Vehicles | 0 (0.0%) | 0 (0.0%) |
| Total | 1,978 (100.0%) | 1,752 (100.0%) |
Commute Time in Elmwood
The most frequently occuring commute durations in Elmwood are 20 to 24 minutes (1,101 commuters, 31.1%), 15 to 19 minutes (625 commuters, 17.7%), and 10 to 14 minutes (478 commuters, 13.5%).
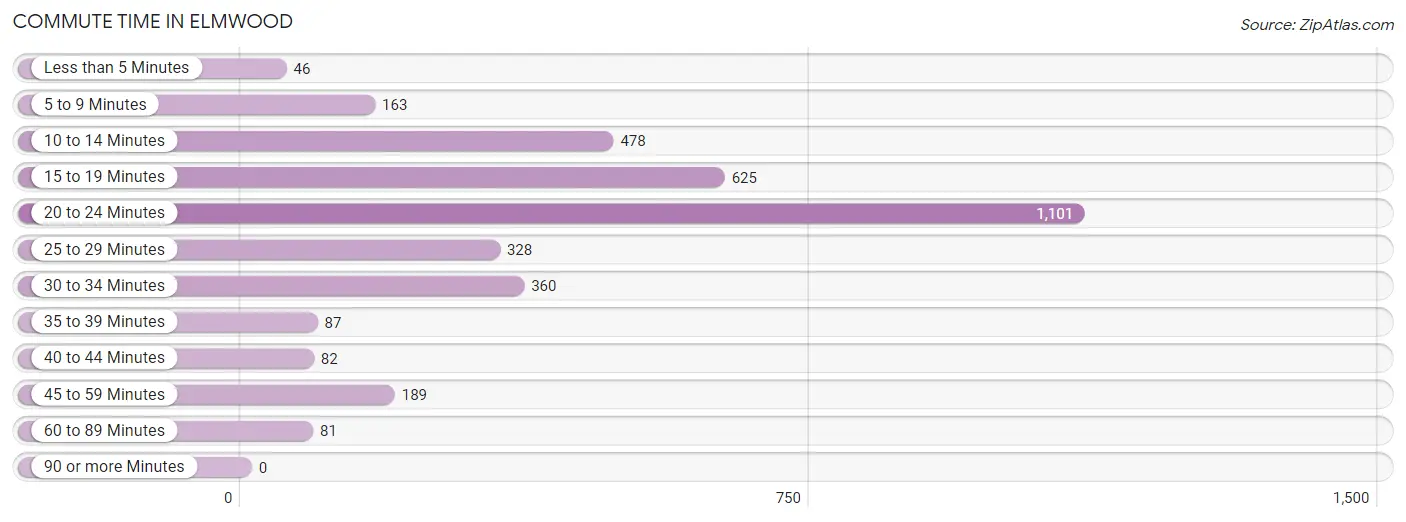
| Commute Time | # Commuters | % Commuters |
| Less than 5 Minutes | 46 | 1.3% |
| 5 to 9 Minutes | 163 | 4.6% |
| 10 to 14 Minutes | 478 | 13.5% |
| 15 to 19 Minutes | 625 | 17.7% |
| 20 to 24 Minutes | 1,101 | 31.1% |
| 25 to 29 Minutes | 328 | 9.3% |
| 30 to 34 Minutes | 360 | 10.2% |
| 35 to 39 Minutes | 87 | 2.5% |
| 40 to 44 Minutes | 82 | 2.3% |
| 45 to 59 Minutes | 189 | 5.3% |
| 60 to 89 Minutes | 81 | 2.3% |
| 90 or more Minutes | 0 | 0.0% |
Commute Time by Sex in Elmwood
The most common commute times in Elmwood are 20 to 24 minutes (467 commuters, 24.7%) for males and 20 to 24 minutes (634 commuters, 38.5%) for females.
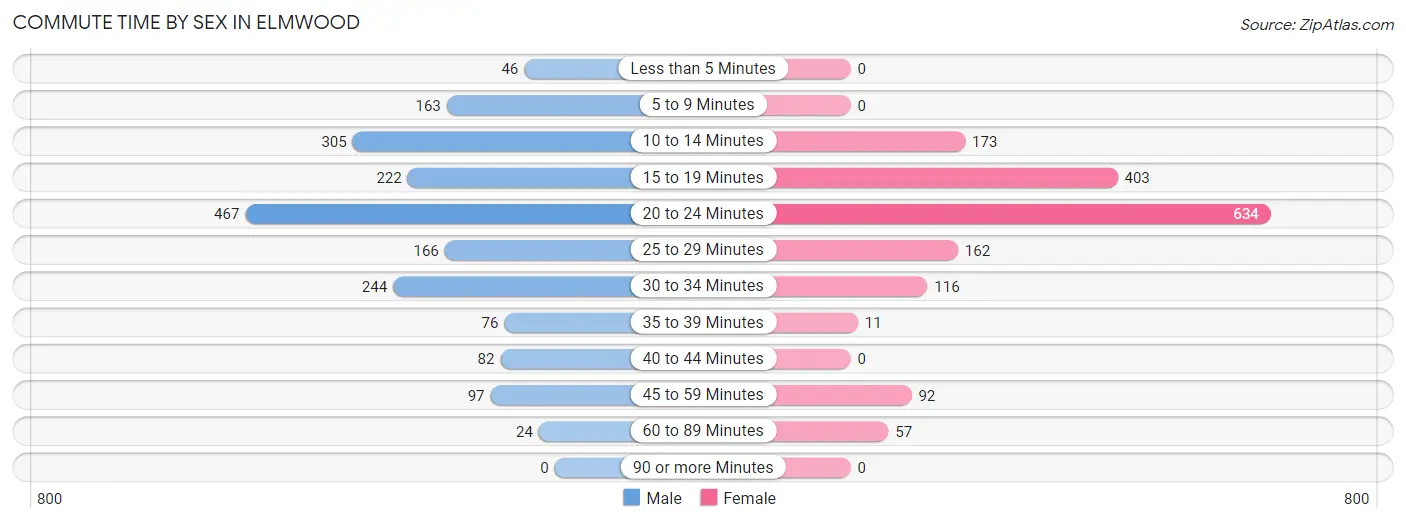
| Commute Time | Male | Female |
| Less than 5 Minutes | 46 (2.4%) | 0 (0.0%) |
| 5 to 9 Minutes | 163 (8.6%) | 0 (0.0%) |
| 10 to 14 Minutes | 305 (16.1%) | 173 (10.5%) |
| 15 to 19 Minutes | 222 (11.7%) | 403 (24.4%) |
| 20 to 24 Minutes | 467 (24.7%) | 634 (38.5%) |
| 25 to 29 Minutes | 166 (8.8%) | 162 (9.8%) |
| 30 to 34 Minutes | 244 (12.9%) | 116 (7.0%) |
| 35 to 39 Minutes | 76 (4.0%) | 11 (0.7%) |
| 40 to 44 Minutes | 82 (4.3%) | 0 (0.0%) |
| 45 to 59 Minutes | 97 (5.1%) | 92 (5.6%) |
| 60 to 89 Minutes | 24 (1.3%) | 57 (3.5%) |
| 90 or more Minutes | 0 (0.0%) | 0 (0.0%) |
Time of Departure to Work by Sex in Elmwood
The most frequent times of departure to work in Elmwood are 7:30 AM to 7:59 AM (330, 17.4%) for males and 8:00 AM to 8:29 AM (366, 22.2%) for females.
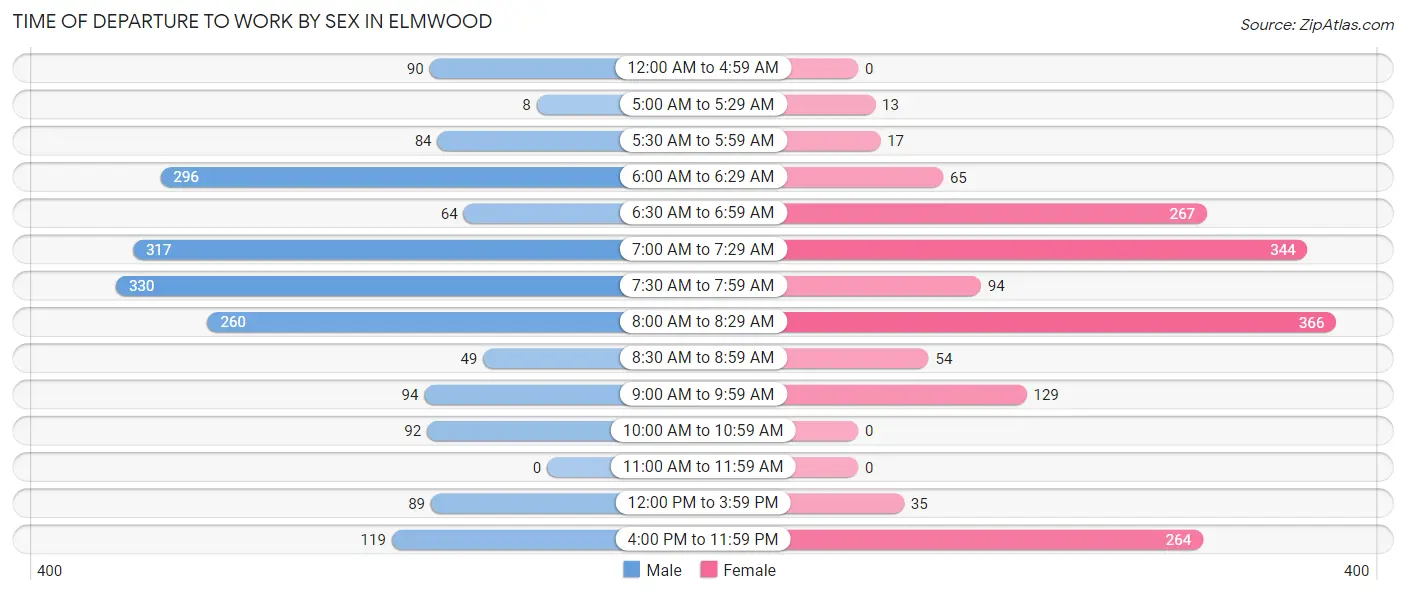
| Time of Departure | Male | Female |
| 12:00 AM to 4:59 AM | 90 (4.8%) | 0 (0.0%) |
| 5:00 AM to 5:29 AM | 8 (0.4%) | 13 (0.8%) |
| 5:30 AM to 5:59 AM | 84 (4.4%) | 17 (1.0%) |
| 6:00 AM to 6:29 AM | 296 (15.6%) | 65 (3.9%) |
| 6:30 AM to 6:59 AM | 64 (3.4%) | 267 (16.2%) |
| 7:00 AM to 7:29 AM | 317 (16.8%) | 344 (20.9%) |
| 7:30 AM to 7:59 AM | 330 (17.4%) | 94 (5.7%) |
| 8:00 AM to 8:29 AM | 260 (13.7%) | 366 (22.2%) |
| 8:30 AM to 8:59 AM | 49 (2.6%) | 54 (3.3%) |
| 9:00 AM to 9:59 AM | 94 (5.0%) | 129 (7.8%) |
| 10:00 AM to 10:59 AM | 92 (4.9%) | 0 (0.0%) |
| 11:00 AM to 11:59 AM | 0 (0.0%) | 0 (0.0%) |
| 12:00 PM to 3:59 PM | 89 (4.7%) | 35 (2.1%) |
| 4:00 PM to 11:59 PM | 119 (6.3%) | 264 (16.0%) |
| Total | 1,892 (100.0%) | 1,648 (100.0%) |
Housing Occupancy in Elmwood
Occupancy by Ownership in Elmwood
Of the total 3,462 dwellings in Elmwood, owner-occupied units account for 514 (14.8%), while renter-occupied units make up 2,948 (85.2%).
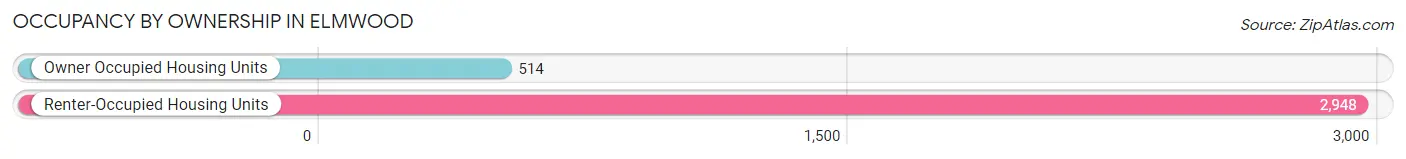
| Occupancy | # Housing Units | % Housing Units |
| Owner Occupied Housing Units | 514 | 14.8% |
| Renter-Occupied Housing Units | 2,948 | 85.2% |
| Total Occupied Housing Units | 3,462 | 100.0% |
Occupancy by Household Size in Elmwood
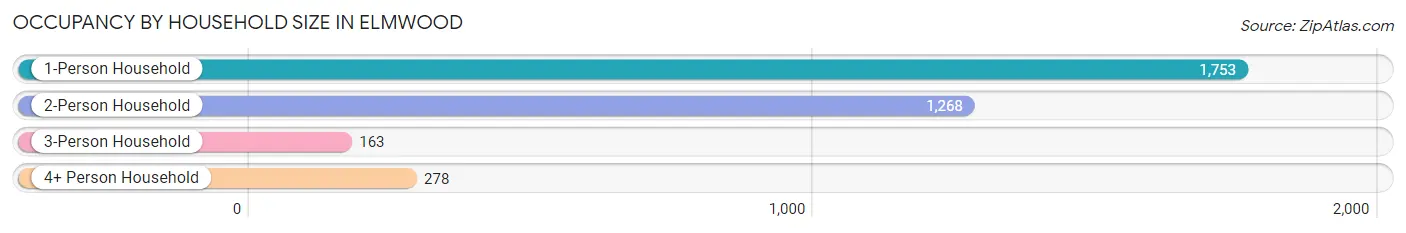
| Household Size | # Housing Units | % Housing Units |
| 1-Person Household | 1,753 | 50.6% |
| 2-Person Household | 1,268 | 36.6% |
| 3-Person Household | 163 | 4.7% |
| 4+ Person Household | 278 | 8.0% |
| Total Housing Units | 3,462 | 100.0% |
Occupancy by Ownership by Household Size in Elmwood
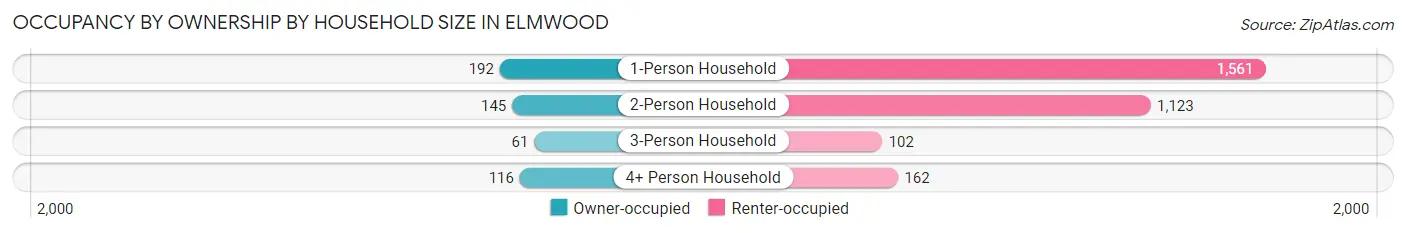
| Household Size | Owner-occupied | Renter-occupied |
| 1-Person Household | 192 (11.0%) | 1,561 (89.0%) |
| 2-Person Household | 145 (11.4%) | 1,123 (88.6%) |
| 3-Person Household | 61 (37.4%) | 102 (62.6%) |
| 4+ Person Household | 116 (41.7%) | 162 (58.3%) |
| Total Housing Units | 514 (14.8%) | 2,948 (85.2%) |
Occupancy by Educational Attainment in Elmwood
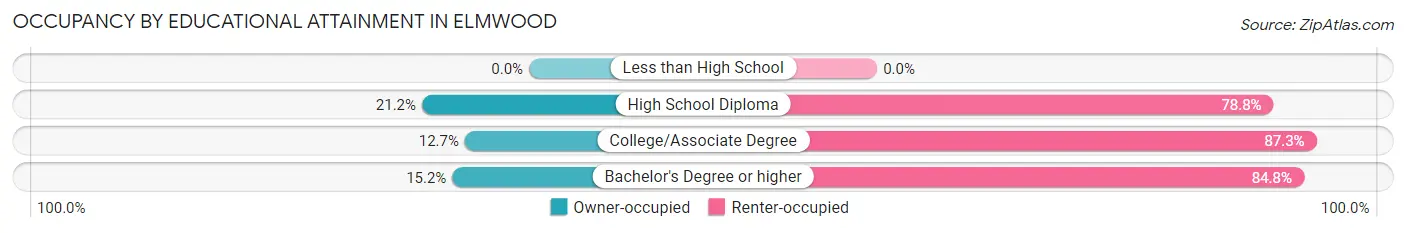
| Household Size | Owner-occupied | Renter-occupied |
| Less than High School | 0 (0.0%) | 0 (0.0%) |
| High School Diploma | 41 (21.2%) | 152 (78.8%) |
| College/Associate Degree | 125 (12.7%) | 858 (87.3%) |
| Bachelor's Degree or higher | 348 (15.2%) | 1,938 (84.8%) |
Occupancy by Age of Householder in Elmwood
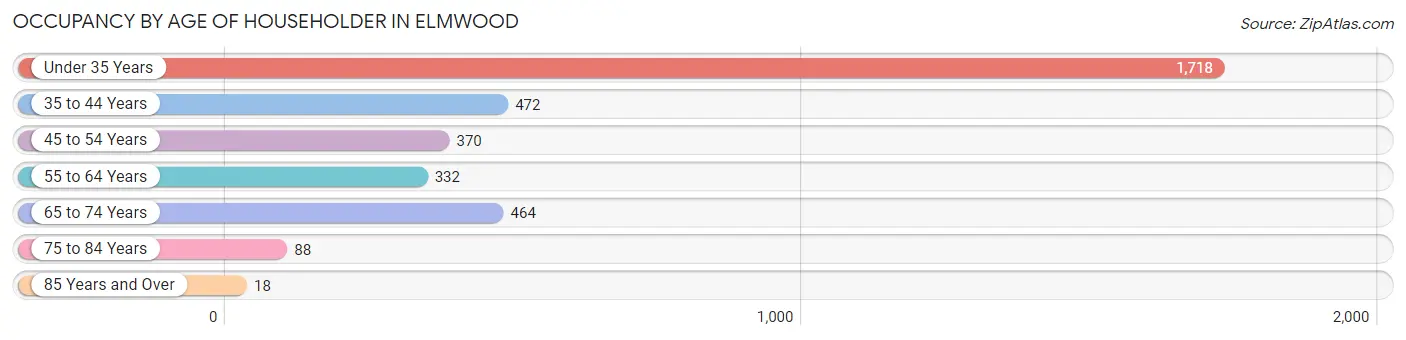
| Age Bracket | # Households | % Households |
| Under 35 Years | 1,718 | 49.6% |
| 35 to 44 Years | 472 | 13.6% |
| 45 to 54 Years | 370 | 10.7% |
| 55 to 64 Years | 332 | 9.6% |
| 65 to 74 Years | 464 | 13.4% |
| 75 to 84 Years | 88 | 2.5% |
| 85 Years and Over | 18 | 0.5% |
| Total | 3,462 | 100.0% |
Housing Finances in Elmwood
Median Income by Occupancy in Elmwood
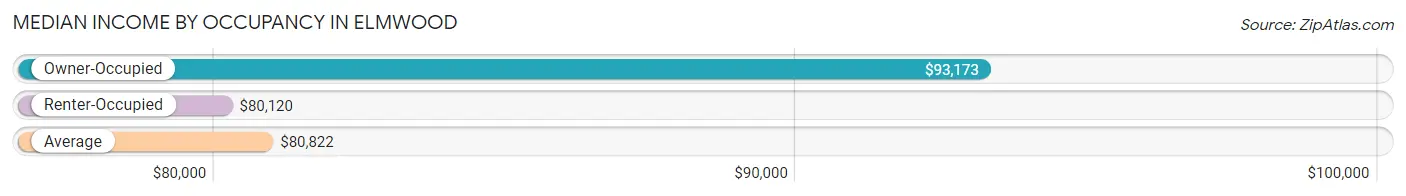
| Occupancy Type | # Households | Median Income |
| Owner-Occupied | 514 (14.8%) | $93,173 |
| Renter-Occupied | 2,948 (85.2%) | $80,120 |
| Average | 3,462 (100.0%) | $80,822 |
Occupancy by Householder Income Bracket in Elmwood
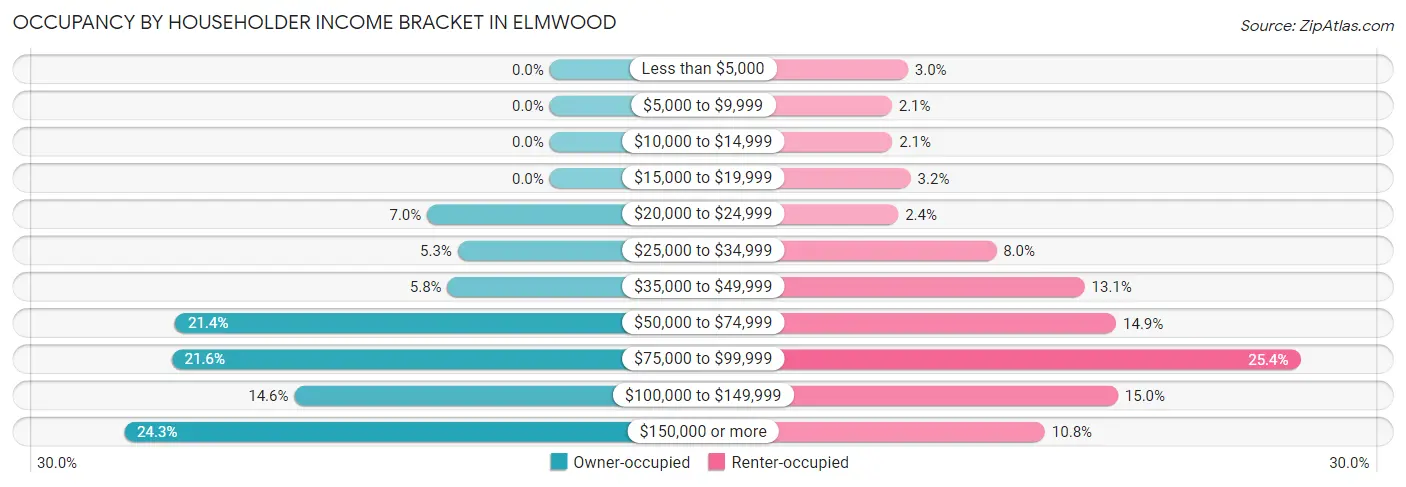
| Income Bracket | Owner-occupied | Renter-occupied |
| Less than $5,000 | 0 (0.0%) | 88 (3.0%) |
| $5,000 to $9,999 | 0 (0.0%) | 61 (2.1%) |
| $10,000 to $14,999 | 0 (0.0%) | 62 (2.1%) |
| $15,000 to $19,999 | 0 (0.0%) | 93 (3.2%) |
| $20,000 to $24,999 | 36 (7.0%) | 72 (2.4%) |
| $25,000 to $34,999 | 27 (5.2%) | 237 (8.0%) |
| $35,000 to $49,999 | 30 (5.8%) | 386 (13.1%) |
| $50,000 to $74,999 | 110 (21.4%) | 439 (14.9%) |
| $75,000 to $99,999 | 111 (21.6%) | 749 (25.4%) |
| $100,000 to $149,999 | 75 (14.6%) | 442 (15.0%) |
| $150,000 or more | 125 (24.3%) | 319 (10.8%) |
| Total | 514 (100.0%) | 2,948 (100.0%) |
Monthly Housing Cost Tiers in Elmwood
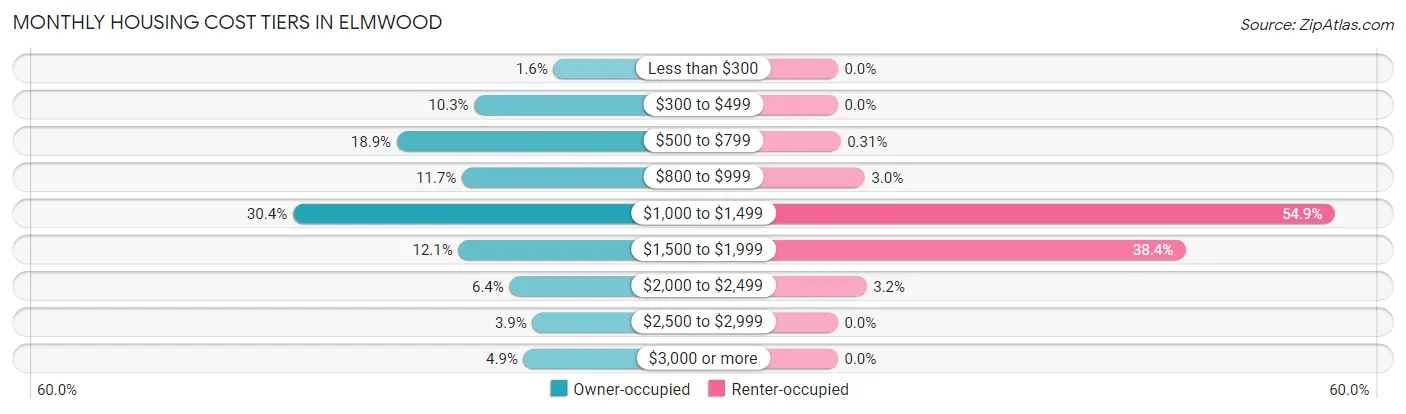
| Monthly Cost | Owner-occupied | Renter-occupied |
| Less than $300 | 8 (1.6%) | 0 (0.0%) |
| $300 to $499 | 53 (10.3%) | 0 (0.0%) |
| $500 to $799 | 97 (18.9%) | 9 (0.3%) |
| $800 to $999 | 60 (11.7%) | 88 (3.0%) |
| $1,000 to $1,499 | 156 (30.3%) | 1,618 (54.9%) |
| $1,500 to $1,999 | 62 (12.1%) | 1,132 (38.4%) |
| $2,000 to $2,499 | 33 (6.4%) | 94 (3.2%) |
| $2,500 to $2,999 | 20 (3.9%) | 0 (0.0%) |
| $3,000 or more | 25 (4.9%) | 0 (0.0%) |
| Total | 514 (100.0%) | 2,948 (100.0%) |
Physical Housing Characteristics in Elmwood
Housing Structures in Elmwood
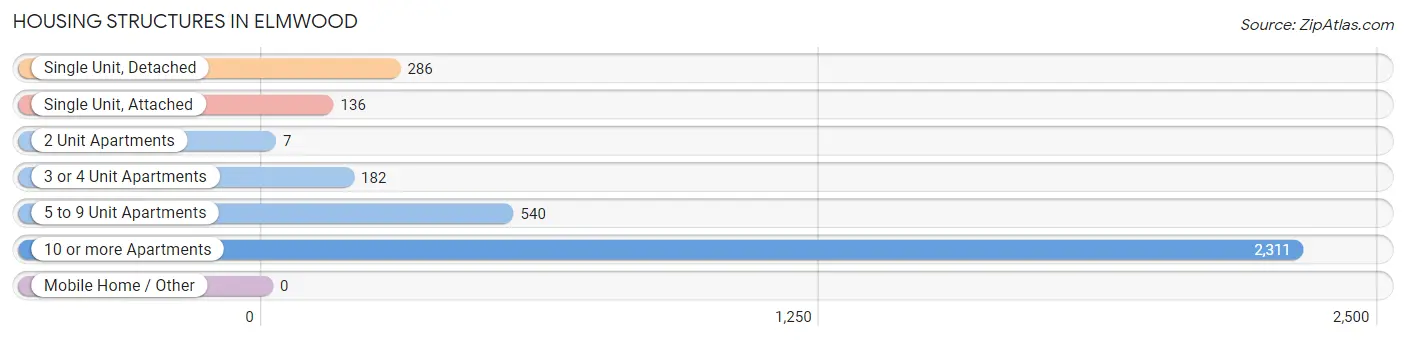
| Structure Type | # Housing Units | % Housing Units |
| Single Unit, Detached | 286 | 8.3% |
| Single Unit, Attached | 136 | 3.9% |
| 2 Unit Apartments | 7 | 0.2% |
| 3 or 4 Unit Apartments | 182 | 5.3% |
| 5 to 9 Unit Apartments | 540 | 15.6% |
| 10 or more Apartments | 2,311 | 66.7% |
| Mobile Home / Other | 0 | 0.0% |
| Total | 3,462 | 100.0% |
Housing Structures by Occupancy in Elmwood
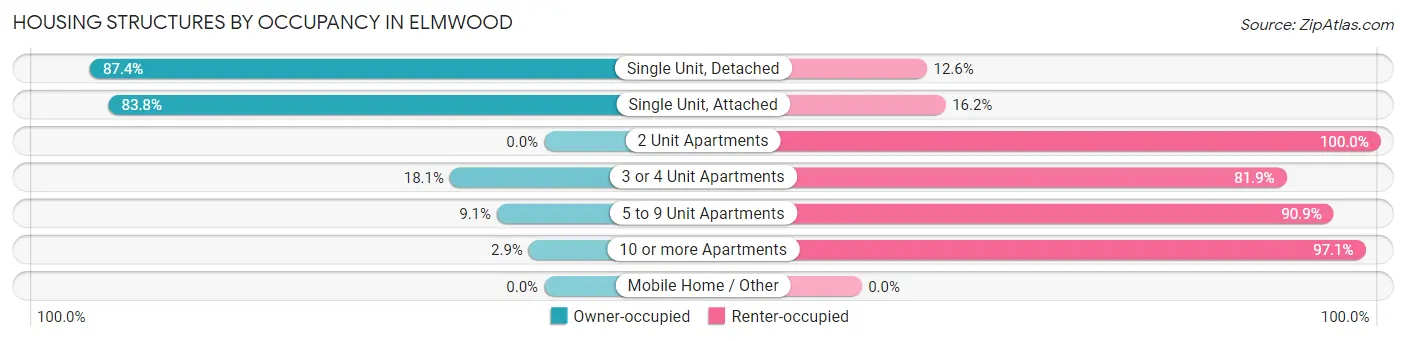
| Structure Type | Owner-occupied | Renter-occupied |
| Single Unit, Detached | 250 (87.4%) | 36 (12.6%) |
| Single Unit, Attached | 114 (83.8%) | 22 (16.2%) |
| 2 Unit Apartments | 0 (0.0%) | 7 (100.0%) |
| 3 or 4 Unit Apartments | 33 (18.1%) | 149 (81.9%) |
| 5 to 9 Unit Apartments | 49 (9.1%) | 491 (90.9%) |
| 10 or more Apartments | 68 (2.9%) | 2,243 (97.1%) |
| Mobile Home / Other | 0 (0.0%) | 0 (0.0%) |
| Total | 514 (14.8%) | 2,948 (85.2%) |
Housing Structures by Number of Rooms in Elmwood
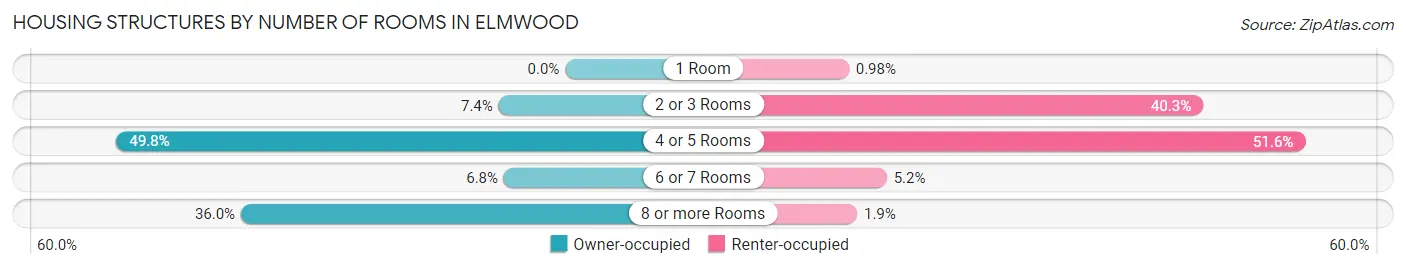
| Number of Rooms | Owner-occupied | Renter-occupied |
| 1 Room | 0 (0.0%) | 29 (1.0%) |
| 2 or 3 Rooms | 38 (7.4%) | 1,188 (40.3%) |
| 4 or 5 Rooms | 256 (49.8%) | 1,522 (51.6%) |
| 6 or 7 Rooms | 35 (6.8%) | 153 (5.2%) |
| 8 or more Rooms | 185 (36.0%) | 56 (1.9%) |
| Total | 514 (100.0%) | 2,948 (100.0%) |
Housing Structure by Heating Type in Elmwood
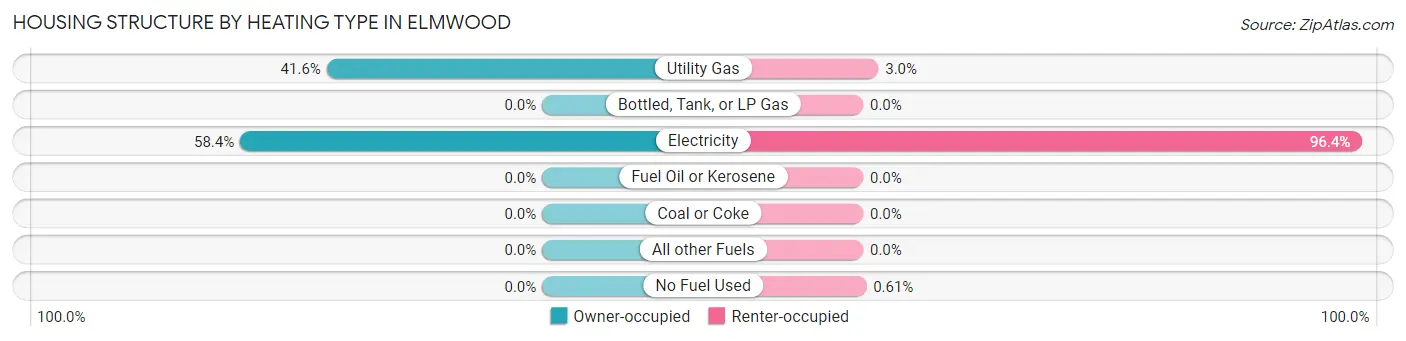
| Heating Type | Owner-occupied | Renter-occupied |
| Utility Gas | 214 (41.6%) | 87 (2.9%) |
| Bottled, Tank, or LP Gas | 0 (0.0%) | 0 (0.0%) |
| Electricity | 300 (58.4%) | 2,843 (96.4%) |
| Fuel Oil or Kerosene | 0 (0.0%) | 0 (0.0%) |
| Coal or Coke | 0 (0.0%) | 0 (0.0%) |
| All other Fuels | 0 (0.0%) | 0 (0.0%) |
| No Fuel Used | 0 (0.0%) | 18 (0.6%) |
| Total | 514 (100.0%) | 2,948 (100.0%) |
Household Vehicle Usage in Elmwood
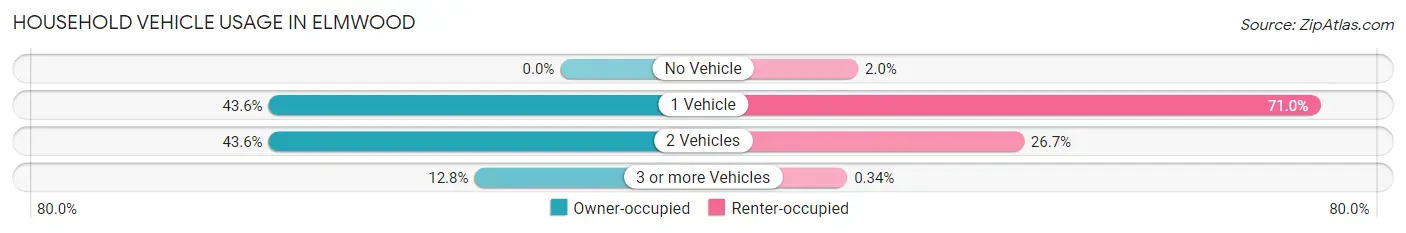
| Vehicles per Household | Owner-occupied | Renter-occupied |
| No Vehicle | 0 (0.0%) | 58 (2.0%) |
| 1 Vehicle | 224 (43.6%) | 2,092 (71.0%) |
| 2 Vehicles | 224 (43.6%) | 788 (26.7%) |
| 3 or more Vehicles | 66 (12.8%) | 10 (0.3%) |
| Total | 514 (100.0%) | 2,948 (100.0%) |
Real Estate & Mortgages in Elmwood
Real Estate and Mortgage Overview in Elmwood
| Characteristic | Without Mortgage | With Mortgage |
| Housing Units | 158 | 356 |
| Median Property Value | $167,500 | $198,800 |
| Median Household Income | $66,750 | $88 |
| Monthly Housing Costs | $553 | $25 |
| Real Estate Taxes | - | - |
Property Value by Mortgage Status in Elmwood
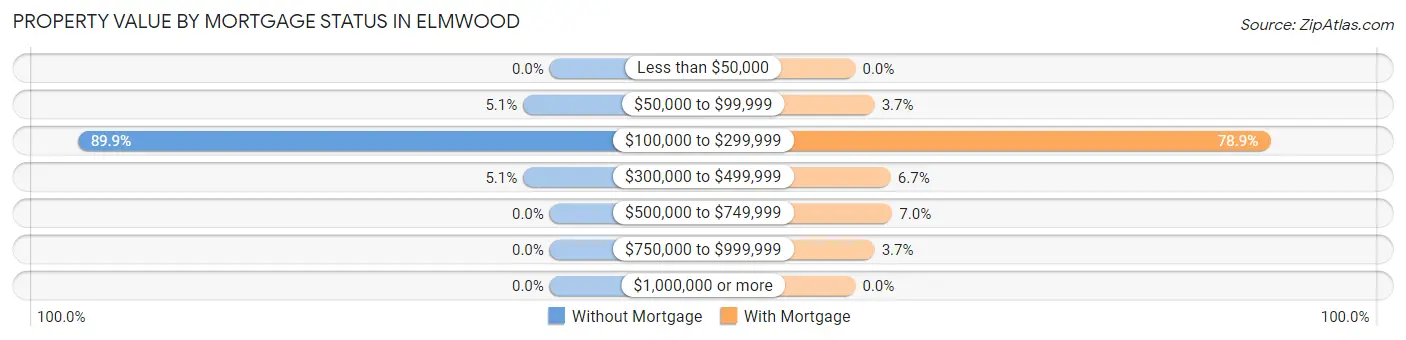
| Property Value | Without Mortgage | With Mortgage |
| Less than $50,000 | 0 (0.0%) | 0 (0.0%) |
| $50,000 to $99,999 | 8 (5.1%) | 13 (3.6%) |
| $100,000 to $299,999 | 142 (89.9%) | 281 (78.9%) |
| $300,000 to $499,999 | 8 (5.1%) | 24 (6.7%) |
| $500,000 to $749,999 | 0 (0.0%) | 25 (7.0%) |
| $750,000 to $999,999 | 0 (0.0%) | 13 (3.6%) |
| $1,000,000 or more | 0 (0.0%) | 0 (0.0%) |
| Total | 158 (100.0%) | 356 (100.0%) |
Household Income by Mortgage Status in Elmwood
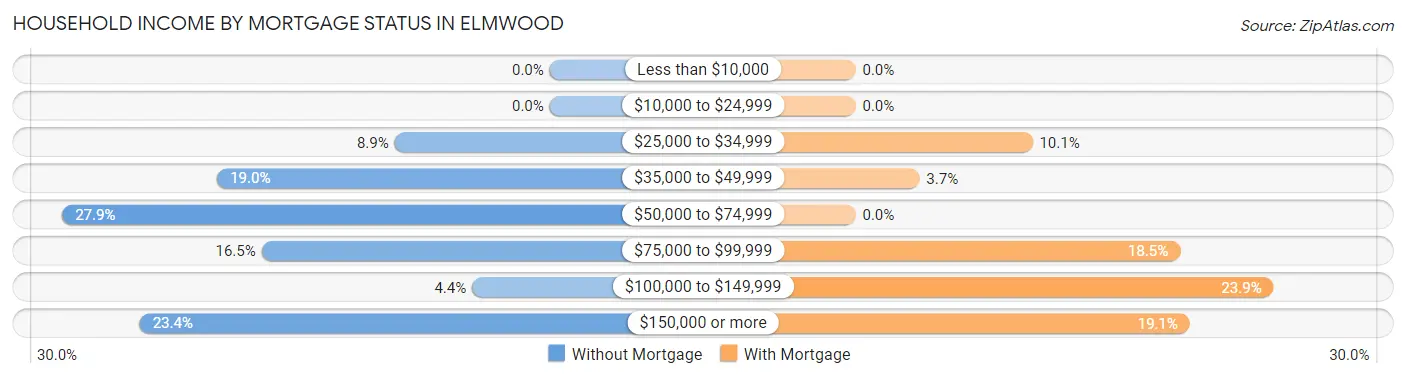
| Household Income | Without Mortgage | With Mortgage |
| Less than $10,000 | 0 (0.0%) | 0 (0.0%) |
| $10,000 to $24,999 | 0 (0.0%) | 0 (0.0%) |
| $25,000 to $34,999 | 14 (8.9%) | 36 (10.1%) |
| $35,000 to $49,999 | 30 (19.0%) | 13 (3.6%) |
| $50,000 to $74,999 | 44 (27.9%) | 0 (0.0%) |
| $75,000 to $99,999 | 26 (16.5%) | 66 (18.5%) |
| $100,000 to $149,999 | 7 (4.4%) | 85 (23.9%) |
| $150,000 or more | 37 (23.4%) | 68 (19.1%) |
| Total | 158 (100.0%) | 356 (100.0%) |
Property Value to Household Income Ratio in Elmwood
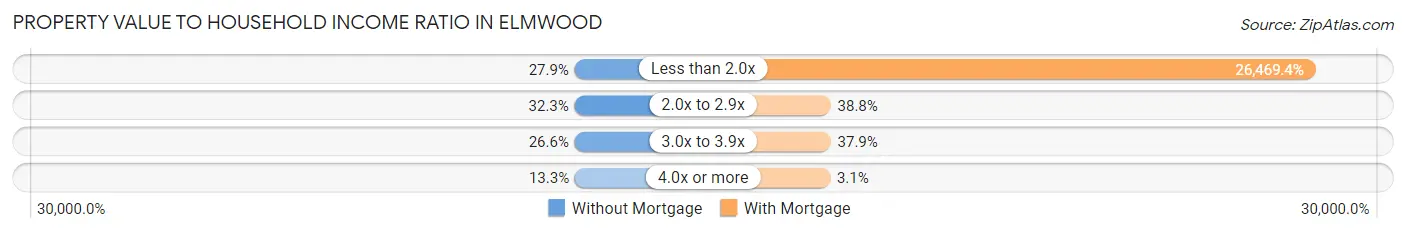
| Value-to-Income Ratio | Without Mortgage | With Mortgage |
| Less than 2.0x | 44 (27.9%) | 94,231 (26,469.4%) |
| 2.0x to 2.9x | 51 (32.3%) | 138 (38.8%) |
| 3.0x to 3.9x | 42 (26.6%) | 135 (37.9%) |
| 4.0x or more | 21 (13.3%) | 11 (3.1%) |
| Total | 158 (100.0%) | 356 (100.0%) |
Real Estate Taxes by Mortgage Status in Elmwood
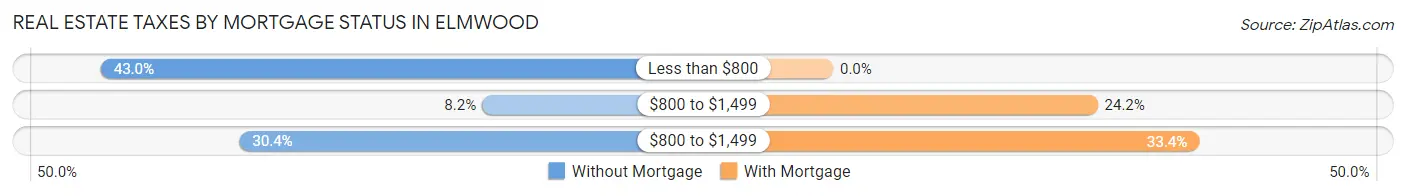
| Property Taxes | Without Mortgage | With Mortgage |
| Less than $800 | 68 (43.0%) | 0 (0.0%) |
| $800 to $1,499 | 13 (8.2%) | 86 (24.2%) |
| $800 to $1,499 | 48 (30.4%) | 119 (33.4%) |
| Total | 158 (100.0%) | 356 (100.0%) |
Health & Disability in Elmwood
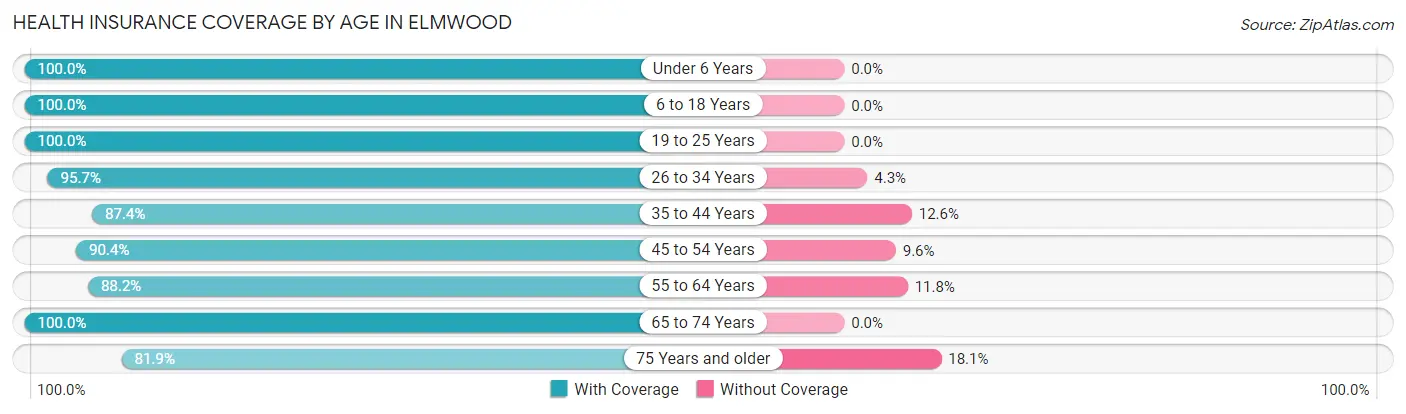
Health Insurance Coverage by Age in Elmwood
| Age Bracket | With Coverage | Without Coverage |
| Under 6 Years | 491 (100.0%) | 0 (0.0%) |
| 6 to 18 Years | 603 (100.0%) | 0 (0.0%) |
| 19 to 25 Years | 666 (100.0%) | 0 (0.0%) |
| 26 to 34 Years | 1,936 (95.7%) | 87 (4.3%) |
| 35 to 44 Years | 465 (87.4%) | 67 (12.6%) |
| 45 to 54 Years | 433 (90.4%) | 46 (9.6%) |
| 55 to 64 Years | 470 (88.2%) | 63 (11.8%) |
| 65 to 74 Years | 551 (100.0%) | 0 (0.0%) |
| 75 Years and older | 154 (81.9%) | 34 (18.1%) |
| Total | 5,769 (95.1%) | 297 (4.9%) |
Health Insurance Coverage by Citizenship Status in Elmwood
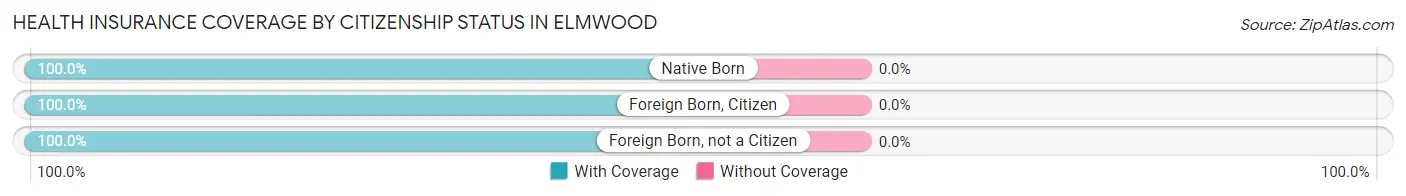
| Citizenship Status | With Coverage | Without Coverage |
| Native Born | 491 (100.0%) | 0 (0.0%) |
| Foreign Born, Citizen | 603 (100.0%) | 0 (0.0%) |
| Foreign Born, not a Citizen | 666 (100.0%) | 0 (0.0%) |
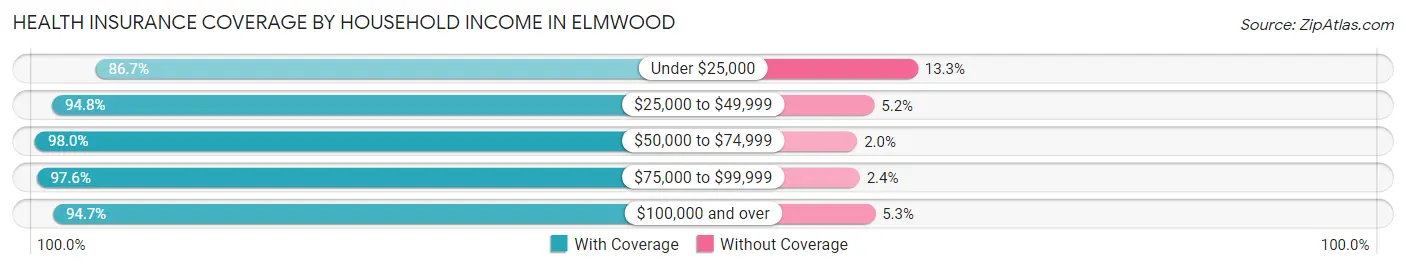
Health Insurance Coverage by Household Income in Elmwood
| Household Income | With Coverage | Without Coverage |
| Under $25,000 | 554 (86.7%) | 85 (13.3%) |
| $25,000 to $49,999 | 1,192 (94.8%) | 65 (5.2%) |
| $50,000 to $74,999 | 852 (98.0%) | 17 (2.0%) |
| $75,000 to $99,999 | 1,534 (97.6%) | 38 (2.4%) |
| $100,000 and over | 1,637 (94.7%) | 92 (5.3%) |
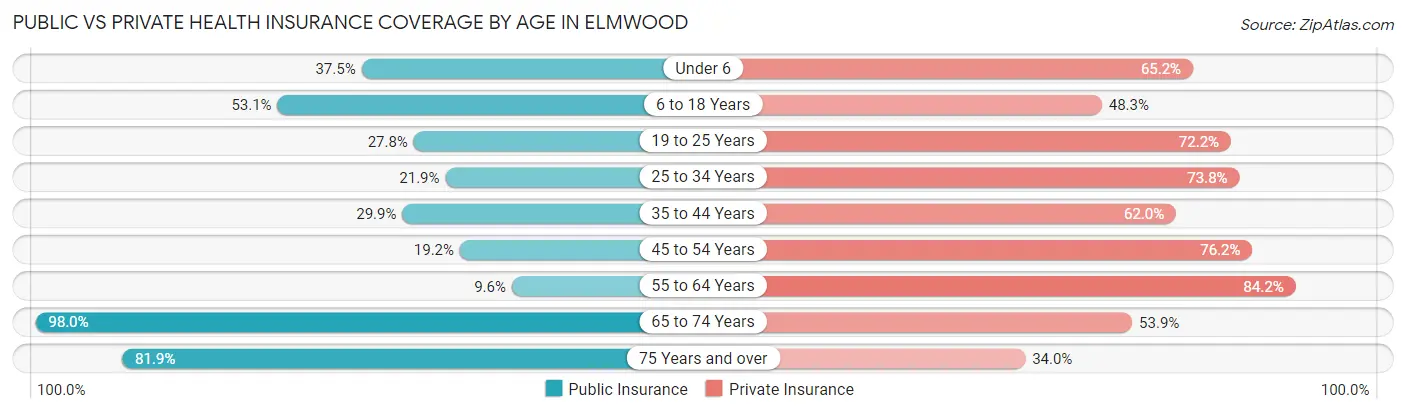
Public vs Private Health Insurance Coverage by Age in Elmwood
| Age Bracket | Public Insurance | Private Insurance |
| Under 6 | 184 (37.5%) | 320 (65.2%) |
| 6 to 18 Years | 320 (53.1%) | 291 (48.3%) |
| 19 to 25 Years | 185 (27.8%) | 481 (72.2%) |
| 25 to 34 Years | 443 (21.9%) | 1,493 (73.8%) |
| 35 to 44 Years | 159 (29.9%) | 330 (62.0%) |
| 45 to 54 Years | 92 (19.2%) | 365 (76.2%) |
| 55 to 64 Years | 51 (9.6%) | 449 (84.2%) |
| 65 to 74 Years | 540 (98.0%) | 297 (53.9%) |
| 75 Years and over | 154 (81.9%) | 64 (34.0%) |
| Total | 2,128 (35.1%) | 4,090 (67.4%) |
Disability Status by Sex by Age in Elmwood
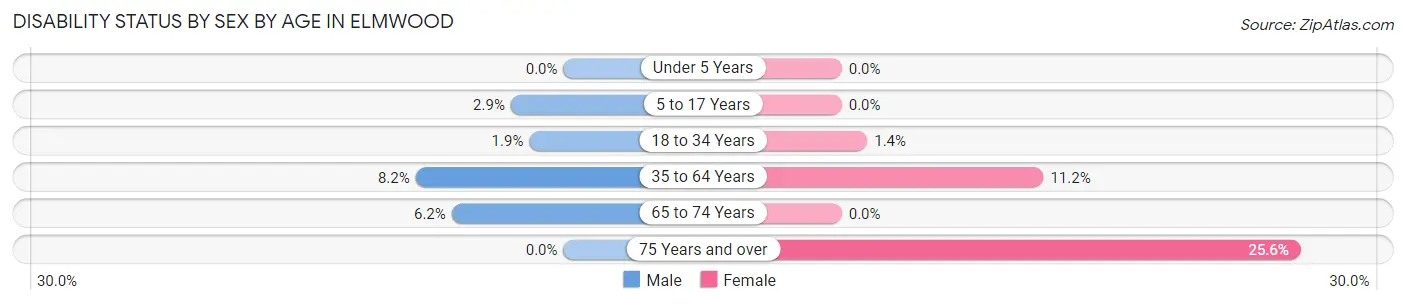
| Age Bracket | Male | Female |
| Under 5 Years | 0 (0.0%) | 0 (0.0%) |
| 5 to 17 Years | 13 (2.9%) | 0 (0.0%) |
| 18 to 34 Years | 23 (1.9%) | 21 (1.4%) |
| 35 to 64 Years | 64 (8.2%) | 86 (11.2%) |
| 65 to 74 Years | 13 (6.2%) | 0 (0.0%) |
| 75 Years and over | 0 (0.0%) | 35 (25.6%) |
Disability Class by Sex by Age in Elmwood
Disability Class: Hearing Difficulty
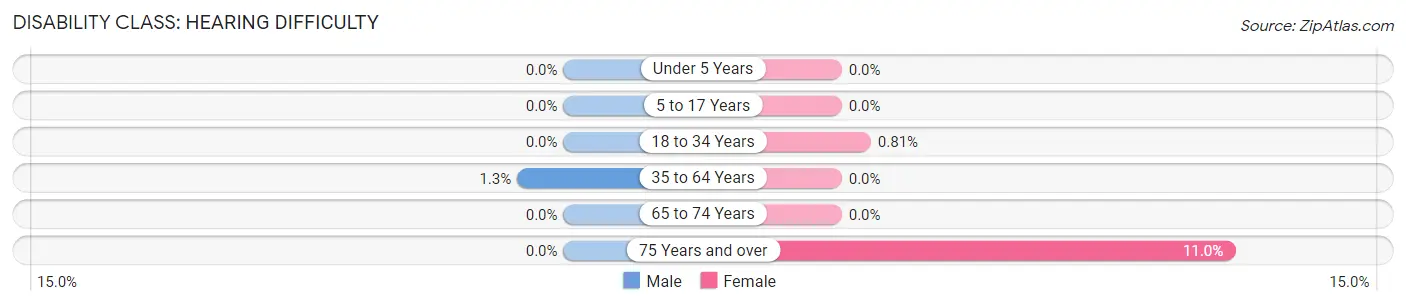
| Age Bracket | Male | Female |
| Under 5 Years | 0 (0.0%) | 0 (0.0%) |
| 5 to 17 Years | 0 (0.0%) | 0 (0.0%) |
| 18 to 34 Years | 0 (0.0%) | 12 (0.8%) |
| 35 to 64 Years | 10 (1.3%) | 0 (0.0%) |
| 65 to 74 Years | 0 (0.0%) | 0 (0.0%) |
| 75 Years and over | 0 (0.0%) | 15 (11.0%) |
Disability Class: Vision Difficulty
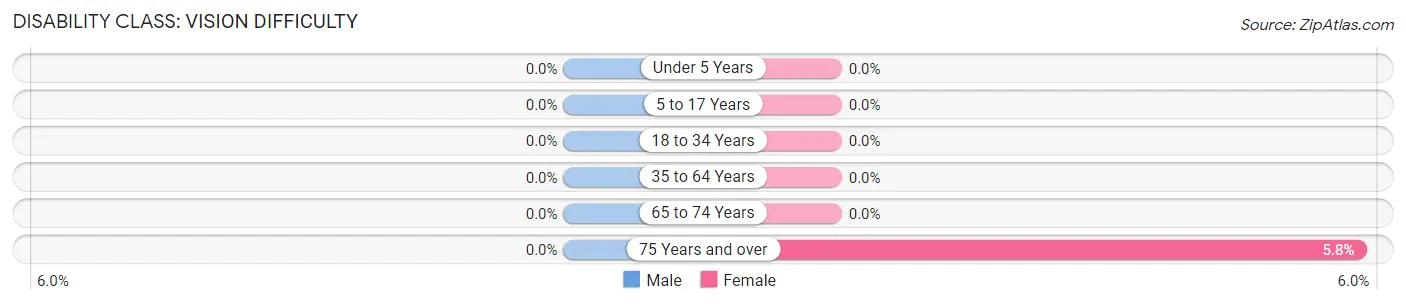
| Age Bracket | Male | Female |
| Under 5 Years | 0 (0.0%) | 0 (0.0%) |
| 5 to 17 Years | 0 (0.0%) | 0 (0.0%) |
| 18 to 34 Years | 0 (0.0%) | 0 (0.0%) |
| 35 to 64 Years | 0 (0.0%) | 0 (0.0%) |
| 65 to 74 Years | 0 (0.0%) | 0 (0.0%) |
| 75 Years and over | 0 (0.0%) | 8 (5.8%) |
Disability Class: Cognitive Difficulty
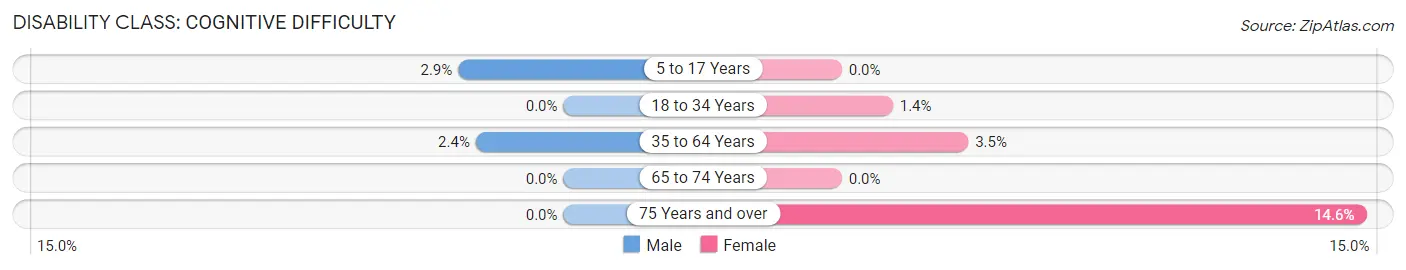
| Age Bracket | Male | Female |
| 5 to 17 Years | 13 (2.9%) | 0 (0.0%) |
| 18 to 34 Years | 0 (0.0%) | 21 (1.4%) |
| 35 to 64 Years | 19 (2.4%) | 27 (3.5%) |
| 65 to 74 Years | 0 (0.0%) | 0 (0.0%) |
| 75 Years and over | 0 (0.0%) | 20 (14.6%) |
Disability Class: Ambulatory Difficulty
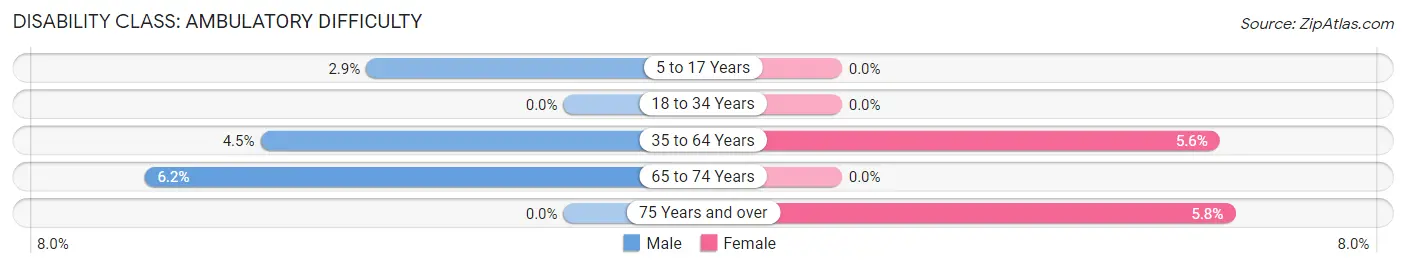
| Age Bracket | Male | Female |
| 5 to 17 Years | 13 (2.9%) | 0 (0.0%) |
| 18 to 34 Years | 0 (0.0%) | 0 (0.0%) |
| 35 to 64 Years | 35 (4.5%) | 43 (5.6%) |
| 65 to 74 Years | 13 (6.2%) | 0 (0.0%) |
| 75 Years and over | 0 (0.0%) | 8 (5.8%) |
Disability Class: Self-Care Difficulty
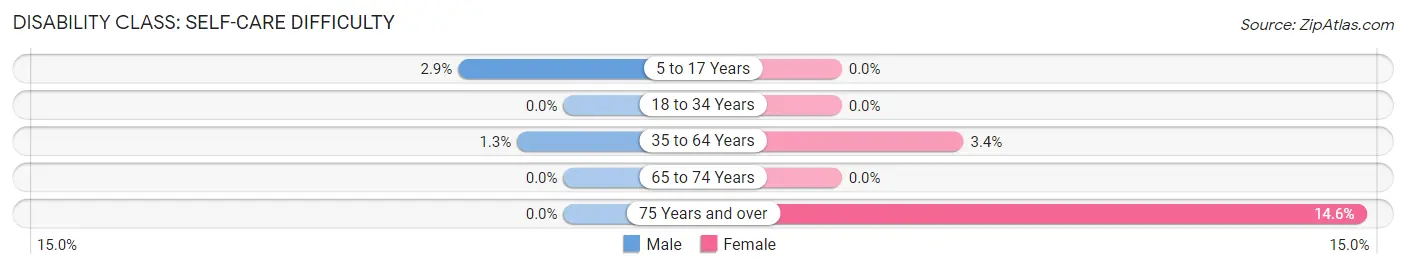
| Age Bracket | Male | Female |
| 5 to 17 Years | 13 (2.9%) | 0 (0.0%) |
| 18 to 34 Years | 0 (0.0%) | 0 (0.0%) |
| 35 to 64 Years | 10 (1.3%) | 26 (3.4%) |
| 65 to 74 Years | 0 (0.0%) | 0 (0.0%) |
| 75 Years and over | 0 (0.0%) | 20 (14.6%) |
Technology Access in Elmwood
Computing Device Access in Elmwood
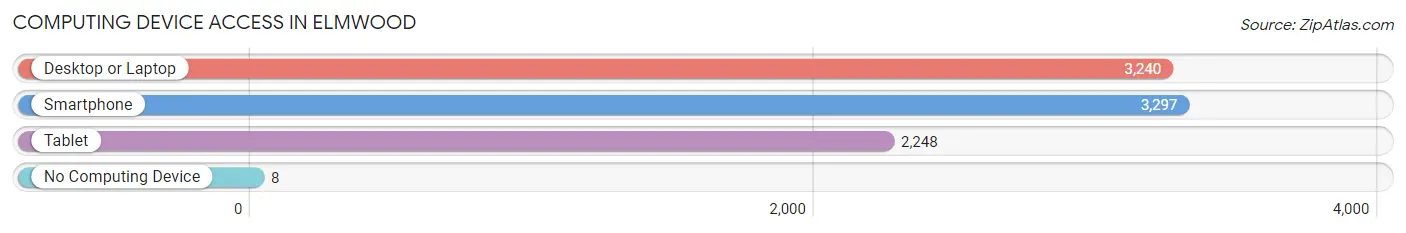
| Device Type | # Households | % Households |
| Desktop or Laptop | 3,240 | 93.6% |
| Smartphone | 3,297 | 95.2% |
| Tablet | 2,248 | 64.9% |
| No Computing Device | 8 | 0.2% |
| Total | 3,462 | 100.0% |
Internet Access in Elmwood
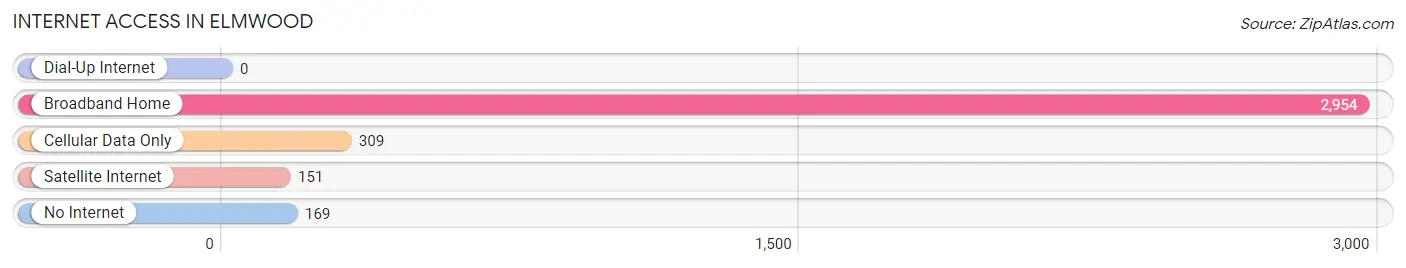
| Internet Type | # Households | % Households |
| Dial-Up Internet | 0 | 0.0% |
| Broadband Home | 2,954 | 85.3% |
| Cellular Data Only | 309 | 8.9% |
| Satellite Internet | 151 | 4.4% |
| No Internet | 169 | 4.9% |
| Total | 3,462 | 100.0% |
Elmwood Summary
Elmwood is a small unincorporated community located in Jefferson Parish, Louisiana. It is situated on the west bank of the Mississippi River, just south of the city of New Orleans. The community is part of the New Orleans–Metairie–Kenner Metropolitan Statistical Area.
History
Elmwood was founded in the early 19th century by French settlers. The community was named after the elm trees that grew in the area. The area was originally part of the plantation of Jean Baptiste Le Moyne de Bienville, the founder of New Orleans. In the early 20th century, the area was developed as a residential suburb of New Orleans.
Geography
Elmwood is located in Jefferson Parish, Louisiana, on the west bank of the Mississippi River. It is situated just south of the city of New Orleans. The community is part of the New Orleans–Metairie–Kenner Metropolitan Statistical Area. The area is characterized by flat terrain and is located at an elevation of approximately 10 feet above sea level.
Economy
Elmwood is primarily a residential community, with most of its residents commuting to nearby New Orleans for work. The area is home to a number of small businesses, including restaurants, convenience stores, and auto repair shops. The community is also home to a number of industrial and manufacturing facilities, including a chemical plant and a paper mill.
Demographics
As of the 2010 census, the population of Elmwood was 8,945. The racial makeup of the community was 79.3% White, 15.2% African American, 0.7% Native American, 1.2% Asian, 0.1% Pacific Islander, and 3.5% from other races. The median household income was $45,945, and the median family income was $54,945. The per capita income was $25,945.
Conclusion
Elmwood is a small unincorporated community located in Jefferson Parish, Louisiana. It is situated on the west bank of the Mississippi River, just south of the city of New Orleans. The community was founded in the early 19th century by French settlers and is characterized by flat terrain and is located at an elevation of approximately 10 feet above sea level. Elmwood is primarily a residential community, with most of its residents commuting to nearby New Orleans for work. The area is home to a number of small businesses, including restaurants, convenience stores, and auto repair shops. As of the 2010 census, the population of Elmwood was 8,945, with a median household income of $45,945 and a median family income of $54,945.
Common Questions
What is Per Capita Income in Elmwood?
Per Capita income in Elmwood is $46,466.
What is the Median Family Income in Elmwood?
Median Family Income in Elmwood is $88,836.
What is the Median Household income in Elmwood?
Median Household Income in Elmwood is $80,822.
What is Income or Wage Gap in Elmwood?
Income or Wage Gap in Elmwood is 14.1%.
Women in Elmwood earn 85.9 cents for every dollar earned by a man.
What is Inequality or Gini Index in Elmwood?
Inequality or Gini Index in Elmwood is 0.36.
What is the Total Population of Elmwood?
Total Population of Elmwood is 6,081.
What is the Total Male Population of Elmwood?
Total Male Population of Elmwood is 2,832.
What is the Total Female Population of Elmwood?
Total Female Population of Elmwood is 3,249.
What is the Ratio of Males per 100 Females in Elmwood?
There are 87.17 Males per 100 Females in Elmwood.
What is the Ratio of Females per 100 Males in Elmwood?
There are 114.72 Females per 100 Males in Elmwood.
What is the Median Population Age in Elmwood?
Median Population Age in Elmwood is 32.1 Years.
What is the Average Family Size in Elmwood
Average Family Size in Elmwood is 2.8 People.
What is the Average Household Size in Elmwood
Average Household Size in Elmwood is 1.8 People.
How Large is the Labor Force in Elmwood?
There are 4,065 People in the Labor Forcein in Elmwood.
What is the Percentage of People in the Labor Force in Elmwood?
79.0% of People are in the Labor Force in Elmwood.
What is the Unemployment Rate in Elmwood?
Unemployment Rate in Elmwood is 6.5%.