Lake Sherwood, WI Map & Demographics
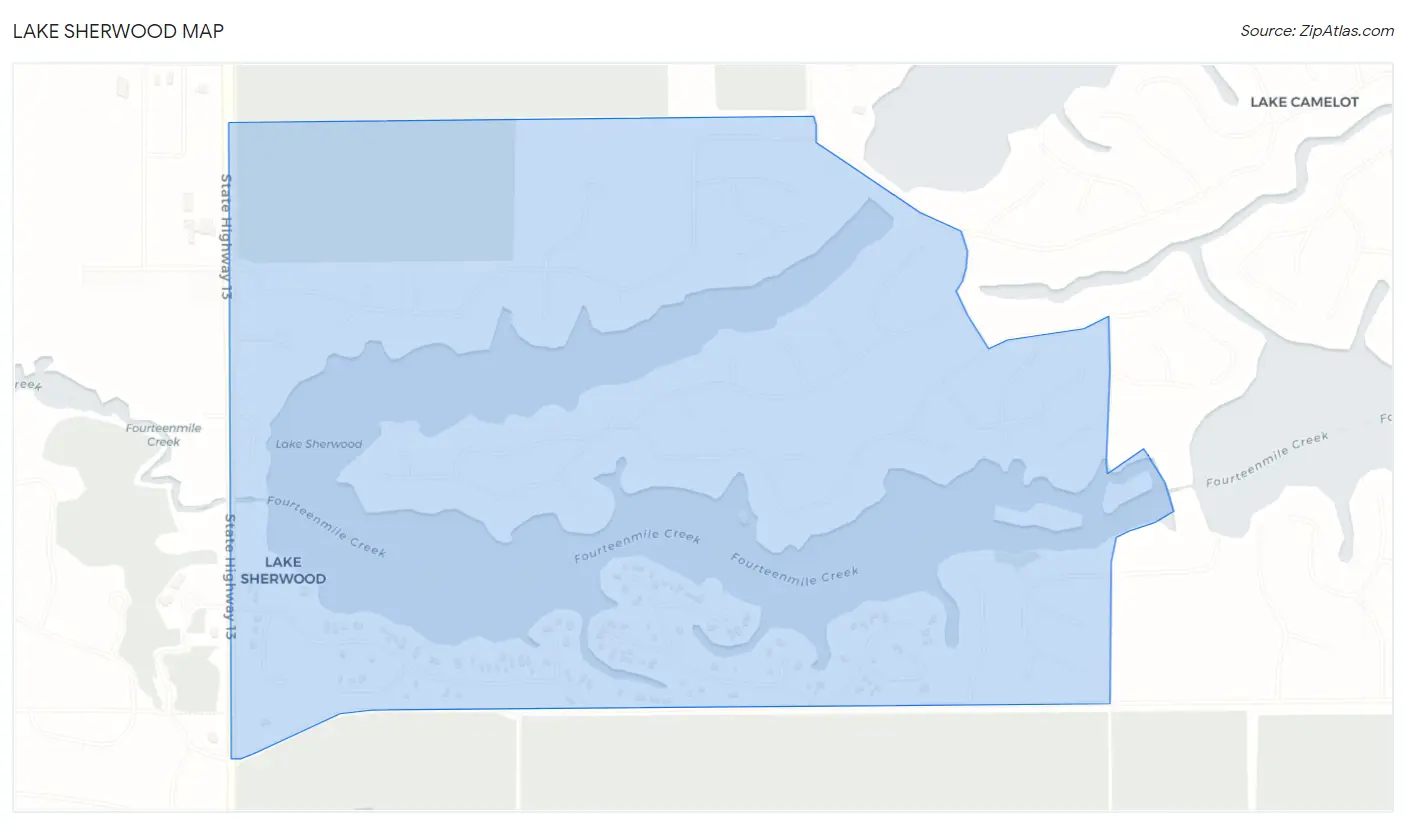
Lake Sherwood Map
Lake Sherwood Overview
$51,378
PER CAPITA INCOME
$98,594
AVG FAMILY INCOME
$98,672
AVG HOUSEHOLD INCOME
12.3%
WAGE / INCOME GAP [ % ]
87.7¢/ $1
WAGE / INCOME GAP [ $ ]
0.30
INEQUALITY / GINI INDEX
378
TOTAL POPULATION
174
MALE POPULATION
204
FEMALE POPULATION
85.29
MALES / 100 FEMALES
117.24
FEMALES / 100 MALES
60.6
MEDIAN AGE
2.1
AVG FAMILY SIZE
2.0
AVG HOUSEHOLD SIZE
217
LABOR FORCE [ PEOPLE ]
60.4%
PERCENT IN LABOR FORCE
8.3%
UNEMPLOYMENT RATE
Income in Lake Sherwood
Income Overview in Lake Sherwood
Per Capita Income in Lake Sherwood is $51,378, while median incomes of families and households are $98,594 and $98,672 respectively.
| Characteristic | Number | Measure |
| Per Capita Income | 378 | $51,378 |
| Median Family Income | 136 | $98,594 |
| Mean Family Income | 136 | $113,746 |
| Median Household Income | 193 | $98,672 |
| Mean Household Income | 193 | $104,631 |
| Income Deficit | 136 | $0 |
| Wage / Income Gap (%) | 378 | 12.30% |
| Wage / Income Gap ($) | 378 | 87.70¢ per $1 |
| Gini / Inequality Index | 378 | 0.30 |
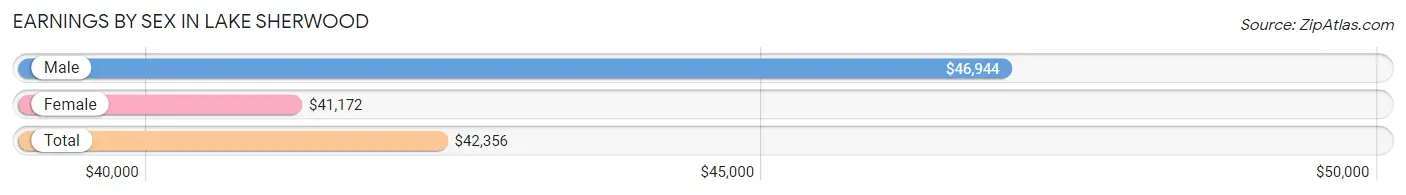
Earnings by Sex in Lake Sherwood
Average Earnings in Lake Sherwood are $42,356, $46,944 for men and $41,172 for women, a difference of 12.3%.
| Sex | Number | Average Earnings |
| Male | 116 (47.7%) | $46,944 |
| Female | 127 (52.3%) | $41,172 |
| Total | 243 (100.0%) | $42,356 |
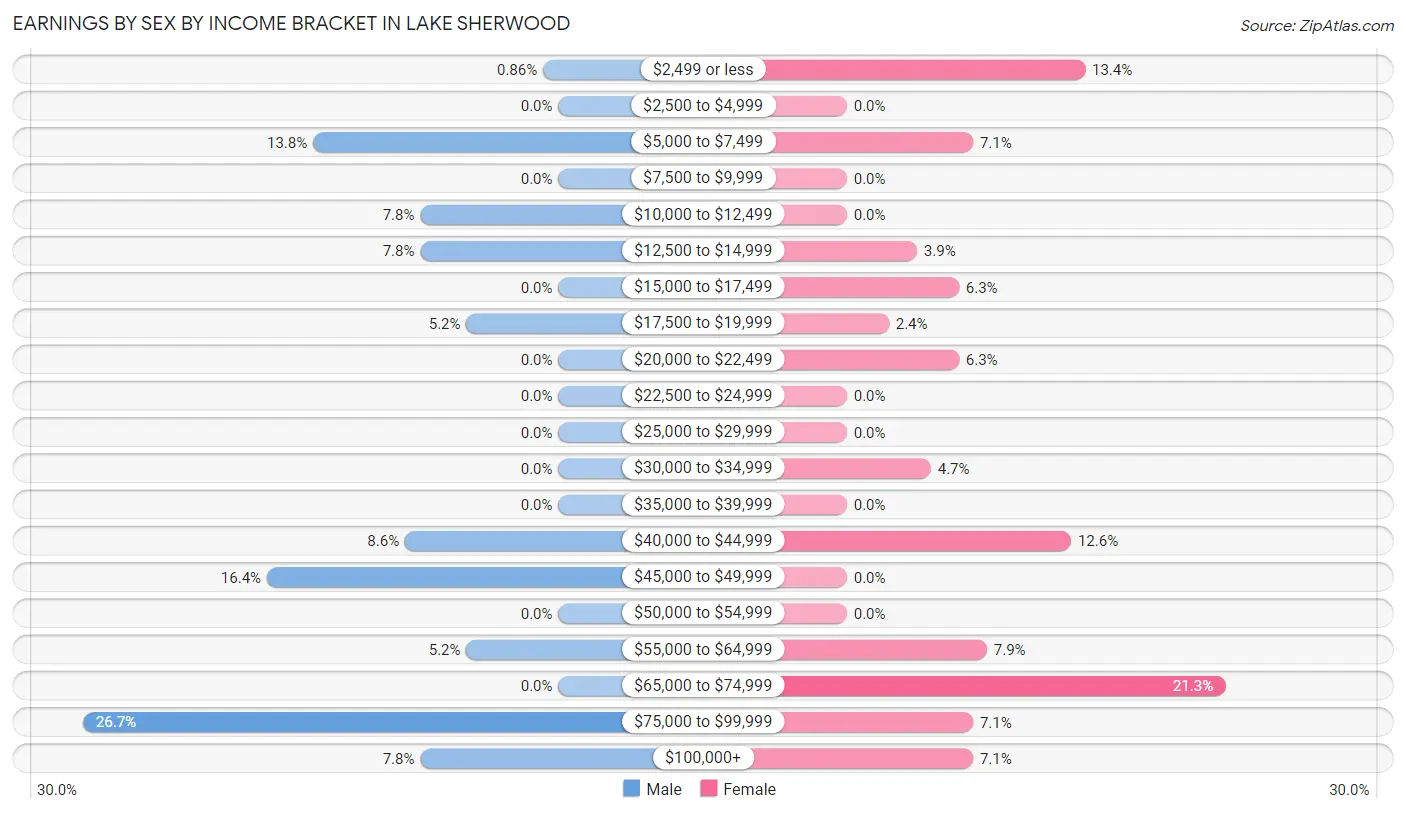
Earnings by Sex by Income Bracket in Lake Sherwood
The most common earnings brackets in Lake Sherwood are $75,000 to $99,999 for men (31 | 26.7%) and $65,000 to $74,999 for women (27 | 21.3%).
| Income | Male | Female |
| $2,499 or less | 1 (0.9%) | 17 (13.4%) |
| $2,500 to $4,999 | 0 (0.0%) | 0 (0.0%) |
| $5,000 to $7,499 | 16 (13.8%) | 9 (7.1%) |
| $7,500 to $9,999 | 0 (0.0%) | 0 (0.0%) |
| $10,000 to $12,499 | 9 (7.8%) | 0 (0.0%) |
| $12,500 to $14,999 | 9 (7.8%) | 5 (3.9%) |
| $15,000 to $17,499 | 0 (0.0%) | 8 (6.3%) |
| $17,500 to $19,999 | 6 (5.2%) | 3 (2.4%) |
| $20,000 to $22,499 | 0 (0.0%) | 8 (6.3%) |
| $22,500 to $24,999 | 0 (0.0%) | 0 (0.0%) |
| $25,000 to $29,999 | 0 (0.0%) | 0 (0.0%) |
| $30,000 to $34,999 | 0 (0.0%) | 6 (4.7%) |
| $35,000 to $39,999 | 0 (0.0%) | 0 (0.0%) |
| $40,000 to $44,999 | 10 (8.6%) | 16 (12.6%) |
| $45,000 to $49,999 | 19 (16.4%) | 0 (0.0%) |
| $50,000 to $54,999 | 0 (0.0%) | 0 (0.0%) |
| $55,000 to $64,999 | 6 (5.2%) | 10 (7.9%) |
| $65,000 to $74,999 | 0 (0.0%) | 27 (21.3%) |
| $75,000 to $99,999 | 31 (26.7%) | 9 (7.1%) |
| $100,000+ | 9 (7.8%) | 9 (7.1%) |
| Total | 116 (100.0%) | 127 (100.0%) |
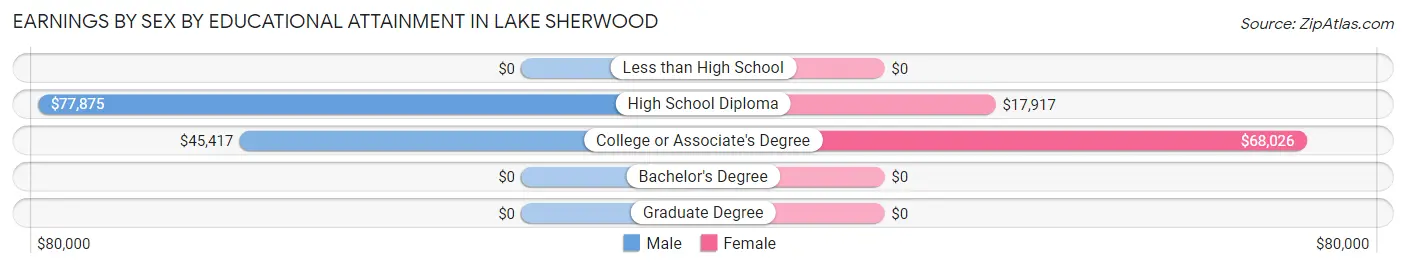
Earnings by Sex by Educational Attainment in Lake Sherwood
| Educational Attainment | Male Income | Female Income |
| Less than High School | - | - |
| High School Diploma | $77,875 | $17,917 |
| College or Associate's Degree | $45,417 | $68,026 |
| Bachelor's Degree | - | - |
| Graduate Degree | - | - |
| Total | $47,875 | $0 |
Family Income in Lake Sherwood
Family Income Brackets in Lake Sherwood
According to the Lake Sherwood family income data, there are 54 families falling into the $75,000 to $99,999 income range, which is the most common income bracket and makes up 39.7% of all families.
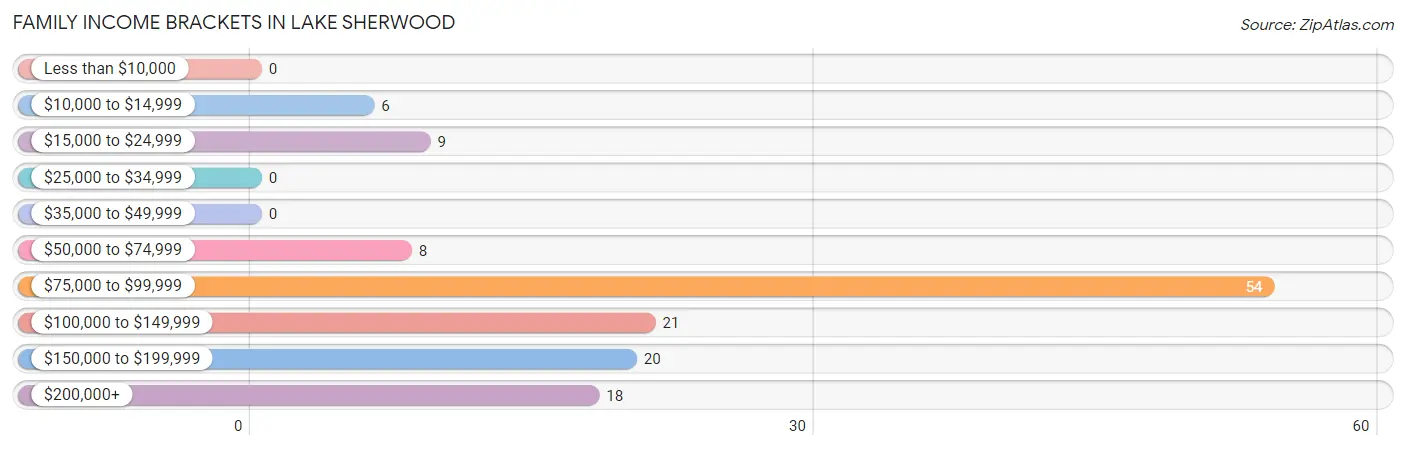
| Income Bracket | # Families | % Families |
| Less than $10,000 | 0 | 0.0% |
| $10,000 to $14,999 | 6 | 4.4% |
| $15,000 to $24,999 | 9 | 6.6% |
| $25,000 to $34,999 | 0 | 0.0% |
| $35,000 to $49,999 | 0 | 0.0% |
| $50,000 to $74,999 | 8 | 5.9% |
| $75,000 to $99,999 | 54 | 39.7% |
| $100,000 to $149,999 | 21 | 15.4% |
| $150,000 to $199,999 | 20 | 14.7% |
| $200,000+ | 18 | 13.2% |
Family Income by Famaliy Size in Lake Sherwood
2-person families (127 | 93.4%) account for the highest median family income in Lake Sherwood with $98,516 per family, while 2-person families (127 | 93.4%) have the highest median income of $49,258 per family member.
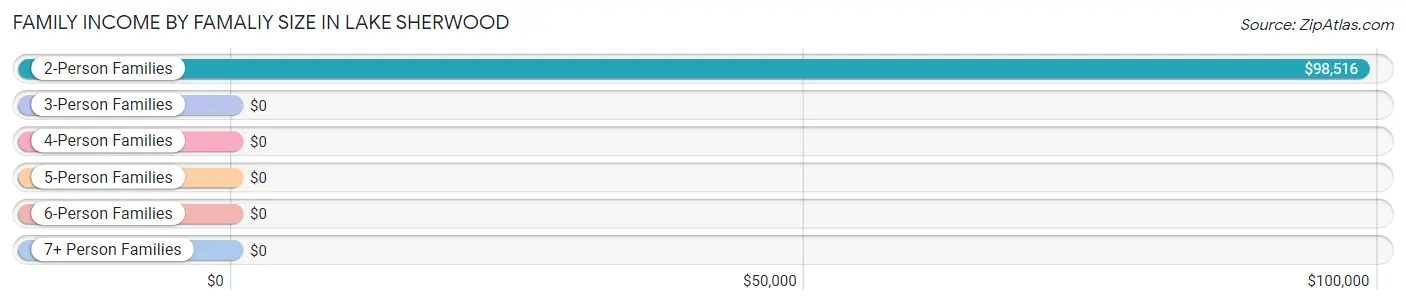
| Income Bracket | # Families | Median Income |
| 2-Person Families | 127 (93.4%) | $98,516 |
| 3-Person Families | 0 (0.0%) | $0 |
| 4-Person Families | 4 (2.9%) | $0 |
| 5-Person Families | 5 (3.7%) | $0 |
| 6-Person Families | 0 (0.0%) | $0 |
| 7+ Person Families | 0 (0.0%) | $0 |
| Total | 136 (100.0%) | $98,594 |
Family Income by Number of Earners in Lake Sherwood
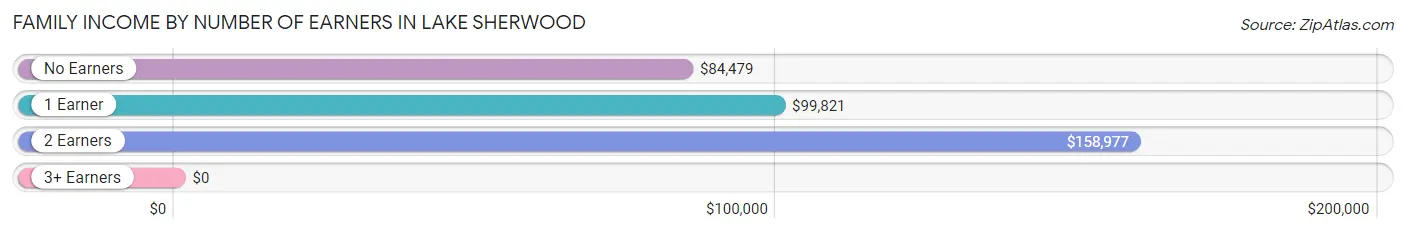
| Number of Earners | # Families | Median Income |
| No Earners | 47 (34.6%) | $84,479 |
| 1 Earner | 21 (15.4%) | $99,821 |
| 2 Earners | 63 (46.3%) | $158,977 |
| 3+ Earners | 5 (3.7%) | $0 |
| Total | 136 (100.0%) | $98,594 |
Household Income in Lake Sherwood
Household Income Brackets in Lake Sherwood
With 50 households falling in the category, the $75,000 to $99,999 income range is the most frequent in Lake Sherwood, accounting for 25.9% of all households.
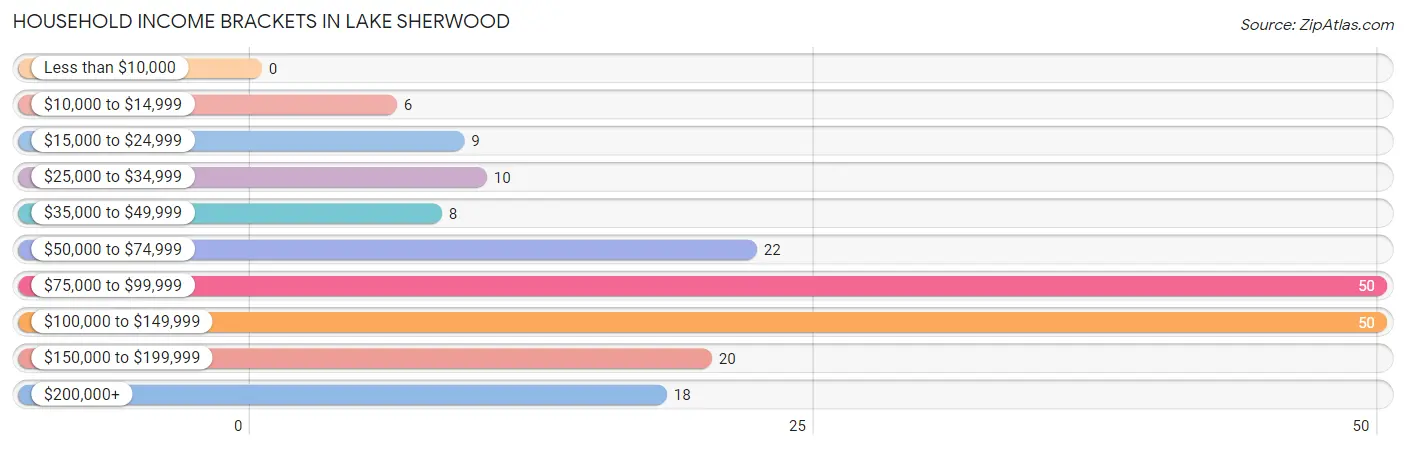
| Income Bracket | # Households | % Households |
| Less than $10,000 | 0 | 0.0% |
| $10,000 to $14,999 | 6 | 3.1% |
| $15,000 to $24,999 | 9 | 4.7% |
| $25,000 to $34,999 | 10 | 5.2% |
| $35,000 to $49,999 | 8 | 4.1% |
| $50,000 to $74,999 | 22 | 11.4% |
| $75,000 to $99,999 | 50 | 25.9% |
| $100,000 to $149,999 | 50 | 25.9% |
| $150,000 to $199,999 | 20 | 10.4% |
| $200,000+ | 18 | 9.3% |
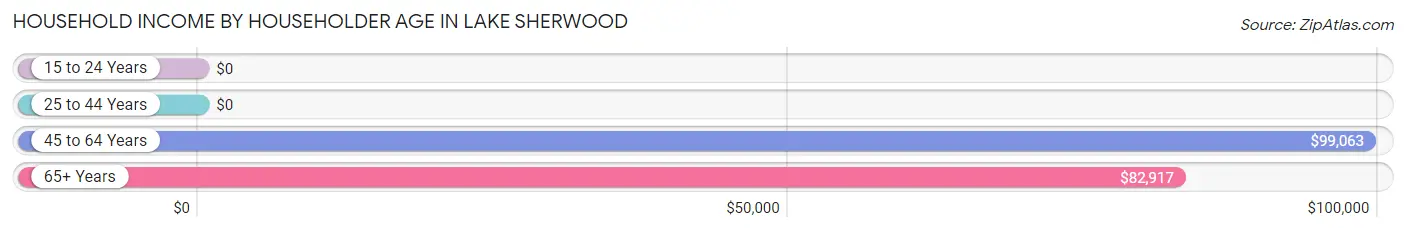
Household Income by Householder Age in Lake Sherwood
The median household income in Lake Sherwood is $98,672, with the highest median household income of $99,063 found in the 45 to 64 years age bracket for the primary householder. A total of 104 households (53.9%) fall into this category. Meanwhile, the 15 to 24 years age bracket for the primary householder has the lowest median household income of $0, with 16 households (8.3%) in this group.
| Income Bracket | # Households | Median Income |
| 15 to 24 Years | 16 (8.3%) | $0 |
| 25 to 44 Years | 11 (5.7%) | $0 |
| 45 to 64 Years | 104 (53.9%) | $99,063 |
| 65+ Years | 62 (32.1%) | $82,917 |
| Total | 193 (100.0%) | $98,672 |
Poverty in Lake Sherwood
Income Below Poverty by Sex and Age in Lake Sherwood
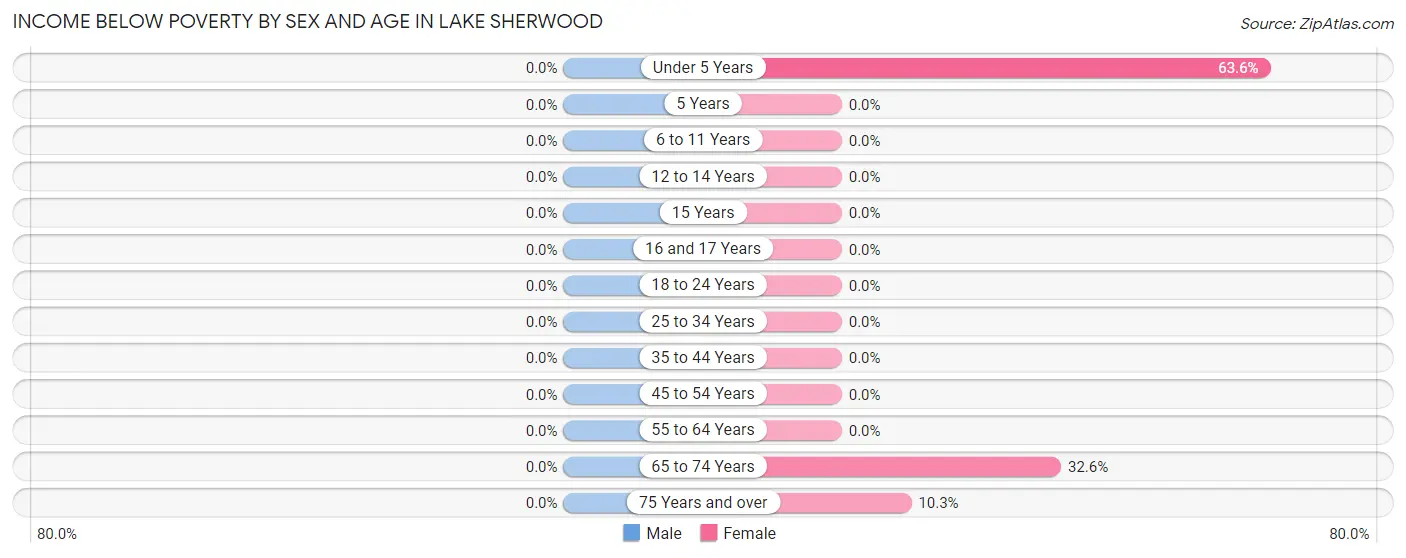
| Age Bracket | Male | Female |
| Under 5 Years | 0 (0.0%) | 7 (63.6%) |
| 5 Years | 0 (0.0%) | 0 (0.0%) |
| 6 to 11 Years | 0 (0.0%) | 0 (0.0%) |
| 12 to 14 Years | 0 (0.0%) | 0 (0.0%) |
| 15 Years | 0 (0.0%) | 0 (0.0%) |
| 16 and 17 Years | 0 (0.0%) | 0 (0.0%) |
| 18 to 24 Years | 0 (0.0%) | 0 (0.0%) |
| 25 to 34 Years | 0 (0.0%) | 0 (0.0%) |
| 35 to 44 Years | 0 (0.0%) | 0 (0.0%) |
| 45 to 54 Years | 0 (0.0%) | 0 (0.0%) |
| 55 to 64 Years | 0 (0.0%) | 0 (0.0%) |
| 65 to 74 Years | 0 (0.0%) | 14 (32.6%) |
| 75 Years and over | 0 (0.0%) | 3 (10.3%) |
| Total | 0 (0.0%) | 24 (11.8%) |
Income Above Poverty by Sex and Age in Lake Sherwood
According to the poverty statistics in Lake Sherwood, males aged 6 to 11 years and females aged 6 to 11 years are the age groups that are most secure financially, with 100.0% of males and 100.0% of females in these age groups living above the poverty line.
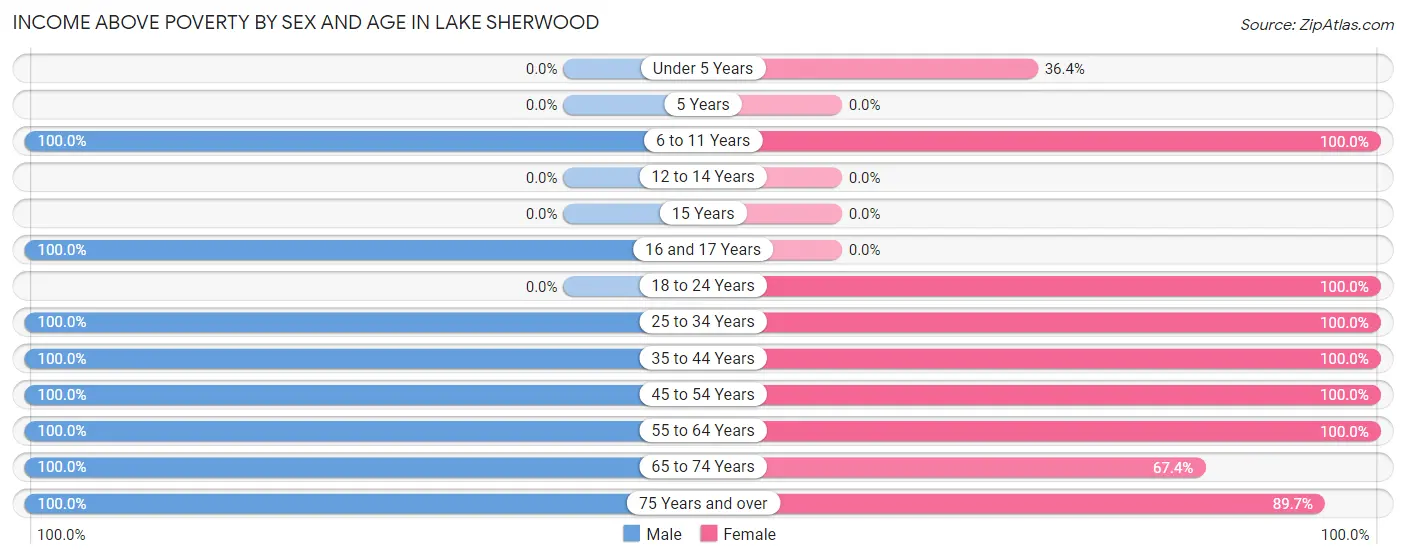
| Age Bracket | Male | Female |
| Under 5 Years | 0 (0.0%) | 4 (36.4%) |
| 5 Years | 0 (0.0%) | 0 (0.0%) |
| 6 to 11 Years | 4 (100.0%) | 4 (100.0%) |
| 12 to 14 Years | 0 (0.0%) | 0 (0.0%) |
| 15 Years | 0 (0.0%) | 0 (0.0%) |
| 16 and 17 Years | 7 (100.0%) | 0 (0.0%) |
| 18 to 24 Years | 0 (0.0%) | 16 (100.0%) |
| 25 to 34 Years | 10 (100.0%) | 3 (100.0%) |
| 35 to 44 Years | 3 (100.0%) | 11 (100.0%) |
| 45 to 54 Years | 12 (100.0%) | 17 (100.0%) |
| 55 to 64 Years | 86 (100.0%) | 70 (100.0%) |
| 65 to 74 Years | 16 (100.0%) | 29 (67.4%) |
| 75 Years and over | 36 (100.0%) | 26 (89.7%) |
| Total | 174 (100.0%) | 180 (88.2%) |
Income Below Poverty Among Married-Couple Families in Lake Sherwood
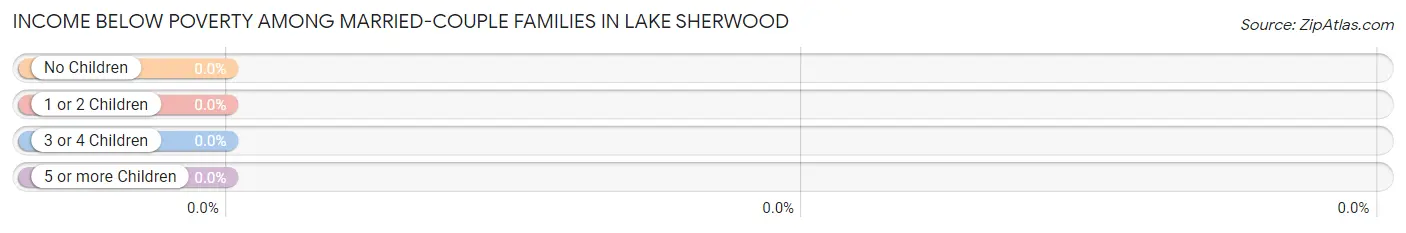
| Children | Above Poverty | Below Poverty |
| No Children | 121 (100.0%) | 0 (0.0%) |
| 1 or 2 Children | 4 (100.0%) | 0 (0.0%) |
| 3 or 4 Children | 5 (100.0%) | 0 (0.0%) |
| 5 or more Children | 0 (0.0%) | 0 (0.0%) |
| Total | 130 (100.0%) | 0 (0.0%) |
Income Below Poverty Among Single-Parent Households in Lake Sherwood
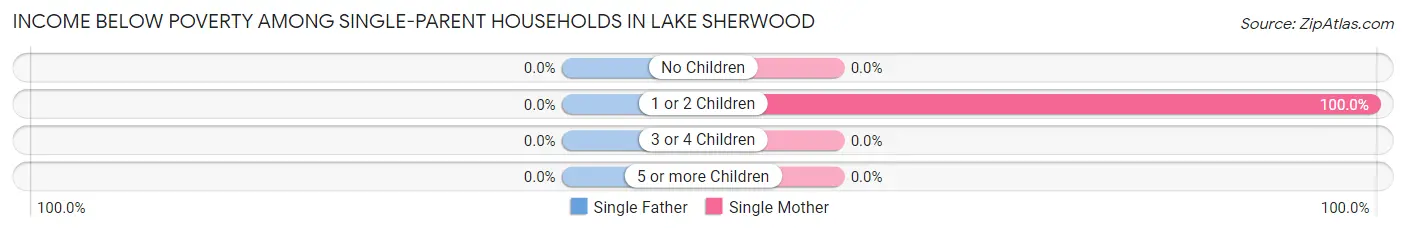
| Children | Single Father | Single Mother |
| No Children | 0 (0.0%) | 0 (0.0%) |
| 1 or 2 Children | 0 (0.0%) | 6 (100.0%) |
| 3 or 4 Children | 0 (0.0%) | 0 (0.0%) |
| 5 or more Children | 0 (0.0%) | 0 (0.0%) |
| Total | 0 (0.0%) | 6 (100.0%) |
Income Below Poverty Among Married-Couple vs Single-Parent Households in Lake Sherwood
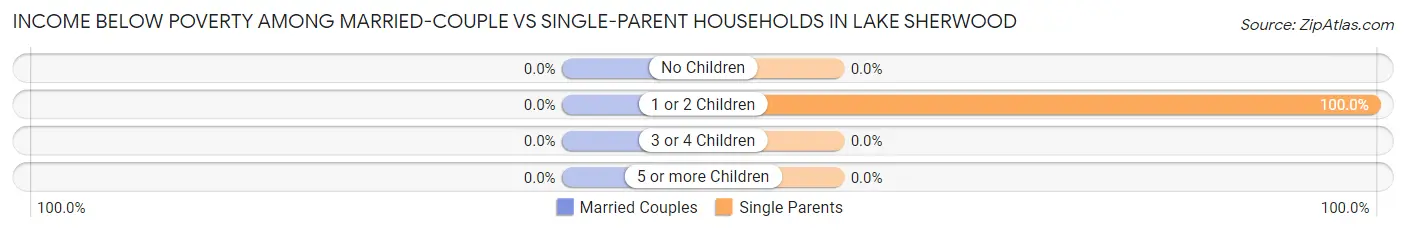
| Children | Married-Couple Families | Single-Parent Households |
| No Children | 0 (0.0%) | 0 (0.0%) |
| 1 or 2 Children | 0 (0.0%) | 6 (100.0%) |
| 3 or 4 Children | 0 (0.0%) | 0 (0.0%) |
| 5 or more Children | 0 (0.0%) | 0 (0.0%) |
| Total | 0 (0.0%) | 6 (100.0%) |
Race in Lake Sherwood
The most populous races in Lake Sherwood are White / Caucasian (378 | 100.0%), and Hispanic or Latino (16 | 4.2%).
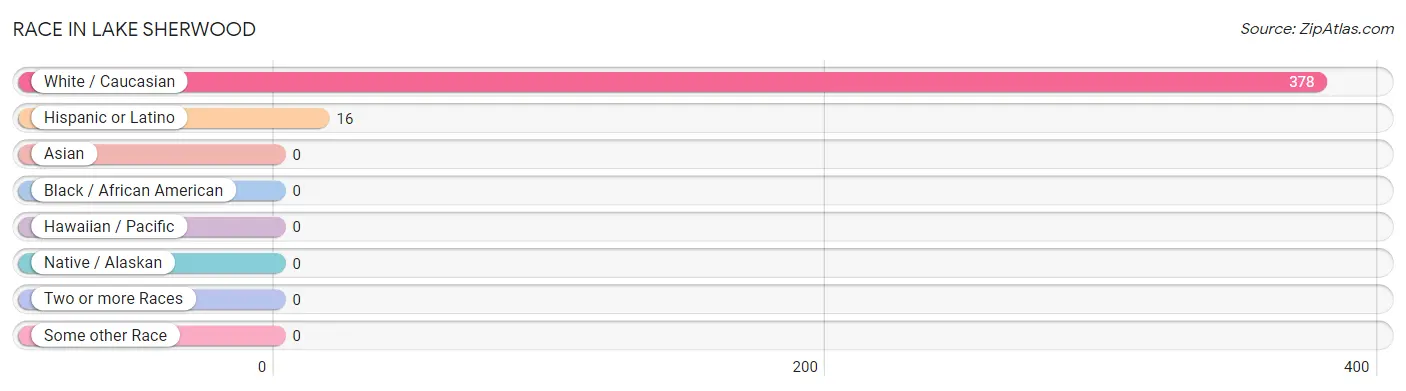
| Race | # Population | % Population |
| Asian | 0 | 0.0% |
| Black / African American | 0 | 0.0% |
| Hawaiian / Pacific | 0 | 0.0% |
| Hispanic or Latino | 16 | 4.2% |
| Native / Alaskan | 0 | 0.0% |
| White / Caucasian | 378 | 100.0% |
| Two or more Races | 0 | 0.0% |
| Some other Race | 0 | 0.0% |
| Total | 378 | 100.0% |
Ancestry in Lake Sherwood
The most populous ancestries reported in Lake Sherwood are German (161 | 42.6%), Norwegian (59 | 15.6%), Polish (59 | 15.6%), Irish (49 | 13.0%), and English (33 | 8.7%), together accounting for 95.5% of all Lake Sherwood residents.
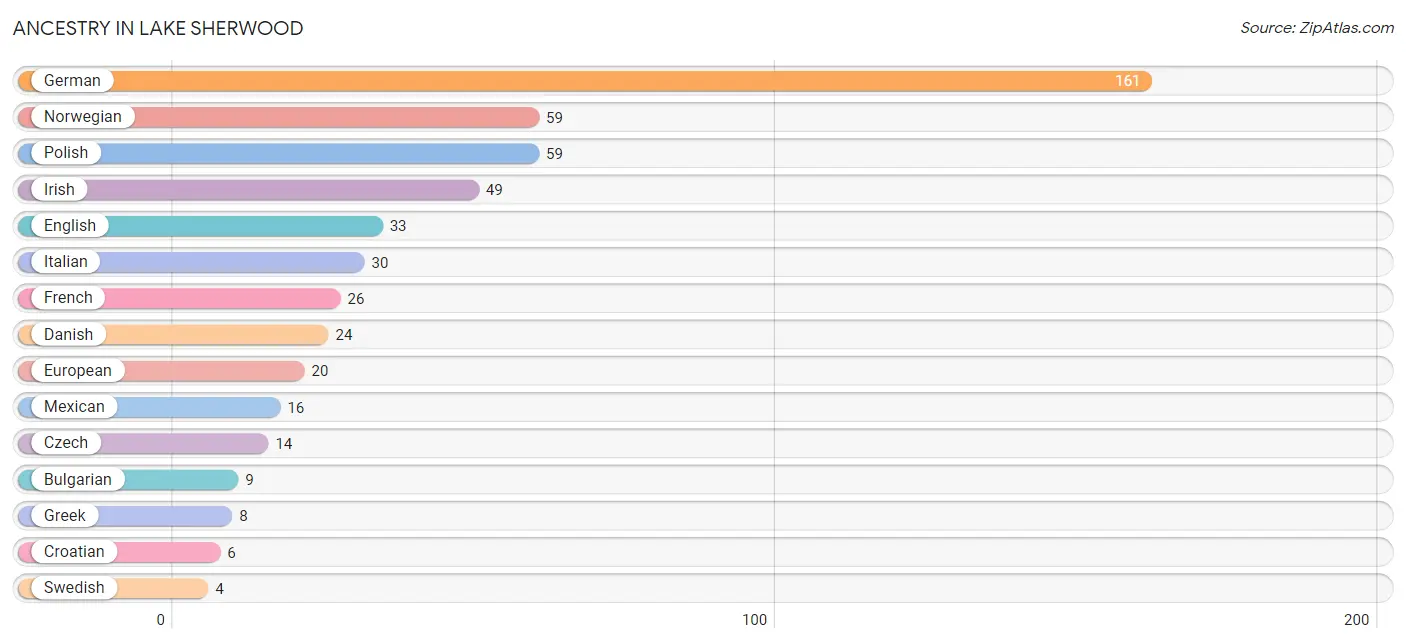
| Ancestry | # Population | % Population |
| Bulgarian | 9 | 2.4% |
| Croatian | 6 | 1.6% |
| Czech | 14 | 3.7% |
| Danish | 24 | 6.4% |
| Dutch | 3 | 0.8% |
| English | 33 | 8.7% |
| European | 20 | 5.3% |
| French | 26 | 6.9% |
| German | 161 | 42.6% |
| Greek | 8 | 2.1% |
| Irish | 49 | 13.0% |
| Italian | 30 | 7.9% |
| Mexican | 16 | 4.2% |
| Norwegian | 59 | 15.6% |
| Polish | 59 | 15.6% |
| Swedish | 4 | 1.1% | View All 16 Rows |
Immigrants in Lake Sherwood
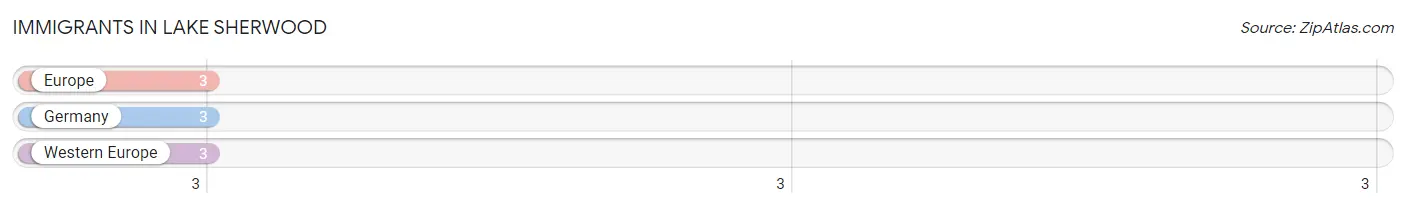
The most numerous immigrant groups reported in Lake Sherwood came from Europe (3 | 0.8%), Germany (3 | 0.8%), and Western Europe (3 | 0.8%), together accounting for 2.4% of all Lake Sherwood residents.
| Immigration Origin | # Population | % Population |
| Europe | 3 | 0.8% |
| Germany | 3 | 0.8% |
| Western Europe | 3 | 0.8% | View All 3 Rows |
Sex and Age in Lake Sherwood
Sex and Age in Lake Sherwood
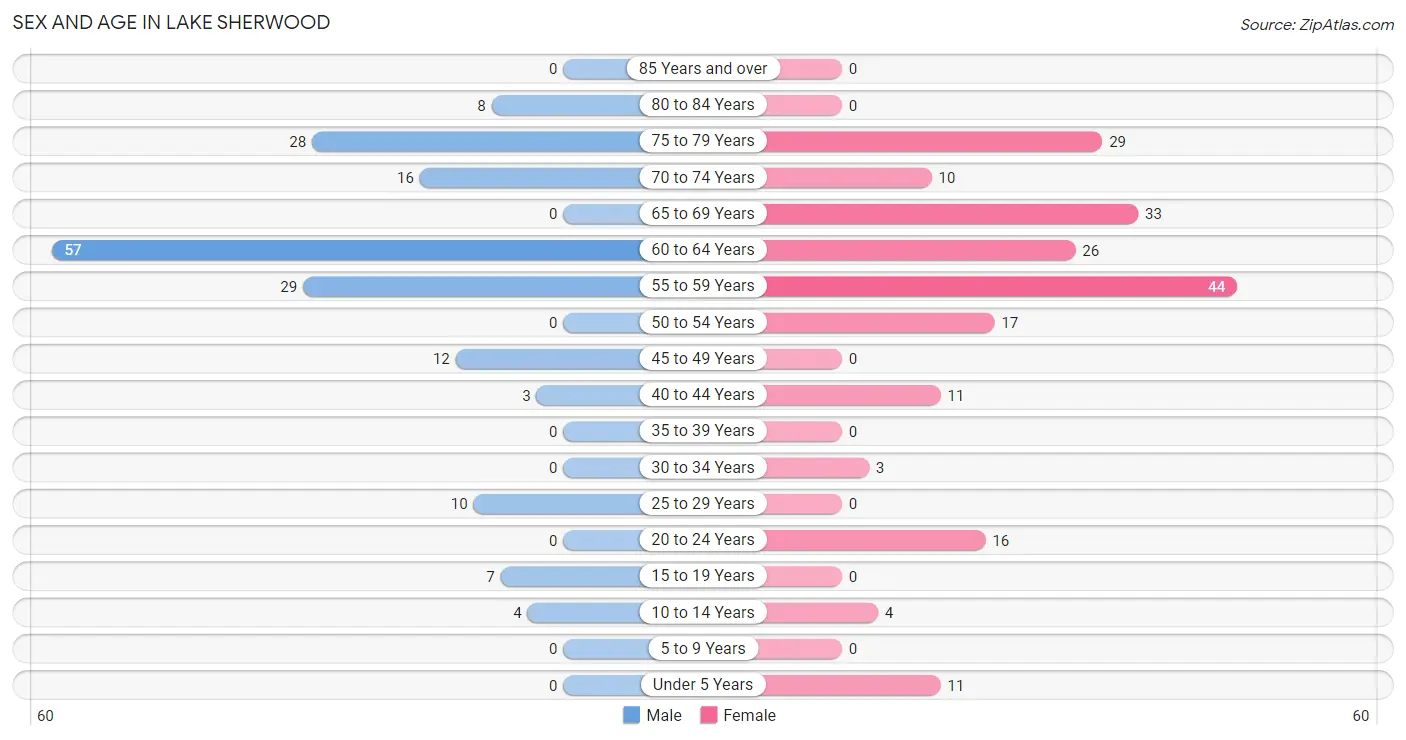
The most populous age groups in Lake Sherwood are 60 to 64 Years (57 | 32.8%) for men and 55 to 59 Years (44 | 21.6%) for women.
| Age Bracket | Male | Female |
| Under 5 Years | 0 (0.0%) | 11 (5.4%) |
| 5 to 9 Years | 0 (0.0%) | 0 (0.0%) |
| 10 to 14 Years | 4 (2.3%) | 4 (2.0%) |
| 15 to 19 Years | 7 (4.0%) | 0 (0.0%) |
| 20 to 24 Years | 0 (0.0%) | 16 (7.8%) |
| 25 to 29 Years | 10 (5.8%) | 0 (0.0%) |
| 30 to 34 Years | 0 (0.0%) | 3 (1.5%) |
| 35 to 39 Years | 0 (0.0%) | 0 (0.0%) |
| 40 to 44 Years | 3 (1.7%) | 11 (5.4%) |
| 45 to 49 Years | 12 (6.9%) | 0 (0.0%) |
| 50 to 54 Years | 0 (0.0%) | 17 (8.3%) |
| 55 to 59 Years | 29 (16.7%) | 44 (21.6%) |
| 60 to 64 Years | 57 (32.8%) | 26 (12.8%) |
| 65 to 69 Years | 0 (0.0%) | 33 (16.2%) |
| 70 to 74 Years | 16 (9.2%) | 10 (4.9%) |
| 75 to 79 Years | 28 (16.1%) | 29 (14.2%) |
| 80 to 84 Years | 8 (4.6%) | 0 (0.0%) |
| 85 Years and over | 0 (0.0%) | 0 (0.0%) |
| Total | 174 (100.0%) | 204 (100.0%) |
Families and Households in Lake Sherwood
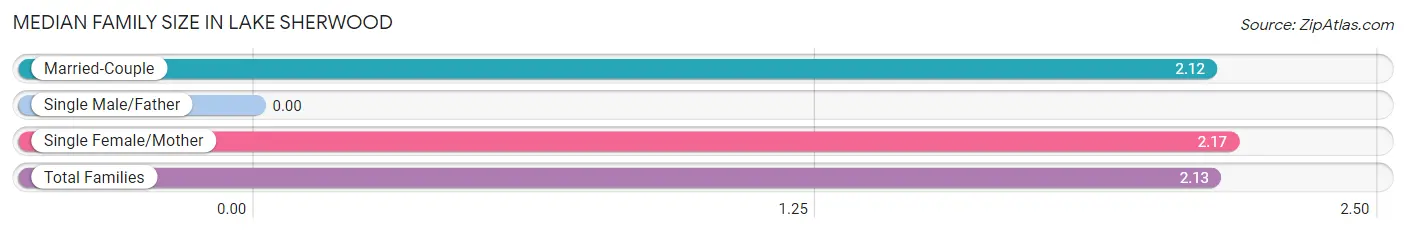
Median Family Size in Lake Sherwood
| Family Type | # Families | Family Size |
| Married-Couple | 130 (95.6%) | 2.12 |
| Single Male/Father | 0 (0.0%) | - |
| Single Female/Mother | 6 (4.4%) | 2.17 |
| Total Families | 136 (100.0%) | 2.13 |
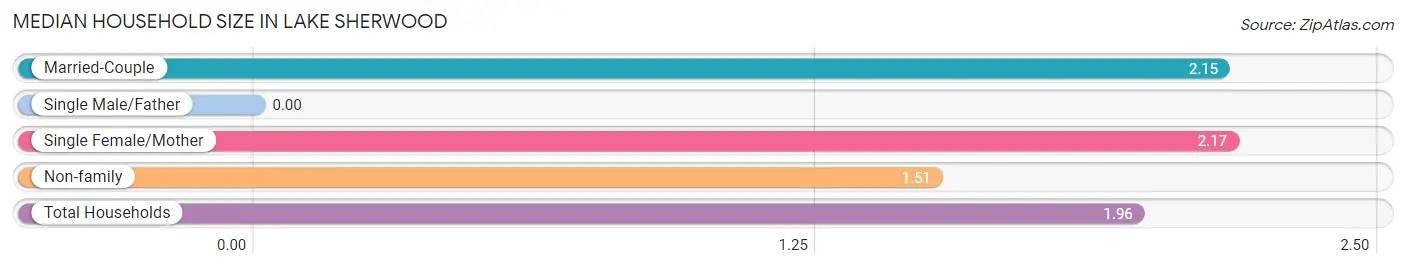
Median Household Size in Lake Sherwood
| Household Type | # Households | Household Size |
| Married-Couple | 130 (67.4%) | 2.15 |
| Single Male/Father | 0 (0.0%) | - |
| Single Female/Mother | 6 (3.1%) | 2.17 |
| Non-family | 57 (29.5%) | 1.51 |
| Total Households | 193 (100.0%) | 1.96 |
Household Size by Marriage Status in Lake Sherwood
Out of a total of 193 households in Lake Sherwood, 136 (70.5%) are family households, while 57 (29.5%) are nonfamily households. The most numerous type of family households are 2-person households, comprising 127, and the most common type of nonfamily households are 2-person households, comprising 35.
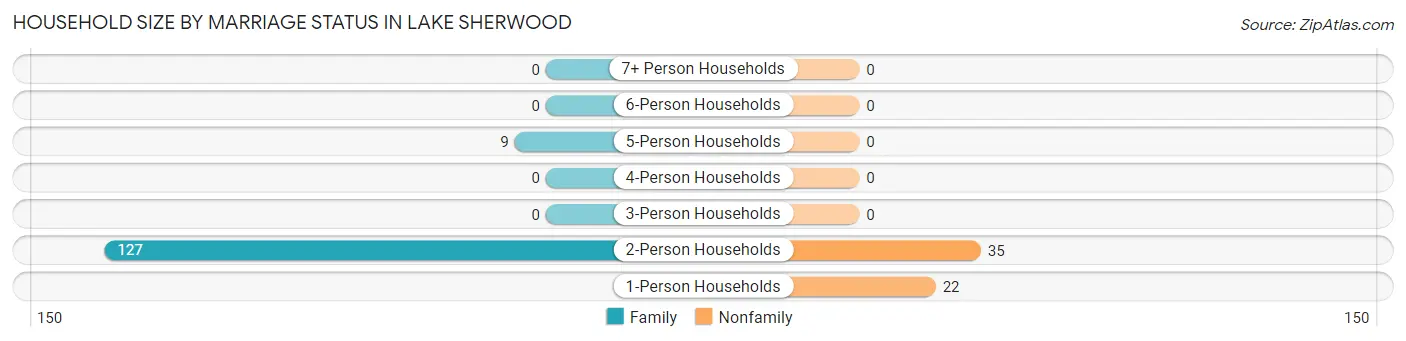
| Household Size | Family Households | Nonfamily Households |
| 1-Person Households | - | 22 (11.4%) |
| 2-Person Households | 127 (65.8%) | 35 (18.1%) |
| 3-Person Households | 0 (0.0%) | 0 (0.0%) |
| 4-Person Households | 0 (0.0%) | 0 (0.0%) |
| 5-Person Households | 9 (4.7%) | 0 (0.0%) |
| 6-Person Households | 0 (0.0%) | 0 (0.0%) |
| 7+ Person Households | 0 (0.0%) | 0 (0.0%) |
| Total | 136 (70.5%) | 57 (29.5%) |
Female Fertility in Lake Sherwood
Fertility by Age in Lake Sherwood
| Age Bracket | Women with Births | Births / 1,000 Women |
| 15 to 19 years | 0 (0.0%) | 0.0 |
| 20 to 34 years | 0 (0.0%) | 0.0 |
| 35 to 50 years | 0 (0.0%) | 0.0 |
| Total | 0 (0.0%) | 0.0 |
Fertility by Age by Marriage Status in Lake Sherwood
| Age Bracket | Married | Unmarried |
| 15 to 19 years | 0 (0.0%) | 0 (0.0%) |
| 20 to 34 years | 0 (0.0%) | 0 (0.0%) |
| 35 to 50 years | 0 (0.0%) | 0 (0.0%) |
| Total | 0 (0.0%) | 0 (0.0%) |
Fertility by Education in Lake Sherwood
| Educational Attainment | Women with Births | Births / 1,000 Women |
| Less than High School | 0 (0.0%) | 0.0 |
| High School Diploma | 0 (0.0%) | 0.0 |
| College or Associate's Degree | 0 (0.0%) | 0.0 |
| Bachelor's Degree | 0 (0.0%) | 0.0 |
| Graduate Degree | 0 (0.0%) | 0.0 |
| Total | 0 (0.0%) | 0.0 |
Fertility by Education by Marriage Status in Lake Sherwood
| Educational Attainment | Married | Unmarried |
| Less than High School | 0 (0.0%) | 0 (0.0%) |
| High School Diploma | 0 (0.0%) | 0 (0.0%) |
| College or Associate's Degree | 0 (0.0%) | 0 (0.0%) |
| Bachelor's Degree | 0 (0.0%) | 0 (0.0%) |
| Graduate Degree | 0 (0.0%) | 0 (0.0%) |
| Total | 0 (0.0%) | 0 (0.0%) |
Employment Characteristics in Lake Sherwood
Employment by Class of Employer in Lake Sherwood
Among the 194 employed individuals in Lake Sherwood, private company employees (129 | 66.5%), self-employed (incorporated) (29 | 14.9%), and local government employees (18 | 9.3%) make up the most common classes of employment.
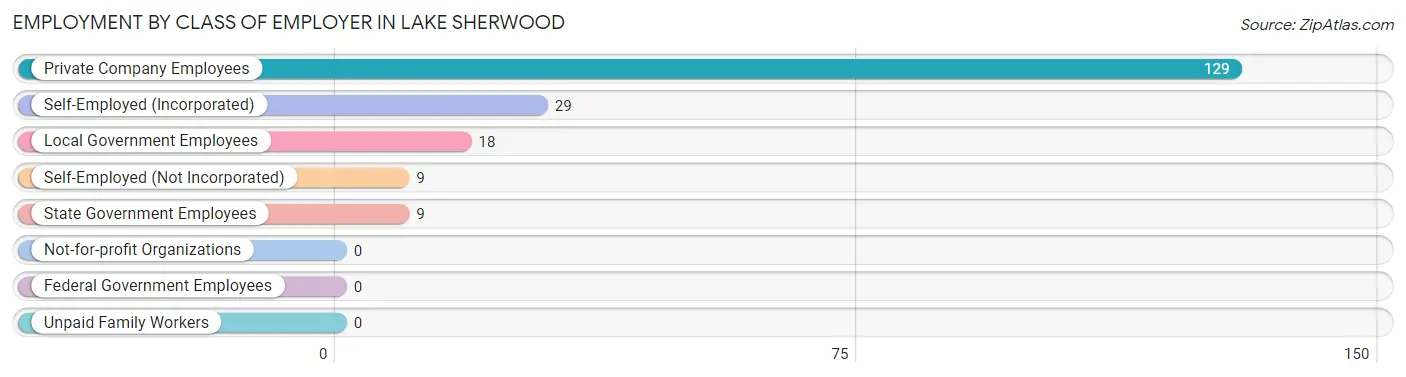
| Employer Class | # Employees | % Employees |
| Private Company Employees | 129 | 66.5% |
| Self-Employed (Incorporated) | 29 | 14.9% |
| Self-Employed (Not Incorporated) | 9 | 4.6% |
| Not-for-profit Organizations | 0 | 0.0% |
| Local Government Employees | 18 | 9.3% |
| State Government Employees | 9 | 4.6% |
| Federal Government Employees | 0 | 0.0% |
| Unpaid Family Workers | 0 | 0.0% |
| Total | 194 | 100.0% |
Employment Status by Age in Lake Sherwood
According to the labor force statistics for Lake Sherwood, out of the total population over 16 years of age (359), 60.4% or 217 individuals are in the labor force, with 8.3% or 18 of them unemployed. The age group with the highest labor force participation rate is 20 to 24 years, with 100.0% or 16 individuals in the labor force. Within the labor force, the 45 to 54 years age range has the highest percentage of unemployed individuals, with 31.0% or 9 of them being unemployed.
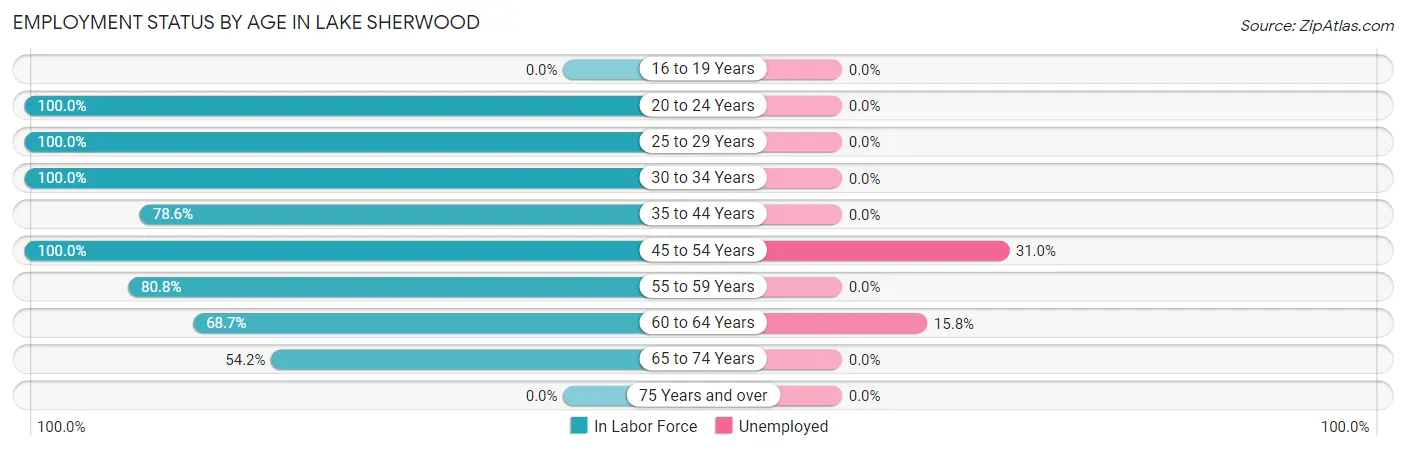
| Age Bracket | In Labor Force | Unemployed |
| 16 to 19 Years | 0 (0.0%) | 0 (0.0%) |
| 20 to 24 Years | 16 (100.0%) | 0 (0.0%) |
| 25 to 29 Years | 10 (100.0%) | 0 (0.0%) |
| 30 to 34 Years | 3 (100.0%) | 0 (0.0%) |
| 35 to 44 Years | 11 (78.6%) | 0 (0.0%) |
| 45 to 54 Years | 29 (100.0%) | 9 (31.0%) |
| 55 to 59 Years | 59 (80.8%) | 0 (0.0%) |
| 60 to 64 Years | 57 (68.7%) | 9 (15.8%) |
| 65 to 74 Years | 32 (54.2%) | 0 (0.0%) |
| 75 Years and over | 0 (0.0%) | 0 (0.0%) |
| Total | 217 (60.4%) | 18 (8.3%) |
Employment Status by Educational Attainment in Lake Sherwood
According to labor force statistics for Lake Sherwood, 79.7% of individuals (169) out of the total population between 25 and 64 years of age (212) are in the labor force, with 10.7% or 18 of them being unemployed. The group with the highest labor force participation rate are those with the educational attainment of college / associate degree, with 97.2% or 106 individuals in the labor force. Within the labor force, individuals with bachelor's degree or higher education have the highest percentage of unemployment, with 33.3% or 9 of them being unemployed.
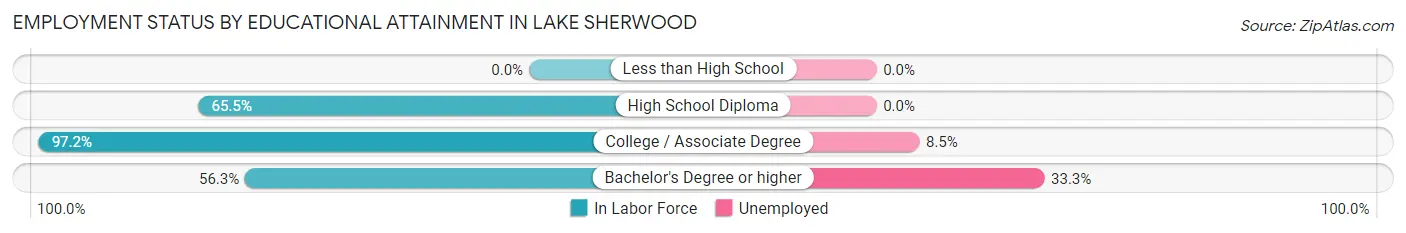
| Educational Attainment | In Labor Force | Unemployed |
| Less than High School | 0 (0.0%) | 0 (0.0%) |
| High School Diploma | 36 (65.5%) | 0 (0.0%) |
| College / Associate Degree | 106 (97.2%) | 9 (8.5%) |
| Bachelor's Degree or higher | 27 (56.3%) | 16 (33.3%) |
| Total | 169 (79.7%) | 23 (10.7%) |
Employment Occupations by Sex in Lake Sherwood
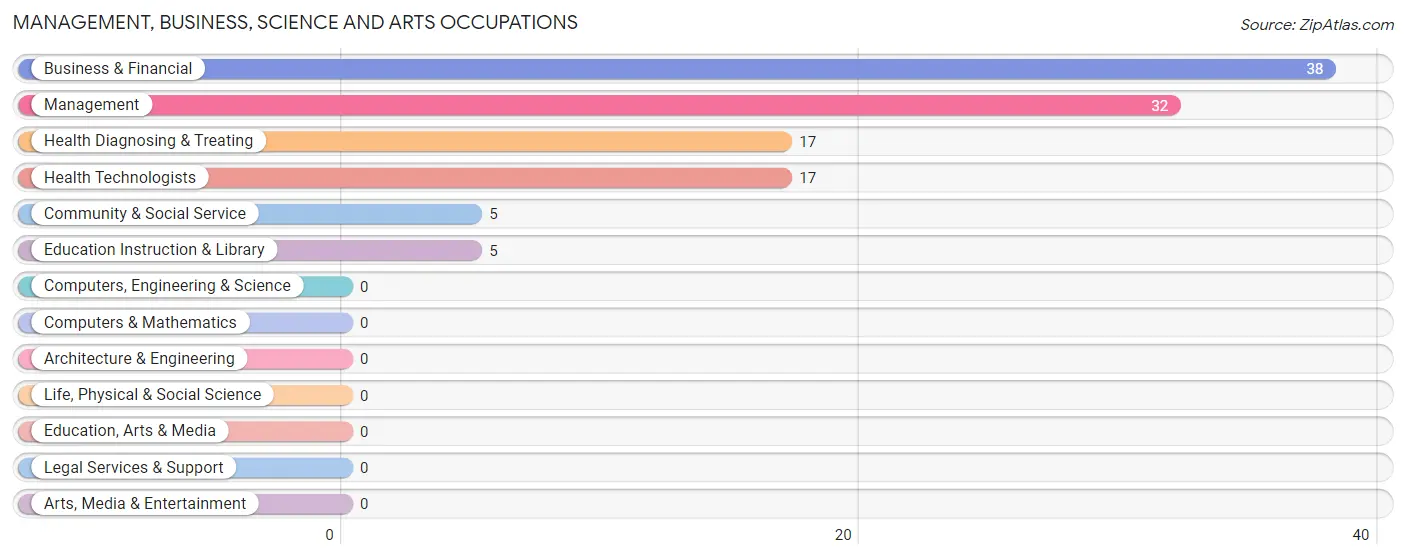
Management, Business, Science and Arts Occupations
The most common Management, Business, Science and Arts occupations in Lake Sherwood are Business & Financial (38 | 19.1%), Management (32 | 16.1%), Health Diagnosing & Treating (17 | 8.5%), Health Technologists (17 | 8.5%), and Community & Social Service (5 | 2.5%).
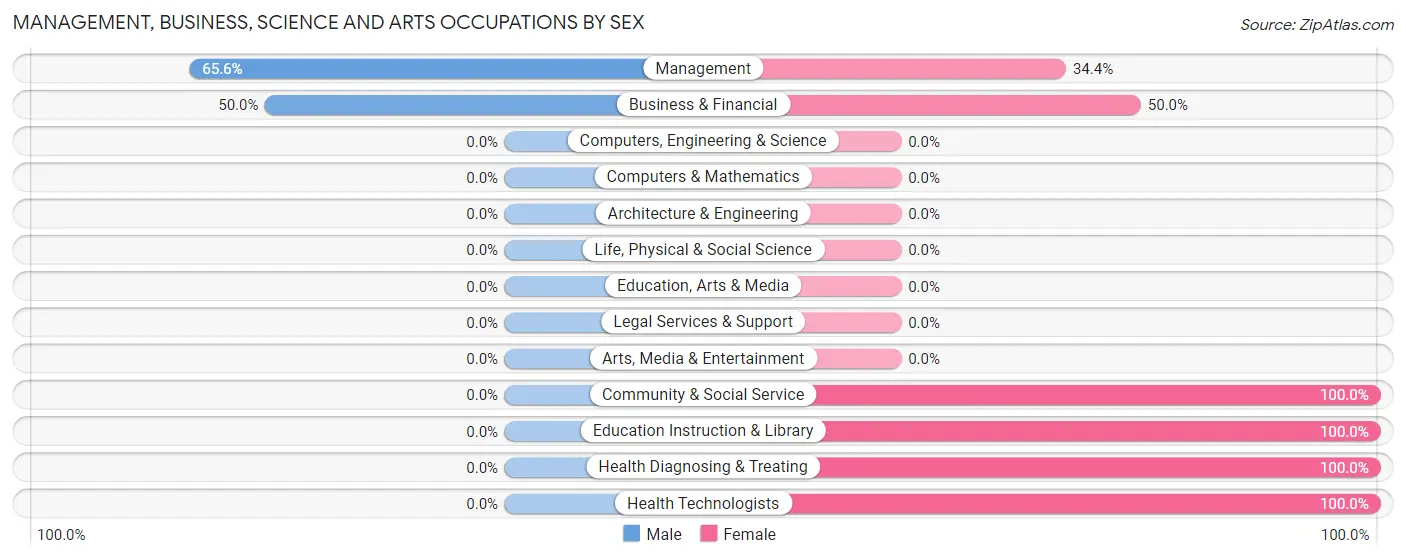
Management, Business, Science and Arts Occupations by Sex
Within the Management, Business, Science and Arts occupations in Lake Sherwood, the most male-oriented occupations are Management (65.6%), and Business & Financial (50.0%), while the most female-oriented occupations are Community & Social Service (100.0%), Education Instruction & Library (100.0%), and Health Diagnosing & Treating (100.0%).
| Occupation | Male | Female |
| Management | 21 (65.6%) | 11 (34.4%) |
| Business & Financial | 19 (50.0%) | 19 (50.0%) |
| Computers, Engineering & Science | 0 (0.0%) | 0 (0.0%) |
| Computers & Mathematics | 0 (0.0%) | 0 (0.0%) |
| Architecture & Engineering | 0 (0.0%) | 0 (0.0%) |
| Life, Physical & Social Science | 0 (0.0%) | 0 (0.0%) |
| Community & Social Service | 0 (0.0%) | 5 (100.0%) |
| Education, Arts & Media | 0 (0.0%) | 0 (0.0%) |
| Legal Services & Support | 0 (0.0%) | 0 (0.0%) |
| Education Instruction & Library | 0 (0.0%) | 5 (100.0%) |
| Arts, Media & Entertainment | 0 (0.0%) | 0 (0.0%) |
| Health Diagnosing & Treating | 0 (0.0%) | 17 (100.0%) |
| Health Technologists | 0 (0.0%) | 17 (100.0%) |
| Total (Category) | 40 (43.5%) | 52 (56.5%) |
| Total (Overall) | 91 (45.7%) | 108 (54.3%) |
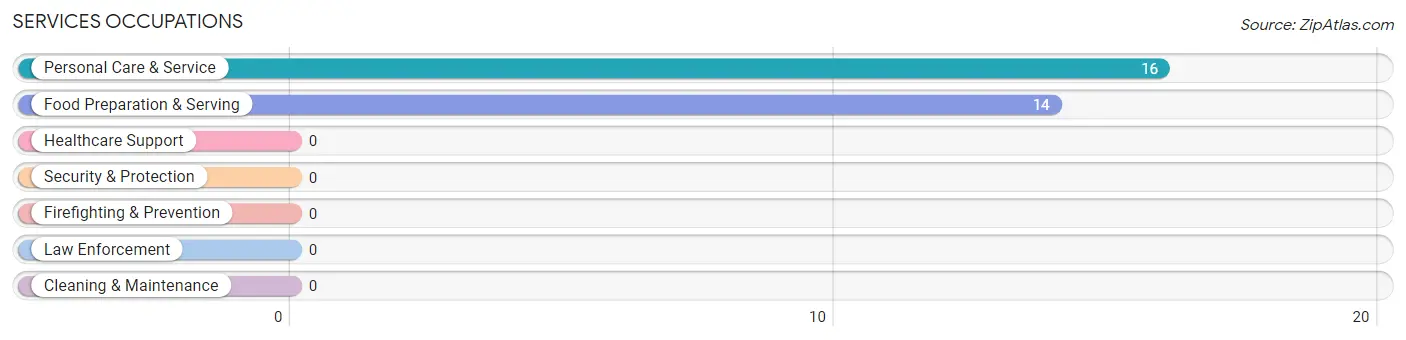
Services Occupations
The most common Services occupations in Lake Sherwood are Personal Care & Service (16 | 8.0%), and Food Preparation & Serving (14 | 7.0%).
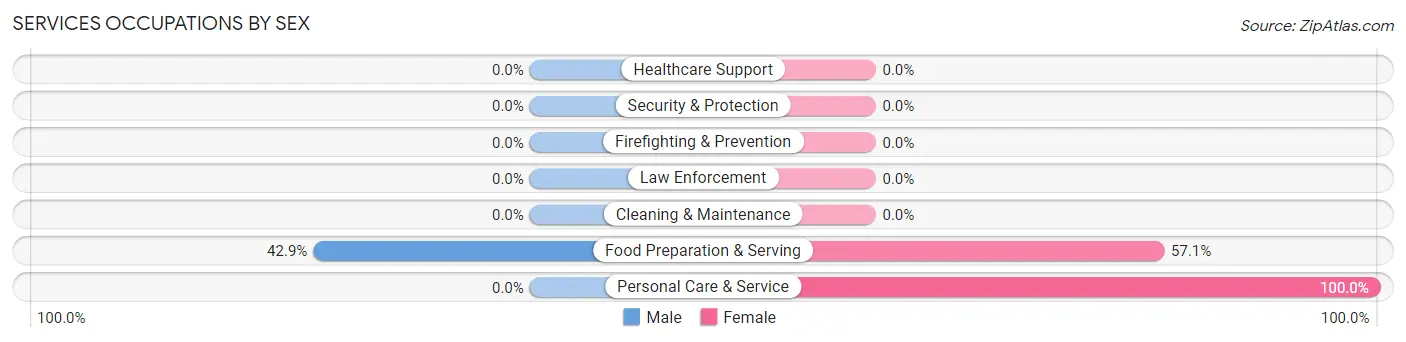
Services Occupations by Sex
| Occupation | Male | Female |
| Healthcare Support | 0 (0.0%) | 0 (0.0%) |
| Security & Protection | 0 (0.0%) | 0 (0.0%) |
| Firefighting & Prevention | 0 (0.0%) | 0 (0.0%) |
| Law Enforcement | 0 (0.0%) | 0 (0.0%) |
| Food Preparation & Serving | 6 (42.9%) | 8 (57.1%) |
| Cleaning & Maintenance | 0 (0.0%) | 0 (0.0%) |
| Personal Care & Service | 0 (0.0%) | 16 (100.0%) |
| Total (Category) | 6 (20.0%) | 24 (80.0%) |
| Total (Overall) | 91 (45.7%) | 108 (54.3%) |
Sales and Office Occupations
The most common Sales and Office occupations in Lake Sherwood are , and Office & Administration (18 | 9.0%).
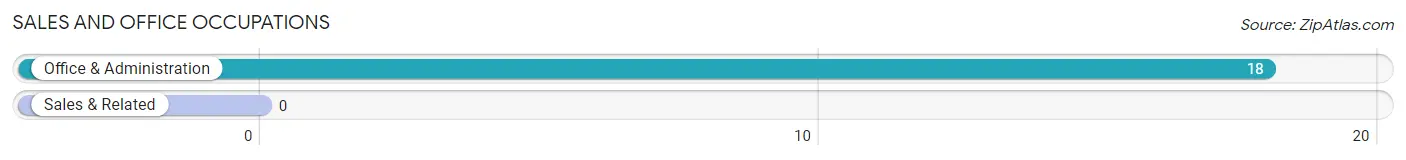
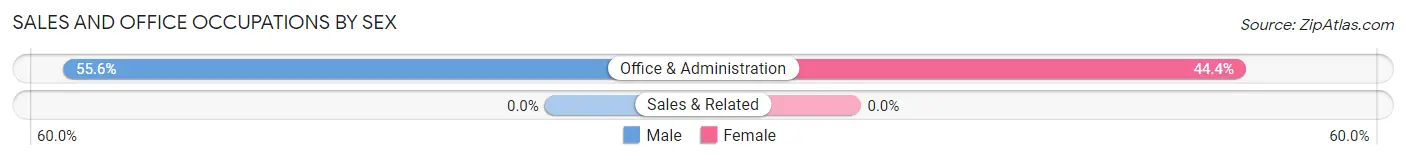
Sales and Office Occupations by Sex
| Occupation | Male | Female |
| Sales & Related | 0 (0.0%) | 0 (0.0%) |
| Office & Administration | 10 (55.6%) | 8 (44.4%) |
| Total (Category) | 10 (55.6%) | 8 (44.4%) |
| Total (Overall) | 91 (45.7%) | 108 (54.3%) |
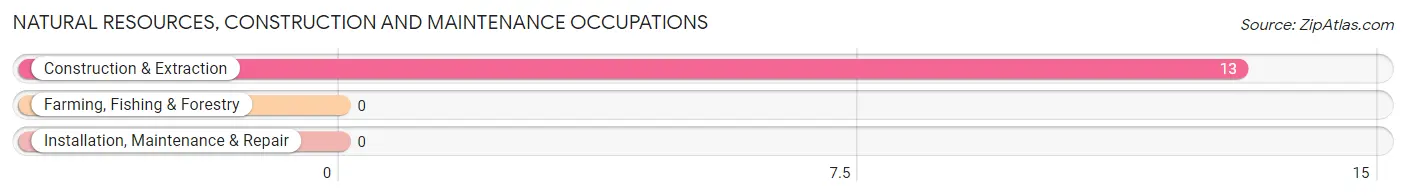
Natural Resources, Construction and Maintenance Occupations
The most common Natural Resources, Construction and Maintenance occupations in Lake Sherwood are , and Construction & Extraction (13 | 6.5%).
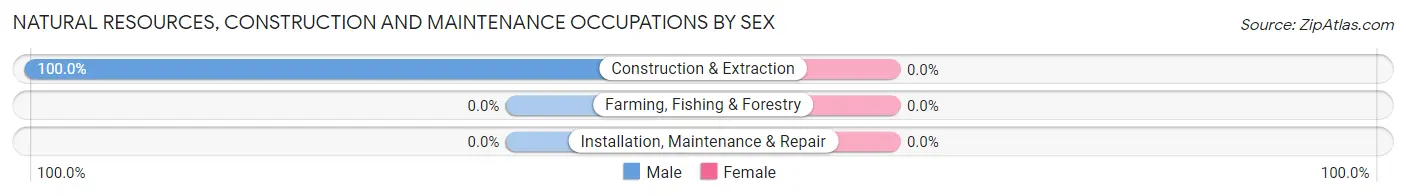
Natural Resources, Construction and Maintenance Occupations by Sex
| Occupation | Male | Female |
| Farming, Fishing & Forestry | 0 (0.0%) | 0 (0.0%) |
| Construction & Extraction | 13 (100.0%) | 0 (0.0%) |
| Installation, Maintenance & Repair | 0 (0.0%) | 0 (0.0%) |
| Total (Category) | 13 (100.0%) | 0 (0.0%) |
| Total (Overall) | 91 (45.7%) | 108 (54.3%) |
Production, Transportation and Moving Occupations
The most common Production, Transportation and Moving occupations in Lake Sherwood are Production (19 | 9.6%), Transportation (17 | 8.5%), and Material Moving (10 | 5.0%).
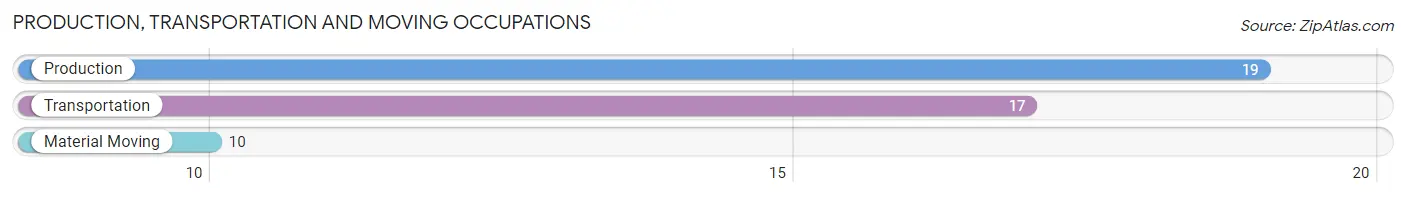
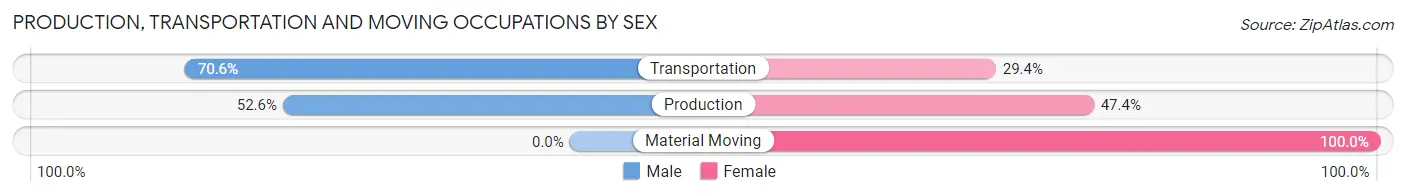
Production, Transportation and Moving Occupations by Sex
| Occupation | Male | Female |
| Production | 10 (52.6%) | 9 (47.4%) |
| Transportation | 12 (70.6%) | 5 (29.4%) |
| Material Moving | 0 (0.0%) | 10 (100.0%) |
| Total (Category) | 22 (47.8%) | 24 (52.2%) |
| Total (Overall) | 91 (45.7%) | 108 (54.3%) |
Employment Industries by Sex in Lake Sherwood
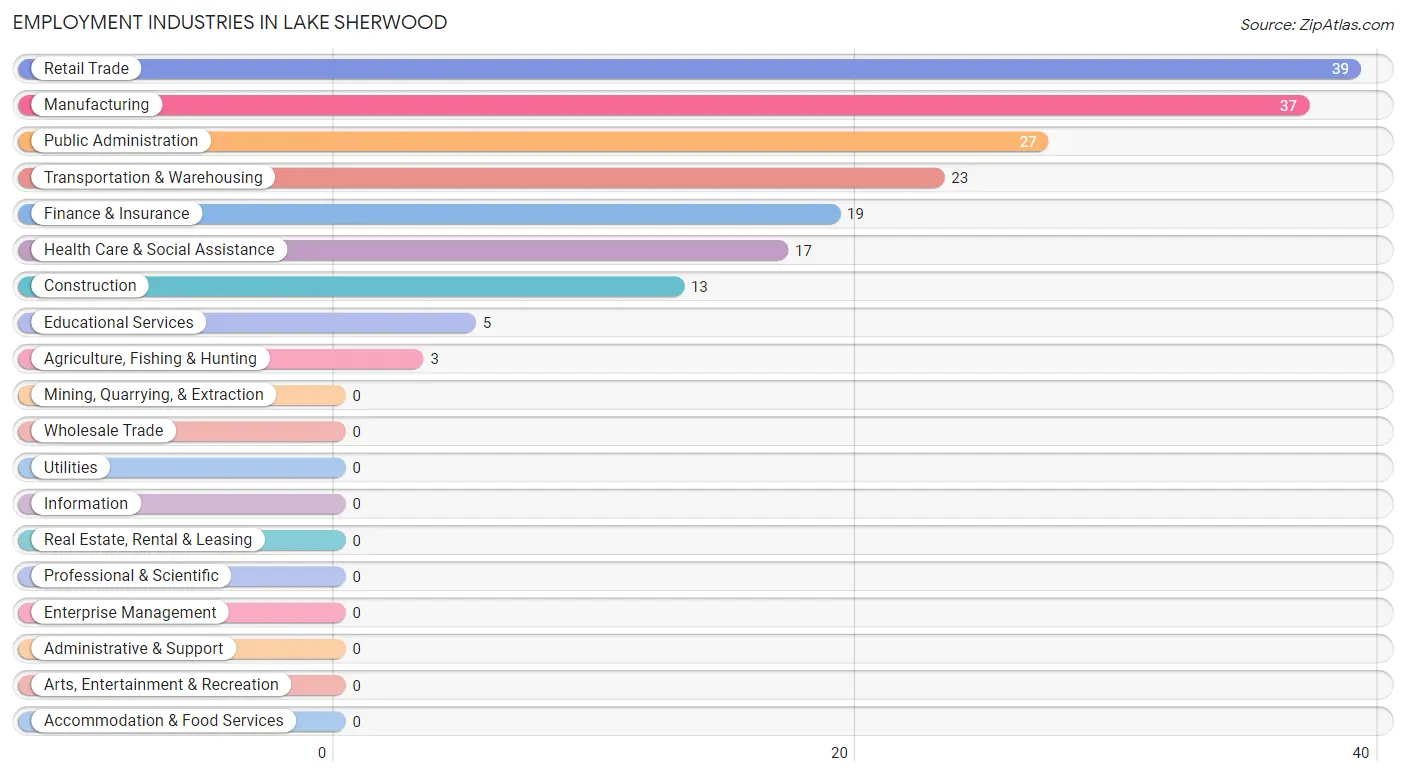
Employment Industries in Lake Sherwood
The major employment industries in Lake Sherwood include Retail Trade (39 | 19.6%), Manufacturing (37 | 18.6%), Public Administration (27 | 13.6%), Transportation & Warehousing (23 | 11.6%), and Finance & Insurance (19 | 9.6%).
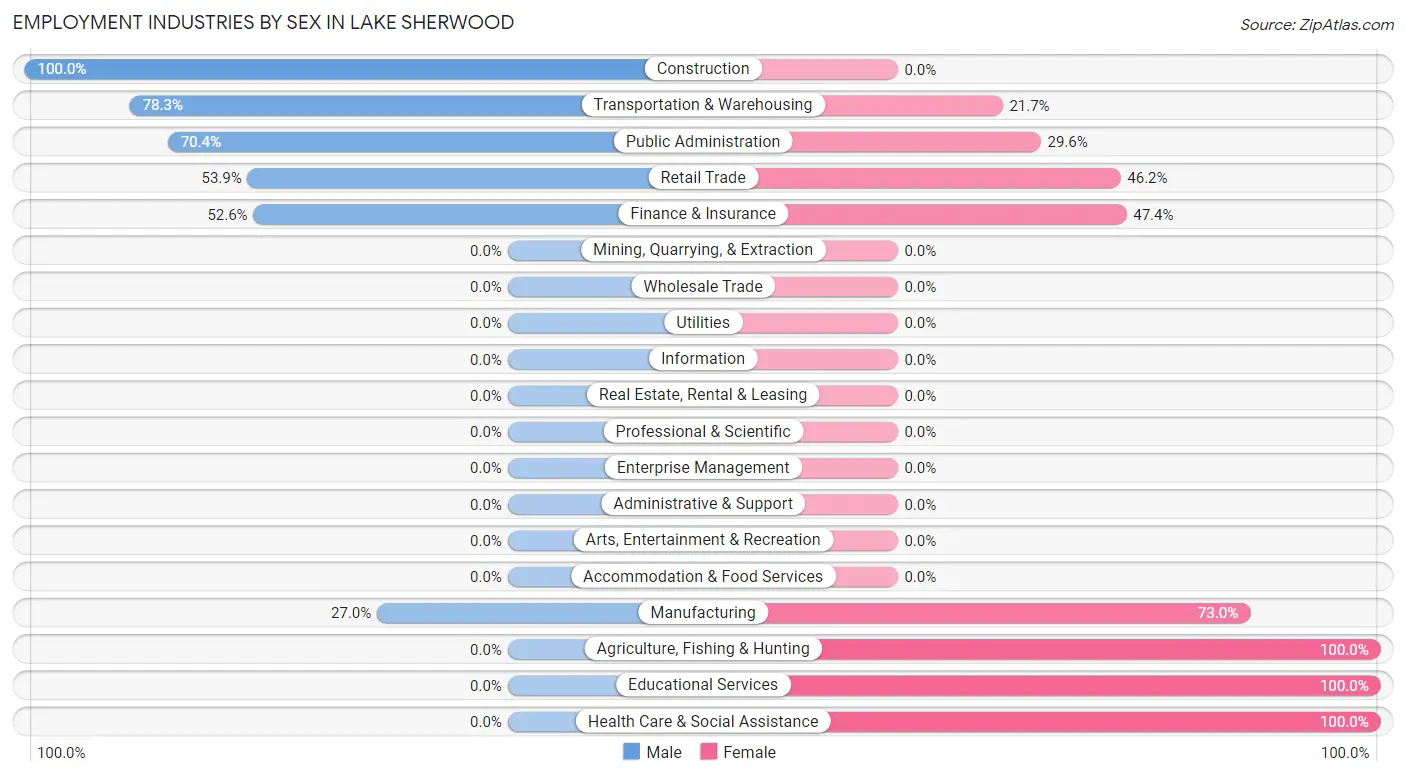
Employment Industries by Sex in Lake Sherwood
The Lake Sherwood industries that see more men than women are Construction (100.0%), Transportation & Warehousing (78.3%), and Public Administration (70.4%), whereas the industries that tend to have a higher number of women are Agriculture, Fishing & Hunting (100.0%), Educational Services (100.0%), and Health Care & Social Assistance (100.0%).
| Industry | Male | Female |
| Agriculture, Fishing & Hunting | 0 (0.0%) | 3 (100.0%) |
| Mining, Quarrying, & Extraction | 0 (0.0%) | 0 (0.0%) |
| Construction | 13 (100.0%) | 0 (0.0%) |
| Manufacturing | 10 (27.0%) | 27 (73.0%) |
| Wholesale Trade | 0 (0.0%) | 0 (0.0%) |
| Retail Trade | 21 (53.8%) | 18 (46.2%) |
| Transportation & Warehousing | 18 (78.3%) | 5 (21.7%) |
| Utilities | 0 (0.0%) | 0 (0.0%) |
| Information | 0 (0.0%) | 0 (0.0%) |
| Finance & Insurance | 10 (52.6%) | 9 (47.4%) |
| Real Estate, Rental & Leasing | 0 (0.0%) | 0 (0.0%) |
| Professional & Scientific | 0 (0.0%) | 0 (0.0%) |
| Enterprise Management | 0 (0.0%) | 0 (0.0%) |
| Administrative & Support | 0 (0.0%) | 0 (0.0%) |
| Educational Services | 0 (0.0%) | 5 (100.0%) |
| Health Care & Social Assistance | 0 (0.0%) | 17 (100.0%) |
| Arts, Entertainment & Recreation | 0 (0.0%) | 0 (0.0%) |
| Accommodation & Food Services | 0 (0.0%) | 0 (0.0%) |
| Public Administration | 19 (70.4%) | 8 (29.6%) |
| Total | 91 (45.7%) | 108 (54.3%) |
Education in Lake Sherwood
School Enrollment in Lake Sherwood
The most common levels of schooling among the 15 students in Lake Sherwood are middle school (8 | 53.3%), and high school (7 | 46.7%).
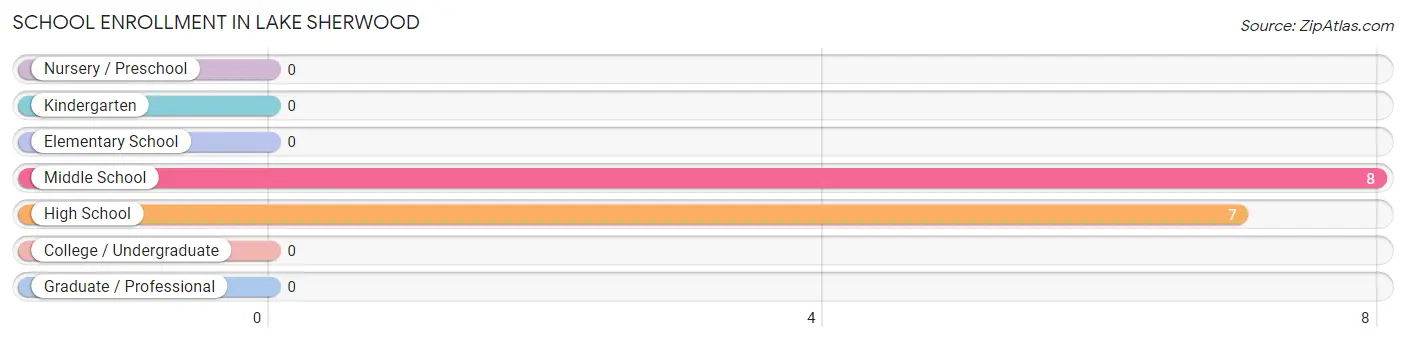
| School Level | # Students | % Students |
| Nursery / Preschool | 0 | 0.0% |
| Kindergarten | 0 | 0.0% |
| Elementary School | 0 | 0.0% |
| Middle School | 8 | 53.3% |
| High School | 7 | 46.7% |
| College / Undergraduate | 0 | 0.0% |
| Graduate / Professional | 0 | 0.0% |
| Total | 15 | 100.0% |
School Enrollment by Age by Funding Source in Lake Sherwood
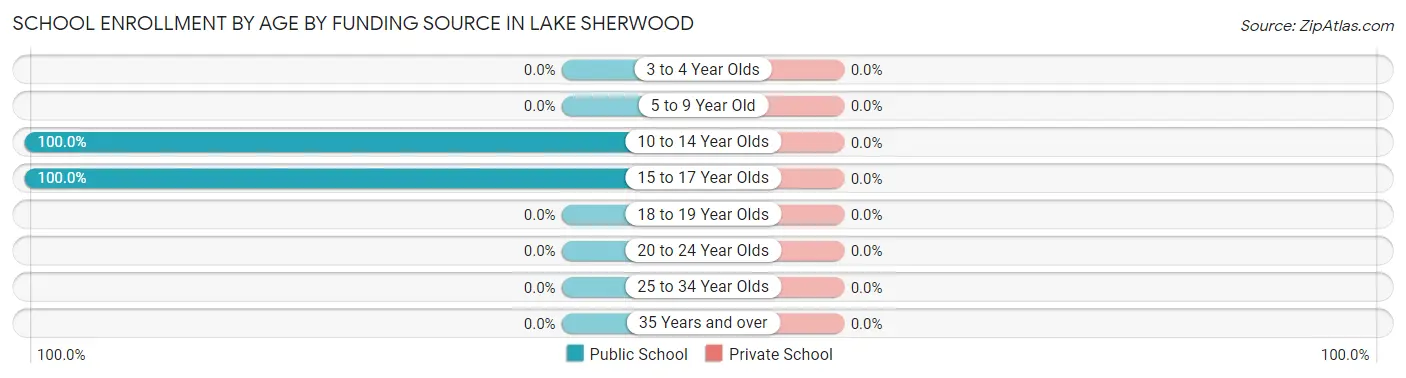
| Age Bracket | Public School | Private School |
| 3 to 4 Year Olds | 0 (0.0%) | 0 (0.0%) |
| 5 to 9 Year Old | 0 (0.0%) | 0 (0.0%) |
| 10 to 14 Year Olds | 8 (100.0%) | 0 (0.0%) |
| 15 to 17 Year Olds | 7 (100.0%) | 0 (0.0%) |
| 18 to 19 Year Olds | 0 (0.0%) | 0 (0.0%) |
| 20 to 24 Year Olds | 0 (0.0%) | 0 (0.0%) |
| 25 to 34 Year Olds | 0 (0.0%) | 0 (0.0%) |
| 35 Years and over | 0 (0.0%) | 0 (0.0%) |
| Total | 15 (100.0%) | 0 (0.0%) |
Educational Attainment by Field of Study in Lake Sherwood
Education (48 | 42.1%), business (25 | 21.9%), science & technology (18 | 15.8%), social sciences (17 | 14.9%), and liberal arts & history (6 | 5.3%) are the most common fields of study among 114 individuals in Lake Sherwood who have obtained a bachelor's degree or higher.
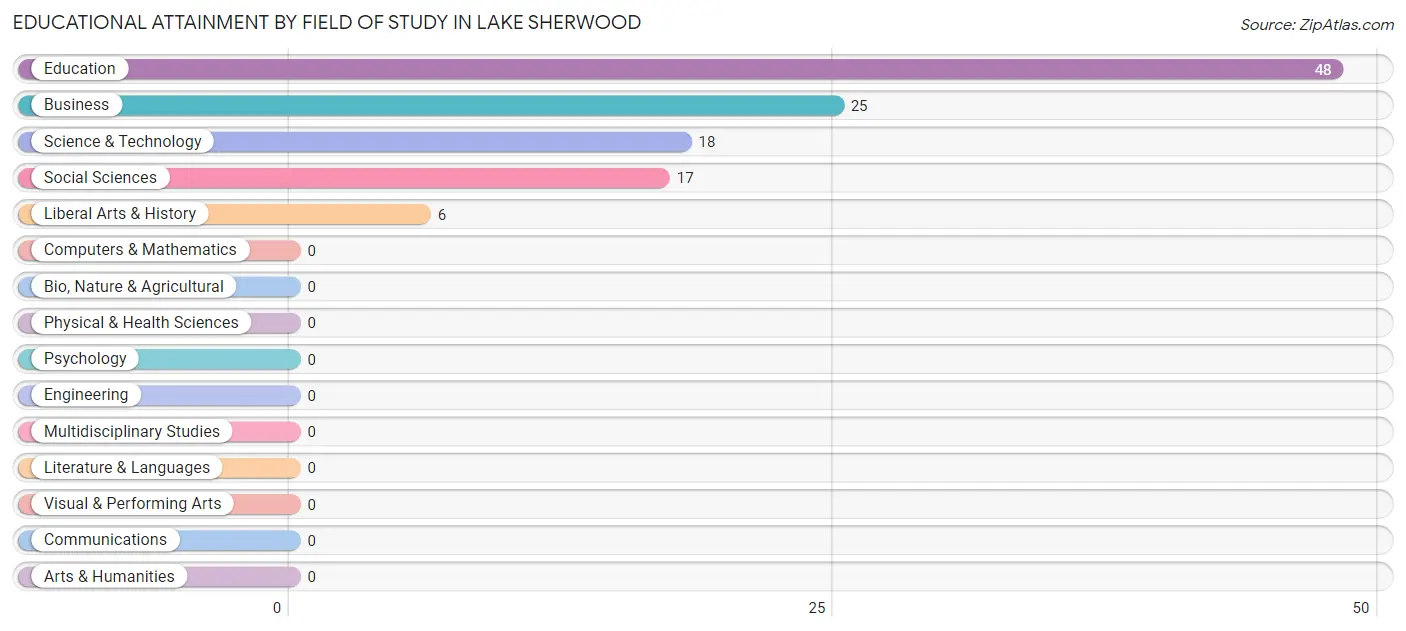
| Field of Study | # Graduates | % Graduates |
| Computers & Mathematics | 0 | 0.0% |
| Bio, Nature & Agricultural | 0 | 0.0% |
| Physical & Health Sciences | 0 | 0.0% |
| Psychology | 0 | 0.0% |
| Social Sciences | 17 | 14.9% |
| Engineering | 0 | 0.0% |
| Multidisciplinary Studies | 0 | 0.0% |
| Science & Technology | 18 | 15.8% |
| Business | 25 | 21.9% |
| Education | 48 | 42.1% |
| Literature & Languages | 0 | 0.0% |
| Liberal Arts & History | 6 | 5.3% |
| Visual & Performing Arts | 0 | 0.0% |
| Communications | 0 | 0.0% |
| Arts & Humanities | 0 | 0.0% |
| Total | 114 | 100.0% |
Transportation & Commute in Lake Sherwood
Vehicle Availability by Sex in Lake Sherwood
The most prevalent vehicle ownership categories in Lake Sherwood are males with 2 vehicles (66, accounting for 72.5%) and females with 2 vehicles (79, making up 64.1%).
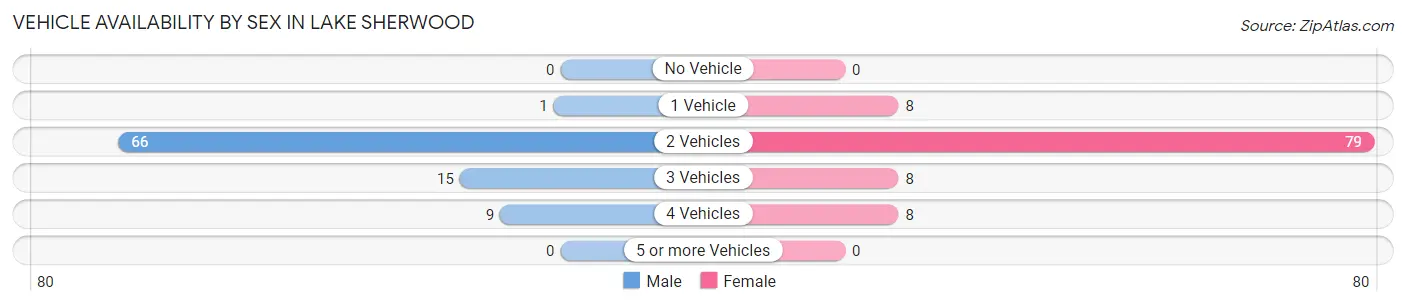
| Vehicles Available | Male | Female |
| No Vehicle | 0 (0.0%) | 0 (0.0%) |
| 1 Vehicle | 1 (1.1%) | 8 (7.8%) |
| 2 Vehicles | 66 (72.5%) | 79 (76.7%) |
| 3 Vehicles | 15 (16.5%) | 8 (7.8%) |
| 4 Vehicles | 9 (9.9%) | 8 (7.8%) |
| 5 or more Vehicles | 0 (0.0%) | 0 (0.0%) |
| Total | 91 (100.0%) | 103 (100.0%) |
Commute Time in Lake Sherwood
The most frequently occuring commute durations in Lake Sherwood are 20 to 24 minutes (38 commuters, 24.8%), 15 to 19 minutes (34 commuters, 22.2%), and 45 to 59 minutes (20 commuters, 13.1%).
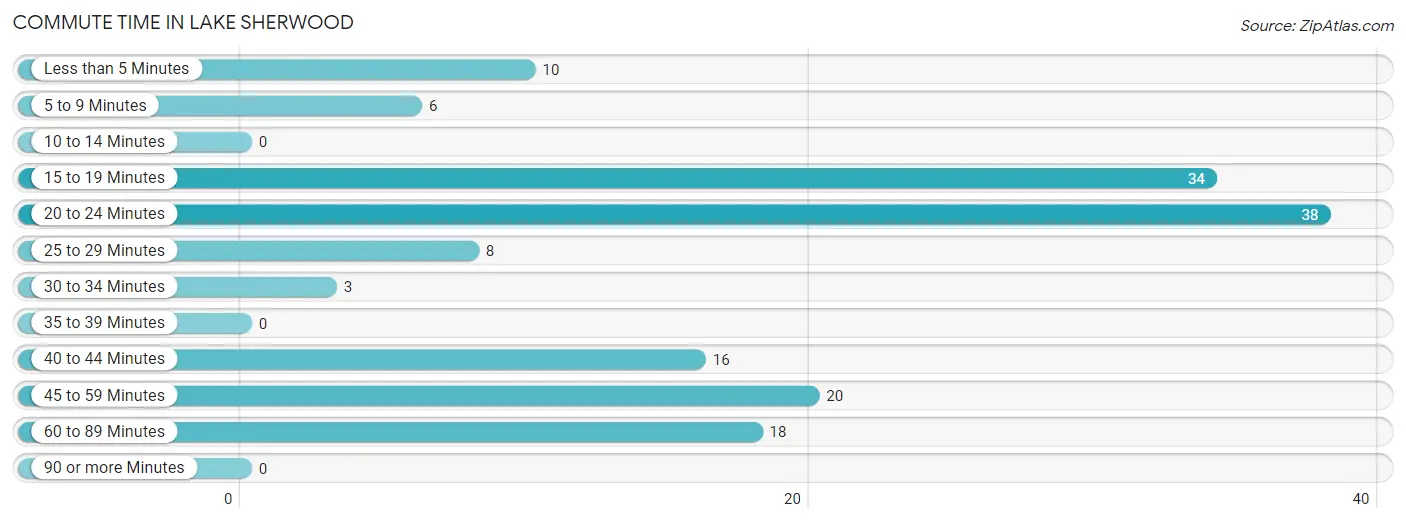
| Commute Time | # Commuters | % Commuters |
| Less than 5 Minutes | 10 | 6.5% |
| 5 to 9 Minutes | 6 | 3.9% |
| 10 to 14 Minutes | 0 | 0.0% |
| 15 to 19 Minutes | 34 | 22.2% |
| 20 to 24 Minutes | 38 | 24.8% |
| 25 to 29 Minutes | 8 | 5.2% |
| 30 to 34 Minutes | 3 | 2.0% |
| 35 to 39 Minutes | 0 | 0.0% |
| 40 to 44 Minutes | 16 | 10.5% |
| 45 to 59 Minutes | 20 | 13.1% |
| 60 to 89 Minutes | 18 | 11.8% |
| 90 or more Minutes | 0 | 0.0% |
Commute Time by Sex in Lake Sherwood
The most common commute times in Lake Sherwood are 20 to 24 minutes (20 commuters, 29.0%) for males and 15 to 19 minutes (20 commuters, 23.8%) for females.
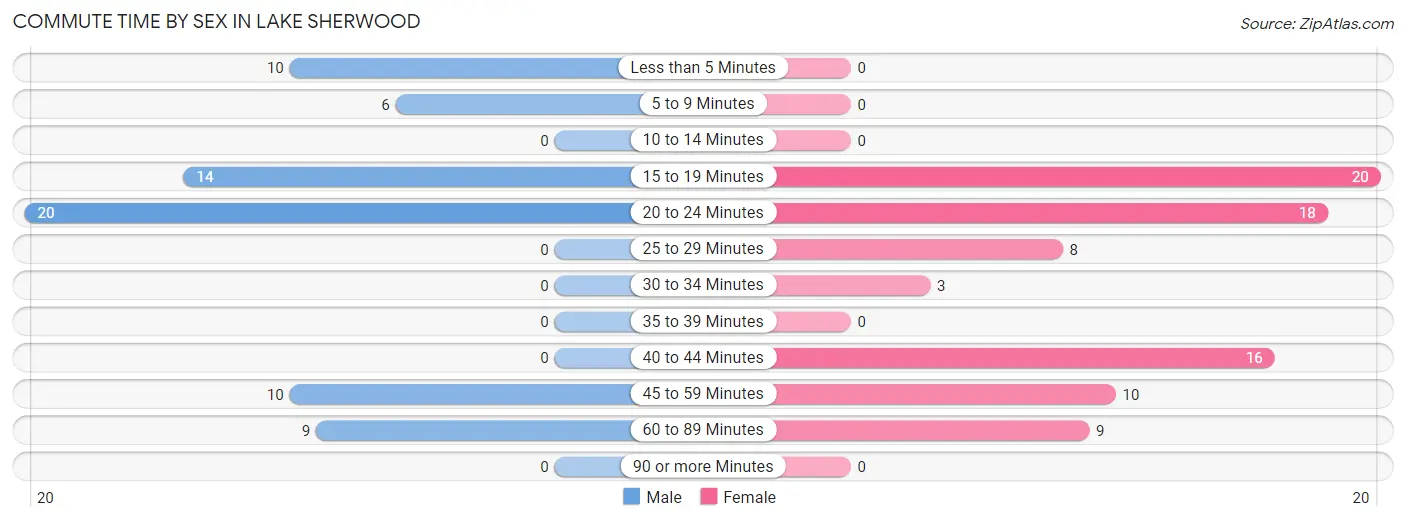
| Commute Time | Male | Female |
| Less than 5 Minutes | 10 (14.5%) | 0 (0.0%) |
| 5 to 9 Minutes | 6 (8.7%) | 0 (0.0%) |
| 10 to 14 Minutes | 0 (0.0%) | 0 (0.0%) |
| 15 to 19 Minutes | 14 (20.3%) | 20 (23.8%) |
| 20 to 24 Minutes | 20 (29.0%) | 18 (21.4%) |
| 25 to 29 Minutes | 0 (0.0%) | 8 (9.5%) |
| 30 to 34 Minutes | 0 (0.0%) | 3 (3.6%) |
| 35 to 39 Minutes | 0 (0.0%) | 0 (0.0%) |
| 40 to 44 Minutes | 0 (0.0%) | 16 (19.1%) |
| 45 to 59 Minutes | 10 (14.5%) | 10 (11.9%) |
| 60 to 89 Minutes | 9 (13.0%) | 9 (10.7%) |
| 90 or more Minutes | 0 (0.0%) | 0 (0.0%) |
Time of Departure to Work by Sex in Lake Sherwood
The most frequent times of departure to work in Lake Sherwood are 8:00 AM to 8:29 AM (18, 26.1%) for males and 7:30 AM to 7:59 AM (24, 28.6%) for females.
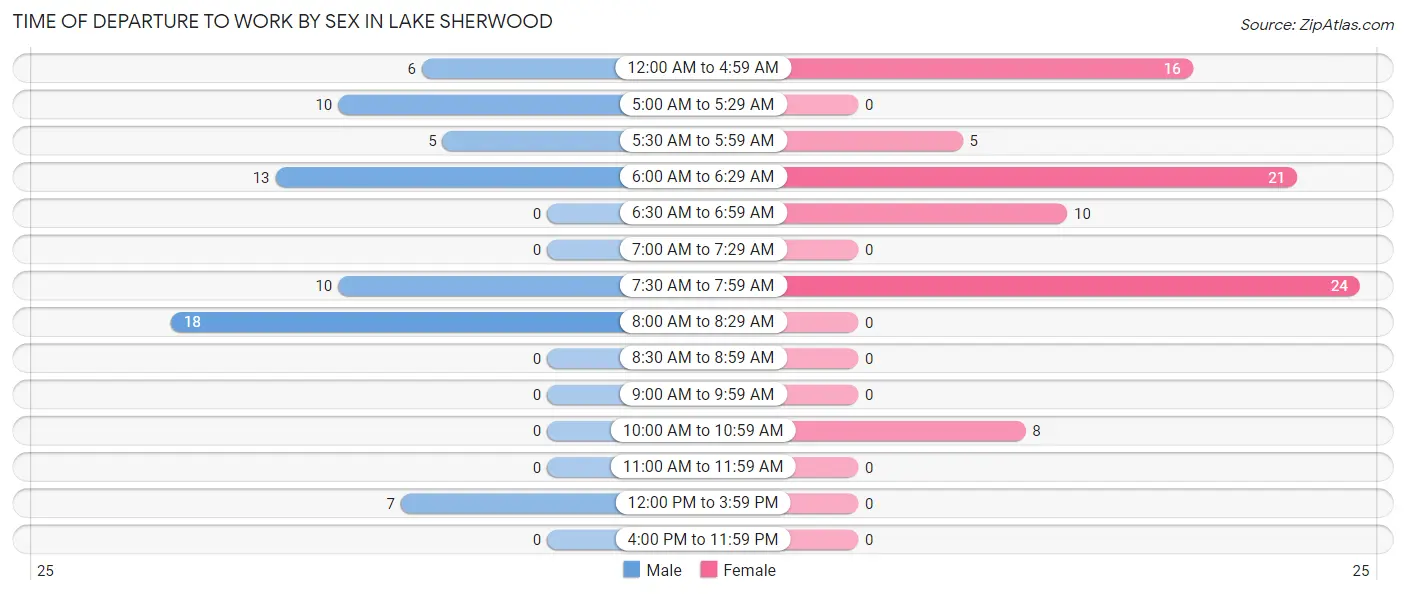
| Time of Departure | Male | Female |
| 12:00 AM to 4:59 AM | 6 (8.7%) | 16 (19.1%) |
| 5:00 AM to 5:29 AM | 10 (14.5%) | 0 (0.0%) |
| 5:30 AM to 5:59 AM | 5 (7.2%) | 5 (5.9%) |
| 6:00 AM to 6:29 AM | 13 (18.8%) | 21 (25.0%) |
| 6:30 AM to 6:59 AM | 0 (0.0%) | 10 (11.9%) |
| 7:00 AM to 7:29 AM | 0 (0.0%) | 0 (0.0%) |
| 7:30 AM to 7:59 AM | 10 (14.5%) | 24 (28.6%) |
| 8:00 AM to 8:29 AM | 18 (26.1%) | 0 (0.0%) |
| 8:30 AM to 8:59 AM | 0 (0.0%) | 0 (0.0%) |
| 9:00 AM to 9:59 AM | 0 (0.0%) | 0 (0.0%) |
| 10:00 AM to 10:59 AM | 0 (0.0%) | 8 (9.5%) |
| 11:00 AM to 11:59 AM | 0 (0.0%) | 0 (0.0%) |
| 12:00 PM to 3:59 PM | 7 (10.1%) | 0 (0.0%) |
| 4:00 PM to 11:59 PM | 0 (0.0%) | 0 (0.0%) |
| Total | 69 (100.0%) | 84 (100.0%) |
Housing Occupancy in Lake Sherwood
Occupancy by Ownership in Lake Sherwood
Of the total 193 dwellings in Lake Sherwood, owner-occupied units account for 192 (99.5%), while renter-occupied units make up 1 (0.5%).
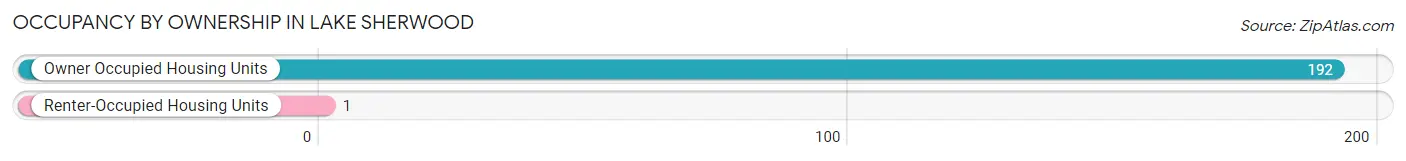
| Occupancy | # Housing Units | % Housing Units |
| Owner Occupied Housing Units | 192 | 99.5% |
| Renter-Occupied Housing Units | 1 | 0.5% |
| Total Occupied Housing Units | 193 | 100.0% |
Occupancy by Household Size in Lake Sherwood
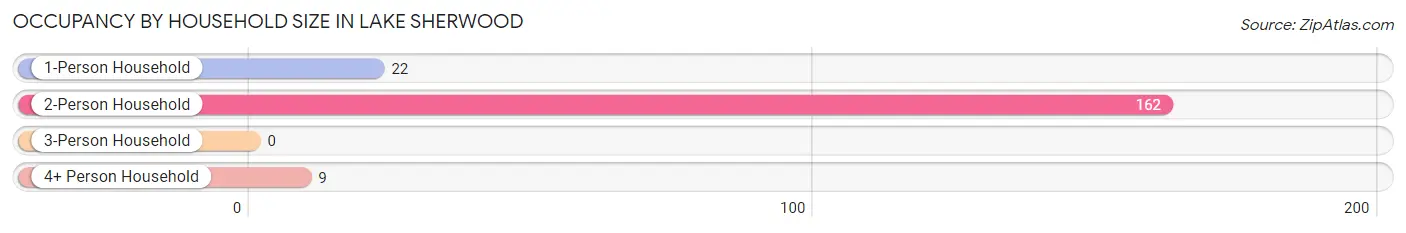
| Household Size | # Housing Units | % Housing Units |
| 1-Person Household | 22 | 11.4% |
| 2-Person Household | 162 | 83.9% |
| 3-Person Household | 0 | 0.0% |
| 4+ Person Household | 9 | 4.7% |
| Total Housing Units | 193 | 100.0% |
Occupancy by Ownership by Household Size in Lake Sherwood
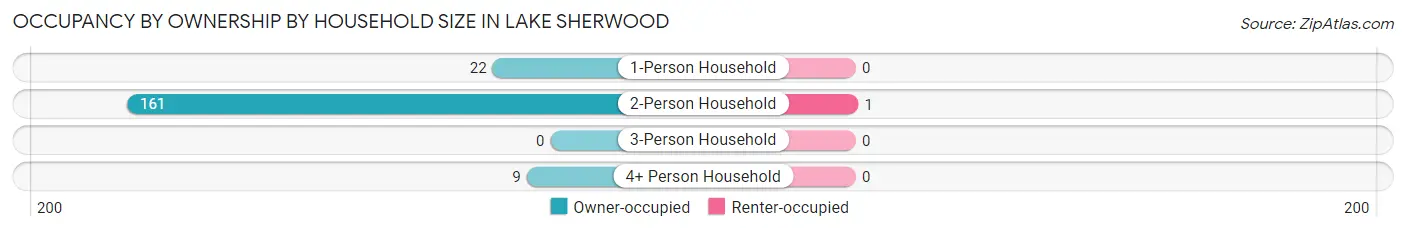
| Household Size | Owner-occupied | Renter-occupied |
| 1-Person Household | 22 (100.0%) | 0 (0.0%) |
| 2-Person Household | 161 (99.4%) | 1 (0.6%) |
| 3-Person Household | 0 (0.0%) | 0 (0.0%) |
| 4+ Person Household | 9 (100.0%) | 0 (0.0%) |
| Total Housing Units | 192 (99.5%) | 1 (0.5%) |
Occupancy by Educational Attainment in Lake Sherwood
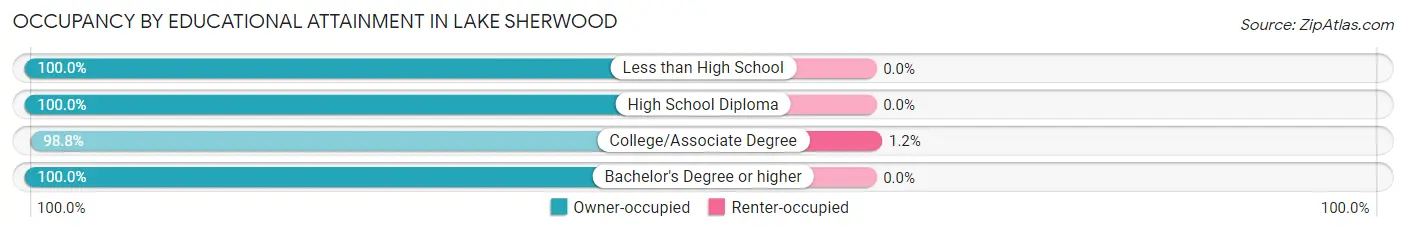
| Household Size | Owner-occupied | Renter-occupied |
| Less than High School | 6 (100.0%) | 0 (0.0%) |
| High School Diploma | 42 (100.0%) | 0 (0.0%) |
| College/Associate Degree | 85 (98.8%) | 1 (1.2%) |
| Bachelor's Degree or higher | 59 (100.0%) | 0 (0.0%) |
Occupancy by Age of Householder in Lake Sherwood
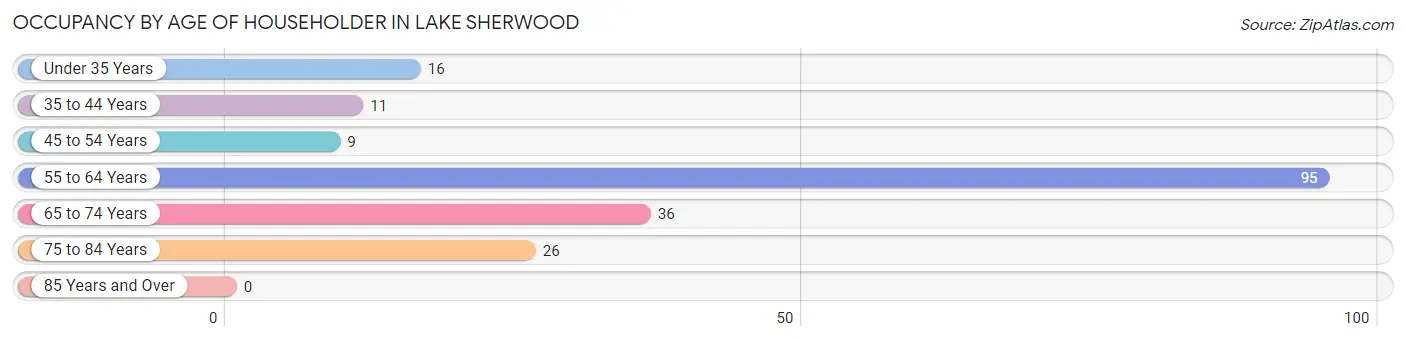
| Age Bracket | # Households | % Households |
| Under 35 Years | 16 | 8.3% |
| 35 to 44 Years | 11 | 5.7% |
| 45 to 54 Years | 9 | 4.7% |
| 55 to 64 Years | 95 | 49.2% |
| 65 to 74 Years | 36 | 18.6% |
| 75 to 84 Years | 26 | 13.5% |
| 85 Years and Over | 0 | 0.0% |
| Total | 193 | 100.0% |
Housing Finances in Lake Sherwood
Median Income by Occupancy in Lake Sherwood
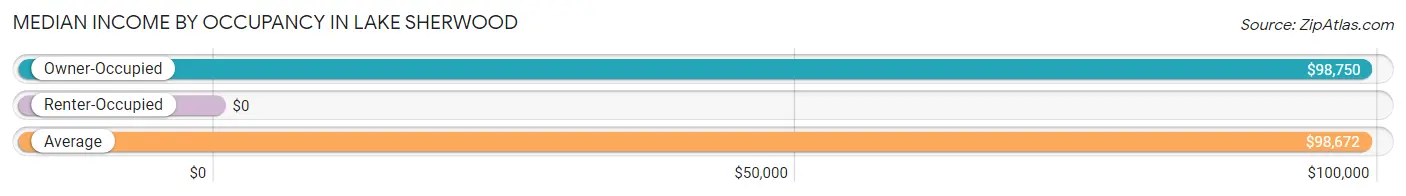
| Occupancy Type | # Households | Median Income |
| Owner-Occupied | 192 (99.5%) | $98,750 |
| Renter-Occupied | 1 (0.5%) | $0 |
| Average | 193 (100.0%) | $98,672 |
Occupancy by Householder Income Bracket in Lake Sherwood
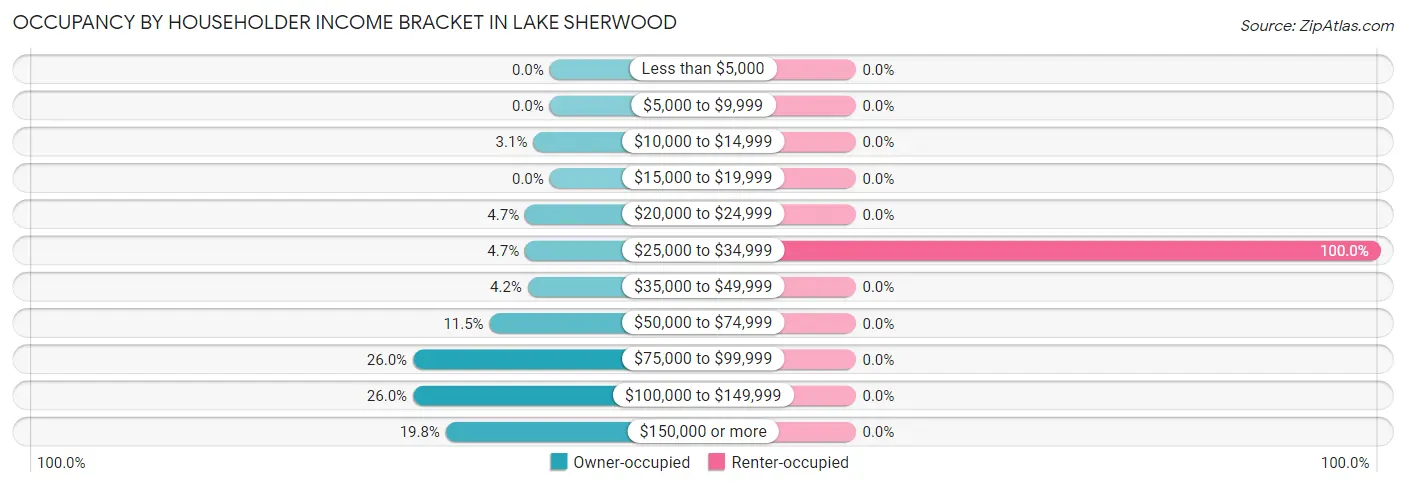
| Income Bracket | Owner-occupied | Renter-occupied |
| Less than $5,000 | 0 (0.0%) | 0 (0.0%) |
| $5,000 to $9,999 | 0 (0.0%) | 0 (0.0%) |
| $10,000 to $14,999 | 6 (3.1%) | 0 (0.0%) |
| $15,000 to $19,999 | 0 (0.0%) | 0 (0.0%) |
| $20,000 to $24,999 | 9 (4.7%) | 0 (0.0%) |
| $25,000 to $34,999 | 9 (4.7%) | 1 (100.0%) |
| $35,000 to $49,999 | 8 (4.2%) | 0 (0.0%) |
| $50,000 to $74,999 | 22 (11.5%) | 0 (0.0%) |
| $75,000 to $99,999 | 50 (26.0%) | 0 (0.0%) |
| $100,000 to $149,999 | 50 (26.0%) | 0 (0.0%) |
| $150,000 or more | 38 (19.8%) | 0 (0.0%) |
| Total | 192 (100.0%) | 1 (100.0%) |
Monthly Housing Cost Tiers in Lake Sherwood
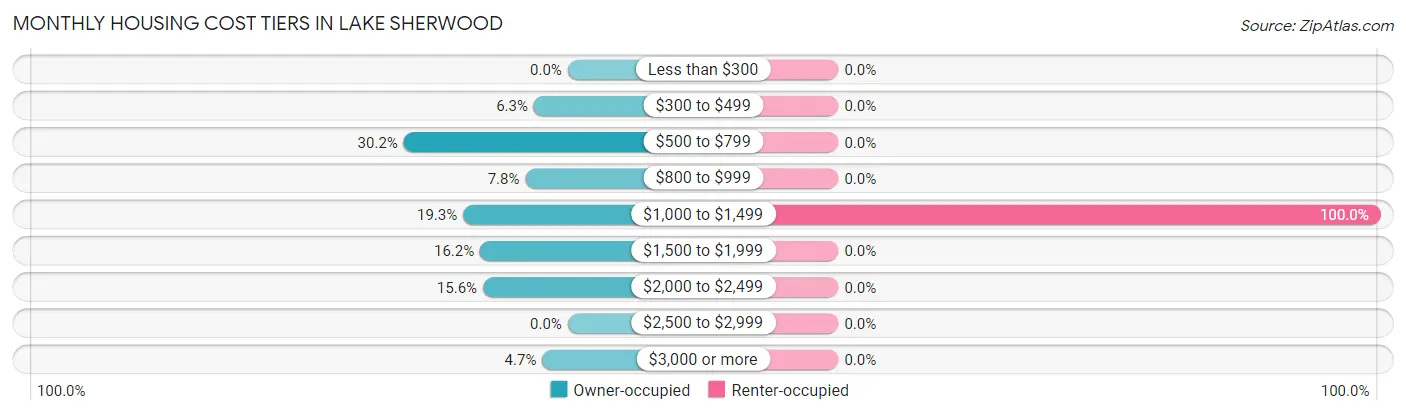
| Monthly Cost | Owner-occupied | Renter-occupied |
| Less than $300 | 0 (0.0%) | 0 (0.0%) |
| $300 to $499 | 12 (6.2%) | 0 (0.0%) |
| $500 to $799 | 58 (30.2%) | 0 (0.0%) |
| $800 to $999 | 15 (7.8%) | 0 (0.0%) |
| $1,000 to $1,499 | 37 (19.3%) | 1 (100.0%) |
| $1,500 to $1,999 | 31 (16.2%) | 0 (0.0%) |
| $2,000 to $2,499 | 30 (15.6%) | 0 (0.0%) |
| $2,500 to $2,999 | 0 (0.0%) | 0 (0.0%) |
| $3,000 or more | 9 (4.7%) | 0 (0.0%) |
| Total | 192 (100.0%) | 1 (100.0%) |
Physical Housing Characteristics in Lake Sherwood
Housing Structures in Lake Sherwood
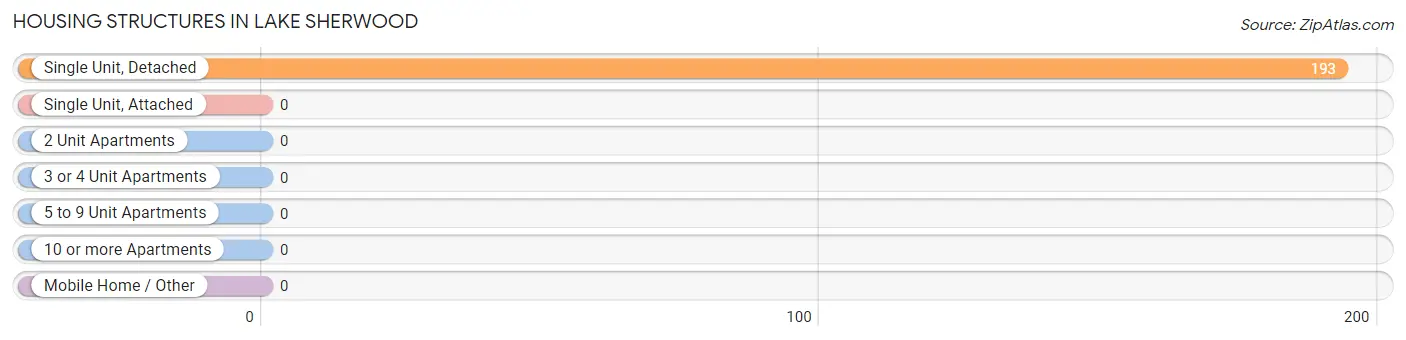
| Structure Type | # Housing Units | % Housing Units |
| Single Unit, Detached | 193 | 100.0% |
| Single Unit, Attached | 0 | 0.0% |
| 2 Unit Apartments | 0 | 0.0% |
| 3 or 4 Unit Apartments | 0 | 0.0% |
| 5 to 9 Unit Apartments | 0 | 0.0% |
| 10 or more Apartments | 0 | 0.0% |
| Mobile Home / Other | 0 | 0.0% |
| Total | 193 | 100.0% |
Housing Structures by Occupancy in Lake Sherwood
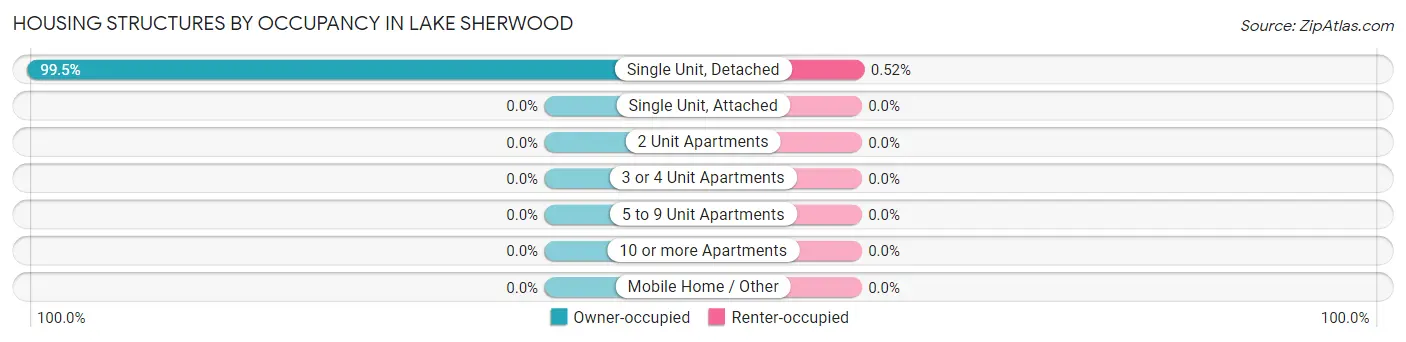
| Structure Type | Owner-occupied | Renter-occupied |
| Single Unit, Detached | 192 (99.5%) | 1 (0.5%) |
| Single Unit, Attached | 0 (0.0%) | 0 (0.0%) |
| 2 Unit Apartments | 0 (0.0%) | 0 (0.0%) |
| 3 or 4 Unit Apartments | 0 (0.0%) | 0 (0.0%) |
| 5 to 9 Unit Apartments | 0 (0.0%) | 0 (0.0%) |
| 10 or more Apartments | 0 (0.0%) | 0 (0.0%) |
| Mobile Home / Other | 0 (0.0%) | 0 (0.0%) |
| Total | 192 (99.5%) | 1 (0.5%) |
Housing Structures by Number of Rooms in Lake Sherwood
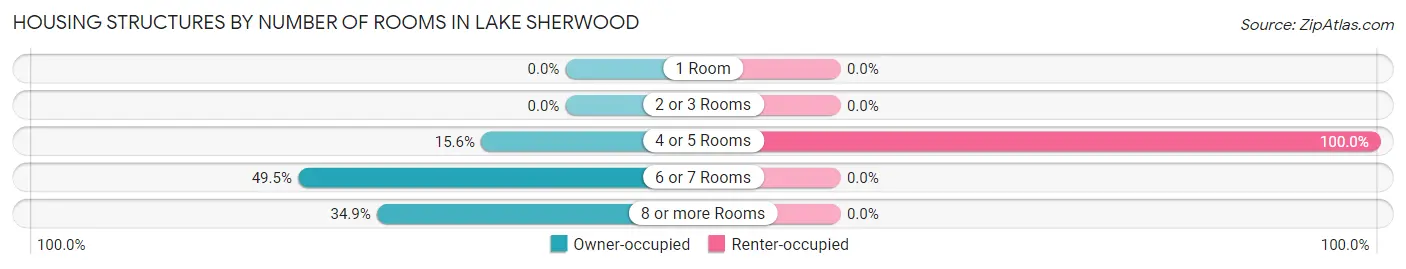
| Number of Rooms | Owner-occupied | Renter-occupied |
| 1 Room | 0 (0.0%) | 0 (0.0%) |
| 2 or 3 Rooms | 0 (0.0%) | 0 (0.0%) |
| 4 or 5 Rooms | 30 (15.6%) | 1 (100.0%) |
| 6 or 7 Rooms | 95 (49.5%) | 0 (0.0%) |
| 8 or more Rooms | 67 (34.9%) | 0 (0.0%) |
| Total | 192 (100.0%) | 1 (100.0%) |
Housing Structure by Heating Type in Lake Sherwood
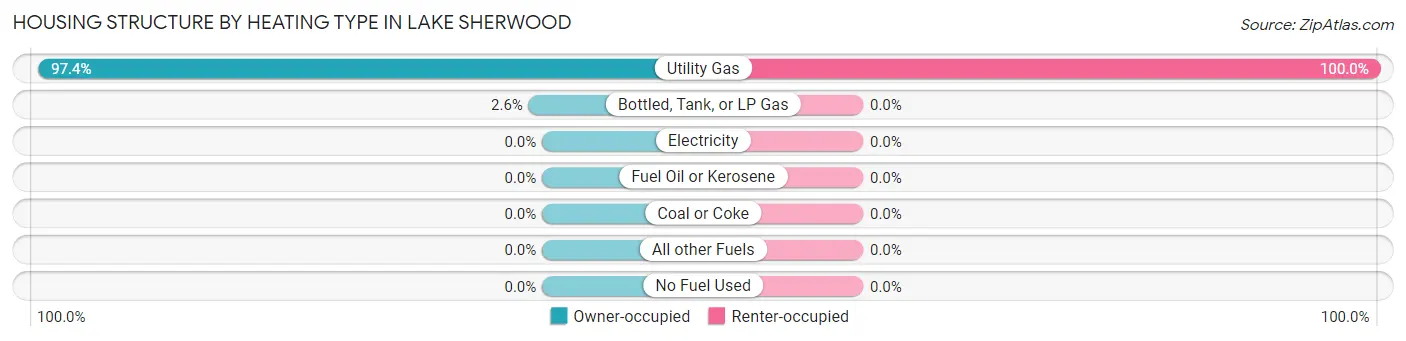
| Heating Type | Owner-occupied | Renter-occupied |
| Utility Gas | 187 (97.4%) | 1 (100.0%) |
| Bottled, Tank, or LP Gas | 5 (2.6%) | 0 (0.0%) |
| Electricity | 0 (0.0%) | 0 (0.0%) |
| Fuel Oil or Kerosene | 0 (0.0%) | 0 (0.0%) |
| Coal or Coke | 0 (0.0%) | 0 (0.0%) |
| All other Fuels | 0 (0.0%) | 0 (0.0%) |
| No Fuel Used | 0 (0.0%) | 0 (0.0%) |
| Total | 192 (100.0%) | 1 (100.0%) |
Household Vehicle Usage in Lake Sherwood
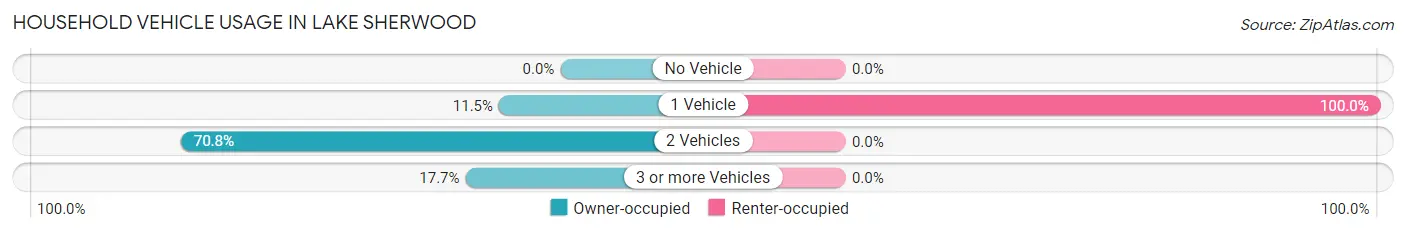
| Vehicles per Household | Owner-occupied | Renter-occupied |
| No Vehicle | 0 (0.0%) | 0 (0.0%) |
| 1 Vehicle | 22 (11.5%) | 1 (100.0%) |
| 2 Vehicles | 136 (70.8%) | 0 (0.0%) |
| 3 or more Vehicles | 34 (17.7%) | 0 (0.0%) |
| Total | 192 (100.0%) | 1 (100.0%) |
Real Estate & Mortgages in Lake Sherwood
Real Estate and Mortgage Overview in Lake Sherwood
| Characteristic | Without Mortgage | With Mortgage |
| Housing Units | 79 | 113 |
| Median Property Value | $271,000 | $272,400 |
| Median Household Income | $83,646 | $30 |
| Monthly Housing Costs | $642 | $9 |
| Real Estate Taxes | $4,420 | $0 |
Property Value by Mortgage Status in Lake Sherwood
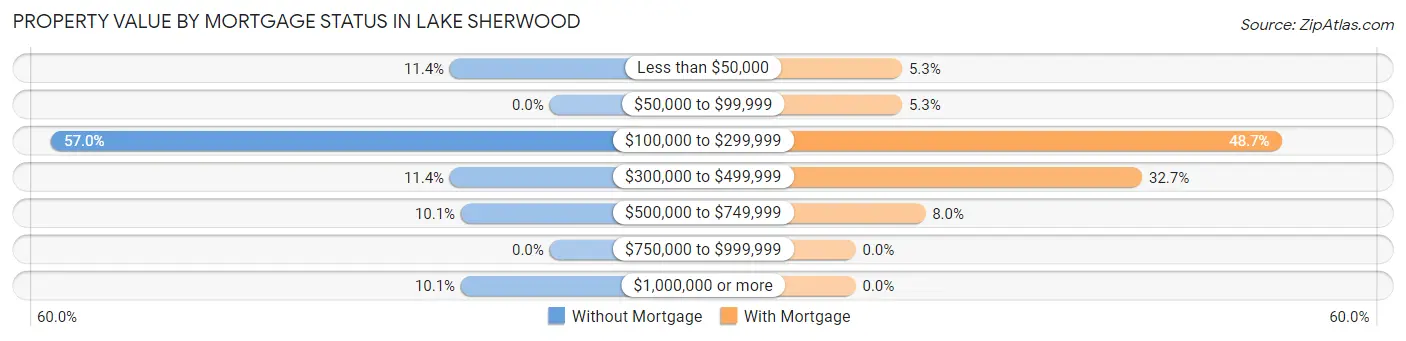
| Property Value | Without Mortgage | With Mortgage |
| Less than $50,000 | 9 (11.4%) | 6 (5.3%) |
| $50,000 to $99,999 | 0 (0.0%) | 6 (5.3%) |
| $100,000 to $299,999 | 45 (57.0%) | 55 (48.7%) |
| $300,000 to $499,999 | 9 (11.4%) | 37 (32.7%) |
| $500,000 to $749,999 | 8 (10.1%) | 9 (8.0%) |
| $750,000 to $999,999 | 0 (0.0%) | 0 (0.0%) |
| $1,000,000 or more | 8 (10.1%) | 0 (0.0%) |
| Total | 79 (100.0%) | 113 (100.0%) |
Household Income by Mortgage Status in Lake Sherwood
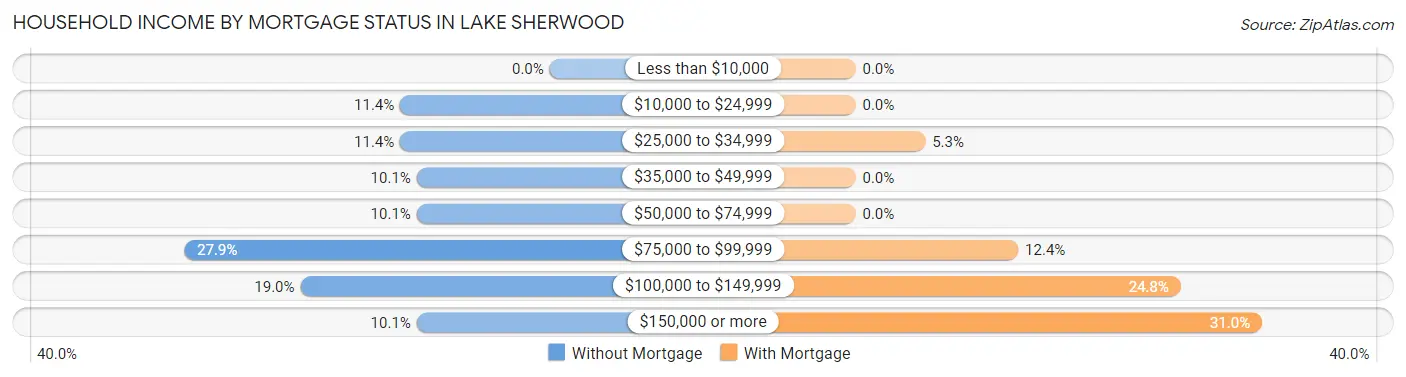
| Household Income | Without Mortgage | With Mortgage |
| Less than $10,000 | 0 (0.0%) | 0 (0.0%) |
| $10,000 to $24,999 | 9 (11.4%) | 0 (0.0%) |
| $25,000 to $34,999 | 9 (11.4%) | 6 (5.3%) |
| $35,000 to $49,999 | 8 (10.1%) | 0 (0.0%) |
| $50,000 to $74,999 | 8 (10.1%) | 0 (0.0%) |
| $75,000 to $99,999 | 22 (27.9%) | 14 (12.4%) |
| $100,000 to $149,999 | 15 (19.0%) | 28 (24.8%) |
| $150,000 or more | 8 (10.1%) | 35 (31.0%) |
| Total | 79 (100.0%) | 113 (100.0%) |
Property Value to Household Income Ratio in Lake Sherwood
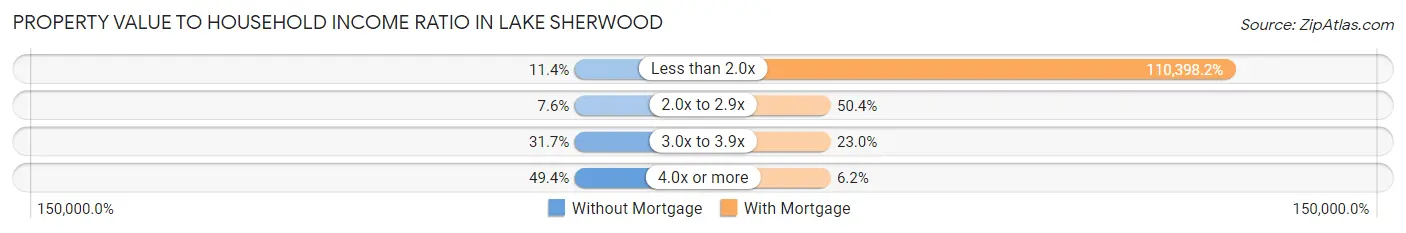
| Value-to-Income Ratio | Without Mortgage | With Mortgage |
| Less than 2.0x | 9 (11.4%) | 124,750 (110,398.2%) |
| 2.0x to 2.9x | 6 (7.6%) | 57 (50.4%) |
| 3.0x to 3.9x | 25 (31.7%) | 26 (23.0%) |
| 4.0x or more | 39 (49.4%) | 7 (6.2%) |
| Total | 79 (100.0%) | 113 (100.0%) |
Real Estate Taxes by Mortgage Status in Lake Sherwood
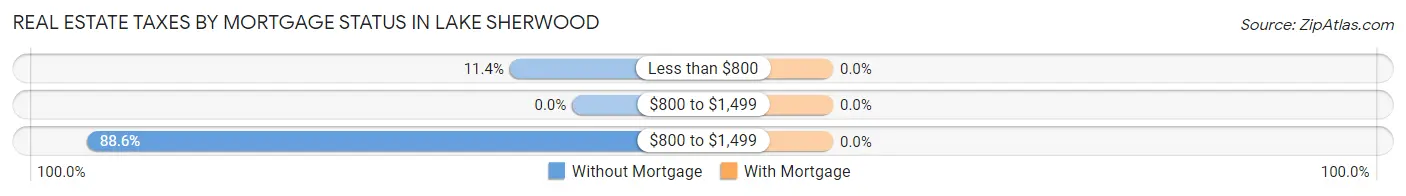
| Property Taxes | Without Mortgage | With Mortgage |
| Less than $800 | 9 (11.4%) | 0 (0.0%) |
| $800 to $1,499 | 0 (0.0%) | 0 (0.0%) |
| $800 to $1,499 | 70 (88.6%) | 0 (0.0%) |
| Total | 79 (100.0%) | 113 (100.0%) |
Health & Disability in Lake Sherwood
Health Insurance Coverage by Age in Lake Sherwood
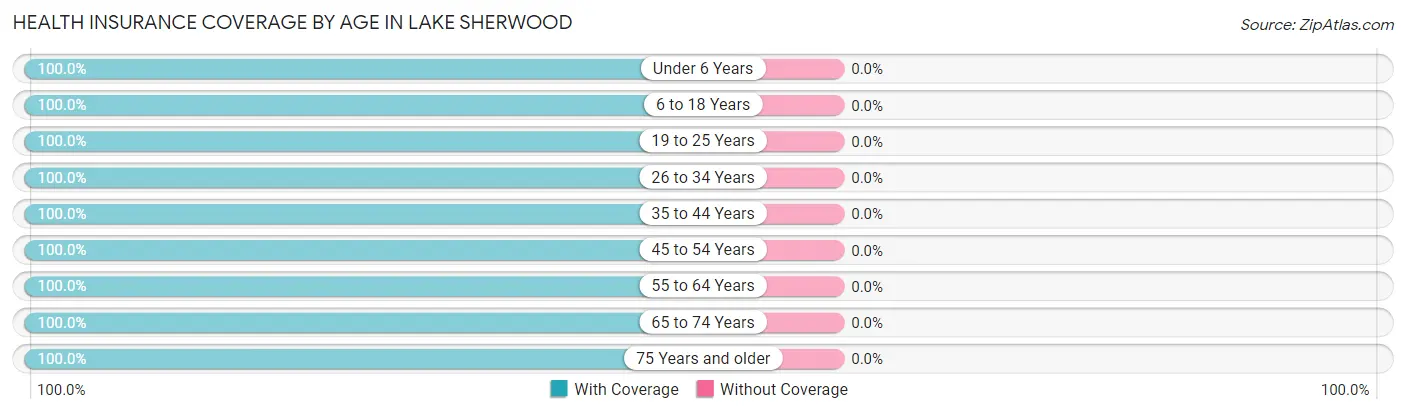
| Age Bracket | With Coverage | Without Coverage |
| Under 6 Years | 11 (100.0%) | 0 (0.0%) |
| 6 to 18 Years | 15 (100.0%) | 0 (0.0%) |
| 19 to 25 Years | 16 (100.0%) | 0 (0.0%) |
| 26 to 34 Years | 13 (100.0%) | 0 (0.0%) |
| 35 to 44 Years | 14 (100.0%) | 0 (0.0%) |
| 45 to 54 Years | 29 (100.0%) | 0 (0.0%) |
| 55 to 64 Years | 156 (100.0%) | 0 (0.0%) |
| 65 to 74 Years | 59 (100.0%) | 0 (0.0%) |
| 75 Years and older | 65 (100.0%) | 0 (0.0%) |
| Total | 378 (100.0%) | 0 (0.0%) |
Health Insurance Coverage by Citizenship Status in Lake Sherwood
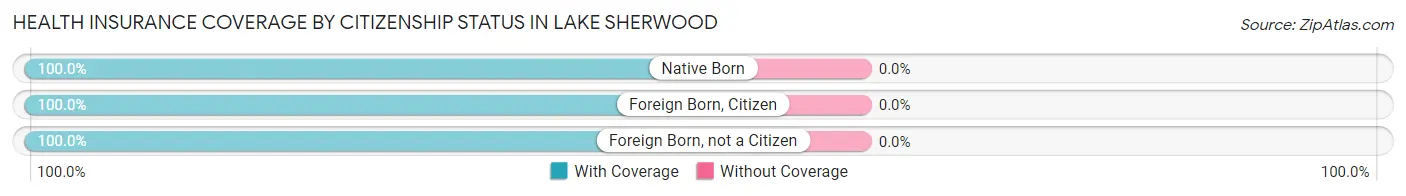
| Citizenship Status | With Coverage | Without Coverage |
| Native Born | 11 (100.0%) | 0 (0.0%) |
| Foreign Born, Citizen | 15 (100.0%) | 0 (0.0%) |
| Foreign Born, not a Citizen | 16 (100.0%) | 0 (0.0%) |
Health Insurance Coverage by Household Income in Lake Sherwood
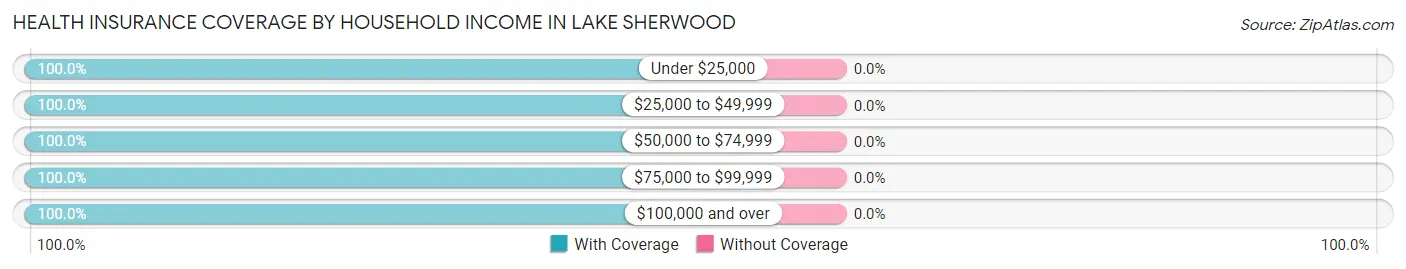
| Household Income | With Coverage | Without Coverage |
| Under $25,000 | 31 (100.0%) | 0 (0.0%) |
| $25,000 to $49,999 | 29 (100.0%) | 0 (0.0%) |
| $50,000 to $74,999 | 30 (100.0%) | 0 (0.0%) |
| $75,000 to $99,999 | 92 (100.0%) | 0 (0.0%) |
| $100,000 and over | 196 (100.0%) | 0 (0.0%) |
Public vs Private Health Insurance Coverage by Age in Lake Sherwood
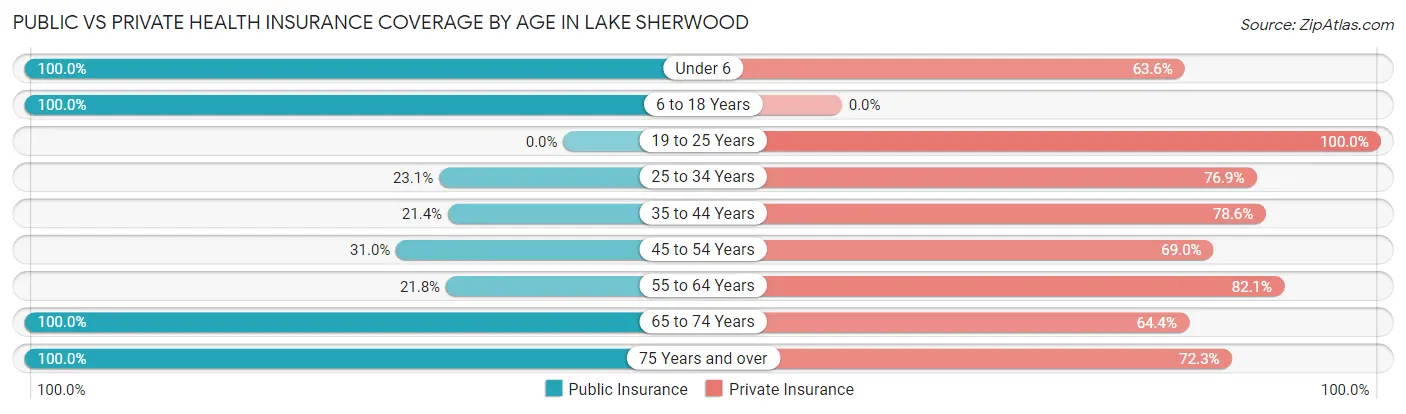
| Age Bracket | Public Insurance | Private Insurance |
| Under 6 | 11 (100.0%) | 7 (63.6%) |
| 6 to 18 Years | 15 (100.0%) | 0 (0.0%) |
| 19 to 25 Years | 0 (0.0%) | 16 (100.0%) |
| 25 to 34 Years | 3 (23.1%) | 10 (76.9%) |
| 35 to 44 Years | 3 (21.4%) | 11 (78.6%) |
| 45 to 54 Years | 9 (31.0%) | 20 (69.0%) |
| 55 to 64 Years | 34 (21.8%) | 128 (82.1%) |
| 65 to 74 Years | 59 (100.0%) | 38 (64.4%) |
| 75 Years and over | 65 (100.0%) | 47 (72.3%) |
| Total | 199 (52.6%) | 277 (73.3%) |
Disability Status by Sex by Age in Lake Sherwood
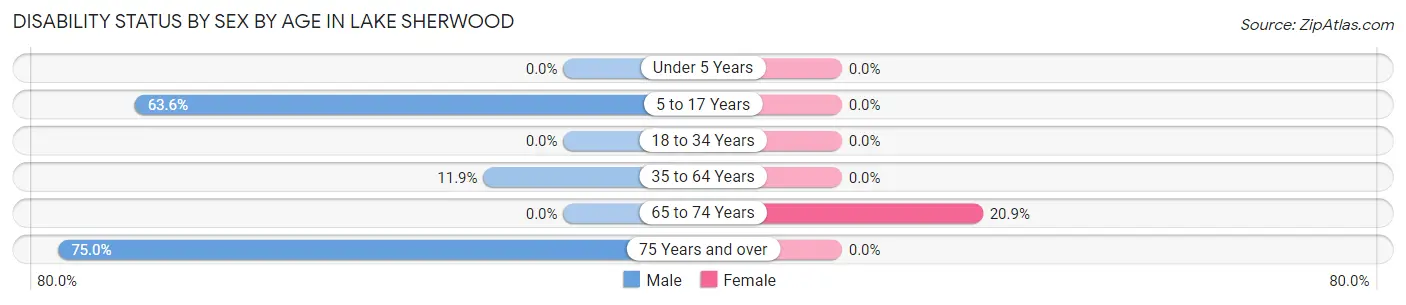
| Age Bracket | Male | Female |
| Under 5 Years | 0 (0.0%) | 0 (0.0%) |
| 5 to 17 Years | 7 (63.6%) | 0 (0.0%) |
| 18 to 34 Years | 0 (0.0%) | 0 (0.0%) |
| 35 to 64 Years | 12 (11.9%) | 0 (0.0%) |
| 65 to 74 Years | 0 (0.0%) | 9 (20.9%) |
| 75 Years and over | 27 (75.0%) | 0 (0.0%) |
Disability Class by Sex by Age in Lake Sherwood
Disability Class: Hearing Difficulty
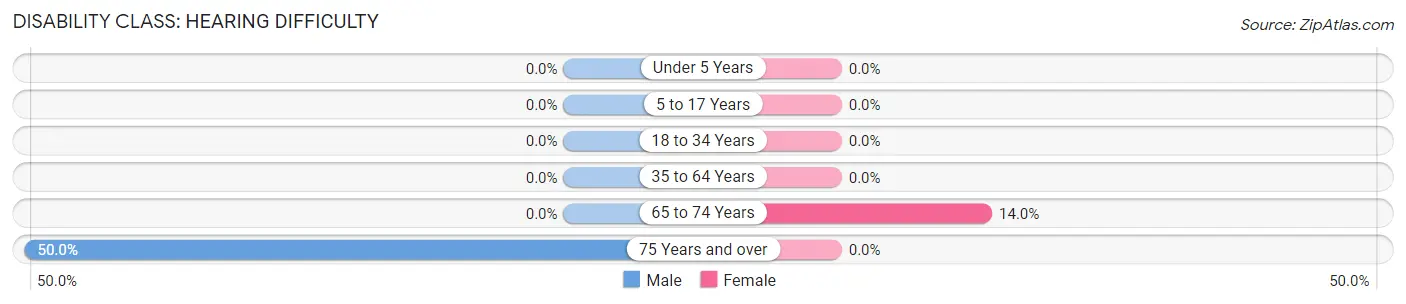
| Age Bracket | Male | Female |
| Under 5 Years | 0 (0.0%) | 0 (0.0%) |
| 5 to 17 Years | 0 (0.0%) | 0 (0.0%) |
| 18 to 34 Years | 0 (0.0%) | 0 (0.0%) |
| 35 to 64 Years | 0 (0.0%) | 0 (0.0%) |
| 65 to 74 Years | 0 (0.0%) | 6 (14.0%) |
| 75 Years and over | 18 (50.0%) | 0 (0.0%) |
Disability Class: Vision Difficulty
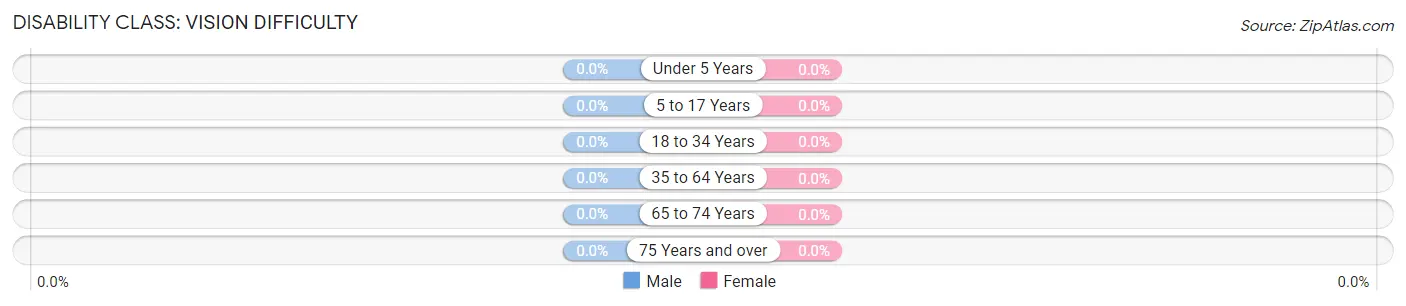
| Age Bracket | Male | Female |
| Under 5 Years | 0 (0.0%) | 0 (0.0%) |
| 5 to 17 Years | 0 (0.0%) | 0 (0.0%) |
| 18 to 34 Years | 0 (0.0%) | 0 (0.0%) |
| 35 to 64 Years | 0 (0.0%) | 0 (0.0%) |
| 65 to 74 Years | 0 (0.0%) | 0 (0.0%) |
| 75 Years and over | 0 (0.0%) | 0 (0.0%) |
Disability Class: Cognitive Difficulty
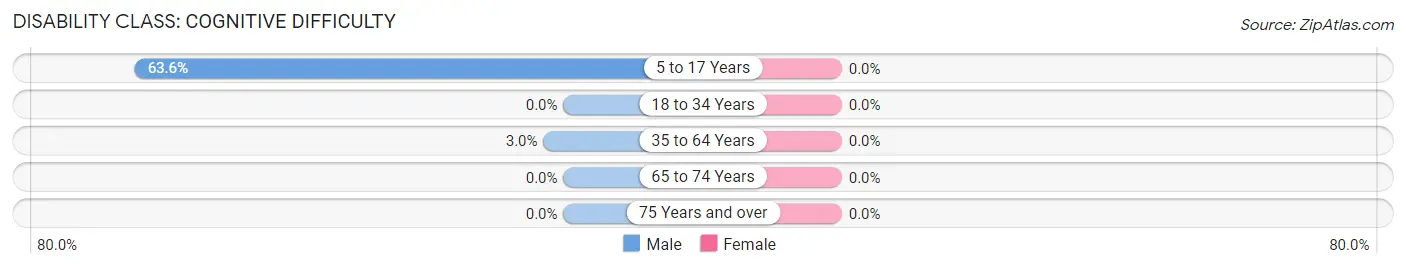
| Age Bracket | Male | Female |
| 5 to 17 Years | 7 (63.6%) | 0 (0.0%) |
| 18 to 34 Years | 0 (0.0%) | 0 (0.0%) |
| 35 to 64 Years | 3 (3.0%) | 0 (0.0%) |
| 65 to 74 Years | 0 (0.0%) | 0 (0.0%) |
| 75 Years and over | 0 (0.0%) | 0 (0.0%) |
Disability Class: Ambulatory Difficulty
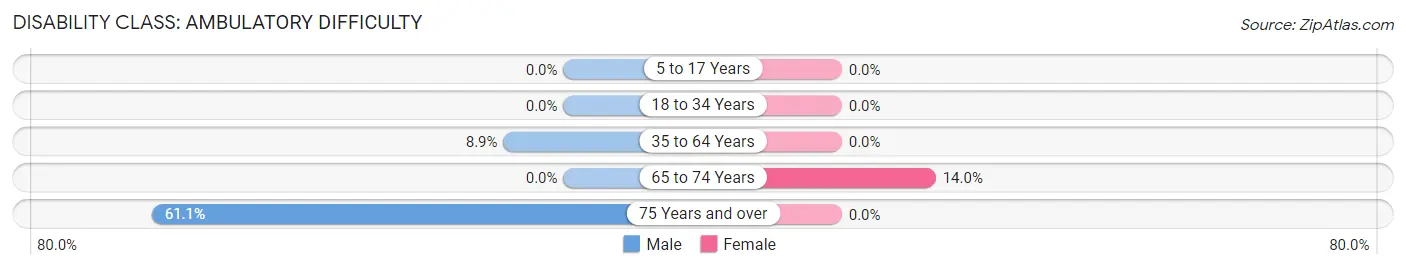
| Age Bracket | Male | Female |
| 5 to 17 Years | 0 (0.0%) | 0 (0.0%) |
| 18 to 34 Years | 0 (0.0%) | 0 (0.0%) |
| 35 to 64 Years | 9 (8.9%) | 0 (0.0%) |
| 65 to 74 Years | 0 (0.0%) | 6 (14.0%) |
| 75 Years and over | 22 (61.1%) | 0 (0.0%) |
Disability Class: Self-Care Difficulty
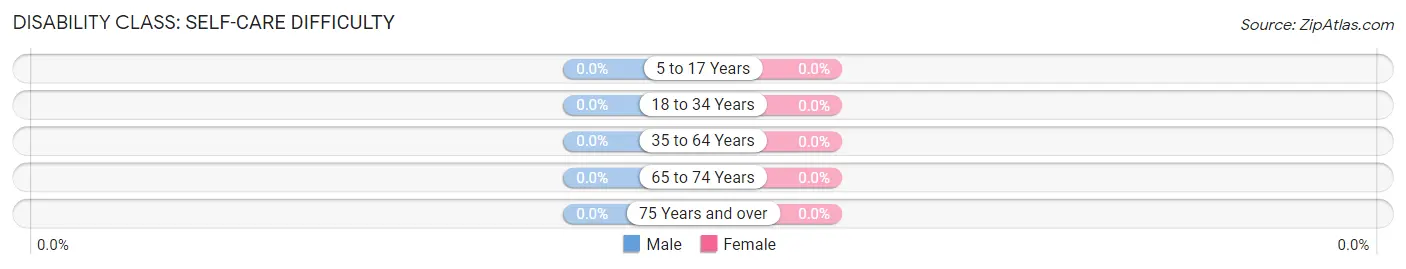
| Age Bracket | Male | Female |
| 5 to 17 Years | 0 (0.0%) | 0 (0.0%) |
| 18 to 34 Years | 0 (0.0%) | 0 (0.0%) |
| 35 to 64 Years | 0 (0.0%) | 0 (0.0%) |
| 65 to 74 Years | 0 (0.0%) | 0 (0.0%) |
| 75 Years and over | 0 (0.0%) | 0 (0.0%) |
Technology Access in Lake Sherwood
Computing Device Access in Lake Sherwood
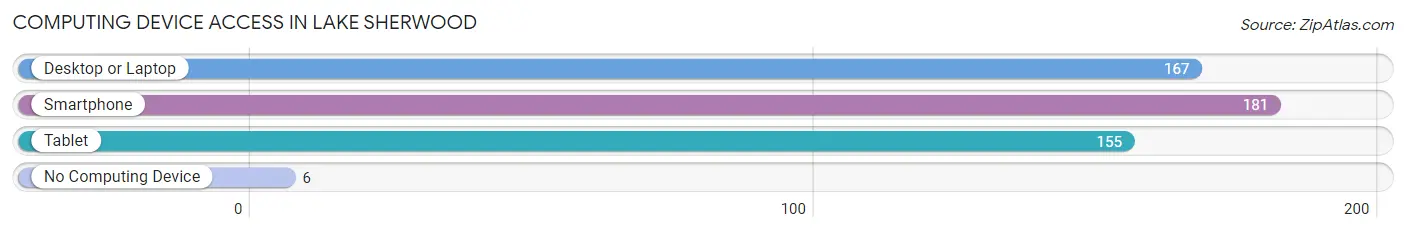
| Device Type | # Households | % Households |
| Desktop or Laptop | 167 | 86.5% |
| Smartphone | 181 | 93.8% |
| Tablet | 155 | 80.3% |
| No Computing Device | 6 | 3.1% |
| Total | 193 | 100.0% |
Internet Access in Lake Sherwood
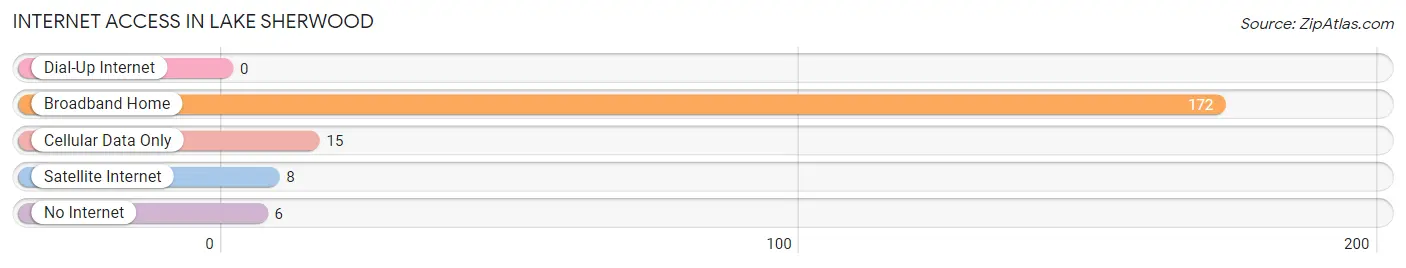
| Internet Type | # Households | % Households |
| Dial-Up Internet | 0 | 0.0% |
| Broadband Home | 172 | 89.1% |
| Cellular Data Only | 15 | 7.8% |
| Satellite Internet | 8 | 4.2% |
| No Internet | 6 | 3.1% |
| Total | 193 | 100.0% |
Lake Sherwood Summary
Lake Sherwood is a small unincorporated community located in the town of Rome, Adams County, Wisconsin, United States. It is situated on the north shore of Lake Sherwood, a small lake of about 200 acres. The lake is part of the Wisconsin River system and is a popular destination for fishing, boating, and swimming.
History
The area around Lake Sherwood has been inhabited for thousands of years. The first known inhabitants were the Ho-Chunk people, who lived in the area until the late 19th century. The first European settlers arrived in the area in the early 1800s, and the town of Rome was established in 1848.
The lake was named after the Sherwood family, who were among the first settlers in the area. The family built a sawmill on the lake in the late 1800s, and the lake became a popular destination for fishing and recreation.
In the early 1900s, the lake was used for ice harvesting, and a small resort was built on the lake. The resort was destroyed by a fire in the 1950s, but the lake remains a popular destination for fishing, boating, and swimming.
Geography
Lake Sherwood is located in the town of Rome, Adams County, Wisconsin. It is situated on the north shore of the lake, which is about 200 acres in size. The lake is part of the Wisconsin River system and is fed by several small streams. The lake is surrounded by wooded hills and is a popular destination for fishing, boating, and swimming.
The lake is located about 10 miles south of the city of Wisconsin Dells and about 25 miles north of the city of Madison. The nearest major airport is Dane County Regional Airport, located about 40 miles away.
Economy
The economy of Lake Sherwood is largely based on tourism and recreation. The lake is a popular destination for fishing, boating, and swimming, and there are several resorts and campgrounds located on the lake. The lake is also a popular destination for ice fishing in the winter months.
The town of Rome also has a small manufacturing sector, with several small businesses located in the area. The town is also home to a small airport, which serves the local area.
Demographics
As of the 2010 census, the population of Lake Sherwood was 1,072. The population is largely white (97.2%), with a small percentage of African Americans (1.2%) and Native Americans (0.7%). The median household income is $45,000, and the median age is 44.
Conclusion
Lake Sherwood is a small unincorporated community located in the town of Rome, Adams County, Wisconsin. It is situated on the north shore of Lake Sherwood, a small lake of about 200 acres. The lake is part of the Wisconsin River system and is a popular destination for fishing, boating, and swimming. The economy of Lake Sherwood is largely based on tourism and recreation, and the population is largely white. The lake is a popular destination for fishing, boating, and swimming, and there are several resorts and campgrounds located on the lake.
Common Questions
What is Per Capita Income in Lake Sherwood?
Per Capita income in Lake Sherwood is $51,378.
What is the Median Family Income in Lake Sherwood?
Median Family Income in Lake Sherwood is $98,594.
What is the Median Household income in Lake Sherwood?
Median Household Income in Lake Sherwood is $98,672.
What is Income or Wage Gap in Lake Sherwood?
Income or Wage Gap in Lake Sherwood is 12.3%.
Women in Lake Sherwood earn 87.7 cents for every dollar earned by a man.
What is Inequality or Gini Index in Lake Sherwood?
Inequality or Gini Index in Lake Sherwood is 0.30.
What is the Total Population of Lake Sherwood?
Total Population of Lake Sherwood is 378.
What is the Total Male Population of Lake Sherwood?
Total Male Population of Lake Sherwood is 174.
What is the Total Female Population of Lake Sherwood?
Total Female Population of Lake Sherwood is 204.
What is the Ratio of Males per 100 Females in Lake Sherwood?
There are 85.29 Males per 100 Females in Lake Sherwood.
What is the Ratio of Females per 100 Males in Lake Sherwood?
There are 117.24 Females per 100 Males in Lake Sherwood.
What is the Median Population Age in Lake Sherwood?
Median Population Age in Lake Sherwood is 60.6 Years.
What is the Average Family Size in Lake Sherwood
Average Family Size in Lake Sherwood is 2.1 People.
What is the Average Household Size in Lake Sherwood
Average Household Size in Lake Sherwood is 2.0 People.
How Large is the Labor Force in Lake Sherwood?
There are 217 People in the Labor Forcein in Lake Sherwood.
What is the Percentage of People in the Labor Force in Lake Sherwood?
60.4% of People are in the Labor Force in Lake Sherwood.
What is the Unemployment Rate in Lake Sherwood?
Unemployment Rate in Lake Sherwood is 8.3%.