Tropic, UT Map & Demographics
Tropic Map
Tropic Overview
$32,322
PER CAPITA INCOME
$61,364
AVG FAMILY INCOME
$54,519
AVG HOUSEHOLD INCOME
21.0%
WAGE / INCOME GAP [ % ]
79.0¢/ $1
WAGE / INCOME GAP [ $ ]
0.40
INEQUALITY / GINI INDEX
524
TOTAL POPULATION
259
MALE POPULATION
265
FEMALE POPULATION
97.74
MALES / 100 FEMALES
102.32
FEMALES / 100 MALES
48.3
MEDIAN AGE
2.8
AVG FAMILY SIZE
2.5
AVG HOUSEHOLD SIZE
252
LABOR FORCE [ PEOPLE ]
58.7%
PERCENT IN LABOR FORCE
Tropic Zip Codes
Tropic Area Codes
Income in Tropic
Income Overview in Tropic
Per Capita Income in Tropic is $32,322, while median incomes of families and households are $61,364 and $54,519 respectively.
| Characteristic | Number | Measure |
| Per Capita Income | 524 | $32,322 |
| Median Family Income | 172 | $61,364 |
| Mean Family Income | 172 | $82,760 |
| Median Household Income | 211 | $54,519 |
| Mean Household Income | 211 | $74,208 |
| Income Deficit | 172 | $0 |
| Wage / Income Gap (%) | 524 | 20.95% |
| Wage / Income Gap ($) | 524 | 79.05¢ per $1 |
| Gini / Inequality Index | 524 | 0.40 |
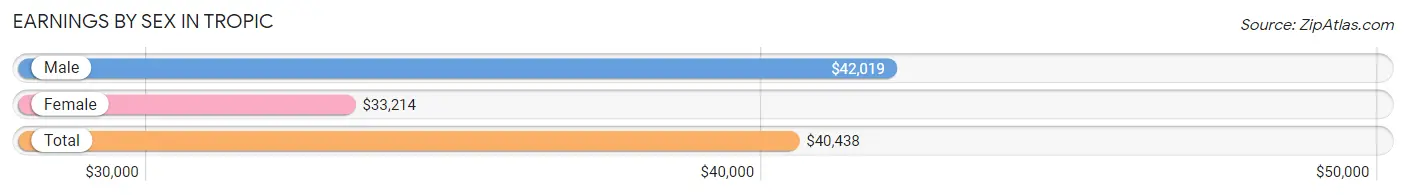
Earnings by Sex in Tropic
Average Earnings in Tropic are $40,438, $42,019 for men and $33,214 for women, a difference of 20.9%.
| Sex | Number | Average Earnings |
| Male | 143 (51.2%) | $42,019 |
| Female | 136 (48.7%) | $33,214 |
| Total | 279 (100.0%) | $40,438 |
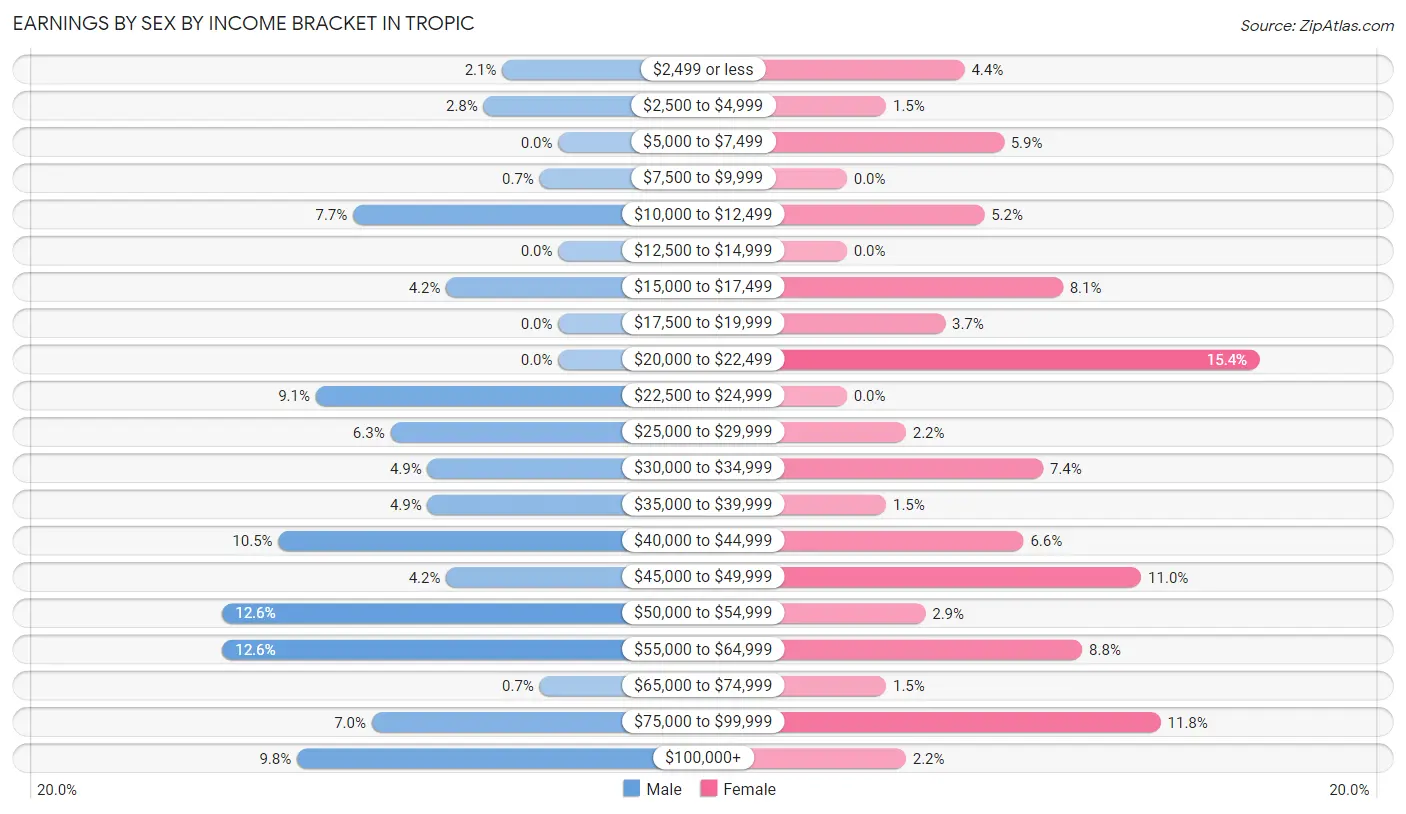
Earnings by Sex by Income Bracket in Tropic
The most common earnings brackets in Tropic are $50,000 to $54,999 for men (18 | 12.6%) and $20,000 to $22,499 for women (21 | 15.4%).
| Income | Male | Female |
| $2,499 or less | 3 (2.1%) | 6 (4.4%) |
| $2,500 to $4,999 | 4 (2.8%) | 2 (1.5%) |
| $5,000 to $7,499 | 0 (0.0%) | 8 (5.9%) |
| $7,500 to $9,999 | 1 (0.7%) | 0 (0.0%) |
| $10,000 to $12,499 | 11 (7.7%) | 7 (5.1%) |
| $12,500 to $14,999 | 0 (0.0%) | 0 (0.0%) |
| $15,000 to $17,499 | 6 (4.2%) | 11 (8.1%) |
| $17,500 to $19,999 | 0 (0.0%) | 5 (3.7%) |
| $20,000 to $22,499 | 0 (0.0%) | 21 (15.4%) |
| $22,500 to $24,999 | 13 (9.1%) | 0 (0.0%) |
| $25,000 to $29,999 | 9 (6.3%) | 3 (2.2%) |
| $30,000 to $34,999 | 7 (4.9%) | 10 (7.3%) |
| $35,000 to $39,999 | 7 (4.9%) | 2 (1.5%) |
| $40,000 to $44,999 | 15 (10.5%) | 9 (6.6%) |
| $45,000 to $49,999 | 6 (4.2%) | 15 (11.0%) |
| $50,000 to $54,999 | 18 (12.6%) | 4 (2.9%) |
| $55,000 to $64,999 | 18 (12.6%) | 12 (8.8%) |
| $65,000 to $74,999 | 1 (0.7%) | 2 (1.5%) |
| $75,000 to $99,999 | 10 (7.0%) | 16 (11.8%) |
| $100,000+ | 14 (9.8%) | 3 (2.2%) |
| Total | 143 (100.0%) | 136 (100.0%) |
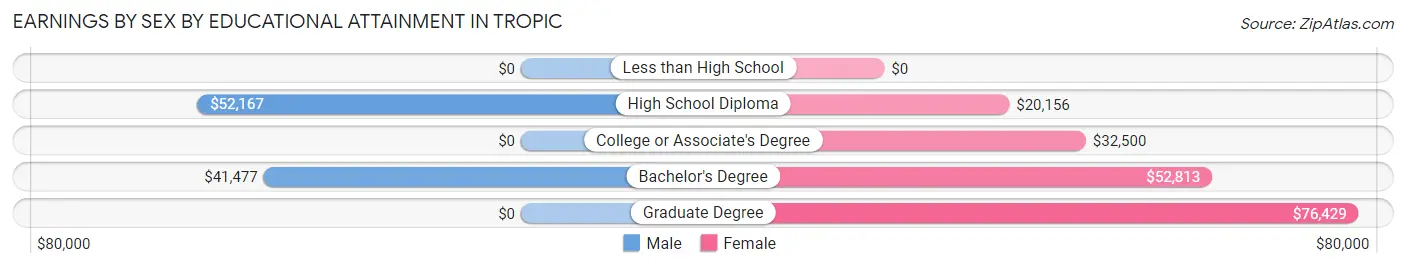
Earnings by Sex by Educational Attainment in Tropic
Average earnings in Tropic are $45,833 for men and $33,393 for women, a difference of 27.1%. Men with an educational attainment of high school diploma enjoy the highest average annual earnings of $52,167, while those with bachelor's degree education earn the least with $41,477. Women with an educational attainment of graduate degree earn the most with the average annual earnings of $76,429, while those with high school diploma education have the smallest earnings of $20,156.
| Educational Attainment | Male Income | Female Income |
| Less than High School | - | - |
| High School Diploma | $52,167 | $20,156 |
| College or Associate's Degree | - | - |
| Bachelor's Degree | $41,477 | $52,813 |
| Graduate Degree | - | - |
| Total | $45,833 | $33,393 |
Family Income in Tropic
Family Income Brackets in Tropic
According to the Tropic family income data, there are 43 families falling into the $25,000 to $34,999 income range, which is the most common income bracket and makes up 25.0% of all families.
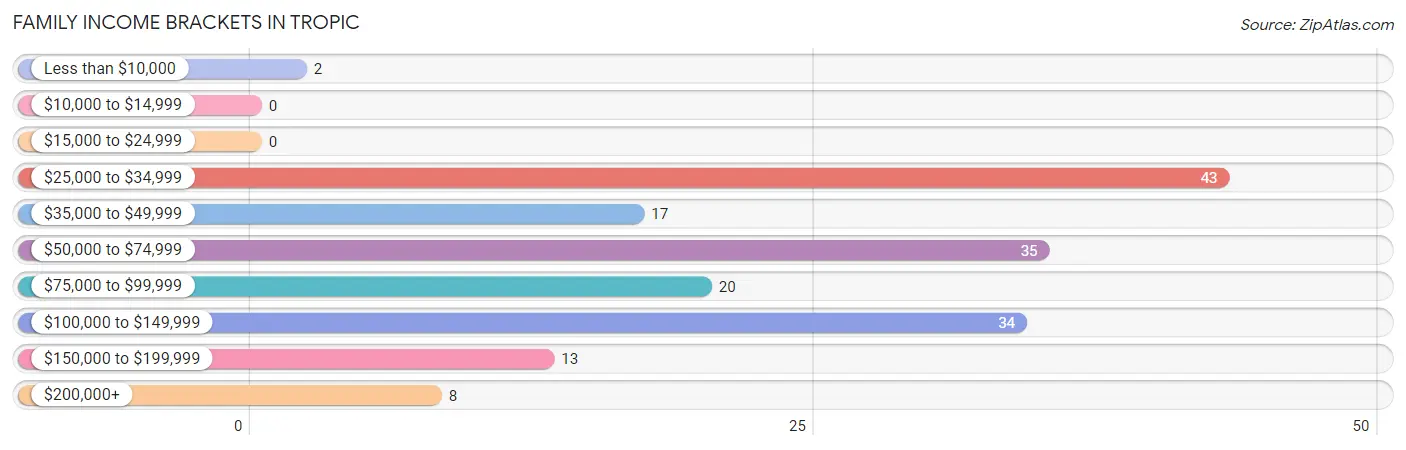
| Income Bracket | # Families | % Families |
| Less than $10,000 | 2 | 1.2% |
| $10,000 to $14,999 | 0 | 0.0% |
| $15,000 to $24,999 | 0 | 0.0% |
| $25,000 to $34,999 | 43 | 25.0% |
| $35,000 to $49,999 | 17 | 9.9% |
| $50,000 to $74,999 | 35 | 20.3% |
| $75,000 to $99,999 | 20 | 11.6% |
| $100,000 to $149,999 | 34 | 19.8% |
| $150,000 to $199,999 | 13 | 7.6% |
| $200,000+ | 8 | 4.7% |
Family Income by Famaliy Size in Tropic
3-person families (12 | 7.0%) account for the highest median family income in Tropic with $172,500 per family, while 3-person families (12 | 7.0%) have the highest median income of $57,500 per family member.
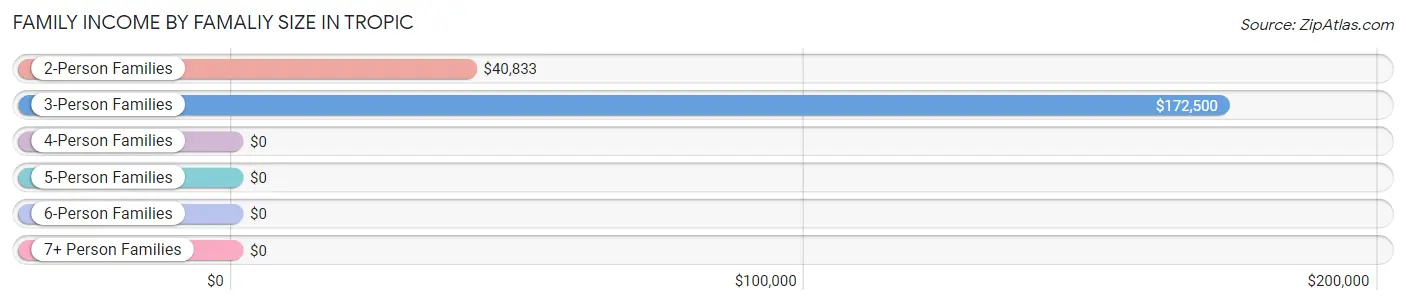
| Income Bracket | # Families | Median Income |
| 2-Person Families | 112 (65.1%) | $40,833 |
| 3-Person Families | 12 (7.0%) | $172,500 |
| 4-Person Families | 28 (16.3%) | $0 |
| 5-Person Families | 14 (8.1%) | $0 |
| 6-Person Families | 2 (1.2%) | $0 |
| 7+ Person Families | 4 (2.3%) | $0 |
| Total | 172 (100.0%) | $61,364 |
Family Income by Number of Earners in Tropic
The median family income in Tropic is $61,364, with families comprising 3+ earners (21) having the highest median family income of $144,861, while families with no earners (56) have the lowest median family income of $27,000, accounting for 12.2% and 32.6% of families, respectively.
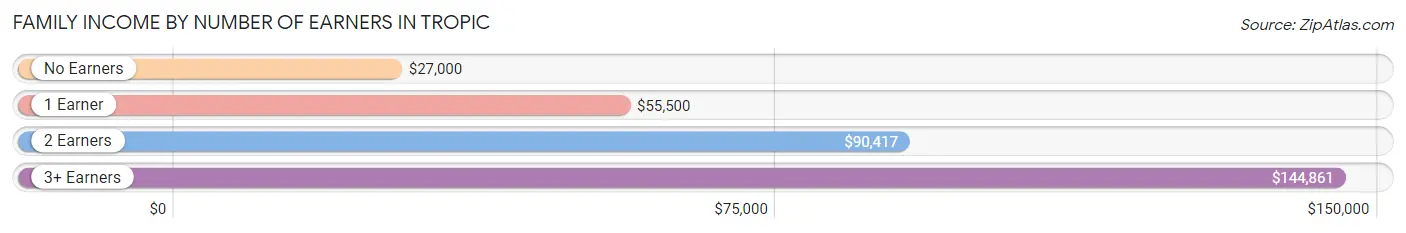
| Number of Earners | # Families | Median Income |
| No Earners | 56 (32.6%) | $27,000 |
| 1 Earner | 20 (11.6%) | $55,500 |
| 2 Earners | 75 (43.6%) | $90,417 |
| 3+ Earners | 21 (12.2%) | $144,861 |
| Total | 172 (100.0%) | $61,364 |
Household Income in Tropic
Household Income Brackets in Tropic
With 52 households falling in the category, the $25,000 to $34,999 income range is the most frequent in Tropic, accounting for 24.6% of all households.
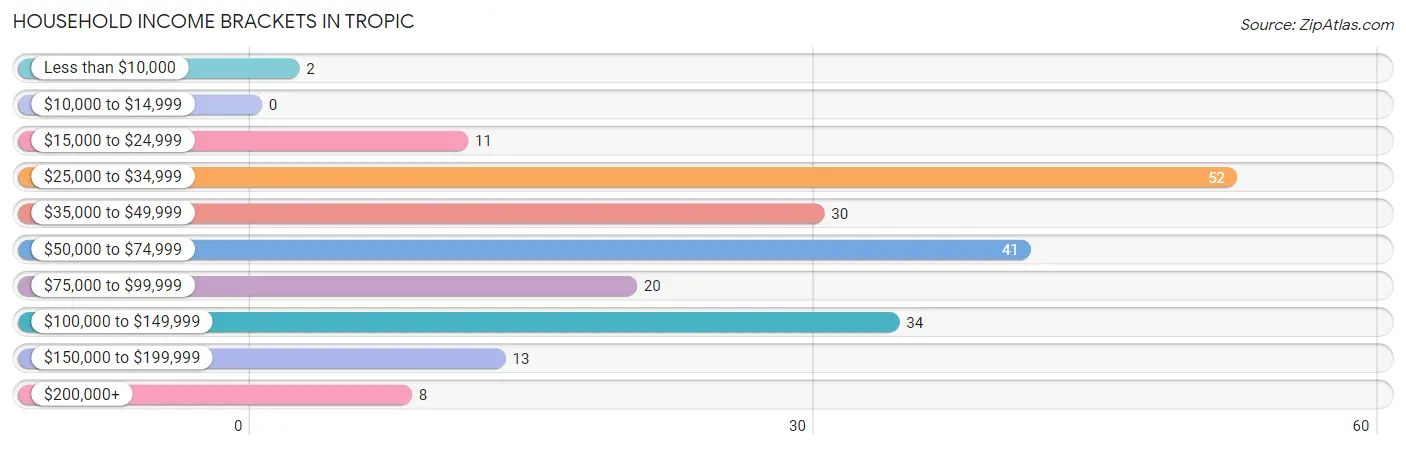
| Income Bracket | # Households | % Households |
| Less than $10,000 | 2 | 0.9% |
| $10,000 to $14,999 | 0 | 0.0% |
| $15,000 to $24,999 | 11 | 5.2% |
| $25,000 to $34,999 | 52 | 24.6% |
| $35,000 to $49,999 | 30 | 14.2% |
| $50,000 to $74,999 | 41 | 19.4% |
| $75,000 to $99,999 | 20 | 9.5% |
| $100,000 to $149,999 | 34 | 16.1% |
| $150,000 to $199,999 | 13 | 6.2% |
| $200,000+ | 8 | 3.8% |
Household Income by Householder Age in Tropic
The median household income in Tropic is $54,519, with the highest median household income of $79,375 found in the 25 to 44 years age bracket for the primary householder. A total of 35 households (16.6%) fall into this category. Meanwhile, the 15 to 24 years age bracket for the primary householder has the lowest median household income of $0, with 18 households (8.5%) in this group.
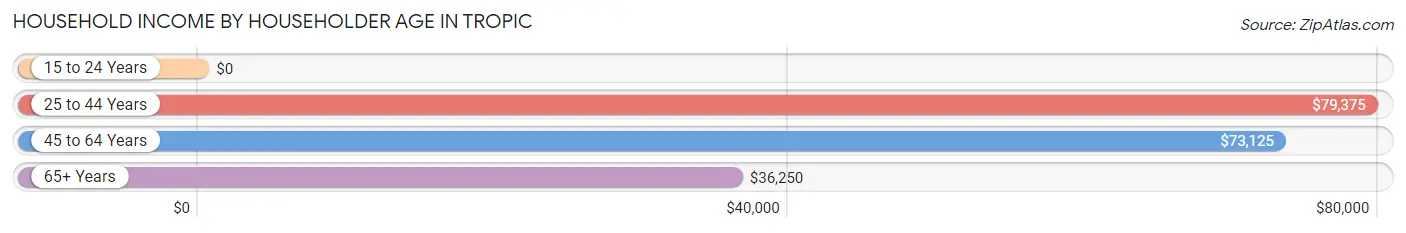
| Income Bracket | # Households | Median Income |
| 15 to 24 Years | 18 (8.5%) | $0 |
| 25 to 44 Years | 35 (16.6%) | $79,375 |
| 45 to 64 Years | 49 (23.2%) | $73,125 |
| 65+ Years | 109 (51.7%) | $36,250 |
| Total | 211 (100.0%) | $54,519 |
Poverty in Tropic
Income Below Poverty by Sex and Age in Tropic
With 1.9% poverty level for males and 1.9% for females among the residents of Tropic, 12 to 14 year old males and 16 and 17 year old females are the most vulnerable to poverty, with 2 males (40.0%) and 3 females (27.3%) in their respective age groups living below the poverty level.
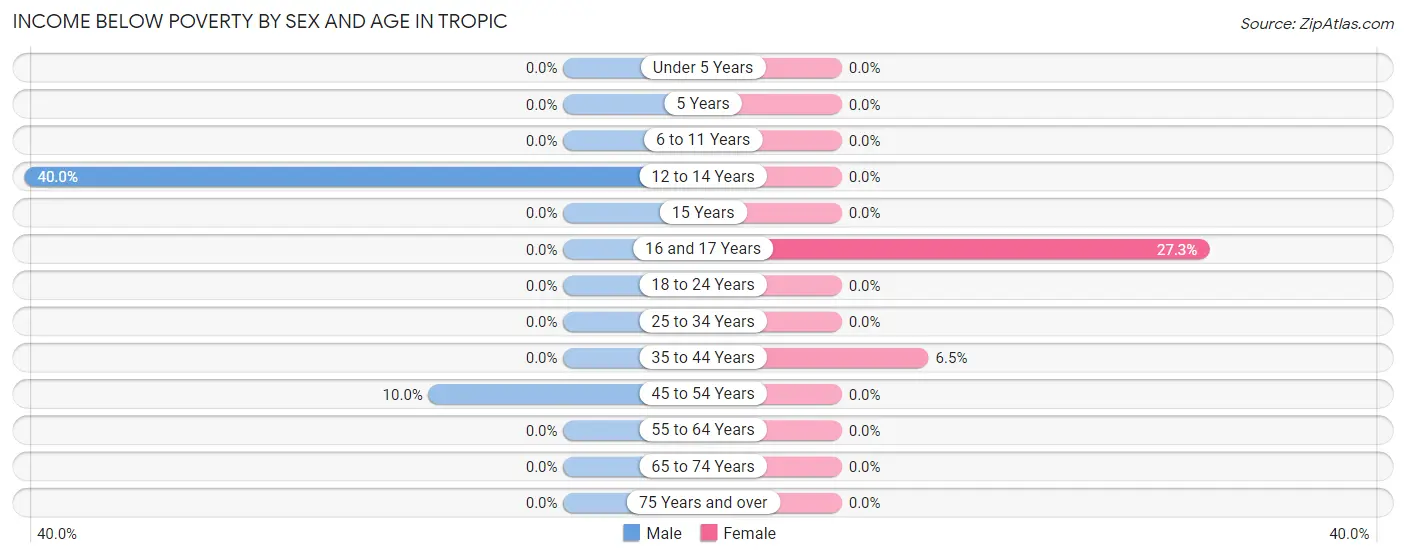
| Age Bracket | Male | Female |
| Under 5 Years | 0 (0.0%) | 0 (0.0%) |
| 5 Years | 0 (0.0%) | 0 (0.0%) |
| 6 to 11 Years | 0 (0.0%) | 0 (0.0%) |
| 12 to 14 Years | 2 (40.0%) | 0 (0.0%) |
| 15 Years | 0 (0.0%) | 0 (0.0%) |
| 16 and 17 Years | 0 (0.0%) | 3 (27.3%) |
| 18 to 24 Years | 0 (0.0%) | 0 (0.0%) |
| 25 to 34 Years | 0 (0.0%) | 0 (0.0%) |
| 35 to 44 Years | 0 (0.0%) | 2 (6.5%) |
| 45 to 54 Years | 3 (10.0%) | 0 (0.0%) |
| 55 to 64 Years | 0 (0.0%) | 0 (0.0%) |
| 65 to 74 Years | 0 (0.0%) | 0 (0.0%) |
| 75 Years and over | 0 (0.0%) | 0 (0.0%) |
| Total | 5 (1.9%) | 5 (1.9%) |
Income Above Poverty by Sex and Age in Tropic
According to the poverty statistics in Tropic, males aged under 5 years and females aged under 5 years are the age groups that are most secure financially, with 100.0% of males and 100.0% of females in these age groups living above the poverty line.
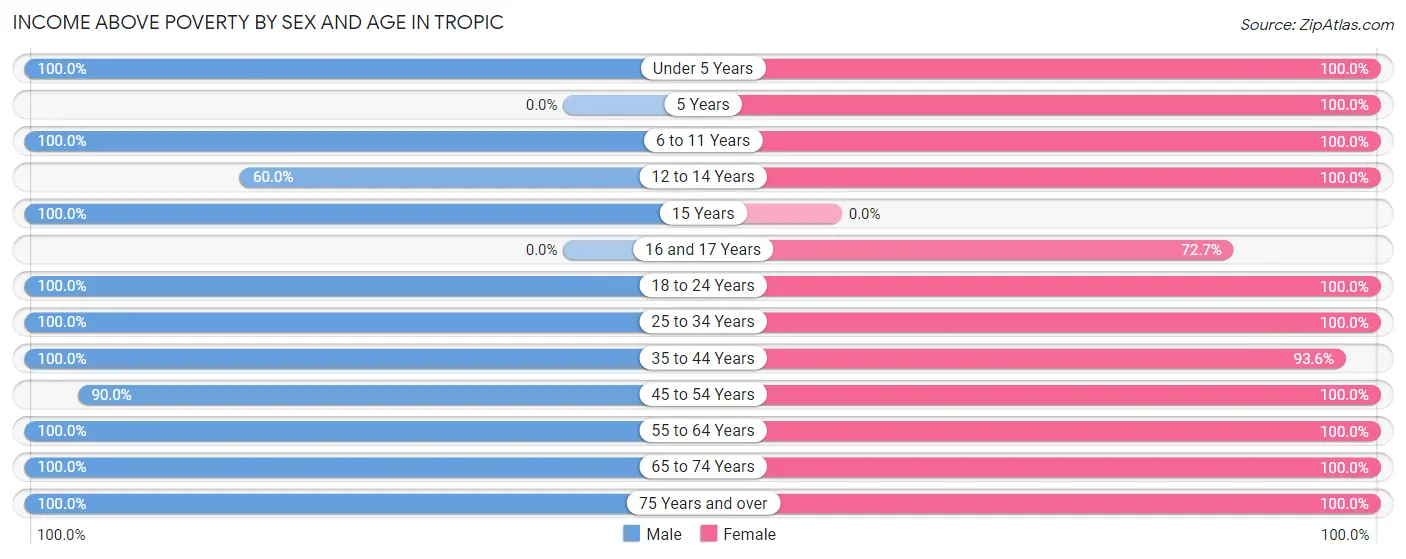
| Age Bracket | Male | Female |
| Under 5 Years | 22 (100.0%) | 9 (100.0%) |
| 5 Years | 0 (0.0%) | 4 (100.0%) |
| 6 to 11 Years | 27 (100.0%) | 2 (100.0%) |
| 12 to 14 Years | 3 (60.0%) | 13 (100.0%) |
| 15 Years | 13 (100.0%) | 0 (0.0%) |
| 16 and 17 Years | 0 (0.0%) | 8 (72.7%) |
| 18 to 24 Years | 13 (100.0%) | 20 (100.0%) |
| 25 to 34 Years | 46 (100.0%) | 15 (100.0%) |
| 35 to 44 Years | 20 (100.0%) | 29 (93.5%) |
| 45 to 54 Years | 27 (90.0%) | 19 (100.0%) |
| 55 to 64 Years | 21 (100.0%) | 31 (100.0%) |
| 65 to 74 Years | 23 (100.0%) | 85 (100.0%) |
| 75 Years and over | 39 (100.0%) | 25 (100.0%) |
| Total | 254 (98.1%) | 260 (98.1%) |
Income Below Poverty Among Married-Couple Families in Tropic
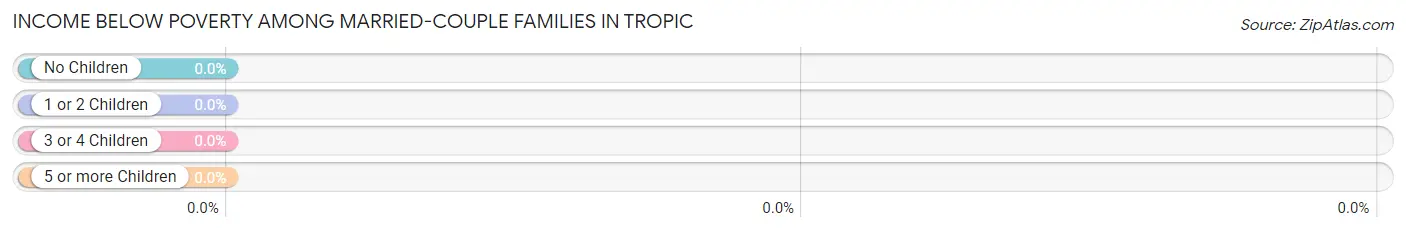
| Children | Above Poverty | Below Poverty |
| No Children | 115 (100.0%) | 0 (0.0%) |
| 1 or 2 Children | 34 (100.0%) | 0 (0.0%) |
| 3 or 4 Children | 6 (100.0%) | 0 (0.0%) |
| 5 or more Children | 0 (0.0%) | 0 (0.0%) |
| Total | 155 (100.0%) | 0 (0.0%) |
Income Below Poverty Among Single-Parent Households in Tropic
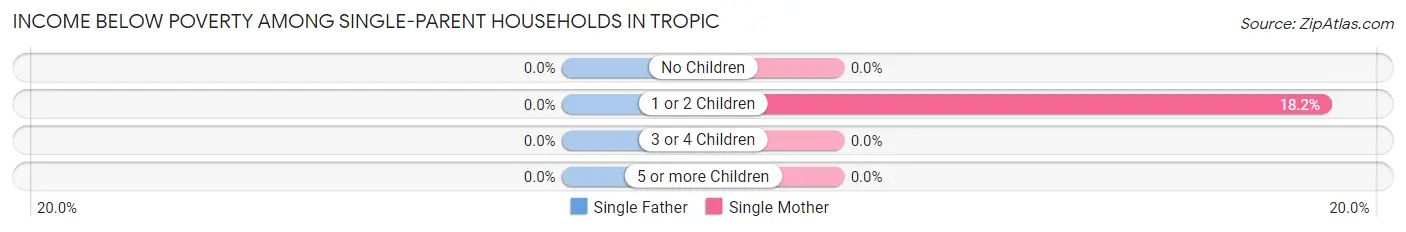
| Children | Single Father | Single Mother |
| No Children | 0 (0.0%) | 0 (0.0%) |
| 1 or 2 Children | 0 (0.0%) | 2 (18.2%) |
| 3 or 4 Children | 0 (0.0%) | 0 (0.0%) |
| 5 or more Children | 0 (0.0%) | 0 (0.0%) |
| Total | 0 (0.0%) | 2 (11.8%) |
Income Below Poverty Among Married-Couple vs Single-Parent Households in Tropic
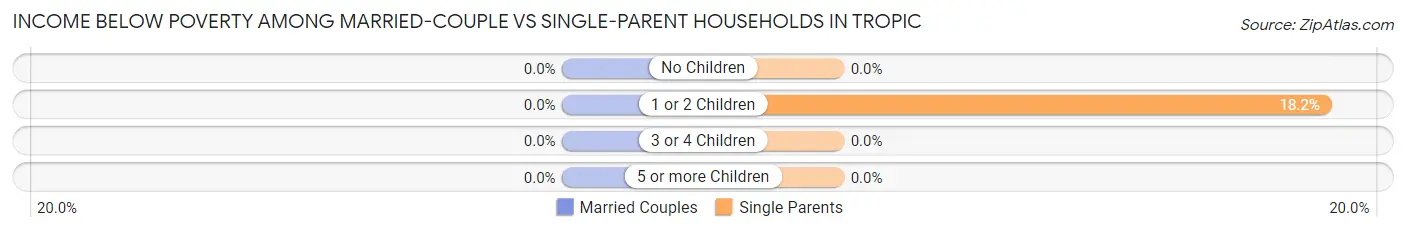
| Children | Married-Couple Families | Single-Parent Households |
| No Children | 0 (0.0%) | 0 (0.0%) |
| 1 or 2 Children | 0 (0.0%) | 2 (18.2%) |
| 3 or 4 Children | 0 (0.0%) | 0 (0.0%) |
| 5 or more Children | 0 (0.0%) | 0 (0.0%) |
| Total | 0 (0.0%) | 2 (11.8%) |
Race in Tropic
The most populous races in Tropic are White / Caucasian (524 | 100.0%), and Hispanic or Latino (4 | 0.8%).
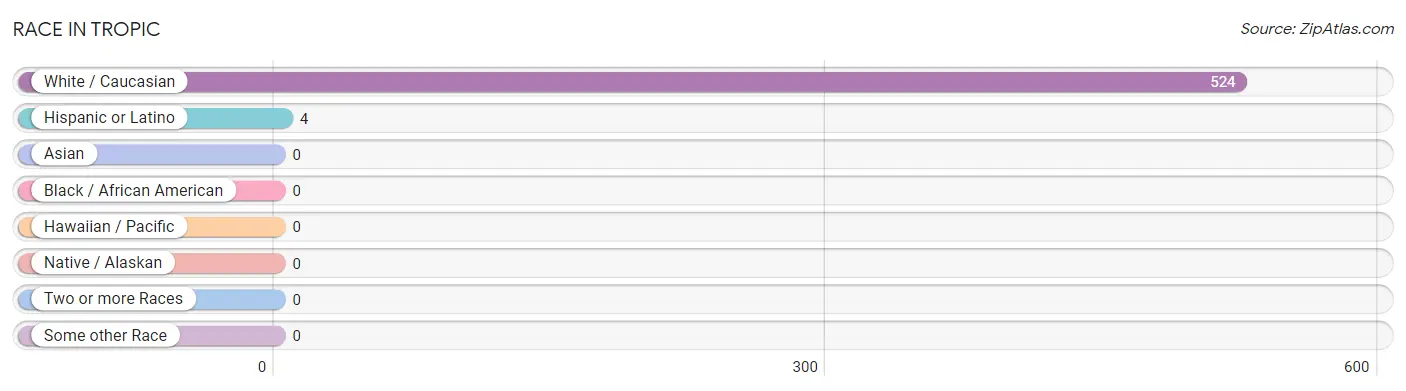
| Race | # Population | % Population |
| Asian | 0 | 0.0% |
| Black / African American | 0 | 0.0% |
| Hawaiian / Pacific | 0 | 0.0% |
| Hispanic or Latino | 4 | 0.8% |
| Native / Alaskan | 0 | 0.0% |
| White / Caucasian | 524 | 100.0% |
| Two or more Races | 0 | 0.0% |
| Some other Race | 0 | 0.0% |
| Total | 524 | 100.0% |
Ancestry in Tropic
The most populous ancestries reported in Tropic are English (240 | 45.8%), American (66 | 12.6%), Irish (40 | 7.6%), German (35 | 6.7%), and Danish (24 | 4.6%), together accounting for 77.3% of all Tropic residents.
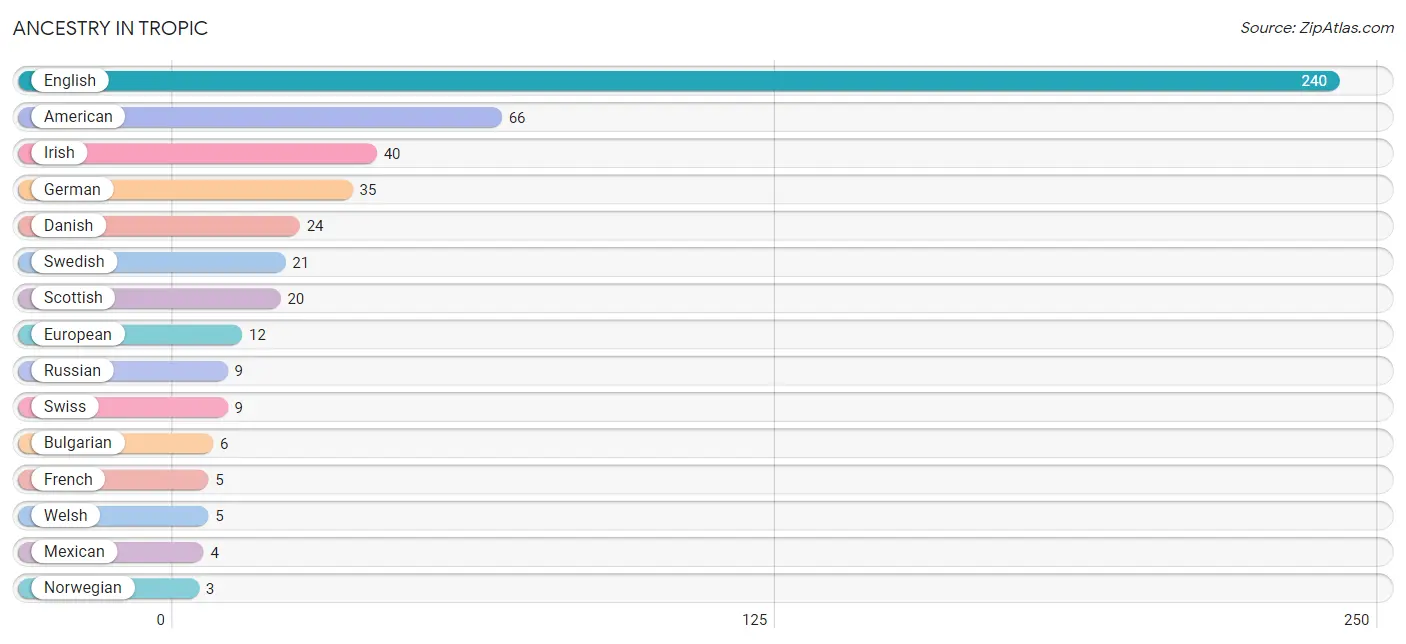
| Ancestry | # Population | % Population |
| American | 66 | 12.6% |
| British | 2 | 0.4% |
| Bulgarian | 6 | 1.1% |
| Danish | 24 | 4.6% |
| English | 240 | 45.8% |
| European | 12 | 2.3% |
| French | 5 | 0.9% |
| German | 35 | 6.7% |
| Irish | 40 | 7.6% |
| Mexican | 4 | 0.8% |
| Northern European | 2 | 0.4% |
| Norwegian | 3 | 0.6% |
| Russian | 9 | 1.7% |
| Scottish | 20 | 3.8% |
| Swedish | 21 | 4.0% |
| Swiss | 9 | 1.7% |
| Welsh | 5 | 0.9% | View All 17 Rows |
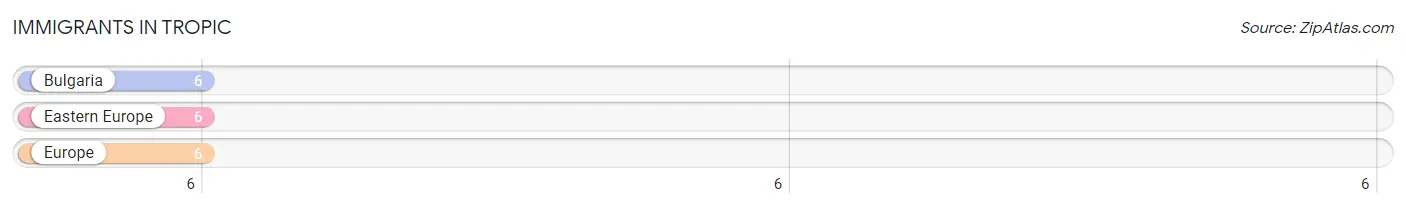
Immigrants in Tropic
The most numerous immigrant groups reported in Tropic came from Bulgaria (6 | 1.1%), Eastern Europe (6 | 1.1%), and Europe (6 | 1.1%), together accounting for 3.5% of all Tropic residents.
| Immigration Origin | # Population | % Population |
| Bulgaria | 6 | 1.1% |
| Eastern Europe | 6 | 1.1% |
| Europe | 6 | 1.1% | View All 3 Rows |
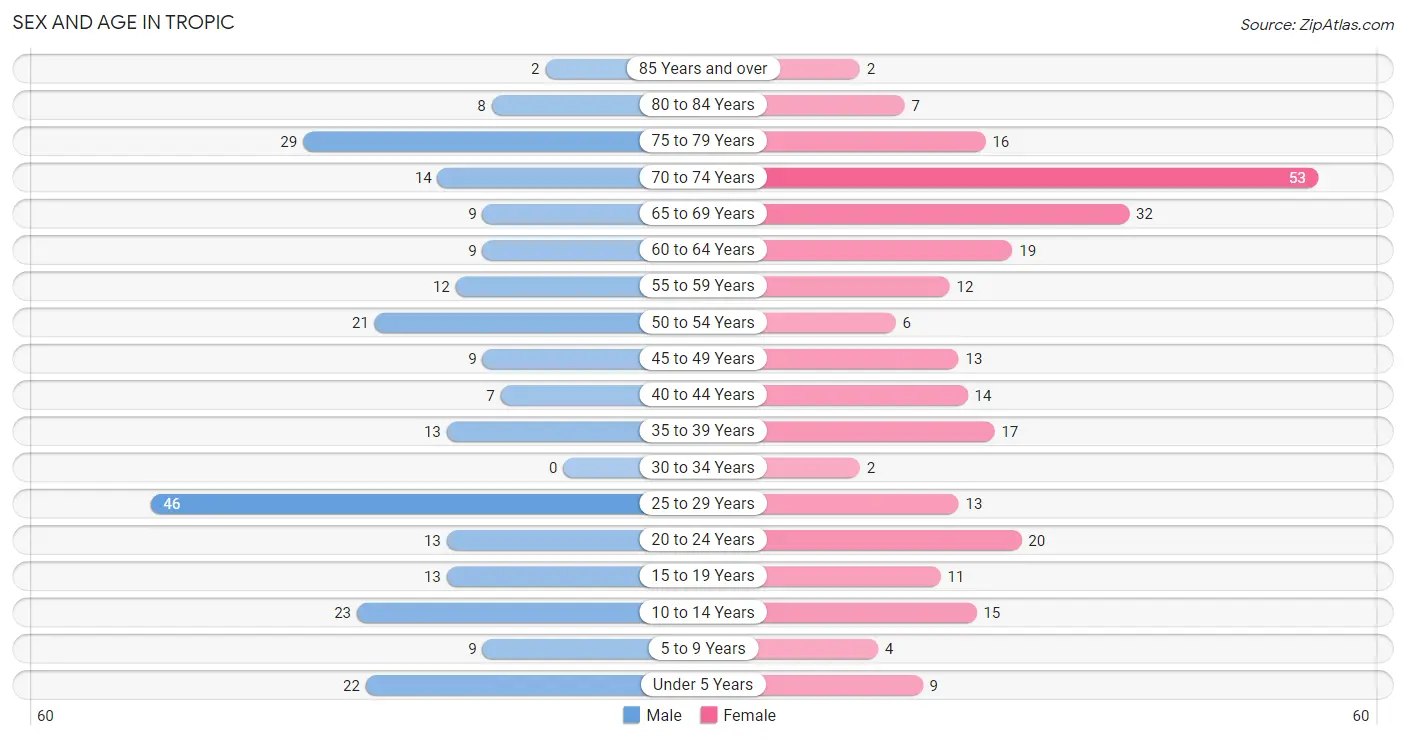
Sex and Age in Tropic
Sex and Age in Tropic
The most populous age groups in Tropic are 25 to 29 Years (46 | 17.8%) for men and 70 to 74 Years (53 | 20.0%) for women.
| Age Bracket | Male | Female |
| Under 5 Years | 22 (8.5%) | 9 (3.4%) |
| 5 to 9 Years | 9 (3.5%) | 4 (1.5%) |
| 10 to 14 Years | 23 (8.9%) | 15 (5.7%) |
| 15 to 19 Years | 13 (5.0%) | 11 (4.2%) |
| 20 to 24 Years | 13 (5.0%) | 20 (7.5%) |
| 25 to 29 Years | 46 (17.8%) | 13 (4.9%) |
| 30 to 34 Years | 0 (0.0%) | 2 (0.7%) |
| 35 to 39 Years | 13 (5.0%) | 17 (6.4%) |
| 40 to 44 Years | 7 (2.7%) | 14 (5.3%) |
| 45 to 49 Years | 9 (3.5%) | 13 (4.9%) |
| 50 to 54 Years | 21 (8.1%) | 6 (2.3%) |
| 55 to 59 Years | 12 (4.6%) | 12 (4.5%) |
| 60 to 64 Years | 9 (3.5%) | 19 (7.2%) |
| 65 to 69 Years | 9 (3.5%) | 32 (12.1%) |
| 70 to 74 Years | 14 (5.4%) | 53 (20.0%) |
| 75 to 79 Years | 29 (11.2%) | 16 (6.0%) |
| 80 to 84 Years | 8 (3.1%) | 7 (2.6%) |
| 85 Years and over | 2 (0.8%) | 2 (0.7%) |
| Total | 259 (100.0%) | 265 (100.0%) |
Families and Households in Tropic
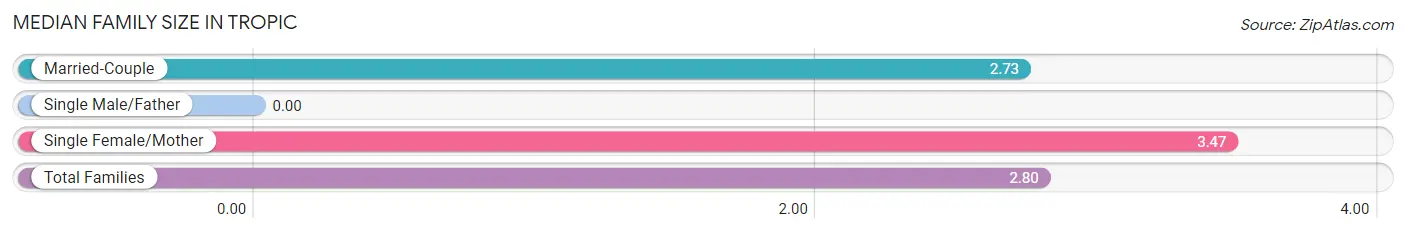
Median Family Size in Tropic
| Family Type | # Families | Family Size |
| Married-Couple | 155 (90.1%) | 2.73 |
| Single Male/Father | 0 (0.0%) | - |
| Single Female/Mother | 17 (9.9%) | 3.47 |
| Total Families | 172 (100.0%) | 2.80 |
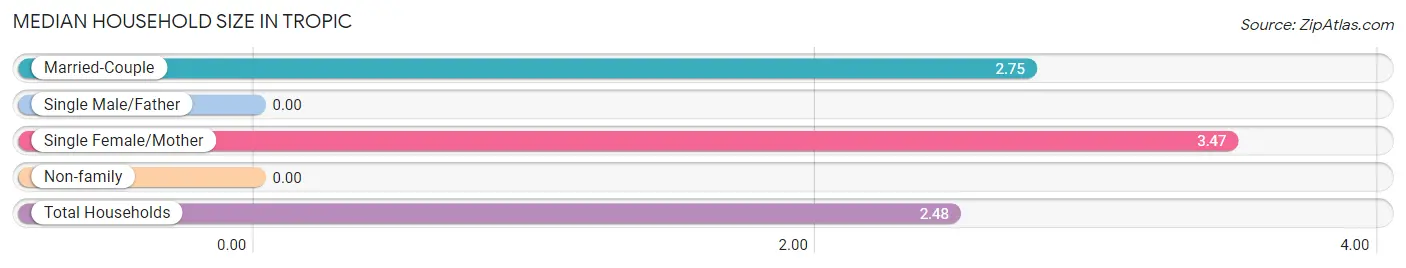
Median Household Size in Tropic
| Household Type | # Households | Household Size |
| Married-Couple | 155 (73.5%) | 2.75 |
| Single Male/Father | 0 (0.0%) | - |
| Single Female/Mother | 17 (8.1%) | 3.47 |
| Non-family | 39 (18.5%) | - |
| Total Households | 211 (100.0%) | 2.48 |
Household Size by Marriage Status in Tropic
Out of a total of 211 households in Tropic, 172 (81.5%) are family households, while 39 (18.5%) are nonfamily households. The most numerous type of family households are 2-person households, comprising 109, and the most common type of nonfamily households are 1-person households, comprising 39.
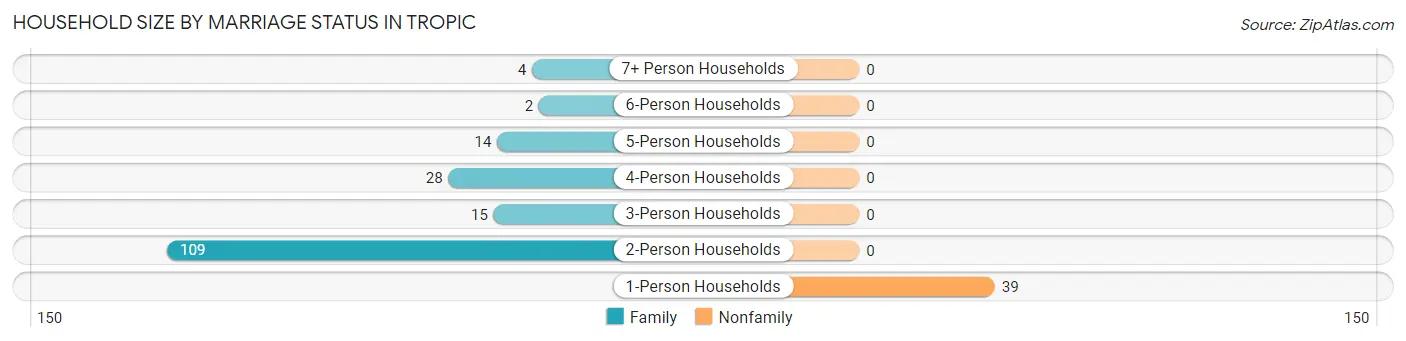
| Household Size | Family Households | Nonfamily Households |
| 1-Person Households | - | 39 (18.5%) |
| 2-Person Households | 109 (51.7%) | 0 (0.0%) |
| 3-Person Households | 15 (7.1%) | 0 (0.0%) |
| 4-Person Households | 28 (13.3%) | 0 (0.0%) |
| 5-Person Households | 14 (6.6%) | 0 (0.0%) |
| 6-Person Households | 2 (0.9%) | 0 (0.0%) |
| 7+ Person Households | 4 (1.9%) | 0 (0.0%) |
| Total | 172 (81.5%) | 39 (18.5%) |
Female Fertility in Tropic
Fertility by Age in Tropic
Average fertility rate in Tropic is 67.0 births per 1,000 women. Women in the age bracket of 20 to 34 years have the highest fertility rate with 171.0 births per 1,000 women. Women in the age bracket of 20 to 34 years acount for 100.0% of all women with births.
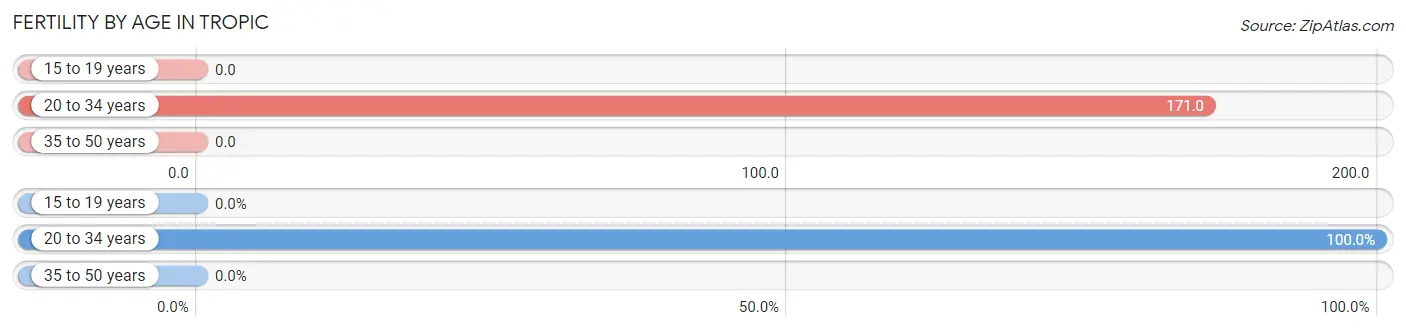
| Age Bracket | Women with Births | Births / 1,000 Women |
| 15 to 19 years | 0 (0.0%) | 0.0 |
| 20 to 34 years | 6 (100.0%) | 171.0 |
| 35 to 50 years | 0 (0.0%) | 0.0 |
| Total | 6 (100.0%) | 67.0 |
Fertility by Age by Marriage Status in Tropic
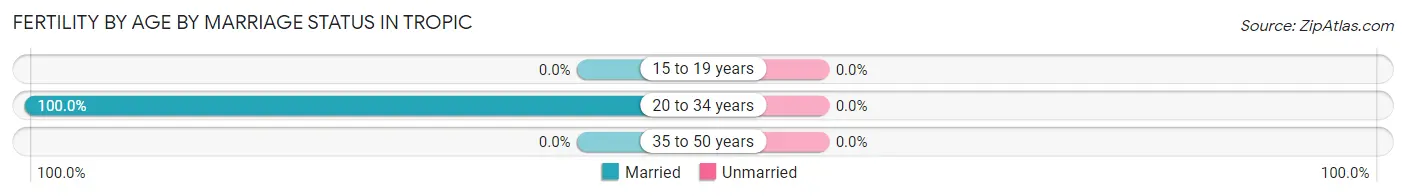
| Age Bracket | Married | Unmarried |
| 15 to 19 years | 0 (0.0%) | 0 (0.0%) |
| 20 to 34 years | 6 (100.0%) | 0 (0.0%) |
| 35 to 50 years | 0 (0.0%) | 0 (0.0%) |
| Total | 6 (100.0%) | 0 (0.0%) |
Fertility by Education in Tropic
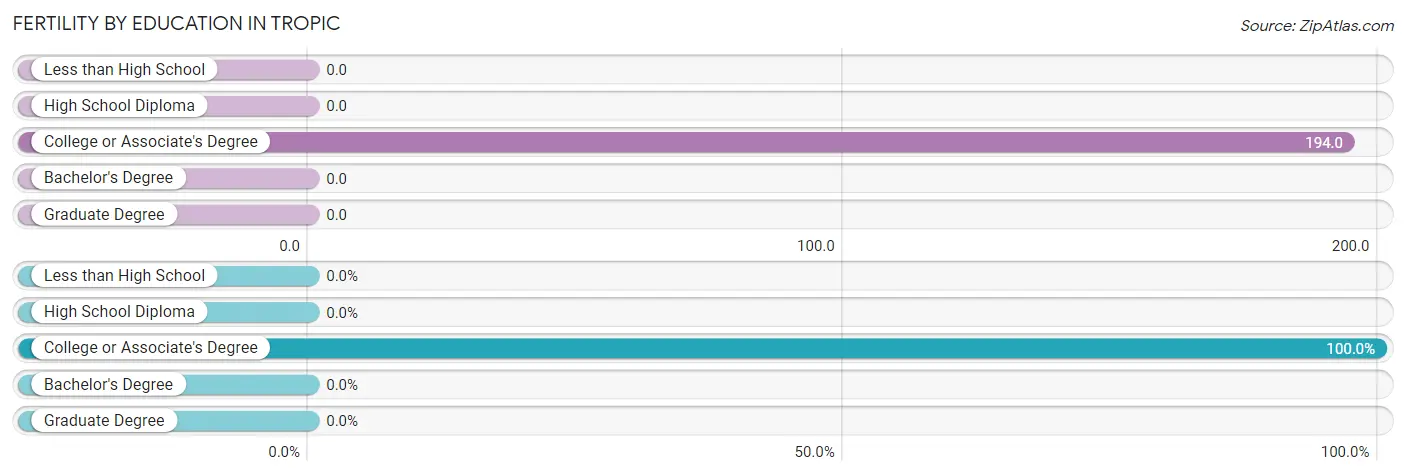
| Educational Attainment | Women with Births | Births / 1,000 Women |
| Less than High School | 0 (0.0%) | 0.0 |
| High School Diploma | 0 (0.0%) | 0.0 |
| College or Associate's Degree | 6 (100.0%) | 194.0 |
| Bachelor's Degree | 0 (0.0%) | 0.0 |
| Graduate Degree | 0 (0.0%) | 0.0 |
| Total | 6 (100.0%) | 67.0 |
Fertility by Education by Marriage Status in Tropic
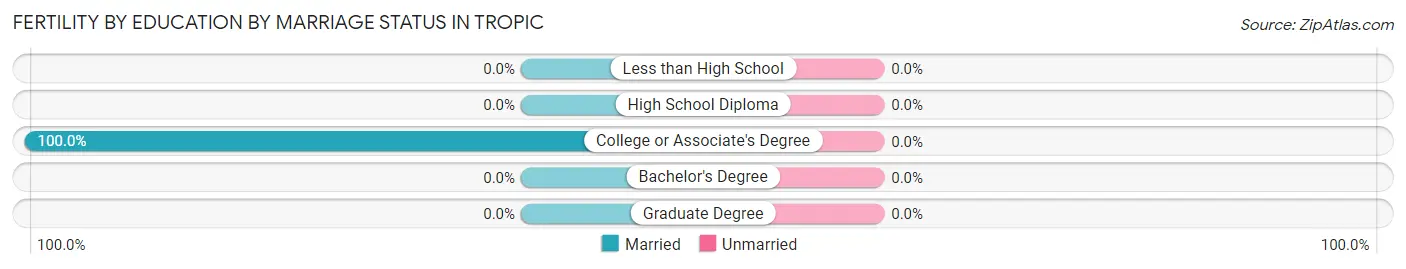
| Educational Attainment | Married | Unmarried |
| Less than High School | 0 (0.0%) | 0 (0.0%) |
| High School Diploma | 0 (0.0%) | 0 (0.0%) |
| College or Associate's Degree | 6 (100.0%) | 0 (0.0%) |
| Bachelor's Degree | 0 (0.0%) | 0 (0.0%) |
| Graduate Degree | 0 (0.0%) | 0 (0.0%) |
| Total | 6 (100.0%) | 0 (0.0%) |
Employment Characteristics in Tropic
Employment by Class of Employer in Tropic
Among the 252 employed individuals in Tropic, private company employees (158 | 62.7%), federal government employees (28 | 11.1%), and state government employees (24 | 9.5%) make up the most common classes of employment.
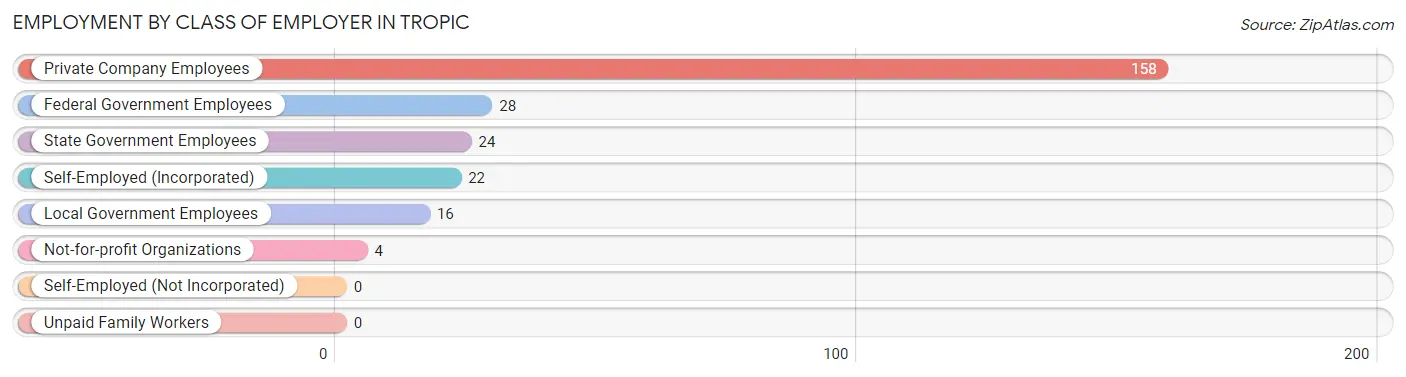
| Employer Class | # Employees | % Employees |
| Private Company Employees | 158 | 62.7% |
| Self-Employed (Incorporated) | 22 | 8.7% |
| Self-Employed (Not Incorporated) | 0 | 0.0% |
| Not-for-profit Organizations | 4 | 1.6% |
| Local Government Employees | 16 | 6.4% |
| State Government Employees | 24 | 9.5% |
| Federal Government Employees | 28 | 11.1% |
| Unpaid Family Workers | 0 | 0.0% |
| Total | 252 | 100.0% |
Employment Status by Age in Tropic
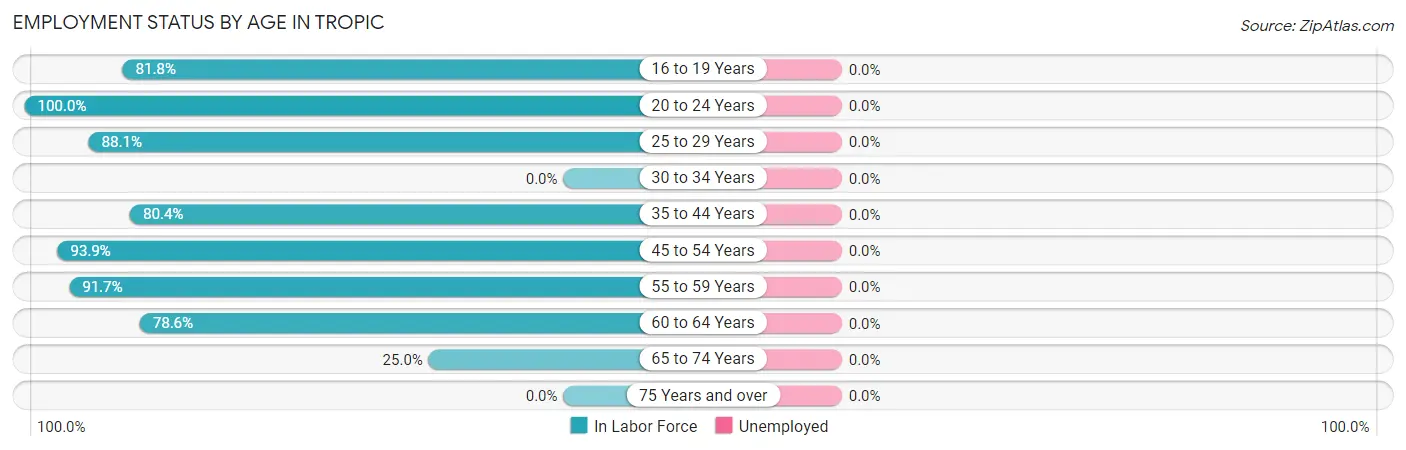
| Age Bracket | In Labor Force | Unemployed |
| 16 to 19 Years | 9 (81.8%) | 0 (0.0%) |
| 20 to 24 Years | 33 (100.0%) | 0 (0.0%) |
| 25 to 29 Years | 52 (88.1%) | 0 (0.0%) |
| 30 to 34 Years | 0 (0.0%) | 0 (0.0%) |
| 35 to 44 Years | 41 (80.4%) | 0 (0.0%) |
| 45 to 54 Years | 46 (93.9%) | 0 (0.0%) |
| 55 to 59 Years | 22 (91.7%) | 0 (0.0%) |
| 60 to 64 Years | 22 (78.6%) | 0 (0.0%) |
| 65 to 74 Years | 27 (25.0%) | 0 (0.0%) |
| 75 Years and over | 0 (0.0%) | 0 (0.0%) |
| Total | 252 (58.7%) | 0 (0.0%) |
Employment Status by Educational Attainment in Tropic
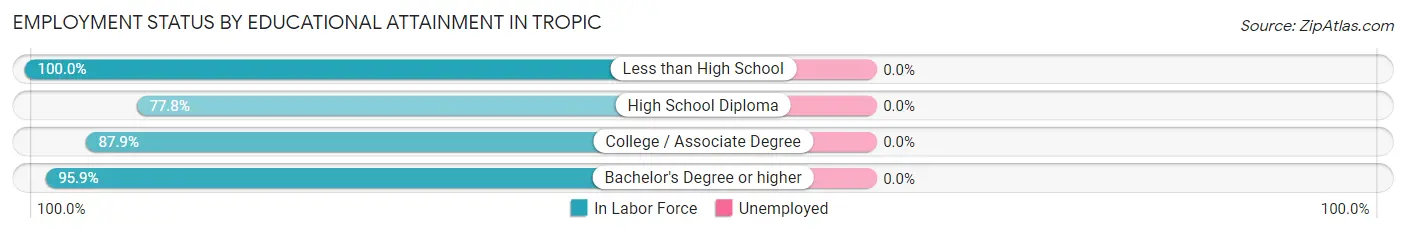
| Educational Attainment | In Labor Force | Unemployed |
| Less than High School | 8 (100.0%) | 0 (0.0%) |
| High School Diploma | 70 (77.8%) | 0 (0.0%) |
| College / Associate Degree | 58 (87.9%) | 0 (0.0%) |
| Bachelor's Degree or higher | 47 (95.9%) | 0 (0.0%) |
| Total | 183 (85.9%) | 0 (0.0%) |
Employment Occupations by Sex in Tropic
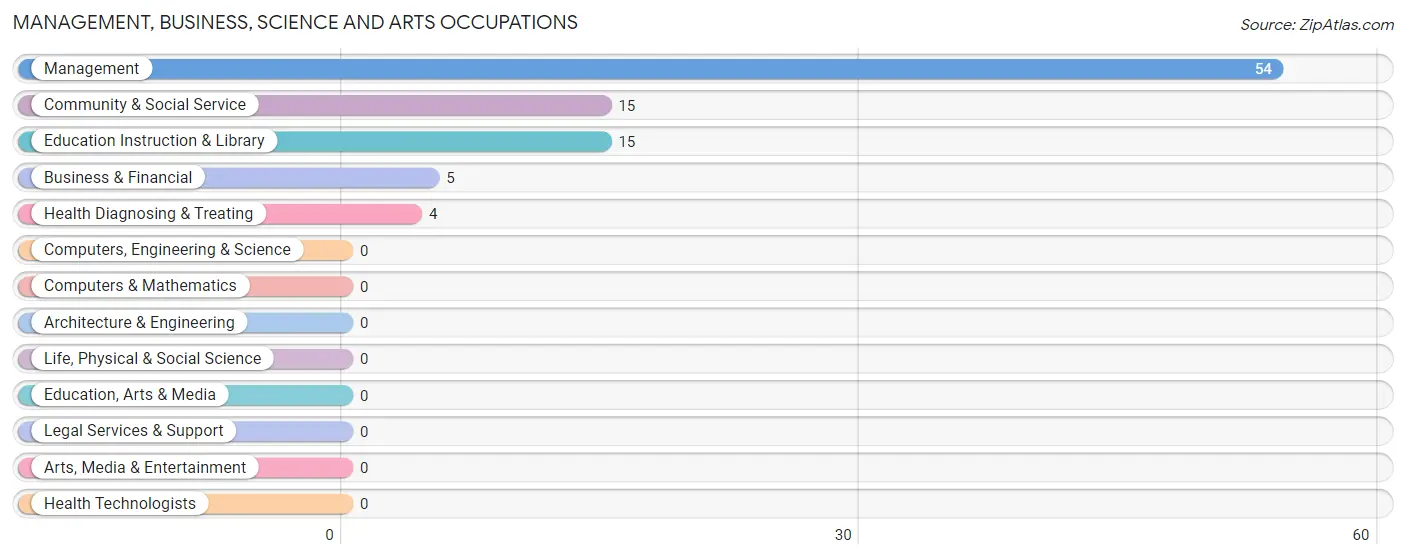
Management, Business, Science and Arts Occupations
The most common Management, Business, Science and Arts occupations in Tropic are Management (54 | 21.4%), Community & Social Service (15 | 5.9%), Education Instruction & Library (15 | 5.9%), Business & Financial (5 | 2.0%), and Health Diagnosing & Treating (4 | 1.6%).
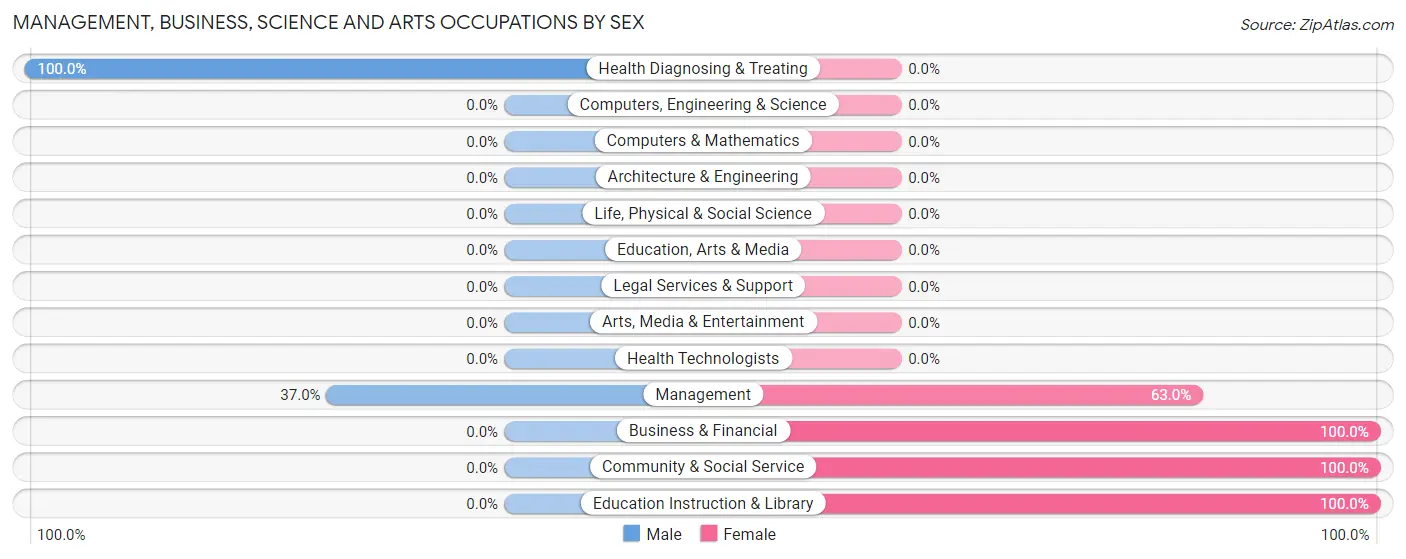
Management, Business, Science and Arts Occupations by Sex
Within the Management, Business, Science and Arts occupations in Tropic, the most male-oriented occupations are Health Diagnosing & Treating (100.0%), and Management (37.0%), while the most female-oriented occupations are Business & Financial (100.0%), Community & Social Service (100.0%), and Education Instruction & Library (100.0%).
| Occupation | Male | Female |
| Management | 20 (37.0%) | 34 (63.0%) |
| Business & Financial | 0 (0.0%) | 5 (100.0%) |
| Computers, Engineering & Science | 0 (0.0%) | 0 (0.0%) |
| Computers & Mathematics | 0 (0.0%) | 0 (0.0%) |
| Architecture & Engineering | 0 (0.0%) | 0 (0.0%) |
| Life, Physical & Social Science | 0 (0.0%) | 0 (0.0%) |
| Community & Social Service | 0 (0.0%) | 15 (100.0%) |
| Education, Arts & Media | 0 (0.0%) | 0 (0.0%) |
| Legal Services & Support | 0 (0.0%) | 0 (0.0%) |
| Education Instruction & Library | 0 (0.0%) | 15 (100.0%) |
| Arts, Media & Entertainment | 0 (0.0%) | 0 (0.0%) |
| Health Diagnosing & Treating | 4 (100.0%) | 0 (0.0%) |
| Health Technologists | 0 (0.0%) | 0 (0.0%) |
| Total (Category) | 24 (30.8%) | 54 (69.2%) |
| Total (Overall) | 130 (51.6%) | 122 (48.4%) |
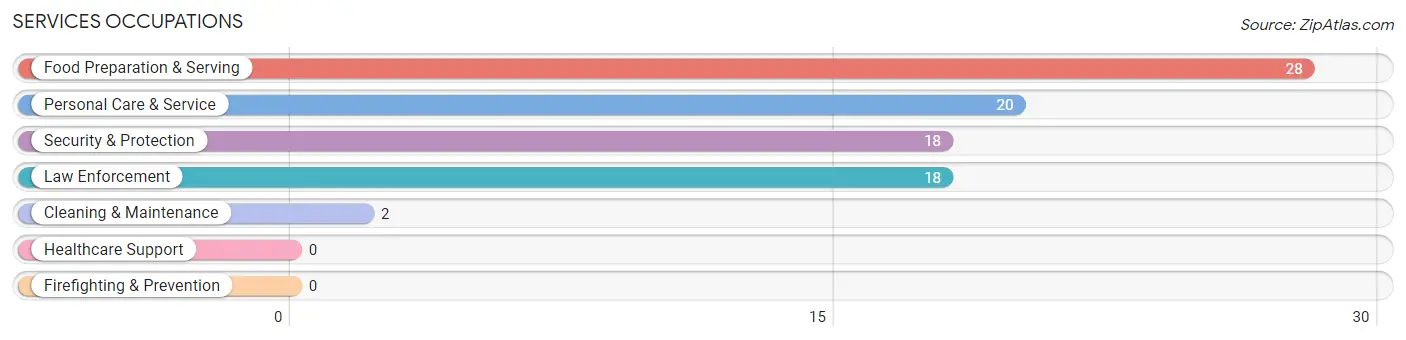
Services Occupations
The most common Services occupations in Tropic are Food Preparation & Serving (28 | 11.1%), Personal Care & Service (20 | 7.9%), Security & Protection (18 | 7.1%), Law Enforcement (18 | 7.1%), and Cleaning & Maintenance (2 | 0.8%).
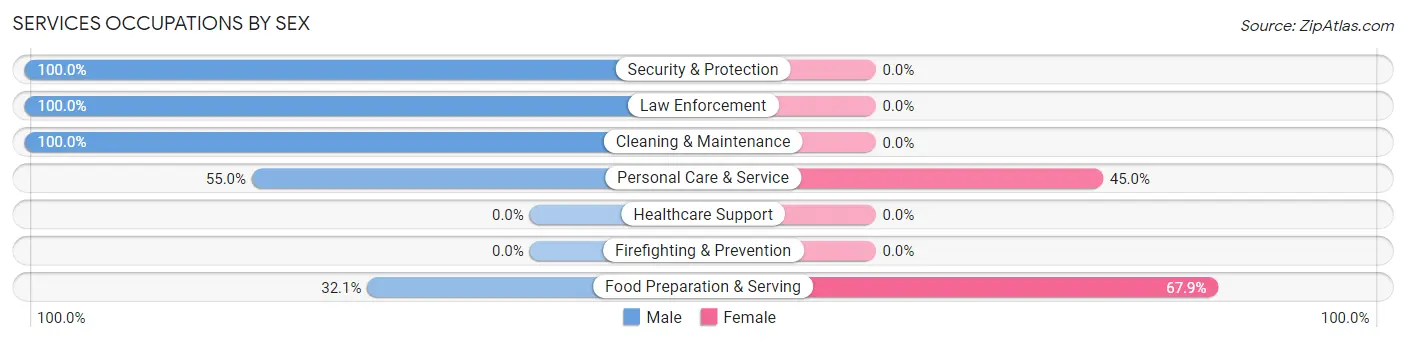
Services Occupations by Sex
Within the Services occupations in Tropic, the most male-oriented occupations are Security & Protection (100.0%), Law Enforcement (100.0%), and Cleaning & Maintenance (100.0%), while the most female-oriented occupations are Food Preparation & Serving (67.9%), and Personal Care & Service (45.0%).
| Occupation | Male | Female |
| Healthcare Support | 0 (0.0%) | 0 (0.0%) |
| Security & Protection | 18 (100.0%) | 0 (0.0%) |
| Firefighting & Prevention | 0 (0.0%) | 0 (0.0%) |
| Law Enforcement | 18 (100.0%) | 0 (0.0%) |
| Food Preparation & Serving | 9 (32.1%) | 19 (67.9%) |
| Cleaning & Maintenance | 2 (100.0%) | 0 (0.0%) |
| Personal Care & Service | 11 (55.0%) | 9 (45.0%) |
| Total (Category) | 40 (58.8%) | 28 (41.2%) |
| Total (Overall) | 130 (51.6%) | 122 (48.4%) |
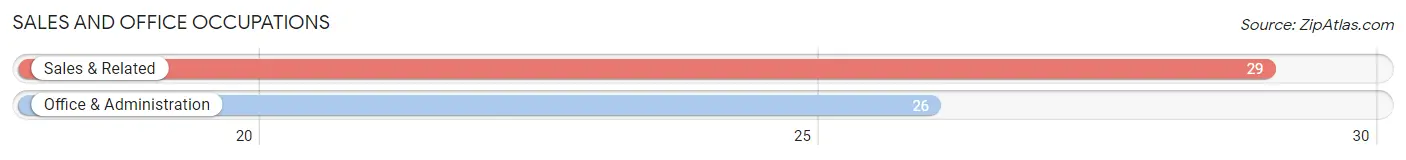
Sales and Office Occupations
The most common Sales and Office occupations in Tropic are Sales & Related (29 | 11.5%), and Office & Administration (26 | 10.3%).
Sales and Office Occupations by Sex
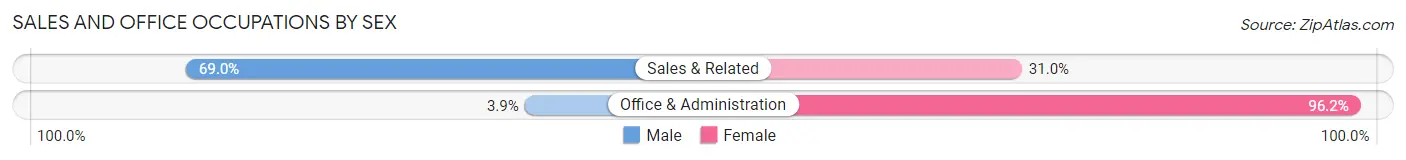
| Occupation | Male | Female |
| Sales & Related | 20 (69.0%) | 9 (31.0%) |
| Office & Administration | 1 (3.8%) | 25 (96.2%) |
| Total (Category) | 21 (38.2%) | 34 (61.8%) |
| Total (Overall) | 130 (51.6%) | 122 (48.4%) |
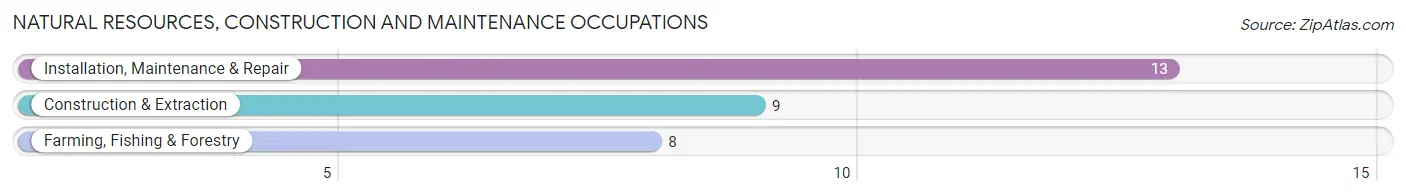
Natural Resources, Construction and Maintenance Occupations
The most common Natural Resources, Construction and Maintenance occupations in Tropic are Installation, Maintenance & Repair (13 | 5.2%), Construction & Extraction (9 | 3.6%), and Farming, Fishing & Forestry (8 | 3.2%).
Natural Resources, Construction and Maintenance Occupations by Sex
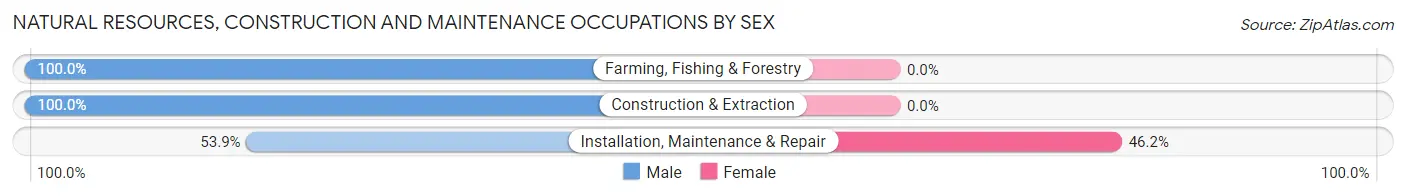
| Occupation | Male | Female |
| Farming, Fishing & Forestry | 8 (100.0%) | 0 (0.0%) |
| Construction & Extraction | 9 (100.0%) | 0 (0.0%) |
| Installation, Maintenance & Repair | 7 (53.8%) | 6 (46.2%) |
| Total (Category) | 24 (80.0%) | 6 (20.0%) |
| Total (Overall) | 130 (51.6%) | 122 (48.4%) |
Production, Transportation and Moving Occupations
The most common Production, Transportation and Moving occupations in Tropic are Production (15 | 5.9%), Transportation (3 | 1.2%), and Material Moving (3 | 1.2%).
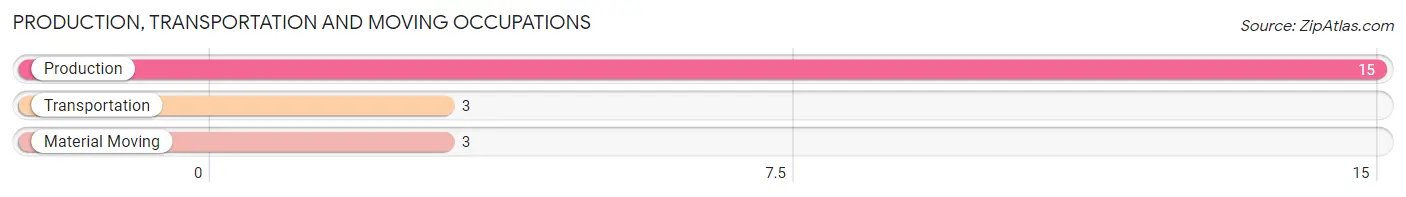
Production, Transportation and Moving Occupations by Sex
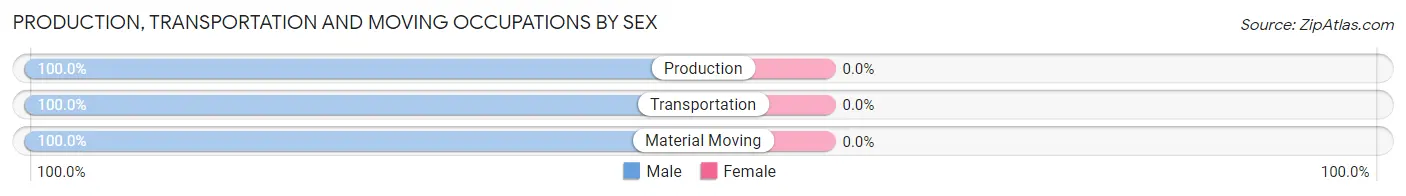
| Occupation | Male | Female |
| Production | 15 (100.0%) | 0 (0.0%) |
| Transportation | 3 (100.0%) | 0 (0.0%) |
| Material Moving | 3 (100.0%) | 0 (0.0%) |
| Total (Category) | 21 (100.0%) | 0 (0.0%) |
| Total (Overall) | 130 (51.6%) | 122 (48.4%) |
Employment Industries by Sex in Tropic
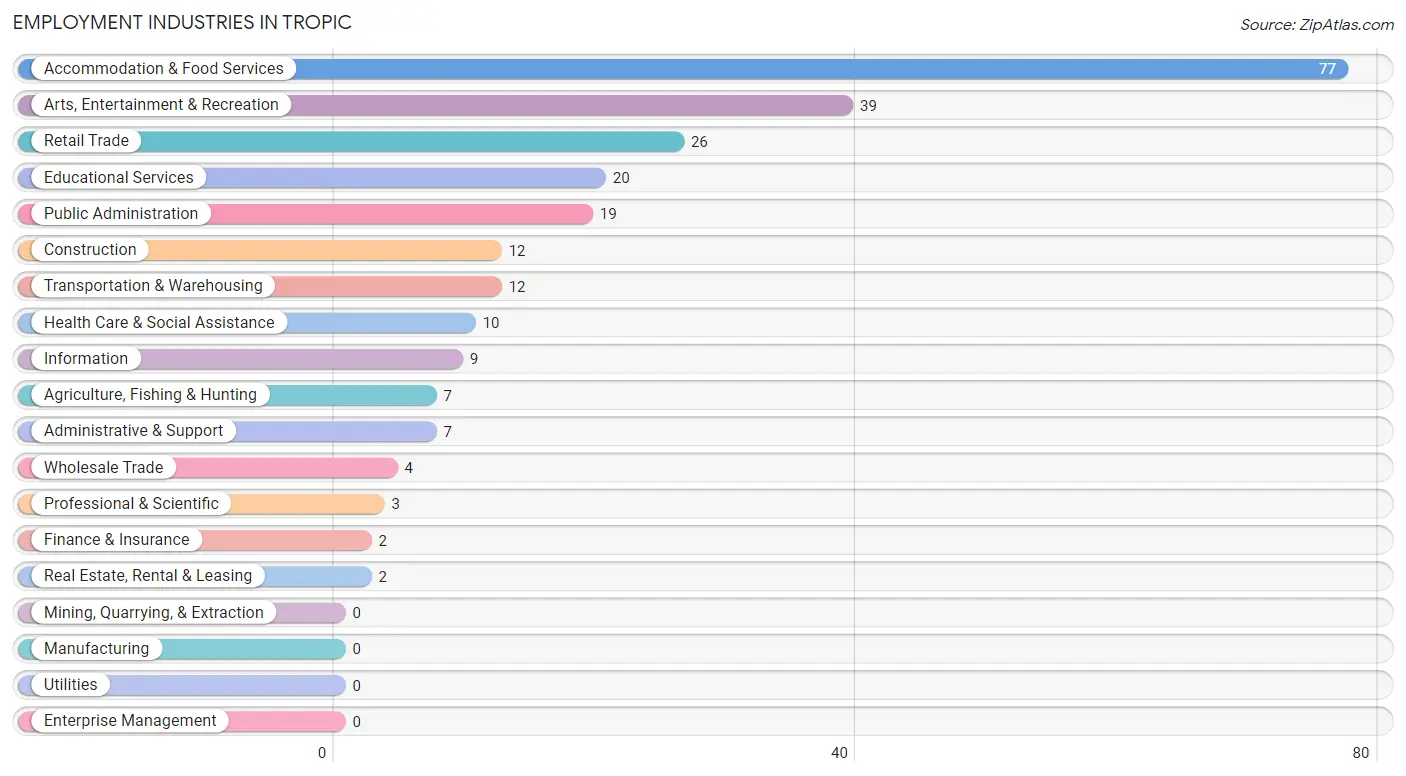
Employment Industries in Tropic
The major employment industries in Tropic include Accommodation & Food Services (77 | 30.6%), Arts, Entertainment & Recreation (39 | 15.5%), Retail Trade (26 | 10.3%), Educational Services (20 | 7.9%), and Public Administration (19 | 7.5%).
Employment Industries by Sex in Tropic
The Tropic industries that see more men than women are Agriculture, Fishing & Hunting (100.0%), Construction (100.0%), and Information (100.0%), whereas the industries that tend to have a higher number of women are Finance & Insurance (100.0%), Real Estate, Rental & Leasing (100.0%), and Professional & Scientific (100.0%).
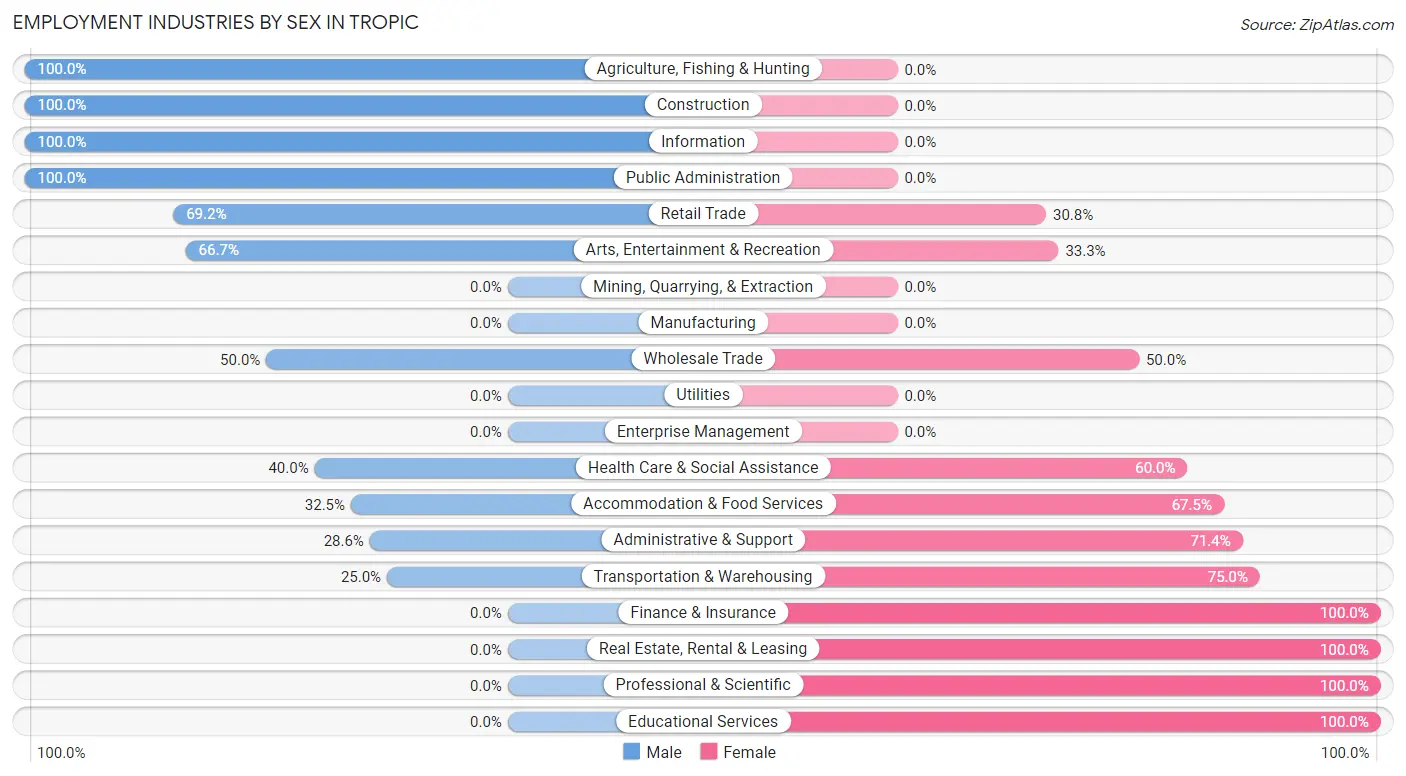
| Industry | Male | Female |
| Agriculture, Fishing & Hunting | 7 (100.0%) | 0 (0.0%) |
| Mining, Quarrying, & Extraction | 0 (0.0%) | 0 (0.0%) |
| Construction | 12 (100.0%) | 0 (0.0%) |
| Manufacturing | 0 (0.0%) | 0 (0.0%) |
| Wholesale Trade | 2 (50.0%) | 2 (50.0%) |
| Retail Trade | 18 (69.2%) | 8 (30.8%) |
| Transportation & Warehousing | 3 (25.0%) | 9 (75.0%) |
| Utilities | 0 (0.0%) | 0 (0.0%) |
| Information | 9 (100.0%) | 0 (0.0%) |
| Finance & Insurance | 0 (0.0%) | 2 (100.0%) |
| Real Estate, Rental & Leasing | 0 (0.0%) | 2 (100.0%) |
| Professional & Scientific | 0 (0.0%) | 3 (100.0%) |
| Enterprise Management | 0 (0.0%) | 0 (0.0%) |
| Administrative & Support | 2 (28.6%) | 5 (71.4%) |
| Educational Services | 0 (0.0%) | 20 (100.0%) |
| Health Care & Social Assistance | 4 (40.0%) | 6 (60.0%) |
| Arts, Entertainment & Recreation | 26 (66.7%) | 13 (33.3%) |
| Accommodation & Food Services | 25 (32.5%) | 52 (67.5%) |
| Public Administration | 19 (100.0%) | 0 (0.0%) |
| Total | 130 (51.6%) | 122 (48.4%) |
Education in Tropic
School Enrollment in Tropic
The most common levels of schooling among the 96 students in Tropic are middle school (38 | 39.6%), high school (24 | 25.0%), and nursery / preschool (14 | 14.6%).
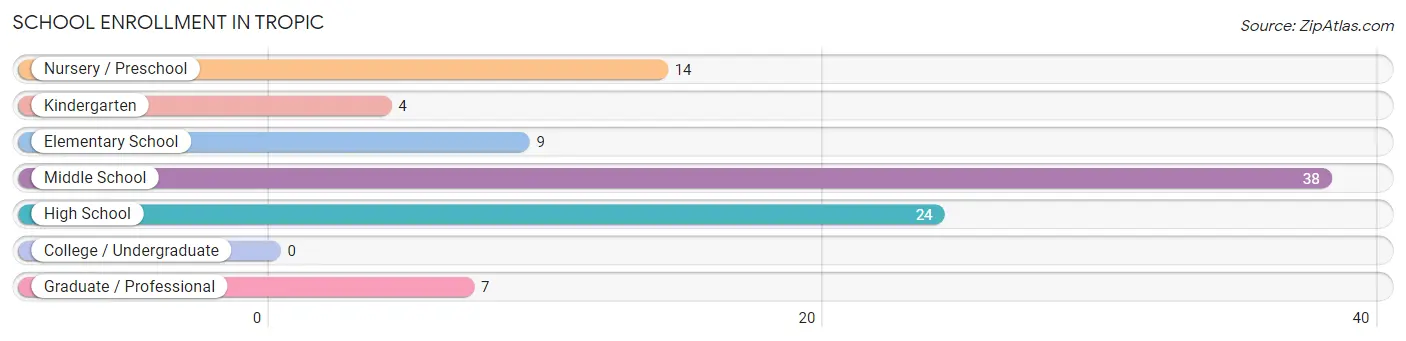
| School Level | # Students | % Students |
| Nursery / Preschool | 14 | 14.6% |
| Kindergarten | 4 | 4.2% |
| Elementary School | 9 | 9.4% |
| Middle School | 38 | 39.6% |
| High School | 24 | 25.0% |
| College / Undergraduate | 0 | 0.0% |
| Graduate / Professional | 7 | 7.3% |
| Total | 96 | 100.0% |
School Enrollment by Age by Funding Source in Tropic
Out of a total of 96 students who are enrolled in schools in Tropic, 7 (7.3%) attend a private institution, while the remaining 89 (92.7%) are enrolled in public schools. The age group of 35 years and over has the highest likelihood of being enrolled in private schools, with 7 (100.0% in the age bracket) enrolled. Conversely, the age group of 3 to 4 year olds has the lowest likelihood of being enrolled in a private school, with 14 (100.0% in the age bracket) attending a public institution.
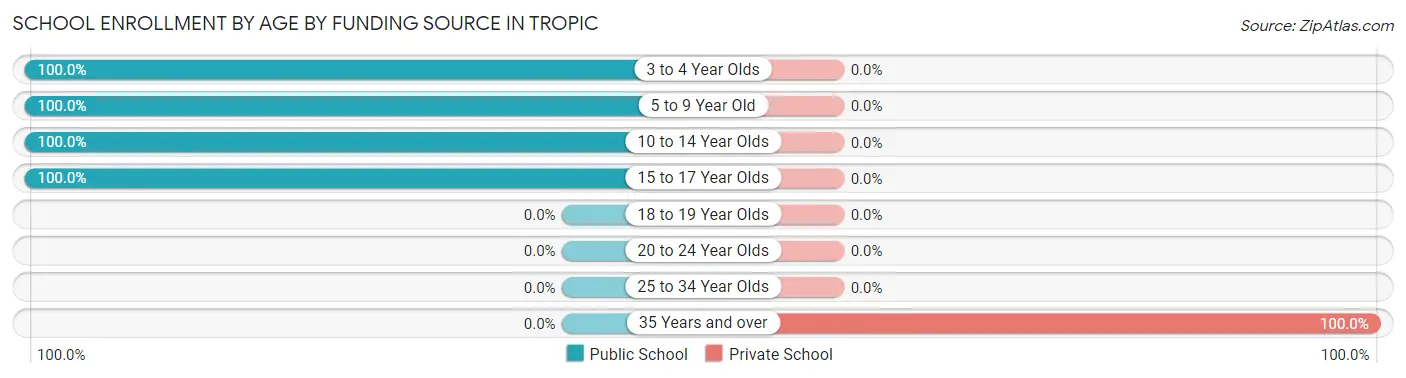
| Age Bracket | Public School | Private School |
| 3 to 4 Year Olds | 14 (100.0%) | 0 (0.0%) |
| 5 to 9 Year Old | 13 (100.0%) | 0 (0.0%) |
| 10 to 14 Year Olds | 38 (100.0%) | 0 (0.0%) |
| 15 to 17 Year Olds | 24 (100.0%) | 0 (0.0%) |
| 18 to 19 Year Olds | 0 (0.0%) | 0 (0.0%) |
| 20 to 24 Year Olds | 0 (0.0%) | 0 (0.0%) |
| 25 to 34 Year Olds | 0 (0.0%) | 0 (0.0%) |
| 35 Years and over | 0 (0.0%) | 7 (100.0%) |
| Total | 89 (92.7%) | 7 (7.3%) |
Educational Attainment by Field of Study in Tropic
Education (30 | 23.4%), business (26 | 20.3%), arts & humanities (20 | 15.6%), science & technology (17 | 13.3%), and visual & performing arts (11 | 8.6%) are the most common fields of study among 128 individuals in Tropic who have obtained a bachelor's degree or higher.
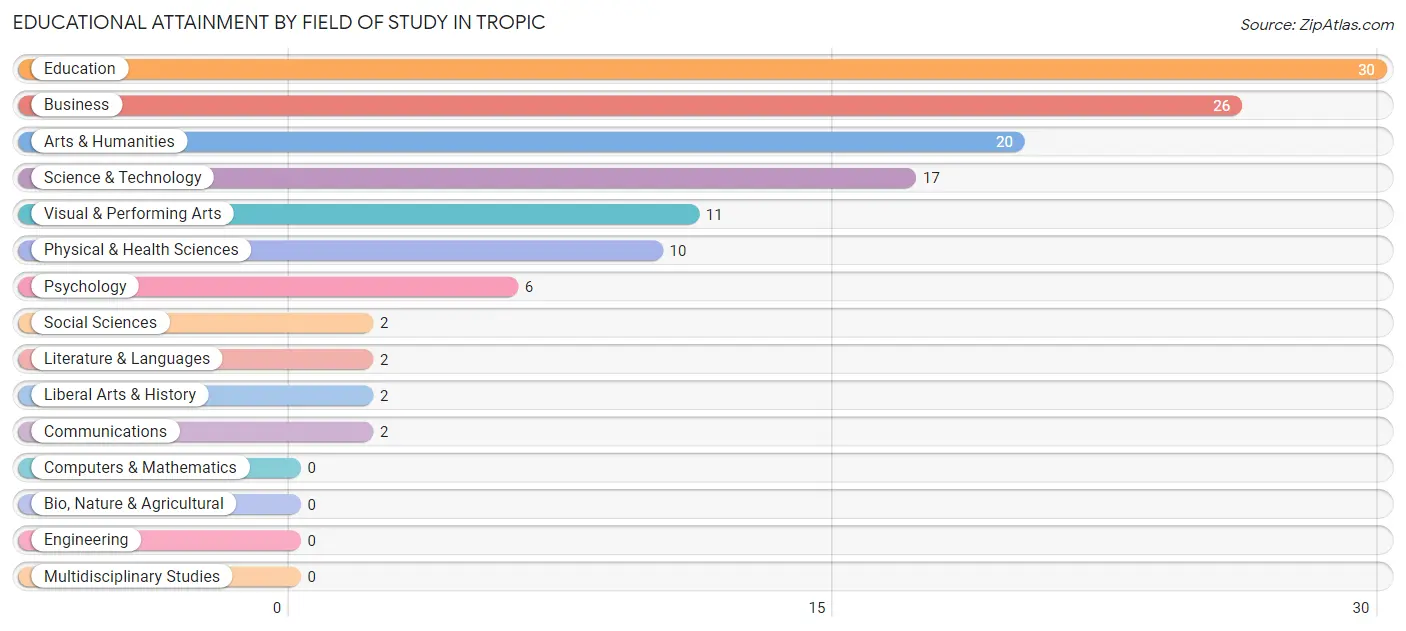
| Field of Study | # Graduates | % Graduates |
| Computers & Mathematics | 0 | 0.0% |
| Bio, Nature & Agricultural | 0 | 0.0% |
| Physical & Health Sciences | 10 | 7.8% |
| Psychology | 6 | 4.7% |
| Social Sciences | 2 | 1.6% |
| Engineering | 0 | 0.0% |
| Multidisciplinary Studies | 0 | 0.0% |
| Science & Technology | 17 | 13.3% |
| Business | 26 | 20.3% |
| Education | 30 | 23.4% |
| Literature & Languages | 2 | 1.6% |
| Liberal Arts & History | 2 | 1.6% |
| Visual & Performing Arts | 11 | 8.6% |
| Communications | 2 | 1.6% |
| Arts & Humanities | 20 | 15.6% |
| Total | 128 | 100.0% |
Transportation & Commute in Tropic
Vehicle Availability by Sex in Tropic
The most prevalent vehicle ownership categories in Tropic are males with 2 vehicles (48, accounting for 36.9%) and females with 2 vehicles (44, making up 39.3%).
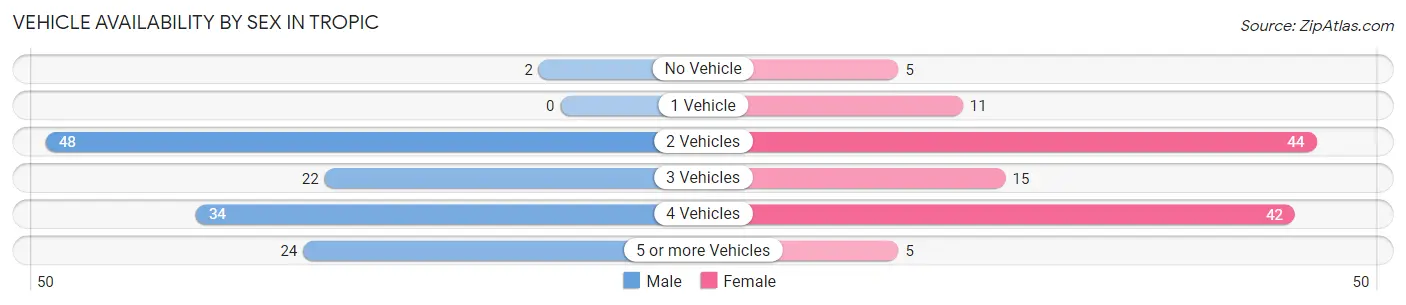
| Vehicles Available | Male | Female |
| No Vehicle | 2 (1.5%) | 5 (4.1%) |
| 1 Vehicle | 0 (0.0%) | 11 (9.0%) |
| 2 Vehicles | 48 (36.9%) | 44 (36.1%) |
| 3 Vehicles | 22 (16.9%) | 15 (12.3%) |
| 4 Vehicles | 34 (26.2%) | 42 (34.4%) |
| 5 or more Vehicles | 24 (18.5%) | 5 (4.1%) |
| Total | 130 (100.0%) | 122 (100.0%) |
Commute Time in Tropic
The most frequently occuring commute durations in Tropic are 15 to 19 minutes (63 commuters, 25.2%), less than 5 minutes (49 commuters, 19.6%), and 5 to 9 minutes (33 commuters, 13.2%).
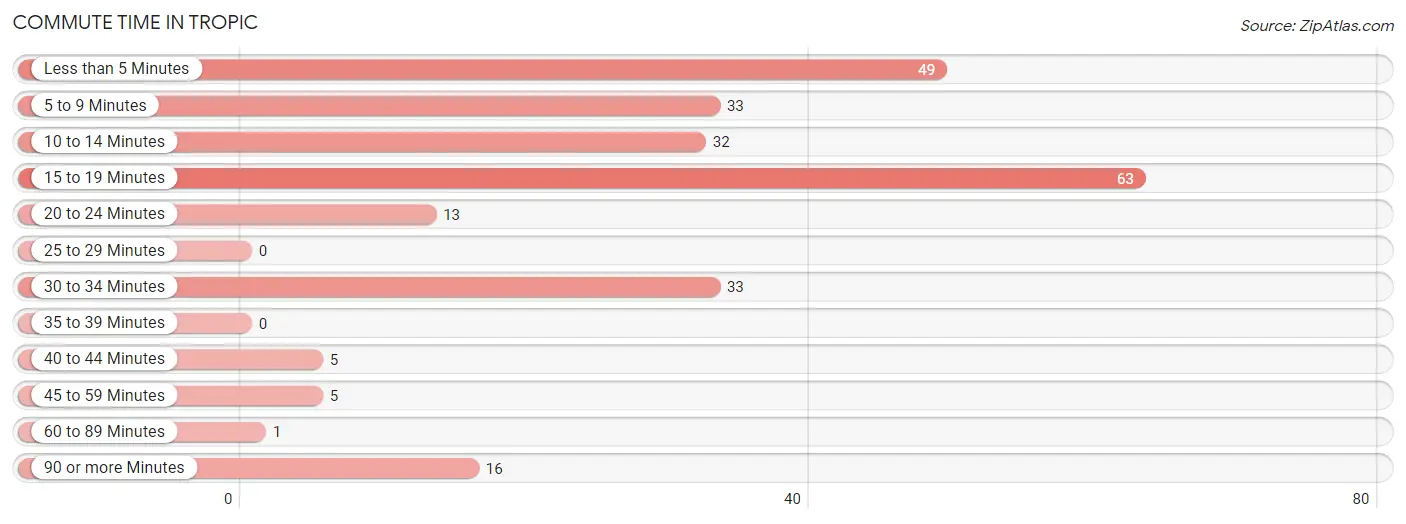
| Commute Time | # Commuters | % Commuters |
| Less than 5 Minutes | 49 | 19.6% |
| 5 to 9 Minutes | 33 | 13.2% |
| 10 to 14 Minutes | 32 | 12.8% |
| 15 to 19 Minutes | 63 | 25.2% |
| 20 to 24 Minutes | 13 | 5.2% |
| 25 to 29 Minutes | 0 | 0.0% |
| 30 to 34 Minutes | 33 | 13.2% |
| 35 to 39 Minutes | 0 | 0.0% |
| 40 to 44 Minutes | 5 | 2.0% |
| 45 to 59 Minutes | 5 | 2.0% |
| 60 to 89 Minutes | 1 | 0.4% |
| 90 or more Minutes | 16 | 6.4% |
Commute Time by Sex in Tropic
The most common commute times in Tropic are 15 to 19 minutes (37 commuters, 28.5%) for males and less than 5 minutes (49 commuters, 40.8%) for females.
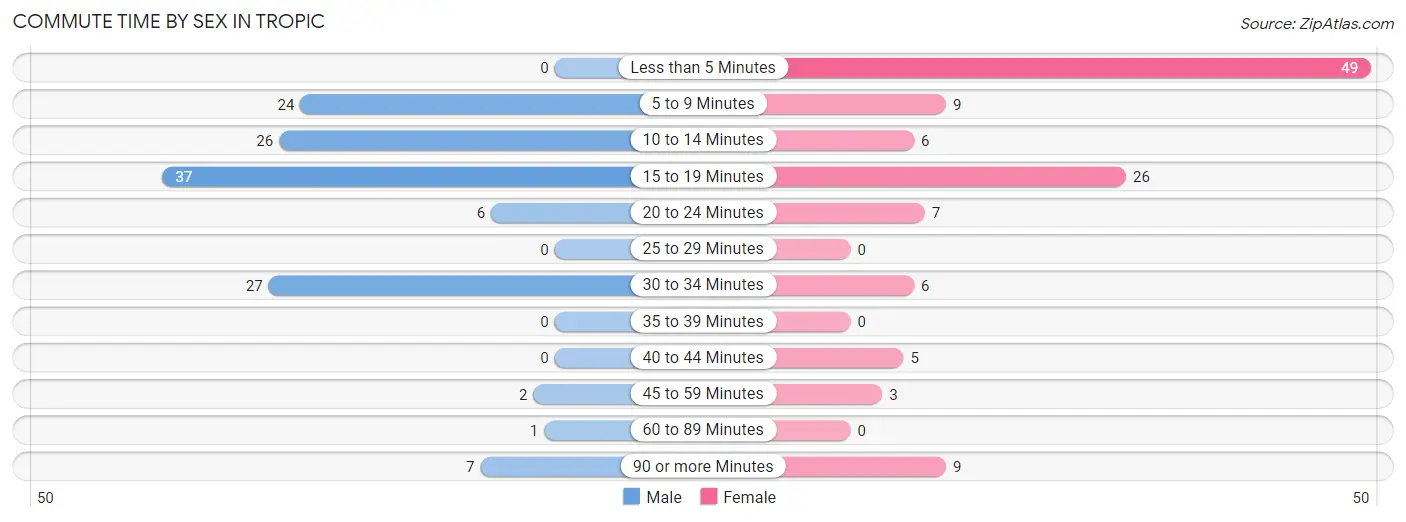
| Commute Time | Male | Female |
| Less than 5 Minutes | 0 (0.0%) | 49 (40.8%) |
| 5 to 9 Minutes | 24 (18.5%) | 9 (7.5%) |
| 10 to 14 Minutes | 26 (20.0%) | 6 (5.0%) |
| 15 to 19 Minutes | 37 (28.5%) | 26 (21.7%) |
| 20 to 24 Minutes | 6 (4.6%) | 7 (5.8%) |
| 25 to 29 Minutes | 0 (0.0%) | 0 (0.0%) |
| 30 to 34 Minutes | 27 (20.8%) | 6 (5.0%) |
| 35 to 39 Minutes | 0 (0.0%) | 0 (0.0%) |
| 40 to 44 Minutes | 0 (0.0%) | 5 (4.2%) |
| 45 to 59 Minutes | 2 (1.5%) | 3 (2.5%) |
| 60 to 89 Minutes | 1 (0.8%) | 0 (0.0%) |
| 90 or more Minutes | 7 (5.4%) | 9 (7.5%) |
Time of Departure to Work by Sex in Tropic
The most frequent times of departure to work in Tropic are 7:30 AM to 7:59 AM (37, 28.5%) for males and 7:00 AM to 7:29 AM (35, 29.2%) for females.
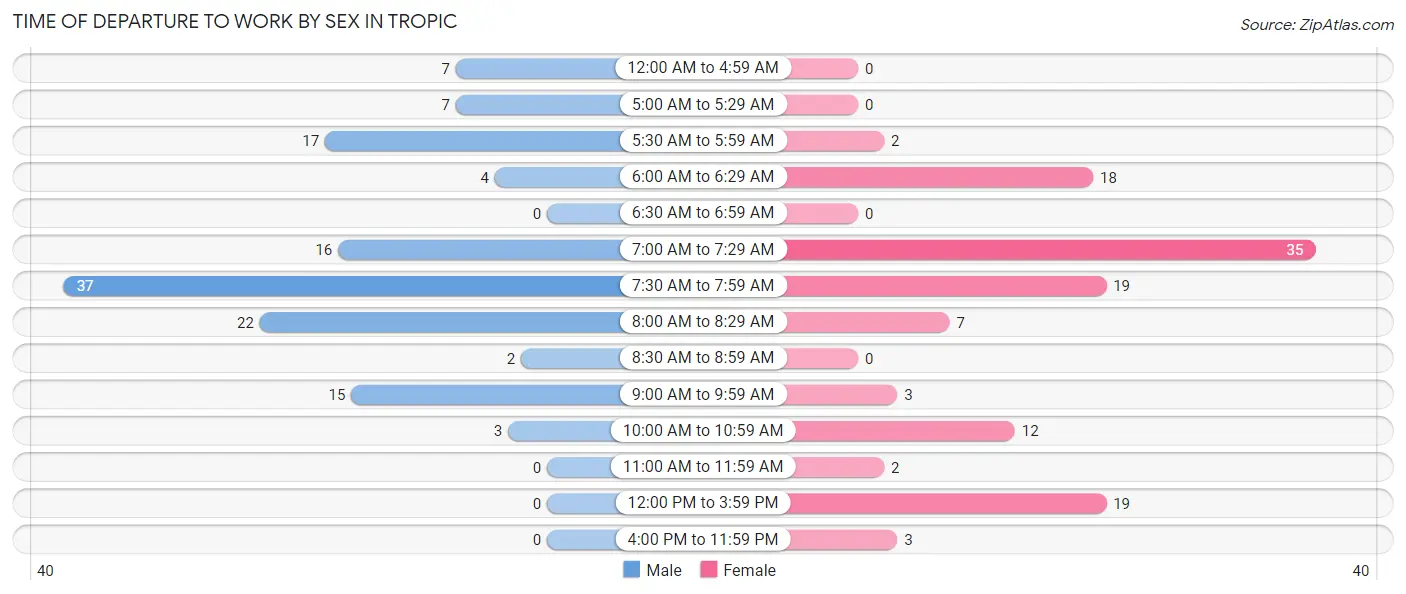
| Time of Departure | Male | Female |
| 12:00 AM to 4:59 AM | 7 (5.4%) | 0 (0.0%) |
| 5:00 AM to 5:29 AM | 7 (5.4%) | 0 (0.0%) |
| 5:30 AM to 5:59 AM | 17 (13.1%) | 2 (1.7%) |
| 6:00 AM to 6:29 AM | 4 (3.1%) | 18 (15.0%) |
| 6:30 AM to 6:59 AM | 0 (0.0%) | 0 (0.0%) |
| 7:00 AM to 7:29 AM | 16 (12.3%) | 35 (29.2%) |
| 7:30 AM to 7:59 AM | 37 (28.5%) | 19 (15.8%) |
| 8:00 AM to 8:29 AM | 22 (16.9%) | 7 (5.8%) |
| 8:30 AM to 8:59 AM | 2 (1.5%) | 0 (0.0%) |
| 9:00 AM to 9:59 AM | 15 (11.5%) | 3 (2.5%) |
| 10:00 AM to 10:59 AM | 3 (2.3%) | 12 (10.0%) |
| 11:00 AM to 11:59 AM | 0 (0.0%) | 2 (1.7%) |
| 12:00 PM to 3:59 PM | 0 (0.0%) | 19 (15.8%) |
| 4:00 PM to 11:59 PM | 0 (0.0%) | 3 (2.5%) |
| Total | 130 (100.0%) | 120 (100.0%) |
Housing Occupancy in Tropic
Occupancy by Ownership in Tropic
Of the total 211 dwellings in Tropic, owner-occupied units account for 192 (91.0%), while renter-occupied units make up 19 (9.0%).
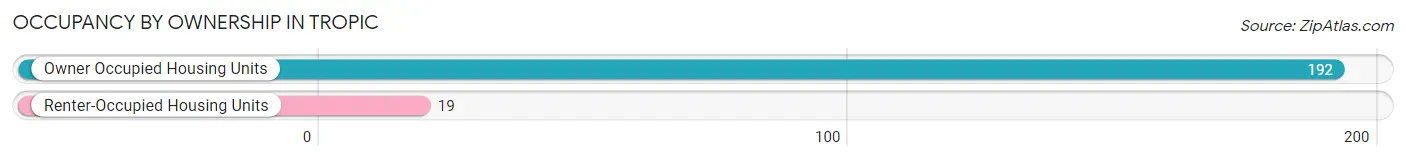
| Occupancy | # Housing Units | % Housing Units |
| Owner Occupied Housing Units | 192 | 91.0% |
| Renter-Occupied Housing Units | 19 | 9.0% |
| Total Occupied Housing Units | 211 | 100.0% |
Occupancy by Household Size in Tropic
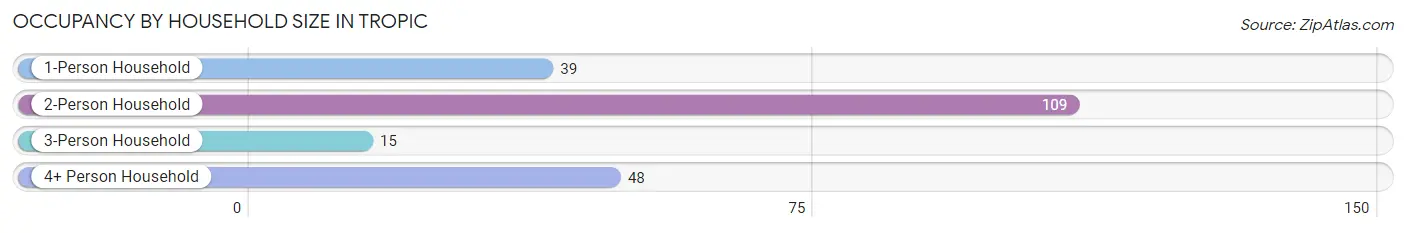
| Household Size | # Housing Units | % Housing Units |
| 1-Person Household | 39 | 18.5% |
| 2-Person Household | 109 | 51.7% |
| 3-Person Household | 15 | 7.1% |
| 4+ Person Household | 48 | 22.8% |
| Total Housing Units | 211 | 100.0% |
Occupancy by Ownership by Household Size in Tropic
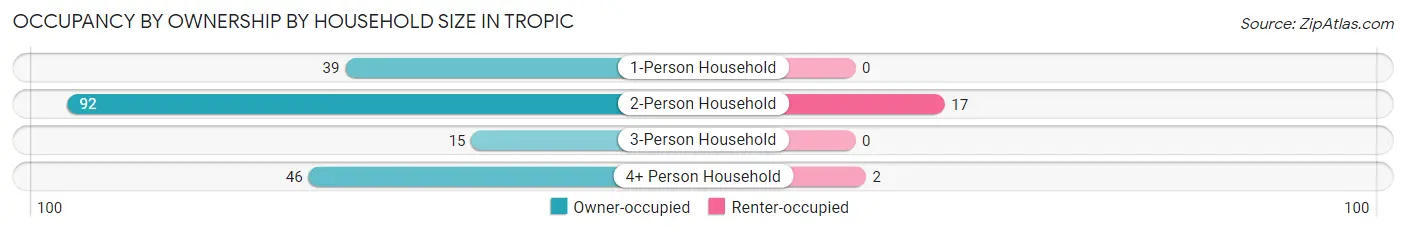
| Household Size | Owner-occupied | Renter-occupied |
| 1-Person Household | 39 (100.0%) | 0 (0.0%) |
| 2-Person Household | 92 (84.4%) | 17 (15.6%) |
| 3-Person Household | 15 (100.0%) | 0 (0.0%) |
| 4+ Person Household | 46 (95.8%) | 2 (4.2%) |
| Total Housing Units | 192 (91.0%) | 19 (9.0%) |
Occupancy by Educational Attainment in Tropic
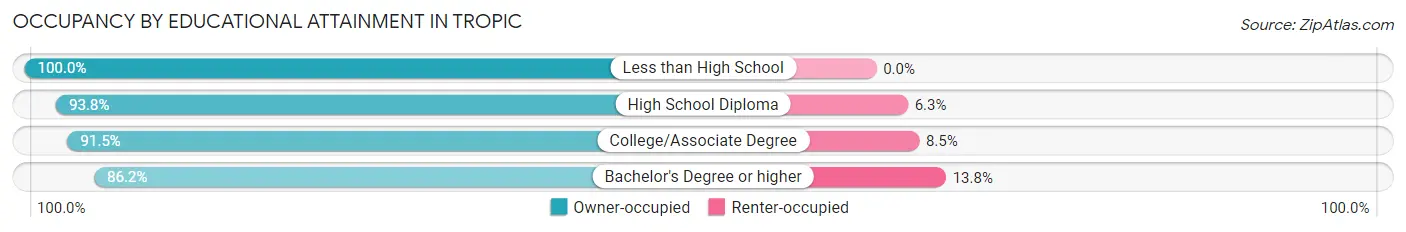
| Household Size | Owner-occupied | Renter-occupied |
| Less than High School | 15 (100.0%) | 0 (0.0%) |
| High School Diploma | 30 (93.8%) | 2 (6.2%) |
| College/Associate Degree | 97 (91.5%) | 9 (8.5%) |
| Bachelor's Degree or higher | 50 (86.2%) | 8 (13.8%) |
Occupancy by Age of Householder in Tropic
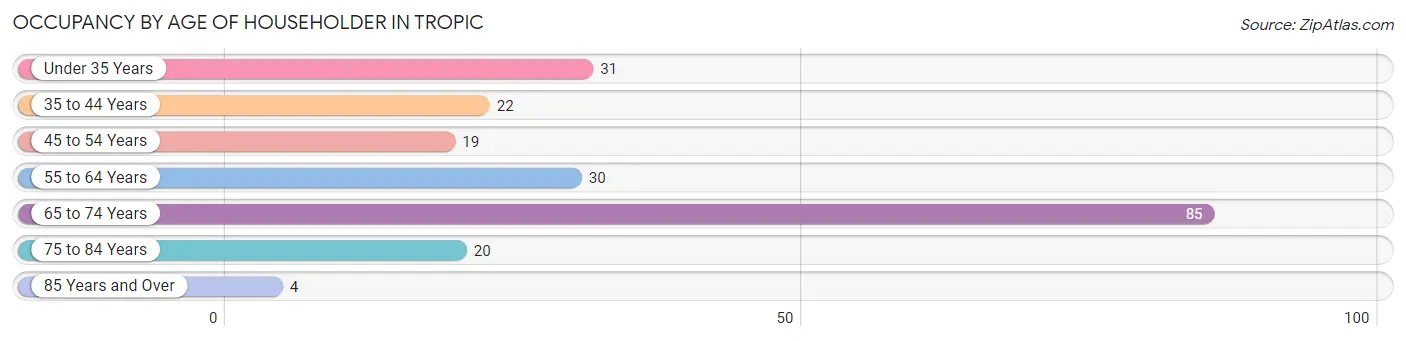
| Age Bracket | # Households | % Households |
| Under 35 Years | 31 | 14.7% |
| 35 to 44 Years | 22 | 10.4% |
| 45 to 54 Years | 19 | 9.0% |
| 55 to 64 Years | 30 | 14.2% |
| 65 to 74 Years | 85 | 40.3% |
| 75 to 84 Years | 20 | 9.5% |
| 85 Years and Over | 4 | 1.9% |
| Total | 211 | 100.0% |
Housing Finances in Tropic
Median Income by Occupancy in Tropic
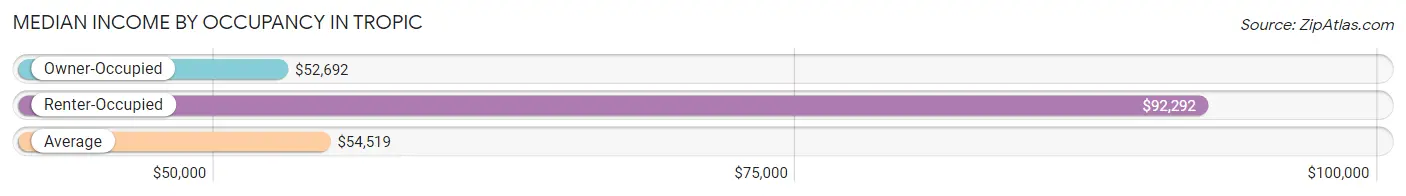
| Occupancy Type | # Households | Median Income |
| Owner-Occupied | 192 (91.0%) | $52,692 |
| Renter-Occupied | 19 (9.0%) | $92,292 |
| Average | 211 (100.0%) | $54,519 |
Occupancy by Householder Income Bracket in Tropic
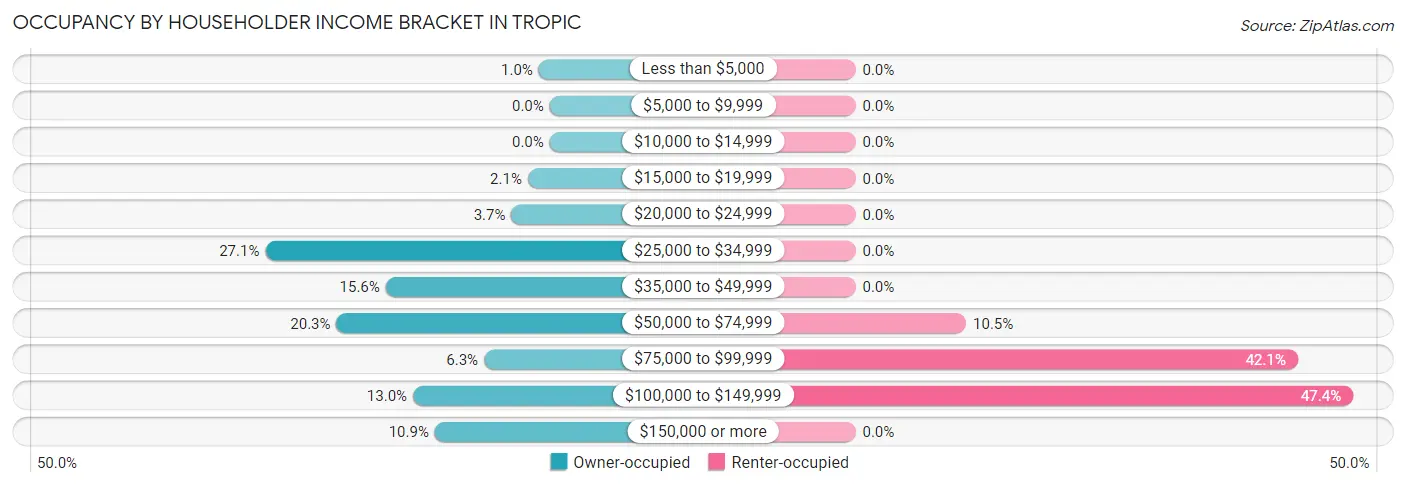
| Income Bracket | Owner-occupied | Renter-occupied |
| Less than $5,000 | 2 (1.0%) | 0 (0.0%) |
| $5,000 to $9,999 | 0 (0.0%) | 0 (0.0%) |
| $10,000 to $14,999 | 0 (0.0%) | 0 (0.0%) |
| $15,000 to $19,999 | 4 (2.1%) | 0 (0.0%) |
| $20,000 to $24,999 | 7 (3.6%) | 0 (0.0%) |
| $25,000 to $34,999 | 52 (27.1%) | 0 (0.0%) |
| $35,000 to $49,999 | 30 (15.6%) | 0 (0.0%) |
| $50,000 to $74,999 | 39 (20.3%) | 2 (10.5%) |
| $75,000 to $99,999 | 12 (6.2%) | 8 (42.1%) |
| $100,000 to $149,999 | 25 (13.0%) | 9 (47.4%) |
| $150,000 or more | 21 (10.9%) | 0 (0.0%) |
| Total | 192 (100.0%) | 19 (100.0%) |
Monthly Housing Cost Tiers in Tropic
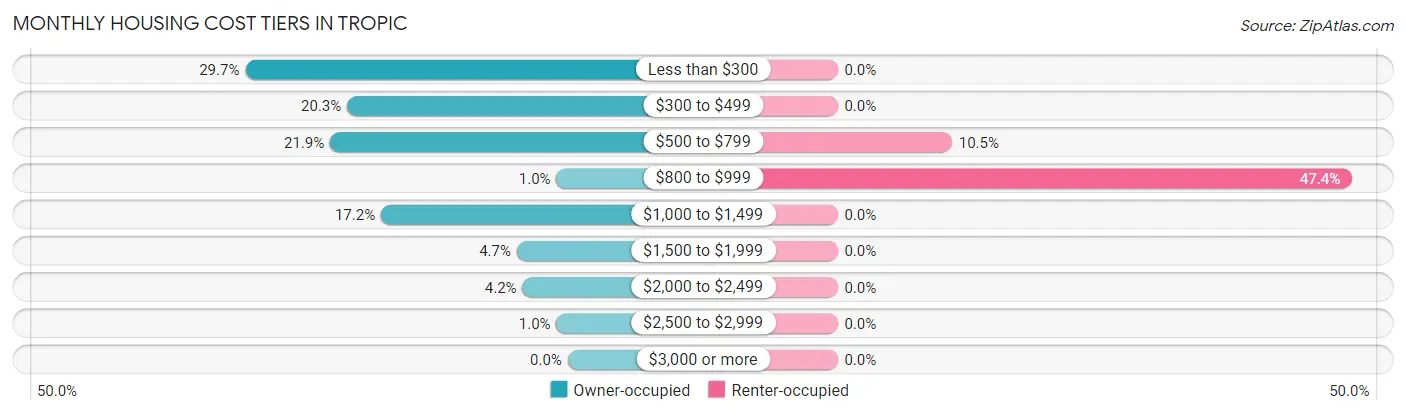
| Monthly Cost | Owner-occupied | Renter-occupied |
| Less than $300 | 57 (29.7%) | 0 (0.0%) |
| $300 to $499 | 39 (20.3%) | 0 (0.0%) |
| $500 to $799 | 42 (21.9%) | 2 (10.5%) |
| $800 to $999 | 2 (1.0%) | 9 (47.4%) |
| $1,000 to $1,499 | 33 (17.2%) | 0 (0.0%) |
| $1,500 to $1,999 | 9 (4.7%) | 0 (0.0%) |
| $2,000 to $2,499 | 8 (4.2%) | 0 (0.0%) |
| $2,500 to $2,999 | 2 (1.0%) | 0 (0.0%) |
| $3,000 or more | 0 (0.0%) | 0 (0.0%) |
| Total | 192 (100.0%) | 19 (100.0%) |
Physical Housing Characteristics in Tropic
Housing Structures in Tropic
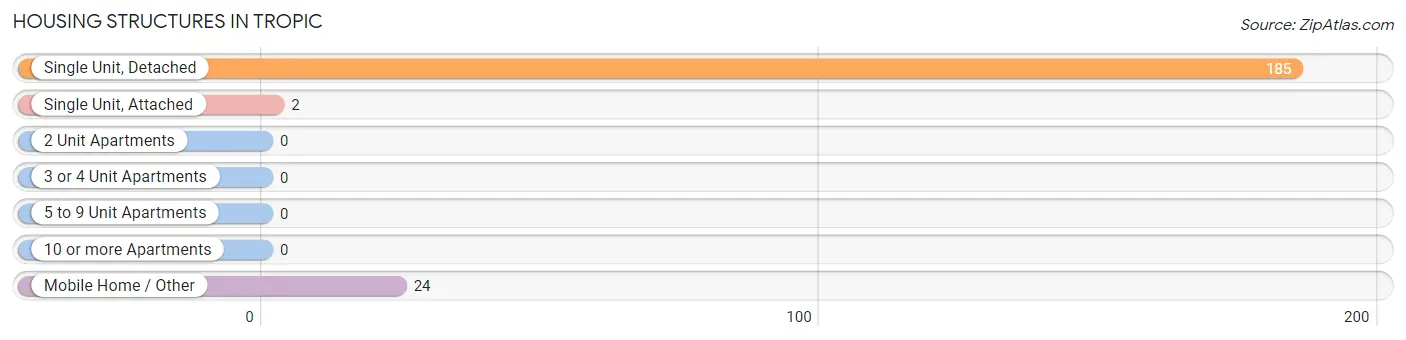
| Structure Type | # Housing Units | % Housing Units |
| Single Unit, Detached | 185 | 87.7% |
| Single Unit, Attached | 2 | 0.9% |
| 2 Unit Apartments | 0 | 0.0% |
| 3 or 4 Unit Apartments | 0 | 0.0% |
| 5 to 9 Unit Apartments | 0 | 0.0% |
| 10 or more Apartments | 0 | 0.0% |
| Mobile Home / Other | 24 | 11.4% |
| Total | 211 | 100.0% |
Housing Structures by Occupancy in Tropic
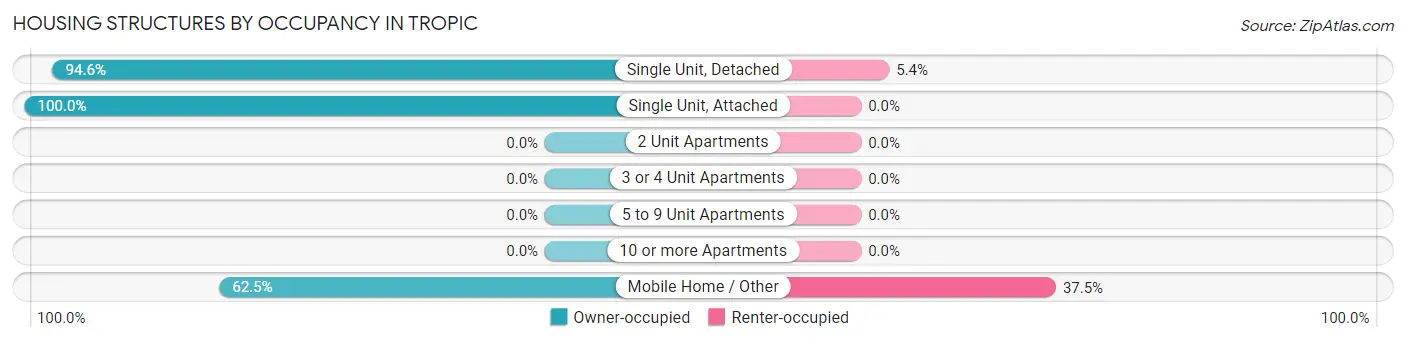
| Structure Type | Owner-occupied | Renter-occupied |
| Single Unit, Detached | 175 (94.6%) | 10 (5.4%) |
| Single Unit, Attached | 2 (100.0%) | 0 (0.0%) |
| 2 Unit Apartments | 0 (0.0%) | 0 (0.0%) |
| 3 or 4 Unit Apartments | 0 (0.0%) | 0 (0.0%) |
| 5 to 9 Unit Apartments | 0 (0.0%) | 0 (0.0%) |
| 10 or more Apartments | 0 (0.0%) | 0 (0.0%) |
| Mobile Home / Other | 15 (62.5%) | 9 (37.5%) |
| Total | 192 (91.0%) | 19 (9.0%) |
Housing Structures by Number of Rooms in Tropic
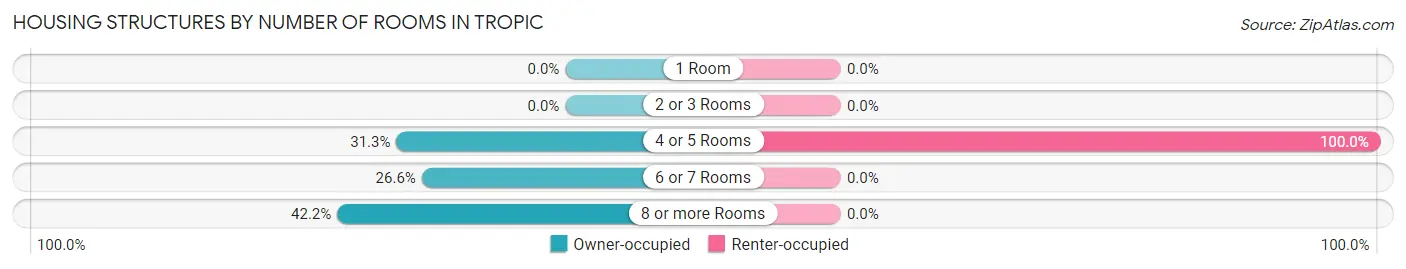
| Number of Rooms | Owner-occupied | Renter-occupied |
| 1 Room | 0 (0.0%) | 0 (0.0%) |
| 2 or 3 Rooms | 0 (0.0%) | 0 (0.0%) |
| 4 or 5 Rooms | 60 (31.2%) | 19 (100.0%) |
| 6 or 7 Rooms | 51 (26.6%) | 0 (0.0%) |
| 8 or more Rooms | 81 (42.2%) | 0 (0.0%) |
| Total | 192 (100.0%) | 19 (100.0%) |
Housing Structure by Heating Type in Tropic
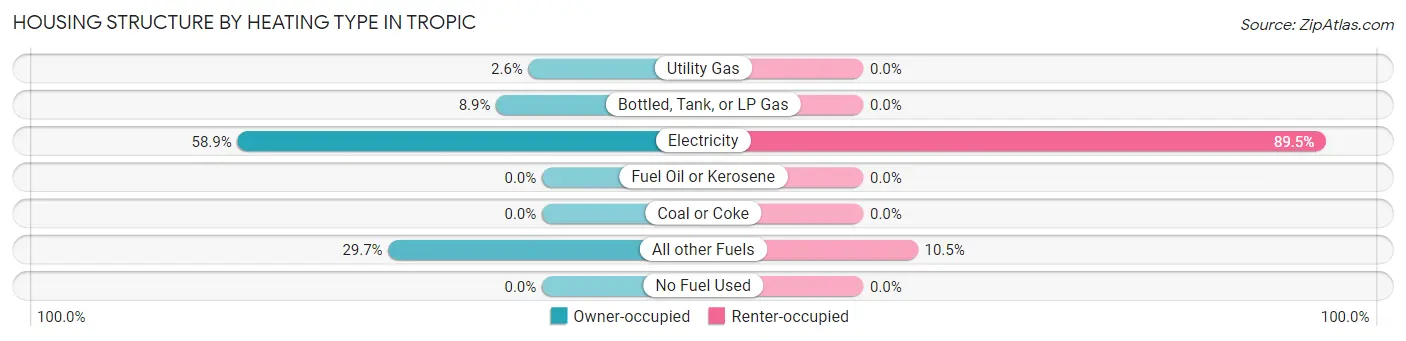
| Heating Type | Owner-occupied | Renter-occupied |
| Utility Gas | 5 (2.6%) | 0 (0.0%) |
| Bottled, Tank, or LP Gas | 17 (8.8%) | 0 (0.0%) |
| Electricity | 113 (58.9%) | 17 (89.5%) |
| Fuel Oil or Kerosene | 0 (0.0%) | 0 (0.0%) |
| Coal or Coke | 0 (0.0%) | 0 (0.0%) |
| All other Fuels | 57 (29.7%) | 2 (10.5%) |
| No Fuel Used | 0 (0.0%) | 0 (0.0%) |
| Total | 192 (100.0%) | 19 (100.0%) |
Household Vehicle Usage in Tropic
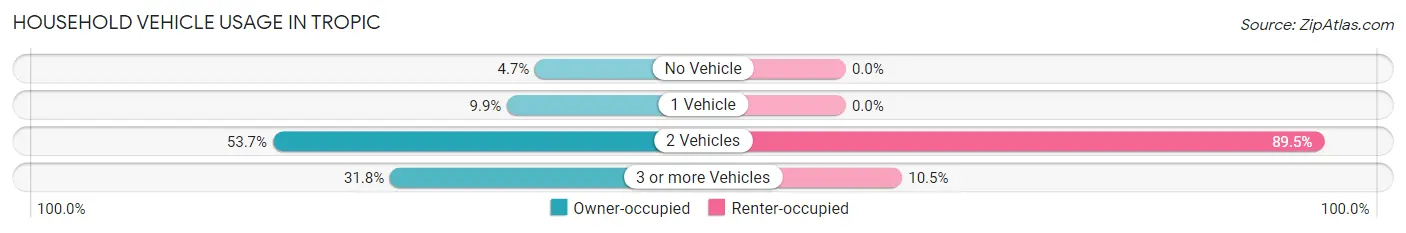
| Vehicles per Household | Owner-occupied | Renter-occupied |
| No Vehicle | 9 (4.7%) | 0 (0.0%) |
| 1 Vehicle | 19 (9.9%) | 0 (0.0%) |
| 2 Vehicles | 103 (53.6%) | 17 (89.5%) |
| 3 or more Vehicles | 61 (31.8%) | 2 (10.5%) |
| Total | 192 (100.0%) | 19 (100.0%) |
Real Estate & Mortgages in Tropic
Real Estate and Mortgage Overview in Tropic
| Characteristic | Without Mortgage | With Mortgage |
| Housing Units | 125 | 67 |
| Median Property Value | $215,500 | $227,900 |
| Median Household Income | $35,139 | $13 |
| Monthly Housing Costs | $346 | $0 |
| Real Estate Taxes | $777 | $0 |
Property Value by Mortgage Status in Tropic
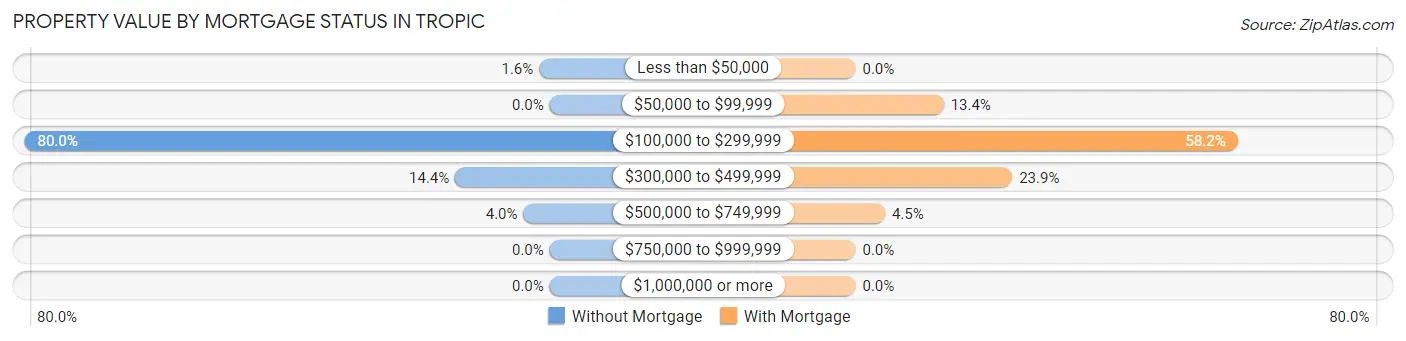
| Property Value | Without Mortgage | With Mortgage |
| Less than $50,000 | 2 (1.6%) | 0 (0.0%) |
| $50,000 to $99,999 | 0 (0.0%) | 9 (13.4%) |
| $100,000 to $299,999 | 100 (80.0%) | 39 (58.2%) |
| $300,000 to $499,999 | 18 (14.4%) | 16 (23.9%) |
| $500,000 to $749,999 | 5 (4.0%) | 3 (4.5%) |
| $750,000 to $999,999 | 0 (0.0%) | 0 (0.0%) |
| $1,000,000 or more | 0 (0.0%) | 0 (0.0%) |
| Total | 125 (100.0%) | 67 (100.0%) |
Household Income by Mortgage Status in Tropic
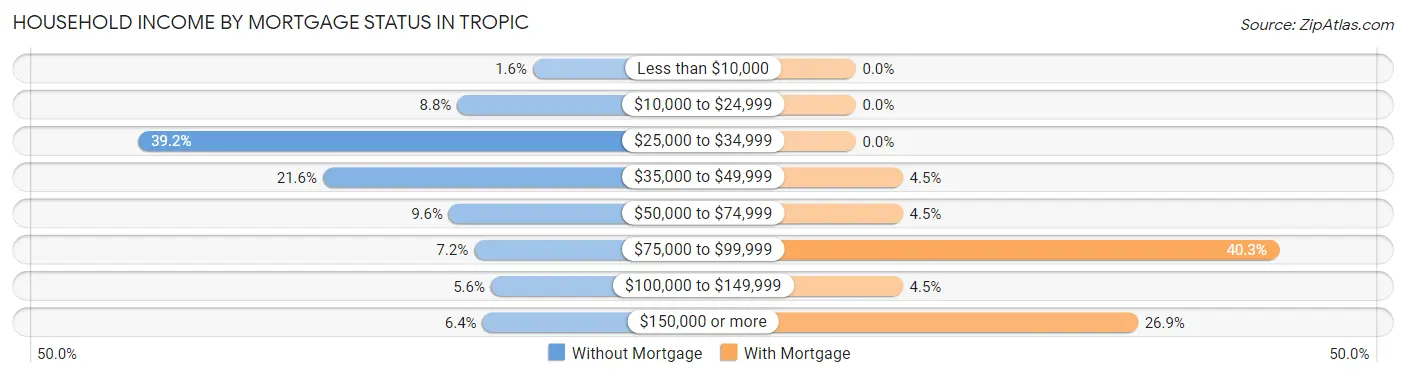
| Household Income | Without Mortgage | With Mortgage |
| Less than $10,000 | 2 (1.6%) | 0 (0.0%) |
| $10,000 to $24,999 | 11 (8.8%) | 0 (0.0%) |
| $25,000 to $34,999 | 49 (39.2%) | 0 (0.0%) |
| $35,000 to $49,999 | 27 (21.6%) | 3 (4.5%) |
| $50,000 to $74,999 | 12 (9.6%) | 3 (4.5%) |
| $75,000 to $99,999 | 9 (7.2%) | 27 (40.3%) |
| $100,000 to $149,999 | 7 (5.6%) | 3 (4.5%) |
| $150,000 or more | 8 (6.4%) | 18 (26.9%) |
| Total | 125 (100.0%) | 67 (100.0%) |
Property Value to Household Income Ratio in Tropic
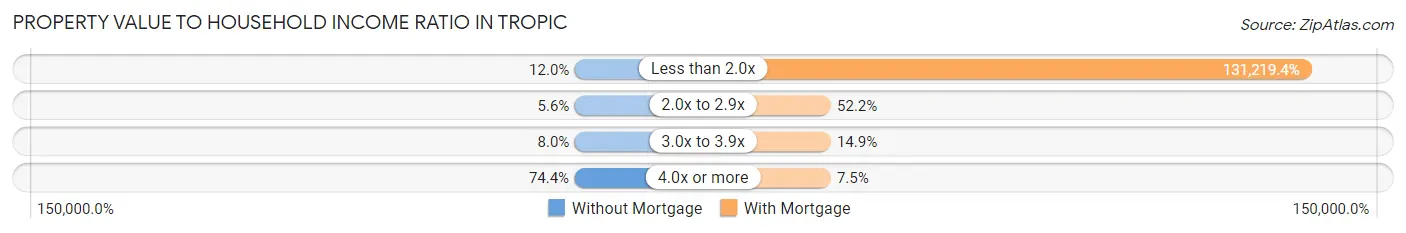
| Value-to-Income Ratio | Without Mortgage | With Mortgage |
| Less than 2.0x | 15 (12.0%) | 87,917 (131,219.4%) |
| 2.0x to 2.9x | 7 (5.6%) | 35 (52.2%) |
| 3.0x to 3.9x | 10 (8.0%) | 10 (14.9%) |
| 4.0x or more | 93 (74.4%) | 5 (7.5%) |
| Total | 125 (100.0%) | 67 (100.0%) |
Real Estate Taxes by Mortgage Status in Tropic
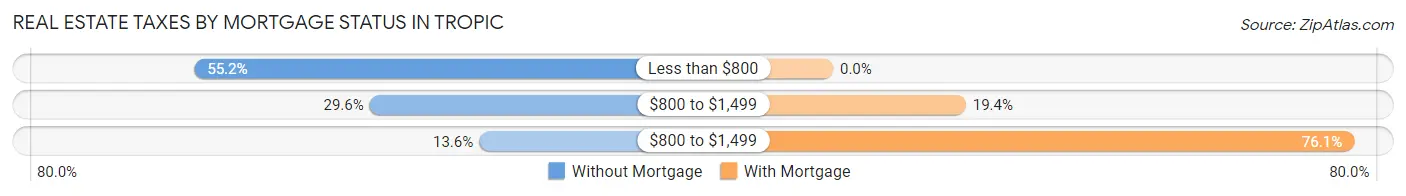
| Property Taxes | Without Mortgage | With Mortgage |
| Less than $800 | 69 (55.2%) | 0 (0.0%) |
| $800 to $1,499 | 37 (29.6%) | 13 (19.4%) |
| $800 to $1,499 | 17 (13.6%) | 51 (76.1%) |
| Total | 125 (100.0%) | 67 (100.0%) |
Health & Disability in Tropic
Health Insurance Coverage by Age in Tropic
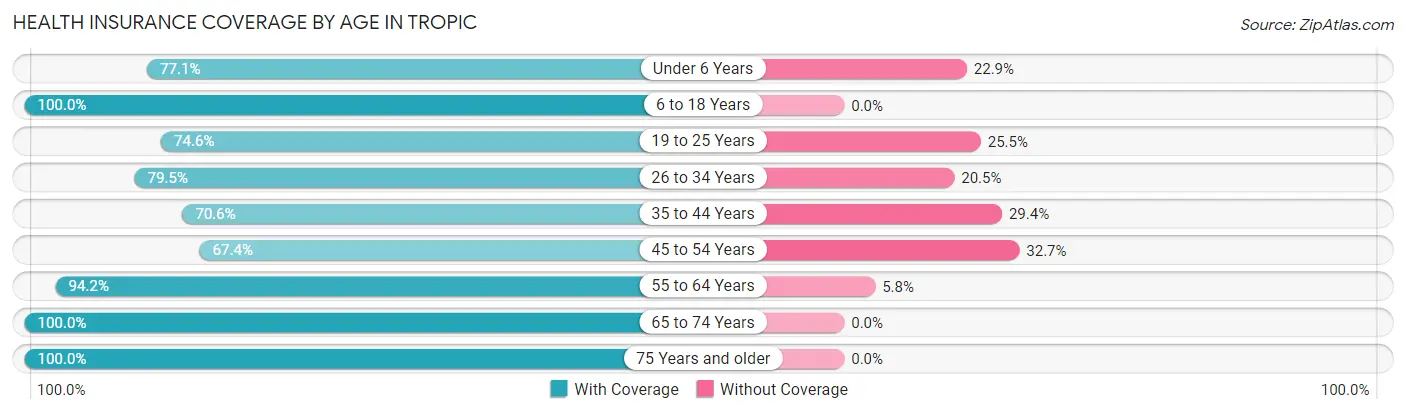
| Age Bracket | With Coverage | Without Coverage |
| Under 6 Years | 27 (77.1%) | 8 (22.9%) |
| 6 to 18 Years | 71 (100.0%) | 0 (0.0%) |
| 19 to 25 Years | 41 (74.6%) | 14 (25.5%) |
| 26 to 34 Years | 31 (79.5%) | 8 (20.5%) |
| 35 to 44 Years | 36 (70.6%) | 15 (29.4%) |
| 45 to 54 Years | 33 (67.3%) | 16 (32.7%) |
| 55 to 64 Years | 49 (94.2%) | 3 (5.8%) |
| 65 to 74 Years | 108 (100.0%) | 0 (0.0%) |
| 75 Years and older | 64 (100.0%) | 0 (0.0%) |
| Total | 460 (87.8%) | 64 (12.2%) |
Health Insurance Coverage by Citizenship Status in Tropic
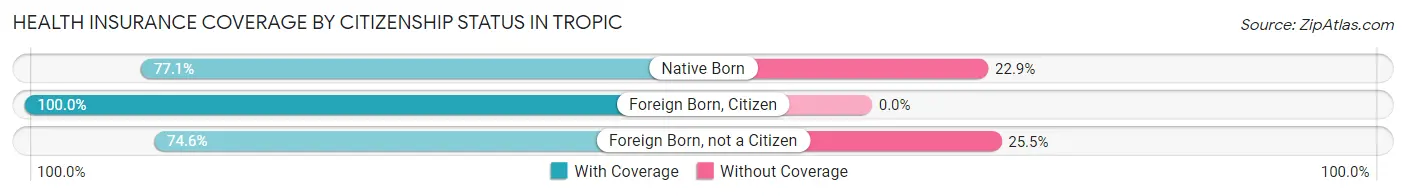
| Citizenship Status | With Coverage | Without Coverage |
| Native Born | 27 (77.1%) | 8 (22.9%) |
| Foreign Born, Citizen | 71 (100.0%) | 0 (0.0%) |
| Foreign Born, not a Citizen | 41 (74.6%) | 14 (25.5%) |
Health Insurance Coverage by Household Income in Tropic
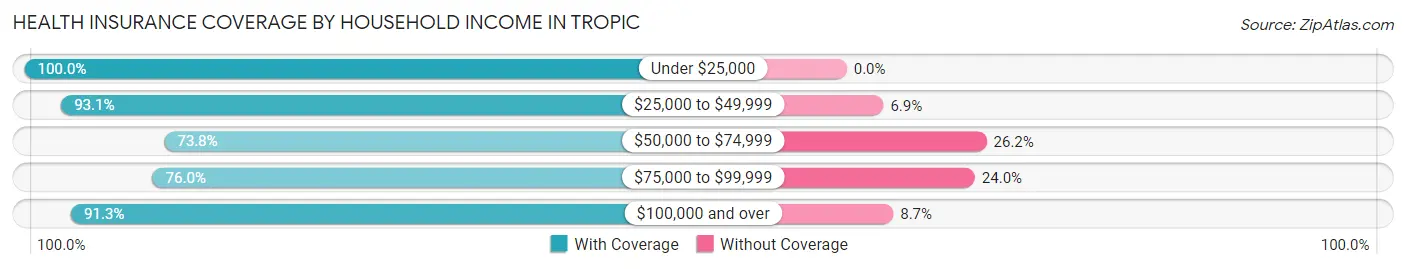
| Household Income | With Coverage | Without Coverage |
| Under $25,000 | 18 (100.0%) | 0 (0.0%) |
| $25,000 to $49,999 | 122 (93.1%) | 9 (6.9%) |
| $50,000 to $74,999 | 62 (73.8%) | 22 (26.2%) |
| $75,000 to $99,999 | 38 (76.0%) | 12 (24.0%) |
| $100,000 and over | 220 (91.3%) | 21 (8.7%) |
Public vs Private Health Insurance Coverage by Age in Tropic
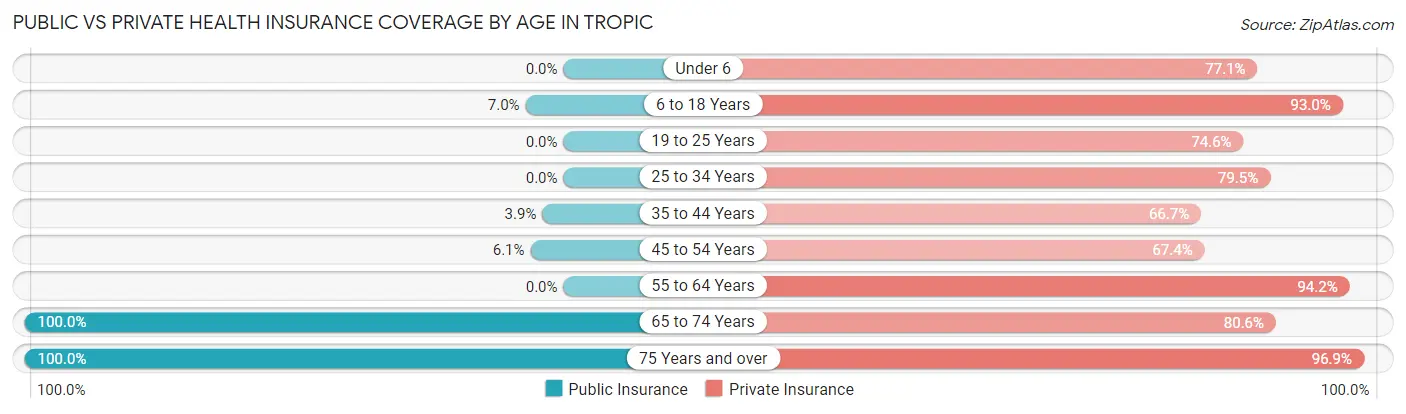
| Age Bracket | Public Insurance | Private Insurance |
| Under 6 | 0 (0.0%) | 27 (77.1%) |
| 6 to 18 Years | 5 (7.0%) | 66 (93.0%) |
| 19 to 25 Years | 0 (0.0%) | 41 (74.6%) |
| 25 to 34 Years | 0 (0.0%) | 31 (79.5%) |
| 35 to 44 Years | 2 (3.9%) | 34 (66.7%) |
| 45 to 54 Years | 3 (6.1%) | 33 (67.3%) |
| 55 to 64 Years | 0 (0.0%) | 49 (94.2%) |
| 65 to 74 Years | 108 (100.0%) | 87 (80.6%) |
| 75 Years and over | 64 (100.0%) | 62 (96.9%) |
| Total | 182 (34.7%) | 430 (82.1%) |
Disability Status by Sex by Age in Tropic
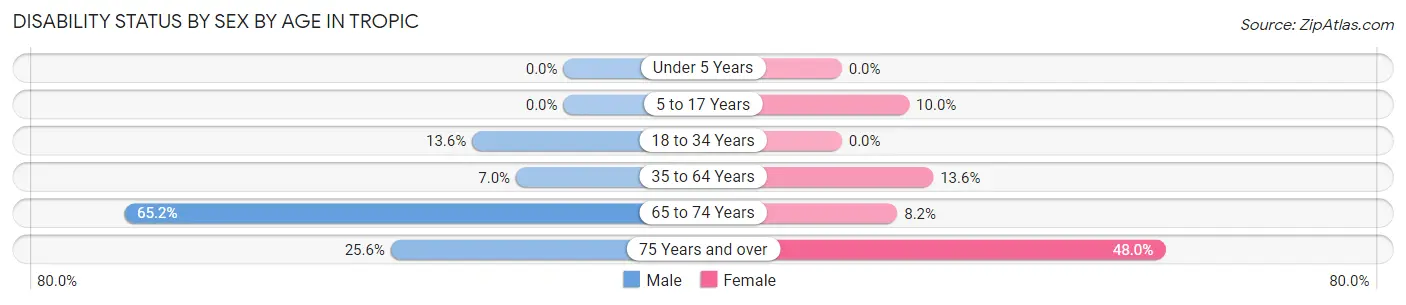
| Age Bracket | Male | Female |
| Under 5 Years | 0 (0.0%) | 0 (0.0%) |
| 5 to 17 Years | 0 (0.0%) | 3 (10.0%) |
| 18 to 34 Years | 8 (13.6%) | 0 (0.0%) |
| 35 to 64 Years | 5 (7.0%) | 11 (13.6%) |
| 65 to 74 Years | 15 (65.2%) | 7 (8.2%) |
| 75 Years and over | 10 (25.6%) | 12 (48.0%) |
Disability Class by Sex by Age in Tropic
Disability Class: Hearing Difficulty
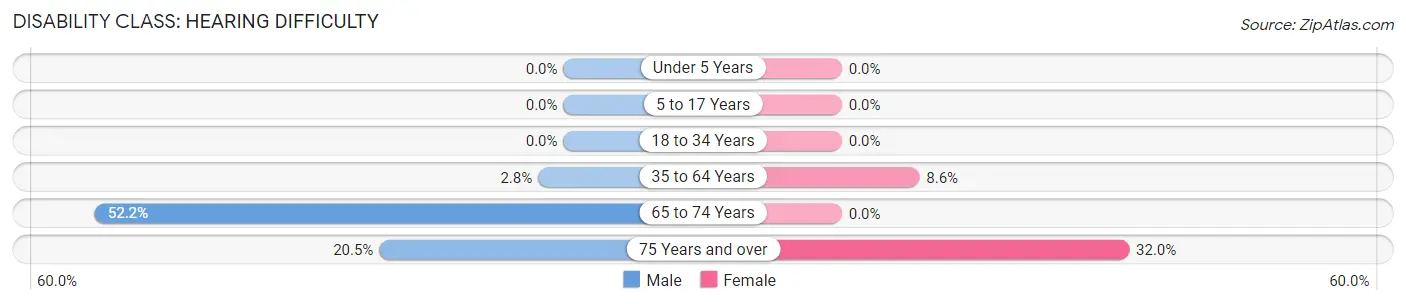
| Age Bracket | Male | Female |
| Under 5 Years | 0 (0.0%) | 0 (0.0%) |
| 5 to 17 Years | 0 (0.0%) | 0 (0.0%) |
| 18 to 34 Years | 0 (0.0%) | 0 (0.0%) |
| 35 to 64 Years | 2 (2.8%) | 7 (8.6%) |
| 65 to 74 Years | 12 (52.2%) | 0 (0.0%) |
| 75 Years and over | 8 (20.5%) | 8 (32.0%) |
Disability Class: Vision Difficulty
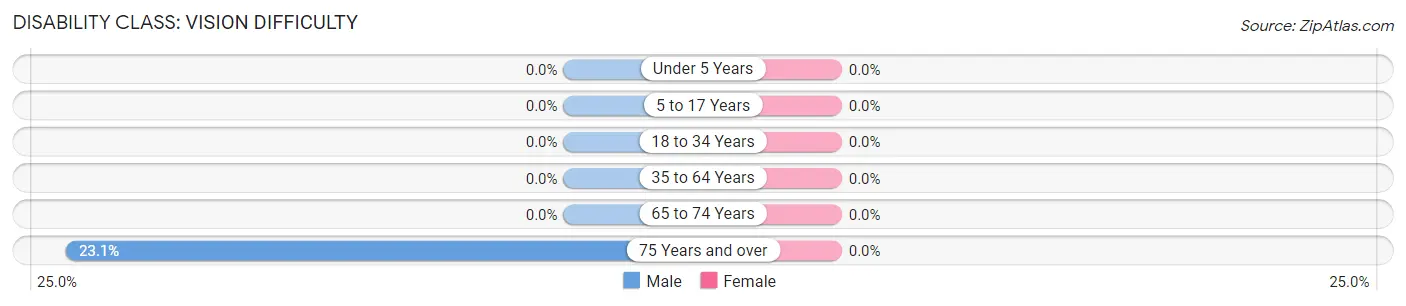
| Age Bracket | Male | Female |
| Under 5 Years | 0 (0.0%) | 0 (0.0%) |
| 5 to 17 Years | 0 (0.0%) | 0 (0.0%) |
| 18 to 34 Years | 0 (0.0%) | 0 (0.0%) |
| 35 to 64 Years | 0 (0.0%) | 0 (0.0%) |
| 65 to 74 Years | 0 (0.0%) | 0 (0.0%) |
| 75 Years and over | 9 (23.1%) | 0 (0.0%) |
Disability Class: Cognitive Difficulty
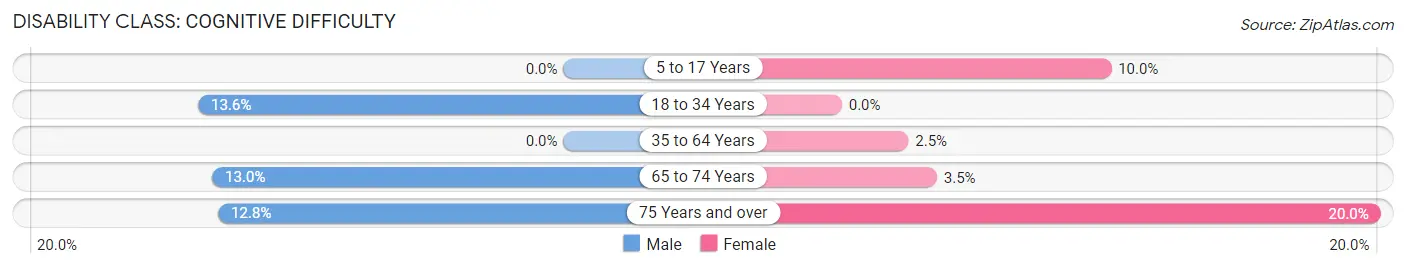
| Age Bracket | Male | Female |
| 5 to 17 Years | 0 (0.0%) | 3 (10.0%) |
| 18 to 34 Years | 8 (13.6%) | 0 (0.0%) |
| 35 to 64 Years | 0 (0.0%) | 2 (2.5%) |
| 65 to 74 Years | 3 (13.0%) | 3 (3.5%) |
| 75 Years and over | 5 (12.8%) | 5 (20.0%) |
Disability Class: Ambulatory Difficulty
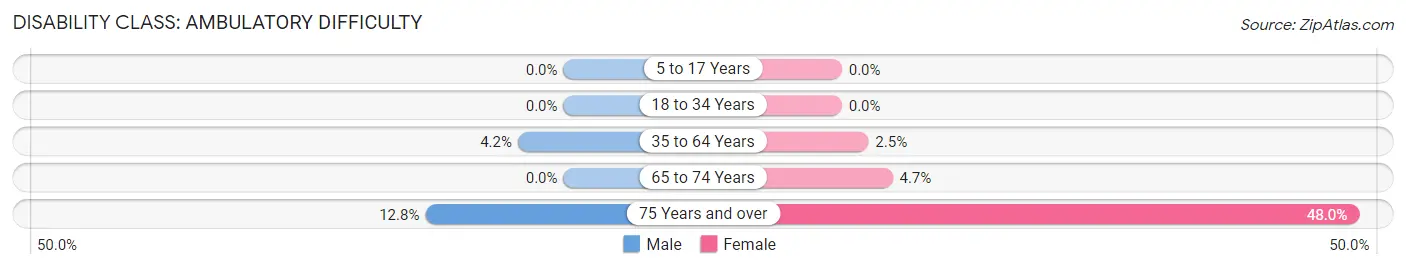
| Age Bracket | Male | Female |
| 5 to 17 Years | 0 (0.0%) | 0 (0.0%) |
| 18 to 34 Years | 0 (0.0%) | 0 (0.0%) |
| 35 to 64 Years | 3 (4.2%) | 2 (2.5%) |
| 65 to 74 Years | 0 (0.0%) | 4 (4.7%) |
| 75 Years and over | 5 (12.8%) | 12 (48.0%) |
Disability Class: Self-Care Difficulty
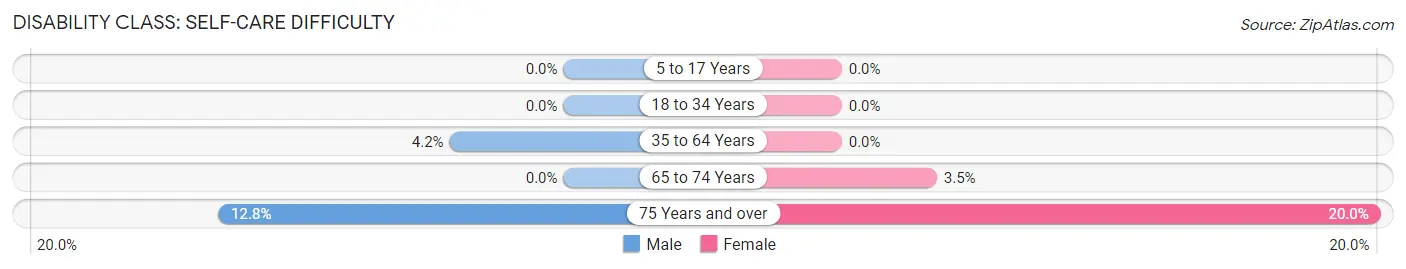
| Age Bracket | Male | Female |
| 5 to 17 Years | 0 (0.0%) | 0 (0.0%) |
| 18 to 34 Years | 0 (0.0%) | 0 (0.0%) |
| 35 to 64 Years | 3 (4.2%) | 0 (0.0%) |
| 65 to 74 Years | 0 (0.0%) | 3 (3.5%) |
| 75 Years and over | 5 (12.8%) | 5 (20.0%) |
Technology Access in Tropic
Computing Device Access in Tropic
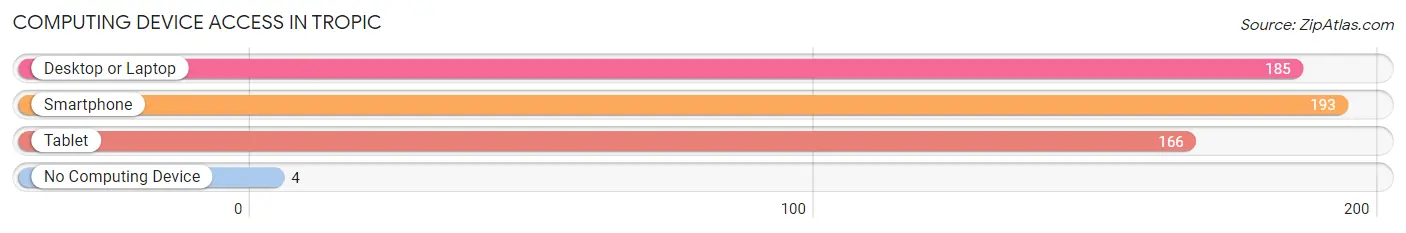
| Device Type | # Households | % Households |
| Desktop or Laptop | 185 | 87.7% |
| Smartphone | 193 | 91.5% |
| Tablet | 166 | 78.7% |
| No Computing Device | 4 | 1.9% |
| Total | 211 | 100.0% |
Internet Access in Tropic
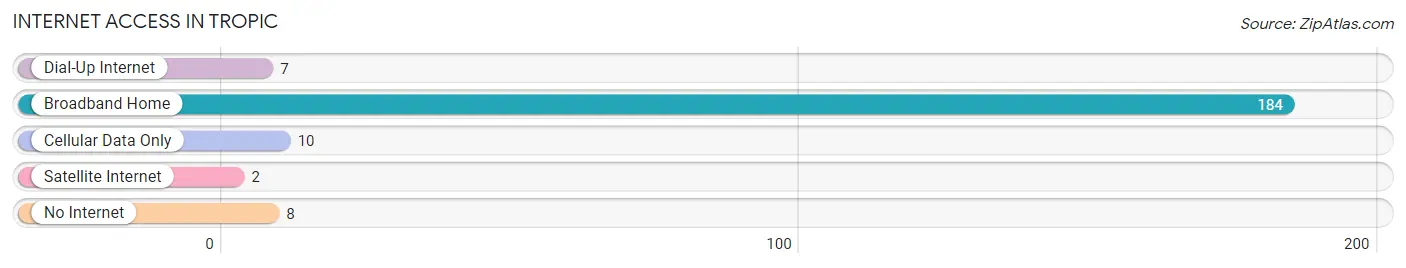
| Internet Type | # Households | % Households |
| Dial-Up Internet | 7 | 3.3% |
| Broadband Home | 184 | 87.2% |
| Cellular Data Only | 10 | 4.7% |
| Satellite Internet | 2 | 0.9% |
| No Internet | 8 | 3.8% |
| Total | 211 | 100.0% |
Tropic Summary
Tropic is a small town located in Garfield County, Utah. It is situated in the heart of the Grand Staircase-Escalante National Monument, and is surrounded by some of the most beautiful and rugged terrain in the state. The town is home to a population of just over 500 people, and is a popular destination for outdoor enthusiasts.
History
Tropic was first settled in 1876 by a group of Mormon pioneers led by John W. Young. The town was originally named Youngsville, but was later changed to Tropic in 1883. The name was chosen to reflect the warm climate of the area, which is much warmer than the rest of the state.
The town was an important stop on the Old Spanish Trail, which was used by traders and travelers to move goods and people between Santa Fe, New Mexico and Los Angeles, California. The town was also a popular stop for cattle drives, and was the site of the first cattle drive in Utah.
Geography
Tropic is located in the heart of the Grand Staircase-Escalante National Monument, which is a vast area of rugged terrain and stunning scenery. The town is situated at an elevation of 5,400 feet, and is surrounded by mountains, canyons, and desert. The nearby Bryce Canyon National Park is a popular destination for visitors to the area.
The town is located on the banks of the Sevier River, which is a tributary of the Colorado River. The river provides a source of irrigation for the area, and is also a popular destination for fishing and rafting.
Economy
Tropic is a small, rural town, and the economy is largely based on agriculture and tourism. The town is home to a number of small businesses, including a grocery store, a gas station, and a few restaurants.
The town is also home to a number of tourist attractions, including the Grand Staircase-Escalante National Monument, Bryce Canyon National Park, and the nearby Anasazi State Park. These attractions draw visitors from all over the world, and provide a boost to the local economy.
Demographics
As of the 2010 census, the population of Tropic was 514. The racial makeup of the town was 97.3% White, 0.2% African American, 0.4% Native American, 0.4% Asian, 0.2% Pacific Islander, 0.6% from other races, and 1.1% from two or more races. Hispanic or Latino of any race were 2.3% of the population.
The median household income in Tropic was $37,500, and the median family income was $41,250. The per capita income for the town was $17,845. About 11.2% of families and 14.2% of the population were below the poverty line, including 18.2% of those under age 18 and 8.3% of those age 65 or over.
Tropic is a small, rural town with a rich history and a unique culture. The town is surrounded by some of the most beautiful and rugged terrain in the state, and is a popular destination for outdoor enthusiasts. The town is home to a diverse population, and the economy is largely based on agriculture and tourism.
Common Questions
What is Per Capita Income in Tropic?
Per Capita income in Tropic is $32,322.
What is the Median Family Income in Tropic?
Median Family Income in Tropic is $61,364.
What is the Median Household income in Tropic?
Median Household Income in Tropic is $54,519.
What is Income or Wage Gap in Tropic?
Income or Wage Gap in Tropic is 21.0%.
Women in Tropic earn 79.0 cents for every dollar earned by a man.
What is Inequality or Gini Index in Tropic?
Inequality or Gini Index in Tropic is 0.40.
What is the Total Population of Tropic?
Total Population of Tropic is 524.
What is the Total Male Population of Tropic?
Total Male Population of Tropic is 259.
What is the Total Female Population of Tropic?
Total Female Population of Tropic is 265.
What is the Ratio of Males per 100 Females in Tropic?
There are 97.74 Males per 100 Females in Tropic.
What is the Ratio of Females per 100 Males in Tropic?
There are 102.32 Females per 100 Males in Tropic.
What is the Median Population Age in Tropic?
Median Population Age in Tropic is 48.3 Years.
What is the Average Family Size in Tropic
Average Family Size in Tropic is 2.8 People.
What is the Average Household Size in Tropic
Average Household Size in Tropic is 2.5 People.
How Large is the Labor Force in Tropic?
There are 252 People in the Labor Forcein in Tropic.
What is the Percentage of People in the Labor Force in Tropic?
58.7% of People are in the Labor Force in Tropic.